

Mitogenomic Analysis of Pterioidea (Bivalvia: Pteriomorphia): Insights into the Evolution of the Gene Rearrangements


Abstract
1. Introduction
2. Materials and Methods
2.1. Sample Collection and DNA Extraction
2.2. Mitochondrial Genome Sequencing and Assembly
2.3. Mitogenome Annotation and Sequence Analysis
2.4. Phylogenetic Analysis
2.5. Gene Rearrangement Analyses
3. Results and Discussion
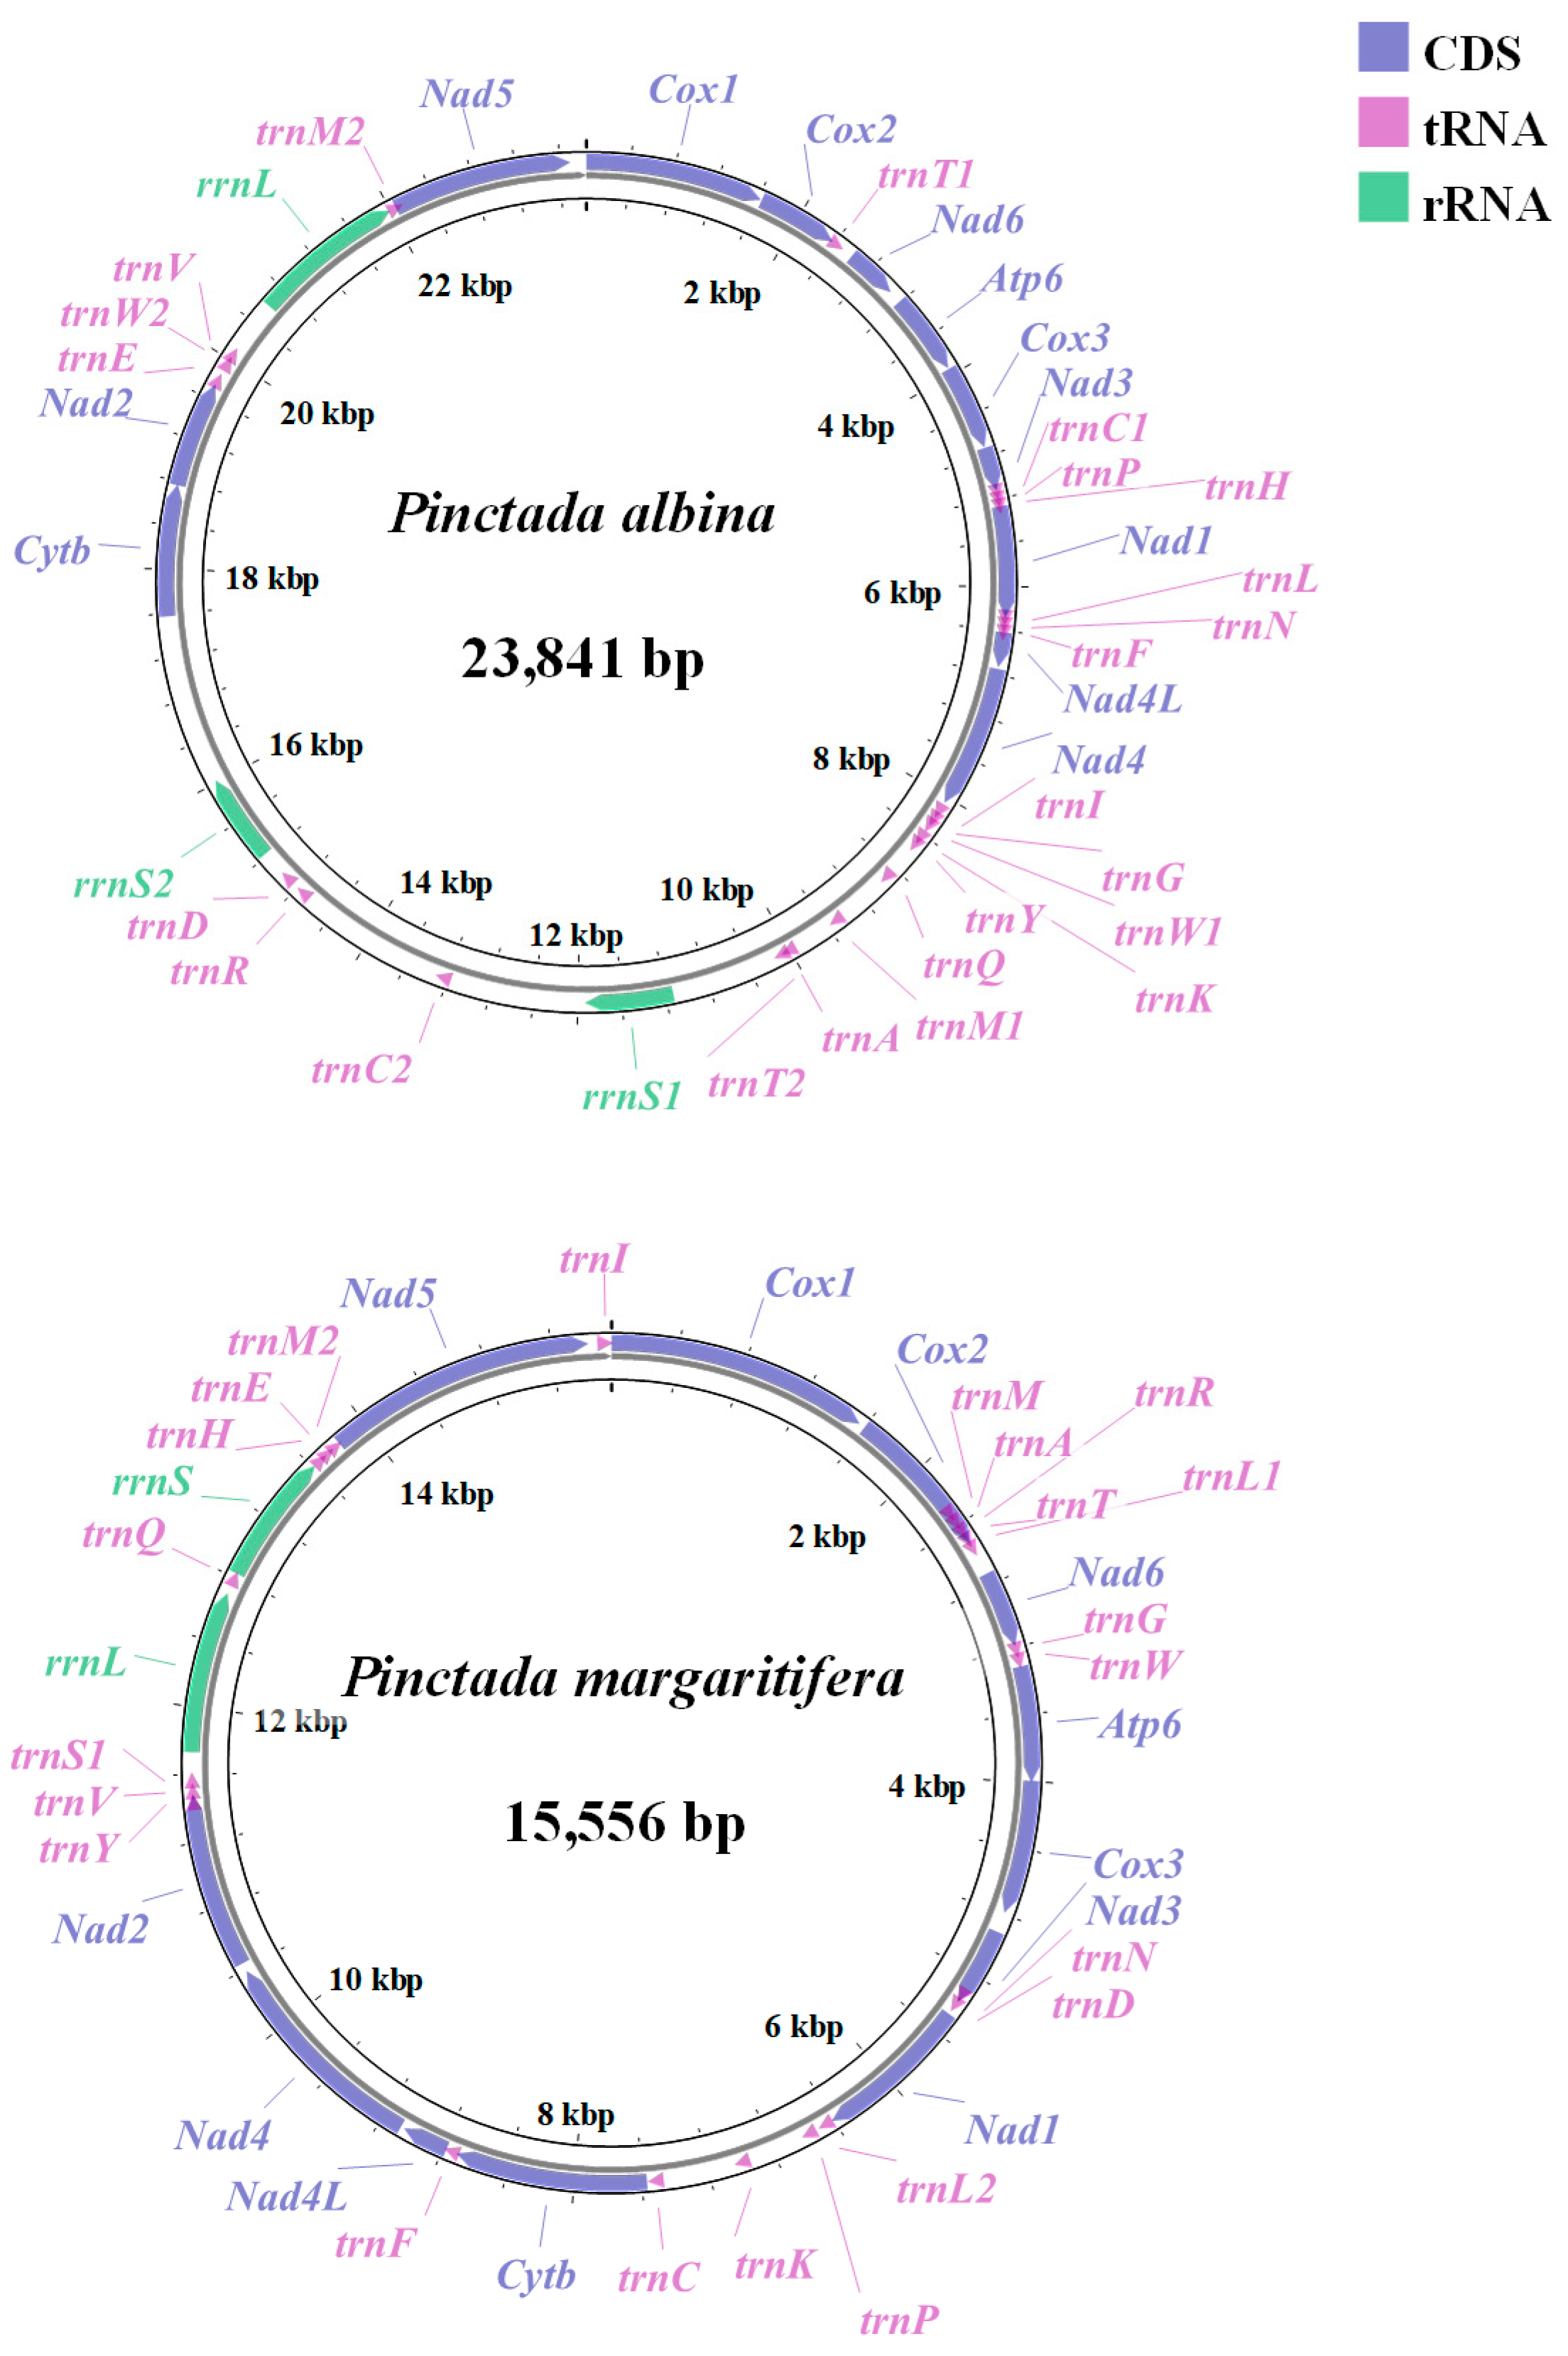
3.1. Mitogenome Composition of P. albina and P. margaritifera
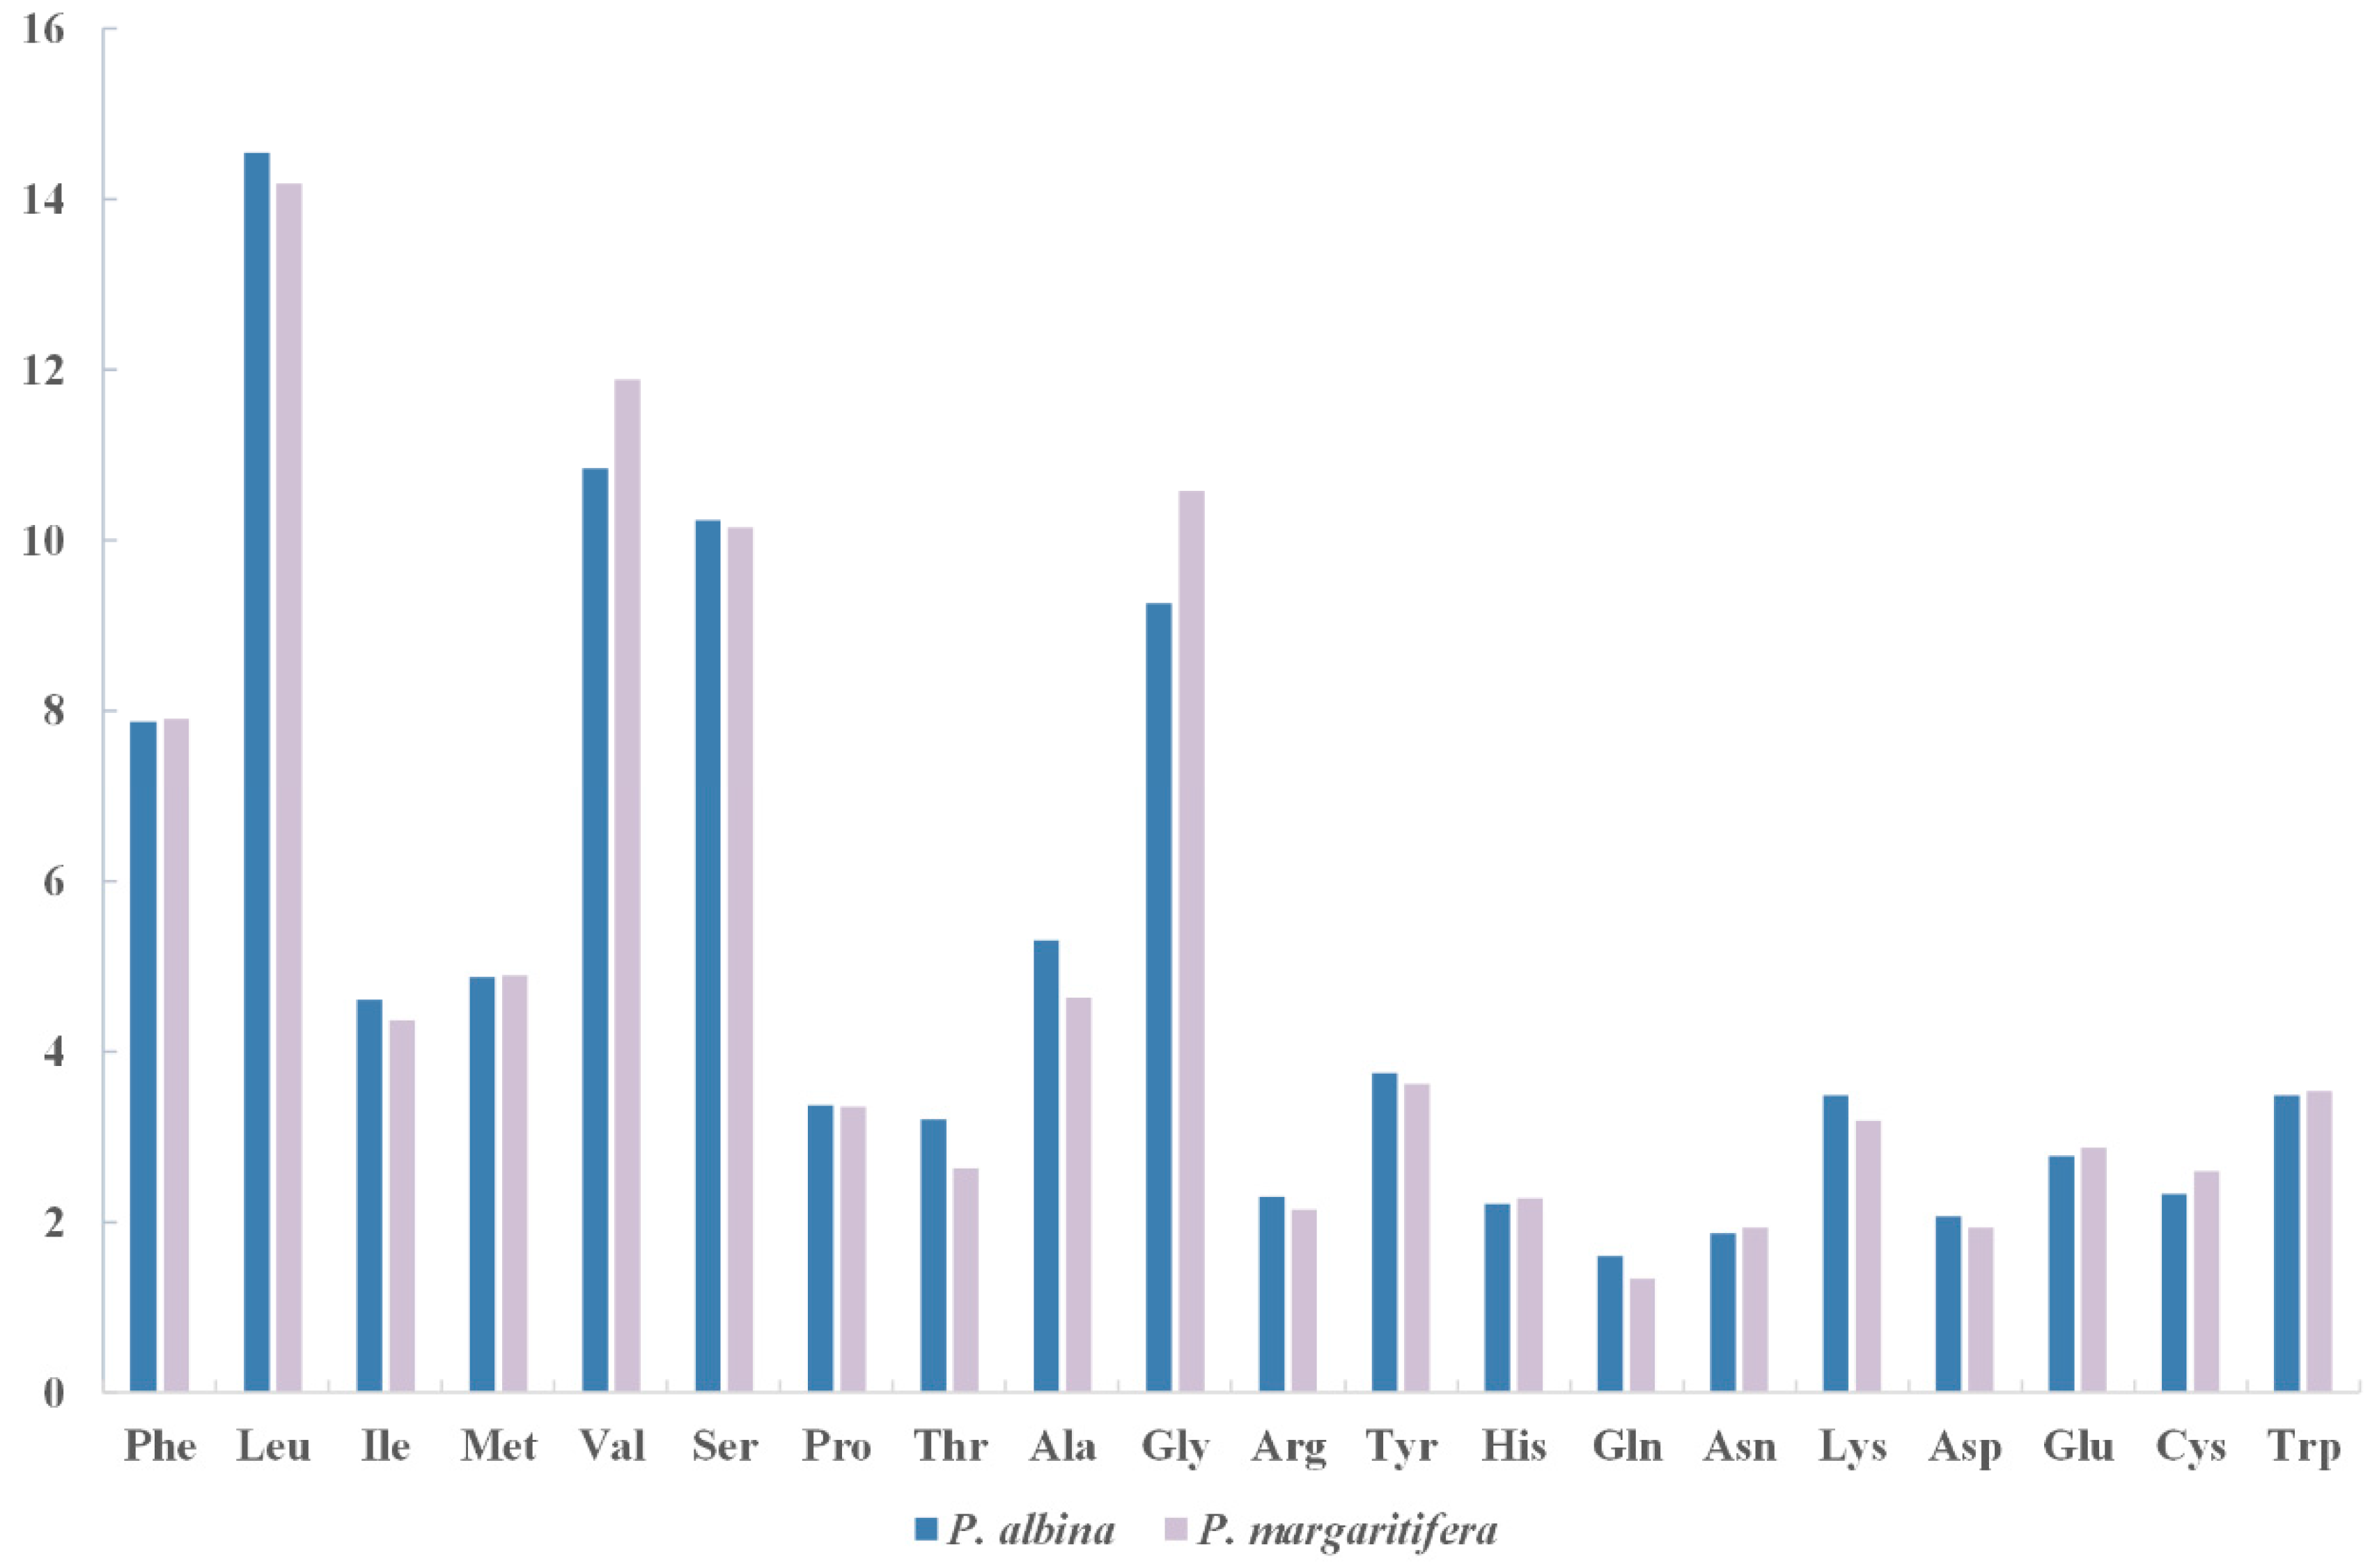
3.2. Protein-Coding Genes
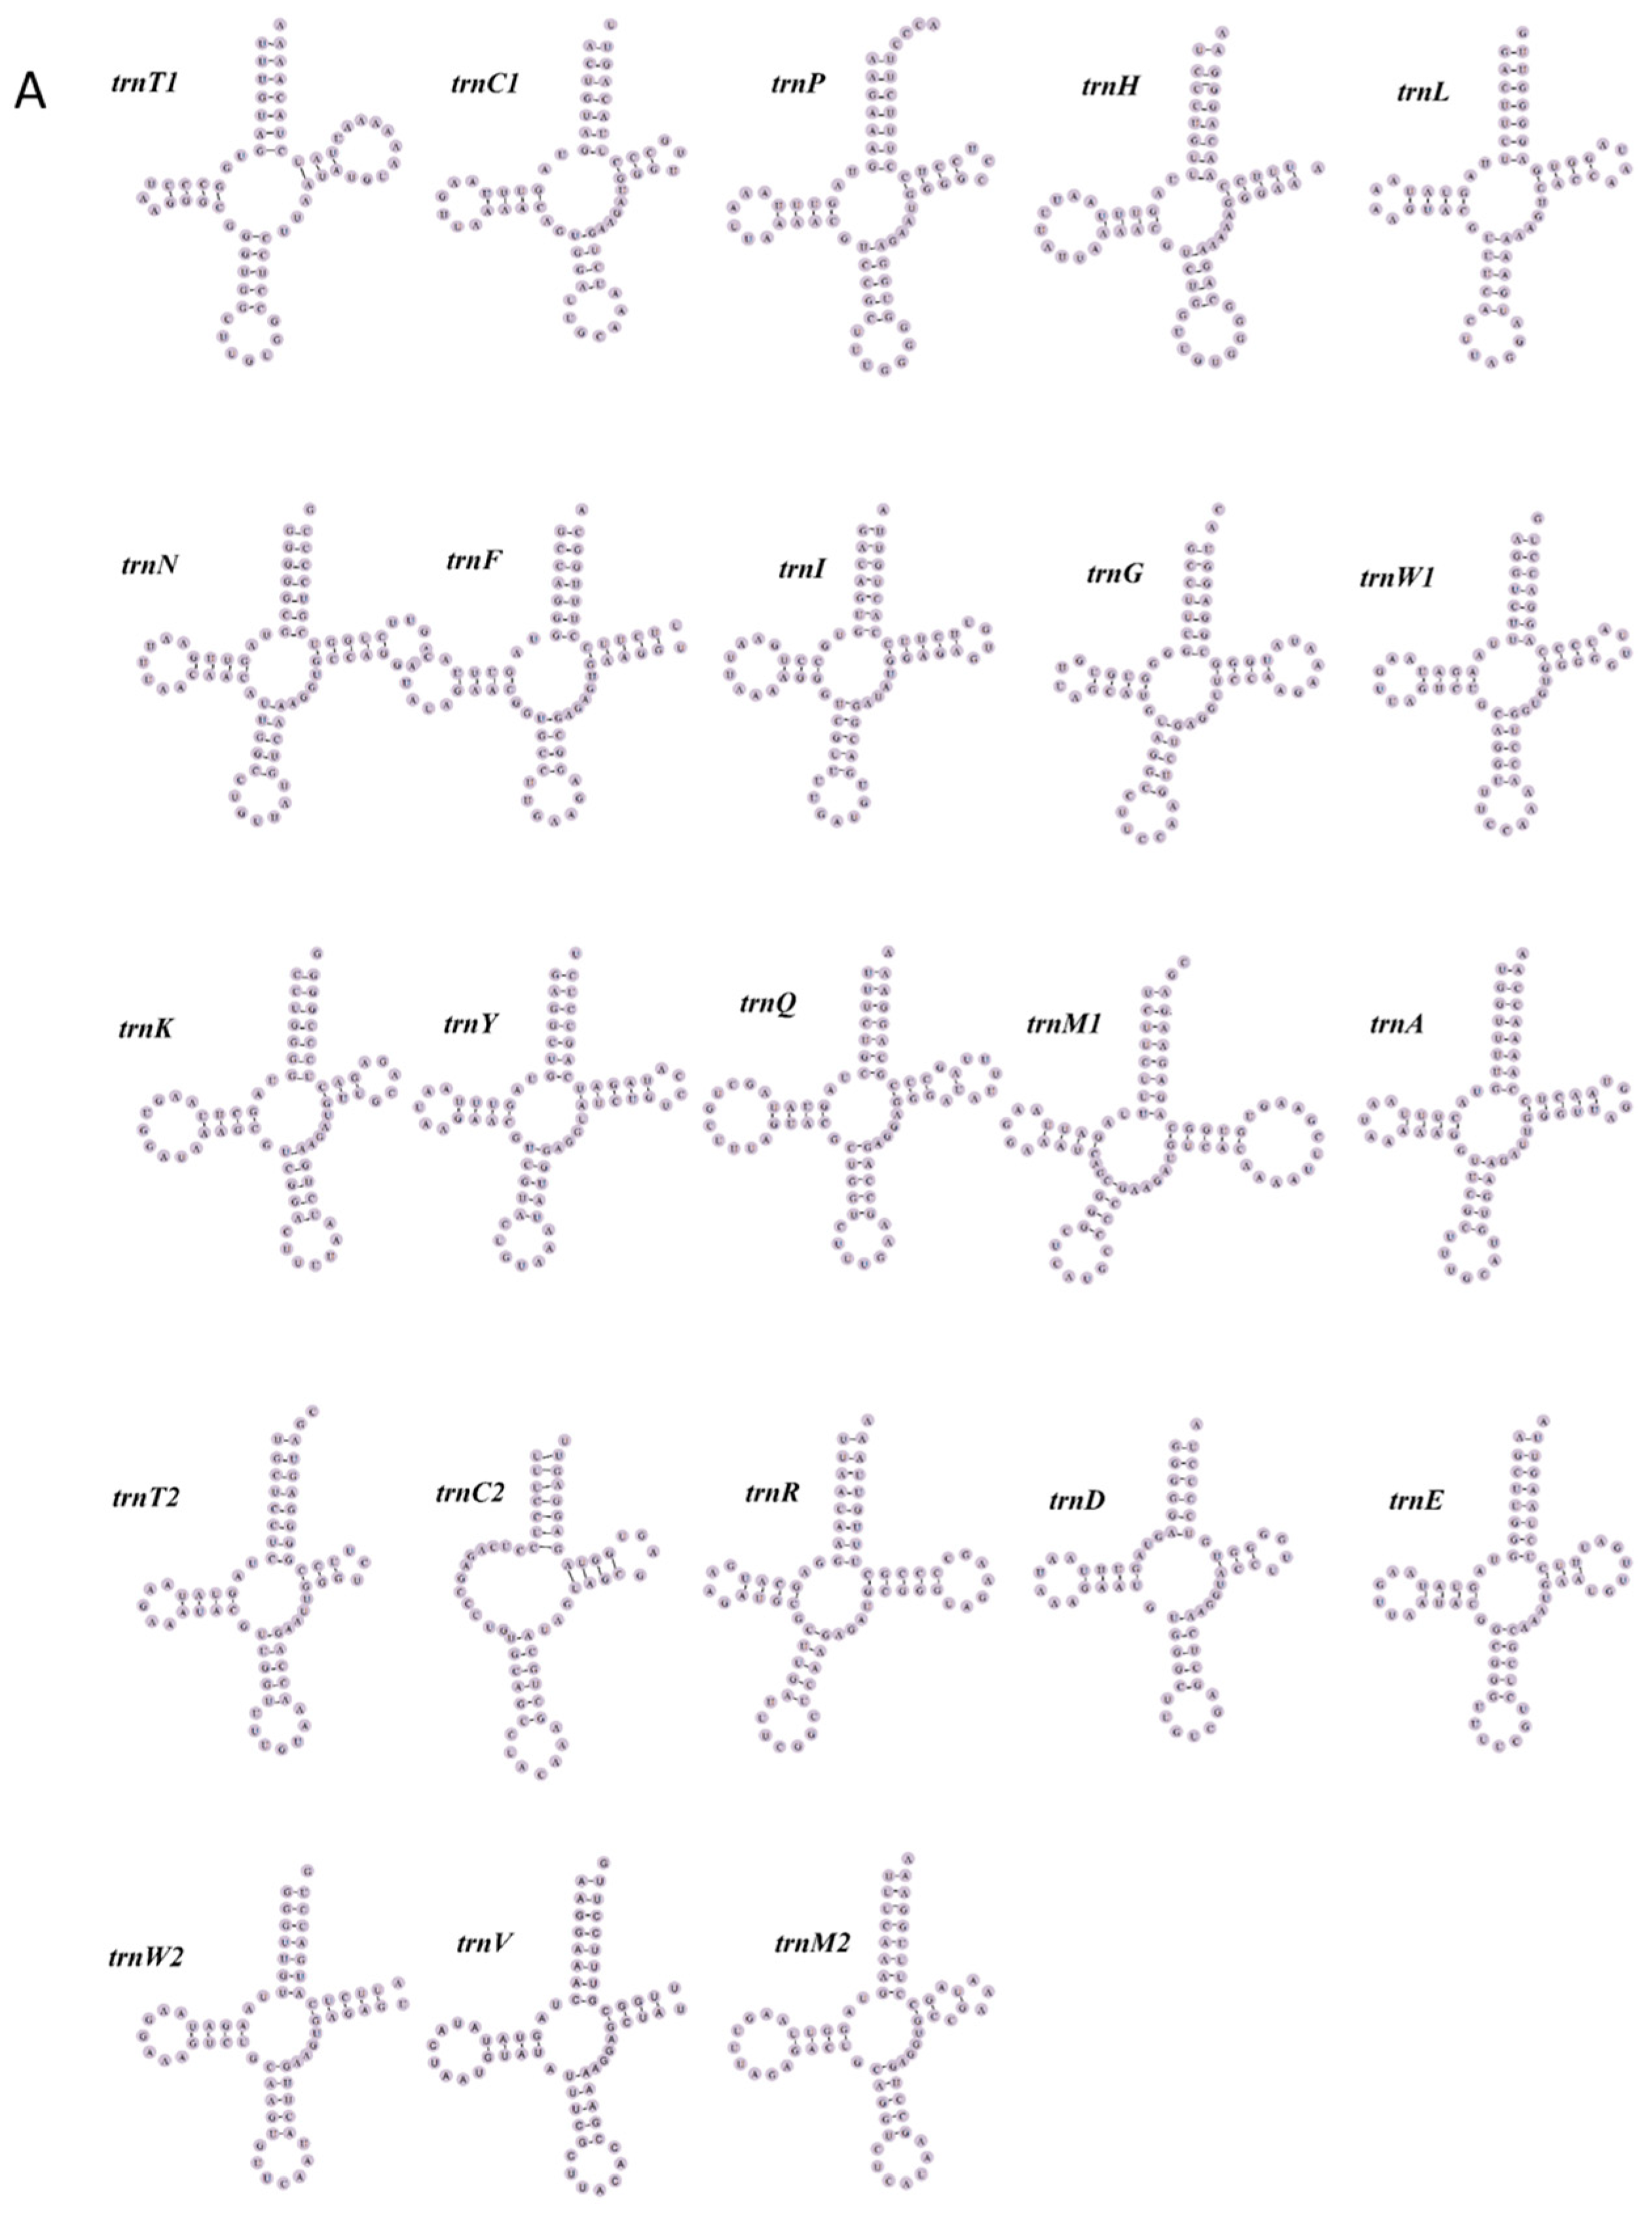
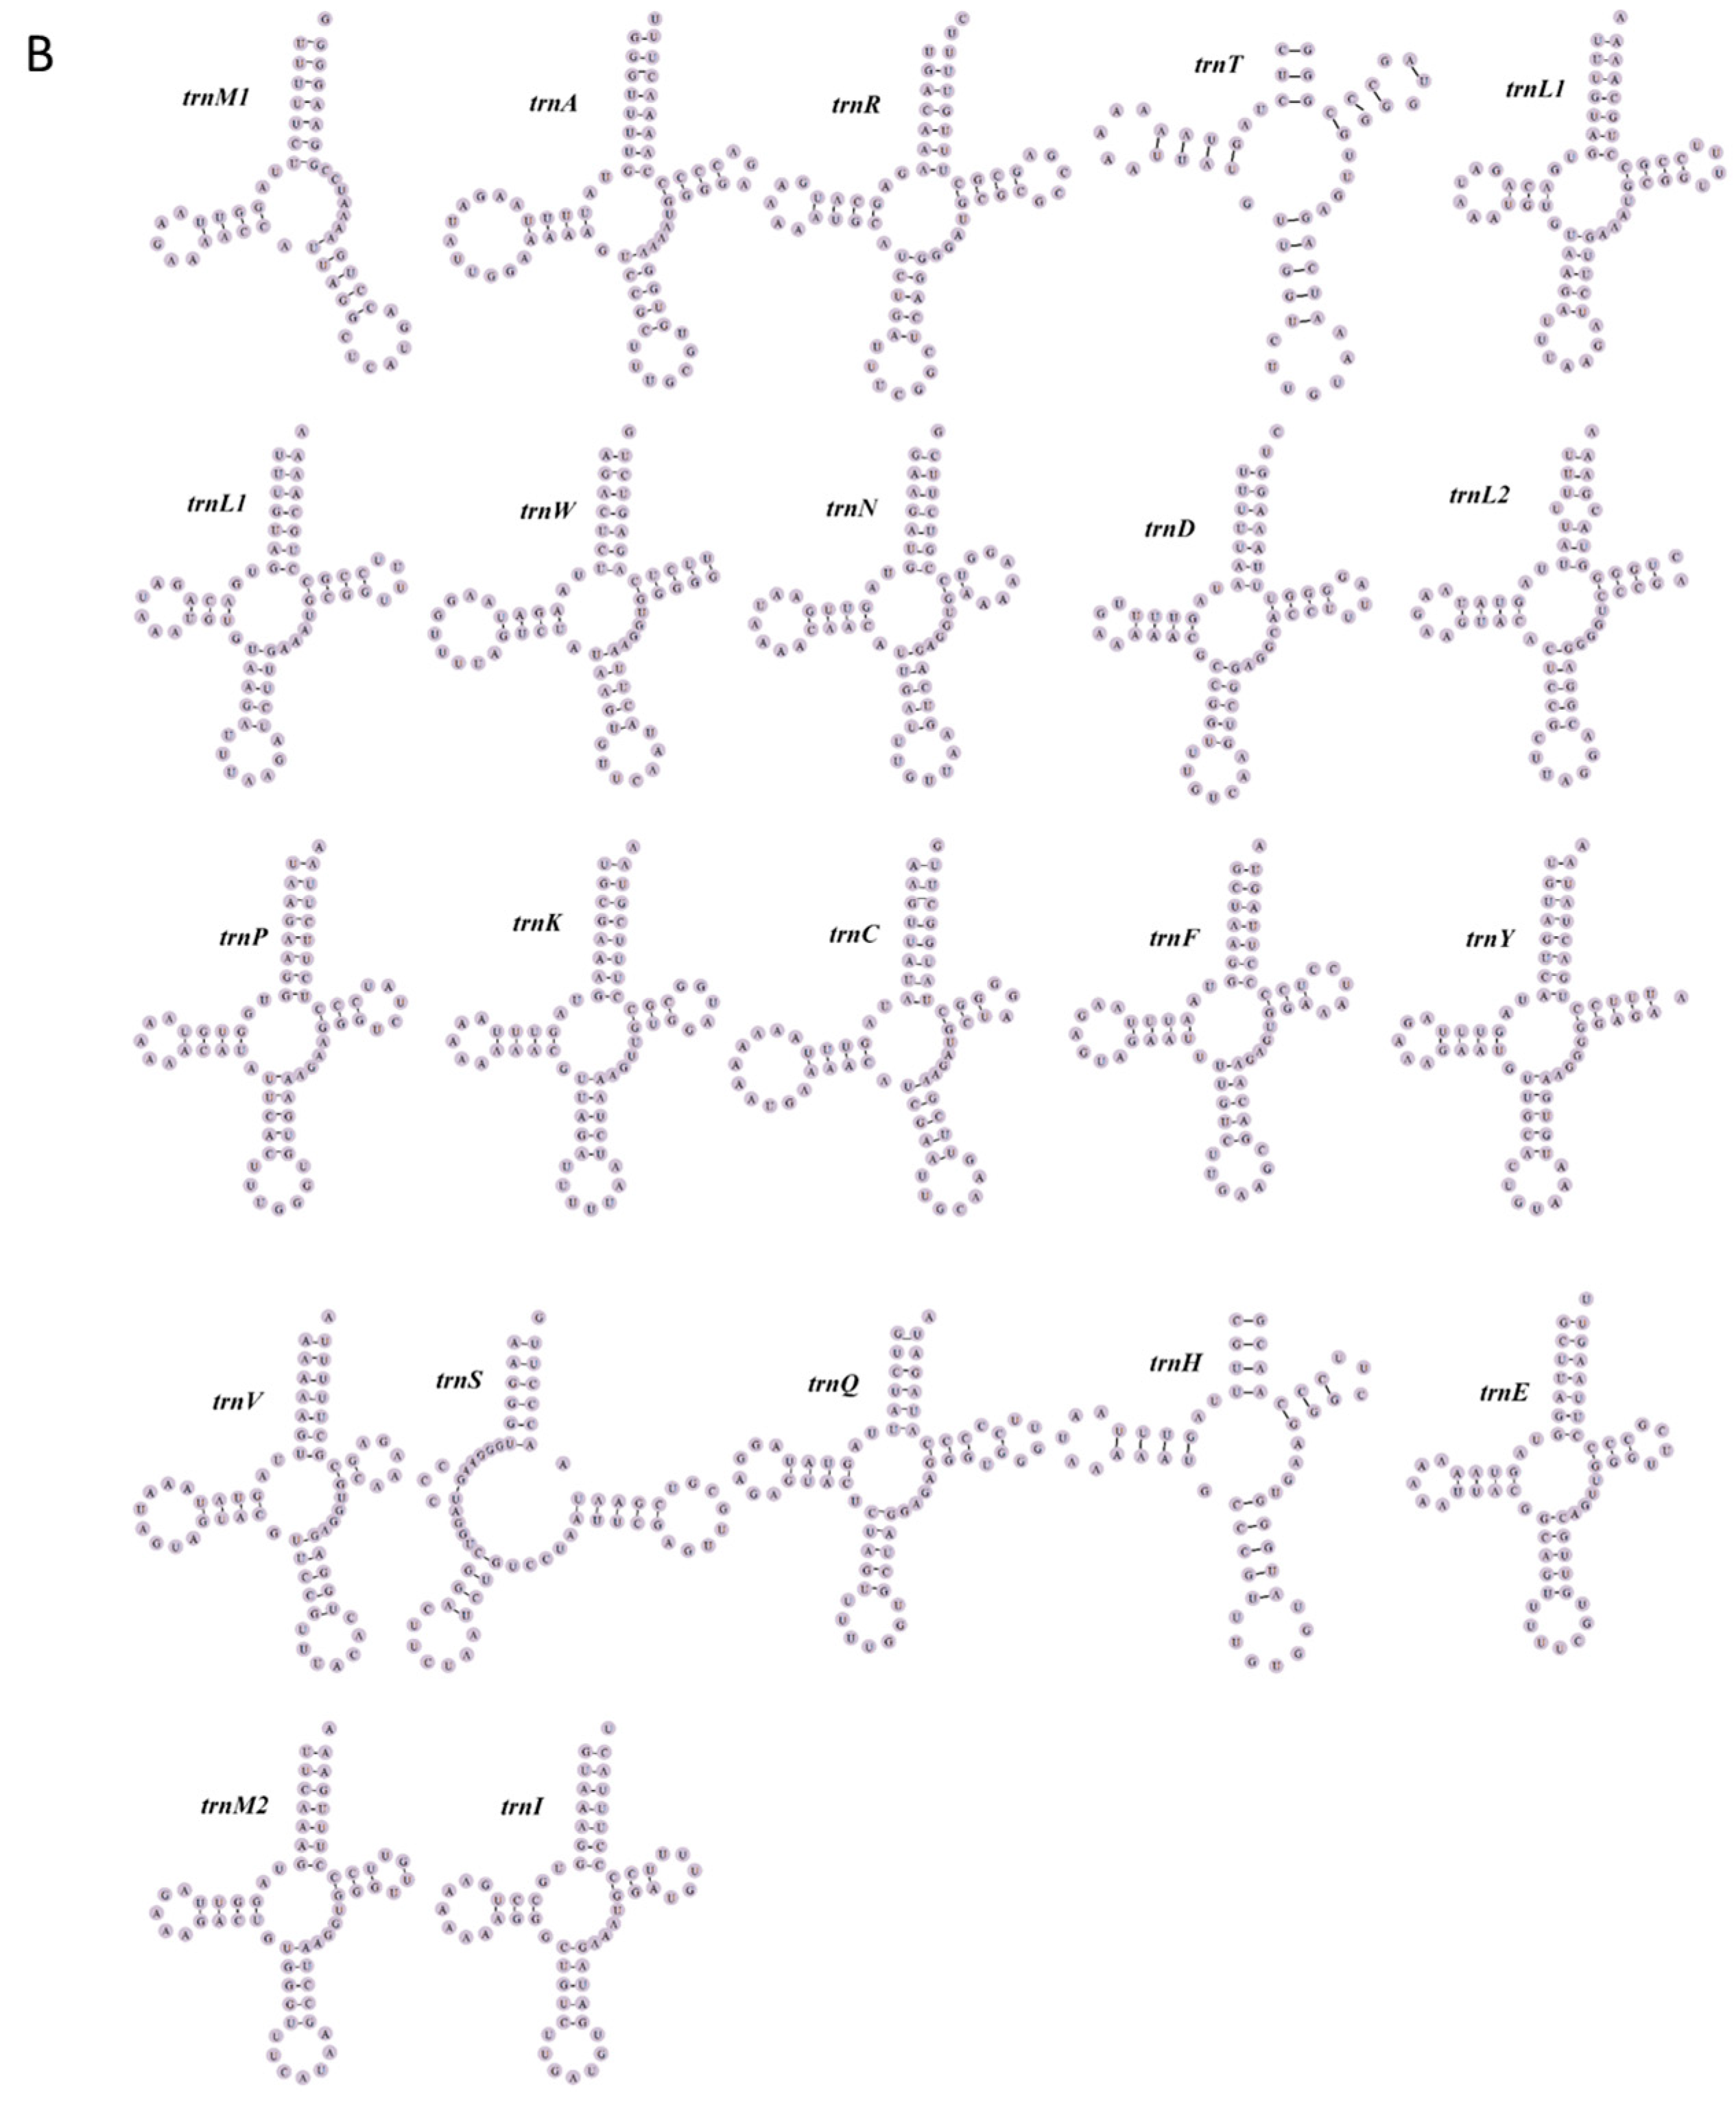
3.3. tRNA and rRNA Genes
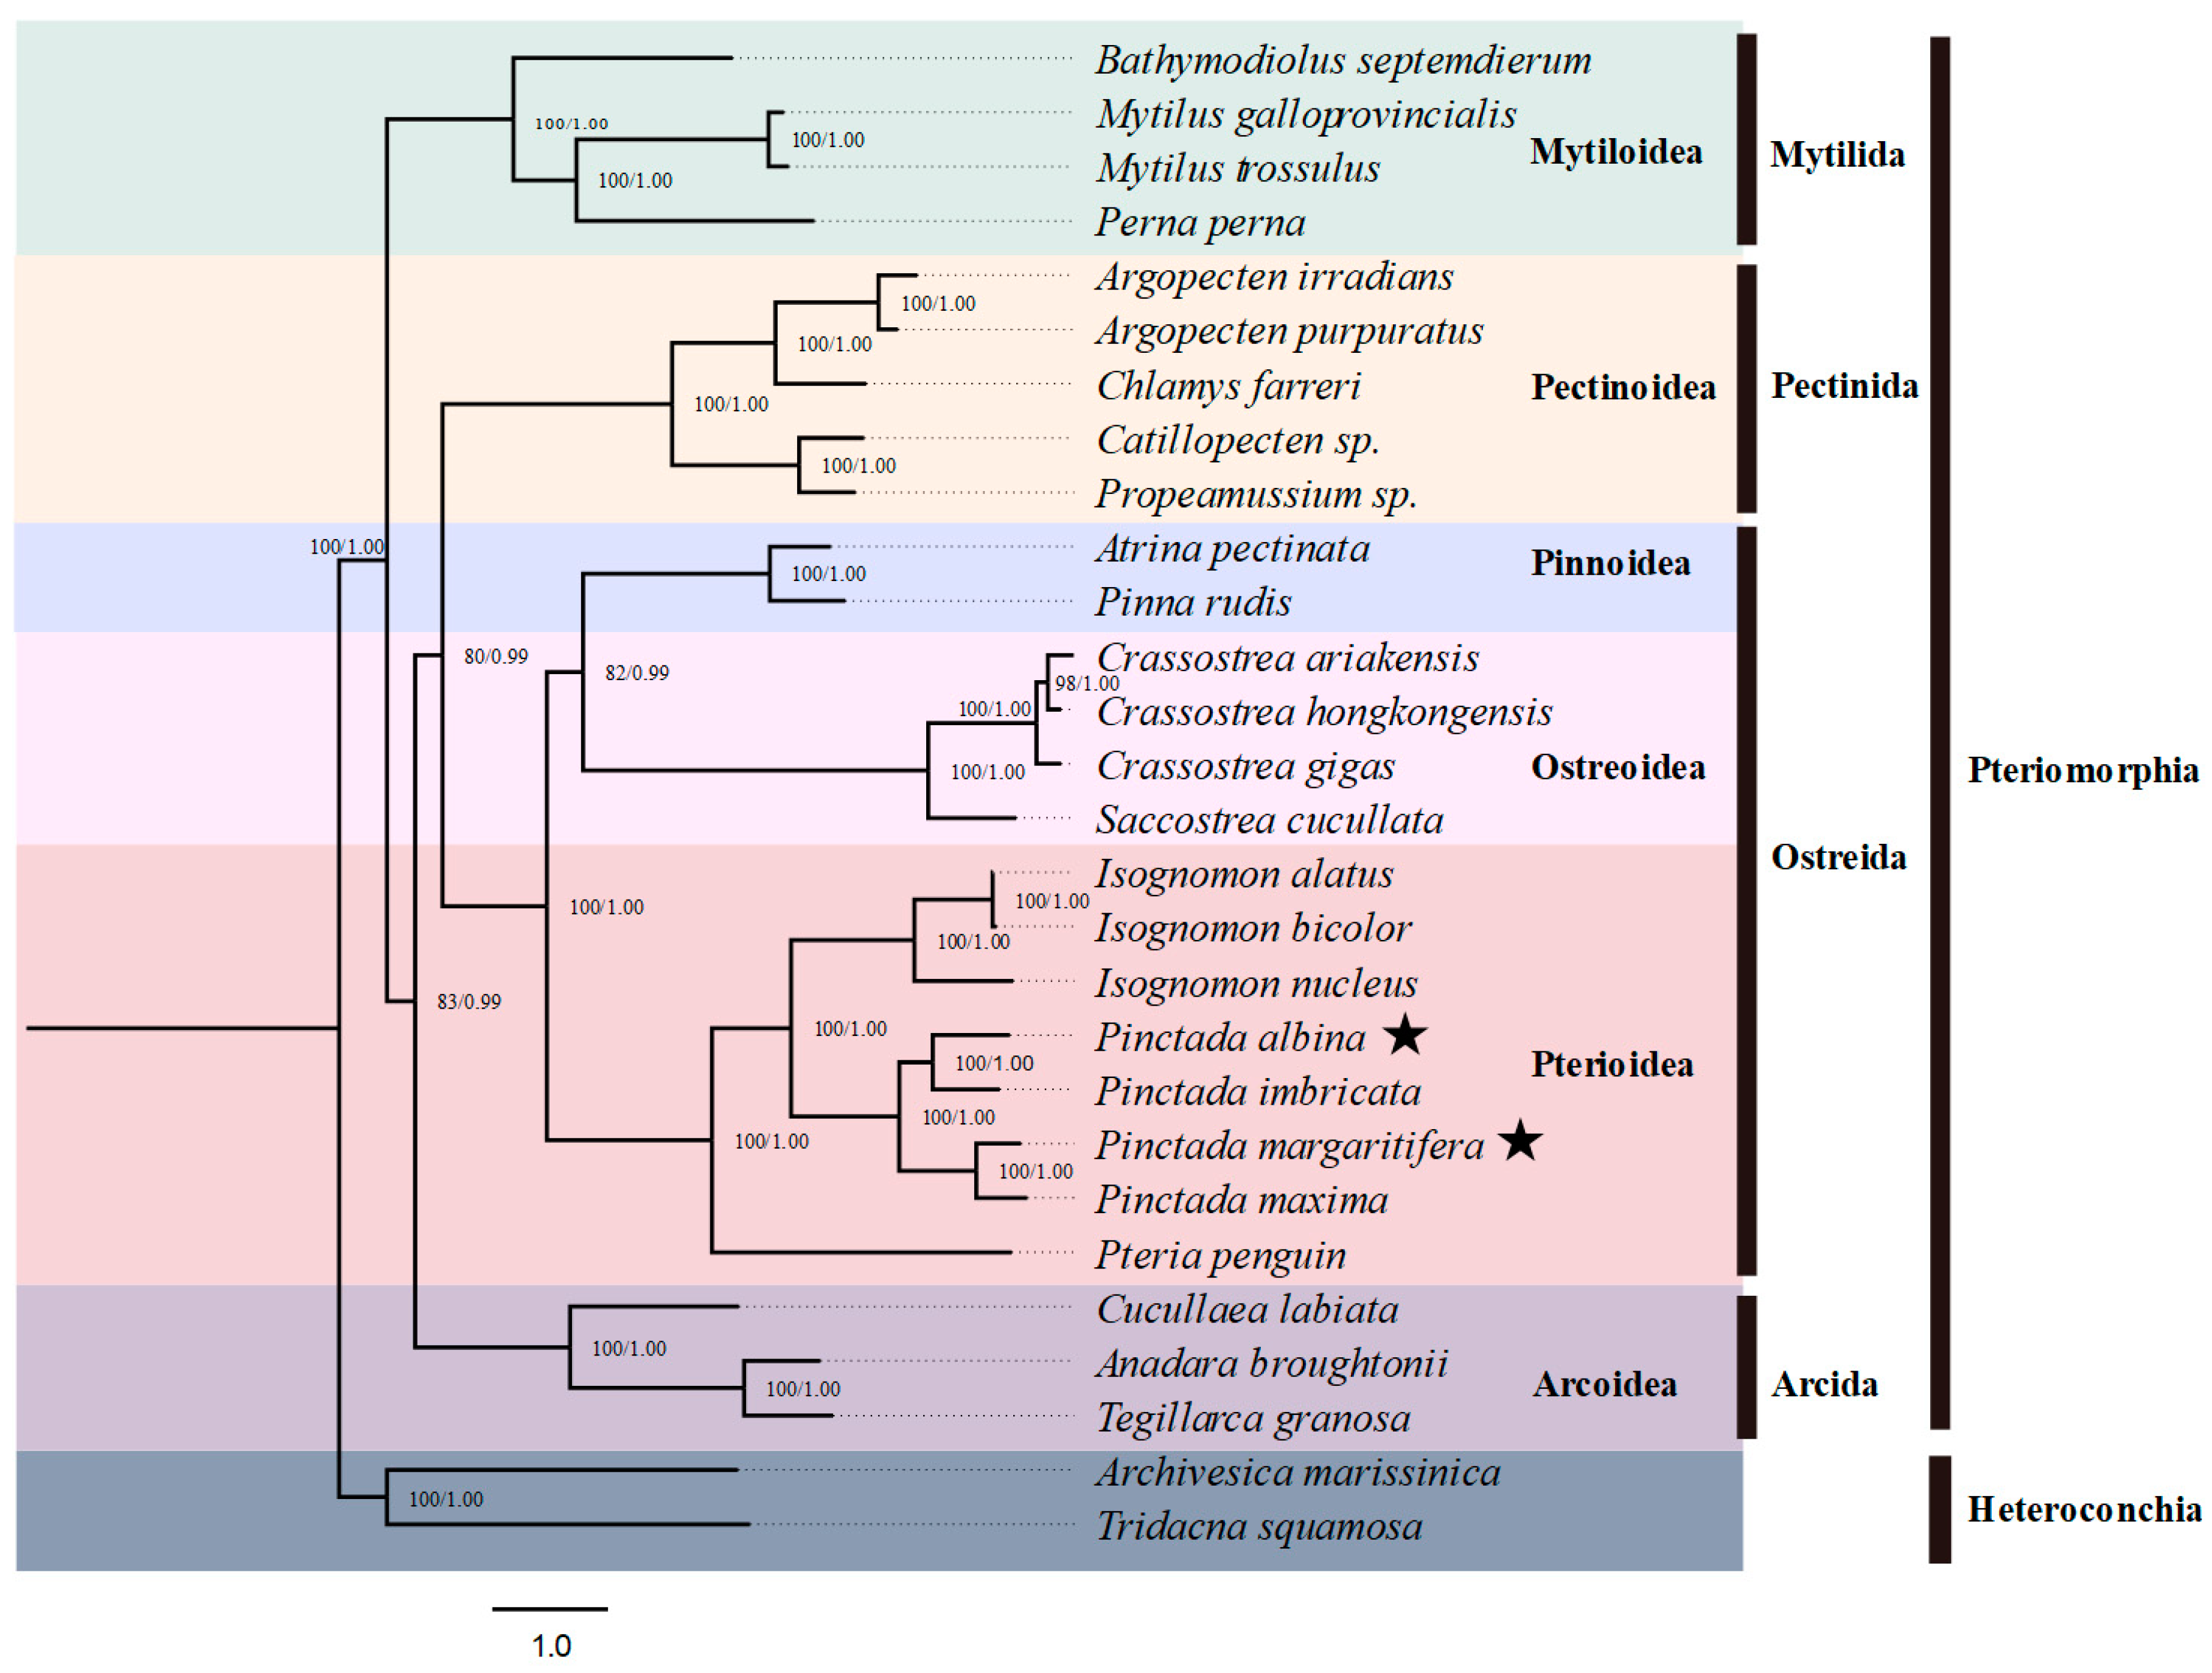
3.4. Phylogenetic Analysis
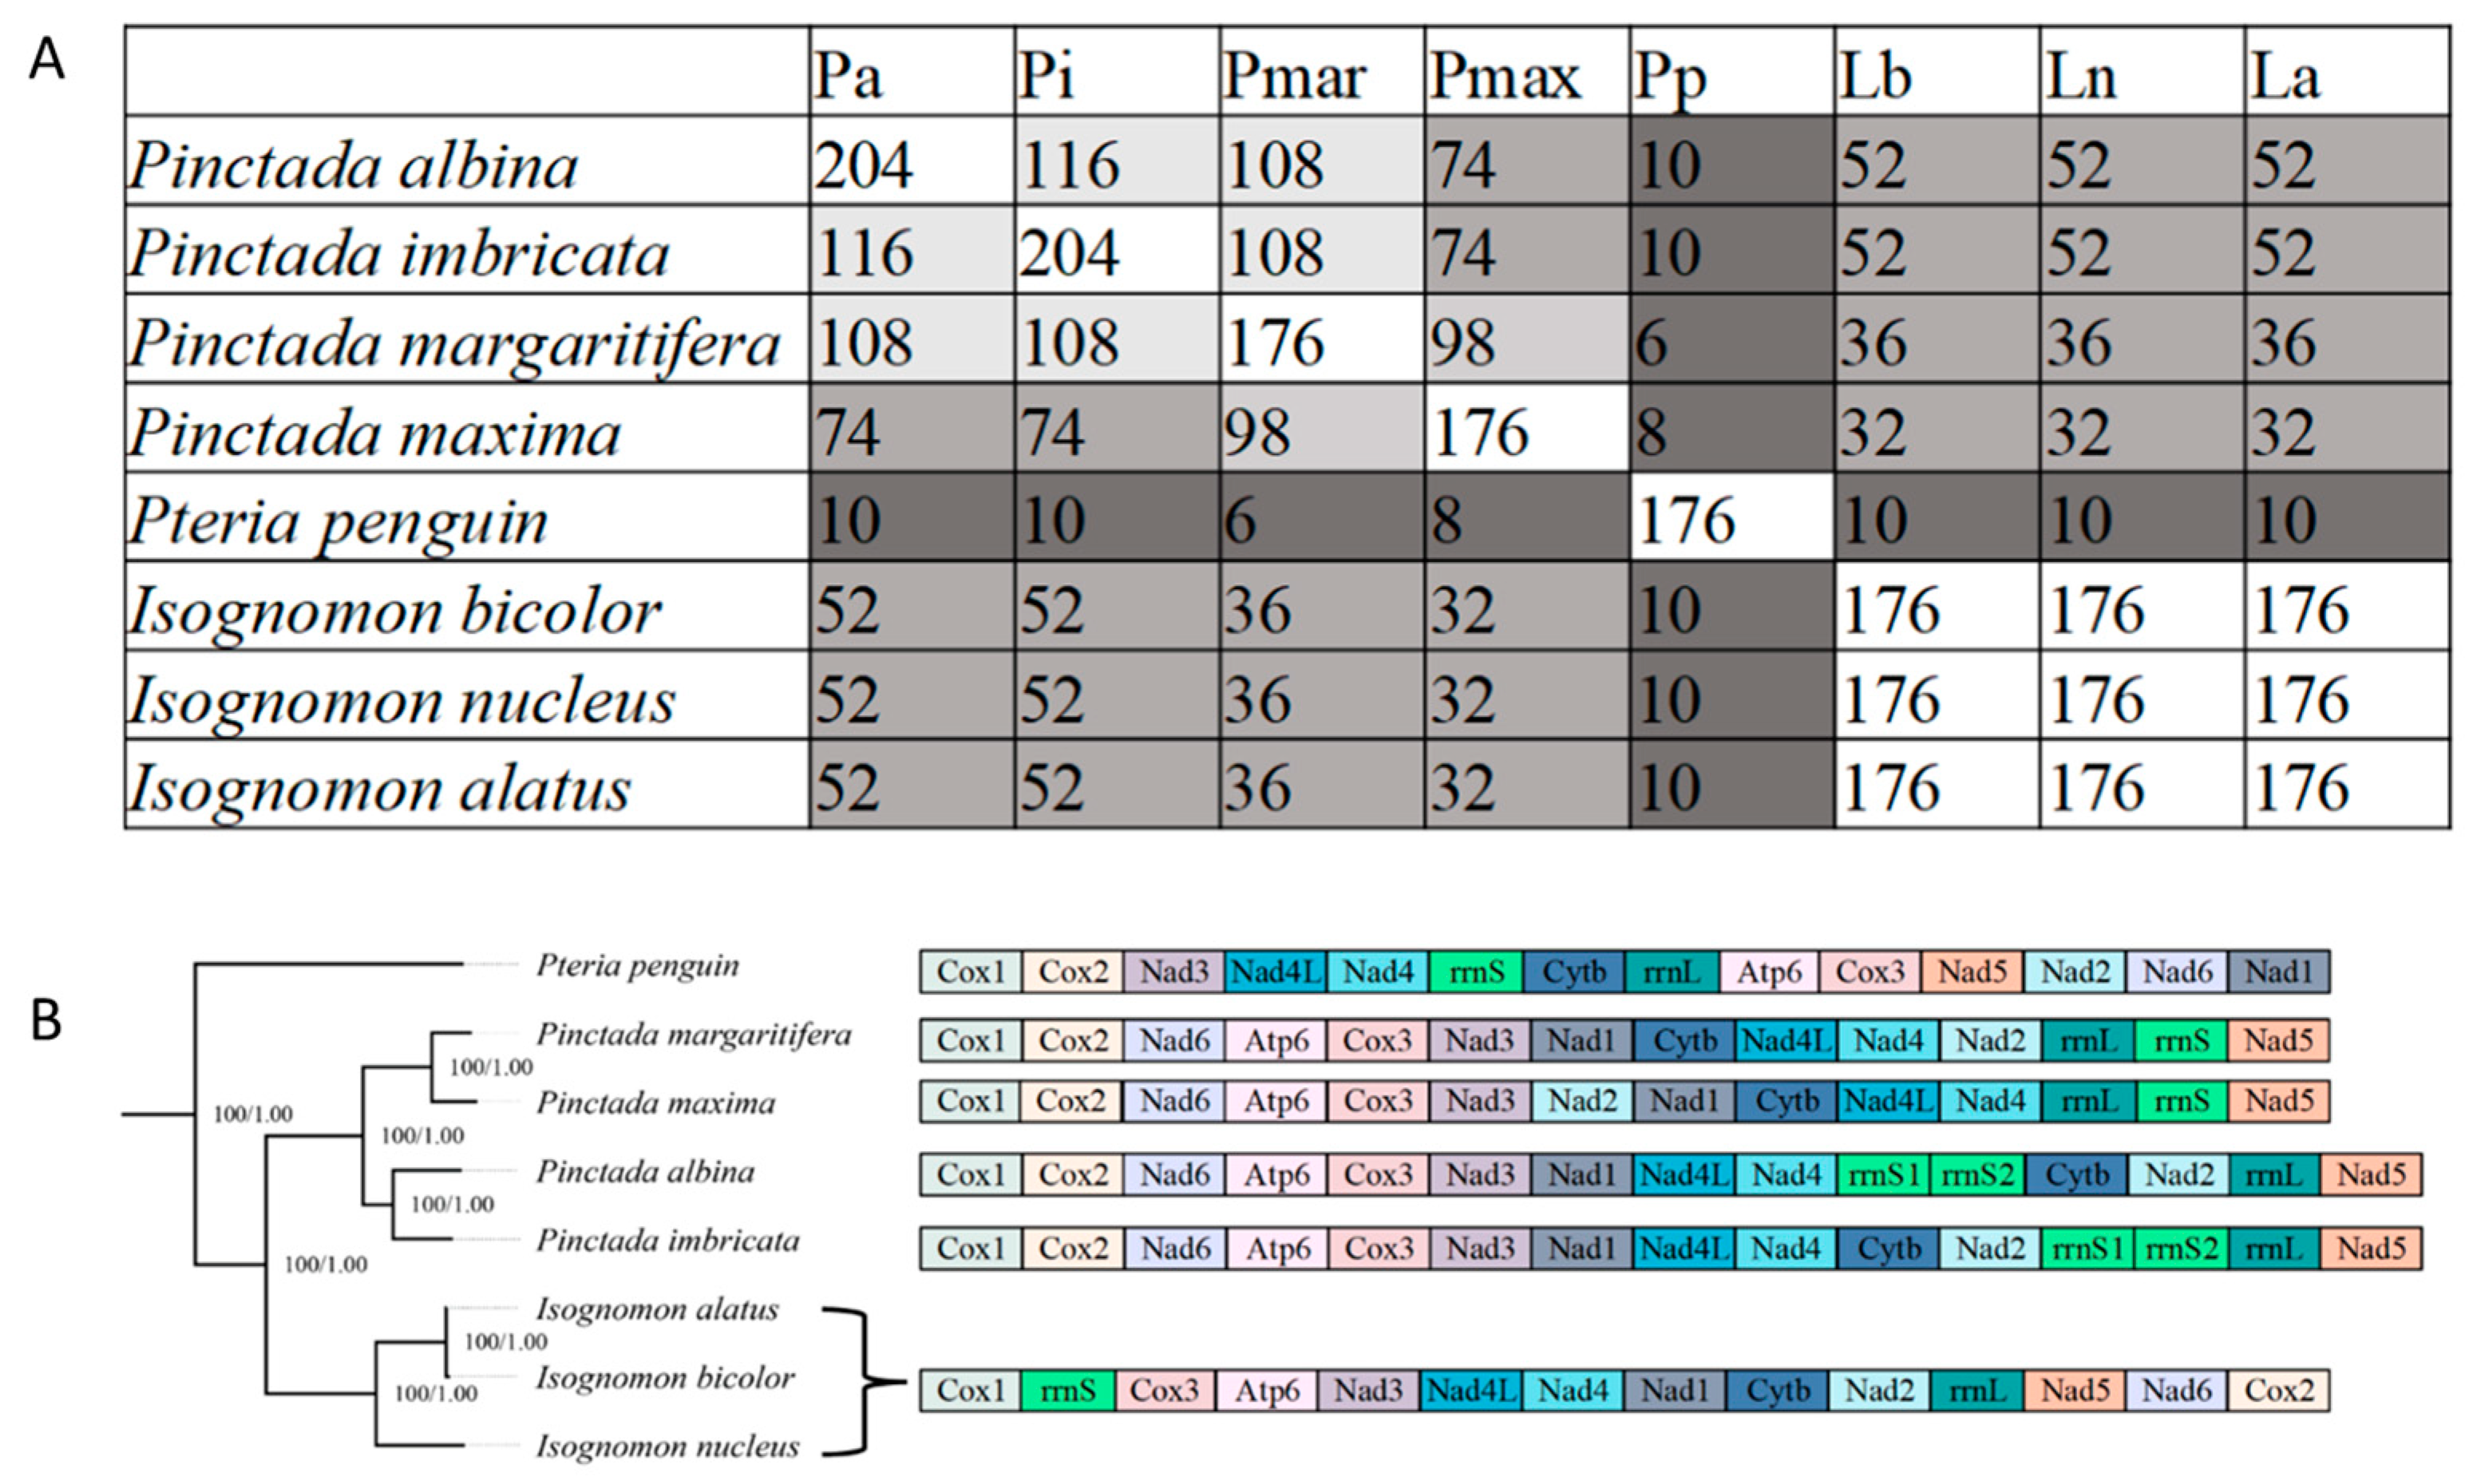
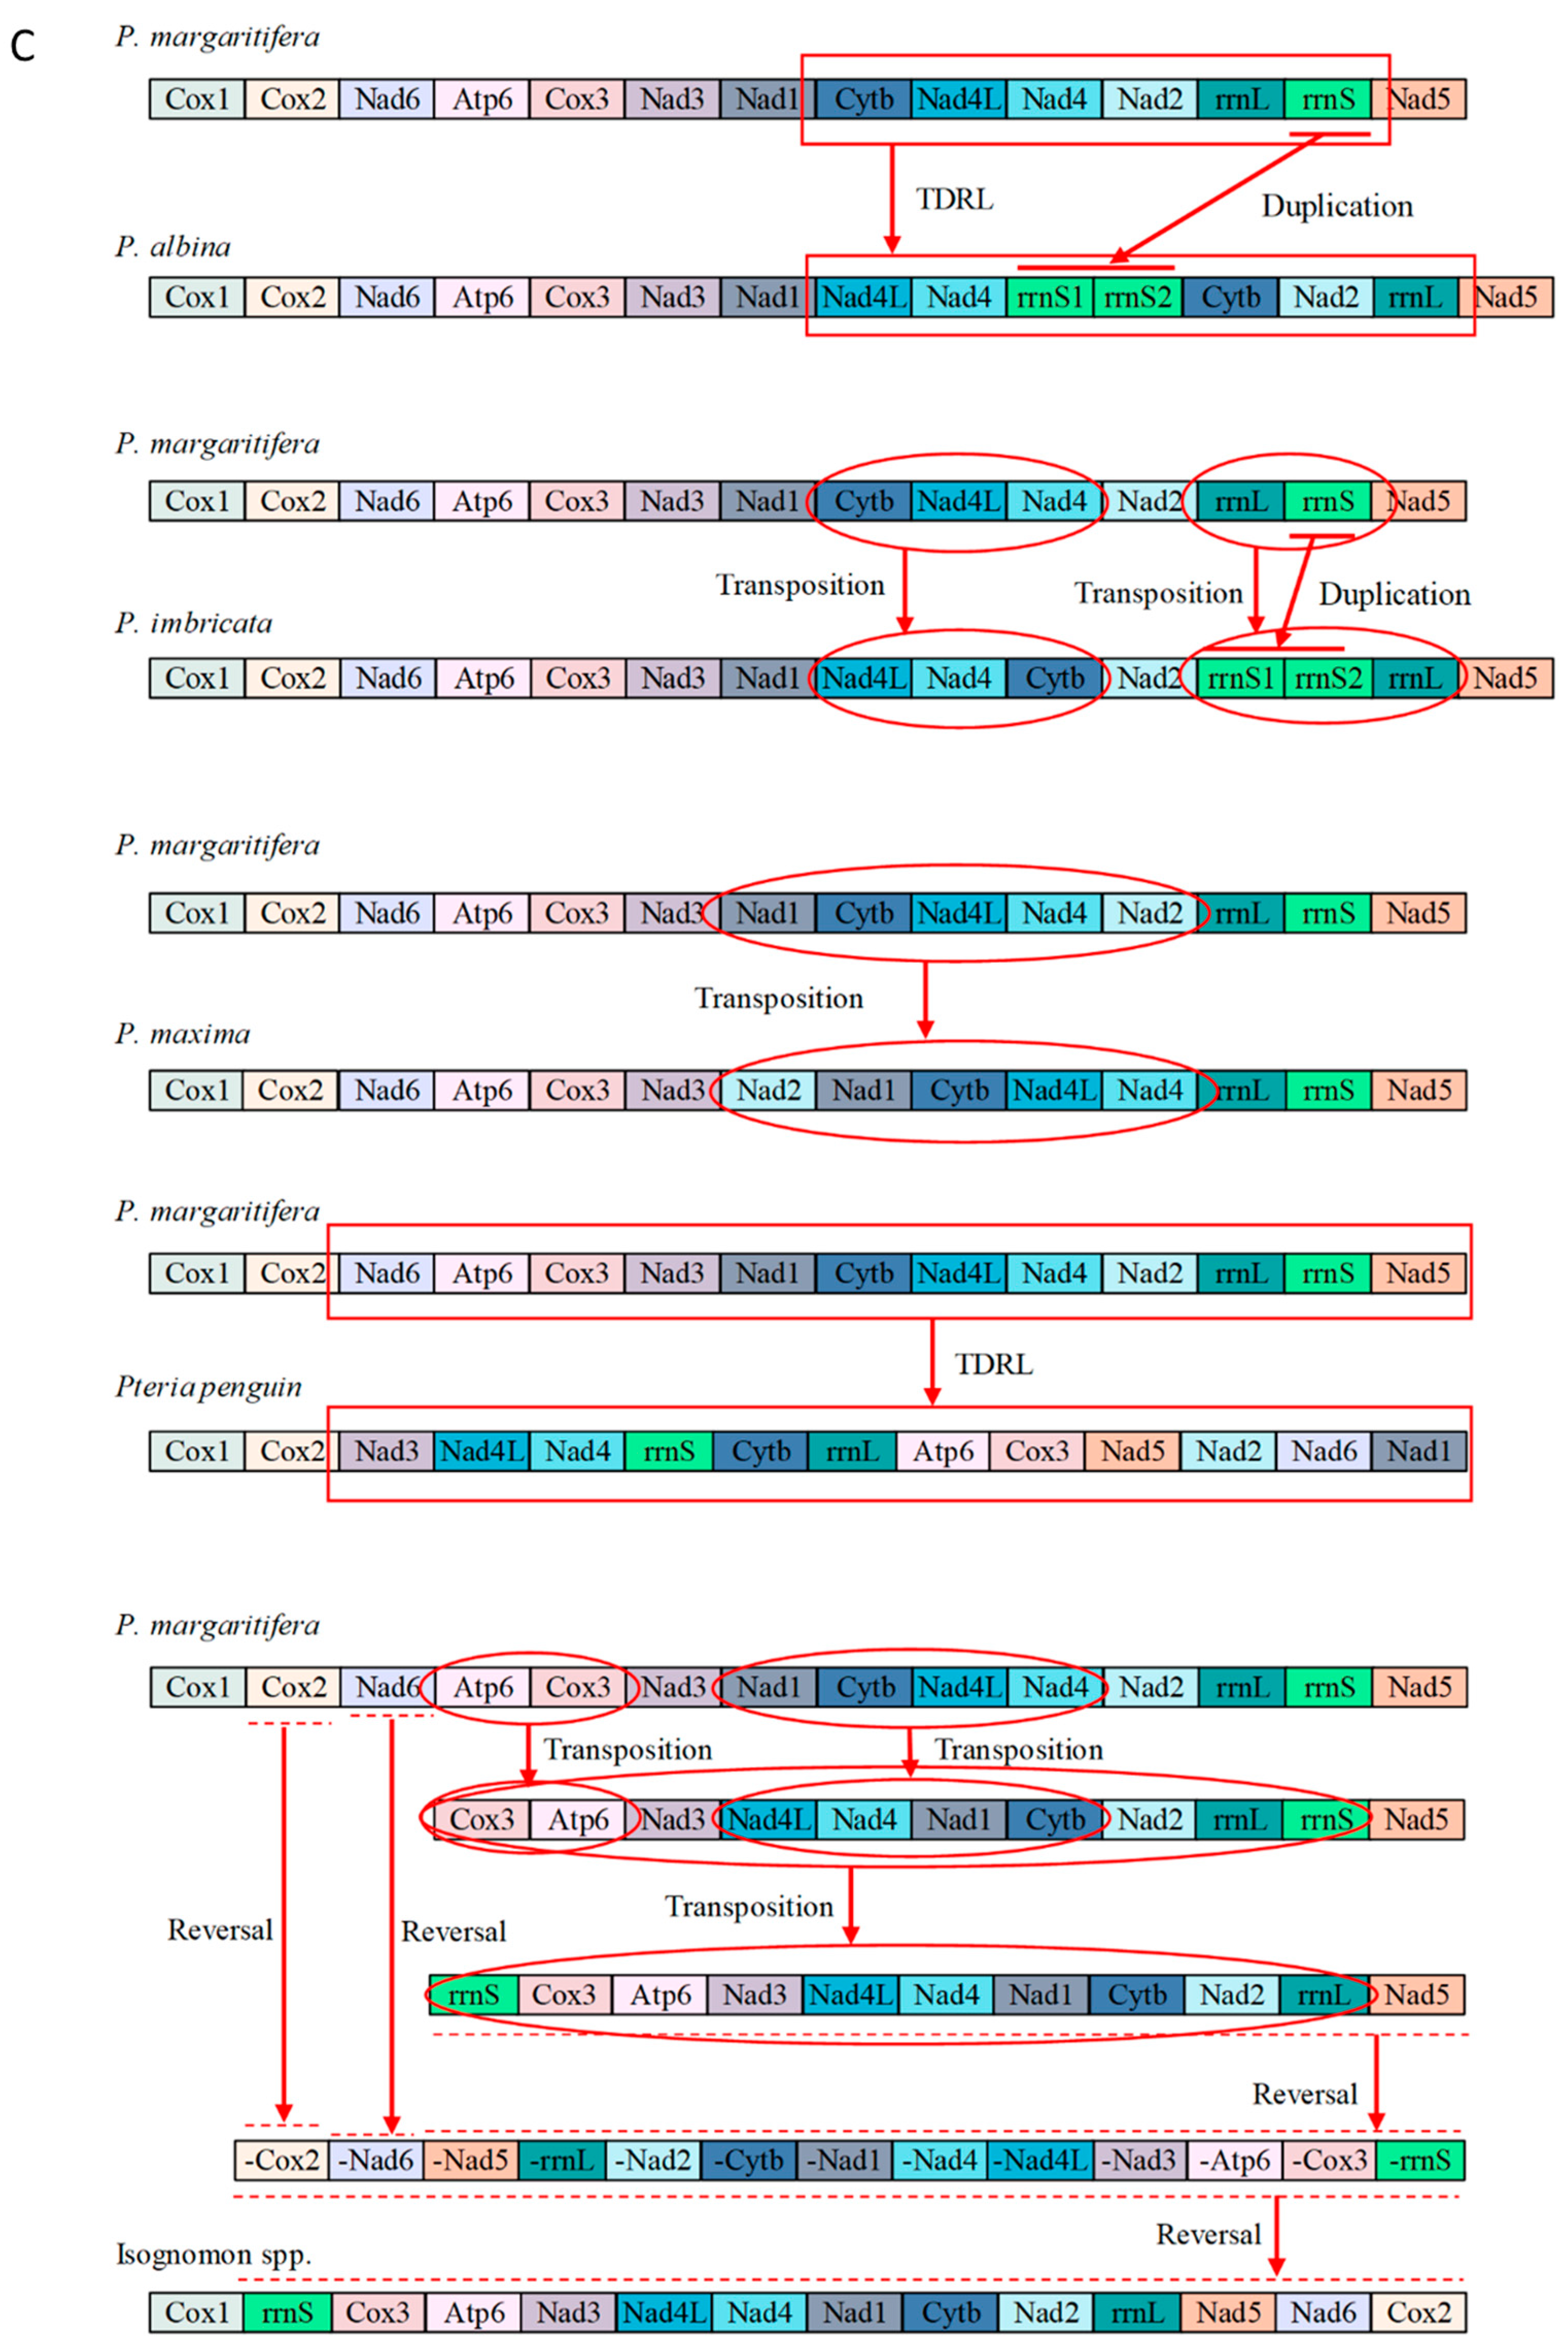
3.5. Mitochondrial Gene Rearrangements within Pterioidea
4. Conclusions
Supplementary Materials
Author Contributions
Funding
Institutional Review Board Statement
Informed Consent Statement
Data Availability Statement
Conflicts of Interest
References
- Stöger, I.; Schrödl, M. Mitogenomics does not resolve deep molluscan relationships (yet?). Mol. Phylogenet. Evol. 2013, 69, 376–392. [Google Scholar] [CrossRef] [PubMed]
- Gissi, C.; Iannelli, F.; Pesole, G. Evolution of the mitochondrial genome of Metazoa as exemplified by comparison of congeneric species. Heredity 2008, 101, 301–320. [Google Scholar] [CrossRef] [PubMed]
- Elson, J.L.; Lightowlers, R.N. Mitochondrial DNA clonality in the dock: Can surveillance swing the case? Trends Genet. 2006, 22, 603–607. [Google Scholar] [CrossRef] [PubMed]
- Miya, M.; Kawaguchi, A.; Nishida, M. Mitogenomic exploration of higher teleostean phylogenies: A case study for moderate-scale evolutionary genomics with 38 newly determined complete mitochondrial DNA sequences. Mol. Biol. Evol. 2001, 18, 1993–2009. [Google Scholar] [CrossRef] [PubMed]
- Ghiselli, F.; Gomes-Dos-Santos, A.; Adema, C.M.; Lopes-Lima, M.; Sharbrough, J.; Boore, J.L. Molluscan mitochondrial genomes break the rules. Philos. Trans. R. Soc. B Biol. Sci. 2021, 376, 20200159. [Google Scholar] [CrossRef] [PubMed]
- Milani, L.; Ghiselli, F.; Guerra, D.; Breton, S.; Passamonti, M. A comparative analysis of mitochondrial ORFans: New clues on their origin and role in species with Doubly Uniparental Inheritance of mitochondria. Genome Biol. Evol. 2013, 5, 1408–1434. [Google Scholar]
- Breton, S.; Beaupré, H.D.; Stewart, D.T.; Hoeh, W.R.; Blier, P.U. The unusual system of Doubly Uniparental Inheritance of mtDNA: Isn’t one enough? Trends Genet. 2007, 23, 465–474. [Google Scholar]
- Burzyński, A.; Zbawicka, M.; Skibinski, D.O.F.; Wenne, R. Evidence for recombination of mtDNA in the marine mussel Mytilus trossulus from the baltic. Mol. Biol. Evol. 2003, 20, 388–392. [Google Scholar] [CrossRef]
- Smith, C.H.; Pinto, B.J.; Kirkpatrick, M.; Hillis, D.M.; Pfeiffer, J.M.; Havird, J.C. A tale of two paths: The evolution of mitochondrial recombination in bivalves with doubly uniparental inheritance. J. Hered. 2023, 114, 119–206. [Google Scholar] [CrossRef]
- Boyle, E.E.; Etter, R.J. Heteroplasmy in a deep-sea protobranch bivalve suggests an ancient origin of doubly uniparental inheritance of mitochondria in Bivalvia. Mar. Biol. 2013, 160, 413–422. [Google Scholar] [CrossRef]
- Stewart, D.T.; Saavedra, C.; Stanwood, R.R.; Ball, A.O.; Zouros, E. Male and female mitochondrial DNA lineages in the blue mussel (Mytilus edulis) species group. Mol. Biol. Evol. 1995, 12, 735–747. [Google Scholar] [PubMed]
- Zhang, N.; Li, Y.; Halanych, K.M.; Kong, L.; Li, Q. A comparative analysis of mitochondrial ORFs provides new insights on expansion of mitochondrial genome size in Arcidae. BMC Genom. 2022, 23, 809. [Google Scholar] [CrossRef] [PubMed]
- Gagnon, J.M.; Kenchington, E.; Port, A.; Anstey, L.J.; Murillo, F.J. Morphological and genetic variation in North Atlantic giant file clams, Acestaspp. (Bivalvia: Limidae), with description of a new cryptic species in the northwest Atlantic. Zootaxa 2015, 4007, 151–180. [Google Scholar] [CrossRef]
- Li, X.; Bai, Y.; Dong, Z.; Xu, C.; Liu, S.; Yu, H.; Kong, L.; Li, Q. Chromosome-level genome assembly of the European flat oyster (Ostrea edulis) provides insights into its evolution and adaptation. Comp. Biochem. Physiol. Part D Genom. Proteom. 2023, 45, 101045. [Google Scholar] [CrossRef]
- Ren, J.; Shen, X.; Jiang, F.; Liu, B. The mitochondrial genomes of two scallops, Argopecten irradians and Chlamys farreri (Mollusca: Bivalvia): The most highly rearranged gene order in the family pectinidae. J. Mol. Evol. 2010, 70, 57–68. [Google Scholar] [CrossRef] [PubMed]
- Schrödl, M.; Stöger, I. A review on deep molluscan phylogeny: Old markers, integrative approaches, persistent problems. J. Nat. Hist. 2014, 48, 2773–2804. [Google Scholar] [CrossRef]
- Li, F.; Fan, M.; Wang, S.; Gu, Z.; Wang, A.; Liu, C.; Yang, Y.; Liu, S. The complete mitochondrial genome of Hyotissa hyotis (Bivalvia: Gryphaeidae) reveals a unique gene order within Ostreoidea. Fishes 2022, 7, 317. [Google Scholar] [CrossRef]
- Lubośny, M.; Przyłucka, A.; Śmietanka, B.; Breton, S.; Burzyński, A. Actively transcribed and expressed atp8 gene in Mytilus edulis mussels. PeerJ 2018, 6, 4897. [Google Scholar] [CrossRef]
- Zhao, B.; Gao, S.; Zhao, M.; Lv, H.; Song, J.; Wang, H.; Zeng, Q.; Liu, J. Mitochondrial genomic analyses provide new insights into the “missing” atp8 and adaptive evolution of Mytilidae. BMC Genom. 2022, 23, 738. [Google Scholar] [CrossRef]
- Kong, L.; Li, Y.; Kocot, K.M.; Yang, Y.; Qi, L.; Li, Q.; Halanych, K.M. Mitogenomics reveals phylogenetic relationships of Arcoida (Mollusca, Bivalvia) and multiple independent expansions and contractions in mitochondrial genome size. Mol. Phylogenet. Evol. 2020, 150, 106857. [Google Scholar] [CrossRef]
- Sun, S.; Li, Q.; Kong, L. Relaxation of selective constraint on the ultra-large mitochondrial genomes of Arcidae (Mollusca: Bivalvia). J. Ocean. Univ. China 2021, 20, 1157–1166. [Google Scholar] [CrossRef]
- Xu, T.; Qi, L.; Kong, L.; Li, Q. Mitogenomics reveals phylogenetic relationships of Patellogastropoda (Mollusca, Gastropoda) and dynamic gene rearrangements. Zool. Scr. 2022, 51, 147–160. [Google Scholar] [CrossRef]
- Chen, Y.; Xu, C.; Li, Q. Genetic diversity in a genetically improved line of the pacific oyster Crassostrea gigas with orange shell based on microsatellites and mtDNA data. Aquaculture 2022, 549, 737791. [Google Scholar] [CrossRef]
- Zhang, Y.; Chen, Y.; Xu, C.; Li, Q. Comparative analysis of genetic diversity and structure among four shell color strains of the pacific oyster Crassostrea gigas based on the mitochondrial COI gene and microsatellites. Aquaculture 2023, 563, 738990. [Google Scholar] [CrossRef]
- Hu, Y.; Li, Q.; Xu, C.; Liu, S.; Kong, L.; Yu, H. Genetic variability of mass-selected and wild populations of Iwagaki oyster (Crassostrea nippona) revealed by microsatellites and mitochondrial COI sequences. Aquaculture 2022, 561, 738737. [Google Scholar] [CrossRef]
- Qi, L.; Xu, B.; Kong, L.; Li, Q. Improved phylogenetic resolution within Neritidae (Gastropoda, Nertimorpha) with implications for the evolution of shell traits and habitat. Zool. Scr. 2023, 52, 46–57. [Google Scholar] [CrossRef]
- Meng, X.; Gao, R.; Shen, X.; Wang, S.; Cheng, H.; Dong, Z.; Yan, B. ITS1 sequences variation and phylogenetic analysis on five geographical stocks of Coelomactra antiquate. Shengtai Xuebao/Acta Ecol. Sin. 2010, 30, 5555–5561. [Google Scholar]
- Boore, J.L. Animal mitochondrial genomes. Nucleic Acids Res. 1999, 27, 1767–1780. [Google Scholar] [CrossRef]
- Zardoya, R. Recent advances in understanding mitochondrial genome diversity. F1000Research 2020, 9, 270. [Google Scholar] [CrossRef]
- Zuo, Q.; Zhang, Z.; Shen, Y. Novel mitochondrial gene rearrangements pattern in the millipede Polydesmus sp. gzcs-2019 and phylogenetic analysis of the Myriapoda. Ecol. Evol. 2022, 12, e8764. [Google Scholar] [CrossRef]
- Shen, Y.; Li, Q.; Cheng, R.; Luo, Y.; Zhang, Y.; Zuo, Q. Mitochondrial genomic characterization of two endemic chinese freshwater crabs of the genus Sinopotamon (Brachyura: Potamidae) and implications for biogeography analysis of Potamidae. Ecol. Evol. 2023, 13, e9858. [Google Scholar] [CrossRef] [PubMed]
- Lin, Y.J.; Cai, L.N.; Zhao, Y.Y.; Cheng, H.Y.; Storey, K.B.; Yu, D.N.; Zhang, J.Y. Novel mitochondrial gene rearrangement and intergenic regions exist in the mitochondrial genomes from four newly established families of praying mantises (Insecta: Mantodea). Insects 2022, 13, 564. [Google Scholar] [CrossRef] [PubMed]
- Boore, J.L.; Medina, M.; Rosenberg, L.A. Complete sequences of the highly rearranged molluscan mitochondrial genomes of the scaphopod Graptacme eborea and the bivalve Mytilus edulis. Mol. Biol. Evol. 2004, 21, 1492–1503. [Google Scholar] [CrossRef] [PubMed]
- Dowton, M.; Castro, L.R.; Austin, A.D. Mitochondrial gene rearrangements as phylogenetic characters in the invertebrates: The examination of genome “morphology”. Invertebr. Syst. 2002, 16, 345–356. [Google Scholar] [CrossRef]
- Bieler, R.; Mikkelsen, P.M.; Collins, T.M.; Glover, E.A.; González, V.L.; Graf, D.L.; Harper, E.M.; Healy, J.; Kawauchi, G.Y.; Sharma, P.P.; et al. Investigating the bivalve tree of life—An exemplar-based approach combining molecular and novel morphological characters. Invertebr. Syst. 2014, 28, 32–115. [Google Scholar] [CrossRef]
- Tëmkin, I. Molecular phylogeny of pearl oysters and their relatives (Mollusca, Bivalvia, Pterioidea). BMC Evol. Biol. 2010, 10, 342. [Google Scholar] [CrossRef]
- Sun, W.; Gao, L. Phylogeny and comparative genomic analysis of Pteriomorphia (Mollusca: Bivalvia) based on complete mitochondrial genomes. Mar. Biol. Res. 2017, 13, 255–268. [Google Scholar] [CrossRef]
- Matsumoto, M. Phylogenetic analysis of the subclass Pteriomorphia (Bivalvia) from mtDNA COI sequences. Mol. Phylogenet. Evol. 2003, 27, 429–440. [Google Scholar] [CrossRef]
- Gaitán-Espitia, J.D.; Quintero-Galvis, J.F.; Mesas, A.; D’Elía, G. Mitogenomics of southern hemisphere blue mussels (Bivalvia: Pteriomorphia): Insights into the evolutionary characteristics of the Mytilus edulis complex. Sci. Rep. 2016, 6, 26853. [Google Scholar] [CrossRef]
- Zhan, X.; Zhang, S.; Gu, Z.; Wang, A. Complete mitochondrial genomes of two pearl oyster species (Bivalvia: Pteriomorphia) reveal novel gene arrangements. J. Shellfish Res. 2018, 37, 1039–1050. [Google Scholar] [CrossRef]
- Feng, Y.; Li, Q.; Kong, L. Molecular phylogeny of arcoidea with emphasis on Arcidae species (Bivalvia: Pteriomorphia) along the coast of china: Challenges to current classification of Arcoids. Mol. Phylogenet. Evol. 2015, 85, 189–196. [Google Scholar] [CrossRef]
- Bolger, A.M.; Lohse, M.; Usadel, B. Trimmomatic: A flexible trimmer for Illumina sequence data. Bioinformatics 2014, 30, 2114–2120. [Google Scholar] [CrossRef] [PubMed]
- Kearse, M.; Moir, R.; Wilson, A.; Stones-Havas, S.; Cheung, M.; Sturrock, S.; Buxton, S.; Cooper, A.; Markowitz, S.; Duran, C.; et al. Geneious basic: An integrated and extendable desktop software platform for the organization and analysis of sequence data. Bioinformatics 2012, 28, 1647–1649. [Google Scholar] [CrossRef] [PubMed]
- Bernt, M.; Donath, A.; Jühling, F.; Externbrink, F.; Florentz, C.; Fritzsch, G.; Pütz, J.; Middendorf, M.; Stadler, P.F. MITOS: Improved de novo Metazoan mitochondrial genome annotation. Mol. Phylogenet. Evol. 2013, 69, 313–319. [Google Scholar] [CrossRef] [PubMed]
- Laslett, D.; Canbäck, B. ARWEN: A program to detect tRNA genes in Metazoan mitochondrial nucleotide sequences. Bioinformatics 2008, 24, 172–175. [Google Scholar] [CrossRef]
- Chan, P.P.; Lin, B.Y.; Mak, A.J.; Lowe, T.M. tRNAscan-SE 2.0: Improved detection and functional classification of transfer RNA genes. Nucleic Acids Res. 2021, 49, 9077–9096. [Google Scholar]
- Tamura, K.; Stecher, G.; Kumar, S. MEGA11: Molecular evolutionary genetics analysis version 11. Mol. Biol. Evol. 2021, 38, 3022–3027. [Google Scholar] [CrossRef]
- Grant, J.R.; Stothard, P. The CGView server: A comparative genomics tool for circular genomes. Nucleic Acids Res. 2008, 36, W181–W184. [Google Scholar] [CrossRef]
- Katoh, K.; Rozewicki, J.; Yamada, K.D. MAFFT online service: Multiple sequence alignment, interactive sequence choice and visualization. Brief Bioinform. 2018, 20, 1160–1166. [Google Scholar] [CrossRef]
- Dereeper, A.; Guignon, V.; Blanc, G.; Audic, S.; Buffet, S.; Chevenet, F.; Dufayard, J.F.; Guindon, S.; Lefort, V.; Lescot, M.; et al. Phylogeny.fr: Robust phylogenetic analysis for the non-specialist. Nucleic Acids Res. 2008, 36, W465–W469. [Google Scholar] [CrossRef]
- Cognato, A.I.; Vogler, A.P. Exploring data interaction and nucleotide alignment in a multiple gene analysis of Ips (Coleoptera: Scolytinae). Syst. Biol. 2001, 50, 758–780. [Google Scholar] [CrossRef] [PubMed]
- Nguyen, L.T.; Schmidt, H.A.; Von Haeseler, A.; Minh, B.Q. IQ-TREE: A fast and effective stochastic algorithm for estimating maximum-likelihood phylogenies. Mol. Biol. Evol. 2015, 32, 268–274. [Google Scholar] [CrossRef] [PubMed]
- Ronquist, F.; Teslenko, M.; Van Der Mark, P.; Ayres, D.L.; Darling, A.; Höhna, S.; Larget, B.; Liu, L.; Suchard, M.A.; Huelsenbeck, J.P. Mrbayes 3.2: Efficient bayesian phylogenetic inference and model choice across a large model space. Syst. Biol. 2012, 61, 539–542. [Google Scholar] [CrossRef] [PubMed]
- Rambaut, A.; Drummond, A.J.; Xie, D.; Baele, G.; Suchard, M.A. Posterior summarization in Bayesian phylogenetics using Tracer 1.7. Syst. Biol. 2018, 67, 901–904. [Google Scholar] [CrossRef]
- Rambaut, A. FigTree—Tree Figure Drawing Tool, Version 1.4.3. Molecular Evolution, Phylogenetics and Epidemiology; Figtree Systems Pty Ltd.: Sydney, Australia, 2016. [Google Scholar]
- Bernt, M.; Merkle, D.; Ramsch, K.; Fritzsch, G.; Perseke, M.; Bernhard, D.; Schlegel, M.; Stadler, P.F.; Middendorf, M. CREx: Inferring genomic rearrangements based on common intervals. Bioinformatics 2007, 23, 2957–2958. [Google Scholar] [CrossRef]
- Somrup, S.; Sangsawang, A.; McMillan, N.; Winitchai, S.; Inthoncharoen, J.; Liu, S.; Muangmai, N. Pinctada phuketensis sp. nov. (Bivalvia, Ostreida, Margaritidae), a new pearl oyster species from Phuket, western coast of Thailand. Zookeys 2022, 1119, 181–195. [Google Scholar] [CrossRef]
- Wang, Y.; Yang, Y.; Liu, H.; Kong, L.; Yu, H.; Liu, S.; Li, Q. Phylogeny of Veneridae (Bivalvia) based on mitochondrial genomes. Zool. Scr. 2021, 50, 58–70. [Google Scholar] [CrossRef]
- Mu, W. The complete mitochondrial genome of Saccostrea malabonensis (Ostreida: Ostreidae): Characterization and phylogenetic position. Mitochondrial DNA Part B Resour. 2022, 7, 1945–1947. [Google Scholar] [CrossRef]
- Yu, H.; Kong, L.; Li, Q. Complete mitochondrial genome of Ostrea denselamellosa (Bivalvia, Ostreidae). Mitochondrial DNA 2016, 27, 711–712. [Google Scholar] [CrossRef]
- Li, F.; Liu, H.; Heng, X.; Zhang, Y.; Fan, M.; Wang, S.; Liu, C.; Gu, Z.; Wang, A.; Yang, Y. The complete mitochondrial genome of Hyotissa sinensis (Bivalvia, Ostreoidea) indicates the genetic diversity within Gryphaeidae. Biodivers. Data J. 2023, 11, e101333. [Google Scholar] [CrossRef]
- Wang, Q.; Liu, H.; Teng, W.; Yu, Z.; Liu, X.; Xie, X.; Yue, C.; Li, D.; Liang, M.; Li, Q. Characterization of the complete mitochondrial genome of Alectryonella plicatula (Bivalvia: Ostreidae). Mitochondrial DNA Part B Resour. 2021, 6, 1581–1582. [Google Scholar] [CrossRef] [PubMed]
- Sun, S.; Jiang, L.; Kong, L.; Li, Q. Comparative mitogenomic analysis of the superfamily Tellinoidea (Mollusca: Bivalvia): Insights into the evolution of the gene rearrangements. Comp. Biochem. Physiol. Part D Genom. Proteom. 2020, 36, 100739. [Google Scholar] [CrossRef] [PubMed]
- Xu, M.; Gu, Z.; Huang, J.; Guo, B.; Jiang, L.; Xu, K.; Ye, Y.; Li, J. The complete mitochondrial genome of Mytilisepta virgata (Mollusca: Bivalvia), novel gene rearrangements, and the phylogenetic relationships of Mytilidae. Genes 2023, 14, 910. [Google Scholar] [CrossRef]
- Milbury, C.A.; Gaffney, P.M. Complete mitochondrial DNA sequence of the eastern oyster Crassostrea virginica. Mar. Biotechnol. 2005, 7, 697–712. [Google Scholar] [CrossRef] [PubMed]
- Sun, S.; Li, Q.; Kong, L.; Yu, H. Evolution of mitochondrial gene arrangements in Arcidae (Bivalvia: Arcida) and their phylogenetic implications. Mol. Phylogenet. Evol. 2020, 150, 106879. [Google Scholar] [CrossRef] [PubMed]
- Wang, G.; Li, X.; Wang, J.; Zhang, J.; Liu, W.; Lu, C.; Guo, Y.; Dong, B. The complete mitochondrial genome and phylogenetic analysis of Acaudina molpdioides. Mitochondrial DNA B Resour. 2019, 4, 668–669. [Google Scholar] [CrossRef]
- Boore, J.L.; Brown, W.M. Complete sequence of the mitochondrial DNA of the annelid worm Lumbricus terrestris. Genetics 1995, 141, 305–319. [Google Scholar] [CrossRef]
- Breton, S.; Burger, G.; Stewart, D.T.; Blier, P.U. Comparative analysis of gender-associated complete mitochondrial genomes in marine mussels (Mytilus spp.). Genetics 2006, 172, 1107–1119. [Google Scholar] [CrossRef]
- Breton, S.; Stewart, D.T.; Shepardson, S.; Trdan, R.J.; Bogan, A.E.; Chapman, E.G.; Ruminas, A.J.; Piontkivska, H.; Hoeh, W.R. Novel protein genes in animal mtDNA: A new sex determination system in freshwater mussels (Bivalvia: Unionoida)? Mol. Biol. Evol. 2011, 28, 1645–1659. [Google Scholar] [CrossRef]
- Wu, X.; Xu, X.; Yu, Z.; Wei, Z.; Xia, J. Comparison of seven crassostrea mitogenomes and phylogenetic analyses. Mol. Phylogenet. Evol. 2010, 57, 448–454. [Google Scholar] [CrossRef]
- Wu, X.; Xu, X.; Yu, Z.; Kong, X. Comparative mitogenomic analyses of three scallops (Bivalvia: Pectinidae) reveal high level variation of genomic organization and a diversity of transfer RNA gene sets. BMC Res. Notes 2009, 2, 69. [Google Scholar] [CrossRef] [PubMed]
- Lemer, S.; Bieler, R.; Giribet, G. Resolving the relationships of clams and cockles: Dense transcriptome sampling drastically improves the Bivalve tree of life. Proc. R. Soc. B Biol. Sci. 2019, 286, 1896. [Google Scholar] [CrossRef] [PubMed]
- Steiner, G.; Hammer, S. Molecular phylogeny of the Bivalvia inferred from 18S rDNA sequences with particular reference to the Pteriomophia. Geol. Soc. Spec. Publ. 2000, 177, 11–29. [Google Scholar] [CrossRef]
- Adamkewicz, S.L.; Harasewych, M.G.; Blake, J.; Saudek, D.; Bult, C.J. A molecular phylogeny of the bivalve mollusks. Mol. Biol. Evol. 1997, 14, 619–629. [Google Scholar] [CrossRef]
- Ozawa, G.; Shimamura, S.; Takaki, Y.; Yokobori, S.-I.; Ohara, Y.; Takishita, K.; Maruyama, T.; Fujikura, K.; Yoshida, T. Updated mitochondrial phylogeny of Pteriomorph and Heterodont Bivalvia, including deep-sea chemosymbiotic Bathymodiolus mussels, vesicomyid clams and the thyasirid clam Conchocele cf. bisecta. Mar. Genom. 2017, 31, 43–52. [Google Scholar] [CrossRef]
- Colgan, D.J.; Ponder, W.F. Genetic discrimination of morphologically similar, sympatric species of pearl oysters (Mollusca: Bivalvia: Pinctada) in eastern Australia. Mar. Freshw. Res. 2002, 53, 697–709. [Google Scholar] [CrossRef]
- Jameson, H.L. On the identity and distribution of the mother-of-pearl oysters; with a revision of the subgenus Margaritifera. Proc. Zool. Soc. Lond. 1901, 70, 372–394. [Google Scholar] [CrossRef]
- Cunha, R.L.; Blanc, F.; Bonhomme, F.; Arnaud-Haond, S. Evolutionary patterns in pearl oysters of the genus Pinctada (Bivalvia: Pteriidae). Mar. Biotechnol. 2011, 13, 181–192. [Google Scholar] [CrossRef]
- Cameron, S.L.; Johnson, K.P.; Whiting, M.F. The mitochondrial genome of the screamer louse Bothriometopus (Phthiraptera: Ischnocera): Effects of extensive gene rearrangements on the evolution of the genome. J. Mol. Evol. 2007, 65, 589–604. [Google Scholar] [CrossRef]


| Gene | Strand | Location | Size (bp) | Start Codon | Stop Codon | Intergenic Nucleotides |
|---|---|---|---|---|---|---|
| Cox1 | H | 1–1626 | 1626 | ATG | TAG | 6 |
| Cox2 | H | 1633–2376 | 744 | GTG | TAG | 13 |
| trnT1 | H | 2390–2454 | 65 | 137 | ||
| Nad6 | H | 2592–3071 | 480 | ATG | TAG | 116 |
| Atp6 | H | 3188–3934 | 747 | ATG | TAA | 7 |
| Cox3 | H | 3942–4721 | 780 | ATT | TAA | 4 |
| Nad3 | H | 4726–5127 | 402 | ATA | TAA | −20 |
| trnC1 | H | 5108–5169 | 62 | 4 | ||
| trnP | H | 5174–5239 | 66 | −4 | ||
| trnH | H | 5236–5304 | 69 | −34 | ||
| Nad1 | H | 5271–6281 | 1011 | GTG | TAG | −32 |
| trnL | H | 6250–6312 | 63 | −1 | ||
| trnN | H | 6312–6381 | 70 | 1 | ||
| trnF | H | 6383–6448 | 66 | −36 | ||
| Nad4L | H | 6413–6733 | 321 | TTG | TAG | 14 |
| Nad4 | H | 6748–8055 | 1308 | ATA | TAG | 54 |
| trnI | H | 8110–8176 | 67 | 18 | ||
| trnG | H | 8195–8261 | 67 | 5 | ||
| trnW1 | H | 8267–8331 | 65 | 69 | ||
| trnK | H | 8400–8466 | 67 | 13 | ||
| trnY | H | 8480–8545 | 66 | 320 | ||
| trnQ | H | 8866–8937 | 72 | 530 | ||
| trnM1 | H | 9468–9544 | 77 | 438 | ||
| trnA | H | 9983–10,050 | 68 | 8 | ||
| trnT2 | H | 10,059–10,122 | 64 | 1009 | ||
| rrnS1 | H | 11,132–11,937 | 806 | 1275 | ||
| trnC2 | H | 13,213–13,271 | 59 | 1420 | ||
| trnR | H | 14,692–14,761 | 70 | 129 | ||
| trnD | H | 14,891–14,953 | 63 | 265 | ||
| rrnS2 | H | 15,219–16,024 | 806 | |||
| Cytb | H | 17,575–18,777 | 1203 | ATT | TAG | −11 |
| Nad2 | H | 18,767–19,741 | 975 | GTG | TAG | 5 |
| trnE | H | 19,747–19,814 | 68 | 110 | ||
| trnW2 | H | 19,925–19,990 | 66 | 28 | ||
| trnV | H | 20,019–20,085 | 67 | 514 | ||
| rrnL | H | 20,600–22,000 | 1401 | 18 | ||
| trnM2 | H | 22,019–22,087 | 69 | −33 | ||
| Nad5 | H | 22,055–23,698 | 1644 | ATA | TAG | 143 |
| Gene | Strand | Location | Size (bp) | Start Codon | Stop Codon | Intergenic Nucleotides |
|---|---|---|---|---|---|---|
| Cox1 | H | 1–1563 | 1563 | ATG | TAA | 35 |
| Cox2 | H | 1599–2525 | 927 | ATG | TAG | −236 |
| trnM1 | H | 2290–2343 | 54 | −1 | ||
| trnA | H | 2343–2413 | 71 | −2 | ||
| trnR | H | 2412–2476 | 65 | 2 | ||
| trnT | H | 2479–2531 | 53 | 0 | ||
| trnL1 | H | 2532–2594 | 63 | 136 | ||
| Nad6 | H | 2731–3189 | 459 | ATG | TAG | −9 |
| trnG | H | 3181–3249 | 69 | −2 | ||
| trnW | H | 3248–3313 | 66 | 1 | ||
| Atp6 | H | 3315–4004 | 690 | ATG | TAA | −11 |
| Cox3 | H | 3994–4791 | 798 | ATG | TAG | 119 |
| Nad3 | H | 4911–5381 | 471 | ATG | TAA | −74 |
| trnN | H | 5308–5371 | 64 | 3 | ||
| trnD | H | 5375–5438 | 64 | 34 | ||
| Nad1 | H | 5473–6414 | 942 | ATG | TAA | 11 |
| trnL2 | H | 6426–6487 | 62 | 48 | ||
| trnP | H | 6536–6600 | 65 | 364 | ||
| trnK | H | 6965–7029 | 65 | 456 | ||
| trnC | H | 7486–7553 | 68 | 17 | ||
| Cytb | H | 7571–8716 | 1146 | ATG | TAG | −1 |
| trnF | H | 8716–8780 | 65 | 0 | ||
| Nad4L | H | 8781–9059 | 279 | ATG | TAA | 20 |
| Nad4 | H | 9080–10,387 | 1308 | ATG | TAA | 50 |
| Nad2 | H | 10,438–11,481 | 1044 | ATG | TAG | −75 |
| trnY | H | 11,407–11,471 | 65 | 0 | ||
| trnV | H | 11,472–11,535 | 64 | 0 | ||
| trnS | H | 11,536–11,601 | 66 | 131 | ||
| rrnL | H | 11,733–12,701 | 969 | 59 | ||
| trnQ | H | 12,761–12,825 | 65 | 1 | ||
| rrnS | H | 12,827–13,616 | 790 | 15 | ||
| trnH | H | 13,632–13,685 | 54 | 0 | ||
| trnE | H | 13,686–13,747 | 62 | −1 | ||
| trnM2 | H | 13,747–13,810 | 64 | −1 | ||
| Nad5 | H | 13,810–15,420 | 1611 | ATG | TAA | 68 |
| trnI | H | 15,489–15,551 | 63 | 5 |
| Speices | P. albina | P. margaritifera | ||||
|---|---|---|---|---|---|---|
| Feature | (A + T)% | AT Skew | GC Skew | (A + T)% | AT Skew | GC Skew |
| Whole genome | 58.0 | −0.13 | 0.30 | 57.8 | −0.24 | 0.35 |
| PCGs | 58.1 | −0.21 | 0.28 | 56.7 | −0.31 | 0.36 |
| PCGs1 | 53.4 | −0.07 | 0.30 | 53.6 | −0.13 | 0.37 |
| PCGs2 | 60.6 | −0.41 | 0.22 | 60.5 | −0.42 | 0.28 |
| PCGs3 | 60.4 | −0.14 | 0.32 | 56.3 | −0.35 | 0.42 |
| tRNAs | 55.8 | −0.04 | 0.24 | 59.7 | −0.03 | 0.30 |
| Cox1 | 57.2 | −0.21 | 0.20 | 59.1 | −0.30 | 0.23 |
| Cox2 | 56.0 | −0.18 | 0.23 | 56.8 | −0.17 | 0.29 |
| Nad6 | 57.7 | −0.24 | 0.29 | 59.7 | −0.32 | 0.47 |
| Atp6 | 57.9 | −0.23 | 0.30 | 58.2 | −0.33 | 0.48 |
| Cox3 | 56.6 | −0.27 | 0.25 | 57.2 | −0.28 | 0.27 |
| Nad3 | 58.7 | −0.16 | 0.41 | 56.5 | −0.22 | 0.37 |
| Nad1 | 59.1 | −0.20 | 0.23 | 55.7 | −0.31 | 0.26 |
| Nad4L | 55.4 | −0.10 | 0.38 | 57.3 | −0.36 | 0.33 |
| Nad4 | 56.6 | −0.26 | 0.34 | 53.8 | −0.35 | 0.63 |
| Cytb | 61.8 | −0.19 | 0.19 | 53.1 | −0.36 | 0.37 |
| Nad2 | 60.1 | −0.24 | 0.35 | 56.6 | −0.31 | 0.50 |
| Nad5 | 57.9 | −0.18 | 0.35 | 56.9 | −0.31 | 0.42 |
| rrnS | 56.2 | 0.10 | 0.20 | 59.7 | −0.01 | 0.22 |
| rrnL | 59.4 | 0.05 | 0.30 | 58.5 | −0.04 | 0.33 |
| rRNAs | 57.7 | 0.07 | 0.25 | 59.1 | −0.03 | 0.28 |
| Amino Acid | Codon | Count (RSCU) | Amino Acid | Codon | Count (RSCU) |
|---|---|---|---|---|---|
| Phe | UUU | 246.0 (1.67) | Ala | GCU | 83.0 (1.68) |
| UUC | 48.0 (0.33) | GCC | 40.0 (0.81) | ||
| Leu | UUA | 176.0 (1.94) | GCA | 47.0 (0.95) | |
| UUG | 106.0 (1.17) | GCG | 28.0 (0.57) | ||
| CUU | 80.0 (0.88) | Gly | GGU | 67.0 (0.77) | |
| CUC | 24.0 (0.27) | GGC | 55.0 (0.64) | ||
| CUA | 93.0 (1.03) | GGA | 72.0 (0.83) | ||
| CUG | 64.0 (0.71) | GGG | 152.0 (1.76) | ||
| Ile | AUU | 135.0 (1.57) | Arg | CGU | 23.0 (1.07) |
| AUC | 37.0 (0.43) | CGC | 12.0 (0.56) | ||
| Met | AUA | 98.0 (1.08) | CGA | 24.0 (1.12) | |
| AUG | 84.0 (0.92) | CGG | 27.0 (1.26) | ||
| Val | GUU | 134.0 (1.32) | Tyr | UAU | 97.0 (1.39) |
| GUC | 44.0 (0.43) | UAC | 43.0 (0.61) | ||
| GUA | 114.0 (1.13) | His | CAU | 52.0 (1.25) | |
| GUG | 113.0 (1.12) | CAC | 31.0 (0.75) | ||
| Ser | UCU | 73.0 (1.53) | Gln | CAA | 29.0 (0.97) |
| UCC | 21.0 (0.44) | CAG | 31.0 (1.03) | ||
| UCA | 30.0 (0.63) | Asn | AAU | 40.0 (1.14) | |
| UCG | 7.0 (0.15) | AAC | 30.0 (0.86) | ||
| AGU | 48.0 (1.01) | Lys | AAA | 75.0 (1.15) | |
| AGC | 26.0 (0.54) | AAG | 55.0 (0.85) | ||
| AGA | 76.0 (1.59) | Asp | GAU | 52.0 (1.35) | |
| AGG | 101.0 (2.12) | GAC | 25.0 (0.65) | ||
| Pro | CCU | 47.0 (1.49) | Glu | GAA | 32.0 (0.62) |
| CCC | 23.0 (0.73) | GAG | 72.0 (1.38) | ||
| CCA | 35.0 (1.11) | Cys | UGU | 57.0 (1.31) | |
| CCG | 21.0 (0.67) | UGC | 30.0 (0.69) | ||
| Thr | ACU | 50.0 (1.67) | Trp | UGA | 37.0 (0.57) |
| ACC | 15.0 (0.50) | UGG | 93.0 (1.43) | ||
| ACA | 36.0 (1.20) | * | UAA | 3.0 (0.50) | |
| ACG | 19.0 (0.63) | UAG | 9.0 (1.50) |
| Amino Acid | Codon | Count (RSCU) | Amino Acid | Codon | Count (RSCU) |
|---|---|---|---|---|---|
| Phe | UUU | 239.0 (1.62) | Ala | GCU | 89.0 (2.06) |
| UUC | 56.0 (0.38) | GCC | 24.0 (0.55) | ||
| Leu | UUA | 136.0 (1.54) | GCA | 23.0 (0.53) | |
| UUG | 187.0 (2.12) | GCG | 37.0 (0.86) | ||
| CUU | 76.0 (0.86) | Gly | GGU | 108.0 (1.09) | |
| CUC | 19.0 (0.22) | GGC | 51.0 (0.52) | ||
| CUA | 46.0 (0.52) | GGA | 68.0 (0.69) | ||
| CUG | 66.0 (0.75) | GGG | 168.0 (1.70) | ||
| Ile | AUU | 132.0 (1.62) | Arg | CGU | 29.0 (1.45) |
| AUC | 31.0 (0.38) | CGC | 11.0 (0.55) | ||
| Met | AUA | 58.0 (0.63) | CGA | 12.0 (0.60) | |
| AUG | 125.0 (1.37) | CGG | 28.0 (1.40) | ||
| Val | GUU | 190.0 (1.71) | Tyr | UAU | 93.0 (1.38) |
| GUC | 44.0 (0.40) | UAC | 42.0 (0.62) | ||
| GUA | 87.0 (0.78) | His | CAU | 43.0 (1.01) | |
| GUG | 123.0 (1.11) | CAC | 42.0 (0.99) | ||
| Ser | UCU | 70.0 (1.48) | Gln | CAA | 14.0 (0.56) |
| UCC | 21.0 (0.44) | CAG | 36.0 (1.44) | ||
| UCA | 26.0 (0.55) | Asn | AAU | 50.0 (1.39) | |
| UCG | 19.0 (0.40) | AAC | 22.0 (0.61) | ||
| AGU | 67.0 (1.41) | Lys | AAA | 52.0 (0.87) | |
| AGC | 34.0 (0.72) | AAG | 67.0 (1.13) | ||
| AGA | 45.0 (0.95) | Asp | GAU | 48.0 (1.33) | |
| AGG | 97.0 (2.05) | GAC | 24.0 (0.67) | ||
| Pro | CCU | 59.0 (1.89) | Glu | GAA | 31.0 (0.58) |
| CCC | 20.0 (0.64) | GAG | 76.0 (1.42) | ||
| CCA | 26.0 (0.83) | Cys | UGU | 80.0 (1.65) | |
| CCG | 20.0 (0.64) | UGC | 17.0 (0.35) | ||
| Thr | ACU | 45.0 (1.84) | Trp | UGA | 41.0 (0.62) |
| ACC | 16.0 (0.65) | UGG | 91.0 (1.38) | ||
| ACA | 16.0 (0.65) | * | UAA | 7.0 (1.17) | |
| ACG | 21.0 (0.86) | UAG | 5.0 (0.83) |
| From | To | Transp. | Rev. | Rev.transp. | TDRL | Total Events |
|---|---|---|---|---|---|---|
| P. albina | P. imbricata | 1 | 0 | 0 | 0 | 1 |
| P. margaritifera | 2 | 0 | 0 | 0 | 2 | |
| P. maxima | 0 | 0 | 0 | 2 | 2 | |
| P. penguin | 0 | 0 | 0 | 2 | 2 | |
| I. bicolor | 3 | 4 | 0 | 0 | 7 | |
| P. imbricata | P. albina | 1 | 0 | 0 | 0 | 1 |
| P. margaritifera | 2 | 0 | 0 | 0 | 2 | |
| P. maxima | 3 | 0 | 0 | 0 | 3 | |
| P. penguin | 0 | 0 | 0 | 3 | 3 | |
| I. bicolor | 3 | 4 | 0 | 0 | 7 | |
| P. margaritifera | P. albina | 0 | 0 | 0 | 1 | 1 |
| P. imbricata | 2 | 0 | 0 | 0 | 2 | |
| P. maxima | 1 | 0 | 0 | 0 | 1 | |
| P. penguin | 0 | 0 | 0 | 3 | 3 | |
| I. bicolor | 3 | 4 | 0 | 0 | 7 | |
| P. maxima | P. albina | 1 | 0 | 0 | 1 | 2 |
| P. imbricata | 3 | 0 | 0 | 0 | 3 | |
| P. margaritifera | 1 | 0 | 0 | 0 | 1 | |
| P. penguin | 0 | 0 | 0 | 3 | 3 | |
| I. bicolor | 2 | 8 | 0 | 0 | 10 | |
| P. penguin | P. albina | 1 | 0 | 0 | 2 | 3 |
| P. imbricata | 1 | 0 | 0 | 2 | 3 | |
| P. margaritifera | 1 | 0 | 0 | 2 | 3 | |
| P. maxima | 3 | 0 | 0 | 1 | 4 | |
| I. bicolor | 1 | 1 | 1 | 2 | 5 | |
| I. bicolor | P. albina | 3 | 4 | 0 | 0 | 7 |
| P. imbricata | 3 | 4 | 0 | 0 | 7 | |
| P. margaritifera | 3 | 4 | 0 | 0 | 7 | |
| P. maxima | 2 | 8 | 0 | 3 | 13 | |
| P. penguin | 2 | 1 | 1 | 2 | 6 |
Disclaimer/Publisher’s Note: The statements, opinions and data contained in all publications are solely those of the individual author(s) and contributor(s) and not of MDPI and/or the editor(s). MDPI and/or the editor(s) disclaim responsibility for any injury to people or property resulting from any ideas, methods, instructions or products referred to in the content. |
© 2023 by the authors. Licensee MDPI, Basel, Switzerland. This article is an open access article distributed under the terms and conditions of the Creative Commons Attribution (CC BY) license (https://creativecommons.org/licenses/by/4.0/).
Share and Cite
Zhang, Y.; Qi, L.; Li, F.; Yang, Y.; Gu, Z.; Liu, C.; Li, Q.; Wang, A. Mitogenomic Analysis of Pterioidea (Bivalvia: Pteriomorphia): Insights into the Evolution of the Gene Rearrangements. Fishes 2023, 8, 528. https://doi.org/10.3390/fishes8100528
Zhang Y, Qi L, Li F, Yang Y, Gu Z, Liu C, Li Q, Wang A. Mitogenomic Analysis of Pterioidea (Bivalvia: Pteriomorphia): Insights into the Evolution of the Gene Rearrangements. Fishes. 2023; 8(10):528. https://doi.org/10.3390/fishes8100528
Chicago/Turabian StyleZhang, Yu, Lu Qi, Fengping Li, Yi Yang, Zhifeng Gu, Chunsheng Liu, Qi Li, and Aimin Wang. 2023. "Mitogenomic Analysis of Pterioidea (Bivalvia: Pteriomorphia): Insights into the Evolution of the Gene Rearrangements" Fishes 8, no. 10: 528. https://doi.org/10.3390/fishes8100528
APA StyleZhang, Y., Qi, L., Li, F., Yang, Y., Gu, Z., Liu, C., Li, Q., & Wang, A. (2023). Mitogenomic Analysis of Pterioidea (Bivalvia: Pteriomorphia): Insights into the Evolution of the Gene Rearrangements. Fishes, 8(10), 528. https://doi.org/10.3390/fishes8100528