Article

Growth Performance, Nutritional Quality, and Immune-Related Gene Expression of the Chinese Mitten Crab (Eriocheir sinensis) in Pond Ecosystem as Influenced by Stocking Density

1
School of Life Sciences, Nanchang University, Jiangxi 330013, China
2
Department of Animal Husbandry and Aquatic Technology Extension and Application, Jiangxi Agricultural Technology Extension Center, Jiangxi 330046, China
3
Fisheries Research Institute of Chongqing Research Institute of Nanchang University, Chongqing 400037, China
*
Authors to whom correspondence should be addressed.
Those authors contributed equally to this work.
Fishes 2022, 7(6), 362; https://doi.org/10.3390/fishes7060362
Submission received: 30 September 2022 / Revised: 25 November 2022 / Accepted: 27 November 2022 / Published: 29 November 2022
(This article belongs to the Special Issue Nutrition and Immunity of Fish and Shellfish)

Abstract

:
This study aimed to evaluate the influence of stocking density on growth performance, nutritional quality, and immune-related gene expression of Eriocheir sinensis and water quality in pond ecosystems. E. sinensis were randomly divided into five density groups (G1: 1.2 inds/m2; G2: 1.5 inds/m2; G3: 1.8 inds/m2; G4: 2.1 inds/m2; G5: 2.4 inds/m2) based on their breeding densities, and three replicates were set up for each density group, for a total of fifteen ponds. After 169 days of breeding, the muscle, hepatopancreatic tissue, and hemolymph of E. sinensis, randomly selected from each group, were collected for analysis. Body weight (BW), carapace length, and carapace width increased with breeding time, and the BW of E. sinensis in G3 was higher than that in the other groups. In the muscle and hepatopancreas, the crude lipid content in the G3 group was higher than that in the other groups (p > 0.05). In the muscle tissue, the contents of total, essential, and delicious amino acids in the G3 group were higher than those in the other groups. The expression levels of immune-related genes in G5 were higher than those in the other groups. The value of pH decreased and NO2-N increased significantly in the G5 group and pH, as a synergetic factor of culture density, affected the growth performance of E. sinensis. In conclusion, stocking density has a certain impact on the growth performance, nutrition quality, and immunity of E. sinensis and water quality in pond ecosystems, and a stocking density of 1.8 inds/m2 can be considered optimal for rearing in pond ecosystems of the Poyang Lake region.

1. Introduction

The Chinese mitten crab (Eriocheir sinensis) is an important freshwater cultured crustacean in China [1]. E. sinensis has excellent taste and good nutritional properties. The hepatopancreas, gonads, and muscles are the main edible parts of E. sinensis, which are rich in a variety of essential amino acids (EAA) and polyunsaturated fatty acids (PUFA) and have positive pharmacological and physiological effects on human health [2,3]. Therefore, the analysis of muscle and hepatopancreas components is important to assess the edible quality and nutritional value of E. sinensis.
Although numerous studies have described the culture technology of E. sinensis at home and abroad, the appropriate breeding mode of E. sinensis often varies substantially due to the influence of different water environments [4,5,6]. Therefore, it is necessary to research the key factors in the culture process. It is known that in fish culture, an increase in the stocking density will intensify the intraspecific struggle of cultured organisms; for example, by increasing the competition pressure for food and space, which will affect their survival, growth, and physiology, and will also aggravate the deterioration of the quality of cultured water [7,8,9]. Previous studies have reported that stocking density affects the survival rate, growth, breeding quality, and aquaculture water environment of shrimp and crab culture, and this effect is negatively correlated [10,11,12,13]. The generally accepted explanation is that the high-density living environment will intensify the competition for water space and food resources, thereby affecting its feeding, growth, and energy metabolism, such as Mithraculus forceps [14] and Palaemonetes sinensis [15]. In addition, intensive farming at high density can also cause stress responses in shrimp and crabs [16,17]. Considering the above-mentioned reasons, the importance of studying the appropriate stocking density of E. sinensis becomes evident.
In recent years, the aquaculture area and output of E. sinensis in Jiangxi Province have increased annually, and aquaculture methods have diversified. However, few systematic reports on the healthy breeding of E. sinensis in Jiangxi have been reported. Therefore, Poyang Lake was selected as the focus of research in the current study, and the influence of stocking density on growth performance, nutritional quality, and immune-related gene expression of E. sinensis in the pond ecosystem was analyzed. According to the actual production of E. sinensis cultured in the Poyang Lake area, five density groups were set up, namely, G1-G5(G1: 1.2 inds/m2; G2: 1.5 inds/m2; G3: 1.8 inds/m2; G4: 2.1 inds/m2; G5: 2.4 inds/m2). This study provides basic scientific data for the healthy culture of the Chinese mitten crab in the Poyang Lake area and promotes the development of E. sinensis farming in the area.

2. Materials and Methods

2.1. Experimental Protocol and Sample Collection

This study followed the guidelines and was approved by the Animal Care and Use Committee of Nanchang University, and was performed in a crab breeding base of Jiangxi province. The experimental ponds (1000–1333 m2) are earth ponds with sufficient water sources, and the water quality complies with the requirements of water quality standards for fisheries and aquaculture (Table 1). The crabs (E. sinensis, a novel variety “Yangtze River No. 2”) were obtained from Ludong, Jiangsu Province, in early February, and healthy E. sinensis (6.32 ± 1.19 g) with robust physique, agile crawling, healthy appendages, no external injuries, and no parasite attachment were selected as the breeding test crab species. Basic information on the E. sinensis species and ponds is provided in Table 2. The E. sinensis were randomly divided into five groups (G1–G5) based on the breeding densities of 1.2, 1.5, 1.8, 2.1, and 2.4 inds/m2, respectively. Three parallel ponds of similar area were set for each density group, and the breeding trial period was 169 d.

2.2. Aquaculture Water Quality Measurements

On days 0, 30, 60, 120, and 150 of the breeding experiment, the water quality of the ponds was analyzed. With the water inlet, outlet, and central location of each test pond as fixed monitoring points (sampling points), three samples were taken from each pond, and nine samples were taken from three ponds of each density group for measurement. Water samples were taken directly from the preset position in 250 mL brown glass bottles, sealed, and stored away from light for nitrite nitrogen (NO2-N, mg/L) analysis, 1-L water collectors were used to take the water sample at the preset position, and concentrated sulfuric acid was added at a ratio of 1:500, sealed, and stored away from light for ammonia nitrogen (NH3-N, mg/L) analysis. Water temperature (WT, °C), dissolved oxygen (DO, mg/L), pH, and electrical conductivity (EC, μs/cm) were measured using a YSI portable multifunctional water quality analyzer (Professional Plus, USA). Ammonia nitrogen (NH3-N, mg/L), nitrite nitrogen (NO2-N, mg/L), and other indicators were analyzed and determined using a Hach DR3900 multifunctional water quality analyzer and its supporting kits.

2.3. Growth Performance Measurements

On days 0, 30, 60, 120, and 150 of the breeding experiment, 30 E. sinensis were randomly selected, respectively, from each group to record basic growth data. Body weight (BW) was determined using electronic scales (with an accuracy of 0.01 g), and carapace length (CL) and width (CW) were measured using electronic Vernier calipers (accurate to 0.001 cm). The average value of each index at day 0 and d 150 was used to calculate the weight gain rate (WGR), specific growth values (SGR), carapace length growth rate (GRCL) and width (GRCW), the mean BW and CL at day 150 of each group were used to calculate condition factors (CF), and the average value and standard deviation of each index at five sampling times were used to calculate standard deviation coefficient of variance (CV) as in the following formulas:
WGR (%) = (Wf − Wi) × 100/Wi;
SGR (%/d) = (lnWf − lnWi) × 100/T;
GRCL (%) = (CLf − CLi) × 100/CLi;
GRCW (%) = (CWf − CWi) × 100/CWi;
CF (%) = (BW/CL3) × 100;
CV (%) = (SD/MN) × 100;
where, Wi is the average value of the initial wet weight (g); Wf, the average value of the final wet weight (g); T, the time interval in d; CLi and CLf, the average value of the initial and final carapace length, respectively; and CWi and CWf, the average value of the initial and final carapace width. SD is standard deviation, MN is the mean of BW, CL, and CW of each test pool crab, respectively.

2.4. Nutritional Composition Measurements

At the conclusion of the breeding experiment, 10 E. sinensis’ muscle and hepatopancreatic tissue were randomly collected from each pond to analyze the nutritional composition. Moisture was detected using the 105 °C constant temperature drying weight loss method (GB5 009.3-2016), using an electronic balance with an accuracy of 0.001 g. Crude fat content was evaluated using the Soxhlet extraction method (GB5 009.6-2016), the equipment uses a set of cord extractors. Crude protein content was determined using the Kjeldahl method (GB5 009.5-2016), using a Haineng K1160 fully automated total nitrogen analyzer. The amino acid compositions were analyzed and determined using a Hitachi L8900 automatic amino acid analyzer.

2.5. Measurements of Immune-Related Gene Expression Levels

At the conclusion of the breeding experiment, 3 E. sinensis’ hemolymphs were randomly collected from each pond to analyze the immune-related gene expression. Total RNA was extracted from the hemolymph using TRIzol. cDNA was prepared using a PrimeScript RT reagent Kit with a gDNA Eraser kit (TaKaRa), and cDNA samples were used as a qRT-PCR template. The Bio-Rad CFX Manager 3.1 real-time PCR instrument was used for relative quantification under the following reaction conditions: 95 °C for 10 min, followed by 39 cycles, 95 °C for 30 s, 58–60 °C for 30 s, and 72 °C for 30 s. Melting reaction conditions were 65–95 °C, with plate reading for 30 s to record the amount of fluorescence. The PCR primer sequences of LBGP, Tube, Dorsal, PPAE, SOD, GST, and GPx genes are listed in Table 3. β-actin was used as the internal reference gene. The relative changes in gene expression levels were detected using the 2−ΔΔ-CT method. The experiment performs a triplicate assay on each sample.

2.6. Statistical Analysis

Statistical analyses were carried out using SPSS 26.0 software (IBM Corporation, New Orchard Road, Armonk, NY 10504, USA, 2019). Data are presented as mean ± standard deviation (SD). Percentage data were square-root arcsine transformed to achieve homogeneity of variance and then statistically analyzed. One-way ANOVA and Duncan’s multiple comparisons were used to compare significant differences between groups. The significance level was set at p < 0.05.
The R package “HH” of ANCOVA was utilized to detect if water quality (pH, and NO2-N) is a cofactor for growth and immunity, in which growth index, amino acid composition, and expression of immune related genes are dependent variables, density is an independent variable, and environmental factors are covariates. The significance level was set at p < 0.05, and the extremely significant level was set at p < 0.01.

3. Results

3.1. Aquaculture Water Quality

The average water quality of five sampling points was analyzed, and it was found that the mean values of WT, EC, DO, and NH3-N have no significant difference in the G1–G5 groups, which were within the limits of Class III water quality standards during the experiment. Compared with other density groups, the mean value of pH decreased very significantly (p < 0.01) and the mean value of NO2-N increased significantly (p < 0.05) in the G5 group (Table 4).

3.2. Growth Performance

As shown in Figure 1, BW, CL, and CW of E. sinensis in each group increased with breeding time, and the BW of E. sinensis in the G3 group was higher than that in the G1, G2, G4, and G5 groups after 169 days of breeding. WGR and SGR in the G1 group were both significantly higher than those in the G4 and G5 groups (p < 0.05). GRCL and GRCW in the G1 group were higher than those in the G2–G5 groups (p > 0.05). The CW/CL value in all groups was in the range of 1.07–1.08, and the CF value was significantly higher in the G3 group than in the G2 and G5 groups (p < 0.05) (Table 5). In addition, CVBW in the G4 group was higher than that in G1, G2, G3, and G5 groups (Figure 2A), and CVCL and CVCW in the G5 group were higher than those in the G1–G4 groups (Figure 2B,C). CVCF in the G5 group was significantly higher than that in the G3 group (p < 0.05; Figure 2D), and CVCW/CL in the G1 group was significantly higher than that in the G3 group (p < 0.05; Figure 2E).

3.3. Proximate Composition

In the muscle and hepatopancreas tissues, the moisture content in the G5 group was higher than that in the G1–G4 groups (p > 0.05), crude protein content in the G2 group was higher than that in the G1 and G3–G5 groups (p > 0.05), and crude lipid content in the G3 group was higher than that in the G1, G2, G4, and G5 groups (p > 0.05) (Figure 3; Figure 4).

3.4. Amino Acids

A total 17 amino acids, including isoleucine, leucine, and lysine, were evaluated in both muscle and hepatopancreas tissues (Table 6; Table 7). In muscle tissue, in terms of EAA, the content of EAA, leucine, lysine, phenylalanine, and threonine in G3 significantly increased compared to content in G4 and G5, and valine content in G4 significantly decreased compared to that in the G2 and G3 groups (p < 0.05). Regarding non-essential amino acids, the contents of histidine, glutamic acid, aspartic acid, serine, total amino acids (TAA), and umami amino acids (DAA) in G3 were significantly higher than those in G4 and G5 (p < 0.05), and cysteine content in the G3 group was significantly higher than that in the other groups (p < 0.05). The ratio of EAA/TAA in G2 was significantly higher than that in the G1 and G4 groups (p < 0.05), and the ratio of DAA/TAA in G1 was significantly higher than that in G2 (p < 0.05) (Table 6). Regarding non-essential amino acids in the hepatopancreas, arginine content in the G4 group was significantly higher than that in the G2 group (p < 0.05). The ratios of EAA/TAA in the G2 and G3 groups were significantly higher than that in the G5 group (p < 0.05), whereas DAA/TAA in G1 was significantly higher than that in the G4 group (p < 0.05) (Table 7).

3.5. Immune-Related Gene Expression

The levels of Dorsal, GST, PPAE, and Tube expression in G5 were significantly higher than those in the G1–G4 groups (p < 0.05; Figure 5A,C,E,G). The expression levels of GPx, LBGP, and SOD in G5 were significantly higher than those in the G1, G3, and G4 groups (p < 0.05; Figure 5B,D,F).

3.6. Analysis of Covariance (ANCOVA)

ANCOVA was performed with pH and NO2-N as covariates, density as the independent variable, growth-related index, amino acid components of muscle and hepatopancreas, and immune-related genes as dependent variables. The results showed that pH and density were the cofactors affecting the WGR and expression of Tube while not affecting the content of EAA, TAA, and expression of Dorsal, GPx, GST, LBGP, PPAE and SOD. Otherwise, density was the main factor affecting the SGR (Table 8). While NO2-N and density were the cofactors, only density was a main factor affecting the WGR and SGR (Table 9).

4. Discussion

Stocking density is a crucial factor that affects aquatic animals, and numerous studies have revealed that a high stocking density can negatively impact the growth, nutritional composition, and immune responses of aquatic animals [12,18,19,20]. In the white shrimp Litopenaeus vannamei (Boone), the lower stocking densities had higher final body weights than the higher density groups, while the highest density stocking can cause serious damage to the ability of their immune systems [21]. In Palaemonetes sinensis, the final body weight and weight gain rate showed a tendency to increase and then decrease with increasing stocking density, and the activity of digestion-related enzymes and some non-specific immune indicators decreased significantly with increasing stocking density [22]. In rice and crab coculture systems with different stocking densities, both growth performance and nutrient fractions tend to increase and then decrease with increasing stocking density [23]. In addition, a suitable breeding density is crucial for controlling the quality of aquaculture water [24]. Aquatic organisms need adequate levels of dissolved oxygen to facilitate growth and prevent disease [25]. Studies have reported that intensive crab farming at high density may cause the water quality of lakes to deteriorate [26]. At the same time, farming shrimp and crab at an appropriate density level is not only conducive to improving water quality, but also helps to improve the growth, nutrition, and immune response of shrimps and crabs [27]. To date, few studies have analyzed the growth performance, nutritional quality, and immune-related gene expression of E. sinensis in pond ecosystems under the influence of stocking density. Therefore, it is of urgency to explore the appropriate stocking density of aquatic animals. In this study, the water quality of all experimental ponds conformed to the Class III fishery and surface water quality standards, and the results illustrate that stocking density had a certain impact on the growth, nutrient composition, and expression of immune-related genes in 
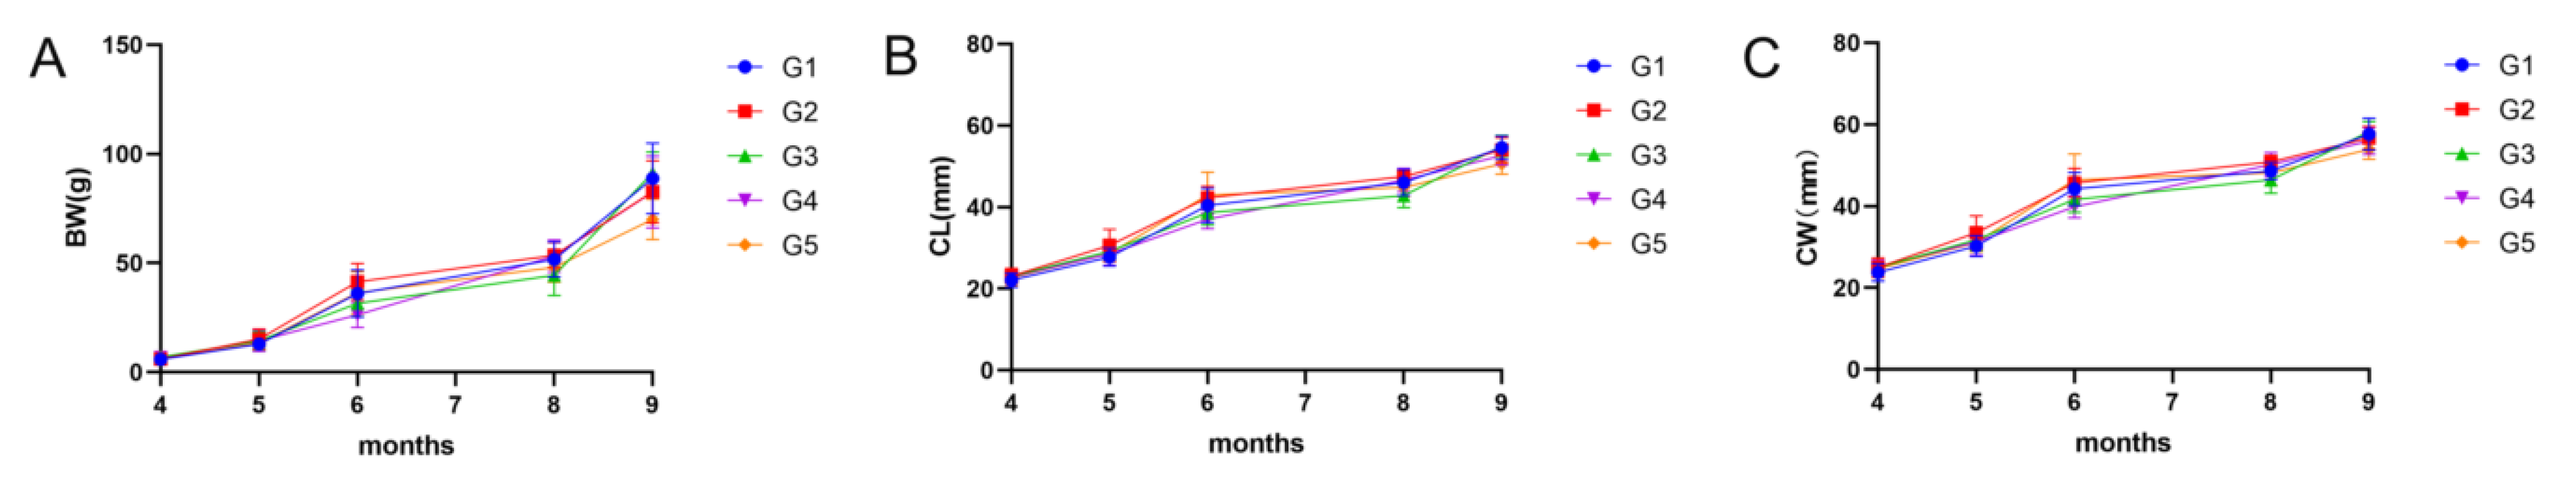
E. sinensis. Crustaceans grow by molting, and E. sinensis go through 18–21 molts over their lifespan [28]. In this study, four molting processes were observed. Research on the growth performance of E. sinensis is mainly reflected in aspects of BW, SGR, CL, CW, and CF [29]. In this study, final BW, WGR, SGR, GRCL, and GRCW are higher in the lower density group than in the higher density group, indicating that controlling the stocking density within a certain range can effectively enhance the growth performance of Chinese mitten crabs. Liu et al. found that the final BW, WGR, and SGR of rice crabs decreased with increasing stocking density [30], which is in accordance with the results of this study. Peters et al. reported that the CW/CL of E. sinensis is a constant value of approximately 1.13, which can be used as an evaluation indicator for germplasm identification [31]. However, the mean value of CW/CL of 
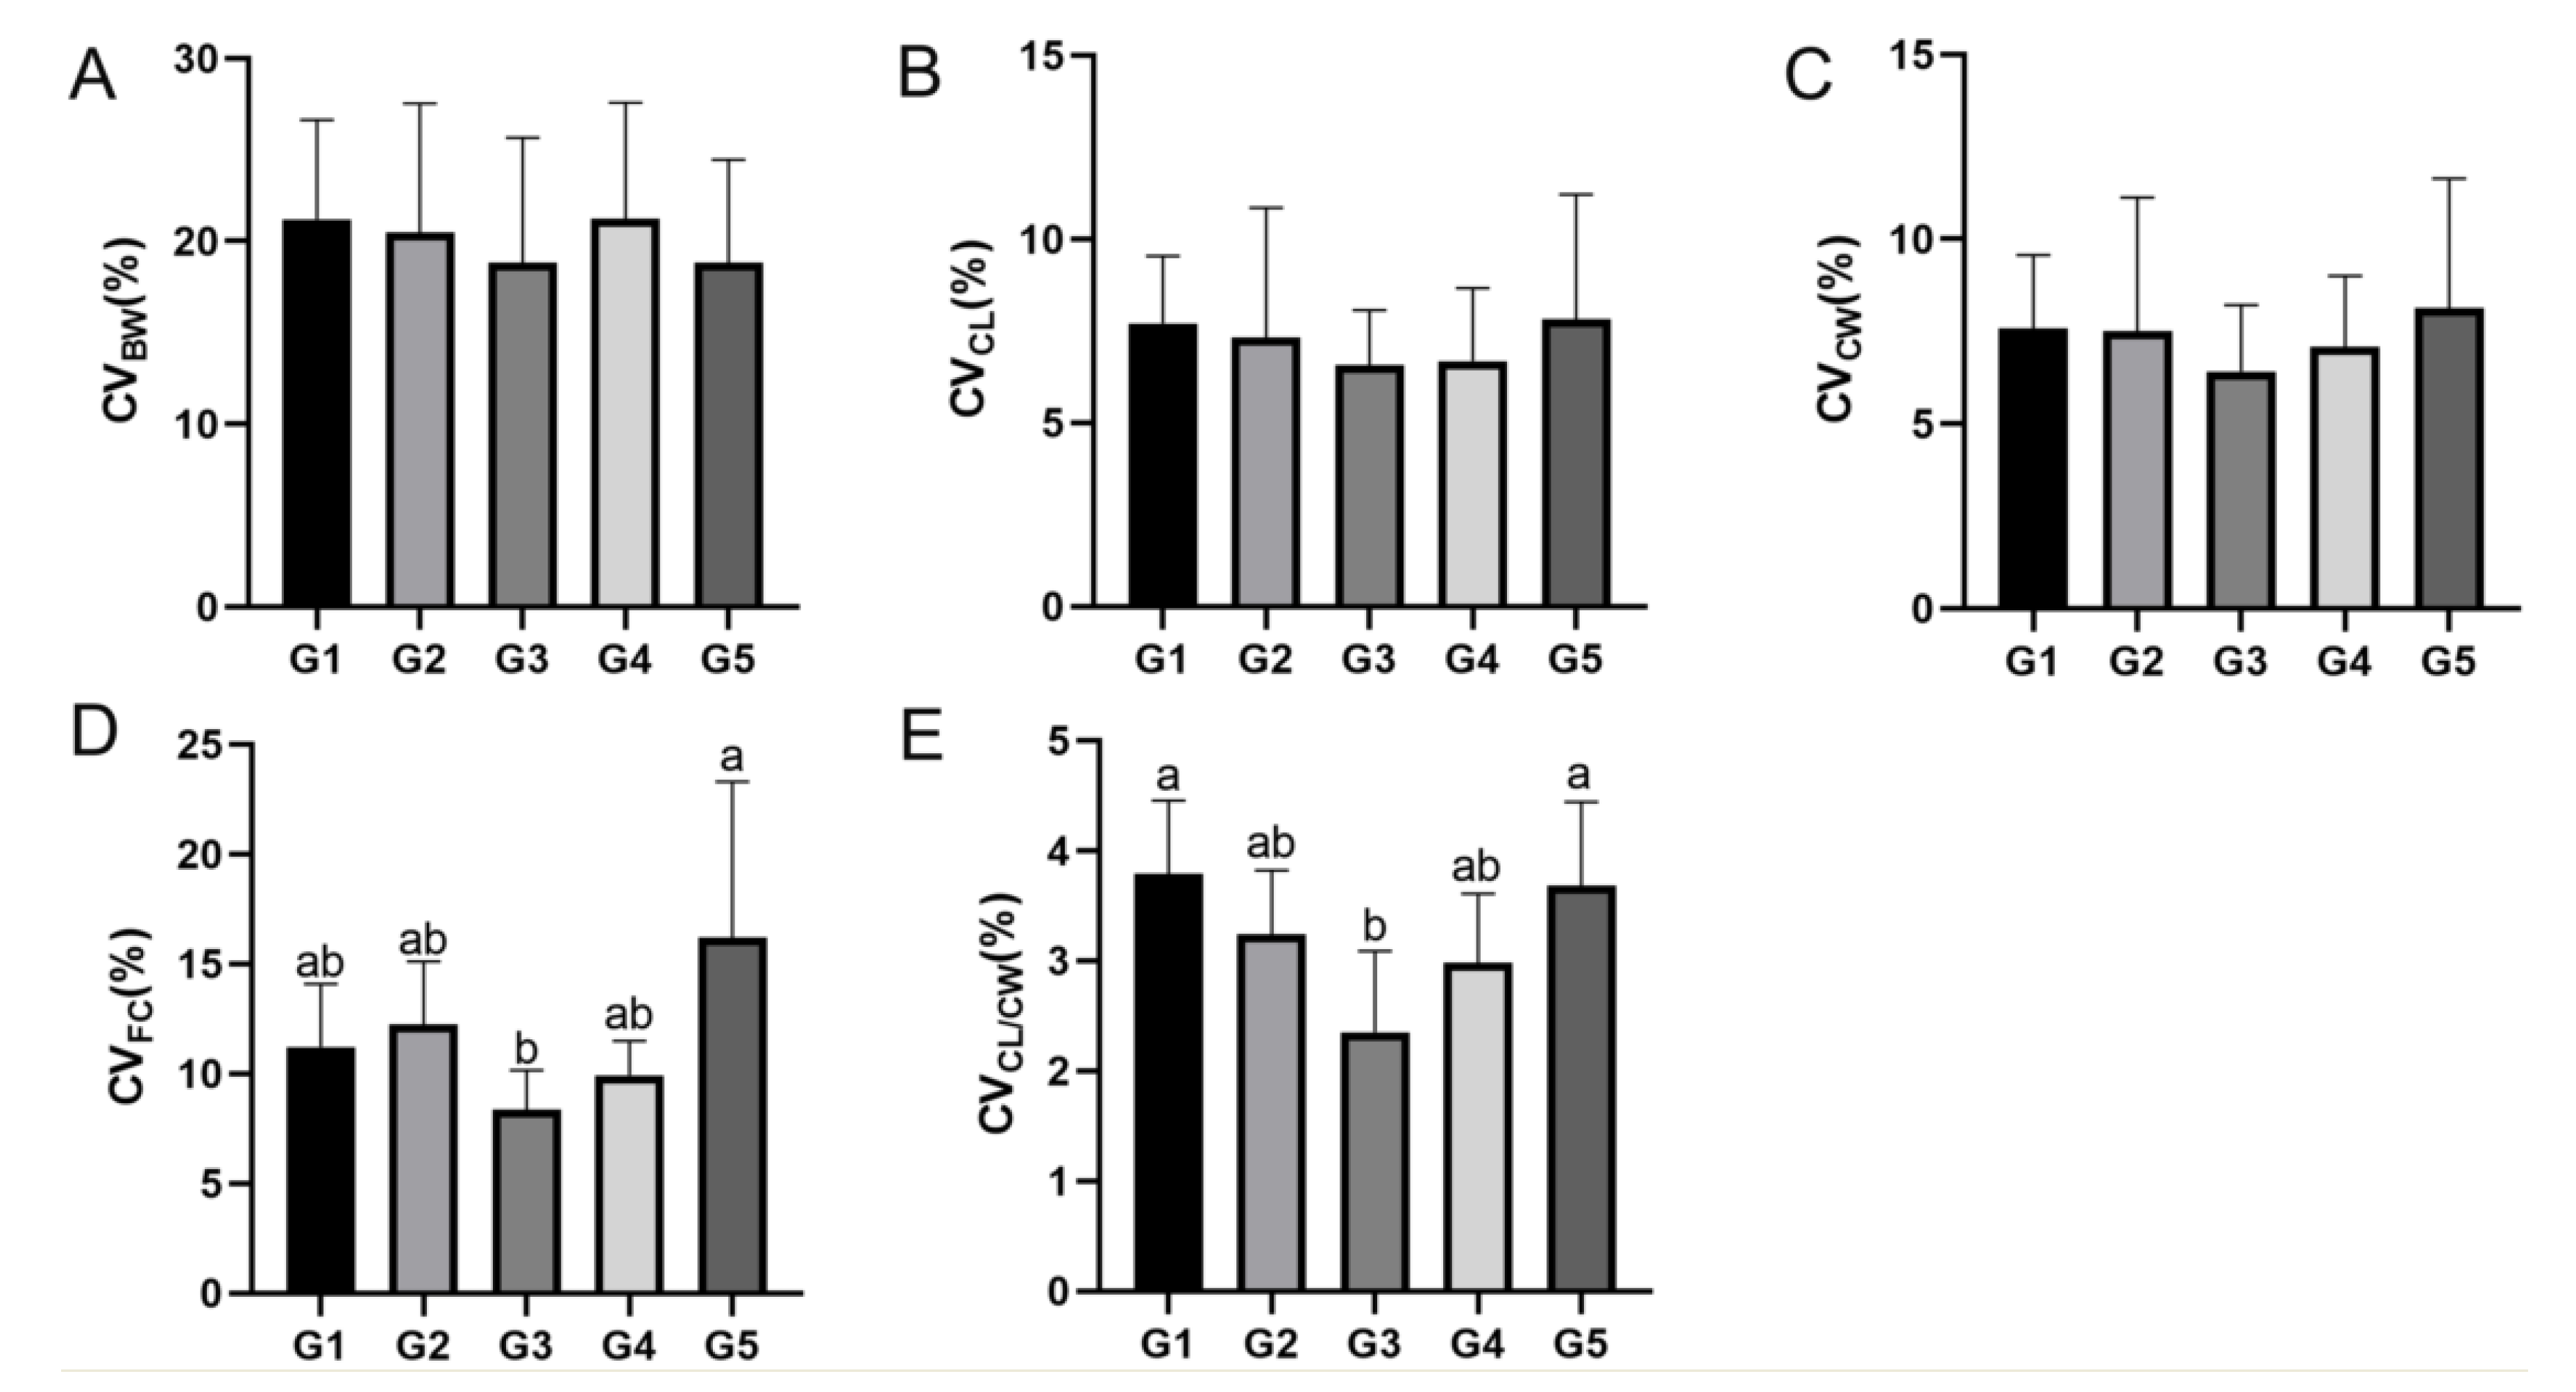
E. sinensis measured in this study was 1.07–1.08, less than 1.13, and the mean value of CW/CL increased with an increase in stocking density, but there was no significant difference. The reasons for this result may be related to the novel variety “Changjiang No. 2” used in this study. Compared with the wild variety, “Changjiang No. 2” was obtained through five generations of group breeding, and has the characteristics of fast growth, large individuals, and excellent quality. In addition, the values of CVBW, CVCL, CVCW, CVCF, and CVCW/CL in the G3 group were lower than those in the other groups, suggesting that the size and nutrient accumulation of E. sinensis in G3 were largely uniform during the breeding process, and the stocking density had a certain influence on the growth and nutrient accumulation of E. sinensis. In fish, size differences are eventually magnified as the fish grow [32], while no significant effect of initial size on the growth of juvenile Pacific abalone was observed [33]. In this study, the G3 group had a higher starting body weight than the other groups, but no significant difference in final body weight. These results indicate that initial size and weight may have no significant effect on the growth in invertebrates.
Salas-Leiton et al. have shown that high stocking density may also lead to intensified intraspecific struggles of Senegalese sole (Solea senegalensis), such as intensifying competition for space and food, which may further affect feeding growth, behavior, energy metabolism, and final nutrient accumulation in the body [
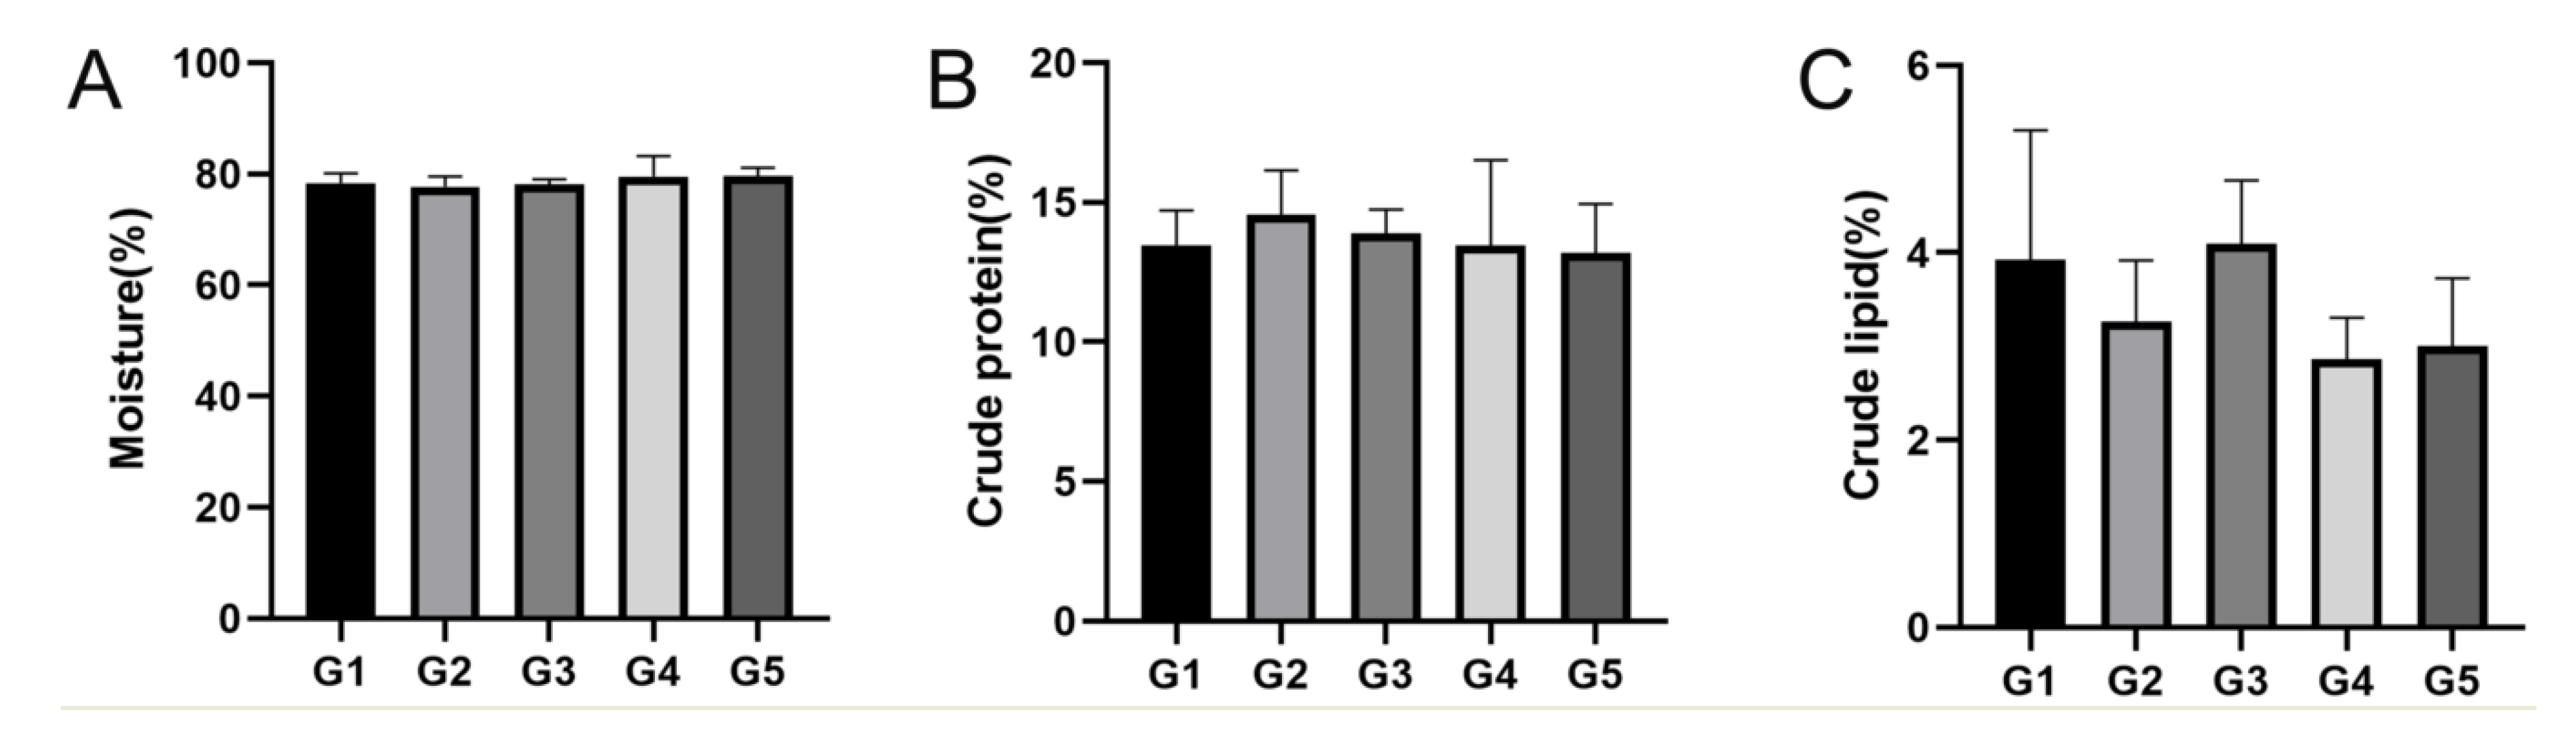
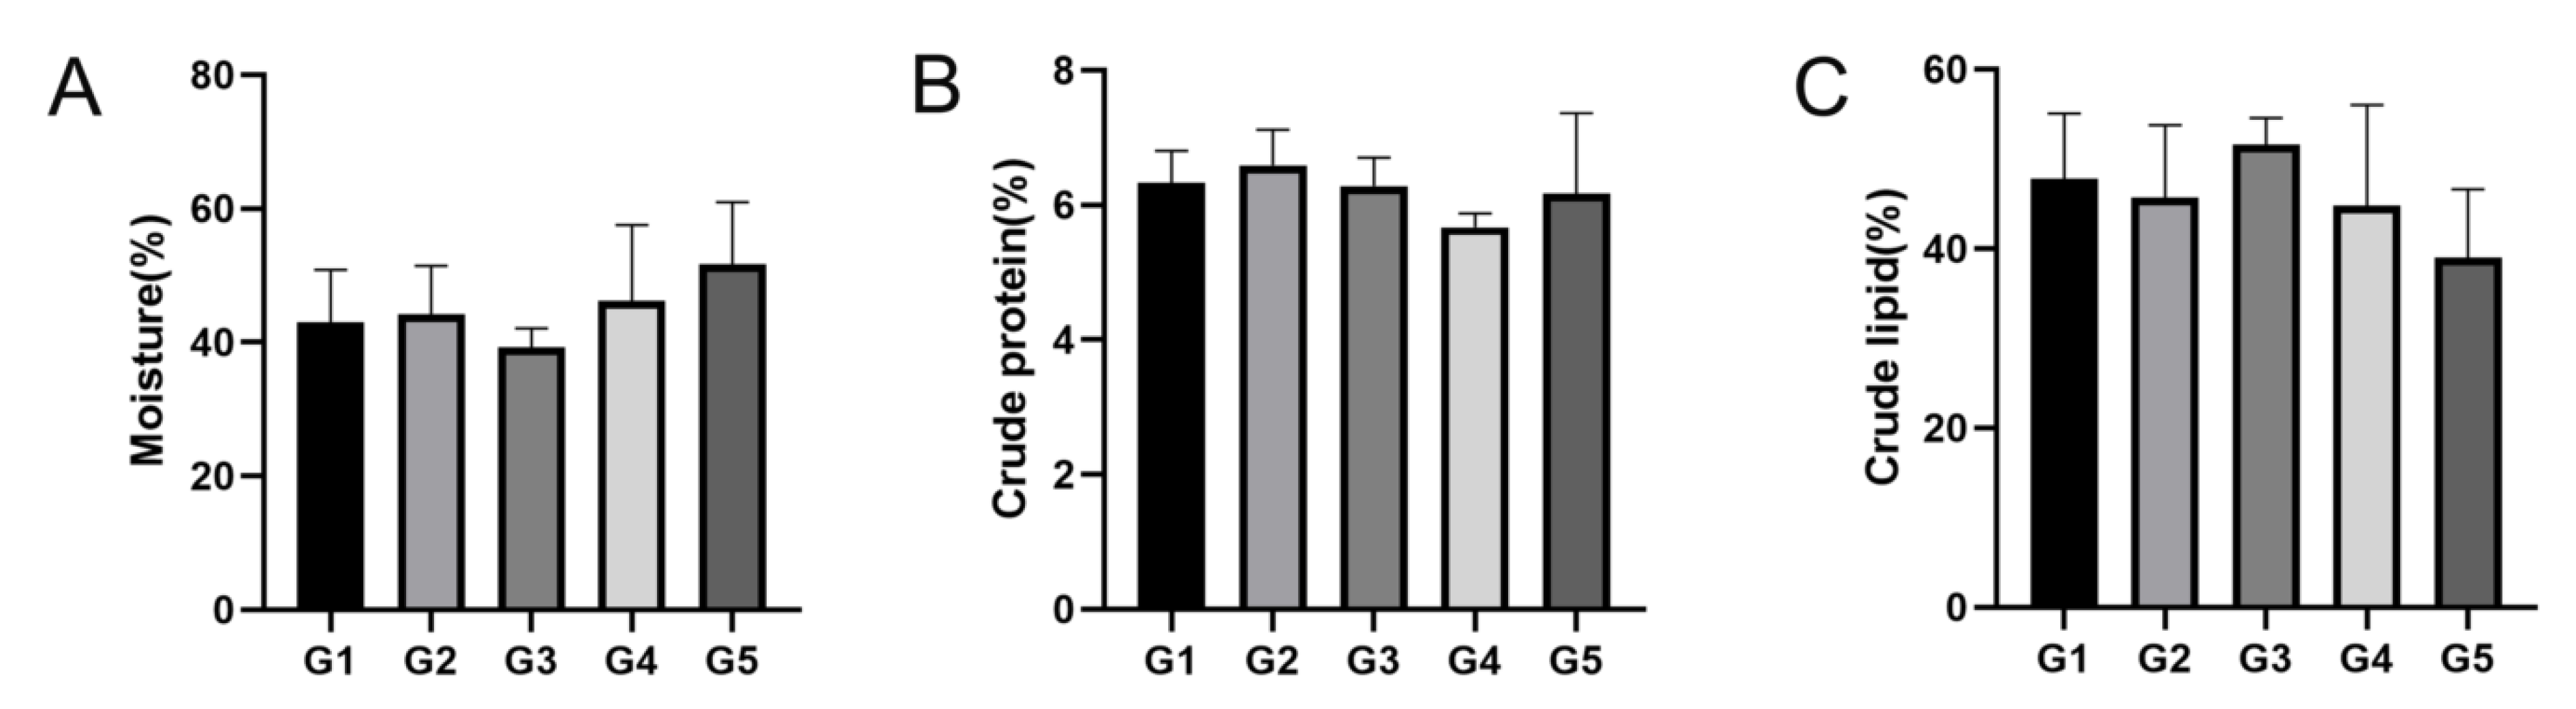
34]. In the current study, the nutritional composition of E. sinensis, including proximate and amino acid composition, influenced by stocking density in the pond ecosystem was also analyzed. The crude protein and lipid contents decreased as stocking density increased, and, in the muscle and hepatopancreas tissues, the crude lipid content in G3 was higher than that in the G1, G2, G4, and G5 groups (p > 0.05). In the muscle tissue, the content of numerous amino acids, including leucine, lysine, EAA, TAA, and DAA in G3 were higher than those in the other groups, which is in line with the results of Wang et al. who studied the nutritional components of rice crab culture at different stocking densities, and showed that the crude protein content and EAA levels of E. sinensis cultured at a density of 0.4 inds/m2 were higher than those in other stocking densities [35]. These results suggest that high stocking density negatively affects the nutritional composition of E. sinensis.
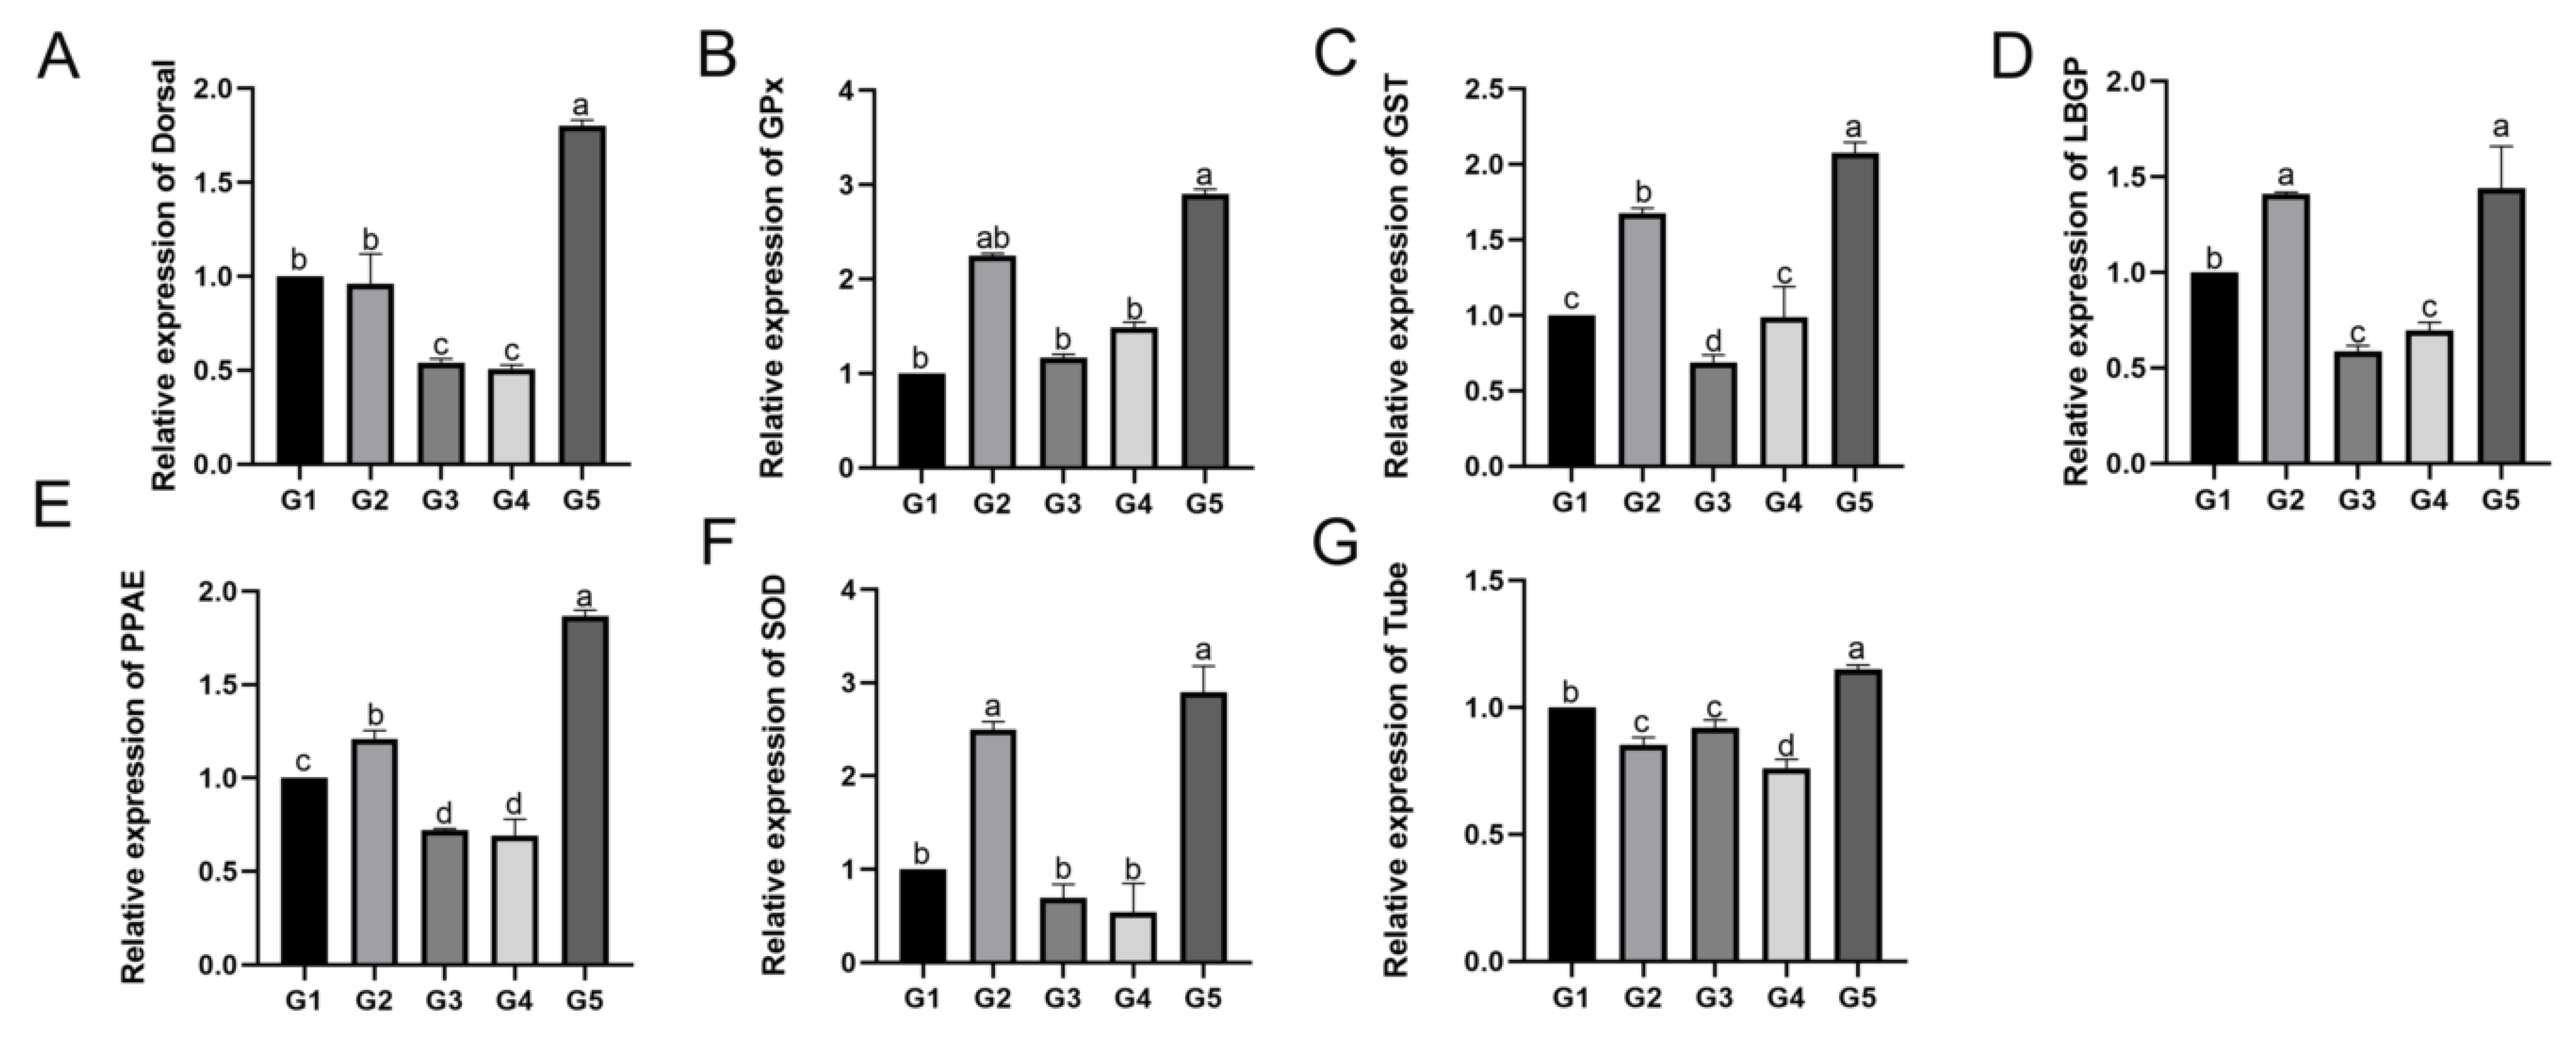
The hemolymph is an important immune organ of shrimps and crabs; thus, immune-related gene expression was evaluated in the hemolymph, including LBGP, Tube, Dorsal, PPAE, SOD, GST, and GPx. LGBP is a classic pattern recognition protein in crustaceans that can activate the prophenoloxidase system and is immune-specific to Gram-negative bacteria and fungi [36]. Dorsal and Tube are important mediator genes and core components in the Toll signaling pathway and play significant roles in immune signaling [37,38]. PPAE is a key component of the prophenoloxidase activation system; serine protease homologous (SPH) is a vital cofactor of PPAE, and a previous study has revealed that SPH plays a significant role in the innate immune response [39]. SOD, GPx, and GST are important antioxidant enzymes in crustaceans, among which, GPx is an important reactive oxygen radical scavenger in the body [40], and forms an antioxidant defense system together with SOD [41] and catalase. GST is widely present in various organisms, and is a multifunctional antioxidant enzyme that participates in the metabolism of a variety of endogenous or exogenous toxic substances [42]. In this study, from the point of view of molecular level, it is shown that the culture density has some effect on the immune system of E. sinensis. Both too low or too high density farming had some stressful effects on E. sinensis, while the expression of immune genes had lower levels in the G3 and G4 density groups, which showed that the stress of these two culture density groups was less than other groups.
The results of this study show that the stocking density not only affected the growth performance of E. sinensis, but also affected the water quality of the aquaculture pond. With the increase in density, pH decreased and NO2-N increased significantly in the G5 group. Some studies reported the effects of pH and NO2-N on the growth, nutrition, and immunity of aquatic animals. Long WC et al. found that too low a pH negatively affected the growth of Lithodes aequispinus [43]; pH (pH 6 and 8.5) stress significantly altered the expression of EsCaM mRNA in E. sinensis gills, hepatopancreas, blood cells, intestine, and muscle [44]; excessive levels of NO2-N can negatively affect the growth of aquatic animals, for example, Macrobrachium rosenbergii [45], Litopenaeus schmitti [46] and Lateolabrax Japonicus [47]. In order to better clarify whether the changes in the growth indicators of E. sinensis were only affected by the stocking density factor or were affected by the combination of the cultivation density and water environment factors in this study, ANCOVA was performed with pH and NO2-N as covariates, density as the independent variable, and growth performance-related indexes as dependent variables. The results showed that, as a synergetic factor of culture density, the pH value of the culture pond affected the growth performance of Chinese mitten-handed crab, while NO2-N had no significant effect on the growth performance-related index of E. sinensis.
This study has some limitations. First, we did not conduct a comprehensive analysis and evaluation of the health and growth benefits of E. sinensis under different stocking densities in this region. Thus, other key influencing factors in the pond culture of E. sinensis, such as research on crab specifications, water quality, and bait, should be further supplemented to improve relevant data. In addition, in-depth research into the molecular mechanisms that influence stocking density of the E. sinensis is required.

5. Conclusions

Stocking density has a certain impact on the growth performance, nutrition quality, immunity of E. sinensis, and water quality parameters in pond ecosystems. The G1 group had the largest growth rate, but the G3 group had the largest average growing size and the largest fattening coefficient, and the G3 group also had better levels of crude nutrition, amino acid composition, the smallest coefficient of variation of growth and nutrition-related indexes, and lower relative expression levels of immune-related genes. Meanwhile, the water quality of the G3 group met the Class III water quality standards during the experiment. Therefore, it is recommended to breed E. sinensis at the G3 group density (1.8 inds/m2) in the Poyang Lake region.

Author Contributions

Formal analysis, Z.W.; data collection, Z.M., M.Z. and L.L.; experimental discussion, F.M. and P.H.; validation, J.H.; resources, S.J.; writing—original draft preparation, Z.W.; writing—review and editing, S.J. and D.Z.; ideas, D.Z.; supervision, D.Z.; funding acquisition, D.Z. and X.L. All authors have read and agreed to the published version of the manuscript.

Funding

This work was supported by the National Natural Science Foundation of China (grant number 32160870), Jiangxi Agriculture Research System (JXARS-03, JXARS-10), Chongqing Natural Science Foundation project (CSTB2022NSCQ-MSX1407).

Institutional Review Board Statement

The animal study protocol was approved by the Animal Care and Use Committee of Nanchang University (identification code: NCUACC-2020-563; date of approval: 26 May 2020).

Data Availability Statement

Data are not shared.

Conflicts of Interest

The authors declare that they have no known competing financial interest or personal relationships that could have appeared to influence the work reported in this paper.

References

  1. Wang, Y.; Zhu, Y.; Shi, W.; Wang, X. Quality evaluation of living and postmortem Chinese mitten crabs (Eriocheir sinensis). Food Sci. Nutr. 2020, 8, 2327–2340. [Google Scholar] [CrossRef] [PubMed] [Green Version]
  2. Wang, Q.J.; Zhang, B.Y.; Jiang, X.D.; Long, X.W.; Zhu, W.L.; Xu, Y.P.; Wu, M.; Zhang, D.M. Comparison on nutritional quality of adult female Chinese mitten crab (Eriocheir sinensis) with different colored hepatopancreases. J. Food Sci. 2021, 86, 2075–2090. [Google Scholar] [CrossRef] [PubMed]
  3. Wang, Q.; Wu, X.; Long, X.; Zhu, W.; Ma, T.; Cheng, Y. Nutritional quality of different grades of adult male chinese mitten crab, Eriocheir sinensis. J. Food Sci. Technol. 2018, 55, 944–955. [Google Scholar] [CrossRef] [PubMed]
  4. Luo, B.Y.; Qian, H.L.; Jiang, H.C.; Xiong, X.Y.; Ye, B.Q.; Liu, X.; Guo, Z.Q.; Ma, K.Y. Transcriptional changes revealed water acidification leads to the immune response and ovary maturation delay in the Chinese mitten crab Eriocheir sinensis. Comp. Biochem. Physiol. Part D Genom. Proteom. 2021, 39, 100868. [Google Scholar] [CrossRef]
  5. Fang, L.; Huang, Z.; Fan, L.; Hu, G.; Qiu, L.; Song, C.; Chen, J. Health risks associated with sulfonamide and quinolone residues in cultured Chinese mitten crab (Eriocheir sinensis) in China. Mar. Pollut. Bull. 2021, 165, 112184. [Google Scholar] [CrossRef] [PubMed]
  6. Fan, Z.; Zou, J.; Wang, Q.; Qiu, L.; Hu, G.; Song, C.; Chen, J. Quantitative benefit and risk assessment of cadmium and nutrient levels in Chinese mitten crab (Eriocheir sinensis). Environ. Sci. Pollut. Res. Int. 2021, 28, 7322–7331. [Google Scholar] [CrossRef]
  7. Onxayvieng, K.; Piria, M.; Fuka, M.M.; Gavrilović, A.; Liang, X.; Liu, L.; Tang, R.; Li, L.; Li, D. High stocking density alters growth performance, blood biochemical profiles, and hepatic antioxidative capacity in gibel carp (Carassius gibelio). Fish Physiol. Biochem. 2021, 47, 203–212. [Google Scholar] [CrossRef]
  8. Klug, J.J.; Treuting, P.M.; Sanders, G.E.; Winton, J.R.; Kurath, G. Effects of stocking density on stress response and susceptibility to infectious Hematopoietic Necrosis virus in rainbow trout. J. Am. Assoc. Lab. Anim. Sci. JAALAS 2021, 60, 637–645. [Google Scholar] [CrossRef]
  9. Karnatak, G.; Das, B.K.; Puthiyottil, M.; Tayung, T.; Kumari, S.; Lianthuamluaia, L.; Sarkar, U.K.; Behera, B.K.; Tiwari, V.K.; Chadha, N.K.; et al. Environmental parameters and stocking density influence growth, feed utilization and economics of butter catfish, Ompok bimaculatus (Bloch, 1794) production in floating net cages in a large tropical reservoir, India. Environ. Sci. Pollut. Res. Int. 2021, 28, 59720–59730. [Google Scholar] [CrossRef]
  10. Ribeiro, P.D.; Daleo, P.; Iribarne, O.O. Density affects mating mode and large male mating advantage in a fiddler crab. Oecologia 2010, 164, 931–941. [Google Scholar] [CrossRef]
  11. Hethke, M.; Weeks, S.C. Population Density Effects on Carapace Growth in Clam Shrimp: Implications for Palaeontological Studies. Zool. Stud. 2020, 59, 33. [Google Scholar]
  12. Araneda, M.; Gasca-Leyva, E.; Vela, M.A.; Domínguez-May, R. Effects of temperature and stocking density on intensive culture of Pacific white shrimp in freshwater. J. Therm. Biol. 2020, 94, 102756. [Google Scholar] [CrossRef] [PubMed]
  13. Deng, Y.; Xu, X.; Yin, X.; Lu, H.; Chen, G.; Yu, J.; Ruan, Y. Effect of stock density on the microbial community in biofloc water and Pacific white shrimp (Litopenaeus vannamei) gut microbiota. Appl. Microbiol. Biotechnol. 2019, 103, 4241–4252. [Google Scholar] [CrossRef]
  14. Penha-Lopes, G.; Rhyne, A.L.; Lin, J.D.; Narciso, L. Effects of temperature, stocking density and diet on the growth and survival of juvenile Mithraculus forceps (A.Milne Edwards, 1875) (Decapoda: Brachyura: Majidae). Aquac. Res. 2006, 37, 398–408. [Google Scholar] [CrossRef]
  15. Dong, J.; Zhao, Y.Y.; Yu, Y.H.; Sun, N.; Li, Y.D.; Wei, H.; Yang, Z.Q.; Li, X.D.; Li, L. Effect of stocking density on growth performance, digestive enzyme activities, and nonspecific immune parameters of Palaemonetes sinensis. Fish Shellfish Immunol. 2018, 73, 37–41. [Google Scholar] [CrossRef]
  16. Peterson, J.J.; Griffith, D.R.W. Intensive nursery systems. Glob. Aquacul.Advocate 1999, 2, 60–61. [Google Scholar]
  17. Abdussamad, E.M.; Thampy, D.M. Cannibalism in the tiger shrimp Penaeus monodon Fabricus in nursery rearing phase. Aquacul 1994, 9, 67–75. [Google Scholar]
  18. Shourbela, R.M.; Khatab, S.A.; Hassan, M.M.; Van Doan, H.; Dawood, M.A.O. The Effect of Stocking Density and Carbon Sources on the Oxidative Status, and Nonspecific Immunity of Nile tilapia (Oreochromis niloticus) Reared under Biofloc Conditions. Animals 2021, 11, 184. [Google Scholar] [CrossRef] [PubMed]
  19. Li, L.; Tan, K.; Zhang, H.; Li, S.; Ma, H.; Zheng, H. Effects of high stocking density on the galectin gene expression in noble scallop Chalmys nobilis under bacterial infection. Fish Shellfish. Immunol. 2020, 105, 263–272. [Google Scholar] [CrossRef]
  20. Dediu, L.; Docan, A.; Crețu, M.; Grecu, I.; Mogodan, A.; Maereanu, M.; Oprea, L. Effects of Stocking Density on Growth Performance and Stress Responses of Bester and Bester ♀ × Beluga ♂ Juveniles in Recirculating Aquaculture Systems. Animals 2021, 11, 2292–2308. [Google Scholar] [CrossRef] [PubMed]
  21. Liu, G.; Zhu, S.; Liu, D.; Guo, X.; Ye, Z. Effects of stocking density of the white shrimp Litopenaeus vannamei (Boone) on immunities, antioxidant status, and resistance against Vibrio harveyi in a biofloc system. Fish Shellfish Immunol. 2017, 67, 19–26. [Google Scholar] [CrossRef]
  22. Bao, J.; Li, X.D.; Yu, H.; Jiang, H.B. Respiratory metabolism responses of Chinese mitten crab, Eriocheir sinensis and Chinese grass shrimp, Palaemonetes sinensis, subjected to environmental hypoxia stress. Front. Physiol. 2018, 9, 01559. [Google Scholar] [CrossRef]
  23. Wang, X.; Zheng, R.X.; Zhang, D.M.; Lei, X.Y.; Wang, S.; Wan, J.W.; Liu, H.J.; Chen, Y.K.; Zhao, Y.L.; Wang, G.Q.; et al. Effects of different stocking densities on growth performance, nutritional quality and economic benefit of juvenile female Chinese mitten crab (Eriocheir sinensis) in rice-crab culture systems. Aquaculture 2022, 553, 738111. [Google Scholar] [CrossRef]
  24. Maucieri, C.; Nicoletto, C.; Zanin, G.; Birolo, M.; Trocino, A.; Sambo, P.; Borin, M.; Xiccato, G. Effect of stocking density of fish on water quality and growth performance of European Carp and leafy vegetables in a low-tech aquaponic system. PLoS ONE 2019, 14, e0217561. [Google Scholar] [CrossRef] [PubMed] [Green Version]
  25. Allan, G.L.; Maguire, G.B. Lethal levels of low dissolved oxygen and effects of short-term oxygen stress on subsequent growth of juvenile Penaeus monodon. Aquaculture 1991, 94, 27–37. [Google Scholar] [CrossRef]
  26. Wang, H.Z.; Wang, H.J.; Liang, X.M.; Cui, Y.D. Stocking models of Chinese mitten crab (Eriocheir japonica sinensis) in Yangtze lakes. Aquaculture 2006, 255, 456–465. [Google Scholar] [CrossRef]
  27. Kumar, S.; Anand, P.S.S.; De, D.; Deo, A.D.; Ghoshal, T.K.; Sundaray, J.K.; Ponniah, A.G.; Jithendran, K.P.; Raja, R.A.; Biswas, G.; et al. Effects of biofloc under different carbon sources and protein levels on water quality, growth performance and immune responses in black tiger shrimp Penaeus monodon (Fabricius, 1978). Aquac. Res. 2017, 48, 1168–1182. [Google Scholar] [CrossRef]
  28. Zhang, C.; Song, X.Z.; Zhang, Q.; Pang, Y.Y.; Lv, J.H.; Tang, B.P.; Cheng, Y.X.; Yang, X.Z. Changes in bud morphology, growth-related genes and nutritional status during cheliped regeneration in the Chinese mitten crab, Eriocheir sinensis. PLoS ONE 2018, 13, e0209617. [Google Scholar] [CrossRef] [Green Version]
  29. Zheng, X.; Chi, C.; Xu, C.; Liu, J.; Zhang, C.; Zhang, L.; Huang, Y.; He, C.; He, C.; Jia, X.; et al. Effects of dietary supplementation with icariin on growth performance, antioxidant capacity and non-specific immunity of Chinese mitten crab (Eriocheir sinensis). Fish Shellfish. Immunol. 2019, 90, 264–273. [Google Scholar] [CrossRef]
  30. Liu, J.; Zhao, Z.; Luo, L.; Wang, S.; Zhang, R.; Guo, K.; Bai, Q.; Li, H.; Li, M. Effects of different crab stocking density on production performance and environmental factors under integrated cultivation of rice crab in the cold areas. Freshw. Fish. 2022, 52, 89–97. (In Chinese) [Google Scholar]
  31. Peters, N.; Panning, A. The Chinese Mitten Crab (Eriocheir sinensis H.Milne-Edwards) in Germany. Zool. Anz. 1933, 88782306. [Google Scholar]
  32. Brian, B.F.; Kraus, M.G. Interactive effects of initial size, stocking density, and type of predator deterrent netting on survival and growth of cultured juveniles of the soft-shell clam, Mya arenaria L., in eastern Maine. Aquaculture 2002, 208, 81–111. [Google Scholar]
  33. Wu, F.; Liu, X.; Zhang, G.; Wang, C. Effects of the initial size, stocking density and sorting on the growth of juvenile Pacific abalone, Haliotis discus hannai Ino. Aquac. Res. 2009, 40, 1103–1110. [Google Scholar] [CrossRef]
  34. Salas-Leiton, E.; Anguis, V.; Martín-Antonio, B.; Crespo, D.; Planas, J.V.; Infante, C.; Cañavate, J.P.; Manchado, M. Effects of stocking density and feed ration on growth and gene expression in the Senegalese sole (Solea senegalensis): Potential effects on the immune response. Fish Shellfish. Immunol. 2010, 28, 296–302. [Google Scholar] [CrossRef] [PubMed]
  35. Wang, X.; Tjale, P.M.; Yao, Q.; Zhang, D.M.; Guo, Z.X. Comparison of the growth performance and nutritional qualities of Chinese mitten crab (Eriocheir sinensis) with different stocking densities in rice-crab culture systems. Aquac. Rep. 2021, 20, 100761. [Google Scholar] [CrossRef]
  36. Zhao, D.; Chen, L.; Qin, C.; Zhang, H.; Wu, P.; Li, E.; Chen, L.; Qin, J. Molecular cloning and characterization of the lipopolysaccharide and β-1, 3-glucan binding protein in Chinese mitten crab (Eriocheir sinensis). Comp. Biochem. Physiol. Part B Biochem. Mol. Biol. 2009, 154, 17–24. [Google Scholar] [CrossRef]
  37. Belvin, M.P.; Anderson, K.V. A conserved signaling pathway: The Drosophila toll-dorsal pathway. Annu. Rev. Cell Dev. Biol. 1996, 12, 393–416. [Google Scholar] [CrossRef] [PubMed]
  38. Encinas-García, T.; Mendoza-Cano, F.; Porchas-Cornejo, M.; Peña-Rodríguez, A.; Enríquez-Espinoza, T.; Sánchez-Paz, A. The white spot syndrome virus hijacks the expression of the Penaeus vannamei Toll signaling pathway to evade host immunity and facilitate its replication. Fish Shellfish. Immunol. 2019, 92, 905–912. [Google Scholar] [CrossRef] [PubMed]
  39. Qin, C.; Chen, L.; Qin, J.G.; Zhao, D.; Zhang, H.; Wu, P.; Li, E. Characterization of a serine proteinase homologous (SPH) in Chinese mitten crab Eriocheir sinensis. Dev. Comp. Immunol. 2010, 34, 14–22. [Google Scholar] [CrossRef]
  40. Cheng, C.H.; Ma, H.L.; Deng, Y.Q.; Feng, J.; Chen, X.L.; Guo, Z.X. Glutathione peroxidase 3 in the mud crab Scylla paramamosain: Characterization and regulation under nitrite stress. Comp. Biochem. Physiol. Toxicol. Pharmacol. CBP 2020, 229, 108673. [Google Scholar] [CrossRef] [PubMed]
  41. Ruan, Z.; Liu, Y.; Chang, G.; Lin, Z.; Xue, Q. Molecular characterization of two CuZn-SOD family proteins in the Pacific oyster Crassostrea gigas. Comp. Biochem. Physiol. Part B Biochem. Mol. Biol. 2022, 260, 110736. [Google Scholar] [CrossRef] [PubMed]
  42. Sun, J.; Qiu, C.; Ding, Y.; Wang, Y.; Sun, L.; Fan, K.; Gai, Z.; Dong, G.; Wang, J.; Li, X.; et al. Fulvic acid ameliorates drought stress-induced damage in tea plants by regulating the ascorbate metabolism and flavonoids biosynthesis. BMC Genom. 2020, 21, 411–424. [Google Scholar] [CrossRef] [PubMed]
  43. Long, W.C.; Swiney, K.M.; Foy, R.J. Effects of ocean acidification on young-of-the-year golden king crab (Lithodes aequispinus) survival and growth. Mar. Biol. 2021, 168, 126–137. [Google Scholar] [CrossRef]
  44. Li, S.; Jia, Z.; Li, X.; Geng, X.; Sun, J. Calmodulin is a stress and immune response gene in Chinese mitten crab Eriocheir sinensis. Fish Shellfish Immunol. 2014, 40, 120–128. [Google Scholar] [CrossRef]
  45. Armstrong, D.A.; Stephenson, M.J.; Knight, A.W. Acute toxicity of nitrite to larvae of giant Malasyan prawn, Macrobrachium rosenbergii. Aquaculture 1976, 9, 39–46. [Google Scholar] [CrossRef]
  46. Barbieri, E. Acute toxicity of ammonia in white shrimp (Litopenaeus schmitti) (Burkenroad, 1936, Crustacea) at different salinity levels. Aquaculture 2010, 306, 329–333. [Google Scholar] [CrossRef]
  47. Wu, J.X.; Wen, G.L.; Xu, Y.; Hu, X.J.; Li, Z.J.; Cao, Y.C.; Yu, W.; Chen, G. Effects of Ammonia and nitrite stress on immune and metabolic responses of Japanese sea bass, Lateolabrax Japonicus. Isr. J. Aquac. 2020, 72, 1100047. [Google Scholar] [CrossRef]
Figure 1. Growth performance of Eriocheir sinensis with different stocking densities. (A) Body weight (BW); (B) carapace length (CL); (C) carapace width (CW). G1: 1.2 inds/m2; G2: 1.5 inds/m2; G3: 1.8 inds/m2; G4: 2.1 inds/m2; G5: 2.4 inds/m2. Data are presented as mean ± standard deviation (SD) (n = 30).
Fishes 07 00362 g001
Figure 2. Average coefficient of variation of growth indicators of E. sinensis at different stocking densities. (A) CVBW; (B) CVCL; (C) CVCW; (D) CVCF; (E) CVCW/CL. Data are presented as means ± SD (n = 5). Different letters indicate significant differences among groups (p < 0.05).
Fishes 07 00362 g002
Figure 3. Proximate composition in the muscle of E. sinensis at different stocking densities. (A) Moisture content; (B) crude protein content; (C) crude lipid content. Data are presented as means ± SD (n = 30).
Fishes 07 00362 g003
Figure 4. Proximate composition in hepatopancreas of E. sinensis at different stocking densities. (A) Moisture content; (B) crude protein content; (C) crude lipid content. Data are presented as means ± SD (n = 30).
Fishes 07 00362 g004
Figure 5. The relative expression levels of immune-related genes in hemocytes of E. sinensis at different stocking densities. (A) Dorsal; (B) GPx; (C) GST; (D) LBGP; (E) PPAE; (F) SOD; (G) Tube. Values are means ± SD (n = 9) of three replications. Different letters indicate significant differences among groups (p < 0.05).
Fishes 07 00362 g005
Table 1. Standard limit range of water quality indicators (III).
TW (℃)DO (mg/L)pHEC (μs/cm)NH3-N (mg/L)NO2-N (mg/L)
Standard LimitWeekly difference 1–2≥56–9≤2000≤1.0≤0.10
Note: The standard limit of electrical conductivity (EC) is the conversion value of the TDS limit (not more than 1000 ppm) in the “Sanitation Standard for Drinking Water GB579-2006”, “GB11607-89”and“National Surface Water Environmental Quality Standard GB-3838-2002”Class III water quality standard value.
Table 2. Culture density of Eriocheir sinensis and conditions of the test ponds.
GroupsCrab Specifications (g)Stocking Density (inds./m2)Types of Aquatic PlantsCrab Species
G15.95 ± 1.271.2Elodea, Black algaeYangtze River 2
G26.09 ± 1.431.5Elodea, Black algaeYangtze River 2
G36.88 ± 1.001.8Elodea, Black algaeYangtze River 2
G46.70 ± 1.212.1Elodea, Black algaeYangtze River 2
G55.99 ± 1.012.4Elodea, Black algaeYangtze River 2
Note: G1: 1.2 inds/m2; G2: 1.5 inds/m2; G3: 1.8 inds/m2; G4: 2.1 inds/m2; G5: 2.4 inds/m2.
Table 3. The PCR primer sequences of immune-related genes.
GenePosition5′–3′ Primer SequenceAccess No.
β-actinForwardGCATCCACGAGACCACTTACAHM053699.1
ReverseCTCCTGCTTGCTGATCCACATC
LGBPForwardCCATCAACAACCAAGTGTGCFJ605172.1
ReverseACGGGTTGTCATAGGTGGAG
TubeForwardATTGTGCTGCTGGAGTTGCTGACKC011815.1
ReverseCATCGTCGGTCGCTTCTTCTTGG
DorsalForwardCGTCAGCAGCACAGCAGAGAATKC900086.1
ReverseCCCGTATTTCCTCCCTCAACTTCAG
PPAEForwardCGTGCCCTACTACCTGTGCMZ736590.1
ReverseCGATGCCTTGAGTGTTCCTA
SODForwardCGGGATCCATGAGTAAGACCTTTGCCTAFJ617306.1
ReverseGGAATTCGTTCGCGGGTTTGCTGG
GSTForwardACGGGTTGTCATAGGTGGAGFJ610337.1
ReverseCCATCAACAACCAAGTGTGC
GPxForwardCTCTGGGAACAGCTTCTTGGFJ617305.1
ReverseATCCTGTACCCTGCAACCAC
Table 4. Change of water quality in different stocking densities.
GroupsWT (℃)EC (μs/cm)DO (mg/L)pHNH3-N (mg/L)NO2-N (mg/L)
G128.39 ± 0.34187.77 ± 8.616.49 ± 0.638.49 ± 0.180.37 ± 0.010.075 ± 0.010
G225.53 ± 0.13173.63 ± 2.147.26 ± 0.108.69 ± 0.060.59 ± 0.100.034 ± 0.005
G327.19 ± 0.83191.33 ± 1.546.74 ± 0.398.48 ± 0.150.46 ± 0.020.034 ± 0.002
G427.07 ± 0.54178.63 ± 2.086.67 ± 0.098.70 ± 0.110.38 ± 0.050.038 ± 0.002
G526.61 ± 0.42185.30 ± 2.035.91 ± 0.217.52 ± 0.07 **0.67 ± 0.040.129 ± 0.003 *
Note: G1: 1.2 inds/m2; G2: 1.5 inds/m2; G3: 1.8 inds/m2; G4: 2.1 inds/m2; G5: 2.4 inds/m2. Data are presented as mean ± SD (n = 9).“∗” indicates significant differences (p < 0.05) and “∗∗” indicates extremely significant differences (p < 0.01) among groups.
Table 5. Growth performance of E. sinensis in different stocking densities.
G1G2G3G4G5
Wi(g)5.95 ± 1.27 b6.09 ± 1.43 b6.88 ± 1.00 a6.70 ± 1.21 ab5.99 ± 1.01 b
Wf (g)86.61 ± 17.46 Aab82.96 ± 16.66 Ab91.79 ± 7.18 Aa78.68 ± 14.80 Ab69.54 ± 8.07 Bc
WGR (%)1403.04 ± 3.61 a1341.44 ± 4.80 a1271.87 ± 2.92 ab1119.96 ± 3.72 b1083.23 ± 1.80 b
SGR (%/day)1.59 ± 0.14 a1.55 ± 0.18 a1.53 ± 0.12 ab1.46 ± 0.16 b1.46 ± 0.09 b
GRCL (%)25.96 ± 0.64 a24.16 ± 0.32 a24.59 ± 0.20 a23.28 ± 1.81 a23.38 ± 0.22 a
GRCW (%)25.46 ± 0.54 a23.37 ± 0.70 a23.77 ± 0.33 a22.29 ± 2.00 a22.74 ± 0.15 a
CW/CL1.07 ± 0.02 a1.07 ± 0.02 a1.08 ± 0.01 a1.08 ± 0.01 a1.08 ± 0.01 a
CF (%)55.50 ± 6.55a51.65 ± 6.57 b55.72 ± 4.81 a54.74 ± 5.82 ab53.21 ± 9.47 b
Note: G1: 1.2 inds/m2; G2: 1.5 inds/m2; G3: 1.8 inds/m2; G4: 2.1 inds/m2; G5: 2.4 inds/m2. Data are presented as mean ± SD (n = 30). Different letters in the same line indicate significant differences among groups (p < 0.05).
Table 6. Amino acid composition in muscle of E. sinensis (g/100 g) at different stocking densities.
Amino Acid Composition of the MuscleG1G2G3G4G5
Isoleucine0.63 ± 0.13 a0.65 ± 0.09 a0.65 ± 0.07 a0.53 ± 0.16 a0.53 ± 0.08 a
Leucine1.18 ± 0.23 ab1.17 ± 0.15 ab1.26 ± 0.13 a0.97 ± 0.27 b0.97 ± 0.16 b
Lysine1.02 ± 0.16 ab1.07 ± 0.16 ab1.10 ± 0.13 a0.88 ± 0.22 b0.87 ± 0.14 bc
Methionine0.32 ± 0.05 b0.39 ± 0.08 b0.50 ± 0.04 a0.38 ± 0.08 b0.31 ± 0.06 b
Phenylalanine0.70 ± 0.13 ab0.72 ± 0.10 ab0.77 ± 0.12 a0.60 ± 0.15 b0.60 ± 0.09 b
Tyrosine0.57 ± 0.12 a0.57 ± 0.08 a0.57 ± 0.09 a0.49 ± 0.14 a0.48 ± 0.07 a
Threonine0.71 ± 0.10 ab0.71 ± 0.09 ab0.74 ± 0.07 a0.57 ± 0.13 c0.60 ± 0.11 bc
Valine0.68 ± 0.11 ab0.72 ± 0.10 a0.74 ± 0.09 a0.57 ± 0.16 b0.62 ± 0.09 ab
EAA5.87 ± 0.99 ab6.08 ± 0.81 ab6.46 ± 0.74 a5.05 ± 1.31 b5.04 ± 0.74 b
Histidine0.42 ± 0.10 ab0.46 ± 0.07 ab0.49 ± 0.08 a0.37 ± 0.10 b0.35 ± 0.08 b
Arginine1.42 ± 0.25 a1.41 ± 0.18 a1.43 ± 0.15 a1.28 ± 0.20 a1.28 ± 0.23 a
Glutamic acid2.61 ± 0.40 ab2.55 ± 0.30 ab2.81 ± 0.26 a2.25 ± 0.54 b2.26 ± 0.38 b
Aspartic acid1.49 ± 0.16 ab1.49 ± 0.17 ab1.56 ± 0.14a1.23 ± 0.30 b1.28 ± 0.22 b
Alanine1.02 ± 0.17 ab1.00 ± 0.12 ab1.11 ± 0.16 a0.98 ± 0.14 ab0.86 ± 0.14 b
Cysteine0.07 ± 0.03 b0.08 ± 0.02 b0.11 ± 0.04 a0.05 ± 0.02 b0.07 ± 0.02b
Glycine0.82 ± 0.12 ab0.77 ± 0.10 bc0.93 ± 0.09 a0.74 ± 0.14 bc0.66 ± 0.12 c
Serine0.69 ± 0.13 ab0.64 ± 0.07 ab0.73 ± 0.08 a0.56 ± 0.15 b0.58 ± 0.11 b
Proline0.72 ± 0.12 b0.74 ± 0.11 b0.89 ± 0.12 a0.73 ± 0.16 b0.60 ± 0.09 b
TAA15.07 ± 2.41 ab15.13 ± 1.85 ab16.41 ± 1.70 a13.21 ± 3.01 b12.92 ± 2.03 b
DAA7.21 ± 1.09 ab7.10 ± 0.82 ab7.76 ± 0.78 a6.30 ± 1.40 b6.15 ± 0.97 b
EAA/TAA38.90 ± 0.49 bc40.11 ± 0.93 a39.31 ± 0.67 ab38.03 ± 1.24 c39.09 ± 0.57 ab
DAA/TAA47.91 ± 0.46 a46.98 ± 0.66 b47.32 ± 0.79 ab47.70 ± 0.64 ab47.56 ± 0.24 ab
Note: Data are presented as mean ± SD (n = 30). Different letters in the same line indicate significant differences among groups (p < 0.05); EAA: essential amino acids; TAA: total amino acids; DAA: umami amino acids.
Table 7. Amino acid composition in hepatopancreas of E. sinensis in different stocking densities.
Amino Acid Composition of the HepatopancreasG1G2G3G4G5
Isoleucine0.22 ± 0.02 a0.23 ± 0.04 a0.23 ± 0.04 a0.25 ± 0.05 a0.23 ± 0.04 a
Leucine0.37 ± 0.03 a0.37 ± 0.06 a0.40 ± 0.08 a0.41 ± 0.06 a0.38 ± 0.06 a
Lysine0.31 ± 0.04 a0.30 ± 0.05 a0.30 ± 0.04 a0.32 ± 0.04 a0.28 ± 0.04 a
Methionine0.08 ± 0.04 a0.15 ± 0.08 a0.14 ± 0.06 a0.11 ± 0.06 a0.10 ± 0.06 a
Phenylalanine0.28 ± 0.03 a0.29 ± 0.05 a0.28 ± 0.04 a0.29 ± 0.04 a0.26 ± 0.05 a
Tyrosine0.19 ± 0.03 a0.20 ± 0.04 a0.21 ± 0.04 a0.19 ± 0.05 a0.19 ± 0.04 a
Threonine0.32 ± 0.02 a0.30 ± 0.05 a0.32 ± 0.06 a0.32 ± 0.05 a0.30 ± 0.05 a
Valine0.31 ± 0.02 a0.30 ± 0.04 a0.30 ± 0.04 a0.31 ± 0.03 a0.30 ± 0.04 a
EAA2.09 ± 0.21 a2.15 ± 0.34 a2.17 ± 0.30 a2.20 ± 0.29 a2.04 ± 0.34 a
Histidine0.17 ± 0.02 a0.16 ± 0.03 a0.17 ± 0.03 a0.16 ± 0.01 a0.14 ± 0.03 a
Arginine0.37 ± 0.05 ab0.35 ± 0.04 b0.38 ± 0.06 ab0.44 ± 0.09 a0.39 ± 0.06 ab
Glutamic acid0.79 ± 0.05 a0.76 ± 0.11 a0.75 ± 0.08 a0.77 ± 0.09 a0.78 ± 0.13 a
Aspartic acid0.59 ± 0.04 a0.57 ± 0.08 a0.57 ± 0.07 a0.60 ± 0.10 a0.56 ± 0.09 a
Alanine0.31 ± 0.02 a0.29 ± 0.04 a0.30 ± 0.05 a0.33 ± 0.05 a0.31 ± 0.05 a
Cysteine0.00 ± 0.00 a0.01 ± 0.01 a0.01 ± 0.00 a0.00 ± 0.00 a0.00 ± 0.00 a
Glycine0.28 ± 0.03 a0.28 ± 0.04 a0.29 ± 0.05 a0.30 ± 0.05 a0.29 ± 0.04 a
Serine0.25 ± 0.02 a0.24 ± 0.03 a0.25 ± 0.04 a0.25 ± 0.03 a0.25 ± 0.04 a
Proline0.30 ± 0.04 a0.29 ± 0.04 a0.30 ± 0.05 a0.34 ± 0.07 a0.32 ± 0.05 a
TAA5.14 ± 0.44 a5.10 ± 0.72 a5.18 ± 0.68 a5.39 ± 0.75 a5.08 ± 0.80 a
DAA2.44 ± 0.18 a2.40 ± 0.34 a2.40 ± 0.29 a2.48 ± 0.36a2.39 ± 0.36 a
EAA/TAA40.52 ± 1.03 ab42.06 ± 1.51 a41.82 ± 1.14 a40.78 ± 1.33 ab40.07 ± 0.94 b
DAA/TAA47.59 ± 1.08 a47.03 ± 1.08 ab46.41 ± 1.20 ab46.01 ± 1.04 b47.13 ± 0.83 ab
Note: Data are presented as mean ± SD (n = 30). Different letters in the same line indicate significant differences among groups (p < 0.05); EAA: essential amino acids; TAA: total amino acids; DAA: umami amino acids.
Table 8. Correlation analysis of pH and density on growth, amino acid composition, and immune-related gene expression of E. sinensis.
WGRSGREAA_MTAA_MEAA_HTAA_HDorsalGPxGSTLBGPPPAESODTube
pH0.043 *0.0560.4720.4460.4720.3070.0840.3030.3320.4710.1300.3670.004 **
Density0.020 *0.015 *0.4470.4580.4470.2110.4410.6860.9860.6340.6710.8000.020 *
Note: “*” indicates significant differences (p < 0.05) and “∗**” indicates extremely significant differences (p < 0.01).
Table 9. Correlation analysis of NO2-N and density on growth, amino acid composition, and immune-related gene expression of E. sinensis.
WGRSGREAA_MTAA_MEAA_HTAA_HDorsalGPxGSTLBGPPPAESODTube
NO2-N0.0910.1900.3650.3470.3650.4470.0760.3710.3310.4240.1470.4170.077
Density0.021 *0.026 *0.4250.4220.4250.4610.8570.5190.8170.7620.9240.9770.553
Note: “*” indicates significant differences (p < 0.05).
Publisher’s Note: MDPI stays neutral with regard to jurisdictional claims in published maps and institutional affiliations.

