Article

Elevated Winter Stream Temperatures below Wastewater Treatment Plants Shift Reproductive Development of Female Johnny Darter Etheostoma nigrum: A Field and Histologic Approach

by
Catherine M. Adams
1,*,
Dana L. Winkelman
2,
Paula A. Schaffer
3,
Daniel L. Villeneuve
4,
Jenna E. Cavallin
4,
Michael Ellman
5,
Kelvin Santana Rodriguez
5 and
Ryan M. Fitzpatrick
6
1
Colorado Cooperative Fish and Wildlife Research Unit, Department of Fish, Wildlife, and Conservation Biology, Colorado State University, Fort Collins, CO 80523, USA
2
U.S. Geological Survey, Colorado Cooperative Fish and Wildlife Research Unit, Colorado State University, Fort Collins, CO 80523, USA
3
CVMBS Microbiology, Immunology & Pathology Department, Veterinary Diagnostic Laboratory, Colorado State University, Fort Collins, CO 80523, USA
4
Environmental Protection Agency, Great Lakes Toxicology and Ecology Division, Duluth, MN 55804, USA
5
Oak Ridge Institute for Science and Education, Environmental Protection Agency, Duluth, MN 55804, USA
6
Colorado Parks and Wildlife, Research, Policy, and Planning Section, Fort Collins, CO 80526, USA
*
Author to whom correspondence should be addressed.
Fishes 2022, 7(6), 361; https://doi.org/10.3390/fishes7060361
Submission received: 21 October 2022 / Revised: 28 November 2022 / Accepted: 28 November 2022 / Published: 29 November 2022
(This article belongs to the Section Biology and Ecology)

Abstract

:
River water temperatures are increasing globally, particularly in urban systems. In winter, wastewater treatment plant (WWTP) effluent inputs are of particular concern because they increase water temperatures from near freezing to ~7–15 °C. Recent laboratory studies suggest that warm overwinter temperatures impact the reproductive timing of some fishes. To evaluate winter water temperature’s influence in the wild, we sampled Johnny Darter Etheostoma nigrum from three urban South Platte River tributaries in Colorado upstream and downstream of WWTP effluent discharge sites. Fish were collected weekly during the spring spawning season of 2021 and reproductive development was determined from histological analysis of the gonads. Winter water temperatures were approximately 5–10 °C greater ~300 m downstream of the WWTP effluent compared to upstream sites, and approximately 3 °C warmer at sampling sites ~5000 m downstream of the effluent discharge. Females collected downstream of WWTP effluent experienced accelerated reproductive development compared to upstream by 1–2 weeks. Water quality, including total estrogenicity, and spring water temperatures did not appear to explain varying reproductive development. It appears that small increases in winter water temperature influence the reproductive timing in E. nigrum. Further investigations into how shifts in reproductive timing influence other population dynamics are warranted.

Graphical Abstract

1. Introduction

Aquatic ectotherms are sensitive to water temperature that controls and regulates important biological functions and behaviors including daily and seasonal activity, metabolism, development, and reproduction [1,2,3,4,5]. Water temperature influences the timing, duration, and quality of reproduction in a variety of freshwater fish species in both the laboratory and field [6,7,8,9,10,11]. Year-round increases in water temperature attributed to climate change and point source pollutants (e.g., powerplant cooling systems) have been shown to impact life history processes, reproductive timing, and hatching success [2,12,13,14,15]. However, little is known about the impact of elevated winter water temperatures on the reproductive development, timing, and success of fishes [11]. The impact of warmer winter thermal regimes on aquatic ecology is of particular concern in urban environments where winter water temperatures have been rising due to decreased shading from deforestation [16], runoff from impervious surfaces [17], warm water releases from water storage and diversions [18], and discharges of warm wastewater treatment plant (WWTP) effluent [19,20,21]. Of these, WWTP effluent has the greatest impact in winter months [20] increasing water temperature by 10 °C or more for up to 27 km downstream [22]. Effluent’s thermal impact on urban streams has been increasing with human population growth globally [19]. Recent studies have shown that short, warm winters cause unseasonably early reproductive development, negatively impacting subsequent spring reproduction due to a decrease in egg size, hatching success, and overall egg production compared to fish that experience longer cooler winters [4,5,23]. Increases in winter stream temperatures due to WWTP effluent may mimic artificially short and warm winters, causing shifts in native fish reproductive development within urban aquatic ecosystems.
The South Platte River basin along the Colorado Front Range supported greater than 80% of the state’s 5.8 million residents in 2020, and population growth and water consumption are expected to increase [24]. Increased population and subsequent winter WWTP effluent volume and temperature can pose a risk to Colorado South Platte tributaries. To mitigate this, the Colorado Department of Public Health and the Environment (CDPHE) has enacted winter water temperature standards limiting the temperature of point source thermal pollutants, like WWTP effluent, to protect Colorado’s aquatic ecosystems. The standard for Warm-water Tier 1 (WS-I) streams is a maximum winter (December–February) weekly average standard of 12 °C [25] and Tier 1 is partly defined by the presence of Johnny Darter Etheostoma nigrum (Rafinesque 1820) among other native fish species. However, the standard is based on laboratory-derived thermal endpoints of Colorado fishes and no research has been conducted in a field setting to assess the impact of warm winter water temperature on fishes or evaluate if the standards are protective [25]. Warm-water Tier I streams are of particular conservation concern in Colorado due to their high concentration of native species, including E. nigrum, the State Species of Concern Stonecat Noturus flavus (Rafinesque 1818), and the State Threatened Common Shiner Luxilus cornutus (Mitchell, 1817) [26,27]. Investigations into how WWTP effluent influences water temperatures and fish reproduction in Colorado South Platte tributaries, particularly in winter, are crucial for understanding management options.
In addition to being a focal species for the Colorado water temperature standard and native percid in the South Platte River basin, E. nigrum are one of the most common darters in eastern Canada and the Midwestern United States [28]. In the South Platte River, Propst and Carlson [9] noted that E. nigrum spawned later in the year at warmer temperatures (17 °C in June–July) than populations in its central range (11.7–23 °C in April–June) [29]. They hypothesized the difference in spawn timing was due to cooler spring temperatures in the western part of its range, which delayed reproductive development and initiation of spawning. Etheostoma nigrum also have unique reproductive requirements and timing in relation to other South Platte native fishes. For example, they require smooth cobble for egg disposition in shallow (<45 cm deep), slow–moderate velocity (5–50 cm/s), and moderately clear sandy reaches [30]. Recent studies have shown that familial Yellow Perch Perca flavescens (Mitchill, 1814) produced smaller eggs and had reduced hatching success after experiencing shorter warmer winters believed to be the cause of subsequent low recruitment [4]. Additionally, Firkus et al. [5] and Baum [23] found that in the laboratory, E. nigrum exposed to elevated overwintering temperatures resulted in the early onset of spawning, which in Firkus et al.’s [5] study additionally had the effect of lowering overall fecundity [5,23]. Etheostoma nigrum’s potential sensitivity to unseasonably high winter stream temperatures is why CDPHE uses its presence to designate Warm-water Tier 1 streams [25]. The CDPHE designation along with its wide native range is why we chose E. nigrum as our focal species to study the influence of increased winter water temperatures from WWTP effluent on fish reproductive development.
Our study had three goals. The main goal of our study was to identify the effects of elevated winter water temperature on the timing of reproductive development of wild E. nigrum in areas surrounding WWTP effluent discharge locations in the South Platte drainage. We hypothesize that fish in warmer winter water regimes downstream of WWTPs will display earlier reproductive development than in colder water sites above WWTPs. In addition to increasing water temperature, we recognize there are various pesticides and personal care products (PPCPs), nutrients, and the hormone estrogen commonly found in WWTP effluent which may impact aspects of fish reproductive biology and decrease fecundity [31,32,33,34]. Thus, a secondary goal was to characterize any variation in water quality, including estrogenicity, between sites and histologically inspect fish gonads for testicular oocytes and atretic follicles, which can increase in the presence of wastewater-derived contaminants [35,36]. Finally, we hypothesize distance below a WWTP effluent will mitigate the thermal influence on reproductive timing due to cooling as the water travels downstream. Therefore, a tertiary goal was to characterize the winter thermal regime surrounding WWTP effluents in these South Platte tributaries.

2. Materials and Methods

2.1. Study Area

We chose three tributaries located in the South Platte River drainage, the Big Thompson River (BT), St. Vrain Creek (SV), and the Cache la Poudre River (CP) for our study (Figure 1). All tributaries have abundant E. nigrum populations that could be repeatedly sampled [37] and the Big Thompson and St. Vrain also had WWTP effluents that allowed us to assess the influence of WWTP effluent on E. nigrum reproductive timing. All three rivers have their headwaters in the Rocky Mountains, then transition into the Great Plains ecoregion upstream of our study sites.
The BT is a 126 km South Platte tributary that begins in Rocky Mountain National Park (RMNP) near Estes Park, CO, and flows east through the city of Loveland, CO before it meets with the main stem South Platte River (SP) near Greely, CO [38]. The SV is a 52 km tributary that begins further south in RMNP and flows east through the city of Longmont, CO before it joins the SP near Milliken, CO [39]. The CP is a 203 km tributary with headwaters on the north side of RMNP, flowing north into the Poudre Canyon and then east through the city of Fort Collins, CO to the confluence with the SP near Greeley, CO [40]. All three rivers have WWTP effluent inputs in the center of the urban towns they flow through, though abundant populations of E. nigrum were only able to be sampled both upstream and downstream of WWTP effluent on the BT and SV. The hydrographs of these streams are characterized by low discharge baseflow from September–April and peak/high flows from May–August due to montane snowmelt runoff.
Four sampling locations were chosen on the BT and SV tributaries. Two sampling locations were selected upstream of the WWTP and two downstream. Sites were at least 500 m apart, a distance greater than E. nigrum’s known maximum range [41], to limit fish movement between sampling locations. We refer to the sites based on their location relative to the WWTP; the far upstream site (FU), upstream site (U), downstream site (D), and far downstream site (FD; Figure 1). These sites represent our hypothesized thermal gradient in relation to effluent impacted stream temperatures in the winter season, with the FU site being the coldest, but similar to the U site, the D site being the warmest, and the temperature of the FD site predicted to fall in between the U and D sites.
A ninth sampling location was selected on CP near Timnath CO, ~38 km west of the confluence with the South Platte (Figure 1). This sampling location was chosen because of its historically high population of E. nigrum [42] and its similarity to BT and SV sites. This site is ~18 km downstream from the nearest WWTP effluent in a semi-urban/agricultural area.

2.2. Fish Collection

Preliminary fish collections and histopathology identified spawning during week 18 of 2020 (late April), earlier than previous accounts of E. nigrum spawn timing in Colorado (in June) [9]. Thus, in 2021, sampling was focused on the identified spawning period (Table 1). The SV and CP were not sampled in week 18 due to high flow conditions. Generally, sampling was conducted at all sites and rivers in the same week. Thus, sampling is described temporally by the week of the year for comparison between rivers. Sampling during weeks 1 and 5 had a maximum collection of 10 fish per sampling site and increased to 20 fish per site during weeks 12–41 per our permit with Colorado Parks and Wildlife (collection permit 1865705216). For each week of sampling, all sites within a river were sampled within 8 h to limit temporal variability. An exception was week 13 on the St. Vrain during which sites were sampled within 24 h. Fish were sampled via backpack electrofishing, euthanized via immersion in a solution of MS-222 at a concentration of 250mg/L, weighed, and measured (total length; TL). Generally, the entire fish was preserved in 10% buffered formalin and submitted to Colorado State University (CSU) Veterinary Diagnostics Laboratory for histological processing and review. Exceptions to this were weeks 12/13, 16, 32, and 41 when fish were dissected post euthanization for removal of the liver for vitellogenin analysis (described below). On those weeks, the gonad was removed and individually preserved in formalin for histological analysis and review.
Vitellogenin (Vtg), an egg yolk precursor protein, typically only synthesized in female fish, can be produced by male fish when exposed to estrogens and is commonly used as a biomarker of estrogen exposure in WWTP-impacted streams [36]. Thus, during weeks 12/13, 16, 32, and 41, we also dissected fish and removed the livers for Vtg3 gene expression analysis. Liver samples were frozen on dry ice and shipped overnight to the US Environmental Protection Agency (EPA) Great Lakes Toxicology and Ecology Division (GLTED) for Vtg3 mRNA analysis. Hepatic Vtg3 transcript abundance was determined by quantitative real-time polymerase chain reaction (qPCR). Detailed methods are described in the supplemental information (SM).
Lengths and weights of fish were compared using Welch’s two-sample t-test and ANOVA as well as Games-Howell post hoc pairwise comparison tests in Program R using the package rstatix [43]. These tests were used over traditional ANOVA and post hoc tests due to equal variance and sample size assumption violations (Bartlett test of homogeneity of variances; p < 0.05).

2.3. Temperature Monitoring

Onset Hobo (Bourne, Massachusetts) temperature loggers were placed at FU-SV, FD-SV, U-BT, and D-BT in the spring of 2020. A logger was placed at FD-BT in December 2020 and at FU-BT in August of 2021 (Figure 1). Due to the late establishment of the FU-BT site, no winter 2020–2021 or spring 2021 temperatures were recorded for this site. Temperature data from 2020 to 2022 at U-SV and D-SV were acquired from the City of Longmont’s water temperature monitoring efforts. Supplemental temperature data for U-BT and D-BT were obtained from the City of Loveland’s water temperature monitoring efforts. Temperature data were compared using Welch’s ANOVA and Games-Howell post hoc pairwise comparison tests in Program R using the package rstatix [42]. These tests were used over traditional ANOVA and post hoc tests due to equal variance and sample size assumption violations (Bartlett test of homogeneity of variances; p < 0.05). In some cases, the presence or absence of an overlap of 95% confidence intervals between weekly average temperatures was used as a de facto significance test for comparisons [44].

2.4. Water Quality

Water samples were collected to evaluate whether any potential differences in E. nigrum reproduction could be attributed to variation in selected contaminant concentrations or water estrogenicity among the sites. Samples were collected on weeks 12, 13, 16, 32, and 41 in 1 L glass amber bottles for estrogen analysis, 40 mL glass amber volatile organic analyses (VOA) vials for PPCPs analysis, and a 60 mL LDPE bottle for nutrients (NNPs) analysis. Samples were stored on ice, and shipped to the U.S. EPA Region 8 laboratory for PPCP and NNPs analysis and the GLTED for in vitro estrogenic activity within 120 h of sampling. Analyses for PPCPs and NNPs were done following the EPA Region 8 standard operating procedures [45,46]. Principal component analysis in Program R was used to visually compare PPCP and NNPs concentrations among sites and sampling occasions. Detailed methods for measuring total in vitro estrogenic activity are provided as supplemental information (SM). Presence or absence of an overlap of 95% confidence intervals of mean 17β-estradiol equivalents was used as a de facto significance test for comparisons [44].

2.5. Histological Analysis

Immersion fixed fish were bisected on the midsagittal plane, routinely processed to paraffin blocks, sectioned at 7 microns, mounted on charged slides, and stained routinely with hematoxylin and eosin for evaluation. Fish were classified as male, female, or unknown sex if the gonad was not present in the histologic section or was present but immature. Male gonads were staged according to the Organisation for Economic Co-operation and Development (OECD) guidance document for the diagnosis of endocrine-related histopathology of fish gonads (supplemental information (SM)) [47], and proportions in each stage at each site each week were calculated. Ovaries of females were photographed using a JENOPTIK GRYPHAX microscope camera and software. From these photos, perinucleolar, cortical alveolar, early vitellogenic, late vitellogenic, and mature oocytes in each female ovary as classified by the EPA [48] were identified and enumerated using the image analysis software ImageJ [49].
Because E. nigrum are fractional spawners (i.e., batch spawners), females usually contain oocytes at a variety of developmental phases at one time, and thus can contain previtellogenic oocytes, early and late vitellogenic oocytes, mature follicles, and postovulatory follicles concurrently (Figure 2). Females that have initiated gonadal development with a commitment to spawn that season are in vitellogenesis, indicated by the presence of vitellogenic oocytes [50,51]. We first classified each female as previtellogenic (no vitellogenic oocytes, only perinucleolar and/or cortical alveolar) or vitellogenic (at least one vitellogenic oocyte) to quantify the reproductive development of females. We further differentiated between females in early and late vitellogenesis based on if the most advanced oocyte present in each female was in the early or late vitellogenic phase, a method modified from Borg and Veen [52]. Differentiating between females’ oocytes in early vs. late vitellogenic phases of development is more insightful for the interpretation of developmental timing than traditional staging [53]. The presence of mature (hydrated oocytes) and post-ovulatory follicles can also provide information on spawning activity in relation to the specific timing of sampling. For example, once oocytes are hydrated, they are generally spawned within hours, and post-ovulatory follicles are thought to be reabsorbed, thus non-observable, after as little as three days [51]. While our weekly sampling frequency was not sufficient for reliable use of hydrated oocytes and post-ovulatory follicles as evidence of daily differences in the onset of spawning, their presence was evidence of weekly differences, and we believe their presence still provides insight into reproductive developmental and timing differences among sites.
For analysis, we identified the proportion of females that; (1) were previtellogenic (2) early vitellogenic, and (3) late vitellogenic as previously described. Females were also placed into a separate and supplemental category of “spawning” or “not spawning”, where “spawning” individuals were those that had at least one hydrated oocyte and/or post ovulatory follicle present and “not spawning” were those who did not. The “spawning” category is considered secondary and supplemental to the main reproductive stage (previtellogenic, early vitellogenic, or late vitellogenic) assigned to each female because while it is evidence of recent or incipient spawning activity, it is possible we missed this evidence in other females due to weekly, instead of daily or hourly, sampling frequency.
The presence or absence of atretic follicles in the presence of degradation or reabsorption in female fish [35] and testicular oocytes in male fish were also recorded. Differences in the proportion of affected fish between rivers and sampling sites were determined using the test for equal proportions in Program R. Proportions that are stated to be similar have a p-value greater than 0.05.

3. Results

We sampled 1304 E. nigrum in 2020 and 2021 (Tables S4–S7). A total of 872 E. nigrum were sampled during the spring sampling period in 2021 (Table 2). The average TL was 56.3 mm (range: 28–82 mm) and the average weight was 1.6 g (range: 0.05–4.3 g). Both TL and weight were significantly different in 2020 and 2021 (p < 0.01). However, on average, fish in 2021 were only 2.5 mm longer and 0.2 g heavier than those sampled in 2020. Fish from CP were significantly smaller than those from BT and SV (49.4 [SD = 8.0], 57.4 [SD = 7.3], and 57.0 [SD = 9.0] mm, respectively; p < 0.01). Within BT fish size varied by site (p < 0.01) though were similar in size at FU, U, and D-BT (55.7 [SD = 7.6] mm and 1.5 [SD = 0.7] g, 56.3 [SD = 7.2] mm and 1.6 [SD = 0.7] g, and 56.4 [SD = 7.2] mm and 1.6 [SD = 0.7] g, respectively), and significantly larger at FD-BT (60.6 [SD = 6.4] mm; 2.0 [SD = 0.7] g; p < 0.05). Fish size also varied by site in SV (p < 0.01) and pairwise comparisons revealed that length and weight were significantly different between all sites. Fish at FU-SV were the smallest (50.1 [SD = 7.13] mm; 1.1 [SD = 0.5] g), followed by those at FD-SV (56.2 [SD = 9.6] mm; 1.6 [SD = 0.8] g), U-SV (59.8 [SD = 7.0] mm; 2.0 [SD = 0.7] g), and finally D-SV (64.0 [SD = 6.8] mm; 2.3 [SD = 0.8] g). Fish size was similar among months sampled in each river from January to May 2021.

3.1. Temperature

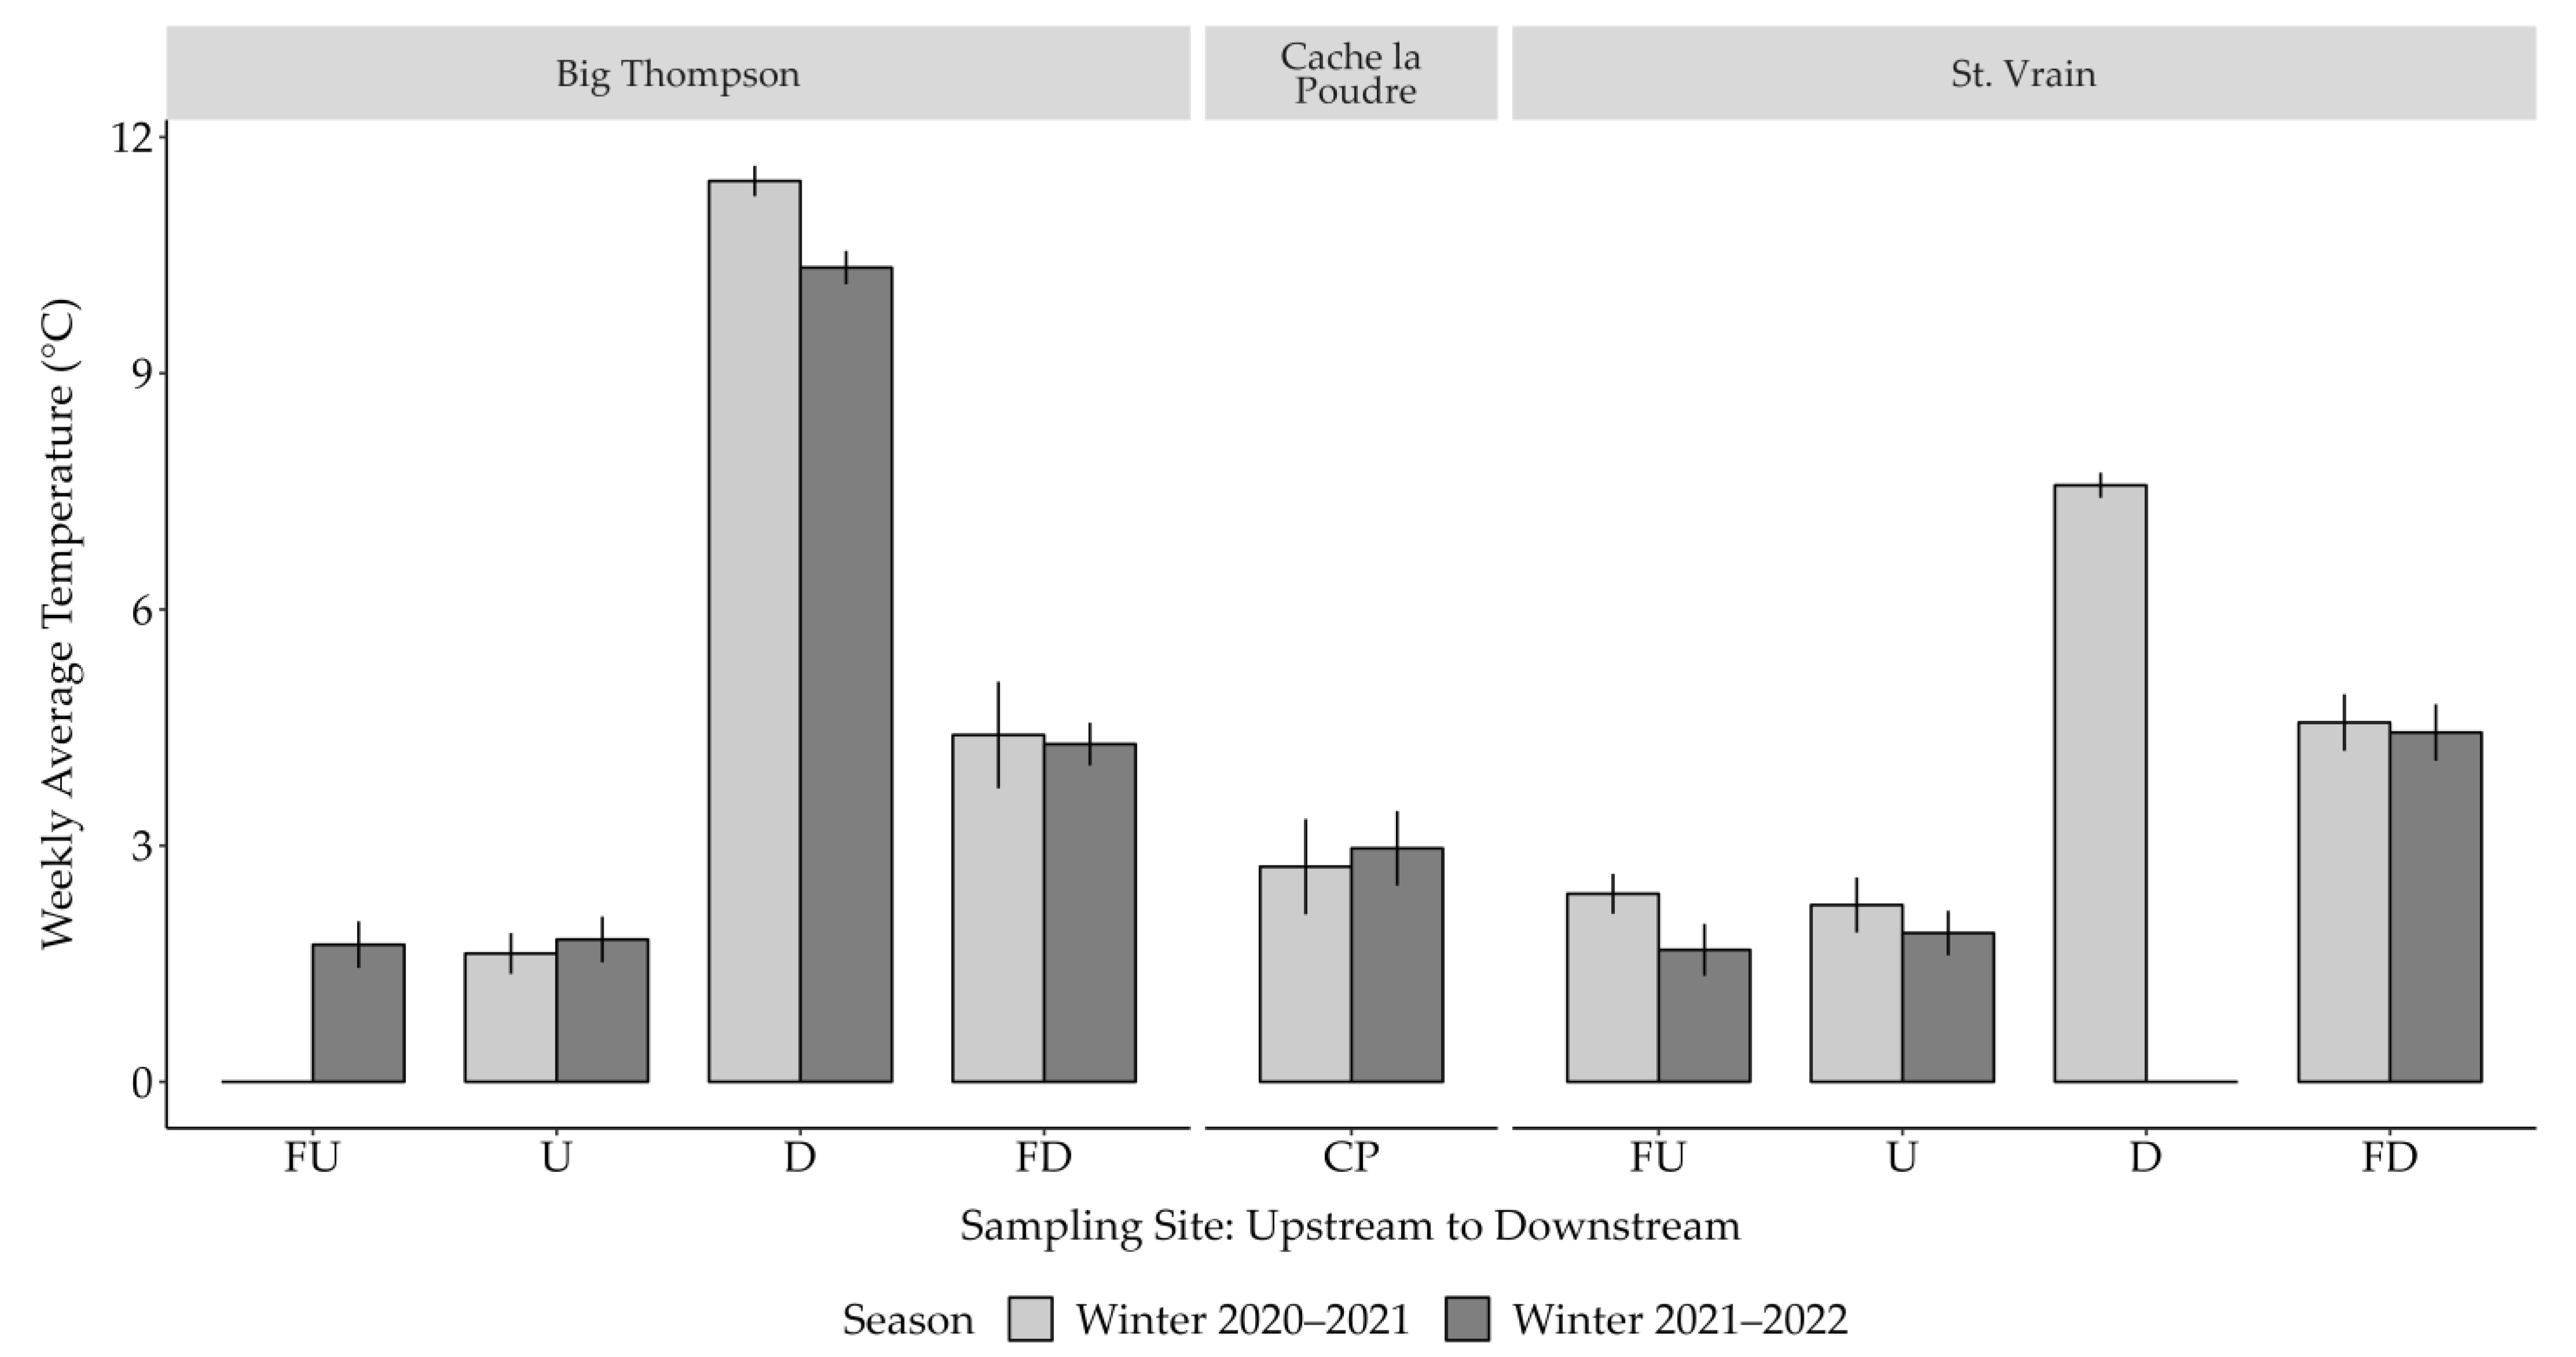
Our hypothesized gradient of winter water temperatures in relation to the WWTP effluent was supported (Figure 3). Winter water temperature in 2021 indicated the coldest winter temperatures at the upstream sites (FU and U, respectively). The site immediately below the WWTPs (D) had the warmest winter weekly average water temperatures (WAT) in both BT and SV, and temperatures at the farthest downstream sites (FD) were intermediate.
In the winter of 2020–2021, WAT at all sites on the BT were significantly different (p < 0.01). The winter WAT was 1.7 °C [SD = 0.8 °C] at U-BT, 11.6 °C [SD = 0.8 °C] at D-BT, and 4.9 °C [SD = 1.7 °C] at FD-BT (Figure 3). Winter WATs at FU-BT and U-BT were similar in winter 2021–2022 (Figure 3). The WATs in SV were also different between sites during the winter period (p < 0.01). The winter 2020–2021 WAT was similar between FU-SV and U-SV (2.4 °C [SD = 0.001 °C] and 2.2 °C [SD = 0.6 °C], respectively) and was significantly greater at D-SV (7.6 °C [SD = 0.6 °C]). Although the WAT declined to 4.6 °C at FD-SV it was still significantly warmer than the WAT at the upstream sites (p < 0.05; Figure 3). Notably, the first week of December at D-BT in both winter 2020–2021 and winter 2021–2022 were the only instances where the WAT exceeded CDPHE WS-I water temperature standard (12.8 °C) [25].
During the winter of 2020–2021, the WATs significantly differed between the upstream sites on both the BT and SV (p < 0.01); however, U-SV had a mean weekly average temperature of only 0.5 °C greater than U-BT. The downstream sites also differed between the SV and BT (p < 0.01) and D-BT had a mean WAT 4 °C greater than D-SV in winter 2020–2021 (Figure 3). The furthest downstream sites (FD) were not significantly different between streams (Figure 3). Logger error at the CP site (C) resulted in a loss of winter water temperature data after the first two weeks in December of 2020. However, winter WAT and average air temperatures (t-test; p > 0.1) were similar in both the 2020–2021 and 2021–2022 winter seasons, and thus the 2021–2022 winter WAT (3.1 °C [SD = 1.7 °C]) is likely representative of the 2020–2021 winter WAT (2.8 °C [SD = 0.4 °C]). Thus, winter WAT at CP was slightly warmer than the BT and SV upstream sites, but slightly cooler than the FD sites (Figure 3).
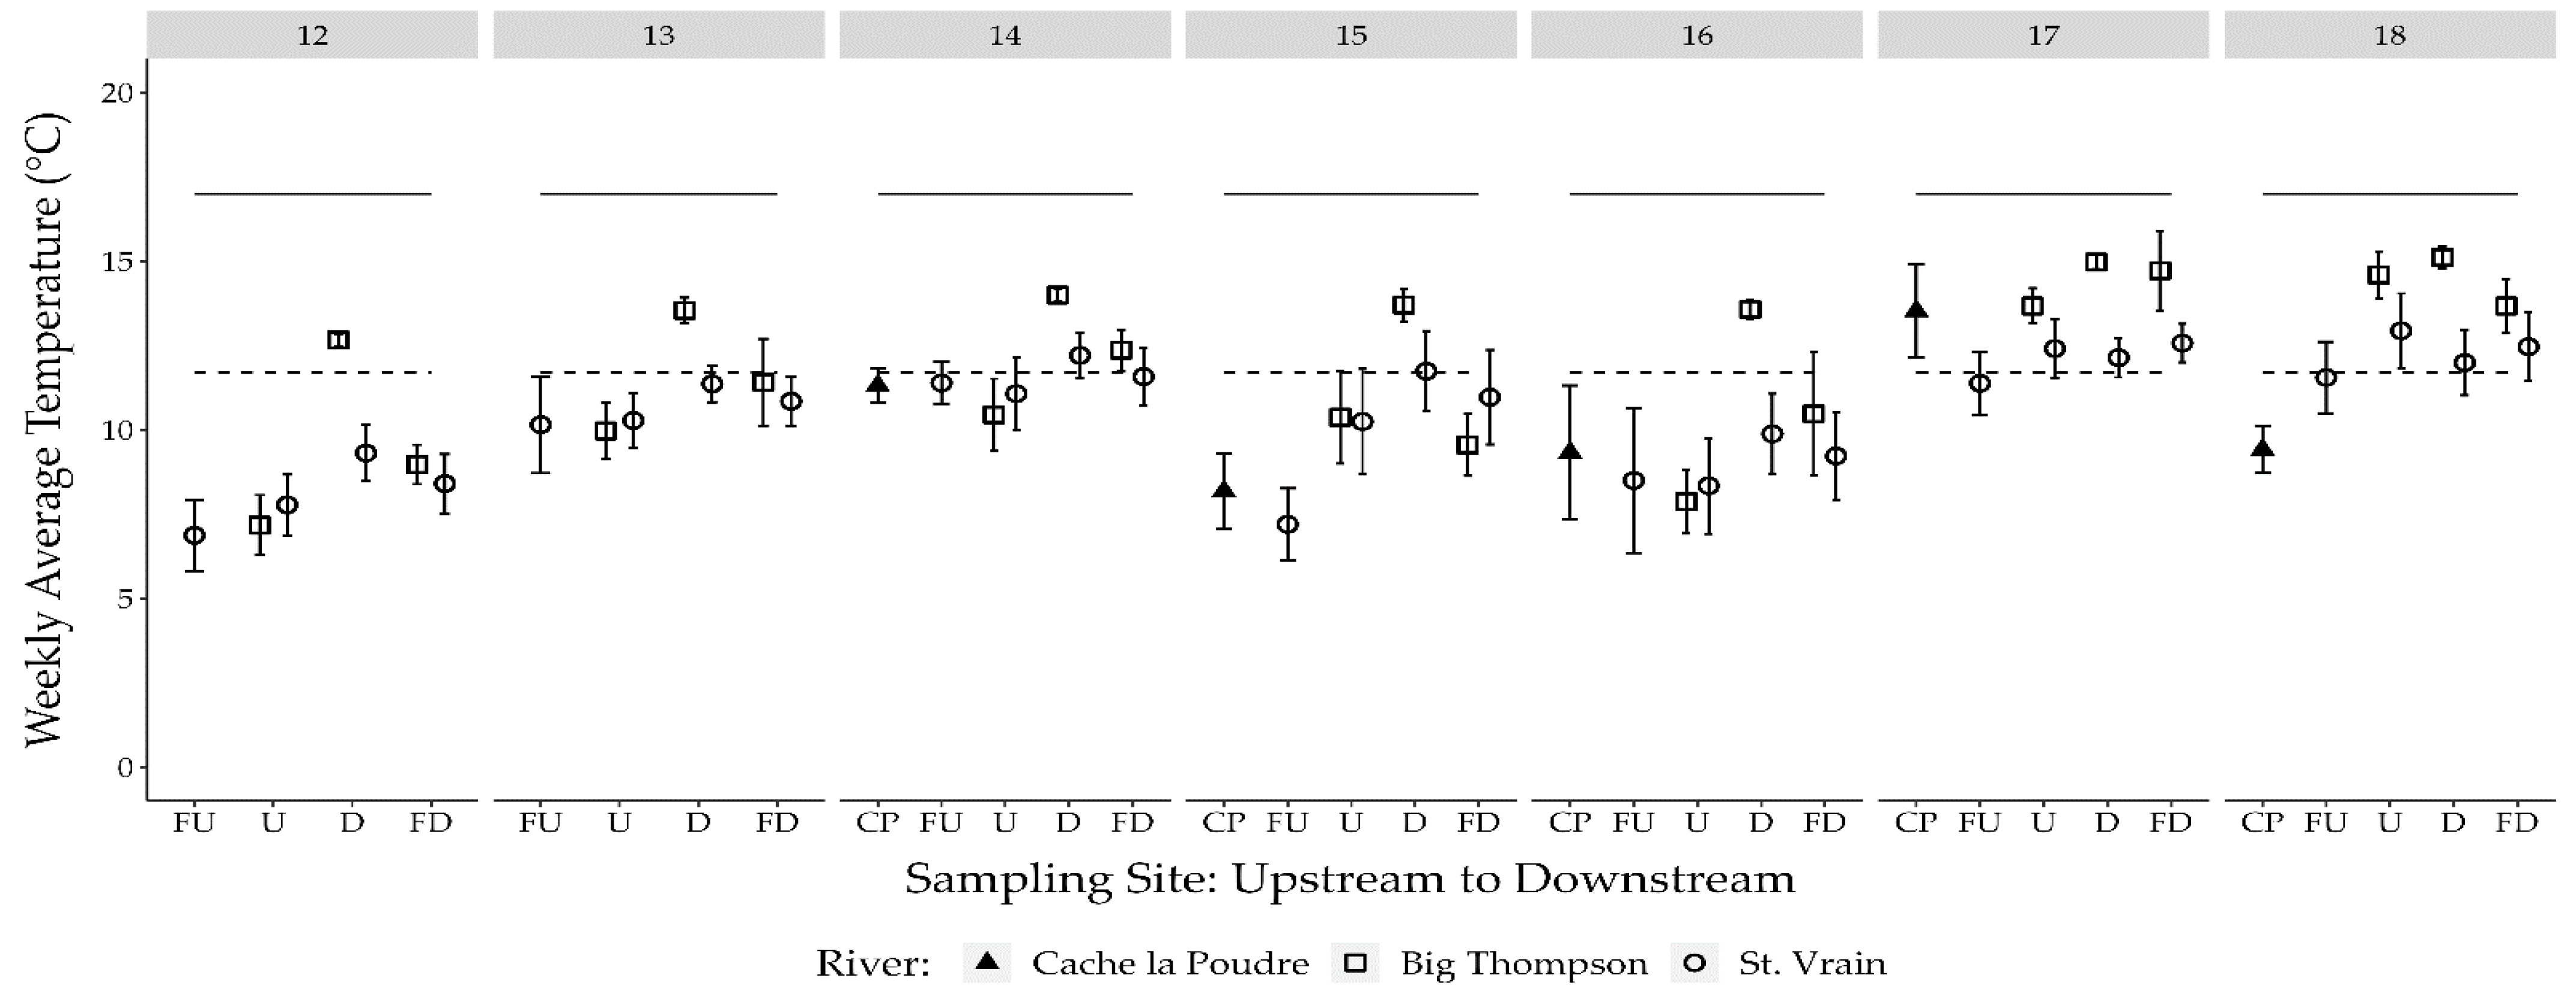
Water temperatures in spring were also examined to assess potential variation in water temperature during the spring sampling period. In March, April, and May WATs were similar between all sampling sites within each river, except for D-BT which was significantly greater than both U-BT and FD-BT until week 17 of 2021 (Figure 4). Overall, WAT ranged from 4.1–17.1 °C during weeks 12–18. Water temperatures at CP were similar to SV (Figure 4). No water temperature data at the CP site were recorded for weeks 12 and 13 due to logger error.

3.2. Water Quality

3.2.1. PPCPs and NNPs

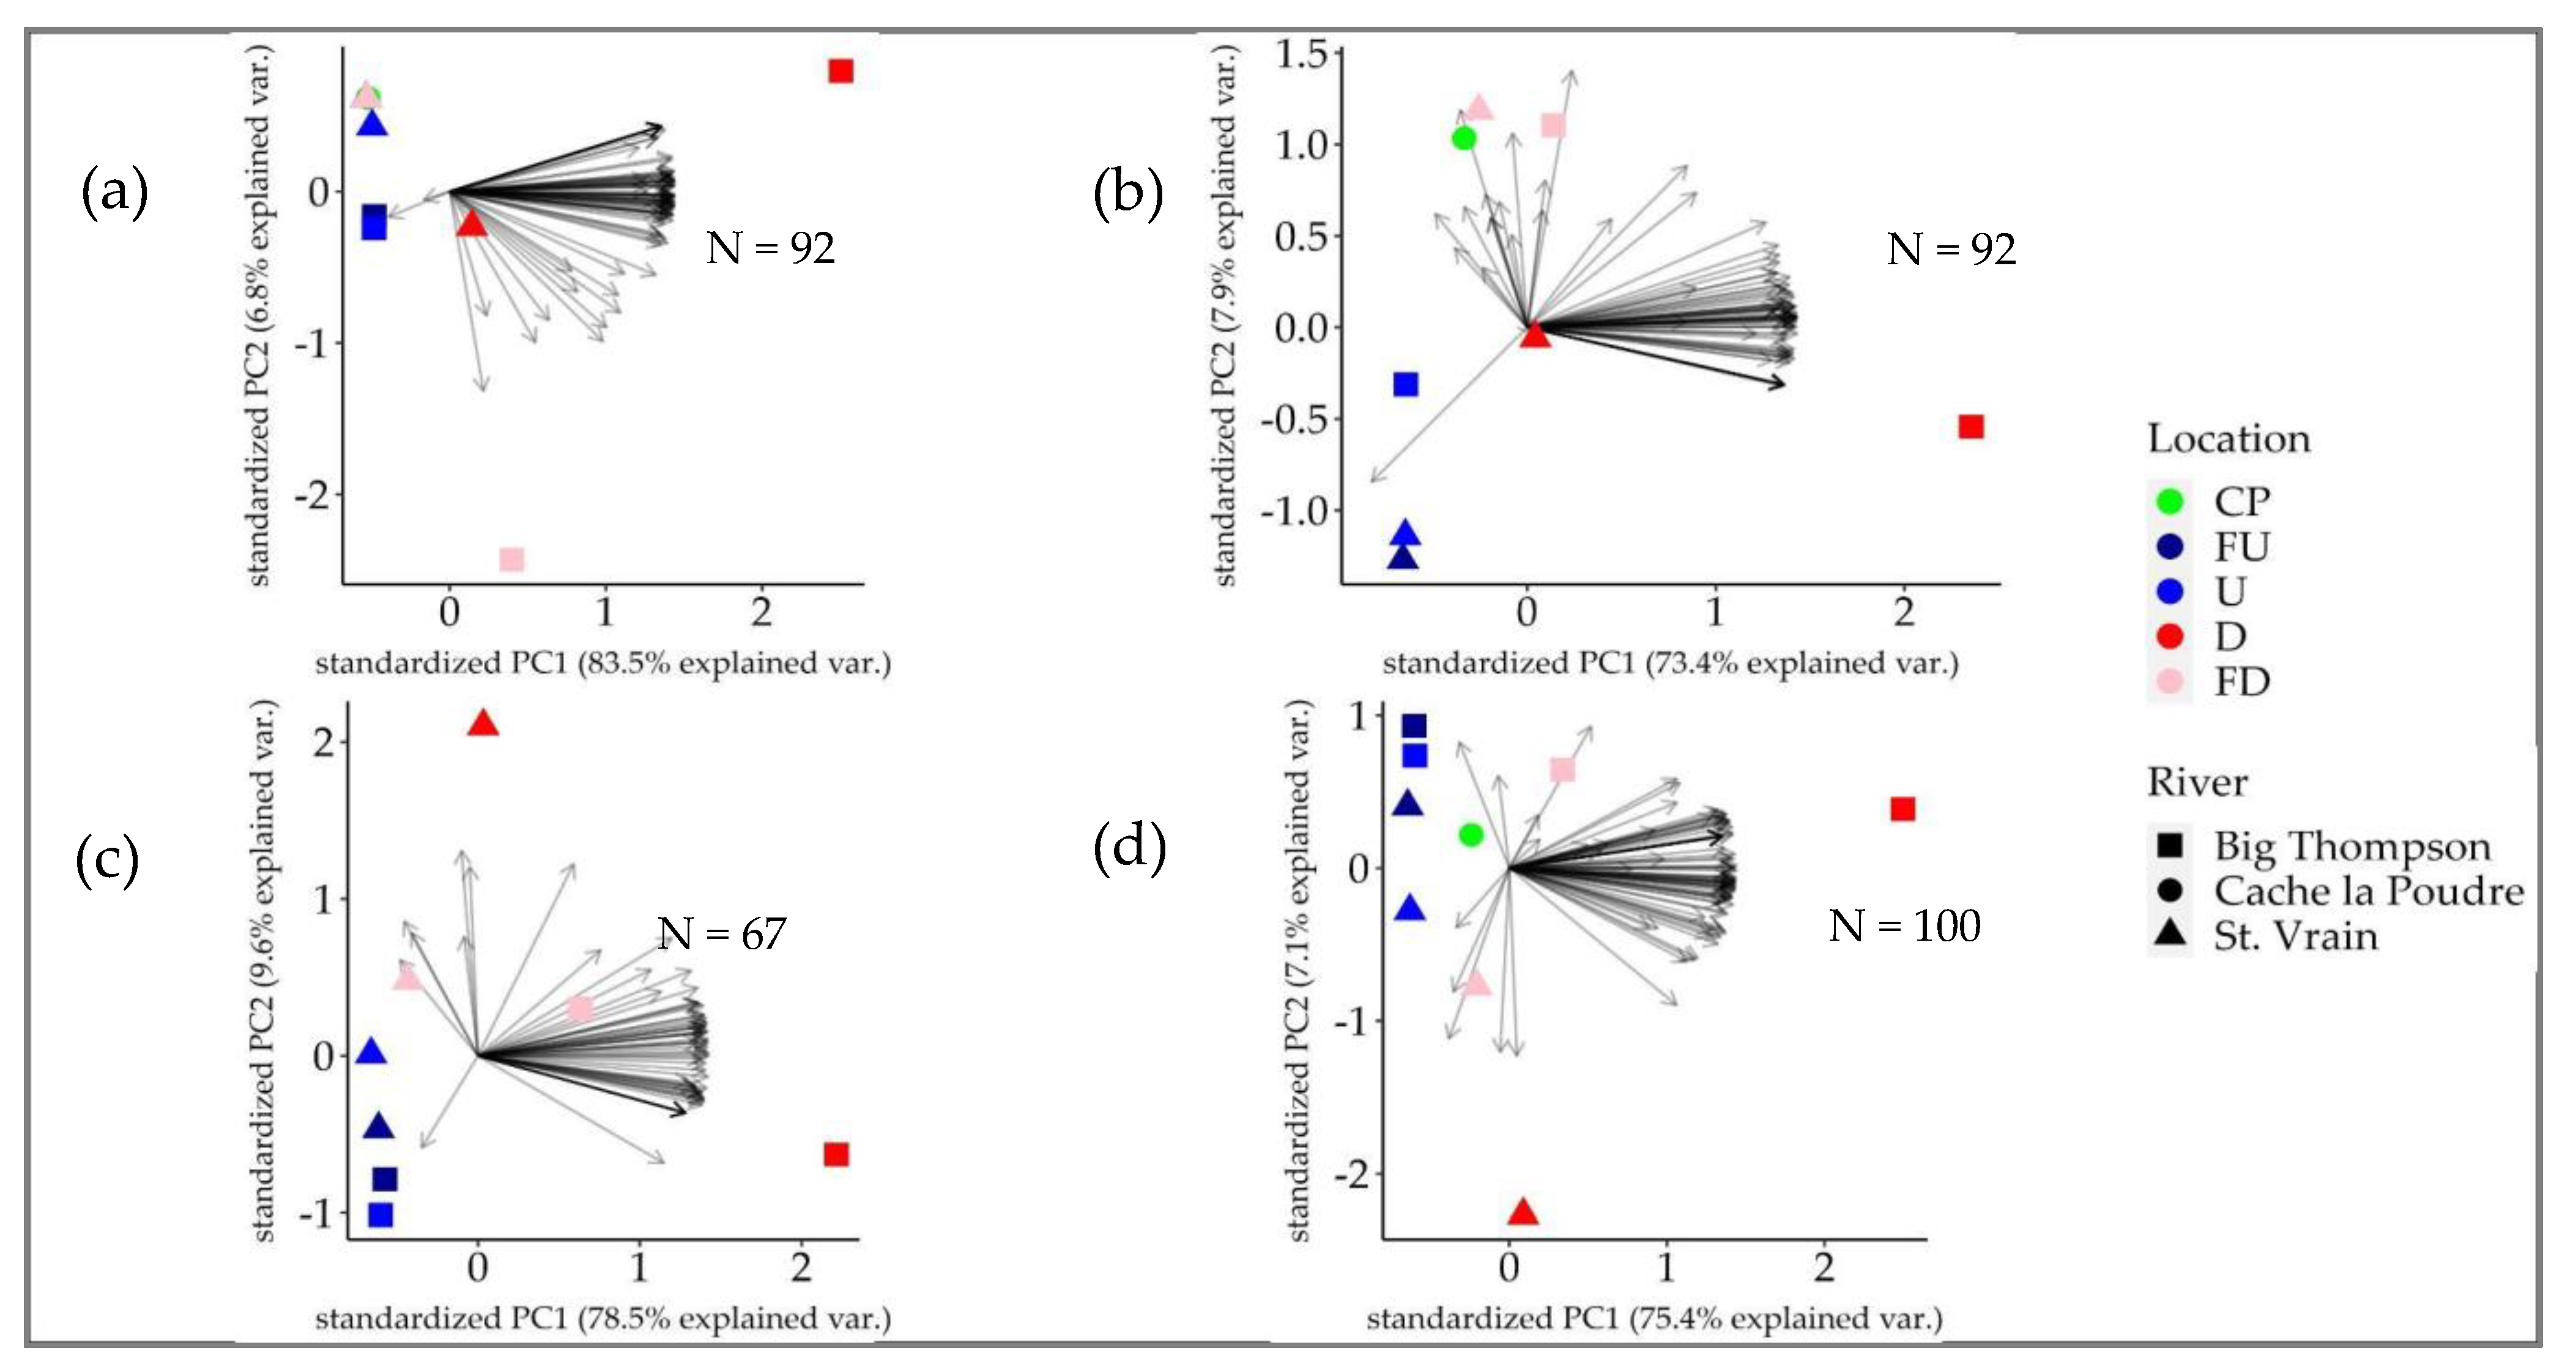
There were 96 PPCPs and 3 NNPs detected across all sampling sites, though only 3 PPCPs (caffeine, DEET, and gabapentin) and 1 NNP (orthophosphate) were detected at every site. Nutrient concentrations were similar between sites and rivers except for orthophosphate which was significantly greater in BT and SV downstream of the WWTP (Figure S2). Forty-one PPCPs were detected exclusively at every downstream site in BT and SV as well as CP, apart from 6 PPCPs not detected also in CP (3-Hydroxycarbofuran, Diclofenac, Monoethylglycinexylidide, Norquetiapine, Oxymorphone, Primidone; Table S9.). Principal component analysis revealed water quality was similar among upstream sites and among the downstream sites along the PC1 axis on all sampling occasions, though D-BT was an outlier (Figure 5). More detailed results are reported in the Supplemental Information [SM].

3.2.2. Estrogenicity

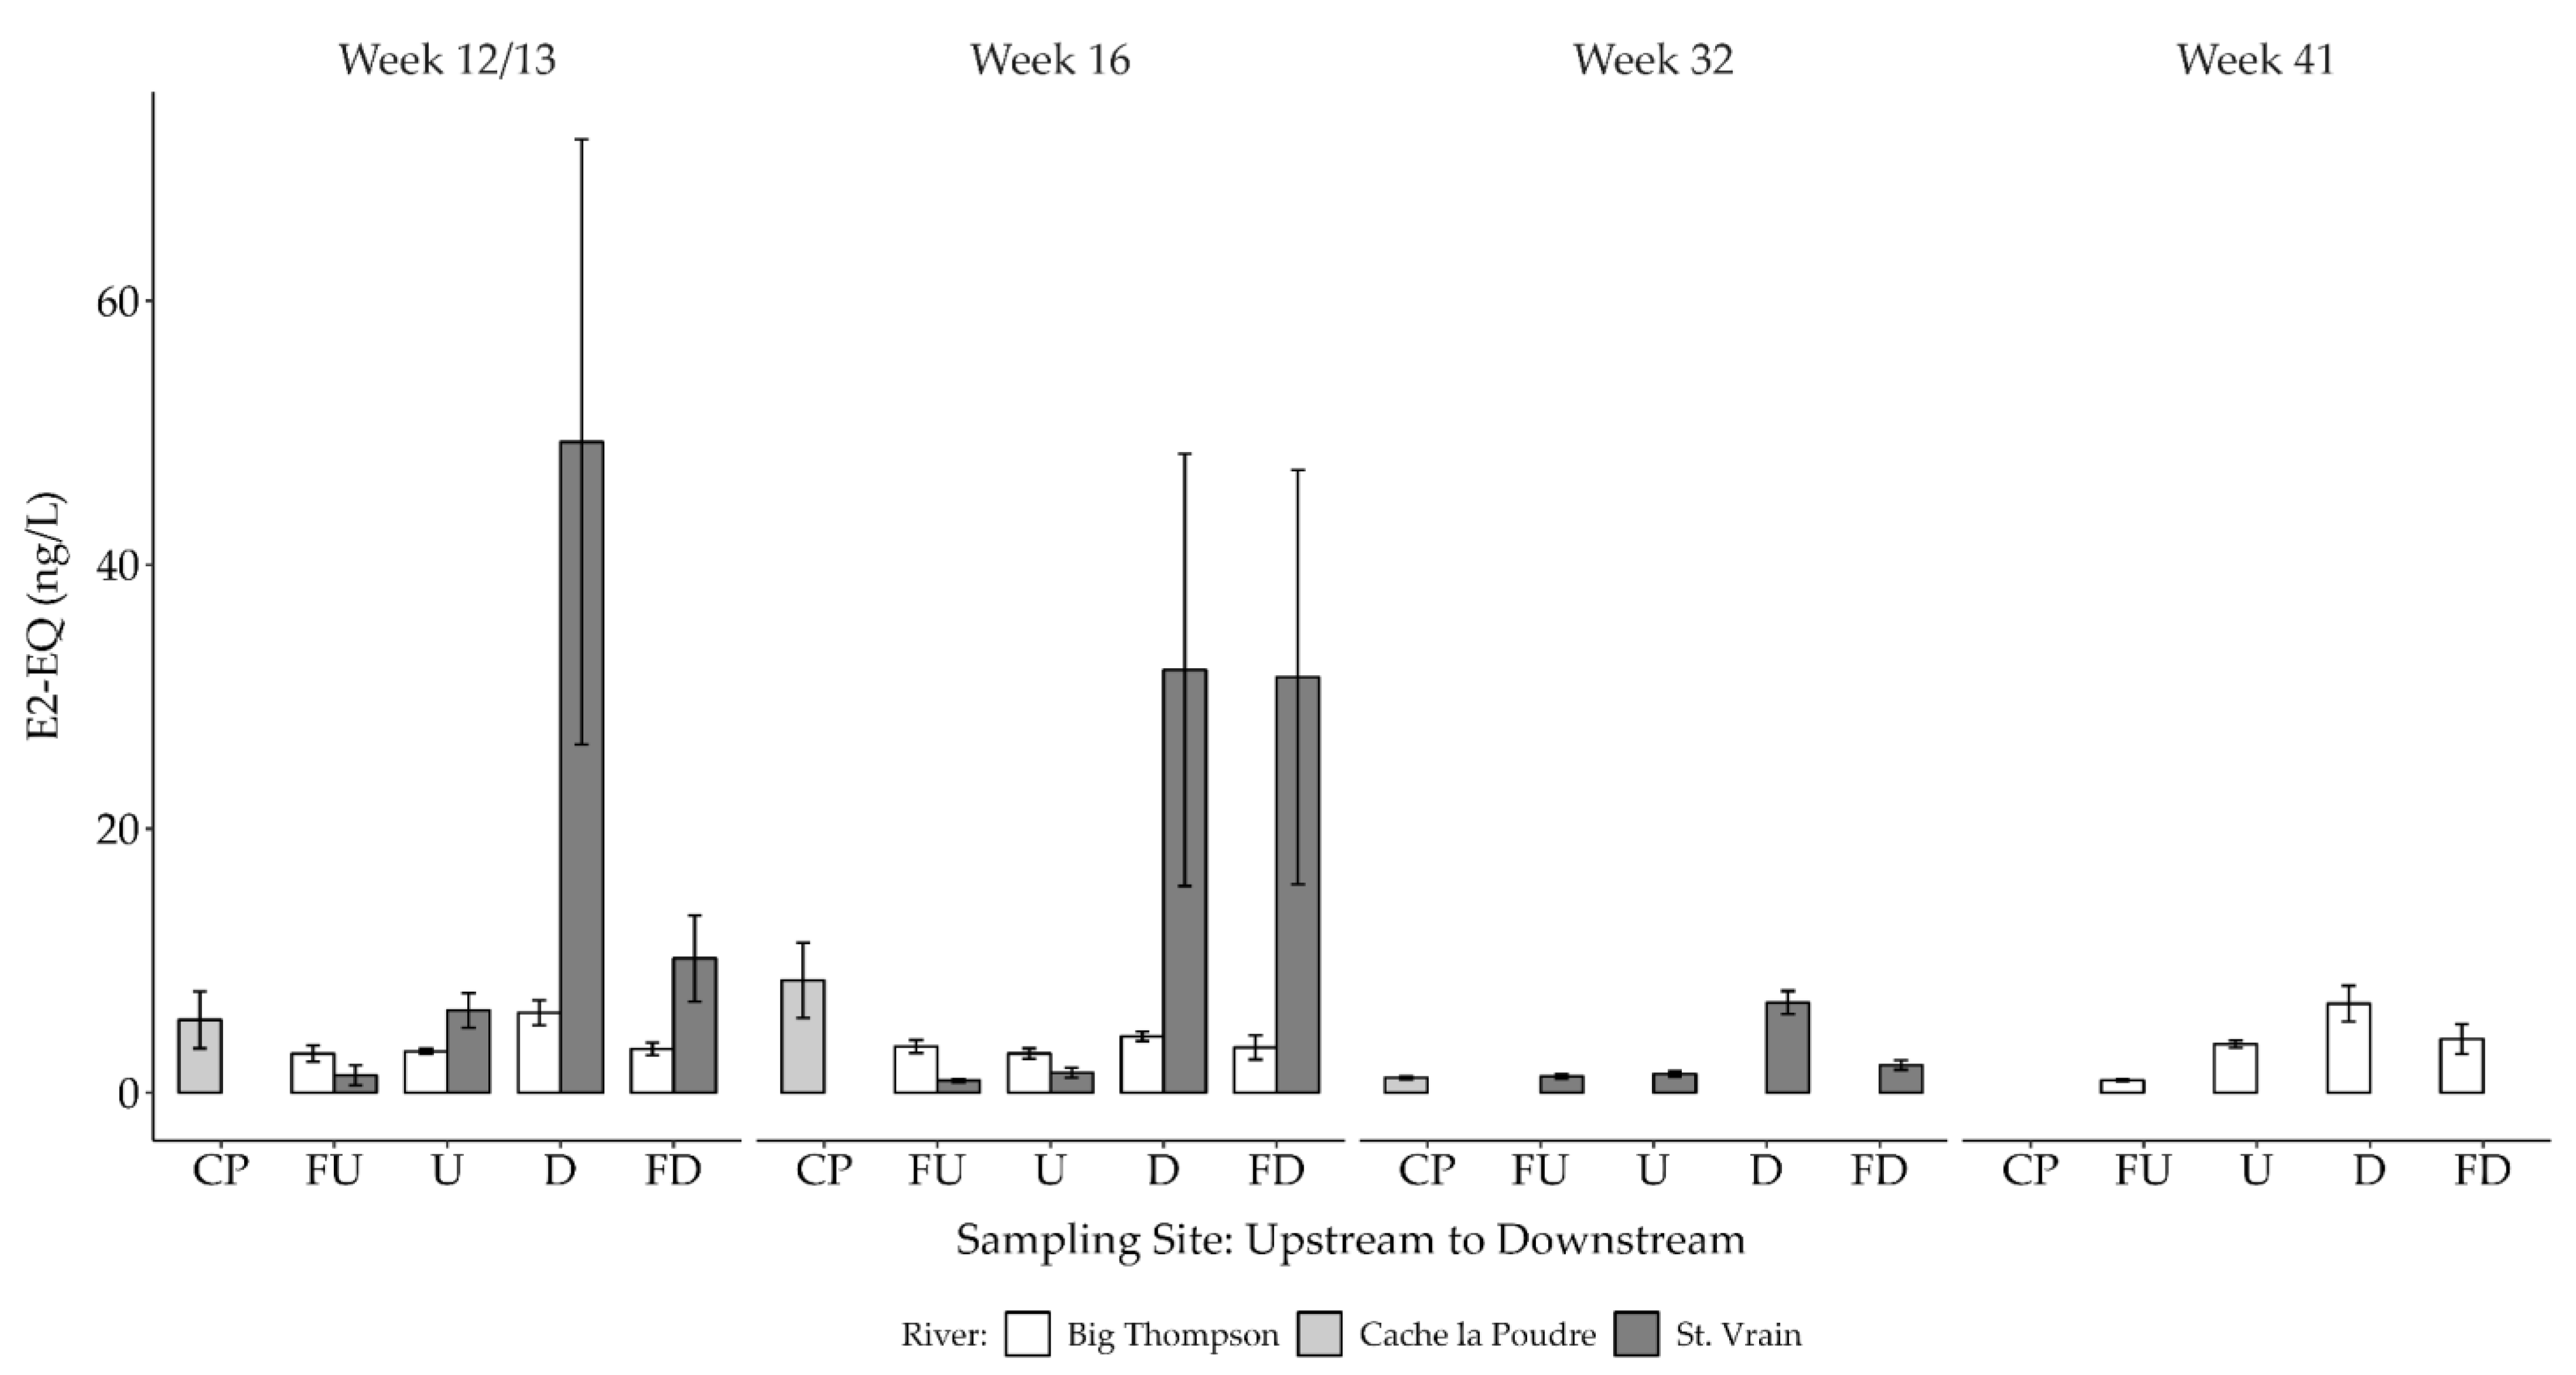
Sites with the highest total estrogenicity included D-SV and FD-SV in March and April (weeks 13 and 16) of 2021 (Figure 6; Table S3). Generally, all other sites had similar concentrations of 17β-estradiol equivalents (E2-EQs, ng/L). There were slight increases in E2-EQs downstream of the WWTP on the BT compared to upstream, but these small differences (2–3 E2-EQs ng/L) are viewed as trivial based on the variability of the bioassay used to calculate the E2-EQ concentration.

3.2.3. Etheostoma nigrum Vtg

Hepatic Vtg3 expression was analyzed in 73 males, 7 from the Cache la Poudre, 32 from the Big Thompson, and 34 from the St. Vrain. Overall, Vtg3 transcript abundance was relatively low and varied at all sites, except for D-SV. Males at site D-SV consistently had liver Vtg3 mRNA abundance comparable to that of the pooled female RNA sample, suggesting ongoing exposure to estrogenic compounds (Figure 7). Males from all other sites had lower Vtg3 mRNA concentrations overall, which was generally consistent with the lower levels of average E2-EQ. The notable inconsistency is the lack of Vtg induction at the FD-SV, which may suggest lower bioavailability of estrogens at the site farther downstream, despite similar E2-EQ to D-SV measured in the in vitro assay (week 16).

3.3. Female Gonad Histology

Within the BT, no vitellogenic female E. nigrum were collected in January or February except for one early vitellogenic female of four sampled at D-BT on 4 February 2021 (week 5). Through the spring period, female reproductive development in BT downstream of the WWTP was approximately two weeks ahead of those upstream (Figure 8). On week 12, early vitellogenic females were sampled from sites downstream of the WWTP while all females collected upstream were previtellogenic. On week 15, while proportions of early and late vitellogenic females were similar, notably, no D-BT females were previtellogenic. On week 16, some FU-BT females were previtellogenic, but all females sampled from the other sites were late vitellogenic, and a proportion of 0.18–0.33 females sampled from D-BT or FU-BT were spawning. Week 17 was similar to week 16, but by the first week in May (week 18), most females were late vitellogenic with many also showing evidence of spawning (Figure 8).
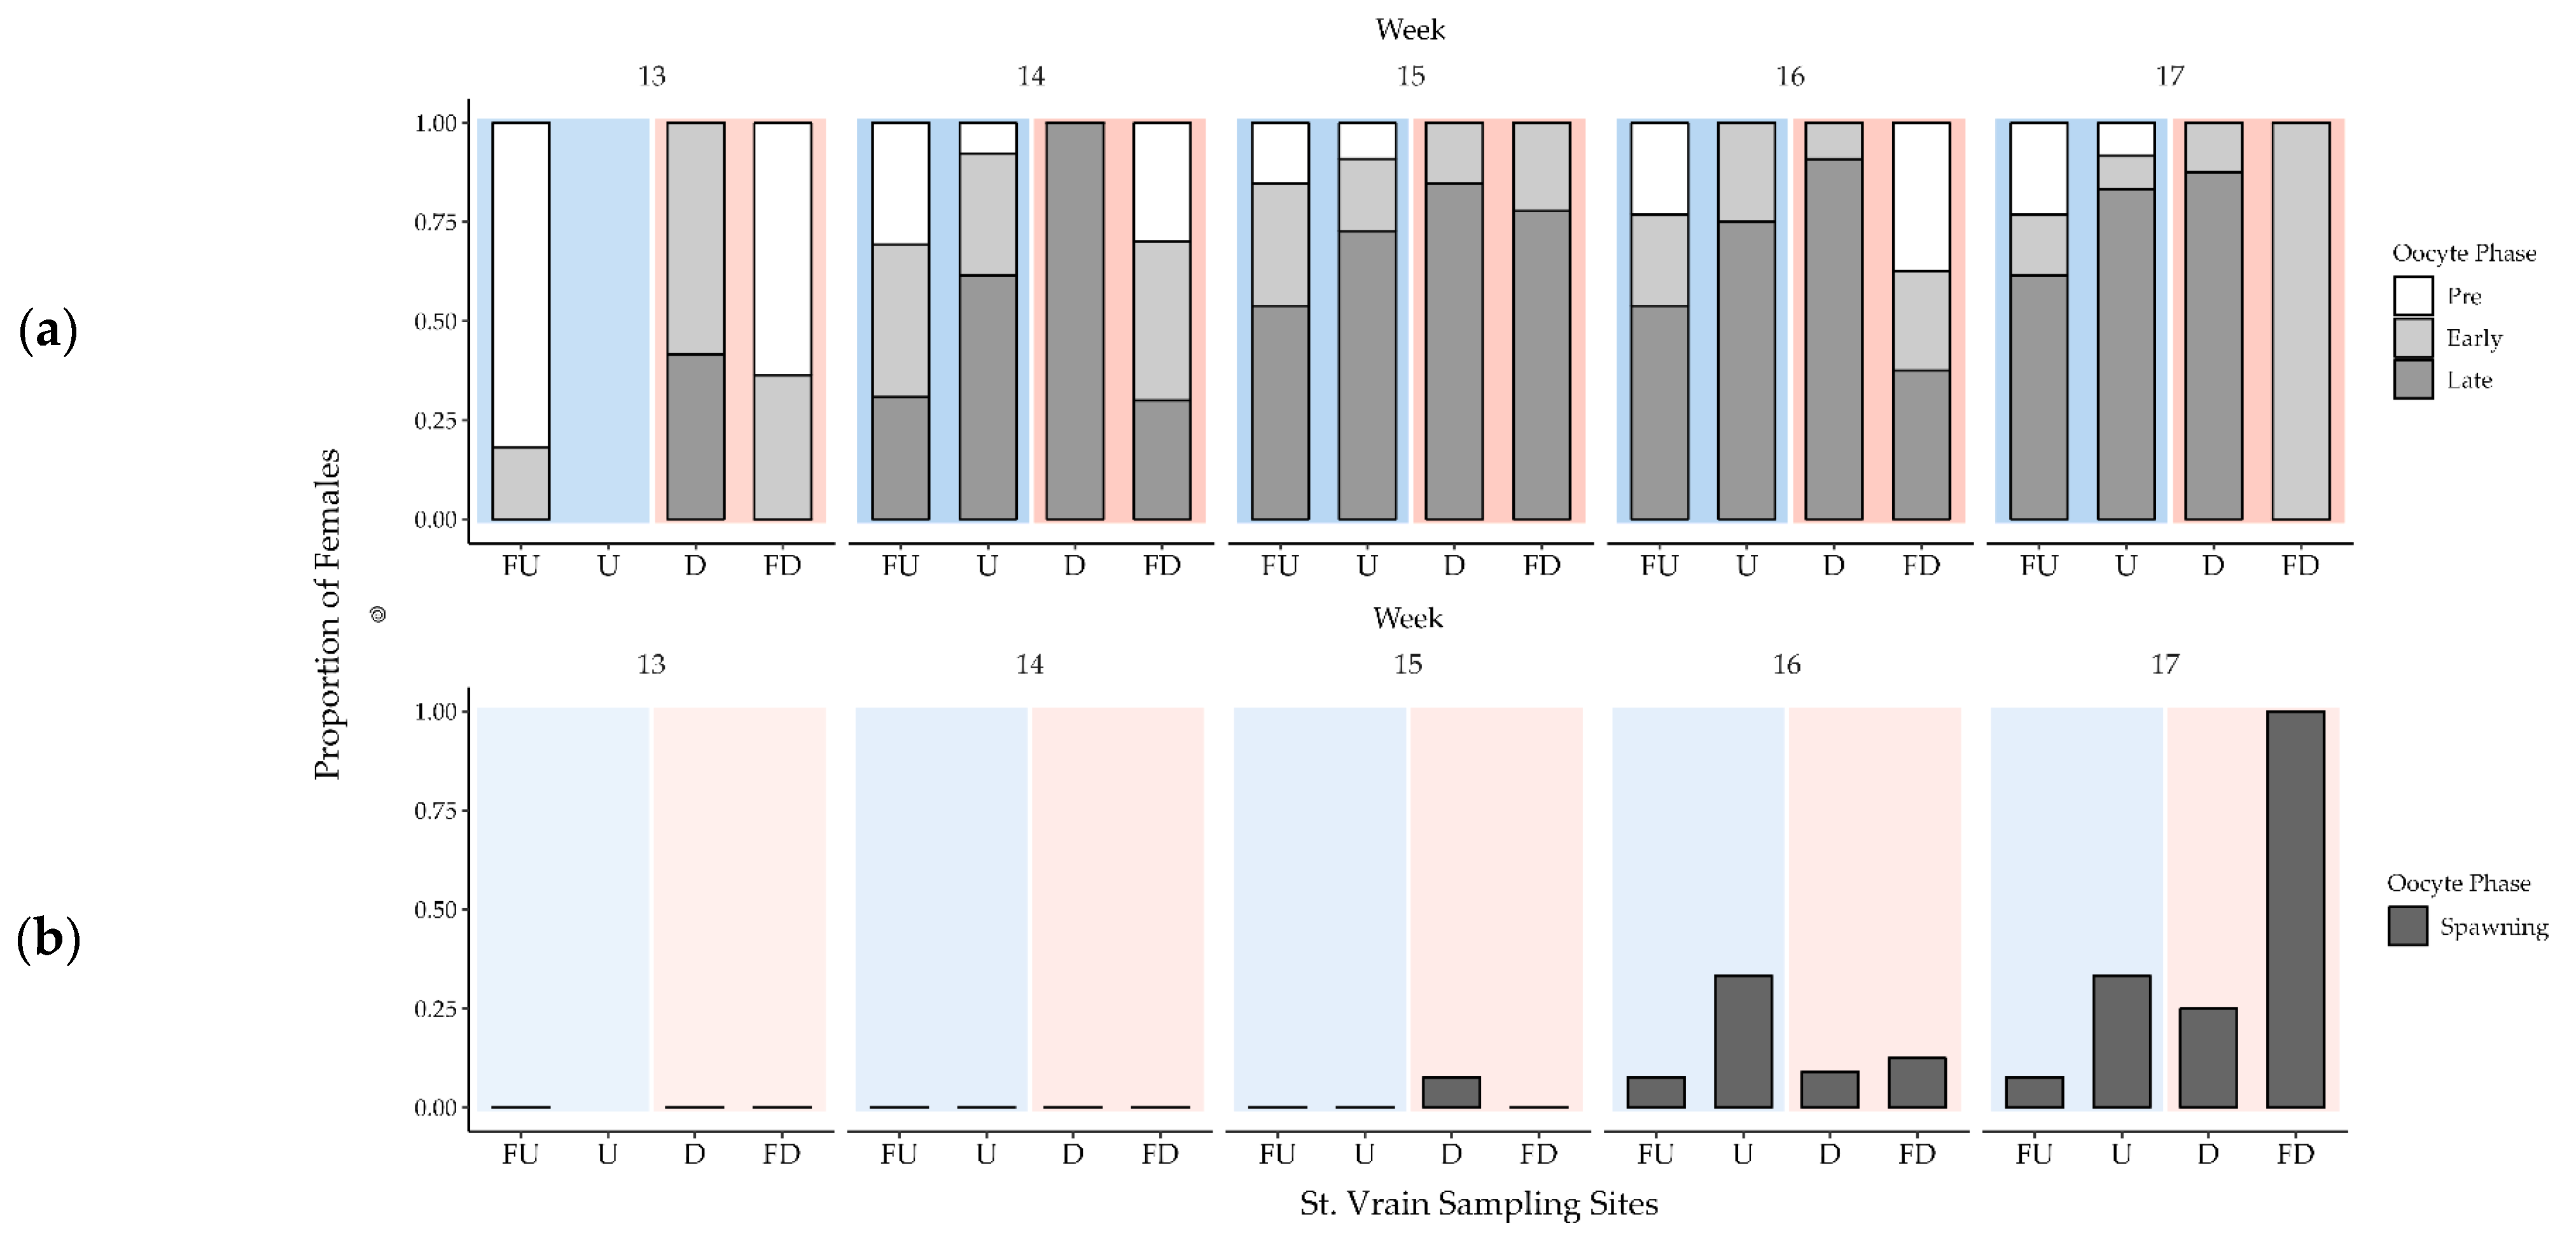
Female reproductive development in SV was one week earlier at D-SV compared to other sites (Figure 9). During weeks 13 and 14, all females sampled from directly below the WWTP (D-BT) were consistently in more developed reproductive states than those at other sites. On week 15, mature follicles (evidence of incipient spawning activity) were detected in a single female at D-SV. Spawning females were detected at all sites on weeks 16 and 17 (Figure 9).
Female reproductive development was delayed at CP compared to BT and SV. No early vitellogenic females were sampled in CP until week 14. From weeks 14 to 17 the proportion of early vitellogenic females remained consistently low (0.10–0.30) while the proportion of previtellogenic females remained consistently high (0.69–0.80). The proportion of late vitellogenic females was 0.15–0.18 on weeks 16 and 17, and no spawning females were detected during the spring 2021 sampling period.
The proportion of females with follicle atresia, classified by the presence of one or more atretic follicles, was similar among the three rivers (0.28–0.35; Figure 10). Cases of severe acute atresia (atresia affecting >75% of vitellogenic follicles) were only present in BT and SV with severe atresia affecting slightly more females in SV (0.06 and 0.02, respectively; p < 0.05). Follicle atresia was similar between BT sites (0.25–0.40). The proportion of females affected with severe acute follicle atresia was low and similar between BT sites (0.01–0.04). The proportion of females with follicle atresia in SV was greatest at D-SV and lowest at FD-SV (0.47 and 0.086, respectively; p < 0.01) while the proportion at FU-SV and U-SV were similar (0.25–0.31). Instances of severe atresia also varied by site, with a similar but greater proportion of females affected at both U-SV and D-SV (0.15 and 0.10, respectively) than FU-SV and FD-SV (0.01 and 0.00, respectively; p < 0.05; Figure 10).

3.4. Male Gonad Histology

Trends in male gonad development were not detected spatially or temporally. Overall, the proportions of males in each reproductive stage were similar between BT and SV (Figure S1). Males in reproductive stages 1–3 were collected every week of sampling, even week 1 of 2021 (January). A proportion of 0.5 or greater of males collected were in either stage 2 or 3 during most sampling occasions (Figure S1). Interestingly, the only exceptions to this were the weeks 15–17 at CP, FU-SV in weeks 14 and 15, and D and FD-SV on week 17, where a majority of males were in stages 0 and 1 (Figure S1)
Testicular oocytes in E. nigrum males were present in every river, though the overall proportion of affected males was low, between 0.01 and 0.03, and not significantly different. Testicular oocytes were present at all BT sites except the furthest upstream site (FU-BT). The D-BT site had the highest proportion of males with testicular oocytes (0.01–0.06), though differences were not significant. In SV, affected males were only detected at D-SV in 2020 and U-SV in 2021 (0.02–0.03; Figure 10).

4. Discussion

In general, reproduction occurred one to two weeks earlier at sites with warmer winter water temperatures downstream of the WWTPs in both BT and SV. Water quality, including PPCPs and estrogenicity, fish gonadal histology, and spring water temperatures do not correlate with the reproductive developmental trends in our study. We attribute the differences in spawning initiation to warmer winter water temperatures downstream of the WWTPs, which were ~3–10 °C higher than upstream sites. The data in our study do not indicate that water quality played a role in spawning initiation among sites; however, samples could be analyzed for a wider variety of analytes. Additionally, detection of female-like Vtg3 expression in males from the D-SV site suggests that WWTP-associated contaminants should not be discounted as additional stresses to native fish reproduction. Interestingly, reproductive development and spawn timing occurred in April, earlier in the year than we expected based on previously recorded spawning times in June for E. nigrum in Colorado [9].
Early in the spawning season females immediately below both WWTPs showed signs of advanced oocyte development compared to sites upstream of the WWTP effluents. In April (weeks 14–17), the females immediately downstream of the WWTP on the Big Thompson (D-BT) had a significantly higher proportion of vitellogenic oocytes than at any other site, suggesting females at that site had accelerated gonadal development. Histologically, female vitellogenesis downstream of the WWTP on the St. Vrain (D-SV) was similar to D-BT and showed accelerated gonadal development compared to females sampled from upstream sites. At the start of our spring sampling period, all D-SV females were vitellogenic while greater than 50% of females from all other SV sites were still in a previtellogenic state. This discrepancy in vitellogenic females between sites suggests that those at D-SV had accelerated reproductive development. We attribute the accelerated gonadal development to higher winter water temperatures immediately below the WWTPs. The winter WAT at D-BT was ~10 °C higher than upstream sites and D-SV was ~5 °C higher. The WATs at sites furthest downstream of the WWTP were about ~3 °C higher than upstream sites in both the BT and SV. Despite cooler temperatures at the sites furthest from the WWTP, females from FD-BT appeared to be more reproductively developed than upstream sites, suggesting relatively small increases in winter water temperature may accelerate reproductive development in female E. nigrum.
Direct evidence of spawning, either hydrated oocytes or post-ovulatory follicles, was observed in both the BT and SV. Spawning females were detected at D-BT and FD-BT two weeks prior to their detection at either upstream site. We also sampled a spawning female at D-SV one week prior to any other site, which complements our conclusions of accelerated reproductive development at the D-SV site. However, our weekly sampling design likely did not effectively sample for spawning individuals, and it is possible we missed evidence of this activity at upstream sites. Direct evidence of recent and incipient spawning is rare in fractional spawners, as the presence of hydrated oocytes and post-ovulatory follicles are typically short-lived in the gonad. More frequent, possibly hourly, sampling would be required to make definitive spawn timing inferences.
Interestingly, throughout our spring sampling period, most females from CP remained previtellogenic and there was no evidence of spawning females. We were not able to record winter WAT leading up to our fish collection, but subsequent temperature monitoring the following winter suggests that the winter WAT at CP is generally colder than the BT and SV downstream sites. On average, fish from CP were similar in size to the FU-SV site and had a similar thermal regime as the other rivers throughout the spring, summer, and fall [54]. Additionally, water quality and fish health metrics were comparable to BT and SV overall. Further investigation is warranted to understand why reproductive development was delayed in E. nigrum collected in CP compared to those in BT and SV.
The data do not indicate that water quality differences contributed to accelerated spawning in BT and SV compared to CP, or at downstream sites compared to upstream sites. Principal component analysis of PPCPs and NNPs suggested that all sites were similar along the PC1 axis, which explained 73–83% of the variation between sites, except for D-BT which was an outlier. Despite these similarities, accelerated reproductive development occurred at all downstream sites, not exclusively the downstream BT site, and females at the CP site had comparatively delayed reproductive development despite similarities in PPCPs and NNPs concentrations. Further, the surface water estrogenicity and Vtg3 in males do not support estrogen as a cause of the variation in reproductive development of female E. nigrum in our study. The highest concentrations of E2-EQs in the water were found only at the D-SV and FD-SV sites (10.18–49.3 ng/L) while concentrations at all other sites were lower (<9 ng/L) and showed little variation. Male Vtg3 concentrations somewhat reflected this trend as Vtg3 was up-regulated in males from the site (D-SV) with the highest in vitro estrogenic activity. Because estrogenicity was similar between all BT sites and because the reproductive development at the downstream BT sites was accelerated by two weeks, we can logically deduce that estrogenicity is likely not the cause of this variation in reproductive timing. Given these findings, water quality was not a contributing factor in differences in E. nigrum reproductive development between rivers or between fish upstream and downstream of the WWTP.
Year-round increases in water temperature attributed to climate change and point source pollutants (e.g., powerplant cooling systems) have been shown to accelerate reproductive timing by 2–3 weeks [15]. Particularly, water temperature in the spring immediately prior to spawning is thought to be a spawning cue [14]. However, the spring water temperature was similar among most sampling sites within each river, suggesting variation in reproductive development and onset of spawning is not attributable to variation in spring water temperatures among sites. One exception to this was D-BT, which was significantly warmer than other BT sites during much of our spring sampling period. However, additional logger data (not reported and part of another study) revealed the river had not fully mixed with the effluent at the D-BT logger location. The water temperature on the other side of the channel from the effluent was similar to upstream temperatures [55]. The effluent fully mixed with the main channel ~300 m downstream of the effluent input. Water temperature at this location was similar to the average water temperature on river left and river right of D-BT, and thus may be more representative of the thermal conditions E. nigrum endured there during the winter period. This average WAT was comparable to the WAT at D-SV, and thus still supported our winter water temperature gradient hypothesis. If this hypothesis is true, then WATs at D-BT in the spring period would be similar to those at the other BT sites. Thus, our data suggest that accelerated reproductive development is partially explained by winter water temperatures. Our data also indicate that E. nigrum spawn in April, earlier in South Platte tributaries and at cooler spring temperatures than previously reported [9], and in fact spawn timing and temperature in the South Platte River basin tributaries are comparable to elsewhere in their range [29]. Changes in the thermal regimes of these rivers since Propst and Carlson’s [9] study in the 1980s may have already caused impacts to reproductive timing in native fishes.
Because E. nigrum are fractional spawners, females later in the spawning season usually have early vitellogenic oocytes present and this stage may dominate the gonad immediately post-spawning. The dominance of early vitellogenic oocytes post-spawn has been documented in other small-bodied fractional spawning fish, such as the Fathead Minnow Pimephales promelas (Rafinesque 1820) [51]. Like P. promelas, E. nigrum females sampled later in the spring had predominantly early vitellogenic oocytes in their gonads despite also having post-ovulatory follicles. Thus, after initial vitellogenesis, the comparison of females between sites becomes increasingly difficult to interpret relative to temperature because many mature females are spawning and have highly variable oocyte development.
Curiously, we did not detect any trend in male reproductive development spatially or temporally. In fact, most males captured even in the first week of January were in the most advanced reproductive stage. While we had expected to see at least a small trend in reproductive development temporally as the spring spawning season approached, it is not completely surprising that males were in more consistently advanced reproductive stages across space and time than females. Firstly, our finding of E. nigrum males in more advanced stages of reproductive development throughout the late winter and spring is similar to that described for Black Darter Etheostoma duryi (Henshall 1889) in Alabama [56]. This may be attributed to the fact that gonad development in male fishes requires much less energy than in females [57,58]. Additionally, environmental variables including prey availability are less likely to impact gonad development in males than in females [59]. Thus, though our study provided evidence that female E. nigrum are impacted by warmer winter water temperatures, it is possible that males are not similarly impacted.
Although we documented differences in the initiation of reproduction below WWTPs, the ecological consequences, if any, are unknown. Earlier spawning exposes especially sensitive early life stages of fishes to spring snowstorms and potential declines in water temperature and increases in flow, which may increase mortality. These stochastic events are common in mid-late spring along the Front Range, and we documented rapid drops in temperature associated with a snowstorm in mid-April (weeks 15 and 16) of 2021. Sustained high water temperatures and sudden periods of abnormally low water temperatures can cause follicle atresia, which if severe enough can also impede reproductive output [35]. Though our study did not find severe atresia correlated with water temperature, the increased frequency of extreme weather events due to climate change may be of concern for early spring spawning females and subsequent eggs and larvae. Differences in reproductive timing may also expose young fishes to other deleterious conditions, such as low food supply (i.e., prey mismatch). The potential consequences of accelerated reproductive timing need further research and are beyond the scope of our study.
We observed a 1–2-week acceleration in reproductive development in warm water below WWTP relative to upstream sites. This acceleration is substantially shorter than that seen in laboratory studies. In the laboratory, warm over-winter water temperatures shifted spawn timing by two months and fish spawned as early as February [5,23]. However, winter water temperatures in those studies were greater than in our impacted systems (12–20 °C vs. ≤11.5 °C, respectively) and fish in our field study had the opportunity to behaviorally seek out thermal refugia. Controlled laboratory studies have documented negative effects of estrogen on reproductive phenology and biology of fishes at concentrations lower than the E2-EQ we measured at D-SV and FD-SV, including the cessation of spawning by females and the delayed onset of spawning [32,60,61], that we did not observe. However, it should be noted that not all estrogenic activity detected in the in vitro assay may be bioavailable in situ. The significantly lower Vtg3 mRNA abundance in males from the FD-SV site, relative to those from the D-SV site, despite similar levels of E2-EQ on week 16 suggests that other field-related factors (including potentially the difference in site temperature) are impacting either availability of, or response to, estrogens present in the water. The disparity between laboratory and field studies should be heeded in future investigations designed to understand the role of temperature in fish reproduction. Obviously, laboratory studies are more controlled but do not have the ecological realism of field studies and the difference between laboratory and field studies should be carefully considered when making management decisions.

5. Conclusions

Making direct inferences regarding the relationship between temperature and reproductive development is difficult using field data because of confounding factors common in field investigations [62]. However, we believe our study provides evidence that increased winter water temperature is correlated with accelerated reproductive development of female E. nigrum, and this is consistent with laboratory studies though at a smaller magnitude. We did not see any appreciable differences in water quality or fish gonadal histology that would otherwise explain the differences in reproductive timing. While it is possible other non-monitored variables may contribute to the patterns we observed, temperature is highly influential for all biological functions in fish [12,63] and we believe the accelerated reproductive development in female E. nigrum was directly correlated with abnormally high winter water temperatures.

Supplementary Materials

The following supporting information can be downloaded at: https://www.mdpi.com/article/10.3390/fishes7060361/s1, Table S1: Primers designed for Orangethroat Darters, Vtg3; Table S2: Johnny Darter specific qPCR primers designed based on partial Vtg3 sequence (List S3); Table S3: 17β–estradiol equivalents (E2–EQs, ng/L) displayed as mean (±SD) at each site during each sampling event. Mean ± SD derived using n= 3–6 technical replicates per sample. The U–SV* water sample on week 12/13 was taken independently of fish sampling because the site was not established for fish collection until week 14. N/A = Not applicable (did not sample); Table S4: The number of individuals of Johnny Darter Etheostoma nigrum sampled in 2020 and 2021; Table S5: Johnny Darter Etheostoma nigrum sampling summary for 2020 and 2021 at sites on the Big Thompson River (BT). Upstream and Downstream are in reference to the sampling site’s location to the WWTP effluent input into the river; Table S6: Johnny Darter Etheostoma nigrum sampling summary for 2020 and 2021 at sites on St. Vrain Creek (SV). Upstream and Downstream are in reference to the sampling site’s location to the WWTP effluent input into the river; Table S7: Johnny Darter Etheostoma nigrum sampling summary for 2020 and 2021 at sites on the Cache la Poudre River (CP); Table S8: Description of gonad developmental staging according to OECD used to stage male Johnny Darter Etheostoma nigrum collected in our study. Table adapted from Johnson et al. 2009 [47]; Table S9: Average concentrations of NNPs and PPCPs at Cache la Poudre (CP), Big Thompson (BT), and St. Vrain (SV) sampling sites during the pre–spawn and spawn sample collections in March and April of 2021. NNPs are in µg/L and PPCPs are in ng/L; Figure S1: Proportions of males in each reproductive stage sampled each week during the spawning season in 2021 at the (a) the BT and (b) SV far upstream (FU), upstream (U), downstream (D), and far downstream (FD) sites, and the (c) CP site. Stages were assigned using OECD guidelines [47]. Red highlighted columns indicate sites subject to warmer overwinter water temperatures (downstream of the WWTP) and blue highlighted columns indicate sites subject to cooler overwinter water temperatures (upstream of the WWTP) on the SV and BT. The SV was not sampled during week 12, BT and CP were not sampled during week 13, and only BT was sampled during week 18 due to high flows elsewhere. The U–SV site was not established until week 14. No males were sampled at FU or U-BT week 17. Figure S2: Nutrient concentrations at all study sites. If a site is missing on the figure, that nutrient was not detected at that site. The y-axis is transformed for graphical comparison. References [64,65,66,67,68] are cited in the supplementary materials.

Author Contributions

Conceptualization, C.M.A., D.L.W., R.M.F. and D.L.V.; methodology, C.M.A., D.L.W. and P.A.S.; software, C.M.A.; validation, C.M.A., D.L.W. and P.A.S.; formal analysis, C.M.A., P.A.S. and J.E.C.; investigation, C.M.A., D.L.W., P.A.S., M.E. and K.S.R.; resources, D.L.W., P.A.S. and R.M.F.; data curation, C.M.A., P.A.S. and J.E.C.; writing—original draft preparation, C.M.A.; writing—review and editing, C.M.A., D.L.W., P.A.S., R.M.F., D.L.V., J.E.C. and M.E.; visualization, C.M.A.; supervision, D.L.W., R.M.F. and D.L.V.; project administration, D.L.W. and R.M.F.; funding acquisition, D.L.W. and R.M.F. All authors have read and agreed to the published version of the manuscript.

Funding

This research was funded by Colorado Parks and Wildlife, Species Conservation Trust Fund Project Number SCA807.

Institutional Review Board Statement

The animal study protocol was approved by the Institutional Animal Care and Use Committee of Colorado State University (protocol code 1164 approved 25 August 2020).

Informed Consent Statement

Not applicable.

Data Availability Statement

The datasets used and/or analyzed during the current study are available from the corresponding author on reasonable request.

Acknowledgments

We thank Colorado Parks and Wildlife (CPW) and the City of Longmont for providing funding and contributions to this report. Additionally, CPW and the Colorado Department of Public Health and the Environment (CDPHE) provided valuable discussion and field aid. We appreciate the PPCP and NNP analytical contributions provided by the U.S. Environmental Protection Agency’s Region 8 Water Quality Laboratory. Andy Treble and Mindi May of CPW provided valuable temperature logger deployment advice and aid. The City of Loveland graciously provided access to their natural areas, a tour of their WWTP, and interest in our project. Substantial field and laboratory contributions were made by many volunteers and technicians from the Fish, Wildlife, and Conservation Biology Department at Colorado State University, CPW, and the Cooperative Fish and Wildlife Research Unit, including Tawni Riepe, Rebecca McDevitt, Ben Applegate, Ryan Friebertshauser, Audrey Harris, Brian Avila, Brie Cranor, Jimmy Kainz, and Kelly Carlson among others, of which we are greatly appreciative. Katherine McMurdo, Todd Bass, and additional staff of the Histology Lab at the Colorado State University Veterinary Diagnostic Laboratory provided invaluable technical support in processing fish for histologic review. We thank Nicki Evans and Elizabeth Medlock Kakaley (US EPA, RTP) for providing the T47D-KBluc cells used for the in vitro bioassays. We thank Emma Stacy (US EPA) and Christopher A. Myrick (CSU) for providing valuable feedback on an earlier draft of this manuscript. This manuscript has been reviewed in accordance with official U.S. EPA policy, and conclusions drawn in this study neither constitute nor reflect the view or policies of the U.S. EPA. Any use of trade, firm, or product names is for descriptive purposes only and does not imply endorsement by the U.S. Government.

Conflicts of Interest

The authors declare no conflict of interest. The funders had no role in the design of the study; in the collection, analyses, or interpretation of data; in the writing of the manuscript; or in the decision to publish the results.

References

  1. Brett, J.R. Some principles in the thermal requirements of fishes. Q. Rev. Biol. 1956, 31, 75–87. [Google Scholar] [CrossRef]
  2. Bestgen, K.R.; Williams, M.A. Effects of fluctuating and constant temperatures on early development and survival of Colorado Squawfish. Trans. Am. Fish. Soc. 1994, 123, 574–579. [Google Scholar] [CrossRef]
  3. Hester, E.T.; Doyle, M.W. Human impacts to the river temperature and their effects on biological processes: A quantitative synthesis. J. Am. Water. Resour. Assoc. 2011, 47, 571–587. [Google Scholar] [CrossRef]
  4. Farmer, T.M.; Marschall, E.A.; Dabrowski, K.; Ludsin, S.A. Short winters threaten temperate fish populations. Nat. Commun. 2015, 6, 7724. [Google Scholar] [CrossRef] [PubMed] [Green Version]
  5. Firkus, T.; Rahel, F.J.; Bergman, H.L.; Cherrington, B.D. Warmed winter water temperatures alter reproduction in two fish species. Environ. Manag. 2018, 61, 291–303. [Google Scholar] [CrossRef]
  6. Jones, B.R.; Hokanson, K.E.F.; McCormick, J.H. Winter temperature requirements for maturation and spawning of yellow perch Perca flavescens (Mitchill). In Biological Balance and Thermal Modification; Marios, M., Ed.; Pergamon Press: Oxford, UK, 1972; Volume 3, pp. 189–192. [Google Scholar]
  7. De Vlaming, V.L. Effects of photoperiod and temperature on gonadal activity in the cyprinid teleost Notemigonus crysoleucas. Biol. Bull. 1975, 148, 402–415. [Google Scholar] [CrossRef]
  8. McCormick, J.H.; Jones, B.R.; Hokanson, K.E. White sucker (Catostomus commersoni) embryo development, and early growth and survival at different temperatures. J. Fish. Board Can. 1977, 34, 1019–1025. [Google Scholar] [CrossRef]
  9. Propst, D.L.; Carlson, C.A. Life History Notes and Distribution of the Etheostoma nigrum (Percidae), in Colorado. Southwest Nat. 1989, 34, 250–259. [Google Scholar] [CrossRef]
  10. Clarkson, R.W.; Childs, M.R. Temperature effects of hypolimnial–release dams on early life stages of Colorado River basin big–river fishes. Copeia 2000, 2000, 402–412. [Google Scholar] [CrossRef]
  11. Pankhurst, N.W.; Porter, M.J.R. Cold and dark or warm and light: Variations on the theme of environmental control of reproduction. Fish Physiol. Biochem. 2003, 28, 385–389. [Google Scholar] [CrossRef]
  12. Pankhurst, N.W.; Munday, P.L. Effects of climate change on fish reproduction and early life history stages. Mar. Freshw. Res. 2011, 62, 1015–1026. [Google Scholar] [CrossRef] [Green Version]
  13. Starzynski, D.; Lauer, T.E. How temperature affects timing and duration of yellow perch spawning in the Indian waters of Lake Michigan. J. Freshw. Ecol. 2015, 30, 445–453. [Google Scholar] [CrossRef]
  14. Fraser, G.S.; Bestgen, K.R.; Winkelman, D.L.; Thompson, K.G. Temperature—not flow—Predicts native fish reproduction with implications for climate change. Trans. Am. Fish. Soc. 2019, 148, 509–527. [Google Scholar] [CrossRef] [Green Version]
  15. White, D.P.; Colombo, R.E.; Wahl, D.H. Persistently warmer temperature lead to life history changes in bluegill sunfish (Lepomis macrochirus). Envirn. Bio. Fish. 2020, 103, 1165–1177. [Google Scholar] [CrossRef]
  16. Burton, T.M.; Likens, G.E. Effect of strip–cutting on stream temperatures in Hubbard Brook Experimental Forest, New Hampshire. BioScience 1973, 23, 433–435. [Google Scholar] [CrossRef]
  17. Nelson, K.; Palmer, M.A. Predicting stream temperature under urbanization and climate change: Implications for stream biota. J. Am. Water Resour. Assoc. 2007, 43, 440–452. [Google Scholar] [CrossRef]
  18. Webb, B.W.; Nobilis, F. Long–term changes in river temperature and the influence of climatic and hydrologic factors. Hydrol. Sci. J. 2007, 52, 74–85. [Google Scholar] [CrossRef]
  19. Kinouchi, T.; Yagi, H.; Miyamoto, M. Increase in stream temperature related to anthropogenic heat input from urban wastewater. J. Hydrol. 2007, 335, 78–88. [Google Scholar] [CrossRef]
  20. Graham, J.L.; Stone, M.L.; Rasmussen, T.J.; Foster, G.M.; Poulton, B.C.; Paxson, C.R.; Harris, T.D. Effects of Wastewater Effluent Discharge and Treatment Facility Upgrades on Environmental and Biological Conditions of Indian Creek, Johnson County, Kansas, June 2004 through June 2013. U.S. Geological Survey Scientific Investigations Report 2014–5187. 2014. Available online: https://doi.org/10.3133/sir20145187 (accessed on 28 November 2022).
  21. Tuncay, E. The Effect of Wastewater Treatment Plant Effluent on Water Temperature, Macroinvertebrate Community, and Functional Feeding Groups Structure in the Lower Rouge River, Michigan. Master’s Thesis, University of Michigan, Dearborn, MI, USA, 2016. [Google Scholar]
  22. Lewis, W.M.; McCutchan, J.H. Regulatory temperature compliance for the South Platte River downstream of the Metro District R. W. Hite Treatment Facility (RWHTF). Metro Wastewater Reclamation District Report 326. 2012. [Google Scholar]
  23. Baum, C.M. Temperature and Winter Duration Requirements for Reproductive Success in Johnny Darter Etheostoma nigrum in the South Platte River Basin, Colorado. Master’s Thesis, Colorado State University, Fort Collins, CO, USA, 2021. [Google Scholar]
  24. U.S. Census Bureau. COLORADO: 2020 Census. 2020. Available online: https://www.census.gov/library/stories/state–by–state/colorado–population–change–between–census–decade.html (accessed on 1 September 2022).
  25. CDPHE. Regulation No. 38-Classifications and Numeric Standards for South Platte River Basin, Laramie River Basin, Republican River Basin, Smoky Hill River Basin; Colorado Department of Public Health and the Environment: Denver, CO, USA, 2020. [Google Scholar]
  26. Woodling, J.D. Colorado’s Little Fish: A Guide to the Minnows and Other Lesser Known Fishes in the State of Colorado; Colorado Division of Wildlife: Denver, CO, USA, 1985. [Google Scholar]
  27. Zuellig, R.E.; Sprague, L.A.; Collins, J.A.; Cox, O.N. Aquatic Communities and Selected Water Chemistry in St. Vrain Creek Near the City of Longmont, Colorado, Wastewater–Treatment Plant, 2005 and 2006: U.S. Geological Survey Data Series 253. 2007. Available online: https://doi.org/10.3133/ds253 (accessed on 28 November 2022).
  28. Page, L.M.; Burr, B.M. Peterson Field Guide to Freshwater Fishes of North America and Mexico, 2nd ed.; Houghton Mifflin Harcourt: New York, NY, USA, 1991. [Google Scholar]
  29. Becker, G.C. Fishes of Wisconsin; University of Wisconsin Press: Madison, WI, USA, 1983; Available online: http://digital.library.wisc.edu/1711.dl/EcoNatRes.FishesWI (accessed on 14 April 2022).
  30. Propst, D.L. Warm Water Fishes of the Platte River Basin, Colorado; Distribution, Ecology, and Community Dynamics. Ph.D. Thesis, Colorado State University, Fort Collins, CO, USA, 1982. [Google Scholar]
  31. Overturf, M.D.; Anderson, J.C.; Pandelides, Z.; Beyger, L.; Holdway, D. Pharmaceuticals and personal care products: A critical review of the impacts on fish reproduction. Crit. Rev. Toxicol. 2015, 45, 469–491. [Google Scholar] [CrossRef]
  32. Schäfers, C.; Teigeler, M.; Wenzel, A.; Maack, G.; Fenske, M.; Segner, H. Concentration- and Time-dependent Effects of the Synthetic Estrogen, 17α- ethinylestradiol, on Reproductive Capabilities of the Zebrafish, Danio rerio. J. Toxicol. Environ. Health Part A 2007, 70, 768–779. [Google Scholar] [CrossRef]
  33. Länge, R.; Hutchinson, T.H.; Croudace, C.P.; Siemund, F.; Schweinfurth, H.; Hampe, P.; Panter, G.H.; Sumpter, J.P. Effects of the synthetic estrogen 17α- ethinylestradiol on the life-cycle of the Fathead Minnow (Pimephales promelas). Environ. Tox. Chem. 2001, 20, 1216–1227. [Google Scholar] [CrossRef] [Green Version]
  34. Brain, J.V.; Harris, C.A.; Scholze, M.; Kortenkamp, A.; Booy, P.; Lamoree, M.; Pojana, G.; Jonkers, N.; Marcomini, A.; Sumpter, J.P. Evidence of estrogenic mixture effects on the reproductive performance of fish. Environ. Sci. Technol. 2007, 41, 337–344. [Google Scholar] [CrossRef] [Green Version]
  35. Corriero, A.; Zupa, R.; Mylonas, C.C.; Letizia, P. Atresia of ovarian follicles in fishes, and implications and used in aquaculture and fisheries. J. Fish Dis. 2021, 44, 1271–1291. [Google Scholar] [CrossRef] [PubMed]
  36. Woodling, J.D.; Lopez, E.M.; Maldonado, T.A.; Norris, D.O.; Vajda, A.M. Intersex and other reproductive disruption of fish in wastewater effluent dominated Colorado Streams. Comp. Biochem. Phys. Part C 2006, 144, 10–99. [Google Scholar] [CrossRef]
  37. Adams, C.M. Colorado Cooperative Fish and Wildlife Research Unit; Colorado State University: Fort Collins, CO, USA, 2020; Unpublished data. [Google Scholar]
  38. USGS. Big Thompson River. Geographic Names Phase I Data Compilation (1976–1981), United States Geological Survey, Feature ID: 205019. 1981. Available online: https://edits.nationalmap.gov/apps/gaz-domestic/public/summary/205019 (accessed on 5 May 2022).
  39. USGS. Saint Vrain Creek. Geographical Names Phase I Data Compilation (1976–1981), United States Geological Survey, Feature ID: 205012. 1981. Available online: https://edits.nationalmap.gov/apps/gaz-domestic/public/summary/205012 (accessed on 5 May 2022).
  40. USGS. Cache la Poudre River. Geographic Names Post Phase I Board/Staff Revisions, United States Geological Survey, Feature ID: 205018. 2000. Available online: https://edits.nationalmap.gov/apps/gaz–domestic/public/summary/205018 (accessed on 5 May 2022).
  41. Eisenhour, D.; Washburn, B.A. Long–distance movements of six darters (Teleostei: Percidae) in the Red River, Kentucky. J. Ky. Acad. Sci. 2016, 77, 19–24. [Google Scholar] [CrossRef]
  42. Smith, R.K.; Fausch, K.D. Thermal tolerance and vegetation preference of Arkansas Darter and Johnny Darter from Colorado plains streams. Trans. Am. Fish Soc. 1997, 126, 676–686. [Google Scholar] [CrossRef]
  43. Kassambara, A. rstatix: Pipe–Friendly Framework for Basic Statistical Tests. R Package Version 0.7.0. 2021. Available online: https://CRAN.R–project.org/package=rstatix (accessed on 15 March 2022).
  44. Schenker, N.; Gentleman, J.F. Judging the significance of differences by examining the overlap between confidence intervals. Am. Stat. 2001, 55, 182–186. [Google Scholar] [CrossRef]
  45. U.S. Environmental Protection Agency, EPA Region 8 Laboratory. Determination of Pharmaceuticals and Personal Care Products (PPCPs) in Water by Direct Aqueous Injection UHPLC and LC/MS/MS; Technical Standard Operating Procedure: Lakewood, CO, USA, 2019. [Google Scholar]
  46. U.S. Environmental Protection Agency, EPA Region 8 Laboratory. Automated Determination of Nitrate-Nitrogen, Nitrite-Nitrogen, and Orthophosphate-Phosphorus Using the Lachat QC 8500 Flow Injection Autoanalyzer; Technical Standard Operating Procedure: Lakewood, CO, USA, 2019. [Google Scholar]
  47. Johnson, R.; Wolf, J.; Braunbreck, T.; OECD Guidance Document for the Diagnosis of Endocrine–Related Histopathology of Fish Gonads. OECD Environment, Health, and Safety Publications, Series on Testing and Assessment No. 123. 2009. Available online: http://www.oecd.org/chemicalsafety/testing/42135693.doc (accessed on 8 August 2020).
  48. U.S. Environmental Protection Agency. Histopathology Guidelines for the Fathead Minnow (Pimephales promelas) 21–Day Reproduction Assay. Duluth, MN, USA; 2006. Available online: https://nepis.epa.gov/Exe/ZyPDF.cgi/P100N3BN.PDF?Dockey=P100N3BN.PDF (accessed on 28 November 2022).
  49. Rueden, C.T.; Schindelin, J.; Hiner, M.C.; DeZonia, B.E.; Walter, A.E.; Arena, E.T.; Eliceiri, K.W. ImageJ2: ImageJ for the Next Generation of Scientific Image Data. BMC Bioinformatics, 18. 2017. Available online: https://imagej.nih.gov/ij/ (accessed on 7 June 2020).
  50. Óskarsson, G.J.; Kjesbu, O.S.; Slotte, A. Predictions of realized fecundity and spawning time in Norwegian spring–spawning herring (Clupea harengus). J. Sea Res. 2002, 48, 59–79. [Google Scholar] [CrossRef]
  51. Leino, R.L.; Jensen, K.M.; Ankley, G.T. Gonadal histology and characteristics histopathology associated with endocrine disruption in adult Fathead Minnow (Pimephales promelas). Environ. Toxicol. Pharmacol. 2005, 19, 85–98. [Google Scholar] [CrossRef]
  52. Borg, B.; Veen, T.V. Seasonal effects of photoperiod and temperature on the ovary of Three–Spined Stickleback, Gasterosteus aculeatus L. Can. J. Zool. 1982, 60, 3387–3393. [Google Scholar] [CrossRef]
  53. Blazer, V. Histopathological assessment of gonadal tissue in wild fishes. Fish Physiol. Biochem. 2002, 26, 85–101. [Google Scholar] [CrossRef]
  54. Adams, C.M. Colorado Cooperative Fish and Wildlife Research Unit; Colorado State University: Fort Collins, CO, USA, 2022; Unpublished data. [Google Scholar]
  55. Adams, C.M.; Winkelman, D.L.; Fitzpatrick, R.F. Impact of Wastewater Treatment Plant Effluent on the Winter Thermal Regime of Two Urban South Platte Tributaries; Colorado Parks and Wildlife: Fort Collins, CO, USA, 2022. [Google Scholar]
  56. Stallsmith, B.; Bedingfield, R. Reproductive development in the Black Darter (Etheostoma duryi). J. Alab. Aca. Sci. 2015, 86, 15–28. [Google Scholar]
  57. Bowerman, T.E.; Pinson-Dumm, A.; Peery, C.A.; Caudill, C.C. Reproductive energy expenditure and changes in body morphology for a population of Chinook salmon Oncorhynchus tshawytscha with a long distance migration. J. Fish Biol. 2017, 90, 1960–1979. [Google Scholar] [CrossRef] [PubMed]
  58. Encina, L.; Granado-Lorencio, C. Seasonal changes in condition, nutrition, gonad maturation and energy content in barrel, Barbus sclateri, inhabiting a fluctuating river. Environ. Biol. Fish. 1997, 50, 75–84. [Google Scholar] [CrossRef]
  59. Bunnel, D.B.; Thomas, S.E.; Stein, R.A. Prey Resources before spawning influence gonadal investment of female, but not male, White Crappie. J. Fish Biol. 2007, 70, 1838–1854. [Google Scholar] [CrossRef] [Green Version]
  60. Maack, G.; Segner, H. Life-stage-dependent sensitivity of zebrafish (Danio rerio) to estrogen exposure. Comp. Biochem. Phys. Part C 2004, 139, 47–55. [Google Scholar] [CrossRef]
  61. Segner, H.; Caroll, K.; Fenske, M.; Janssen, C.R.; Maack, G.; Pascoe, D.; Schafers, C.; Vandenbergh, G.F.; Watts, M.; Wensel, A. Identification of endocrine–disrupting effects in aquatic vertebrates and invertebrates: Report from the European IDEA project. Ecotox. Environ. Saf. 2003, 54, 302–314. [Google Scholar] [CrossRef] [PubMed]
  62. MacKenzie, B.R. Turbulence, larval fish ecology and fisheries recruitment: A review of field studies. Oceanol. Acta 2000, 23, 357–375. [Google Scholar] [CrossRef]
  63. Volkoff, H.; Rønnestad, I. Effects of temperature on feeding and digestive processes in fish. Temperature 2020, 7, 30–320. [Google Scholar] [CrossRef] [PubMed]
  64. National Center for Biotechnology Information (NCBI) [Internet]. Bethesda (MD): National Library of Medicine (US), National Center for Biotechnology Information [1988]. 2022. Available online: https://www.ncbi.nlm.nih.gov/protein (accessed on 29 April 2022).
  65. The UniProt Consortium. UniProt: The Universal Protein Knowledgebase in 2021. Nucleic Acids Res. 2020, 49, D480–D489. [Google Scholar] [CrossRef]
  66. National Center for Biotechnology Information (NCBI). Gene [Internet]. Bethesda (MD): National Library of Medicine (US), National Center for Biotechnology Information [1988]. Gene ID: 116695776, Vtg3 Vitellogenin 3, Phosvitinless [Etheostoma spectabile (Orangethroat Darter)]. 2021. Available online: https://www.ncbi.nlm.nih.gov/gene/116695776 (accessed on 29 April 2022).
  67. Wilson, V.S.; Bobseine, K.; Gray, L.E. Development and characterization of a cell line that stably expresses an estrogen-responsive luciferase reporter for the detection of estrogen receptor agonist and antagonists. Toxicol. Sci. 2004, 81, 69–71. [Google Scholar] [CrossRef] [PubMed]
  68. Wagner, M.; Vermeirssen, E.L.M.; Buchinger, S.; Behr, M.; Magdeburg, A.; Oehlmann, J. Deriving bio-equivalents from in vitro bioassays: Assessment of existing uncertainties and strategies to improve accuracy and reporting. Environ. Toxicol. Chem. 2013, 32, 1906–1917. [Google Scholar] [CrossRef] [PubMed]
Figure 1. Sampling site for Johnny Darter Etheostoma nigrum in 2021 on the Big Thompson River (BT), St. Vrain Creek (SV), and the Cache la Poudre River (CP) on the Front Range in Northern Colorado. Gray areas indicate the extent of maps below it, or river reaches sampled. Stars indicate sampling locations and triangles indicate wastewater treatment plant (WWTP) effluent input. FU refers to far upstream, U to upstream, D to downstream, and FD to far downstream sampling sites in relation to the WWTP effluent input.
Fishes 07 00361 g001
Figure 2. Examples of (a) previtellogenic, (b) early vitellogenic, and (c) late vitellogenic stages of ovaries. (d) spawning gonad with hydrated oocytes, post-ovulatory follicles and the next generation of oocytes at early vitellogenesis. The scale bars represent 500 μm.
Fishes 07 00361 g002
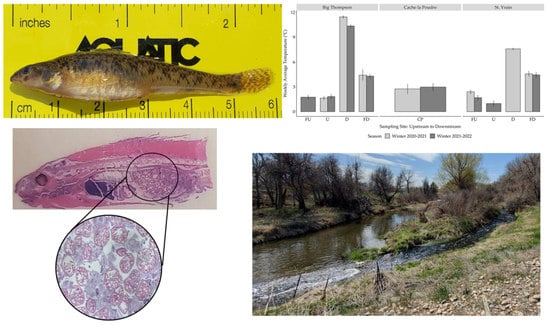
Figure 3. Mean weekly average temperatures in the winter season (December–February) at the Cache la Poudre (CP) and the Big Thompson and St. Vrain far upstream (FU), upstream (U), downstream (D), and far downstream (FD) sites in winter 2020–2021 and 2021–2022. The FU site on the Big Thompson was not established for temperature monitoring until spring 2021. The weekly average temperature was similar within sites each winter. Error bars represent 95% confidence intervals.
Fishes 07 00361 g003
Figure 4. Weekly average temperatures for each week sampling occurred in spring of 2021 at the Cache la Poudre (CP) site, and the Big Thompson and St. Vrain far upstream (FU), upstream (U), downstream (D), and far downstream (FD) sites. The solid horizontal line represents previously documented spawning temperatures for Johnny Darter Etheostoma nigrum in Colorado (17 °C) [9] and the dashed line represents the coolest spawning temperature recorded elsewhere in their range (11.7 °C) [29]. Spring 2021 temperatures were not recorded at FU site on the Big Thompson due to its recent site establishment. No water temperature data at the CP site were recorded for weeks 12 and 13 due to logger error. Weeks 12–18 of 2021 occur during the last two weeks in March through the first week in May. Error bars represent 95% confidence intervals.
Fishes 07 00361 g004
Figure 5. Principal component analysis of pesticides and personal care products (PPCPs) and nutrients (NNPs) detected at each site during the (a) pre-spawn (weeks 12–13), (b) spawn (week 16), and (c) post-spawn (weeks 32 and 41) sampling periods. (d) PCA on the average concentration of detected chemicals at each site during 2021. “N” refers to the number of PPCPs and NNPs detected across all sites during that sampling occasion.
Fishes 07 00361 g005
Figure 6. 17β-estradiol equivalents (E2-EQs, ng/L) at the Cache la Poudre (CP) and the Big Thompson and St. Vrain far upstream (FU), upstream (U), downstream (D), and far downstream (FD) sites displayed as mean at each site during each sampling event. Water samples were collected prior to sampling weeks 12/13, 16, 32, and 41. The water sample from the U site on the St. Vrain on week 12/13 was taken independently of fish sampling because the site was not established for fish collection until week 14. High flows prevented the sampling of the Big Thompson on week 32, which was delayed until week 41. Mean derived using n = 3–6 technical replicates per sample. Error bars represent means + SD.
Fishes 07 00361 g006
Figure 7. Mean relative abundance of Vtg3 mRNA transcripts (relative number of copies, normalized) in the liver of male Johnny Darters Etheostoma nigrum collected at the Cache la Poudre (CP) and the Big Thompson and St. Vrain far upstream (FU), upstream (U), downstream (D), and far downstream (FD) sites on weeks 12, 13, 16, 32, and 41. The centerline of each box represents the median, and whiskers represent minimum and maximums. The dashed line indicates the relative abundance of Vtg3 mRNA transcripts detected in pooled female E. nigrum liver RNA samples (analyzed in duplicate).
Fishes 07 00361 g007
Figure 8. (a) Proportions of females sampled from the Big Thompson in March (week 12), April (weeks 14–17), and May (week 18) far upstream (FU), upstream (U), downstream (D), and far downstream (FD) sites that were previtellogenic (Pre), early vitellogenic (Early) or late vitellogenic (Late). (b) The proportion of total females with evidence of recent or incipient spawning activity (mature or post-ovulatory follicles present). All females fall into either the Pre, Early, or Late category but may also have evidence of recent or incipient spawning activity. For example, a female could be classified as early vitellogenic, but may also have post-ovulatory follicles present (evidence of recent spawning activity) because Johnny Darter Etheostoma nigrum are fractional spawners. Red highlighted columns indicate sites subject to warmer overwinter water temperatures (downstream of the WWTP) and blue highlighted columns indicate sites subject to cooler overwinter water temperatures (upstream of the WWTP). The Big Thompson was not sampled on week 13.
Fishes 07 00361 g008
Figure 9. (a) Proportions of females sampled from the St. Vrain in March (week 13) and April (weeks 14–17) far upstream (FU), upstream (U), downstream (D), and far downstream (FD) sites that were previtellogenic (Pre), early vitellogenic (Early) or late vitellogenic (Late). (b) The proportion of total females with evidence of recent or incipient spawning activity (mature or post-ovulatory follicles present). All females fall into either the Pre, Early, or Late category, but may also have evidence of recent or incipient spawning activity. For example, a female could be classified as early vitellogenic, but may also have post-ovulatory follicles present (evidence of recent or incipient spawning activity) because Johnny Darter Etheostoma nigrum are fractional spawners. Red highlighted columns indicate sites subject to warmer overwinter water temperatures (downstream of the WWTP) and blue highlighted columns indicate sites subject to cooler overwinter water temperatures (upstream of the WWTP). The St. Vrain was not sampled on week 12 or 18, and the U site was not established until week 14.
Fishes 07 00361 g009
Figure 10. Proportions of females afflicted with mild and severe follicle atresia and males with testicular oocytes at the CP site, and the BT and SV far upstream (FU), upstream (U), downstream (D), and far downstream (FD) sites. Error bars represent 95% confidence intervals. Severe atresia refers to females where follicle atresia affected >75% of vitellogenic follicles. Horizontal lines at 0 represent that no sampled fish had follicular atresia. For example, female Johnny Darter Etheostoma nigrum were sampled at CP, but none had severe atresia.
Fishes 07 00361 g010
Table 1. The sampling dates for Johnny Darters Etheostoma nigrum in 2021. To limit temporal variability, we sampled each river within the same week on most occasions. All sites were sampled within 8 h of each other on a sampling day. One exception is week 13 on the St. Vrain where D and FD were sampled on the 29th and U and FU were sampled on the 30th of March. Sampling was still conducted at all sites in less than 24 h. Sampling was clustered just prior to the spawning season to determine differences in reproductive development between sites.
RiverWeek of the Year 2021
15121314151617183241
Big Thompson5 January4 February23 March-6 April13 April21 April28 April6 May-11 October
St. Vrain-2 February-29 March7 April12 April19 April26 April-9 August-
30 March
Cache la Poudre5 January-22 March-6 April13 April20 April28 April-10 August-
Table 2. Total number of female, male, and unknown sex Johnny Darters Etheostoma nigrum captured each week during the spring sampling period in 2021.
SexWeekCache la PoudreBig Thompson RiverSt. Vrain Creek
CPFU-BTU-BTD-BTFD-BTFU-SVU-SVD-SVFD-SV
F12151010108----
M482612----
unk21020----
F13-----12-1211
M-----8-84
unk-----0-00
F141065101013131110
M8959107787
unk210100012
F151013811151311139
M773946969
unk300011012
F16111531261112118
M65381287910
unk2000211--
F171322127131281
M500737811
unk200110000
F18-1714115----
M-3698----
unk-0000----
F32-----25-10
M-----10-0
unk-----01-10
F41-5070----
M-3111----
unk-0011----
Publisher’s Note: MDPI stays neutral with regard to jurisdictional claims in published maps and institutional affiliations.