Article

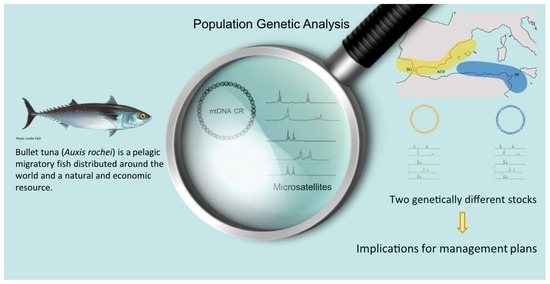
Larval Retention and Homing Behaviour Shape the Genetic Structure of the Bullet Tuna (Auxis rochei) in the Mediterranean Sea

1
Laboratori d’Ictiologia Genètica, Departament de Biologia, Universitat de Girona, 17003 Girona, Spain
2
Instituto Español de Oceanografía (IEO-CSIC), Centro Oceanográfico de Murcia, Puerto de Mazarrón, 30860 Murcia, Spain
3
Instituto Español de Oceanografía (IEO-CSIC), Centro Oceanográfico de Málaga, 29640 Fuengirola, Spain
*
Author to whom correspondence should be addressed.
Fishes 2022, 7(5), 300; https://doi.org/10.3390/fishes7050300
Submission received: 19 September 2022 / Revised: 11 October 2022 / Accepted: 17 October 2022 / Published: 21 October 2022
(This article belongs to the Special Issue Population Genetics and Conservation of Fishes)

Abstract

:
Background: The bullet tuna (Auxis rochei) is an epipelagic fish with a worldwide distribution that is highly targeted by fisheries. Genetic diversity and population genetics are good indicators of population structure and thus, essential tools for fisheries management. Knowing which factors (biotic and abiotic) might be shaping such structure is crucial for management plans. In the present study, we assessed the population structure of the bullet tuna in the western and central Mediterranean Sea. Methods: We used two types of genetic data: the mitochondrial DNA control region and seven microsatellite loci. The analysis of 431 sequences with a length of 386 bp from the mtDNA CR and the results from 276 individuals were genotyped by seven microsatellite loci. Results: Both types of markers coincided in showing significant genetic differences between an Iberian Peninsula–Strait of Gibraltar stock in comparison with a North African stock. Conclusions: We argue that this differentiation pattern is likely caused by reproductive strategies such as coastal spawning, larval retention, and natal homing behavior. These results should endorse the implementation of management plans for a resource that currently is not being managed. Thus, to ensure sustainability, these new policies should consider the presence of at least two genetically identified stocks.

Graphical Abstract

1. Introduction

For more than four decades, population genetics has proven to be a useful tool in the management of fisheries. Its contributions have ranged from species identification to assessment of the stock structure and analysis of mixed stocks [1,2]. In addition, the knowledge of genetic variation within and among populations is crucial for inferring the strategies for both short- and long-term conservation of populations and species. The assessment of population structure for marine organisms, especially pelagic fish, is challenging. First, because of the biological characteristics of these organisms, such as migratory behaviour, long lifespan, large population sizes and pelagic larval stages. Second, due to marine habitat features, including the apparent lack of physical barriers and the potential homogenising effect of the marine currents [3,4]. It was thought that these characteristics would impede the genetic differentiation of marine populations [3,4]. On the contrary, several biotic and abiotic factors contribute to the phylogeographical distribution of the populations and their genetic structure: (i) historical factors, such as paleogeographical changes in the sea levels and other physicochemical characteristics that could isolate, or in the worst case, drive some populations to extinction; (ii) phylogeographical discontinuities originated by oceanic fronts or oceanic gyres that promote local retention and self-recruitment of the larvae; and (iii) species life-history traits and strategies, such as duration of larval stages, coastal spawning and natal homing behaviours [3,5,6,7]. Thus, the research is aimed not only at identifying the population structure itself but also the seascape features that may shape the population structure which are also critical for the survival and adaptation of populations [8]. Finally, all this information is essential for developing proper management plans for these populations/species [9].
Scombridae is one of the families that most challenges the study of population structure in marine habitats. Despite their preference for the pelagic zone, large population sizes and migratory behaviour, there are several examples of population structure in the species of this family. Probably the most known case is the Atlantic bluefin tuna (Thunnus thynnus), with two genetically different stocks in the western and the eastern Atlantic Ocean [10,11,12,13]. A similar situation of amphi-Atlantic differentiation was described for the Atlantic bonito (Sarda sarda), the albacore (Thunnus alalunga) and the swordfish (Xiphias gladius) [14,15,16]. Within the Mediterranean Sea, examples of population structure also occur in the Atlantic bluefin tuna, the Atlantic bonito and the Atlantic mackerel (Scomber scombrus) [17,18,19]. The population structure of these species is related to contemporary factors including ocean currents that would affect the dispersion of young of the year individuals, paleo-historical factors that could shape the genetic discontinuities, and life-history traits such as larval retention and homing behaviour, among others.
Bullet tuna (Auxis rochei) (Risso, 1810), one of the members of the Scombridae family, is an epipelagic neritic and cosmopolitan species with a worldwide distribution [20]. Together with the Atlantic bonito, bullet tuna is the most abundant small tuna species in the Mediterranean Sea [21]. It is largely targeted by traditional fisheries and, in some regions of the Mediterranean, its exploitation was regulated as a protected geographical indication [22]. Collette and Aadland [23] already warned about the possibility of over-exploitation of the populations of the genus Auxis. This trend was confirmed when the maximum captures in the Mediterranean Sea in 2010 were followed by a progressive decline in its abundance in the subsequent years [24]. However, no guidelines were proposed to regulate the exploitation of this resource in the Atlantic and Mediterranean. Due to its economic importance and also because of the limited knowledge of the biology of this species, the International Commission of the Conservation of Atlantic Tunas (ICCAT) has identified the bullet tuna as one of the target species in its 2022–2024 research program agenda [25].
Previous population genetic studies have proved the existence of two different mitochondrial clades within the bullet tuna distribution. Mitotype I being present in both the Pacific and Atlantic Oceans, and mitotype II with two different lineages, one restricted to the Pacific (Pac Mitotype II) and the other restricted to the Atlantic Ocean and Mediterranean Sea (MA Mitotype II) [26,27]. A preliminary study using microsatellite markers showed differentiation between the Mediterranean and the Atlantic Ocean and between the western and central Mediterranean. Although, in the same study, a lack of heterogeneity between the Atlantic Ocean and the Mediterranean Sea was found using the mitochondrial DNA control region marker (mtDNA CR) [28]. Authors attributed these discrepancies to the low number of individuals when using the mitochondrial marker. Unfortunately, the conclusions reported in this study give rise to some concern because of the contradictory results between mtDNA and microsatellite markers and the scarceness in describing the statistical analysis and results. In a local study using the mtDNA CR marker, no genetic heterogeneity was found between bullet tuna surrounding the Strait of Sicily [29]. Despite these preliminary attempts to understand the stock structure of this species in the Mediterranean, the population structure of bullet tuna in this region is still poorly understood. How many populations inhabit the Mediterranean Sea, whether there are discontinuities that segregate bullet tuna individuals, and which factors produce such discontinuities are questions to be addressed. In the present study, we analysed the bullet tuna inhabiting the western and central Mediterranean Sea. Information from two different types of genetic data, mtDNA CR and microsatellites, coincidently reported two genetically distinct stocks within the sampled area. We, therefore, hypothesised which factors (biotic and abiotic) could shape the population structure of bullet tuna. This knowledge could become fundamental when implementing appropriate management plans that guarantee the conservation of the resource.

2. Materials and Methods

For this study, 431 bullet tuna individuals caught from eight different locations in the Northeast Atlantic Ocean and the western and central Mediterranean Sea (Figure 1; Table 1) were analysed. Bullet tuna were caught by fishermen in commercial fisheries during the years 2009–2016 across the Northeast Atlantic Ocean and the western and central Mediterranean Sea from eight different locations (Figure 1; Table 1). This experimental procedure does not involve any living animal. We subsampled a small portion of the skeletal muscle of the already-dead animals. Samples were stored and preserved in tubes with ethanol until processed at the Laboratori d’Ictiologia Genètica.
For the mitochondrial DNA Control Region marker (mtDNA CR), database was created merging haplotypes from previous studies that are available in GenBank (www.ncbi.nlm.nih.gov/genbank, accessed on 22 January 2019) under accession numbers KJ573169–KJ573276 [29], MK159428–MK159691 and MH513321–MH513323 [30]. Additionally, a collection of 41 new sequences was added to the dataset and is available online under accession numbers MW574141–MW574181. All sequences of the dataset were generated following the procedures of Alvarado [31] and Ollé [32] and aligned with ClustalW [33] implemented in Geneious v7.1.9 [34]. Haplotypes were collapsed using DNAsp 6.12.03 [35] and assigned to the previously mentioned mitotype I and mitotype II based on reference sequences AB103467 and AB103468, respectively.
For the mtDNA analysis, we used Arlequin 3.5 [36] to estimate the haplotype (h) and nucleotide diversity indices (π) [37,38]. ɸST and AMOVA tests between pairs of samples were also conducted with Arlequin 3.5. AMOVA was used to evaluate the best clustering model, four plausible aggregations were tested on the basis of biogeographical discontinuities: (1) Iberian Peninsula (Olhão, Strait of Gibraltar, Málaga, Cartagena, Valencia, Tarragona) vs. Alger vs. Mahdia; (2) Mediterranean (Strait of Gibraltar, Málaga, Cartagena, Valencia, Tarragona, Alger and Mahdia) vs. Atlantic (Olhão), (3) Iberian Peninsula vs. North Africa (Alger and Mahdia) and (4) East Iberian Peninsula (Strait of Gibraltar, Málaga, Cartagena, Valencia, Tarragona) vs. Olhão vs. Mahdia vs. Alger. For the phylogenetic inference, we estimated the best substitution nucleotide model using MEGA 7.0.26 on the basis of the lowest Bayesian Information Criterion (BIC) score [39]. Tree reconstruction was performed with the Maximum likelihood method (T92 + G + I), nodes support was assessed with 1000 bootstrap pseudoreplicates, and the tree was finally visualised and adapted with FigTree v1.4.3 [40]. Haplotype network was constructed with PopART [41] using the minimum spanning method.
Additionally, individuals from each location were genotyped for eight nuclear microsatellite loci as described in Catanese et al. (2007) [22] (Supplementary Materials Table S1). Forward primer of each pair was labelled with a fluorescent dye and individuals were amplified using two multiplex PCR. Multiplex 1 was performed with 35 cycles of 95 °C for 45 s, 55 °C for 30 s and 72 °C for 30 s, multiplex 2 consisted of 35 cycles of 95 °C for 45 s, 60 °C for 30 s and 72 °C for 30 s (Supplementary Materials Table S1). Alger and Mahdia locations were particularly difficult to genotype for loci Aro 1-3 and Aro 1-10, thus, missing genotypes were analysed via singleplex. Loci were visualised and genotyped with Geneious v7.1.9 [34]. Scoring errors and null allele probability tests were assessed with MICROCHECKER [42]. FreeNA was used to estimate FST masking the effect of null alleles using the ENA method (excluding null alleles) [43].
For the microsatellite loci, allelic richness (AR), expected heterozygosis (HS), departures of Hardy–Weinberg equilibrium (HWE) and linkage disequilibrium were estimated with GENEPOP 4.7.5 [44]. Population structure was tested by the Fisher exact test of genetic differentiation and the isolation by distance model with the Mantel test (Isolde) both implemented in GENEPOP. Pairwise FST comparisons and analysis of the molecular variance (AMOVA) were computed in Arlequin 3.5, also location clustering was tested with AMOVA following the same groups tested for the mtDNA CR mentioned above. The contribution of each locus separately was studied and Jackknife over loci was performed excluding one locus at a time. Confidence Interval (C.I.) was calculated as the average FST from pseudoreplicates ± 3σ, being σ the standard deviation of pseudoreplicates. Bayesian methods were also applied to estimate the minimum number of homogenous units (K) among locations using STRUCTURE 2.3.4 [45]. We tested STRUCTURE from K = 1–8 populations with an admixture model, burn-in period of 1 × 10⁴ and 1 × 10⁴ Monte Carlo Markov Chain generations. The optimal K was estimated according to the method by Evanno et al. (2005) [46] implemented in STRUCTURE HARVESTER [47].

3. Results

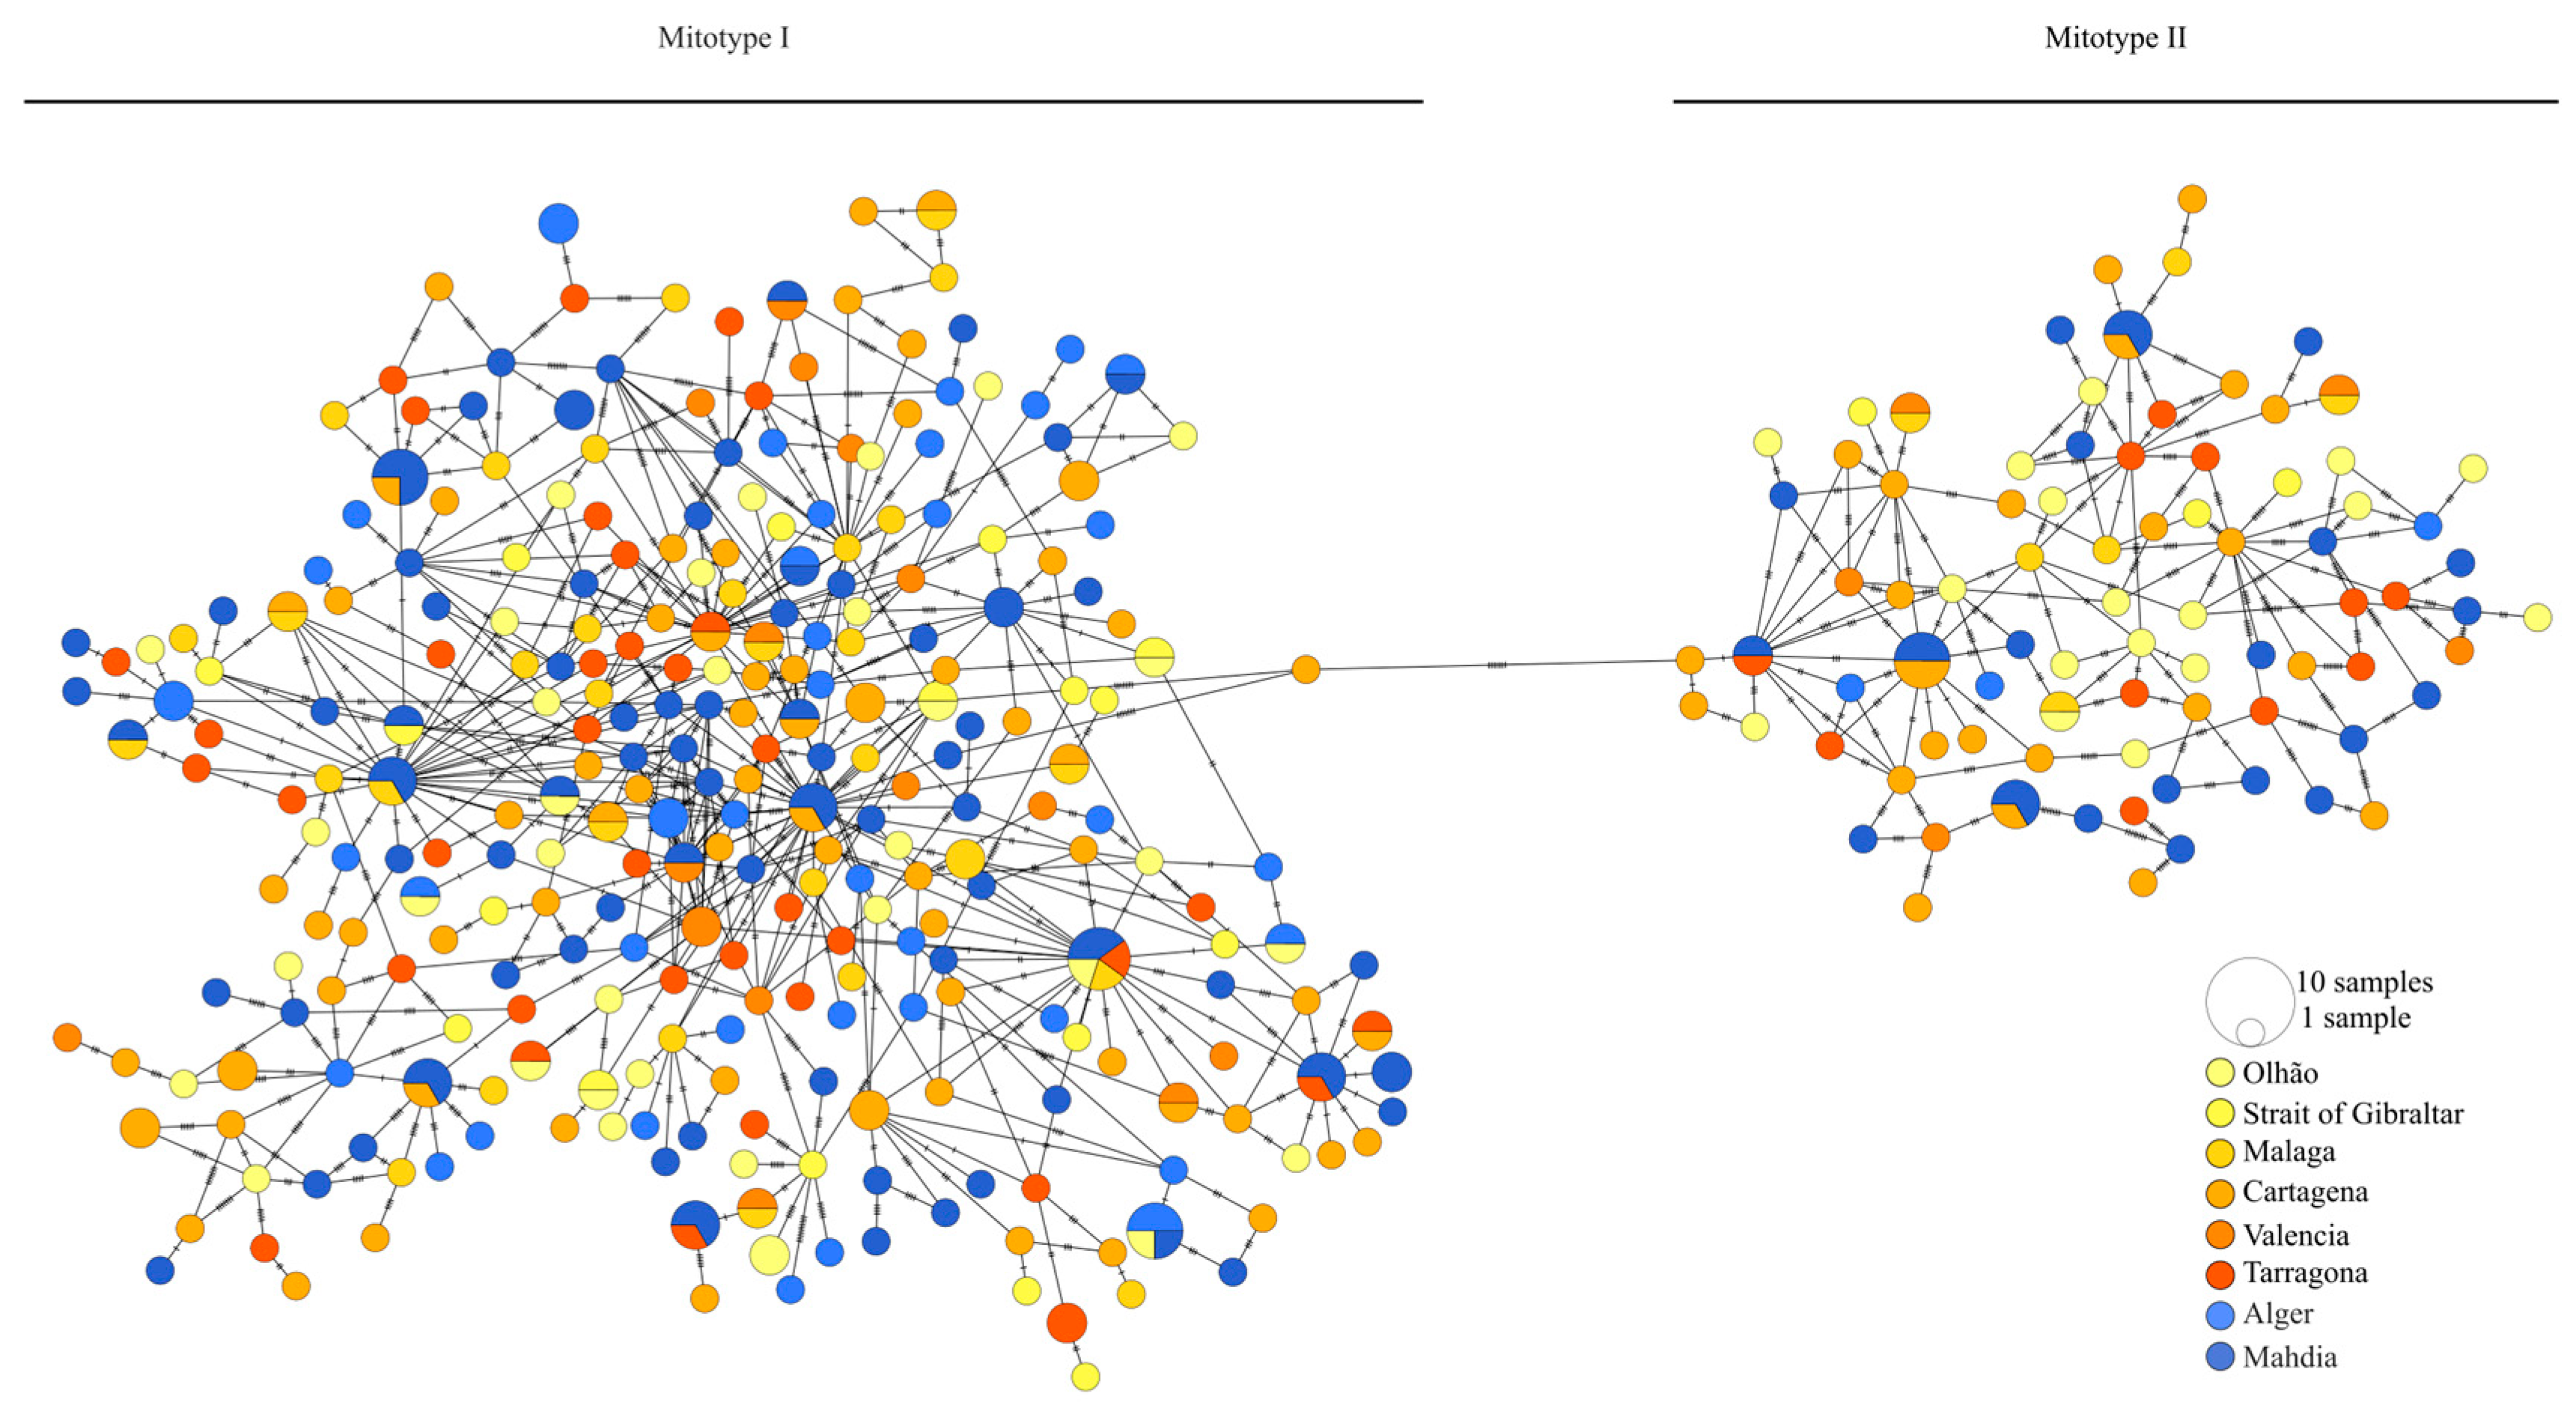
3.1. mtDNA CR Marker

For the mtDNA CR, a collection of 401 distinct haplotypes with a length of 386 base pairs was obtained. No differences in genetic diversity indices were observed among locations (Table 1). High haplotype diversity was found in all samples, ranging from 0.996–1.00, with Alger being the location with the lowest haplotype diversity. Nucleotide diversity ranged from 0.040 (Málaga) to 0.049 (Olhão). Global ɸST among samples was estimated at 0.028 (p = 0.000 ± 0.000). Paired ɸST values between samples showed a lack of genetic differentiation among the locations from the East coast of the Iberian Peninsula, which includes, Málaga, Cartagena, Valencia, and Tarragona; and the Strait of Gibraltar (Ceuta) (ɸST = −0.002; p = 0.616 ± 0.017) (see Table 2), consequently all the samples from this region were pooled together. The samples from Olhão (Atlantic Iberian Peninsula) presented significant genetic differentiation against the Strait of Gibraltar (ɸST = 0.032; p = 0.027 ± 0.014) and Málaga (ɸST = 0.026; p = 0.018 ± 0.012) locations. In the comparison among the different groups (Table 3), the East Iberian Peninsula and Strait of Gibraltar group against Olhão, Alger and Mahdia locations showed a significant ɸCT of 0.036 (p = 0.020 ± 0.005). Higher ɸCT was observed when Olhão was included within the Iberian Peninsula sample group (ɸCT = 0.037; p = 0.035 ± 0.005). The comparison between the samples collected across the Mediterranean (Strait of Gibraltar, Málaga, Cartagena, Valencia, Tarragona, Alger and Mahdia) and the location from the Atlantic Iberian Peninsula (Olhão) did not report significant genetic differentiation (ɸCT = −0.003; p = 0.493 ± 0.017). No significant genetic differences were neither observed in the comparison of the Iberian Peninsula and Strait of Gibraltar with the North African locations merged in a group (Alger and Mahdia) (ɸCT = 0.003 p = 0.391 ± 0.015). Phylogenetic reconstruction for the mtDNA CR marker reported two distinct haplogroups that were assigned to the previously reported mitotype I and mitotype II (Figure 2). The global heterogeneity test did not report significant differences between samples (p > 0.05). However, significant differences in mitotype distribution were found when the Iberian Peninsula was tested against Alger and Mahdia separately (p < 0.05). Nevertheless, the best aggregation resulted in the comparison of the Iberian Peninsula + Mahdia against Alger (p < 0.025). These differences are caused by a highly biased underrepresentation of mitotype II haplotypes in the Algeria locations. While mitotype II presence in the other locations ranges from 15.00–33.33% (Average 23.15% ± 6.18), mitotype II is present in only 7.32% of individuals from Alger (n = 41).

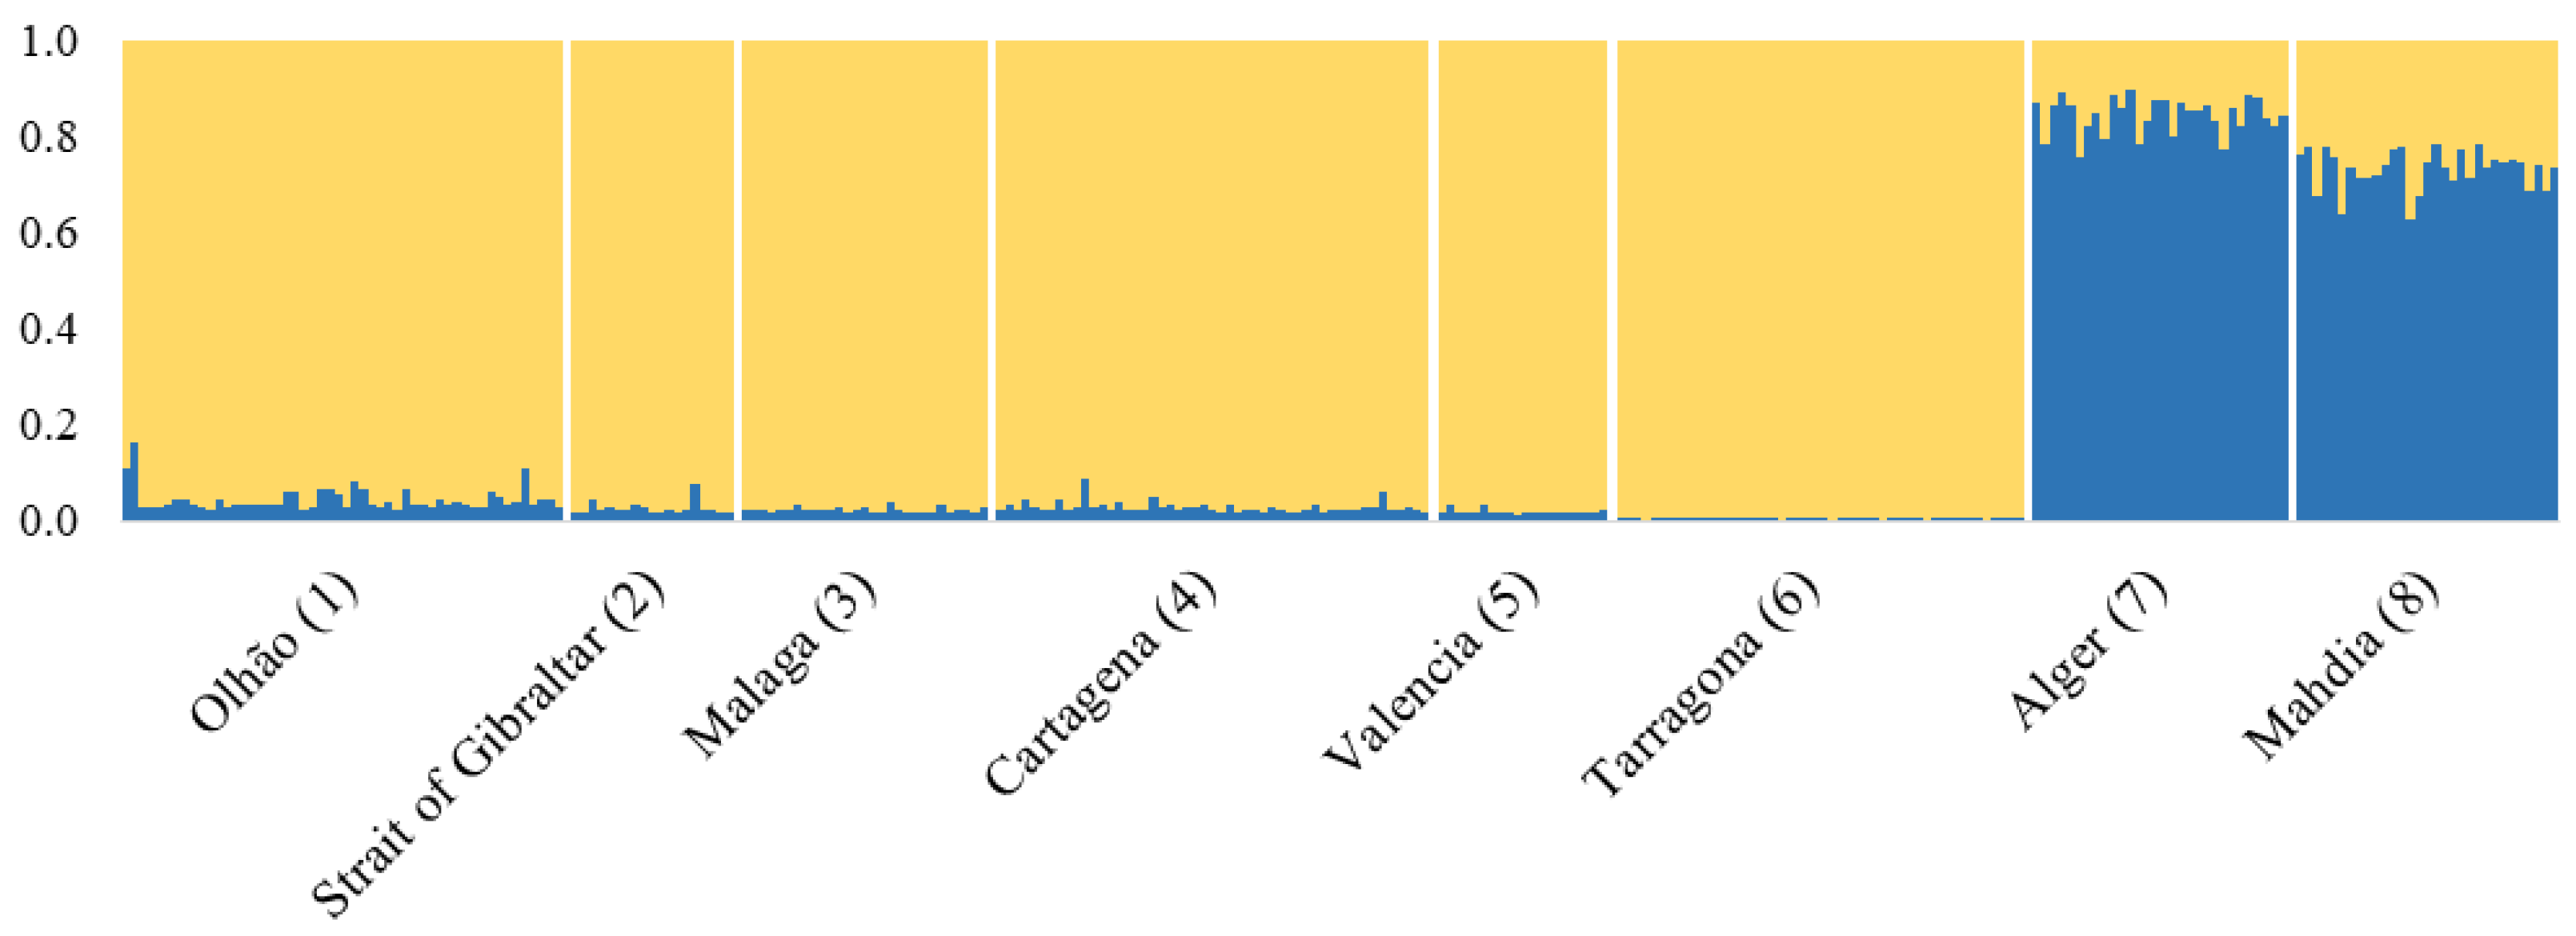
3.2. Microsatellite Markers

A total of 276 individuals were genotyped for at least five out of eight microsatellite loci. For the samples of Alger and Mahdia (caught in 2010 and 2009, respectively), the total number of successfully genotyped individuals was lower than expected. MICROCHECKER revealed null alleles at high frequency (>20%) in locus Aro 2-38 for all locations (p < 0.001). In consequence, this locus was discarded from the posterior analysis. Additionally, null alleles were detected at loci Aro 2-15, Aro 4-13 and Aro 1-3 in some locations at significantly high rates (Supplementary Materials Table S2). After Bonferroni correction, high significant departures from the Hardy–Weinberg equilibrium (HWE) were detected in six out of eight locations: Olhão, Strait of Gibraltar, Málaga, Tarragona, Alger and Mahdia and were caused by heterozygotes deficit (p < 0.001) (Table 4). In all but the Olhão and Strait of Gibraltar locations, locus Aro 4-13 was involved in the Hardy–Weinberg disequilibrium (HWD). Locus Aro 1-10 was responsible for the disequilibrium in Olhão, Tarragona and Alger. Locus Aro 1-3 was responsible for HWD in Olhão and Strait of Gibraltar locations and Aro 2-15 only presented HWD in Alger. Significant departures from the Hardy–Weinberg equilibrium across loci and locations corresponded with the high frequency of null alleles reported by MICROCHECKER (Supplementary Materials Table S2). After Bonferroni correction, linkage disequilibrium was found only between loci Aro 2-15 and Aro 4-13 in the Valencia location (p < 0.001) although this location was in HWE. Allelic richness per location ranged from 11.448 (Mahdia) to 13.819 (Málaga). Expected heterozygosis did not vary greatly across locations and ranged from 0.873 (Alger) to 0.907 (Cartagena).
Given that, the Fisher exact test did not find differences in the allele frequency among the Iberian Peninsula and Strait of Gibraltar group, that is, Olhão, Ceuta, Málaga, Cartagena, Valencia and Tarragona locations, all of them were grouped together. Significant genetic differences were found in the comparison among pooled Iberian Peninsula and Strait of Gibraltar samples with Alger (p < 0.001) and Mahdia (p < 0.001). In addition, differences in the allele frequency were also found in the pairwise comparison between Alger and Mahdia (p < 0.001). Isolation by distance model showed a positive and significant correlation between linearised FST (FST/(1 − FST)) and Linear distances (R2 = 0.547; p < 0.024). The overall mean FST = 0.015 for the seven loci showed significant differences among locations (p = 0.000 ± 0.000). Jackknife pseudoreplicates over loci reported FST average values of 0.015 ± 0.002 and C.I. from 0.009–0.02. Correction for nulls provided by FreeNA did not report remarkable differences in the estimated pairwise FST values (Table 2 and Supplementary Materials Table S2). The study of the contribution of each locus separately reported four loci, Aro 1-59, Aro 2-15, Aro 4-13 and Aro 4-10 to contribute significantly to the global FST (see Supplementary Materials Table S3). FST pairwise comparisons showed significant differences between Alger and Mahdia and between these two locations with the rest (Table 2). For the AMOVA analysis, we compared the same groups tested by mtDNA (see Table 3): Mediterranean vs. Atlantic (FCT = −0.004; p = 0.378 ± 0.018), East Iberian Peninsula and Strait of Gibraltar group compared with Olhão (Atlantic Iberian Peninsula), Alger and Mahdia locations (FCT = 0.017; p = 0.097 ± 0.009), Iberian Peninsula (including Olhão and Strait of Gibraltar) vs. North Africa (Alger and Mahdia pooled) (FCT = 0.008 p = 0.115 ± 0.010) and Iberian Peninsula vs. Alger and vs. Mahdia (FCT = 0.027; p = 0.036 ± 0.008). This last aggrupation showed that 2.670% of the variation accounted for the differences among groups and proved to be the grouping with the highest FCT and the only one with statistical significance. Bayesian inference of population structure gave the highest probability to a model of two clusters (K = 2). Cluster I included all the Iberian Peninsula and Strait of Gibraltar locations—Olhão, Ceuta, Málaga, Cartagena, Valencia, and Tarragona—while cluster II included the North Africa locations—Alger and Mahdia—(Figure 3). No substructure was found within any of the two clusters.

4. Discussion

This is the most extensive work combining a mitochondrial marker and a set of nuclear loci for the study of the population structure of bullet tuna in the Mediterranean Sea. This is more relevant since this species, together with S. sarda is one of the most targeted species in the Mediterranean Sea [48]. The analysis of the mtDNA CR showed high levels of haplotype and nucleotide diversity (h = 1.000 ± 0.000; π = 0.044 ± 0.022). Similar levels of genetic variation were previously reported for this species in the Mediterranean and they were associated with large and stable populations [29]. Such values of diversity fit on those expected in pelagic migratory species with large populations sizes, such as swordfish (Xiphias gladius) [49,50] or other species of the same family, including bluefin tuna, albacore, Atlantic bonito, and Atlantic chub mackerel (Scomber colias) [15,18,29,49].
Our results for mtDNA CR clearly depicted the presence of the two mitotypes previously described in this species [26,27]. The heterogeneous distribution of mtDNA clades among locations was described in other scombrid species including the Atlantic mackerel, Atlantic bonito, bigeye tuna (Thunnus obesus) and xiphioids such as the swordfish [18,50,51,52]. This phylogeographical pattern is often associated with vicariant and allopatric events during the Pleistocene [18,51] with the isolation of the Mediterranean from the Atlantic Ocean followed by secondary contact of individuals from both basins. In bullet tuna, this hypothesis appears no longer valid. Mitotype I is present in both the Pacific and Atlantic Oceans while two different groups exist for mitotype II, each one associated with an Ocean. Therefore, isolation must occur at a more global scale. Regardless of the phylogeographic origin of these mitotypes, their distribution in the Mediterranean indicates a population structure in the area of study, with the Alger presenting the lowest frequency of mitotype II. The mtDNA AMOVA results confirm the genetic differentiation between samples from the Iberian Peninsula and the two locations from the North African coast: Alger and Mahdia separately.
The analysis of the seven microsatellites depicted deviations from the Hardy–Weinberg proportions in six out of eight locations. Three situations can cause Hardy–Weinberg disequilibrium, the Wahlund effect, loci linked to sex chromosomes and the presence of null alleles. A situation that typically can cause HWD is analysing a location that is genetically structured as a single unit, causing an apparent lack of heterozygotes (the Wahlund effect) in the population [53]. In such situations, individual-based approximations such STRUCTURE are a useful resource to unveil putative population mixtures [46]. Our results from STRUCTURE clearly mark a pattern with two genetically distinct clusters but substructure was detected neither within each cluster nor within each location. Another possibility is analysing sex-linked loci. Although male sex-linked loci were identified in the Pacific bluefin tuna (Thunnus orientalis), there is no evidence of heterogametic sex chromosomes either in females or males for this species [54]. Moreover, if this was the situation, we would expect a robust pattern of homozygotes excess in all locations for the sex-linked locus, rather than disequilibria in some loci in certain locations. Therefore, we find that sex linkage is the least likely situation. We argue that in this case, the presence of nulls is the primary cause of significant departures of HWE. As shown in Table 4 and Supplementary Materials Table S2, several loci at locations affected by nulls correspond with those that deviated from HW expectations. Additionally, no HWD is observed across any population for the seven remaining loci and neither in a single locus across all populations. Finally, it is worth mentioning that Catanese [22] already detected HWD in all locus in the Mediterranean individuals when working with a sampling size of 22 individuals. Thus, HWD caused by low sampling cannot be ruled out. Additionally, linkage disequilibrium (LD) was found between loci Aro 2-15 and Aro 4-13 in the location of Valencia, even though this location did not deviate from HWE. From our view, LD is caused by the chance in a location with low sampling size (n = 21), where two individuals shared the same genotype for loci Aro 2-15 and Aro 4-13. This genotype association is not found in any other individuals.
Microsatellite FST values between samples were lower than the ɸST value from the mtDNA CR (0.015 and 0.037, respectively), indicating a relatively high genetic flow between individuals in the sampled locations, even though they did depict the same differentiation pattern (see Table 3). Populations with large effective population sizes are usually affected by nulls and in cases with low gene flow, it was reported that null alleles can overestimate the FST values [43]. From our results, even though FST values were slightly lower when they were recalculated using different methods for null correction, the differentiation pattern remained the same (Table 2 and Supplementary Materials Table S2). Moreover, Jackknife over loci and locus by locus AMOVA analysis discarded that a single locus was responsible for the FST values (Supplementary Materials Table S4). Thus, we find it unlikely that in our case null alleles are the only agents for the differentiation signal observed in these markers. According to Carlson [55], small deviations should not impede the use of these microsatellite markers for assessing the pattern of structure. Moreover, Fisher’s exact test confirmed the same pattern of genetic differentiation found by AMOVA with three different groups of samples (Iberian Peninsula, Alger, and Mahdia). The presence of three different groups could be challenged by the positive correlation between geographic distance and genetic differentiation, as shown by the Mantel test. However, we argue that this model is rather displaying a side-effect of the sampling design than the actual situation of the species. The major genetic distances were found between African locations and Iberian Peninsula locations, coinciding with the largest geographical distances. Although, across the Iberian, the increase in geographic distance is not correlated with the genetic distances among samples. Therefore, we assume that it is unlikely that a stepping-stone model can be representative of our data. Additionally, STRUCTURE results endorse a pattern of two discrete clusters within the Mediterranean (K = 2): one cluster that comprised the Iberian Peninsula and Strait of Gibraltar coast locations and a second containing the samples from the Mediterranean African coast (Alger and Mahdia).
As seen before [56], the use of different genetic markers (such as mtDNA and microsatellites) and different statistical methods can retrieve different levels of population differentiation. The results presented here regarding the network of mtDNA CR haplotypes showed the presence of two mtDNA haplogroups that do not match with the K = 2 groups inferred by STRUCTURE with microsatellites. As mentioned before, the aggregation of mtDNA haplotypes is often found in the Scombridae family and accounts for ancient phylogeographic patterns [18,50,51,52]. Alternatively, groups reported by STRUCTURE are congruent with the AMOVAs and Fisher’s exact tests from microsatellite markers and with the AMOVAs of the mtDNA CR marker, separating the Iberian Peninsula locations from North Africa. In addition, AMOVA and Fisher’s exact test from microsatellite data found a weak differentiation splitting North Africa into two groups. Then, the segregation of individuals inhabiting the area nearby the Iberian Peninsula and Strait of Gibraltar coast from those inhabiting the North African coast is probably a more recent pattern of population structure than the phylogeographic formation and distribution of mitochondrial mitotypes. On the other hand, in contrast with the STRUCTURE results that grouped Alger and Mahdia, AMOVA tests with both markers (mtDNA and microsatellites) agree that the best aggregation model is composed of three groups (Iberian Peninsula–Strait of Gibraltar, Alger and Mahdia). We can then conclude that the analysis of the molecular variance and Fisher’s exact test are able to find a shallower population structure than the one found by the Bayesian method of STRUCTURE. Considering the results from both markers, we conclude that the genetic population structure of bullet tuna within the western and central Mediterranean region comprises at least two genetically well-differentiated stocks, one in the Iberian Peninsula–Strait of Gibraltar coast and another along the African coast (Figure 1), while the putative differentiation between the two locations of the African coast (Alger and Mahdia) should be confirmed by further assessment.
However, what are the causes that would lead to this genetic structure? Past phylogeographic events from the heterogeneous distribution of mtDNA mitotypes have already been discarded. Thus, the genetic pattern may be explained by the current life-history traits of the species influenced by more recent biogeographical events. The presence of bullet tuna in the Mediterranean appears to occur throughout the year, with catches in all months [48], indicating that some individuals remain in the Mediterranean during the cold months. In addition, commercial fishery landings are highly variable throughout the year, with peak catches in the warmer months when spawning occurs. Thus, although it is likely that most of the individuals migrate outside the Mediterranean Sea, probably for feeding [21], there is a proportion of individuals that do not migrate and remain in the same, or close to the same, area where they reproduce. Within the western and central Mediterranean, two major spawning areas were identified for the bullet tuna: the waters surrounding the Balearic Islands, and Capo Passero on the southern Sicilian coast. Outside the study area, a third spawning area was documented in the eastern Mediterranean, between the coasts of Cyprus and Turkey [57,58,59]. These areas coincide with spawning areas of Atlantic bluefin tuna and albacore. However, the bullet tuna prefers coastal waters in comparison to these bigger relatives, with the presence of larvae that positively correlated with geostrophic velocities [57,58]. This makes bullet tuna individuals sensitive to spawning in areas that promote larval retention and self-recruitment, especially in the summer when the reproductive period coincides with the largest intensity of the sea surface currents [5,60]. Aside from these three main spawning areas, bullet tuna larvae were also detected in the north of the Iberian Peninsula and the most northern Sicilian waters [21,61]. There, the direction of the currents might promote the translocation of the larvae into the retention areas. A similar situation was observed in the Sicilian waters for this and other species [58,62]. On the contrary, transportation by marine currents seems less likely to occur on adult individuals as suggested by the non-segregation between individuals from localities on both sides of the Almeria–Oran front, a region with a strong current system. Moreover, homing behaviour was observed in related species such as the Atlantic bluefin tuna. For this species, the presence of two stocks inhabiting the western and eastern Atlantic Ocean and the Mediterranean Sea is well established. Individuals migrate and mix in the central Atlantic for feeding and both males and females return to their natal areas to reproduce [11,12]. Based on our results, a similar situation could be occurring with the bullet tuna within the Mediterranean where no admixture of bullet tuna adults from the different genetically isolated stocks was detected. Since the results coincide on both mitochondrial and nuclear markers and the analyses at the individual level (STRUCTURE), we discard that this philopatric behaviour is restricted to females, as was proposed in other pelagic species [49].
In conclusion, the differentiation pattern observed here could be caused by this homing behaviour accompanied by the preference of this species to spawn in neritic areas that favour larval retention. Thus, these reproductive strategies would shape the pattern of the population genetic structure of two genetically differentiated stocks within the western and central Mediterranean. This situation was previously reported for other members of the tuna family such as Atlantic bluefin tuna [11,12], Atlantic mackerel [17,51] and also hypothesised for yellowfin tuna [63]. From our results, one stock would inhabit the Iberian Peninsula and Strait of Gibraltar coast, with a putative nursery area around the Balearic Islands. The lack of substructure along the Iberian Peninsula makes it unlikely that the Almeria–Oran front or the Ibiza Channel could be shaping a substructure within this stock. The other stock would be located on the North African coast. This stock probably feeds in the nursery area located in the south of Sicily Island. One question that is still open is if the two locations on the North African coast are genetically differentiated and if there is any effect of the Sicilian channel. Thus, from our view, it is important to fill the gaps that we encounter in this study. This can be achieved by firstly, and more importantly, analysing individuals from different age classes captured in these two nursery areas to verify their contribution to each stock. Secondly, by obtaining a more continuous sampling along the African coasts would help to unveil the putative deeper genetic structure present in this region. Lastly, by following a genomic approach, such as RadSeq or ddRadSeq, which would be less sensitive to the presence of null alleles and could provide new information about the population structure of the bullet tuna in the western and central Mediterranean.
Up until now, the International Commission for the Conservation of Atlantic Tunas (ICCAT) has not endorsed any recommendation for this resource, a species with economic interest targeted by artisanal and commercial fisheries in the Western and Central Mediterranean Sea. Our results clearly indicate the presence of at least two different stocks of bullet tuna within the Mediterranean Sea that should be managed separately and a putative genetic differentiation between Alger and Mahdia locations that would need further studies. Moreover, the reproductive behaviour of this species seems to play a strong role in the genetic structure, and thus, banning catches during their reproductive period or at least establishing a limited number of catches are measures that could ensure proper management to avoid the future collapse of this species and their fisheries.

Supplementary Materials

The following supporting information can be downloaded at: https://www.mdpi.com/article/10.3390/fishes7050300/s1, Table S1: Microsatellites descriptions; Table S2: Null allele frequencies; Table S3: FST pairwise comparisons from FreeNA; Table S4: Jackknife AMOVA over microsatellites loci.

Author Contributions

J.O.-V. and N.P.-B. performed the wet lab work; J.O.-V. analysed the data and drafted the manuscript; J.V., N.P.-B., R.M.A. and N.S. supervised the genetic analysis and contributed to the manuscript; S.S. and D.M. provided the samples and contributed to the manuscript. J.O.-V. and J.V. conceived the study. All authors have read and agreed to the published version of the manuscript.

Funding

This work was cofounded by the IEO and the EU through the European Maritime and Fisheries Fund (EMFF) within the national program of collection, management, and use of data in the fisheries sector, and support for scientific advice regarding the Common Fisheries Policy.

Institutional Review Board Statement

Not applicable.

Data Availability Statement

All sequences used and generated in this study were deposited in GenBank (www.ncbi.nlm.nih.gov/genbank, accessed on 22 January 2019) under accession numbers KJ573169–KJ573276, MK159428–MK159691 and MH513321–MH513323 and MW574141–MW574181.

Acknowledgments

The collaboration in the sampling of our colleagues of the Large Pelagic Fisheries department (Málaga) of the IEO is appreciated as is the collaboration of our colleagues of the Instituto Português do Mar e da Atmosfera (Olhão, Portugal), in particular PG Lino, R Coelho, and R Muñoz-Lechuga. We would like to note the contributions of J Torralba, E Majuelos and M. Pauly for their support, enthusiasm, and generosity. This work was cofounded by the IEO and the EU through the European Maritime and Fisheries Fund (EMFF) within the national program of collection, management, and use of data in the fisheries sector, and support for scientific advice regarding the Common Fisheries Policy.

Conflicts of Interest

The authors declare no conflict of interest.

References

  1. Waples, R.S.; Naish, K.A. Genetic and Evolutionary Considerations in Fishery Management: Research Needs for the Future. In The Future of Fisheries Science in North America; Beamish, R., Rothschild, B., Eds.; Springer: Berlin/Heidelberg, Germany, 2009; pp. 427–451. [Google Scholar] [CrossRef]
  2. Ward, R.D. Population Genetics of Tunas. J. Fish Biol. 1995, 47, 259–280. [Google Scholar] [CrossRef]
  3. Ward, R.D. Genetics in Fisheries Management. Hydrobiologia 2000, 420, 191–201. [Google Scholar] [CrossRef]
  4. Palumbi, S.R. Genetic Divergence, Reprodutive Isolation and Marine Speciation. Annu. Rev. Ecol. Syst. 1994, 25, 547–572. [Google Scholar] [CrossRef]
  5. Pascual, M.; Rives, B.; Schunter, C.; Macpherson, E. Impact of Life History Traits on Gene Flow: A Multispecies Systematic Review across Oceanographic Barriers in the Mediterranean Sea. PLoS ONE 2017, 12, e0176419. [Google Scholar] [CrossRef] [Green Version]
  6. Patarnello, T.; Volckaert, F.A.M.J.; Castilho, R. Pillars of Hercules: Is the Atlantic-Mediterranean Transition a Phylogeographical Break? Mol. Ecol. 2007, 16, 4426–4444. [Google Scholar] [CrossRef] [PubMed]
  7. Knutsen, H.; Jorde, P.E.; André, C.; Stenseth, N.C. Fine-Scaled Geographical Population Structuring in a Highly Mobile Marine Species: The Atlantic Cod. Mol. Ecol. 2003, 12, 385–394. [Google Scholar] [CrossRef] [PubMed] [Green Version]
  8. Selkoe, K.A.; D’Aloia, C.C.; Crandall, E.D.; Iacchei, M.; Liggins, L.; Puritz, J.B.; Von Der Heyden, S.; Toonen, R.J. A Decade of Seascape Genetics: Contributions to Basic and Applied Marine Connectivity. Mar. Ecol. Prog. Ser. 2016, 554, 1–19. [Google Scholar] [CrossRef] [Green Version]
  9. Manel, S.; Holderegger, R. Ten Years of Landscape Genetics. Trends Ecol. Evol. 2013, 28, 614–621. [Google Scholar] [CrossRef]
  10. Rooker, J.R.; Alvarado Bremer, J.R.; Block, B.A.; Dewar, H.; De Metrio, G.; Corriero, A.; Kraus, R.T.; Prince, E.D.; Rodriguez-Marin, E.; Secor, D.H. Life History and Stock Structure of Atlantic Bluefin Tuna (Thunnus thynnus). Rev. Fish. Sci. 2007, 15, 265–310. [Google Scholar] [CrossRef]
  11. Rooker, J.R.; Secor, D.H.; DeMetrio, G.; Kaufman, A.J.; Ríos, A.B.; Tičina, V. Evidence of Trans-Atlantic Movement and Natal Homing of Bluefin Tuna from Stable Isotopes in Otoliths. Mar. Ecol. Prog. Ser. 2008, 368, 231–239. [Google Scholar] [CrossRef] [Green Version]
  12. Rooker, J.R.; Arrizabalaga, H.; Fraile, I.; Secor, D.H.; Dettman, D.L.; Abid, N.; Addis, P.; Deguara, S.; Karakulak, F.S.; Kimoto, A.; et al. Crossing the Line: Migratory and Homing Behaviors of Atlantic Bluefin Tuna. Mar. Ecol. Prog. Ser. 2014, 504, 265–276. [Google Scholar] [CrossRef] [Green Version]
  13. Rodríguez-Ezpeleta, N.; Díaz-Arce, N.; Walter, J.F.; Richardson, D.E.; Rooker, J.R.; Nøttestad, L.; Hanke, A.R.; Franks, J.S.; Deguara, S.; Lauretta, M.V.; et al. Determining Natal Origin for Improved Management of Atlantic Bluefin Tuna. Front. Ecol. Environ. 2019, 17, 439–444. [Google Scholar] [CrossRef]
  14. Viñas, J.; Alvarado Bremer, J.R.; Pla, C. Phylogeography and Phylogeny of the Epineritic Cosmopolitan Bonitos of the Genus Sarda (Cuvier): Inferred Patterns of Intra- and Inter-Oceanic Connectivity Derived from Nuclear and Mitochondrial DNA Data. J. Biogeogr. 2010, 37, 557–570. [Google Scholar] [CrossRef]
  15. Viñas, J.; Alvarado Bremer, J.R.; Pla, C. Inter-Oceanic Genetic Differentiation among Albacore (Thunnus alalunga) Populations. Mar. Biol. 2004, 145, 225–232. [Google Scholar] [CrossRef]
  16. Chow, S.; Takeyama, H. Nuclear and Mitochondrial DNA Analyses Reveal Four Genetically Separated Breeding Units of the Swordfish. J. Fish Biol. 2000, 56, 1087–1098. [Google Scholar] [CrossRef]
  17. Zardoya, R.; Castilho, R.; Grande, C.; Favre-Krey, L.; Caetano, S.; Marcato, S.; Krey, G.; Patarnello, T. Differential Population Structuring of Two Closely Related Fish Species, the Mackerel (Scomber scombrus) and the Chub Mackerel (Scomber japonicus), in the Mediterranean Sea. Mol. Ecol. 2004, 13, 1785–1798. [Google Scholar] [CrossRef]
  18. Viñas, J.; Alvarado Bremer, J.R.; Pla, C. Phylogeography of the Atlantic Bonito (Sarda Sarda) in the Northern Mediterranean: The Combined Effects of Historical Vicariance, Population Expansion, Secondary Invasion, and Isolation by Distance. Mol. Phylogenet. Evol. 2004, 33, 32–42. [Google Scholar] [CrossRef]
  19. Carlsson, J.; McDowell, J.R.; Díaz-Jaimes, P.; Carlsson, J.E.L.; Boles, S.B.; Gold, J.R.; Graves, J.E. Microsatellite and Mitochondrial DNA Analyses of Atlantic Bluefin Tuna (Thunnus thynnus thynnus) Population Structure in the Mediterranean Sea. Mol. Ecol. 2004, 13, 3345–3356. [Google Scholar] [CrossRef]
  20. Collette, B.B.; Nauen, C.E. FAO Species Catalogue: Vol. 2 Scombrids of the World; Food and Agriculture Organization of the United Nations: Rome, Italy, 1983; Volume 125. [Google Scholar]
  21. Sabatés, A.; Recasens, L. Seasonal Distribution and Spawning of Small Tunas (Auxis rochei and Sarda sarda) in the Northwestern Mediterranean. Sci. Mar. 2001, 65, 95–100. [Google Scholar] [CrossRef]
  22. Catanese, G.; Infante, C.; Crespo, A.; Zuasti, E.; Ponce, M.; Funes, V.; Pérez, L.; Manchado, M. Development and Characterization of Eight Microsatellite Markers in Bullet Tuna (Auxis rochei). Mol. Ecol. Notes 2007, 7, 842–844. [Google Scholar] [CrossRef]
  23. Collette, B.B.; Aadland, C.R. Revision of the Frigate Tunas (Scombridae, Auxis), with Descriptions of Two New Subspecies from the Eastern Pacific. Fish. Res. 1996, 94, 423–441. [Google Scholar]
  24. ICCAT. Task 1. Nominal Catch Information. Available online: https://www.iccat.int/Data/t1nc_20220131.7z (accessed on 7 February 2022).
  25. ICCAT. Report of the 2021 ICCAT Small Tuna Species Group Intersessional Meeting. Collect. Vol. Sci. Pap.-ICCAT 2021, 78, 1–58. [Google Scholar]
  26. Infante, C.; Catanese, G.; Ponce, M.; Manchado, M. Novel Method for the Authentication of Frigate Tunas (Auxis thazard and Auxis rochei) in Commercial Canned Products. J. Agric. Food Chem. 2004, 52, 7435–7443. [Google Scholar] [CrossRef] [PubMed]
  27. Catanese, G.; Infante, C.; Manchado, M. Complete Mitochondrial DNA Sequences of the Frigate Tuna Auxis thazard and the Bullet Tuna Auxis rochei. DNA Seq.-J. DNA Seq. Mapp. 2008, 19, 159–166. [Google Scholar] [CrossRef] [PubMed]
  28. Orsi-Relini, L.; Palandri, G.; Garibaldi, F.; Lanteri, L.; Tinti, F. Towards a New Taxonomical Approach to Mediterranean Small Tuna of Genus Auxis. Biol. Mar. Mediter. 2008, 15, 207–210. [Google Scholar]
  29. Allaya, H.; Ben Faleh, A.; Hattour, A.; Trabelsi, M.; Viñas, J. Disparate Past Demographic Histories of Three Small Scombridae (Actinopterygii) Species in Tunisian Waters. Hydrobiologia 2015, 758, 19–30. [Google Scholar] [CrossRef]
  30. Ollé, J.; Macías, D.; Saber, S.; Gómez-Vives, M.J.; Pérez-Bielsa, N.; Viñas, J. Genetic Analysis Reveals the Presence of Frigate Tuna (Auxis thazard) in the Bullet Tuna (Auxis rochei) Fishery of the Iberian Peninsula and the Western-Central Mediterranean Sea. Bull. Mar. Sci. 2019, 95, 317–325. [Google Scholar] [CrossRef]
  31. Alvarado Bremer, J.R.; Mejuto, J.; Greig, T.W.; Ely, B. Global Population Structure of the Swordfish (Xiphias Gladius L.) as Revealed by Analysis of the Mitochondrial DNA Control Region. J. Exp. Mar. Bio. Ecol. 1996, 197, 295–310. [Google Scholar] [CrossRef]
  32. Ollé, J.; Vilà-Valls, L.; Alvarado-Bremer, J.; Cerdenares, G.; Duong, T.Y.; Hajjej, G.; Lino, P.G.; Muñoz-Lechuga, R.; Sow, F.N.; Diaha, N.C.; et al. Population Genetics Meets Phylogenetics: New Insights into the Relationships among Members of the Genus Euthynnus (Family Scombridae). Hydrobiologia 2021, 849, 47–62. [Google Scholar] [CrossRef]
  33. Thompson, J.D.; Higgins, D.G.; Gibson, T.J. CLUSTAL W: Improving the Sensitivity of Progressive Multiple Sequence Alignment through Sequence Weighting, Position-Specific Gap Penalties and Weight Matrix Choice. Nucleic Acids Res. 1994, 22, 4673–4680. [Google Scholar] [CrossRef] [Green Version]
  34. Kearse, M.; Moir, R.; Wilson, A.; Stones-Havas, S.; Cheung, M.; Sturrock, S.; Buxton, S.; Cooper, A.; Markowitz, S.; Duran, C.; et al. Geneious Basic: An Integrated and Extendable Desktop Software Platform for the Organization and Analysis of Sequence Data. Bioinformatics 2012, 28, 1647–1649. [Google Scholar] [CrossRef] [PubMed] [Green Version]
  35. Rozas, J.; Ferrer-Mata, A.; Sánchez-DelBarrio, J.C.; Guirao-Rico, S.; Librado, P.; Ramos-Onsins, S.E.; Sánchez-Gracia, A. DnaSP 6: DNA Sequence Polymorphism Analysis of Large Data Sets. Mol. Biol. Evol. 2017, 34, 3299–3302. [Google Scholar] [CrossRef] [PubMed]
  36. Excoffier, L.; Lischer, H.E.L. Arlequin Suite Ver 3.5: A New Series of Programs to Perform Population Genetics Analyses under Linux and Windows. Mol. Ecol. Resour. 2010, 10, 564–567. [Google Scholar] [CrossRef] [PubMed]
  37. Nei, M.; Tajima, F. DNA Polymorphism Detectable by Restriction Endonucleases. Genetics 1981, 97, 145–163. [Google Scholar] [CrossRef]
  38. Nei, M. Molecular Evolutionary Genetics; Columbia University Press: New York, NY, USA, 1987. [Google Scholar] [CrossRef]
  39. Kumar, S.; Stecher, G.; Tamura, K.; Dudley, J. MEGA7: Molecular Evolutionary Genetics Analysis Version 7.0 for Bigger Datasets Downloaded From. Mol. Biol. Evol. 2016, 33, 1870–1874. [Google Scholar] [CrossRef] [Green Version]
  40. Rambaud, A. FigTree; University of Edinburgh: Edinburgh, UK, 2012. [Google Scholar]
  41. Leigh, J.W.; Bryant, D. POPART: Full-Feature Software for Haplotype Network Construction. Methods Ecol. Evol. 2015, 6, 1110–1116. [Google Scholar] [CrossRef]
  42. Van Oosterhout, C.; Hutchinson, W.F.; Wills, D.P.; Shipley, P. MICRO-CHECKER: Software for Identifying and Correcting Genotyping Errors in Microsatellite Data. Mol. Ecol. Notes 2004, 4, 535–538. [Google Scholar] [CrossRef]
  43. Chapuis, M.P.; Estoup, A. Microsatellite Null Alleles and Estimation of Population Differentiation. Mol. Biol. Evol. 2007, 24, 621–631. [Google Scholar] [CrossRef] [Green Version]
  44. Rousset, F. GENEPOP’007: A Complete Re-Implementation of the GENEPOP Software for Windows and Linux. Mol. Ecol. Resour. 2008, 8, 103–106. [Google Scholar] [CrossRef]
  45. Pritchard, J.K.; Stephens, M.; Donnelly, P. Inference of Population Structure Using Multilocus Genotype Data. Genetics 2000, 155, 945–959. [Google Scholar] [CrossRef]
  46. Evanno, G.; Regnaut, S.; Goudet, J. Detecting the Number of Clusters of Individuals Using the Software Structure: A Simulation Study. Mol. Ecol. 2005, 14, 2611–2620. [Google Scholar] [CrossRef] [PubMed]
  47. Earl, D.A.; vonHoldt, B.M. STRUCTURE HARVESTER: A Website and Program for Visualizing STRUCTURE Output and Implementing the Evanno Method. Conserv. Genet. Resour. 2012, 4, 359–361. [Google Scholar] [CrossRef]
  48. Mostarda, E.; Campo, D.; Castriota, L.; Esposito, V.; Scarabello, M.P.; Andaloro, F. Feeding Habits of the Bullet Tuna Auxis Rochei in the Southern Tyrrhenian Sea. J. Mar. Biol. Assoc. UK 2007, 87, 1007–1012. [Google Scholar] [CrossRef]
  49. Alvarado Bremer, J.R.; Viñas, J.; Mejuto, J.; Ely, B.; Pla, C. Comparative Phylogeography of Atlantic Bluefin Tuna and Swordfish: The Combined Effects of Vicariance, Secondary Contact, Introgression, and Population Expansion on the Regional Phylogenies of Two Highly Migratory Pelagic Fishes. Mol. Phylogenet. Evol. 2005, 36, 169–187. [Google Scholar] [CrossRef]
  50. Viñas, J.; Pérez-Serra, A.; Vidal, O.; Alvarado Bremer, J.R.; Pla, C. Genetic Differentiation between Eastern and Western Mediterranean Swordfish Revealed by Phylogeographic Analysis of the Mitochondrial DNA Control Region. ICES J. Mar. Sci. 2010, 67, 1222–1229. [Google Scholar] [CrossRef] [Green Version]
  51. Nesbø, C.L.; Rueness, E.K.; Iversen, S.A.; Skagen, D.W.; Jakobsen, K.S. Phylogeography and Population History of Atlantic Mackerel (Scomber Scombrus L.): A Genealogical Approach Reveals Genetic Structuring among the Eastern Atlantic Stocks. Proc. R. Soc. B Biol. Sci. 2000, 267, 281–292. [Google Scholar] [CrossRef] [Green Version]
  52. Alvarado Bremer, J.R.; Stequert, B.; Robertson, N.W.; Ely, B. Genetic Evidence for Inter-Oceanic Subdivision of Bigeye Tuna (Thunnus obesus) Populations. Mar. Biol. 1998, 132, 547–557. [Google Scholar] [CrossRef]
  53. Selkoe, K.A.; Toonen, R.J. Microsatellites for Ecologists: A Practical Guide to Using and Evaluating Microsatellite Markers. Ecol. Lett. 2006, 9, 615–629. [Google Scholar] [CrossRef] [PubMed]
  54. Agawa, Y.; Iwaki, M.; Komiya, T.; Honryo, T.; Tamura, K.; Okada, T.; Yagishita, N.; Kobayashi, T.; Sawada, Y. Identification of Male Sex-Linked DNA Sequence of the Cultured Pacific Bluefin Tuna Thunnus Orientalis. Fish. Sci. 2015, 81, 113–121. [Google Scholar] [CrossRef]
  55. Carlsson, J. Effects of Microsatellite Null Alleles on Assignment Testing. J. Hered. 2008, 99, 616–623. [Google Scholar] [CrossRef] [Green Version]
  56. Montes, I.; Iriondo, M.; Manzano, C.; Arrizabalaga, H.; Jiménez, E.; Pardo, M.Á.; Goñi, N.; Davies, C.A.; Estonba, A. Worldwide Genetic Structure of Albacore Thunnus alalunga Revealed by Microsatellite DNA Markers. Mar. Ecol. Prog. Ser. 2012, 471, 183–191. [Google Scholar] [CrossRef]
  57. Reglero, P.; Ciannelli, L.; Alvarez-Berastegui, D.; Balbín, R.; López-Jurado, J.L.; Alemany, F. Geographically and Environmentally Driven Spawning Distributions of Tuna Species in the Western Mediterranean Sea. Mar. Ecol. Prog. Ser. 2012, 463, 273–284. [Google Scholar] [CrossRef] [Green Version]
  58. Russo, S.; Torri, M.; Patti, B.; Reglero, P.; Álvarez-Berastegui, D.; Cuttitta, A.; Sarà, G. Unveiling the Relationship Between Sea Surface Hydrographic Patterns and Tuna Larval Distribution in the Central Mediterranean Sea. Front. Mar. Sci. 2021, 8, 708775. [Google Scholar] [CrossRef]
  59. Oray, I.; Karakulak, F.S.; Alicli, Z.; Ates, C.; Kahraman, A. First Evidence of Spawning in the Eastern Mediterranean Sea. Preliminary Results of Tuna Larval Survey in 2004. Collect. Vol. Sci. Pap.-ICCAT 2005, 58, 1341–1347. [Google Scholar]
  60. Macias, D.; Cózar, A.; Garcia-Gorriz, E.; González-Fernández, D.; Stips, A. Surface Water Circulation Develops Seasonally Changing Patterns of Floating Litter Accumulation in the Mediterranean Sea. A Modelling Approach. Mar. Pollut. Bull. 2019, 149, 110619. [Google Scholar] [CrossRef]
  61. Morote, E.; Olivar, M.P.; Pankhurst, P.M.; Villate, F.; Uriarte, I. Trophic Ecology of Bullet Tuna Auxis Rochei Larvae and Ontogeny of Feeding-Related Organs. Mar. Ecol. Prog. Ser. 2008, 353, 243–254. [Google Scholar] [CrossRef] [Green Version]
  62. Cuttitta, A.; Torri, M.; Zarrad, R.; Zgozi, S.; Jarboui, O.; Quinci, E.M.; Hamza, M.; Abdulfatah, E.; Haddoud, D.; El Turki, A.; et al. Linking Surface Hydrodynamics to Planktonic Ecosystem: The Case Study of the Ichthyoplanktonic Assemblages in the Central Mediterranean Sea. Hydrobiologia 2018, 821, 191–214. [Google Scholar] [CrossRef]
  63. Mullins, R.B.; McKeown, N.J.; Sauer, W.H.H.; Shaw, P.W.; Grant, W.S. Genomic Analysis Reveals Multiple Mismatches between Biological and Management Units in Yellowfin Tuna (Thunnus albacares). ICES J. Mar. Sci. 2018, 75, 2145–2152. [Google Scholar] [CrossRef]
Figure 1. Geographical sampling of the bullet tuna included in the present paper. Black dots indicate sampling locations. Olhão, Ceuta, Málaga, Cartagena, Valencia, Tarragona, Alger, Mahdia. Main geographic areas are indicated as follows: Strait of Gibraltar (SG) coinciding with Ceuta location, Almeria Oran Front (AOF), Strait of Sicily (SS), western Mediterranean Sea (WMS) and eastern Mediterranean Sea (EMS). Colour pattern indicates the genetically identified stocks according to both mtDNA and microsatellite loci (see Discussion Section).
Fishes 07 00300 g001
Figure 2. Haplotype network of mtDNA CR marker. Colour pattern represents the location where each haplotype was identified. Each circle represents a single haplotype. The size of the circles indicates the number of individuals with the shared haplotype. Haplotypes were assigned to the previously described mitotype I and II based on their reference sequence [22].
Fishes 07 00300 g002
Figure 3. Population structure analysis for 7 microsatellite loci. Each individual is represented by a vertical bar where colour pattern indicates the genotypic cluster/s that are associated. Following Evanno (2005) [46] the best-supported model was K = 2.
Fishes 07 00300 g003
Table 1. Sampling data, capture locations, location code. For mtDNA CR, original study Ollé et al. (2019) [30] (1), Allaya et al. (2015) [29] (2), sample size (n), number of haplotypes (M), haplotype diversity and standard deviation (h+/−SD), nucleotide diversity and standard deviation (π+/−SD). Data for the seven microsatellites were generated in this study, sample size (n), expected heterozygosis and standard deviation (He+/−SD), mean number alleles per locus and standard deviation (A+/−SD), allelic richness and standard deviation (Ar+/−SD), Hardy Weinberg equilibrium across all loci (HW). * Significant deviations from HW equilibrium (p < 0.05). *** Highly significant deviations from HW equilibrium (p < 0.001). Ceuta is referenced in the text and legends as Strait of Gibraltar to avoid confusion with the two North African locations. †† For mtDNA CR marker individuals were collected from Ghar el Meh, Sidi Daoud and Mahdia, since no genetic heterogeneity was found between them [29], we simplified the name. For the microsatellites loci, only individuals from Mahdia amplified properly.
mtDNA CRMicrosatellites
AreaLocationStudynMh ± SDπ ± SDnHeAArHW
Atlantic Iberian Peninsula
Olhão152510.999 ± 0.0040.049 ± 0.024520.886 ± 0.09322.143 ± 7.05813.338 ± 3.8230.000 ***
Strait of Gibraltar
Ceuta 120201.000 ± 0.0160.041 ± 0.021190.901 ± 0.05614.290 ± 3.10112.624 ± 2.8090.003 *
East Iberian Peninsula
Málaga138370.999 ± 0.0070.040 ± 0.020300.905 ± 0.06819.140 ± 5.02413.819 ± 3.3520.000 ***
Cartagena197971.000 ± 0.0020.046 ± 0.023510.907 ± 0.05721.429 ± 5.82713.220 ± 3.0900.009
Valencia121211.000 ± 0.0150.044 ± 0.023190.895 ± 0.08015.000 ± 4.16313.125 ± 3.6210.14
Tarragona149480.999 ± 0.0040.046 ± 0.023480.902 ± 0.06021.714 ± 5.82313.593 ± 3.4220.000 ***
North Africa
AlgerThis study45410.996 ± 0.0060.043 ± 0.021290.873 ± 0.07415.143 ± 2.54511.779 ± 1.6340.000 ***
Mahdia ††2109960.998 ± 0.0020.041 ± 0.020280.878 ± 0.05013.429 ± 2.29911.448 ± 1.9230.000 ***
All samples 4314011.000 ± 0.0000.044 ± 0.022276
Table 2. Above diagonal ɸST pairwise comparisons between locations. Below are diagonal FST pairwise comparisons for the 7 microsatellites loci from Arlequin. In bold, significant ɸST and FST values (p < 0.05).
OlhãoStrait of GibraltarMálagaCartagenaValenciaTarragonaAlgerMahdia
Olhão--0.0320.0260.007−0.0040.0040.0630.032
Strait of Gibraltar0.003--0.0020.0100.0100.0060.0430.054
Málaga0.0040.004--0.003−0.004−0.0010.0150.045
Cartagena0.0040.0020.001--−0.010−0.0020.0380.033
Valencia0.0030.0050.0010.001--−0.0110.0120.039
Tarragona0.0070.0020.0050.0030.007--0.0350.030
Alger0.020.0220.0190.0190.0210.019--0.098
Mahdia0.0490.0460.0460.040.0440.0380.026--
Table 3. Summary of ɸ and F-statistics obtained from AMOVA to test the best clustering model for both mtDNA and Microsatellites.
ClustersmtDNAMicrosatellites
Fixation IndexpFixation Indexp
Iberian Peninsula vs. Alger vs. MahdiaɸCT = 0.0370.035 ± 0.005FCT = 0.0270.036 ± 0.008
Mediterranean vs. AtlanticɸCT = −0.0030.493 ± 0.017FCT = −0.0040.403 ± 0.015
Iberian Peninsula vs. North AfricaɸCT = 0.0030.391 ± 0.015FCT = 0.0080.115 ± 0.010
East Iberian Peninsula vs. Olhão vs. Mahdia vs. AlgerɸCT = 0.0360.020 ± 0.005FCT = 0.0170.097 ± 0.009
GlobalɸST = 0.0280.000 ± 0.000FST = 0.0150.000 ± 0.000
Table 4. Hardy–Weinberg equilibrium across locations for the 7 microsatellites loci. In bold, significant p-values after Bonferroni correction.
Aro 3-37Aro 2-40Aro 1-59Aro 2-15Aro 4-13Aro 1-3Aro 1-10Total per Location
Olhão0.5780.3970.4160.0450.0200.0000.0000.000
Strait of Gibraltar0.7910.9160.5390.2960.0170.0000.1250.003
Málaga0.2350.0910.4560.9780.0000.4710.0120.000
Cartagena0.7020.5150.1960.1490.0060.6310.0090.009
Valencia0.7950.8710.5800.0430.0690.7770.0570.140
Tarragona0.7800.1300.0210.6140.0000.0280.0000.000
Alger0.1320.9210.5650.0000.0000.0230.0060.000
Mahdia0.0750.8460.1370.4850.0000.3600.0240.000
Total per locus0.4990.6730.1510.0000.0000.0000.0000.000
Publisher’s Note: MDPI stays neutral with regard to jurisdictional claims in published maps and institutional affiliations.

