1. Introduction
Life history traits and local geographical habitat limitations of species contribute to their sensitivity to anthropogenic pressures [
1,
2,
3,
4,
5,
6]. In the ocean, the sustainability of most commercial fish species is being compromised mainly by climate change and fisheries [
7,
8]. Specifically, deep- and cold-water species are mostly K-strategists (i.e., large-sized, with a long generation time, slow growth, late maturity, and low fecundity); thus, they recover more slowly than shallower- and warmer-water species. Consequently, these species show particularly low resilience to environmental stress and overexploitation [
9].
At a global scale, changing ocean conditions are leading to shifts in marine species’ distribution, moving poleward or to deeper waters, to avoid suboptimal environmental conditions [
10,
11]. These relocations are the result of contrasting processes at regional levels at the opposite edges of a species’ distribution range: populations inhabiting the cool edge may benefit from sea warming, leading to improved performance and edge expansion [
12]; oppositely, populations close to the warm edge of their range suffer from temperatures higher than their optimal, resulting in population decline and edge contraction [
13,
14]. The local rate of these processes is partly determined by species traits [
15] and regional differences [
16]. For instance, deep- and cold-water species may undergo higher rates of local extinction [
17].
Molva is a genus of the commercially exploited temperate- and cold-water gadoids from the North Atlantic and the Mediterranean Sea that comprises three species: the ling,
Molva molva; the blue ling,
M. dypterygia; and the Mediterranean ling,
M. macrophthalma. Similar to most deep-water fish,
Molva species show a K life-history strategy [
18], which confers on them a certain degree of sensitivity. Given this, the health of the
Molva populations will be determined by their exposure to pressures. A recent assessment of the health status of
Molva species from the Atlantic Ocean and the Mediterranean Sea [
19] showed a decline in the condition and abundance of most populations, evidencing their low sustainability in the context of fishing activity and climate change. In particular, the populations closer to the warmer edge (i.e.,
M. macrophthalma in the southern North Atlantic and the Mediterranean Sea) were identified as most at risk of sea warming and showed a poorer health status, whereas the populations in the North Atlantic seemed to be the only ones able to rebuild, i.e., the Icelandic population of
M. dypterygia.
Generally, Mediterranean demersal fisheries show higher climate vulnerability than Atlantic demersal fisheries [
16]. Species vulnerability may be even higher in the northwest of this basin, considered a cul-de-sac in a sea-warming hotspot, where a species shifting its range encounters geographical barriers [
20]. In fact,
M. macrophthalma and several other cold-water species from the northwestern Mediterranean Sea are experiencing a climate-related reduction in abundance [
21], and
M. molva has disappeared from regular commercial catches [
21,
22,
23]. On the other hand, in Icelandic waters,
M. dypterygia fisheries have expanded to the north since 1996 [
24,
25].
Based on the above considerations, studying the life history traits of these populations becomes particularly important to obtain insights into their vulnerability to the main current threats. A deeper understanding of fish condition oscillations, their reproductive strategy, and their energy trade-offs is especially needed to assess the population vulnerability and predict the population dynamics [
26]. For instance, species with a narrower reproductive window are likely to undergo higher rates of local extinction due to their higher sensitivity to climate change [
17]. The fecundity style (determinate, indeterminate) is another key aspect for the prediction of populations’ productivity, but this remains unknown for many species, including the Mediterranean ling. Species that exhibit determinate fecundity complete the recruitment of oocytes prior to the onset of the spawning season, whereas in species with indeterminate fecundity, the recruitment of primary oocytes to secondary growth is maintained throughout the spawning season [
27]. Despite its relevance to the understanding of population dynamics and the response to environmental changes, knowledge of the key aspects of the biology of deep-water fish remains limited.
Regarding the
Molva genus,
M. molva has been the focus of more extensive research, whereas the bibliography on
M. macrophthalma and
M. dypterygia is less abundant.
M. dypterygia and
M. macrophthalma have only relatively recently been considered as two distinct species [
21,
28], but their similarity in terms of morphology, ecology, and habitat preference caused confusion, hence, for a long time, some researchers identified them as two subspecies, the northern form
M. dypterygia dypterygia and the southern form
M. dypterygia macrophthalma [
29,
30,
31,
32]. Blue ling,
M. dypterygia, is mainly found on the continental shelf and slopes of the North Atlantic and adjacent Artic region, at depths of 200–1200 m [
33] from Norway, Iceland, and south-east Greenland to Scotland. It is mainly caught by commercial trawlers and longliners at depths greater than 500 m [
24]. At least two separated latitudinal components of
M. dypterygia are found in the northeastern Atlantic based on length, age structures, growth, maturity, and egg and larvae distribution [
24]. The available peer-reviewed literature on the blue ling is relatively small and mostly focused on demographical parameters of size distribution, sex-ratio, growth rate, spawning aggregations distribution, size at maturity, estimations of fecundity, and population health [
19,
34,
35,
36], and most up-to-date works belong to ICES reports of the Working Group on Deep-Sea Fisheries [
24]. The Mediterranean ling
M. macrophthalma is distributed along the south Atlantic and Mediterranean continental shelves, displacing the blue ling in lower latitudes from southern Ireland to Mauritania. It can be found at depths between 180 and 1000 m (Rafinesque 1810), and it is mainly caught by commercial trawlers and sporadically by longliners. This species is considered Data Deficient [
37] and knowledge regarding its life-history traits is very scarce [
21,
30].
Here, we describe the condition and reproductive status of the Mediterranean ling
M. macrophthalma, in the north-western Mediterranean Sea, a population inhabiting the warmer edge of the genus distribution. This population is in a poor health status [
19] and is experiencing a climate-related reduction in abundance [
21]. Additionally, we contrasted the results of this Mediterranean population with a much northern stock. For this comparison, we used samples from the Icelandic population of blue ling,
M. dypterygia, a population of the same genus inhabiting the opposite limit of distribution (colder edge). This Icelandic population is among the few
Molva populations that still presents a good health status [
19,
24]. We predicted that the northern form,
M. dypterygia from Iceland, would show better performance than the impaired southern form,
M. macrophthalma from north-western Mediterranean.
2. Materials and Methods
2.1. Sampling
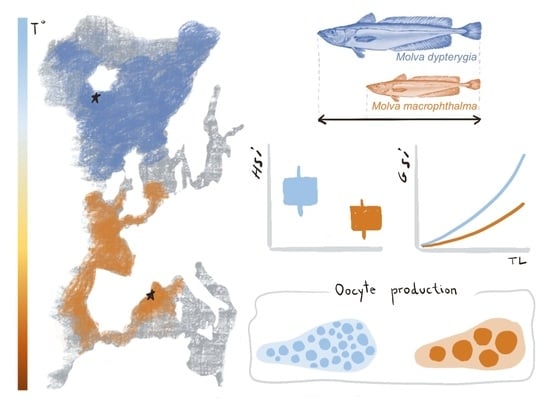
Two different case studies were studied in this work. The main case study (MED) focused on a southern population of
Molva genus,
M. macrophthalma from the north-western Mediterranean Sea. Results are compared with a secondary case study (ICE) focused on a northern population of
Molva,
M. dypterygia from Icelandic waters (
Figure 1). We will refer to the case studies as SITEs.
Samples of M. macrophthalma were collected monthly for a full annual cycle, from July 2015 to June 2016, from commercial bottom trawlers and long-liners fishing in the Gulf of Lion (north-western Mediterranean Sea, GFCM/GSA 05). Due to its low abundance and low commercial value, sampling limitations were expected. Hence, we aimed to obtain as many individuals as possible and did not set a target number. For this, we counted with the collaboration of fishermen, who let us know when this species was present in their daily caught. Individual specimens were collected shortly after being landed at the five main Catalan fishing harbors of the region and immediately transported in cooling containers to the laboratory where they were processed.
Samples of M. dytperygia were obtained from Icelandic waters (ICES division 5a), which belong to the northern stock together with Greenland waters (ICES Subarea 14). Sampling of M. dypterygia from Iceland could only be performed in November 2015 and February-April 2016, coinciding with the autumn and spring Icelandic Groundfish Vessel Surveys (IGFS) conducted by the Marine Research Institute of Reykjavik (MRI). In November, samples were collected during the IGFS and immediately processed on board. In February–April, when the IGFS takes place again, no blue ling was caught during the vessel survey, thus samples were obtained from commercial trawlers at the main fishing harbours of Iceland during March, stored in cooling containers, and immediately transported to the MRI laboratories where they were processed.
Total length (TL, ±0.1 cm), total weight (TW, ±0.01 g), eviscerated weight (EW, ±0.01 g), liver weight (LW, ±0.1 mg), and gonad weight (GW, ±0.1 mg) were recorded. Sex and gonad development phase (MAT) were macroscopically determined using standardised terminology (Brown-Peterson et al., 2011) and validated using histological sections. The gonads were removed, and the left lobe was fixed in 4% buffered formalin for histological assessment of reproduction.
2.2. Condition
The condition status of individuals was assessed through morphometric and organosomatic indicators. The morphometric estimation was based on the Le Cren’s relative condition factor (Kn), which measures the deviation of an individual from the averaged weight at length in the respective sample (Lloret et al. 2014) as follows: Kn = EW/Ewe where EWe is the estimated eviscerated weight of that fish derived from the weight-length relationship obtained from all the individuals sampled. The organosomatic estimation was based on the relative weight of the main energy deposit tissue. Given that the liver is the major lipid storage in most gadoid species (e.g., [
38]), the hepatosomatic index (HSI) was calculated for each individual as follows: HSI = 100 × LW/EW, where LW is the liver weight. The correlation between both indicators was assessed.
2.3. Reproduction
The energy allocated to reproduction and the reproductive cycle progress was estimated through the gonadosomatic index (GSI) as GSI = 100 × GW/EW. A cross-slide of the central area of the left lobe of each fixed ovary was dehydrated, cleared with histoclear II and embedded in paraffin, histologically sectioned at 4 μm, and stained with haematoxylin and eosin [
39]. Sections were screened for validation of the assigned MAT. This validation was based on the most advanced oocyte stage observed and the presence of post-ovulatory follicles (POF), α-atresia, β-atresia, and the relative amount of connective tissue. Based on cytoplasmic processes and the existing literature [
40,
41], the stages of oocyte development (i) were adapted (
Supplementary Materials, Table S1).
To obtain insights into the main reproductive tactics, stereological methods were applied. For all females at late developing (DV), spawning capable (SC) and actively spawning (AS) ovary development phases (MED:
n = 13, ICE:
n = 7), histological sections were analysed to estimate (i) the volume fraction (Vf) of stage
i oocytes, POF, atresia, connective tissue, and blood; and, (ii) the mean volume-based oocyte diameter which was subsequently corrected into the formalin-fixed dimensions (cODv
i) applying the correction factor from Saber et al. 2015 [
42]. Oocyte diameter was estimated for all oocytes from the earliest stages of primary growth to the migratory nucleus stage. It was not feasible to obtain reliable histological measurements of hydrated oocytes due to their excessive shrinkage. The stage
i oocyte packing density (OPD
i, [
43]) and the total number of stage
i oocytes standardised for fish TL (TL-based NOi, [
44]) was estimated. The aforementioned calculations can be consulted in the
Supplementary Materials, Text S1 and Figure S1. All the histological sections were screened for atretic oocytes but none was detected. The image analysis of the histological sections was undertaken using the software ImageJ [
45], and the ObjectJ plugin (
https://sils.fnwi.uva.nl/bcb/object; accessed date: November 2020).
2.4. Data Analysis
The length at which 50% of the individuals were mature (L50) was estimated. Binary maturity observations (0 = immature, 1 = mature) and length (TL) were fitted to binary logistic models to predict the probability that an individual was mature based on its length. Maturity ogives (maturity-at-length probability plots) were constructed based on logistic equations [
46].
First, after rejecting normality and homoscedasticity using Shapiro–Wilk and Levene’s tests, respectively, we checked the differences in the mean values of TL, HSI, GSI and Kn between immature and mature individuals and between sexes using the Mann–Whitney U test. Based on the results, immature individuals and males were excluded from subsequent analysis because significant differences arose for the main variables (
Supplementary Materials, Table S2), and also because there were not enough immature and male specimens to be included in further data exploration for comparisons.
For each SITE, the possible correlations between TL, HIS, GIS and Kn were assessed using the Spearman’s rank-correlation coefficient. Statistically significant coefficients over 0.5 were taken into consideration. The differences in the mean values of TL, HSI and GSI between gonad development phases (MAT) were checked using the Kruskal–Wallis test followed by the post hoc Dunn test with Bonferroni adjustment. Subsequently, and because differences of the somatic indices between MATs arose, analysis of covariances (two-way ANCOVA) (using total length TL as covariate) and subsequent post hoc Bonferroni’s multiple comparison tests were used to compare hepato-somatic (HSI), gonado-somatic (GSI), and Kn indices between the two SITEs for each MAT.
The relationship between reproduction and condition parameters was explored at the levels of MATs through generalised linear models (GLMs), where the equality of slopes was tested. In this sense, GLMs were fitted to GSI, using HSI, MAT, SITE and their three-way interaction as predictors. The three-way interaction was rejected in an ANOVA test, and only the first order interaction between HSI and MAT was retained in the model, as well as the SITE with additive effect. After checking for the assumptions of the models, the specimens at AS phase were not included in the model because they were detected as outliers (note that there were only 2 specimens at this gonad development phase).
Regarding oocyte size, mean cODvi was compared between SITEs using the Mann–Whitney U test. As for oocyte production, the correlation between the number of stagei oocytes (NOi) and fish size (TL) was assessed by Spearman correlation tests and fitted to power functions using females at late-DV (only those showing a gap), SC and AS phases. The number of stagei oocytes standardized for size (TL-based NOi) was compared among SITEs through Mann–Whitney U-test. Correlation of NOi and TL-based NOi with condition parameters (HSI and Kn) was explored through Spearmen correlation tests.
All statistical analyses were performed using R version 3.2.3 (
www.r-project.org/). All tests were performed according to standard routines and the level of statistical significance adopted was
p < 0.05.
3. Results
The sampling efforts provided a total of 89 specimens of
M. macrophthalma in the north-western Mediterranean Sea and 81 specimens of
M. dypterygia from Icelandic waters. The monthly distribution of the samples and gonad development phases can be consulted at the
Supplementary Materials (Tables S3 and S4, respectively). The overall L50 of
M. macrophthalma was estimated at 512 mm (
Supplementary Materials, Figure S2) and no immature individuals were found with TL > 522 mm. Regarding the specimens of
M. dypterygia from Icelandic waters, the overall L50 was estimated at 665 mm (
Figure S2) and no immature individuals were found with TL > 665 mm.
The Spearman Rank Correlation test showed a positive correlation between the two condition indicators Kn and HSI (ICE: Rho = 0.68,
p < 0.01; MED: Rho = 0.71,
p < 0.01,
Supplementary Materials, Figure S3). Reproductive investment (GSI) correlated positively with condition factor Kn (ICE: Rho = 0.57,
p < 0.01; MED: Rho = 0.5,
p < 0.01) and fish size (MED: Rho = 0.5,
p < 0.01).
Because the number of males was limited (2 in the Mediterranean and 17 in Iceland) and some variables differed between sexes and between mature and immature specimens (i.e., on average, mature females of
M. dypterygia from Icelandic waters were significantly larger and showed significantly higher condition than mature males) (
Supplementary Materials, Table S2), the following analyses focused only on mature females. The total length of mature females ranged from 460 to 1043 mm for
M. macrophthalma and from 760 to 1330 mm for
M. dypterygia (
Table 1). As expected, significant differences of gonads relative weight and body condition were found between specimens at different MATs (
Table 1). Mean GSI values were significantly higher in AS, SC and DV specimens from both SITES. For both case studies, the averaged HSI was higher in specimens in the developing (DV) and spawning capable (SC) phases, and the lower values were found in the actively spawning phases (AS) (
Table 1).
Regarding the comparison between SITEs, interesting differences arose for the main reproductive and condition parameters. The analysis of covariance showed a statistically significant interaction between SITE and MAT on the GSI (F
(3,114) = 23.65,
p = 5.57 × 10
−12). In this regard, at DV and SC gonad development phases, the northern species
M. dypterygia showed significantly higher reproductive investment than the southern species
M. macrophthalma (
Table 1), as evidenced through the post hoc Bonferroni pairwise comparisons (SC: adj
p = 1.17 × 10
−7; DV: adj
p = 1.41 × 10
−13). No significant differences were found between SITES for the other MATs. Concerning condition, the northern species showed higher HSI than the southern species at all MAT levels (
Table 1), but statistical significance was only detected for the RT gonad development phase (Bonferroni pairwise comparisons, adj
p = 0.0457). The averaged Kn did not show significant differences between the two SITES for any gonadal development phase (adj
p > 0.05). Note that no AS specimens were available for
M. dypterygia from Icelandic waters, thus comparisons for this gonad development phase are missing.
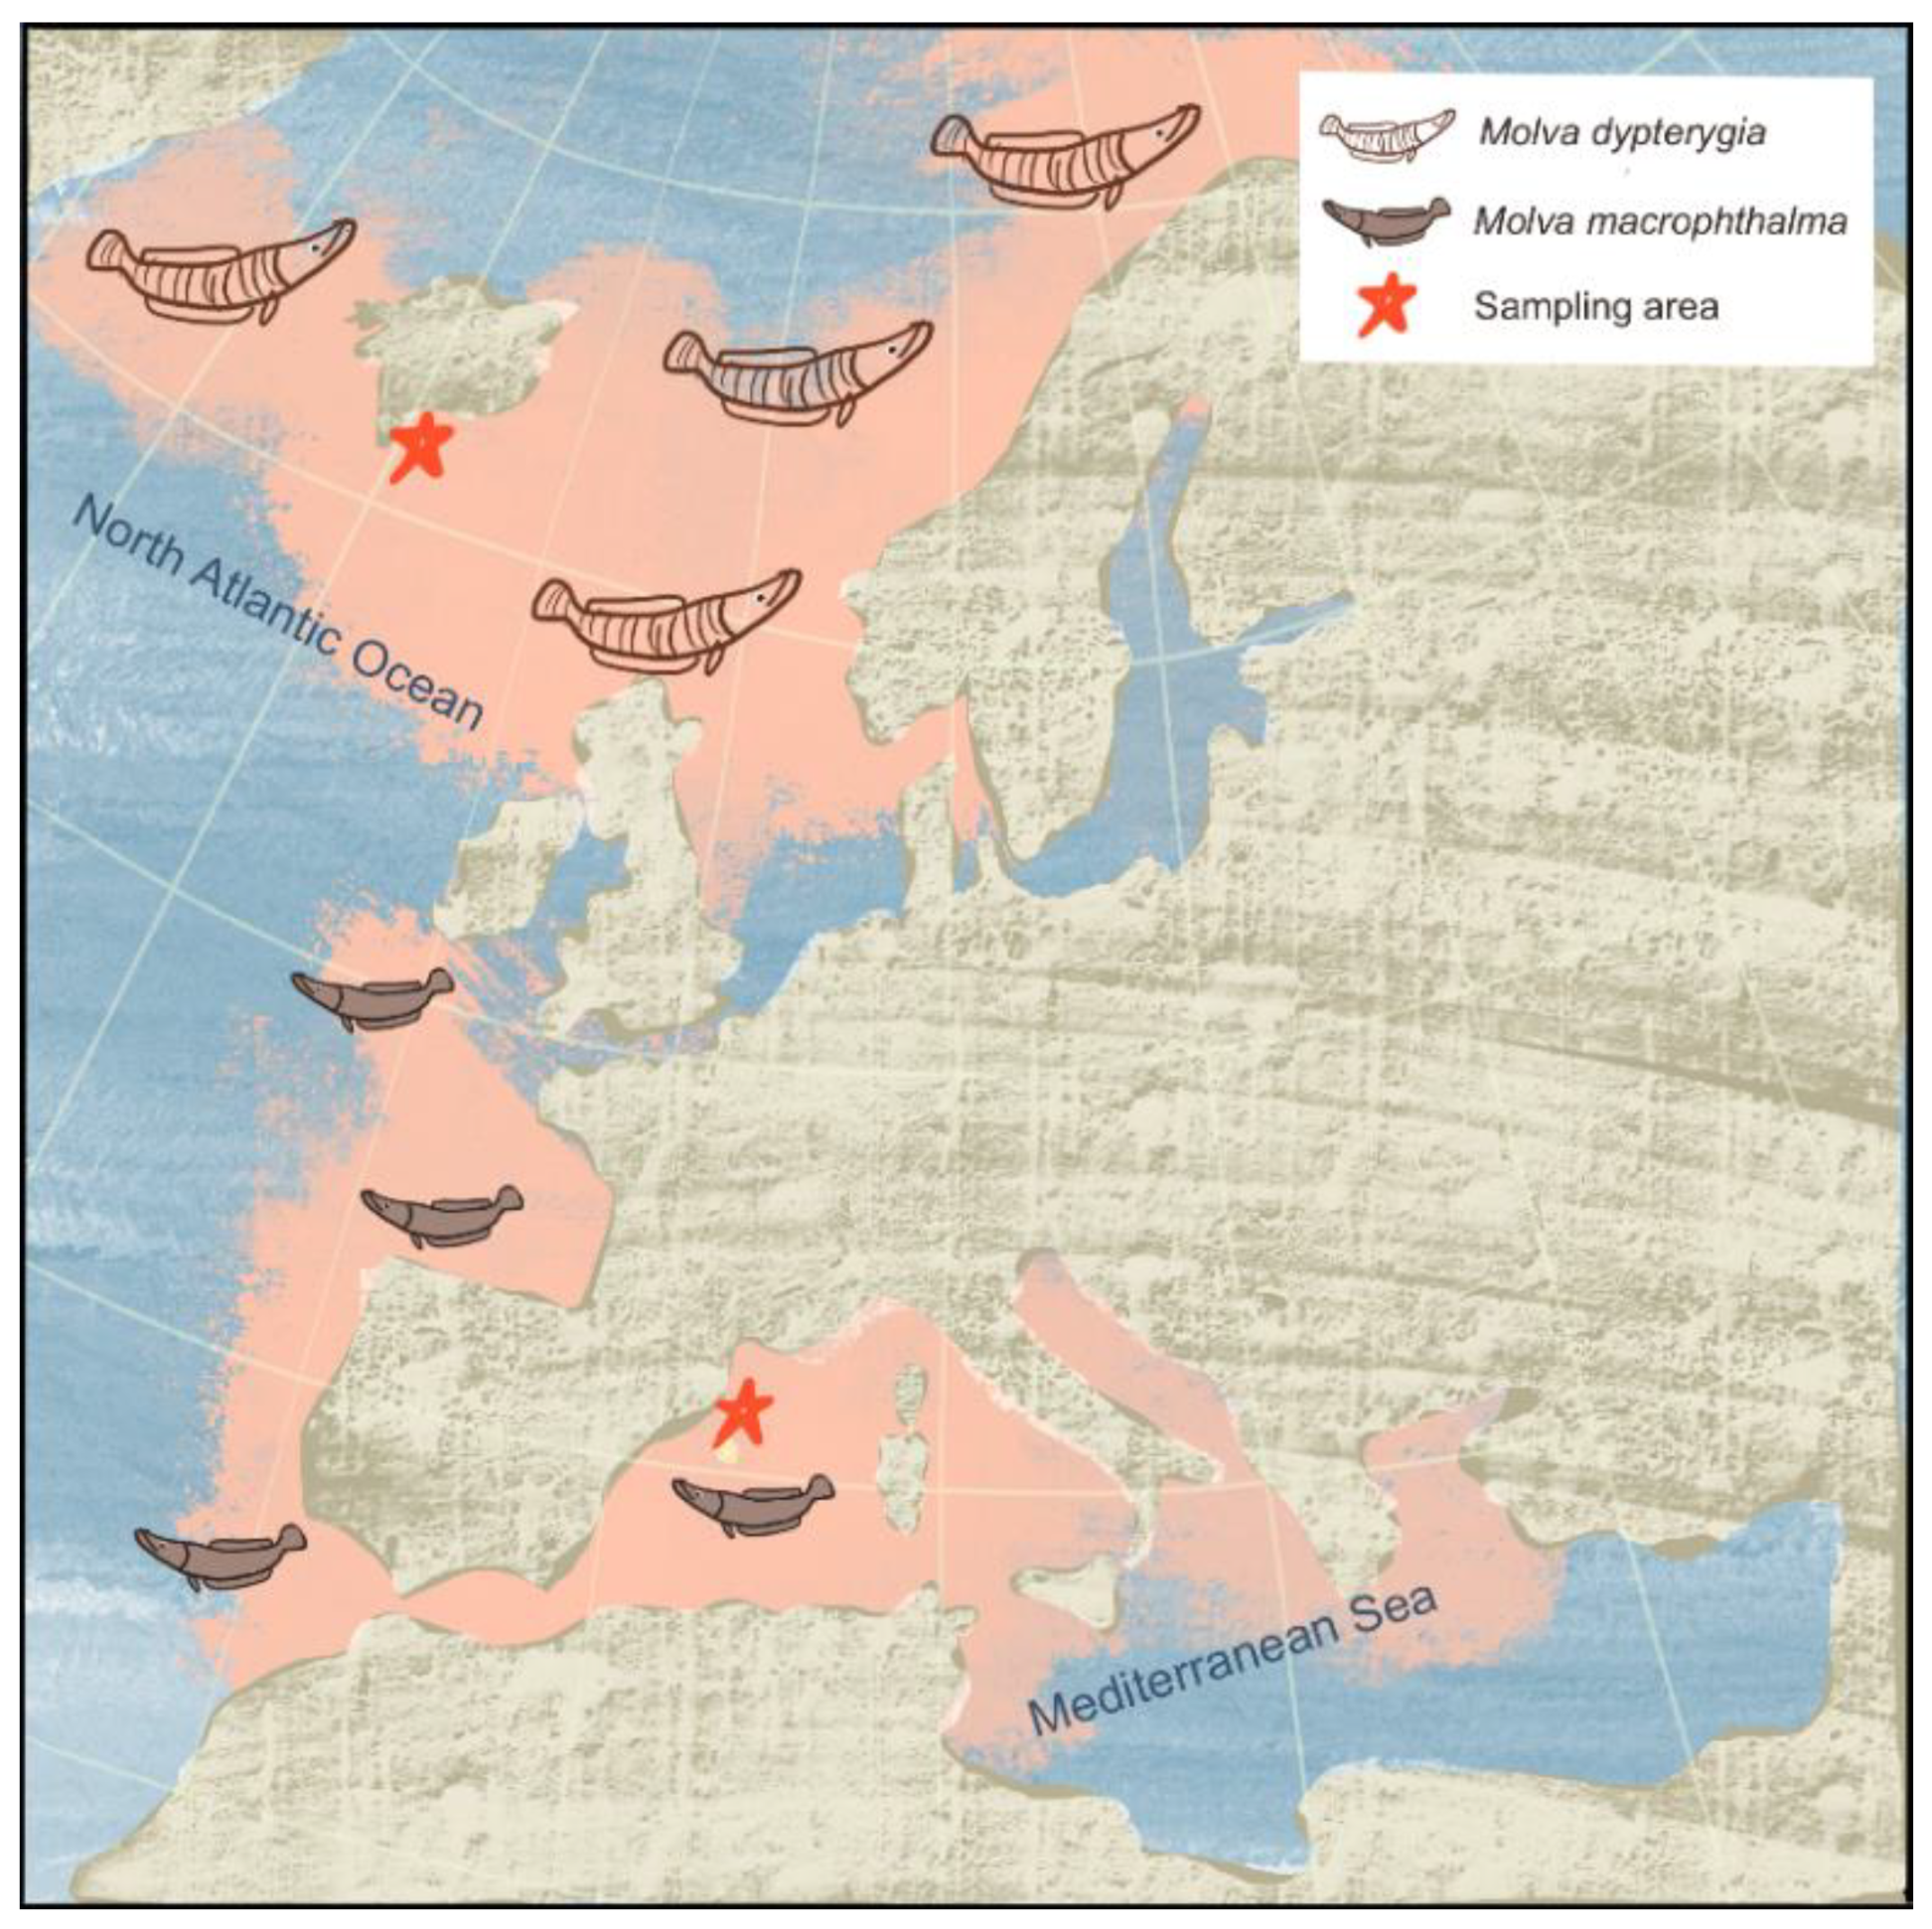
The relationship between condition and reproductive investment differed at the different gonad development phases, as shown by the unequal slopes among MATs of the regression between GSI and HSI (F
(3,111) = 8.93,
p = 2.38 × 10
−5;
Supplementary Materials, Table S5). For both species, the variation of GSI with HSI was positive for the pre-spawning specimens (DV and SC phases) and negative for the post-spawning specimens (RS and RT phases) (
Table 2,
Figure 2), supporting the investment of the liver’s fat depots to gonadal development.
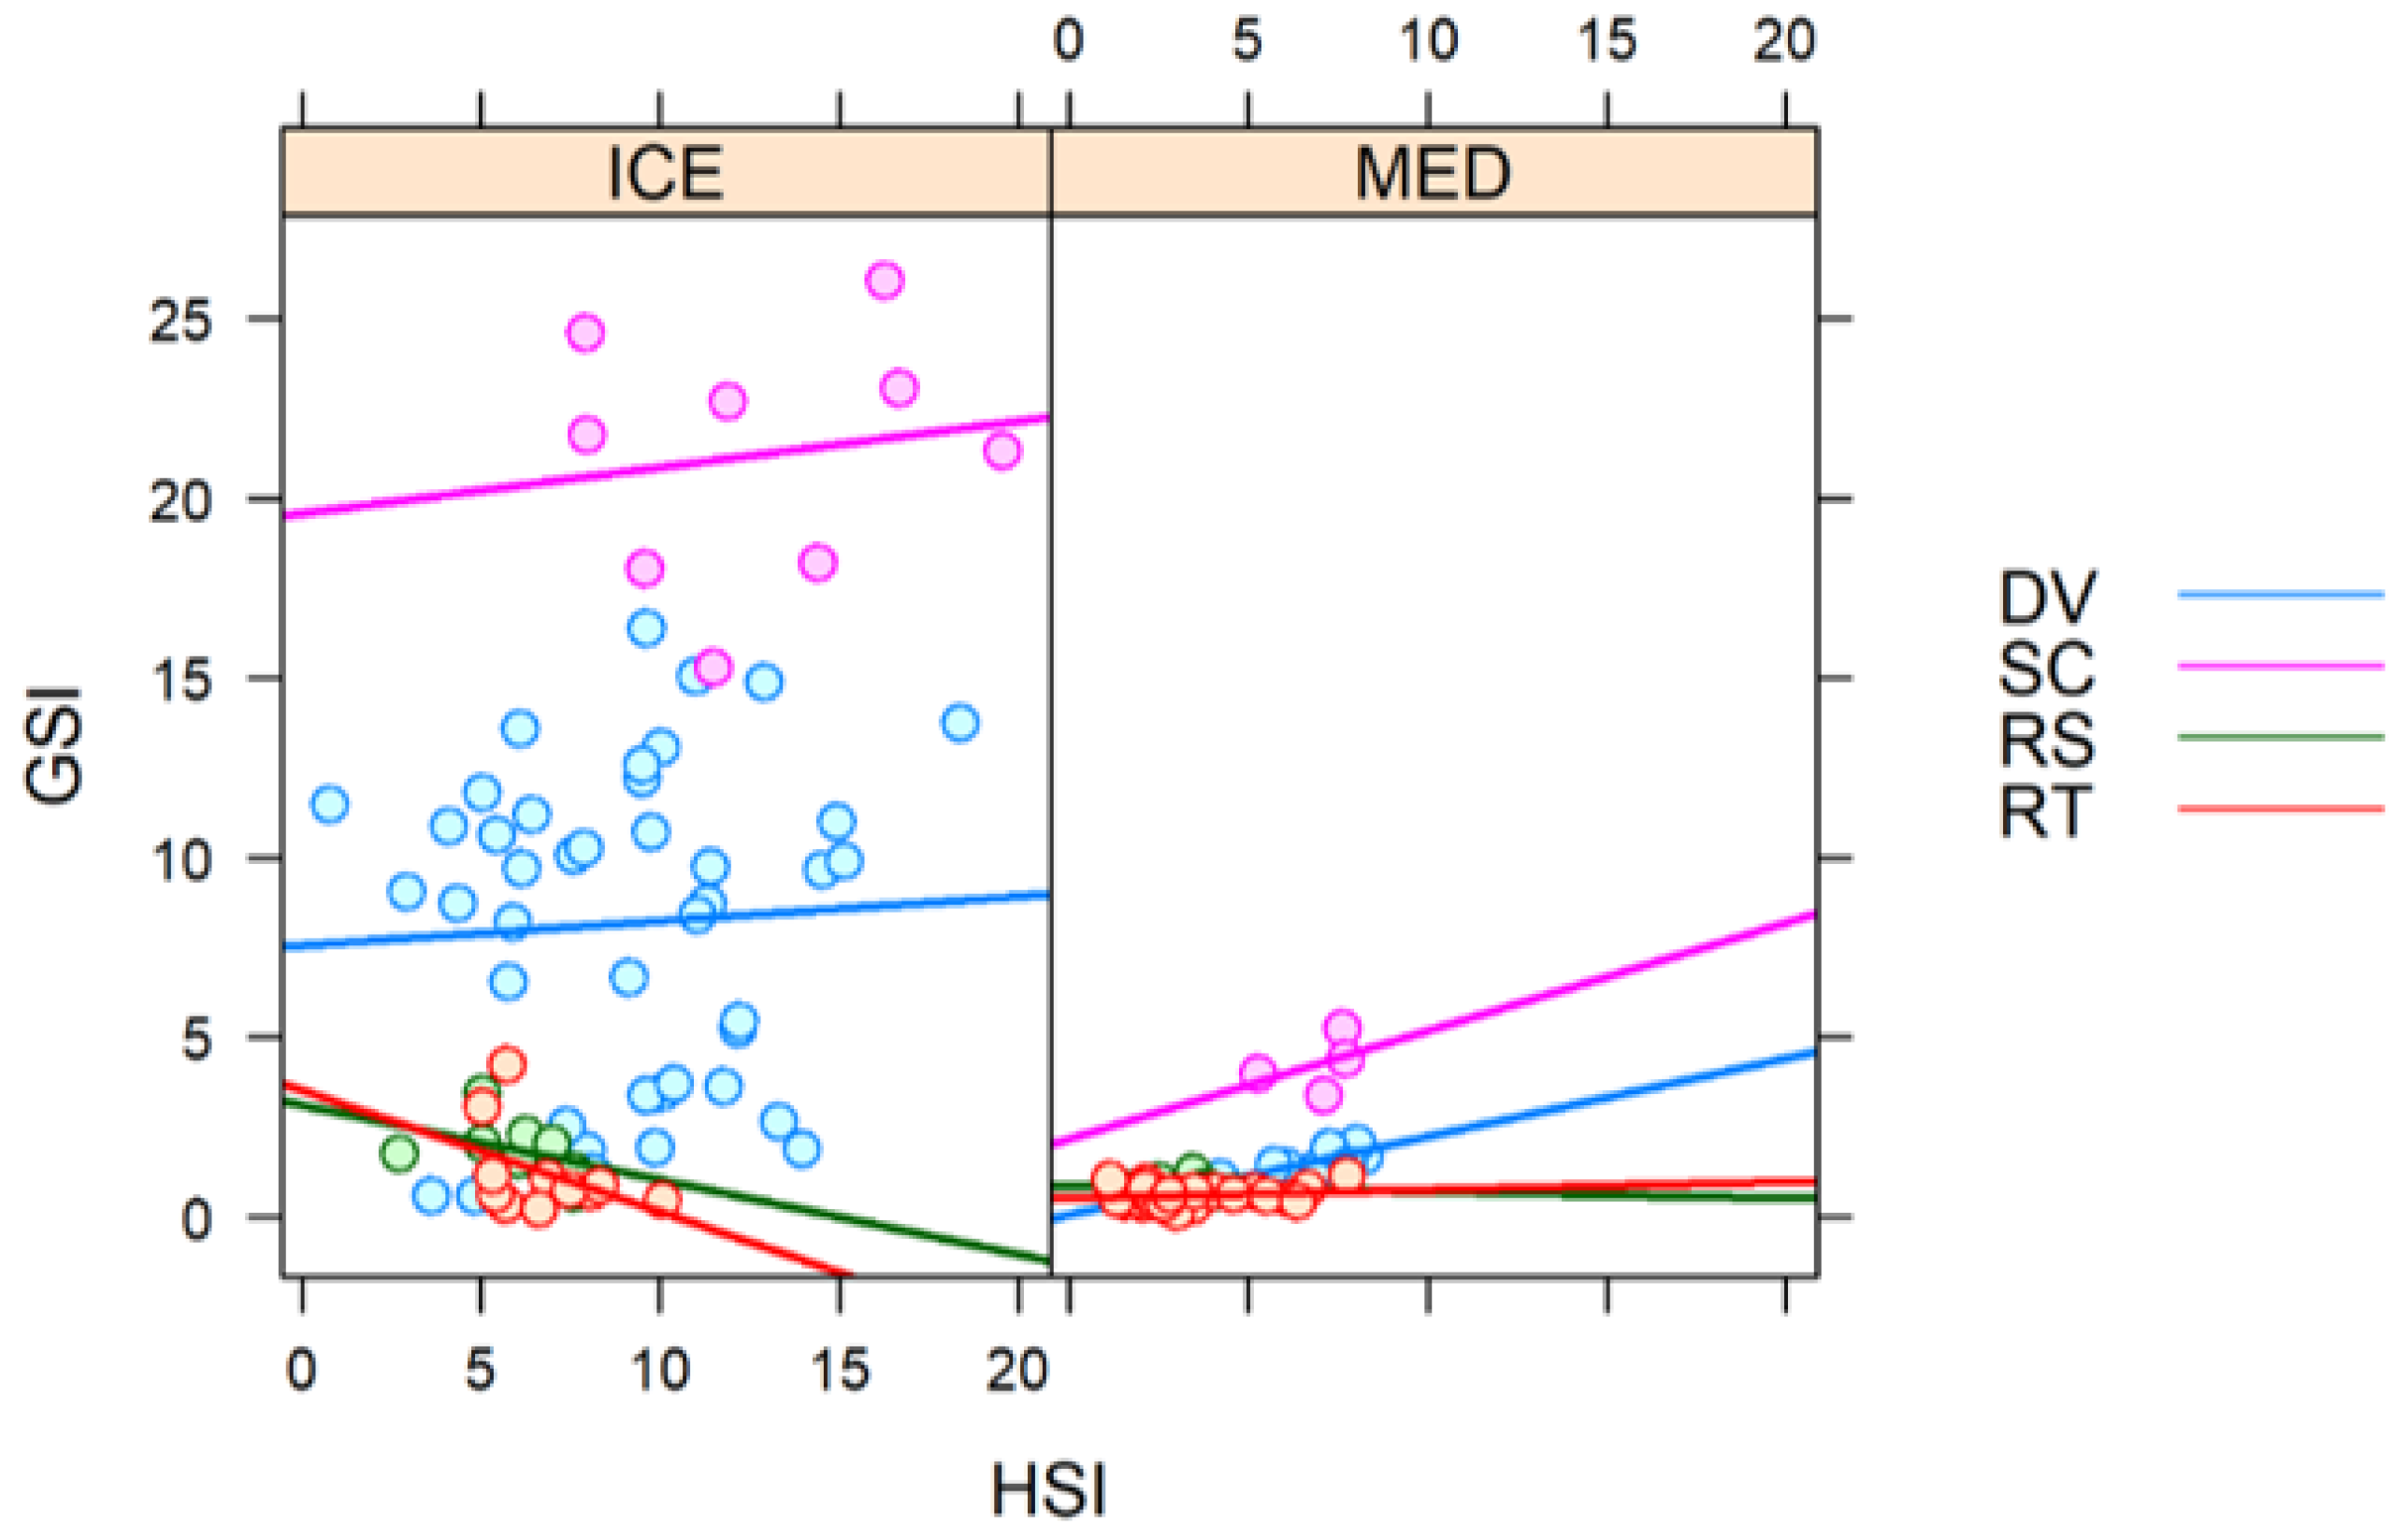
Based on the fluctuation of GSI and the monthly frequency of MAT, gonads of
M. macrophthalma from the north-western Mediterranean began to develop in October, when the sea water reached its maximum temperature (
Figure 3A). AS individuals appeared at the time as GSI peaked (March) and sea water temperature reached its minimum (
Figure 3A,B). After peaking, GSI stayed at very low values from April to August. The energy accumulation in the liver, estimated by HSI, increased together with GSI, but it started to decline in February, and reached its minimum in March, at the same time as GSI peaked. Spawning-associated fluctuations of monthly mean Kn were also observed. It should be noted that RS individuals were detected from February to June (
Figure 3B).
The available samples for the northern species did not provide a full vision of the whole annual cycle but only a glimpse from two snapshots (autumn and spring). Based on the frequency of occurrence of the different gonad development phases, all individuals of
M. dypterygia from Icelandic waters were at DV phase in November. In March all ovarian development phases were registered except for AS. The presence of SC and RS specimens suggested that the spawning was already taking place in March (
Supplementary Materials, Figure S4), but due to sampling limitations a description of the full reproductive cycle cannot be provided for
M. dypterygia.
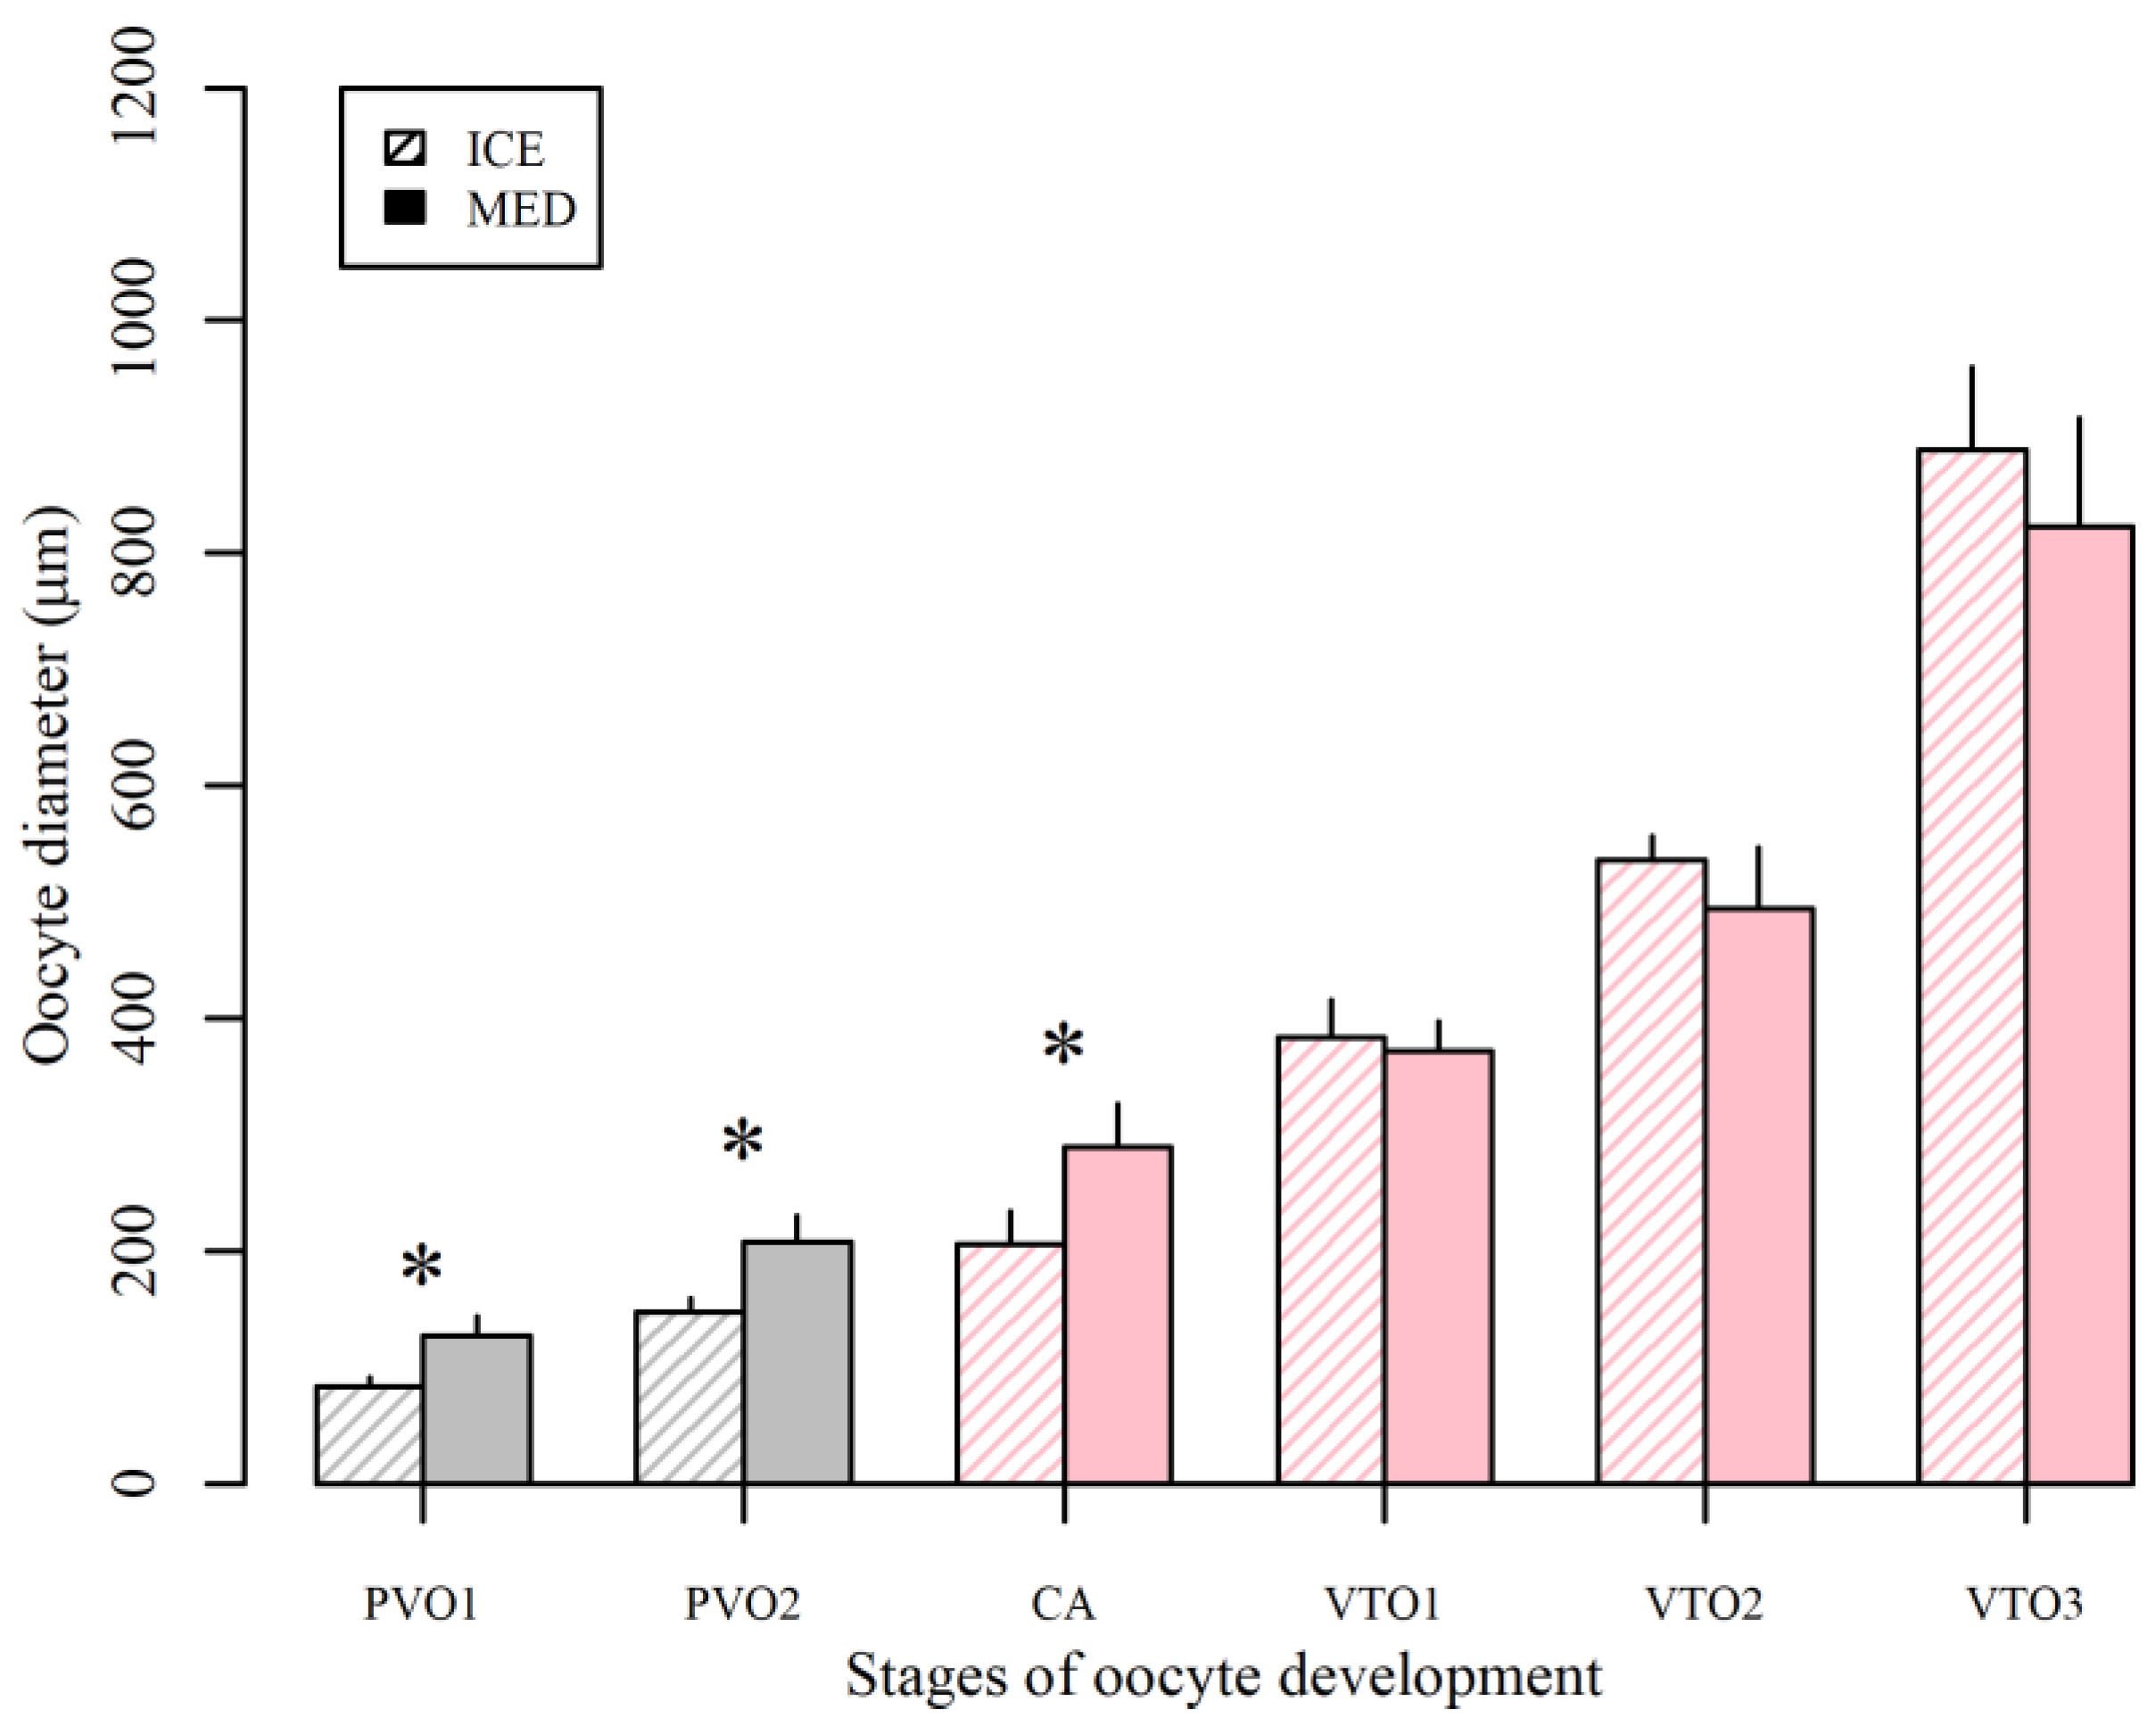
In both SITEs, oocytes at different development stages were simultaneously present in the ovary during different MATs (
Supplementary Materials, Figure S5). The oocyte diameter (cODv
i) increased concomitant with the stage of oocyte development (i) (
Figure 4, and
Supplementary Materials, Table S6). Previtellogenic oocytes were larger in
M. macrophthlma from the Mediterranean than in
M. dypterygia from Iceland (
Figure 4), as evidenced by the significant differences of mean cODv
i between SITES described by a Mann–Whitney U test (PVO1:
p = 3.269 × 10
−5, PVO2:
p = 7.371 × 10
−5, and CA:
p = 3.496 × 10
−6). Vitellogenic stages (VTO1-MN) diameter did not show significant differences between the northern and the southern species. The description and cODv
i measurements of the different oocyte stages can be consulted in the
Supplementary Materials (Table S1 and Table S6, respectively).
On the frequency distribution of stage
i oocytes based on their quantification through OPD calculations, a gap appeared between primary and secondary growth oocytes (i.e., PVO2 oocyte were missing) in late-DV, SC, and AS females of
M. macrophthalma (
Figure 5A–C) as well as between previtellogenic and vitellogenic oocytes (i.e., VTO1 oocytes were missing) in late-DV and SC females of
M. dypterygia (
Figure 5D–F). No signs of atresia were found in the examined samples.
The total number of secondary growth oocytes (NO
CA-MN) correlated positively with TL for both case studies (MED: Rho = 0.6071429,
p > 0.05; ICE: Rho = 0.8929,
p = 0.0123). The NO
CA-MN –TL relationship for
M. dypterygia was described by a positive exponential curve (
Figure 6B, Adj R
2 = 0.8371,
p = 0.002472). After standardizing for size, the northern
M. dypterygia from Iceland showed a higher relative production of secondary growth oocytes (TL-based NO
CA-MN) than the southern
M. macrophthalma from the Mediterranean (
p = 0.006993). Under determinate fecundity type, where the oocyte recruitment to secondary growth is over before the onset of the spawning period, these values would reflect the potential fecundity and the relative potential fecundity, respectively. However, the pool of CA in the oocyte stage frequency distribution of
M. dypterygia in Icelandic waters could either relate to a determinate or indeterminate fecundity style. In any case, taking into consideration that this species may show a slow oocyte growth rate and a short spawning period as other k-species of cold-water gadoids, it is likely that these CA oocytes will not participate of the current spawning season and could either be reabsorbed (in line with indeterminate fecundity) or be recruiting oocytes for next reproductive cycle (in line with determinate fecundity). Taken the latter into consideration, CA oocytes should be excluded from the standing stock used to estimate potential fecundity of
M. dypterygia from Icelandic waters, whereas not for
M. macrophthalma where the frequency distribution gap appeared between primary and secondary oocytes and thereafter CA oocytes are included in the standing stock estimations. Under this assumption, TL-based NO
standing-stock (i.e., TL-based NO
VTO1-MN) did not differ between northern (TL-based
VTO1-MN) and southern (TL-based NO
CA-MN) species (
p > 0.05).
Regarding the early oocyte recruitment, the total number of primary growth oocytes (NO
PVO1-PVO2) showed a positive correlation with fish size only for Icelandic
M. dypterygia (
Figure 6A, Rho = 0.83 i
p = 0.034) following a power function (adj R
2 = 0.5864,
p = 0.02737), whereas for the Mediterranean
M. macropthalma the sign was negative but not significant. The size-standardized amount of primary growth oocytes (TL-based NO
PVO1-PVO2) was greater in the northern species than in the southern species (
p = 0.0005828).
Better conditioned specimens showed higher absolute amount of primary growth oocytes (NO PVO1-PVO2) in both species, and in M. dypterygia also higher absolute amount of vitellogenic oocytes (NO VTO1-MN) as indicated by significant positive correlations between HSI and NOi (Rho = 0.75, p = 0.05; and Rho = 0.75, p = 0.049, respectively). No significant correlations were found between any of the other total or standardized number of oocytes estimates (TL-based NO PVO1-PVO2, NO CA-MN, TL-based NO CA-MN, TL-based NO VTO1-MN) and any of the condition parameters (Kn and HSI).
4. Discussion
This study contributes to fill a knowledge gap on key aspects of Molva species biology. Particularly for M. macrophthalma, our results provide a basis of knowledge that heretofore was inexistent and that will help to better understand their population dynamics and their sensitivity to extrinsic pressures. Moreover, the detected differences on condition and reproduction between the southern species M. macrophthalma from the Mediterranean and the northern species M. dypterygia from Icelandic waters may reflect their respective population health status and confer their distinct degrees of vulnerability. In this sense, the southern species showed lower size at maturity (in concordance with its inferior body length), lower condition and investment in reproduction, larger but fewer primary growth oocytes, and lower size-standardized secondary growth oocyte production than the northern species. Differences on recruitment of oocytes from primary to secondary growth also arose, which may have relevant implications for potential fecundity estimation.
Our estimates show wider length range and lower length at maturity than those published in other works [
24,
36].
M. dypterygia has a higher length range and length at maturity than
M. macrophthalma. In this regard, immature specimens represented over the 40% of the samples of
M. macrophthalma obtained in the Mediterranean and less than 10% of the samples of
M. dypterygia from Iceland. Taking into consideration that samples came mostly from commercial landings, it becomes evident that commercial trawlers are fishing immature specimens in the Mediterranean.
The sampling of
M. macrophthalma in the Mediterranean provided a description of its full reproductive cycle. Spawning took place at the end of winter, during the coldest-water month. By then, gonad development was over in the Mediterranean, whereas in Iceland development specimens of
M. dypterygia were still present. The co-occurrence of phenological events with water temperatures reaching extreme values may indicate certain sensitivity of the reproductive cycle to sea warming. Based on the monthly distribution of ovary developmental phases and the temporal fluctuation of GSI, the spawning period at a population level in the Mediterranean lasts at least two months and the developing period persists for 4 months. Meanwhile, the two snapshots from Icelandic waters suggest a longer developing period (i.e., a long vitellogenic period) which may reflect a lower oocyte growth due to cooler waters [
47], as found in other cold-water big gadoids such as cod [
48].
The results from the monthly fluctuations of GSI and HSI, together with the relationship between HSI and GSI at the different gonad developmental phases and the variation of HSI through gonad development, point out that (i) these species behave as capital breeders, reproducing at the expenses of previously acquired and stored energy [
49], (ii) the liver has an important role as a supplier of energy for reproduction and the HSI could be considered a suitable indicator of fish condition for these species, (iii) better conditioned individuals invested more in reproduction than lower healthy ones, and (iv) the northern species apparently invested more in reproduction and was in better condition than the southern one (supported by RT specimens showing higher HSI and DV-SC specimens showing higher GSI in
M. dypertygia than in
M. macrophthalma), which is most at risk of suffering environmental stress.
The vitellogenesis is the process of accumulation of yolk protein in the oocytes and it requires a huge input of energy [
50]. Thus, energetic constrains may result in lowered quality eggs. In this regard, it should be noted that although
M. macropthalma in the Mediterranean showed larger previtellogenic oocytes (PVO1, PVO2 and CA) than
M. dypterygia in Iceland, vitellogenic oocyte stages showed no significant differences in diameter between both species. Based on this, it can be hypothesized that
M. macrophthalma has the potential to develop larger oocytes than
M. dypterygia but in a capital breeder with low hepatic reserves such as
M. macrophthalma, energetic limitations caused by climate change and occurring during the vitellogenesis slowed down this process and impaired oocyte development and quality. Extended sampling for
M. dypterygia will provide a vision of the full annual cycle and help to test this hypothesis.
Understanding the fecundity style is crucial to select the appropriate method to estimate egg production and to forecast species productivity responses to environmental stress. In species showing determinate fecundity style, the potential annual fecundity (which is generally used to assess egg production) can be estimated by the pre-spawning standing stock of secondary growth oocytes; in indeterminate species, direct estimations of potential annual fecundity are unattainable but should rather be approximated from batch fecundity, spawning season duration, and spawning frequency [
51]. Regarding oocyte recruitment at a life-time scale, the pool of primary growth oocyte (PVO1 and PVO2) in mature females of
M. macrophthalma and
M. dypterygia indicates partial recruitment to secondary growth resulting in reserves of primary growth oocytes (i.e., iteroparous reproduction) in both species. Our figures would be compatible with either singular or multiple secondary growth oocyte recruitment at the reproductive cycle scale (i.e., total or multiple batch spawner). Focusing on the intraseasonal scale and following the approach from Ganias and Lowerre-Barbieri (2017) [
52], our results are sound with a low oocyte growth rate (the time period necessary for oocytes to develop from cortical alveolar stage to ovulated eggs) and a short spawning season duration, suggesting restricted secondary growth oocytes recruitment and therefore determinate fecundity.
Results show a fairly synchronous population of larger secondary growth oocytes to be spawned that is clearly separated from the population of smaller, less developed oocytes, a pattern that fits the group-synchronous description of Wallace and Selman (1981) [
53]. In
M. macrophthalma, the smaller oocytes cohort corresponds to primary growth oocyte (PVO1 and PVO2), and a gap on the oocyte stages frequency distribution appeared before cortical alveoli, suggesting again determinate fecundity. In contrast, in
M. dypterygia, the cohort of smaller oocytes before the hiatus contains primary growth oocytes and also cortical alveoli (PVO1-CA). Information on the spawning period duration of
M. dypterygia would help to clarify the fate of this cohort of cortical alveoli. If the spawning period is long enough, these cortical alveoli oocytes may contribute to the annual potential fecundity which is compatible with indeterminate fecundity. In the case of shorter spawning period, this pool of cortical alveoli could either be a remnant susceptible to being reabsorbed or a cohort that is being developed for next reproductive cycle because of very low oocyte growth rate. Both options would result in determinate fecundity, but the latter makes more sense in terms of energy efficiency. As stated by Ganias and Lowerre-Barbieri (2017) [
52], in cases where oocyte growth rate is low, the time to develop an oocyte through secondary growth can be longer than the spawning period, resulting in determinate fecundity. Additionally, the capital breeding strategy has been related to species that set the potential number of vitellogenic oocytes before the onset of spawning [
54], supporting the determinacy of these species.
Providing fecundity is determinate, the standing stock of developing and maturing oocytes (NO
standing-stock) should by default reflect the potential fecundity. In this regard, more extensive sampling would help to elucidate whether cortical alveoli pool in
M. dypterygia contributes to the annual potential fecundity or not. In any case, estimations of potential fecundity (either TL-based NO
CA-MN or TL-based NO
VTO1-MN) are lower than those from older studies but from the same order of magnitude [
55]. These estimations (again, either NO
CA-MN or NO
VTO1-MN) increased exponentially with fish size for both species, supporting a disproportional contribution of larger females to populations’ offspring production and the critical consequences of the predicted general decrease in fish body size due to overfishing and climate change [
56].
Taken into account the influence of fish size, the relative potential fecundity (i.e., TL-based NOi) was significantly higher for M. dypterygia in Iceland than M. macrophthalma in the Mediterranean, when the whole pool of secondary growth oocytes was used in the estimations for both species (i.e., TL-based NOCA_MN). Contrastingly, differences were not significant when cortical alveoli oocytes were excluded from the calculations for M. dypterygia (i.e., TL-based NOVTO1_MN). Altogether, these species showed discrete oocyte recruitment and signs of a determinate fecundity style for both species. Yet, to firmly state whether these species are behaving as a determinate or indeterminate type, insights on the spawning duration in Iceland and oocyte growth rate in both places are needed. A full understanding of secondary growth oocyte dynamics is required to estimate egg production, a relevant parameter for assessing populations’ productivity. Results of M. dypterygia showed a positive correlation of the fish condition (estimated through the relative liver weight, HSI) with the “potential fecundity” and the number of primary growth oocytes. However, this could be due to size-related higher food intake, as no significant correlation was found when size-standardized estimates of oocyte numbers were used. Data generated from further studies may unveil clearer relationships supporting the influence of condition on egg production.
Our findings suggest that
M. dypterygia from Iceland has a better condition and reproductive status than
M. macrophthalma from the Mediterranean, which is in line with the recent assessment of
Molva population health status by Lloret et al. 2021 [
19]. Moreover, all the aforementioned results provide a first step to understand the vulnerability of
Molva species to extrinsic pressures that interact synergistically such as sea warming and fishing. Capital breeders are energetically less efficient because they must incur the costs of energy storage and mobilization [
54], which makes them more susceptible to energetic limitations. In addition, this breeding strategy implies a post-spawning period of diminished energy reserves when fish are more sensitive to unfavourable conditions [
54], as evidenced here by the observed low HSI during AS, RS, and RT gonad development phases. Here, evolutionary fine-tuning of the reproductive cycling with environmental conditions should ensure reproductive success [
57]. For instance, in the Mediterranean, the end of
M. macrophthalma spawning season occurs during a period of high primary production [
58], when fish can find nutritional resources to recover energetically from reproduction. In front of altered environmental conditions, capital breeders are less likely to adjust their timing of reproduction to meet more favourable conditions [
59]. Given that, the increased occurrence of unpredicted environmental events caused by climate change compromises the capacity of this species to overcome this period of higher sensitivity and could lead to mismatches between breeding and optimal conditions for larvae [
60].
Nevertheless, climate change is not the sole threat to the sustainability of these populations. Large and late maturing species such as
Molva species show also high susceptibility to fishing mortality [
61].
M. macrophthalma is not a target species for any fisheries but it is accidentally caught as by catch. Neither species-specific conservation measures nor minimum landing size regulations are in place for this species [
62], and consequently small immature individuals are often being landed by commercial trawlers in the north-western Mediterranean, as reflected by our data. In contrast,
M. dypterygia in the north-eastern Atlantic is a commercial species caught in mixed fisheries by the trawler fleet that mainly targets redfish and Greenland halibut, and from 2008 also by longliners. In Iceland (ICES division 5a), blue ling has been historically exploited at a moderate level, however its fisheries have gone through substantial changes. Populations collapsed in the 1990s as a result of fisheries directly targeting seasonal spawning aggregations [
63,
64]. Since 2003, population temporal closures have been set in Iceland and in 2013 the ITQ (individual transferable quota) regulation was applied, setting national TACs to prevent the depletion of the Icelandic stock. Despite no minimum landing size is in force, mesh size regulations and closures of fishing areas prevent the fishing of smaller, immature fish.


