Article

Genetic Diversity Evaluation and Population Structure Analysis of Red Swamp Crayfish (Procambarus clarkii) from Lakes and Rice Fields by SSR Markers

1
State Key Laboratory of Freshwater Ecology and Biotechnology, Hubei Hongshan Laboratory, The Innovation Academy of Seed Design, Institute of Hydrobiology, Chinese Academy of Sciences, Wuhan 430061, China
2
University of Chinese Academy of Sciences, Beijing 100049, China
3
Key Laboratory of Ministry of Water Resources for Ecological Impacts of Hydraulic-Projects and Restoration of Aquatic Ecosystem, Institute of Hydroecology, Ministry of Water Resources, Chinese Academy of Sciences, Wuhan 430061, China
*
Author to whom correspondence should be addressed.
Fishes 2022, 7(4), 142; https://doi.org/10.3390/fishes7040142
Submission received: 10 May 2022 / Revised: 18 June 2022 / Accepted: 18 June 2022 / Published: 21 June 2022

Abstract

:
The red swamp crayfish (Procambarus clarkii) is an important aquatic animal and has developed as a popular aquaculture species in China. In this study, a total of 72,839 SSR motifs were identified from transcriptional data, and 20 microsatellite markers of them were finally developed to assess the genetic diversities of seven wild populations from natural lakes and nine cultured populations from rice fields. Genetic diversity was slightly higher in the cultured populations than in the wild populations. The degree of genetic differentiation between cultured populations is slight, while a moderate to a large degree of genetic differentiation between wild populations and most of the variations occurred within individuals (79%). The analysis of cluster, principal coordinate analysis and STRUCTURE were similar, and they showed that isolation-by-distance pattern was not significant. The microsatellite markers developed in this study can not only be used for genetic monitoring of population but also provide important information for the management of breeding and cultured population in red swamp crayfish.

Graphical Abstract

1. Introduction

The red swamp crayfish (Procambarus clarkii), native to the United States and Mexico, was introduced from Japan to Nanjing, China, in the 1930s [1,2,3]. The red swamp crayfish is one of the most aggressive species in the world, with their dredging behavior causing damage to dikes, dams and rice paddies, but due to its high market value, including edible meat, high protein content, low fat content and high nutritional power, it is widely loved and consumed in China and is one of the most economically important aquatic species for aquaculture rather than a destructive invasive species [4]. Recently it has recently become a popular freshwater aquaculture species in China, especially in the middle and lower reaches of the Yangtze River [5]. In the past two decades, red swamp crayfish farming in rice fields has become the most commonly farming mode because it can improve ecological conditions and raise the production values of rice fields. However, with the continuous increase in overfishing, the decline in growth performance and disease resistance has seriously restricted the stable and sustainable development of crayfish production [6]. Therefore, assessment of genetic resources from wild populations is urgent and necessary to breed new strains or varieties with excellent characteristics in the future. In addition, in production practice, integration of breeding and culture in rice fields is the most common production mode at present, which results in a potential risk of inbreeding and loss of genetic diversity [7]. Therefore, the genetic information of wild and cultured populations is needed to monitor the change of genetic diversity to reveal genetic variation and adaptation ability to the environment in the long-term process [8].
Genetic diversity refers to the differences in genes and DNA sequences between individuals of a particular species [9], and it was supposed that the higher the genetic diversity, the greater the ability to adapt to environmental changes because genetic diversity within populations can increase the ability of the population to resist disease and environmental fluctuations [10]. However, the lack of genetic variation can have some degree of deleterious effects on various commercial traits such as disease resistance and growth [11,12]. Several studies on monitoring genetic differences between cultured and wild populations have been reported in various fish species, such as yellow croaker (Pseudosciaena crocea) [13], gibel carp (Carassius gibelio) [14,15], striped catfish (Pangasianodon hypophthalmus) [16], orange-spotted grouper (Epinephelus coioides) [17], Chinese sucker (Myxocyprinus asiaticus) [18], turbot (Scophthalmus maximus) [19]. However, genetic diversity is often reduced in the breeding process due to the founder effect and inbreeding [20]. Therefore, it is necessary to take certain measures to ensure the genetic diversity of the breeding population.
Simple sequence repeats (SSRs), also known as microsatellite markers, are motifs with lengths ranging from 1 to 6 bp tandem repeats that are common in most organisms [21]. SSRs exhibit a high degree of allelic diversity due to the number of repeats and can be easily detected by polymerase chain reaction (PCR) and polyacrylamide gel electrophoresis [21,22]. The distinguishing features, including random distribution in the genome, high levels of polymorphism, codominance and reproducibility, make them very effective in assessing genetic diversity, structure and differentiation of different resources and populations [23,24]. Microsatellites have been applied for genetic diversity detection in a variety of aquatic species [14,15,18,19,25,26], which verifies SSR as an ideal marker system for genetic diversity analysis and population genetics research. Traditional microsatellite marker development is time-consuming and labor-intensive, and the development of next-generation sequencing (NGS) technology provides a more economical and convenient method. RNA sequencing (RNA-Seq) is a high-throughput NGS-based technology that has great advantages in mining microsatellites and has good applications in numerous species [27,28,29].
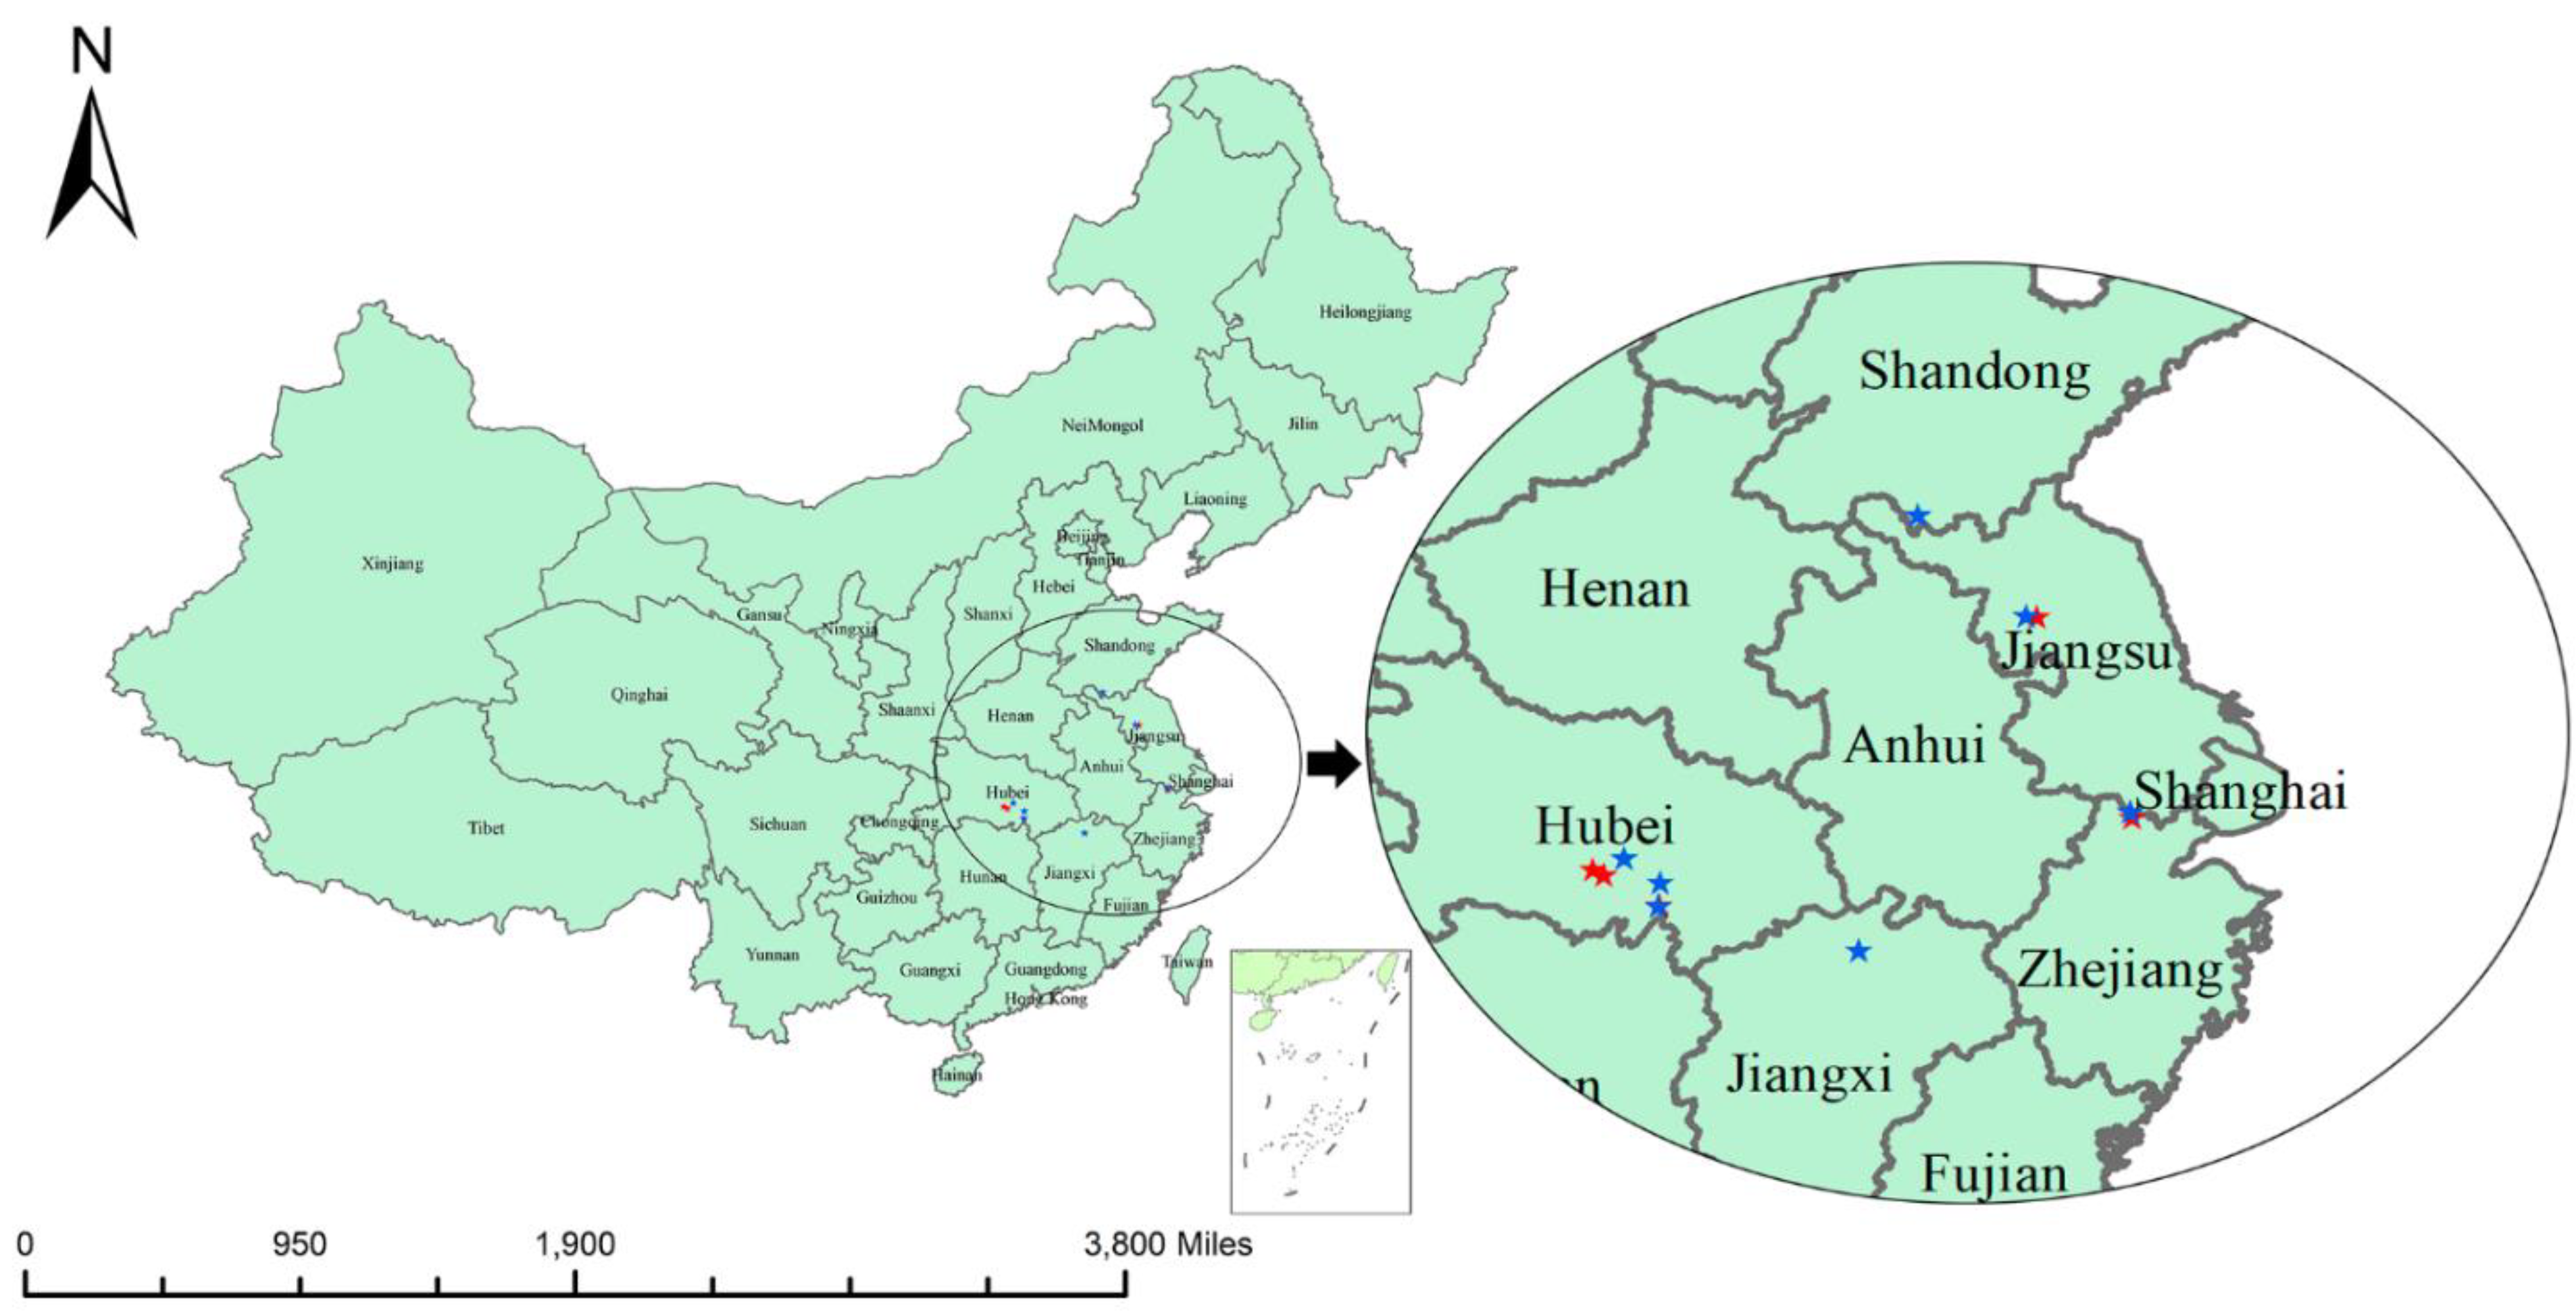
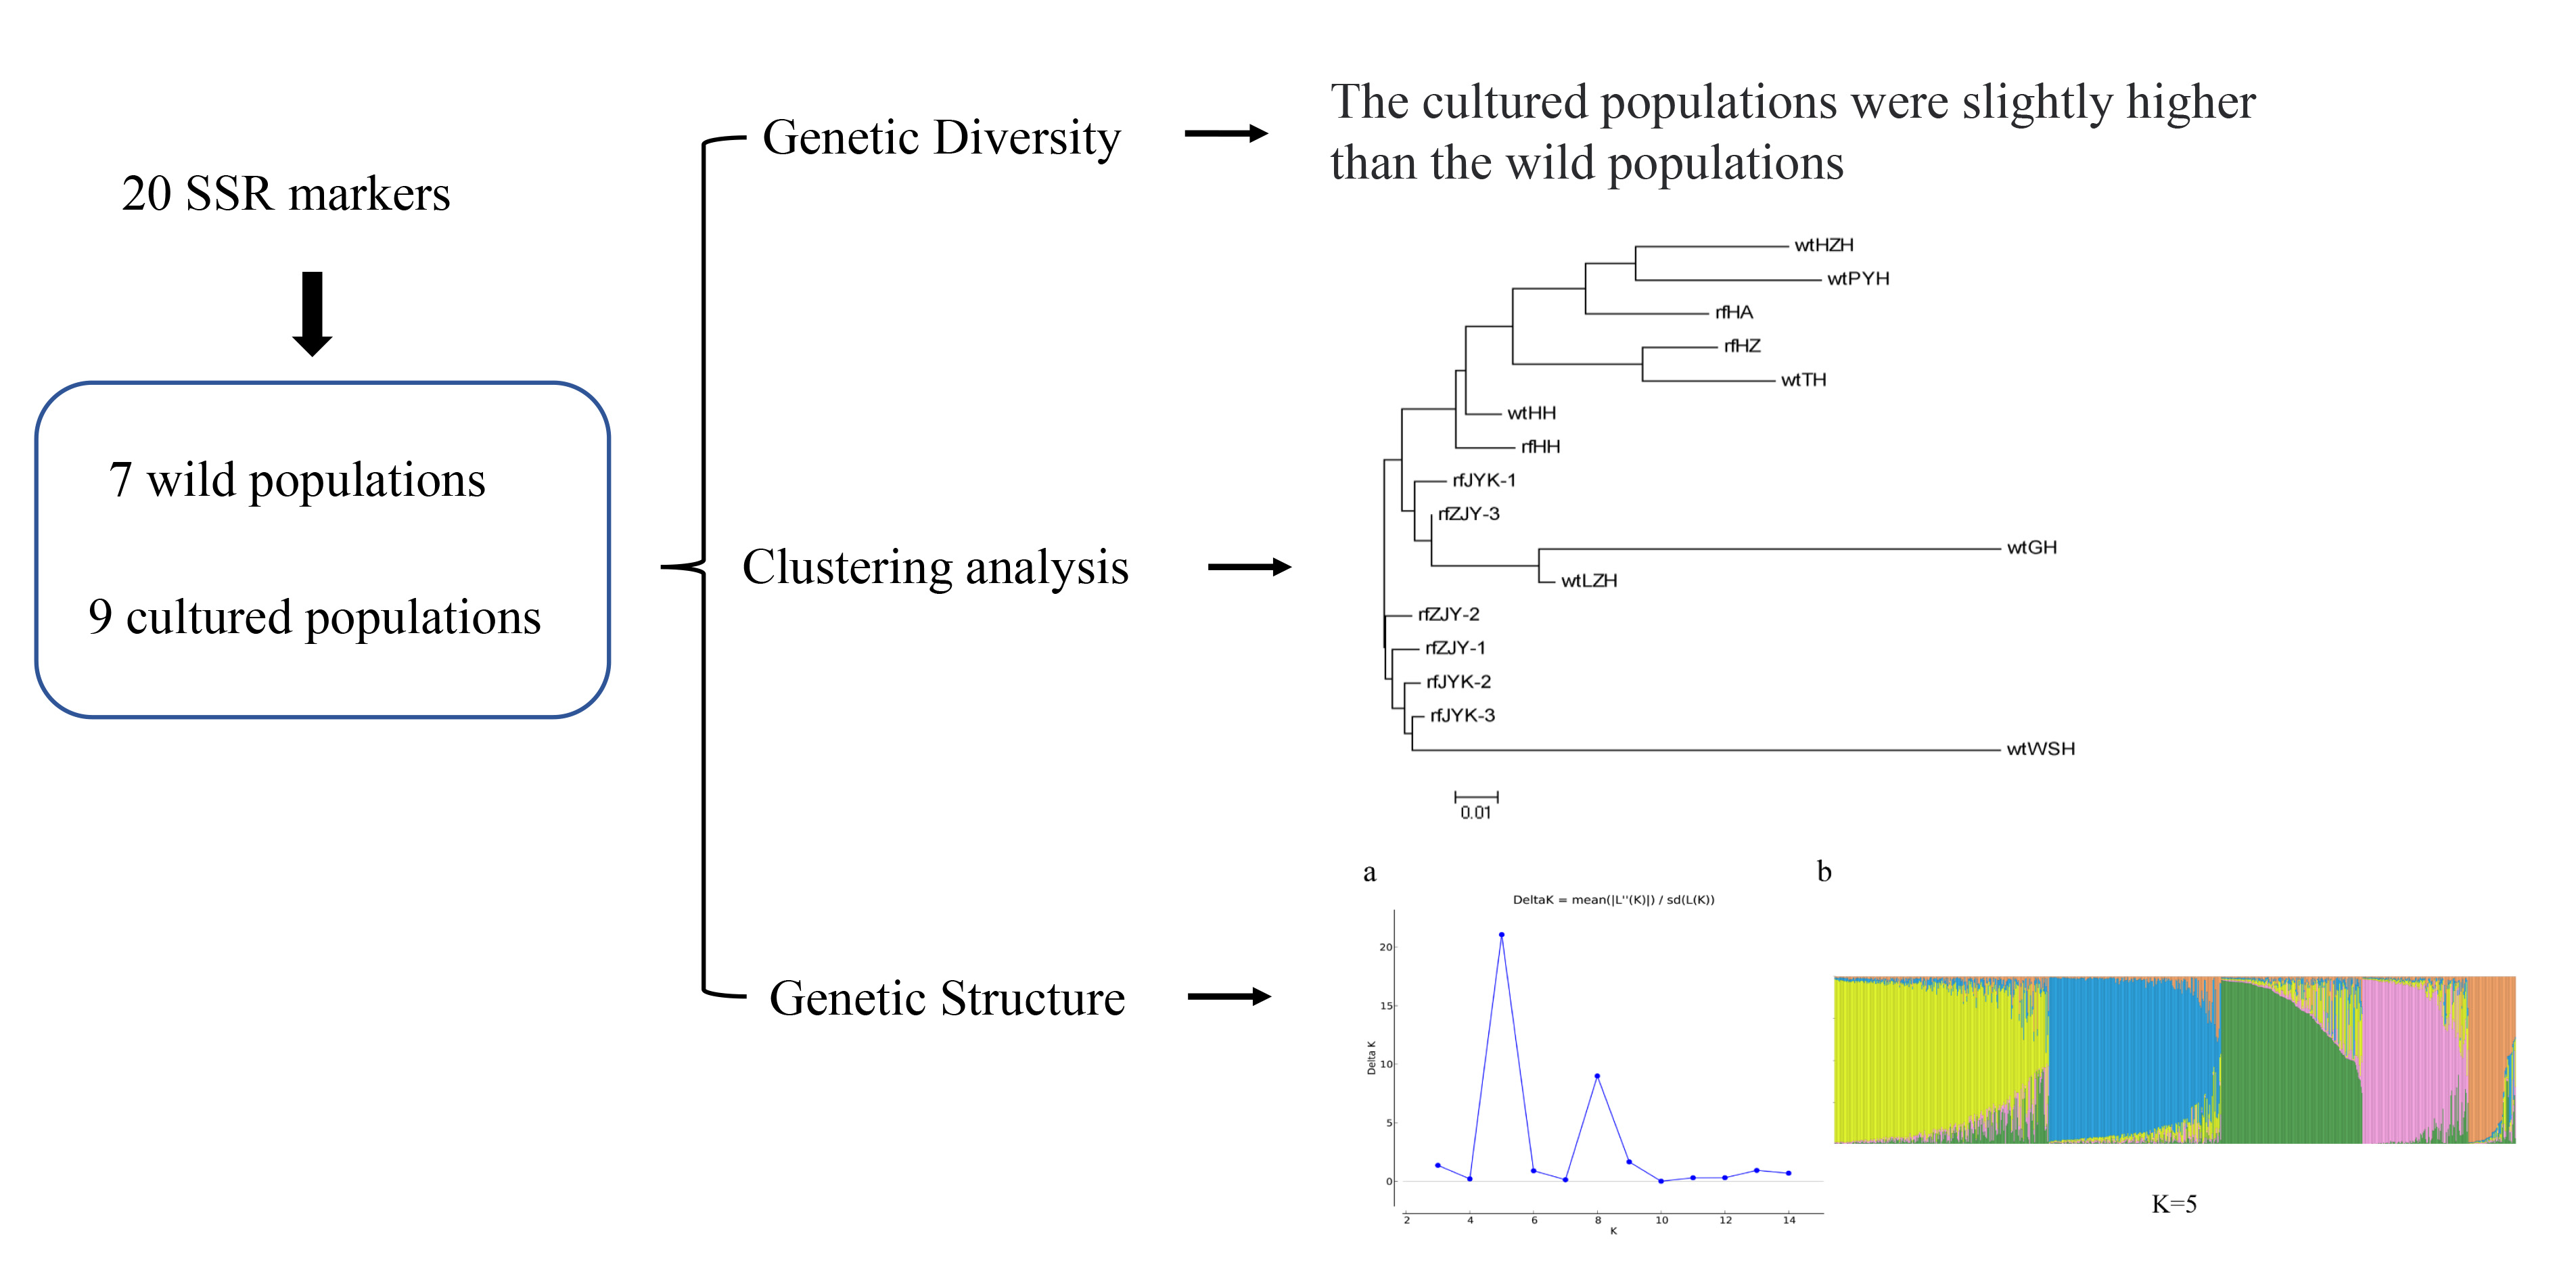
In this study, the genetic diversity of red swamp crayfish from wild lake populations and rice field-cultured populations was assessed by SSR markers developed from transcriptome data obtained by RNA-seq technology, which thereby revealed genetic diversity levels within/among populations and explored the genetic differentiation among these populations. It will provide theoretical guidance for genetic resource conservation, parent selection, progeny genetic variation and heterosis prediction and improve breeding efficiency in the future.

2. Materials and Methods

2.1. Ethics Statement

The red swamp crayfish were sampled and treated by the recommendations in the Guide for the Care and Use of Laboratory Animals of the Institute of Hydrobiology, the Chinese Academy of Sciences, China.

2.2. Sample Collection and DNA Extraction

A total of 800 red swamp crayfish individuals were collected from 7 wild populations and 9 cultured populations from the middle and lower reaches of the Yangtze River. The rfJYK-1,2,3 and rfZJY-1,2,3 represented the rice field populations of Jiyukou and Zhangjiayao hatcheries for three consecutive years, respectively. The details of the sampling locations are shown in Table 1 and Figure 1. The tail muscle tissue of crayfish was sampled and stored in anhydrous ethanol. Genomic DNA was extracted according to the protocol of the Genomic DNA Extraction Kit (Promega, Madison, Wisconsin, USA). DNA quality was detected by 1.0% agarose gel electrophoresis, the concentration was estimated by a NanoDrop 2000 spectrophotometer (Thermo Scientific, Waltham, Massachusetts, USA), and then extracted DNA was stored at −20 °C for further analysis.

2.3. Microsatellite Screening and Polymorphism Detection

An SSR search analysis of crayfish transcriptome data [30] was performed using MISA software (http://pgrc.ipkgakersleben.de/misa accessed on 9 November 2021). A total of 200 among the obtained SSR loci were randomly selected for primers design using Primer5 (Premier Biosoft International). Six individuals were randomly used to detect SSR polymorphism by PCR and 10% polyacrylamide gel electrophoresis. The 20 µL PCR reaction system consisted of 100 ng of template DNA, 10 µL of 2X Es Taq master mix (KangWei, China), 1 µL of forward and reverse primer mixture (10 µmol/µL each) and appropriate sterile water to the final volume. PCR amplifications were performed as follows: initial denaturation at 94 °C for 3 min, 35 cycles of 30 s denaturation at 94 °C, 30 s of annealing at appropriate annealing temperature, 30 s of elongation at 72 °C, and a final extension step of 10 min at 94 °C. The amplification products were detected by 10% polyacrylamide gel electrophoresis to screen polymorphic SSR markers.

2.4. Microsatellite Analysis

The SSR loci with polymorphism screened above were used for genetic diversity analysis. Firstly, the M13 universal adapter sequence (TGTAAAACGACGGCCAGT) was added to the 5′ direction of each pair of forward primer, and different fluorescent motifs (TAMRA, HEX, FAM, ROX) were added to the M13 adapter sequence. The PCR reaction system was 15 µL, containing 1 µL of template DNA (50–200 ng), 7.5 µL of 2× Taq PCR Master Mix (GeneTech), 1 µL each of forward and reverse primers and 4.5 µL of sterile water. PCR amplifications were performed as follows: initial denaturation at 96 °C for 3 min, followed by 35 cycles of 96 °C for 30 s, appropriate annealing temperature for 30 s, 72 °C for 1 min, and a final extension step at 72 °C for 10min. PCR products with fluorescence were detected by fluorescence electrophoresis by DNA sequencer ABI 3730xl, and the raw data were genotyped using the software GeneMarker V2.2.0. The SSR banding patterns were scored as absent (0) or present (1) (Table S1).

2.5. Genetic Diversity and Population Genetic Structure Analysis

GenAIex software was used to calculate the following genetic diversity parameters: number of alleles (Na), number of effective alleles (Ne), observed heterozygosity (Ho), expected heterozygosity (He), Shannon’s Information Index (I), Nei’s genetic distance and the inter-population genetic differentiation coefficient (Fst) [31,32,33,34]. Genetic evidence for a bottleneck effect in the sampled populations was evaluated using the program BOTTLENECK 1.1 [35]. Molecular analysis of variance (AMOVA) was used to analyze whether a certain population grouping factor caused significant differences between populations. Principal Coordinates Analysis (PCoA) was performed to present a visualization of the coordinates of similarities or differences. The polymorphic information content index (PIC) was calculated by Cervus software [36]. The clustering analysis among the populations was performed by the neighbor-joining (NJ) method using Mega 5 software [37]. The population genetic structure of red swamp crayfish was constructed by STRUCTURE [38]. In this study, the K value was set as 3–10, and 20 independent calculations were performed with 100,00 burn-in and 100,000 Markov Chain Monte Carlo (MCMC) to ensure the accuracy of the results. The optimal K value was calculated using the online tool STRUCTURE HARVESTER.

3. Results

3.1. Characterization and Polymorphism of Transcript-Associated Microsatellites

In this study, a total of 72,839 mono-, di-, tri-, tera-, penta- and hexa-nucleotide repeats were detected in the transcriptome sequences. There were 39,797 (54.64%) mono-nucleotide repeats. Except for mono-nucleotide repeats, dinucleotide repeats were the most abundant type, having 21,825 (29.96%), followed by tri-nucleotides (9698, 13.31%), tera-nucleotides (862, 1.18%), penta-nucleotides (601, 0.83%) and hexa-nucleotide (56, 0.08%) (Table 2).
Two hundred SSR loci, including 124 dinucleotide repeats, 72 tri-nucleotide repeats and 4 tera-nucleotide repeats, were randomly selected from the screened SSRs based on red swamp crayfish transcriptome data. After testing the primers in six samples, a total of 20 SSR loci with polymorphism and stable amplification were finally identified (Table 3). Then, these 20 SSR loci were used for genetic diversity analysis of 800 individuals from 16 populations.

3.2. Genetic Diversity among Different Populations of Red Swamp Crayfish

The genetic diversity results for 20 SSR loci in 16 populations are listed in Table 4. A total of 97 alleles were amplified, ranging from 2 to 11 with an average of 4.85 alleles per locus. The number of effective alleles (Ne) ranged from 1.05 (PC9) to 4.14 (PC11), with an average of 2.32 per locus. The Ho values ranged from 0.029 (PC20) to 0.685 (PC11), and the He values ranged from 0.043 (PC9) to 0.759 (PC11) with mean values of 0.433 and 0.527. The PIC ranged from 0.042 to 0.724, with an average of 0.458, which indicated that the majority of loci were moderately polymorphic and could be used for subsequent analysis.
The genetic diversity of 16 crayfish populations based on 20 SSR loci was presented in Table 5. The Na values of all populations ranged from 2.55 (wtGH) to 3.50 (rfZJY-3) with an average of 3.12, and Ne values ranged from 1.80 (wtWSH) to 2.30 (rfJYK-1, rfZJY-3) with an average of 2.13. The Ho ranged from 0.350 (wtWSH) to 0.471 (rfZJY-3) and He from 0.392 (wtGH) to 0.523 (rfZJY-3), with mean values of 0.432 and 0.480, respectively. The I value ranged from 0.623 (wtGH) to 0.888 (rfJYK-3) with an average of 0.804, and the F values were all greater than 0 with an average of 0.105, indicating slight homozygous overabundance in all populations.

3.3. Higher Genetic Diversity of Cultured Populations Than Wild Populations

The mean Na value of the cultured populations was 3.29, the mean Ne value was 2.23, the mean Ho and He values were 0.446 and 0.501, respectively, and the I value was 0.849; while in the wild populations, the mean Na value was 2.89, the mean Ne value was 2.00, the mean Ho and He values were 0.432 and 0.454, respectively, and the I value was 0.747 (Table 5). The genetic diversity of the cultured populations was higher than that of the wild populations (p < 0.05). The results indicated that the breeding and culturing process did not cause any loss of genetic diversity.
In addition, the genetic diversity of the individuals from three generations of successive breeding populations in Zhangjiayao and Jiyukou in Qianjiang City were further investigated, which showed that there was no significant difference among the three generations in the two places, respectively, P values of all genetic diversity parameters were less than 0.05 (Table 6). Notably, expected homozygosity did not increase as expected; on the contrary, it slightly decreased from 0.497 to 0.484 to 0.480 in JYK populations. Similarly, it was 0.491, 0.491 and 0.477 for the three years in the ZJY populations, respectively. The PCoA results also showed that the crayfish populations were mixed and not clearly divided into specific populations, and the populations for three generations were in a mixed state (Figure 2). Therefore, there was no change in genetic diversity during the three consecutive years in both ZJY and JYK populations.
Then, genetic evidence for a bottleneck effect in the sampled populations was evaluated. According to the BOTTLENECK’s test, significant differences between He (number of loci showing heterozygosity excess) and Hd (number of loci showing heterozygosity deficiency) from both the infinite-allele model (IAM) and two-phased model of mutation (TPM) indicated a recent severe reduction in the effective population size (p < 0.05). (Table S2).

3.4. Population Genetic Differentiation and Genetic Structure

The results of the genetic differentiation analysis of 16 populations showed that pairwise Fst values ranged from 0.004 to 0.171, which suggested that these populations were differentiated with each other in various degrees (Table 7). The Fst values between cultured populations were all less than 0.05, which belonged to a slight degree of genetic differentiation. The Fst values between the populations of Jiyukou and Zhangjiayao hatcheries for three consecutive years ranged from 0.004 to 0.011, indicating that the genetic differentiation was negligible.
The Fst values between wild populations wtGH and wtWSH and other populations were both between 0.05 and 0.15, indicating that there was a moderate degree of genetic differentiation between these two populations and other populations, while the Fst values of wtGH and wtWSH were 0.171, indicating a large degree of genetic differentiation between these two populations. Nei’s genetic distance (Nei’s D) of the 16 crayfish populations ranged from 0.008 to 0.321 for the cultured population (Table 7). It was 0.008–0.094 and 0.048–0.321 for the cultured population and wild population, respectively. The genetic distance between rfJYK2 and rfJYK3 was the smallest, while that between wtGH and wtWSH was the largest.
The NJ phylogenetic tree was constructed based on Nei’s genetic distance. The clustering results showed that two independent branches were obtained (Figure 3). One independent branch only contained four cultured populations from Hubei Qianjiang and one wild population from Weishanhu Lake. The other 11 populations were located on the second independent branch. In addition, five populations from Jiangsu, Zhejiang and Jiangxi were also revealed to be grouped into a small branch. The clustering results did not show a significant isolation-by-distance pattern.
The SSR markers of the 16 populations were subjected to PcoA, and the results shown in the scatter plot and clustering plot were consistent with clustering analysis. The percentage variances explained by PCoA1 and PCoA2 were 7.62% and 6.72%, respectively, which may be due to the fact that most of the variation occurred within individuals. Populations of wtGH and wtWSH were distant, while other populations clustered together (Figure 4). AMOVA analysis showed that most of the variation occurred within individuals (79%) (Table 8), while the variation between populations was very small, accounting for only 8%, with a gene flow value of 2.809 for crayfish, indicating the presence of moderate to high levels of gene flow between populations.
To further understand if these populations were divided into several clusters, a mixed model analysis was performed on each individual within the population using the software STRUCTURE. It indicated that the highest peak was at K = 5, inferring that 16 populations can incorporate all individuals into five clusters with the maximum likelihood. (Figure 5).

4. Discussion

Genetic diversity contributes to a species’ ability to cope with environmental change and is often assessed by molecular markers. A variety of molecular markers are used to detect population genetic diversity and differentiation, including restriction fragment length polymorphism (RFLP), amplified fragment length polymorphism (AFLP), and simple sequence repetition (SSR) [39,40,41]. Microsatellites are widely distributed in the genome and have high levels of polymorphism, codominance and repeatability. They are effective tools for assessing genetic diversity and population structure [42]. In this study, we screened SSR markers from transcriptome data based on RNA-Seq technology and identified a total of 72,839 SSRs, excluding single nucleotide repeats; dinucleotide repeats were the most abundant type with 21,825, which is consistent with SSRs in many species [26,43]. The SSRs obtained in this study provide valuable resources for future studies on genetic variation and genetic breeding in the crayfish.
Genetic diversity within species reflects population size, history, ecology and adaptive capacity [44]. Genetic diversity of wild P. clarkii populations in different regions of China has been reported. The highest He value of 0.72 was revealed in the Nanjing population, and the lowest He was 0.44 in the Sichuan population [3]. The He values of crayfish populations in the Pearl River basin ranged from 0.29 to 0.59 with a mean value of 0.50 [45]. It was also indicated that the He ranged from 0.53 to 0.78 with a mean value of 0.62 [8]. In this study, however, the He value of wild crayfish was between 0.39 and 0.50, with an average value of 0.45, which was evidently lower than the previous studies in China. [3,8,45]. It is well-known that red swamp crayfish has been widely introduced globally and has been studied from the viewpoint of invasion ecology in Europe [46,47] and globally [48]. Population genetics of native and introduced red swamp crayfish have been compared in Mexico [49]. As for the non-Chinese populations, the He value ranging from 0.31 and 0.62, with an average value of 0.51 in the populations from Europe and northern Mexico [47], were revealed to be higher than that of our populations.
The decline of genetic diversity of wild red swamp crayfish may be related to the bottleneck effect, founder effect and nonrandom mating [3,45]. It was revealed that about 100 specimens of red swamp crayfish were carried from New Orleans to Japan in 1927, of which only 20 specimens arrived alive to a pond near Tokyo, then were translocated to Nanjing in 1929, indicating a strong genetic bottleneck with few founders in Chinese populations [48]. In this study, the second genetic bottleneck was revealed based on the BOTTLENECK’s test. Therefore, we suppose that this might be the consequence of at least two bottlenecks. In addition, inbreeding is likely to occur because red swamp crayfish laid about 300 eggs per individual [50]. In the past few years, wild crayfish have been seriously overfished, resulting in a sharp decline in wild resources at a rate of 30% each year [6]. Furthermore, water pollution and habitat destruction may also contribute to the decline of genetic diversity in wild populations [51]. Therefore, in order to provide better germplasm resources for crayfish in cultured populations, it is necessary to take measures to protect the genetic diversity of wild populations, such as reducing fishing and habitat destruction.
Gene differentiation and gene flow are two important indicators for evaluating the genetic structure of a population [8]. Fst is an important parameter to measure the genetic differentiation between populations, and the smaller Fst indicated the lower the differentiation between populations, the closer the genetic distance. In this study, the 
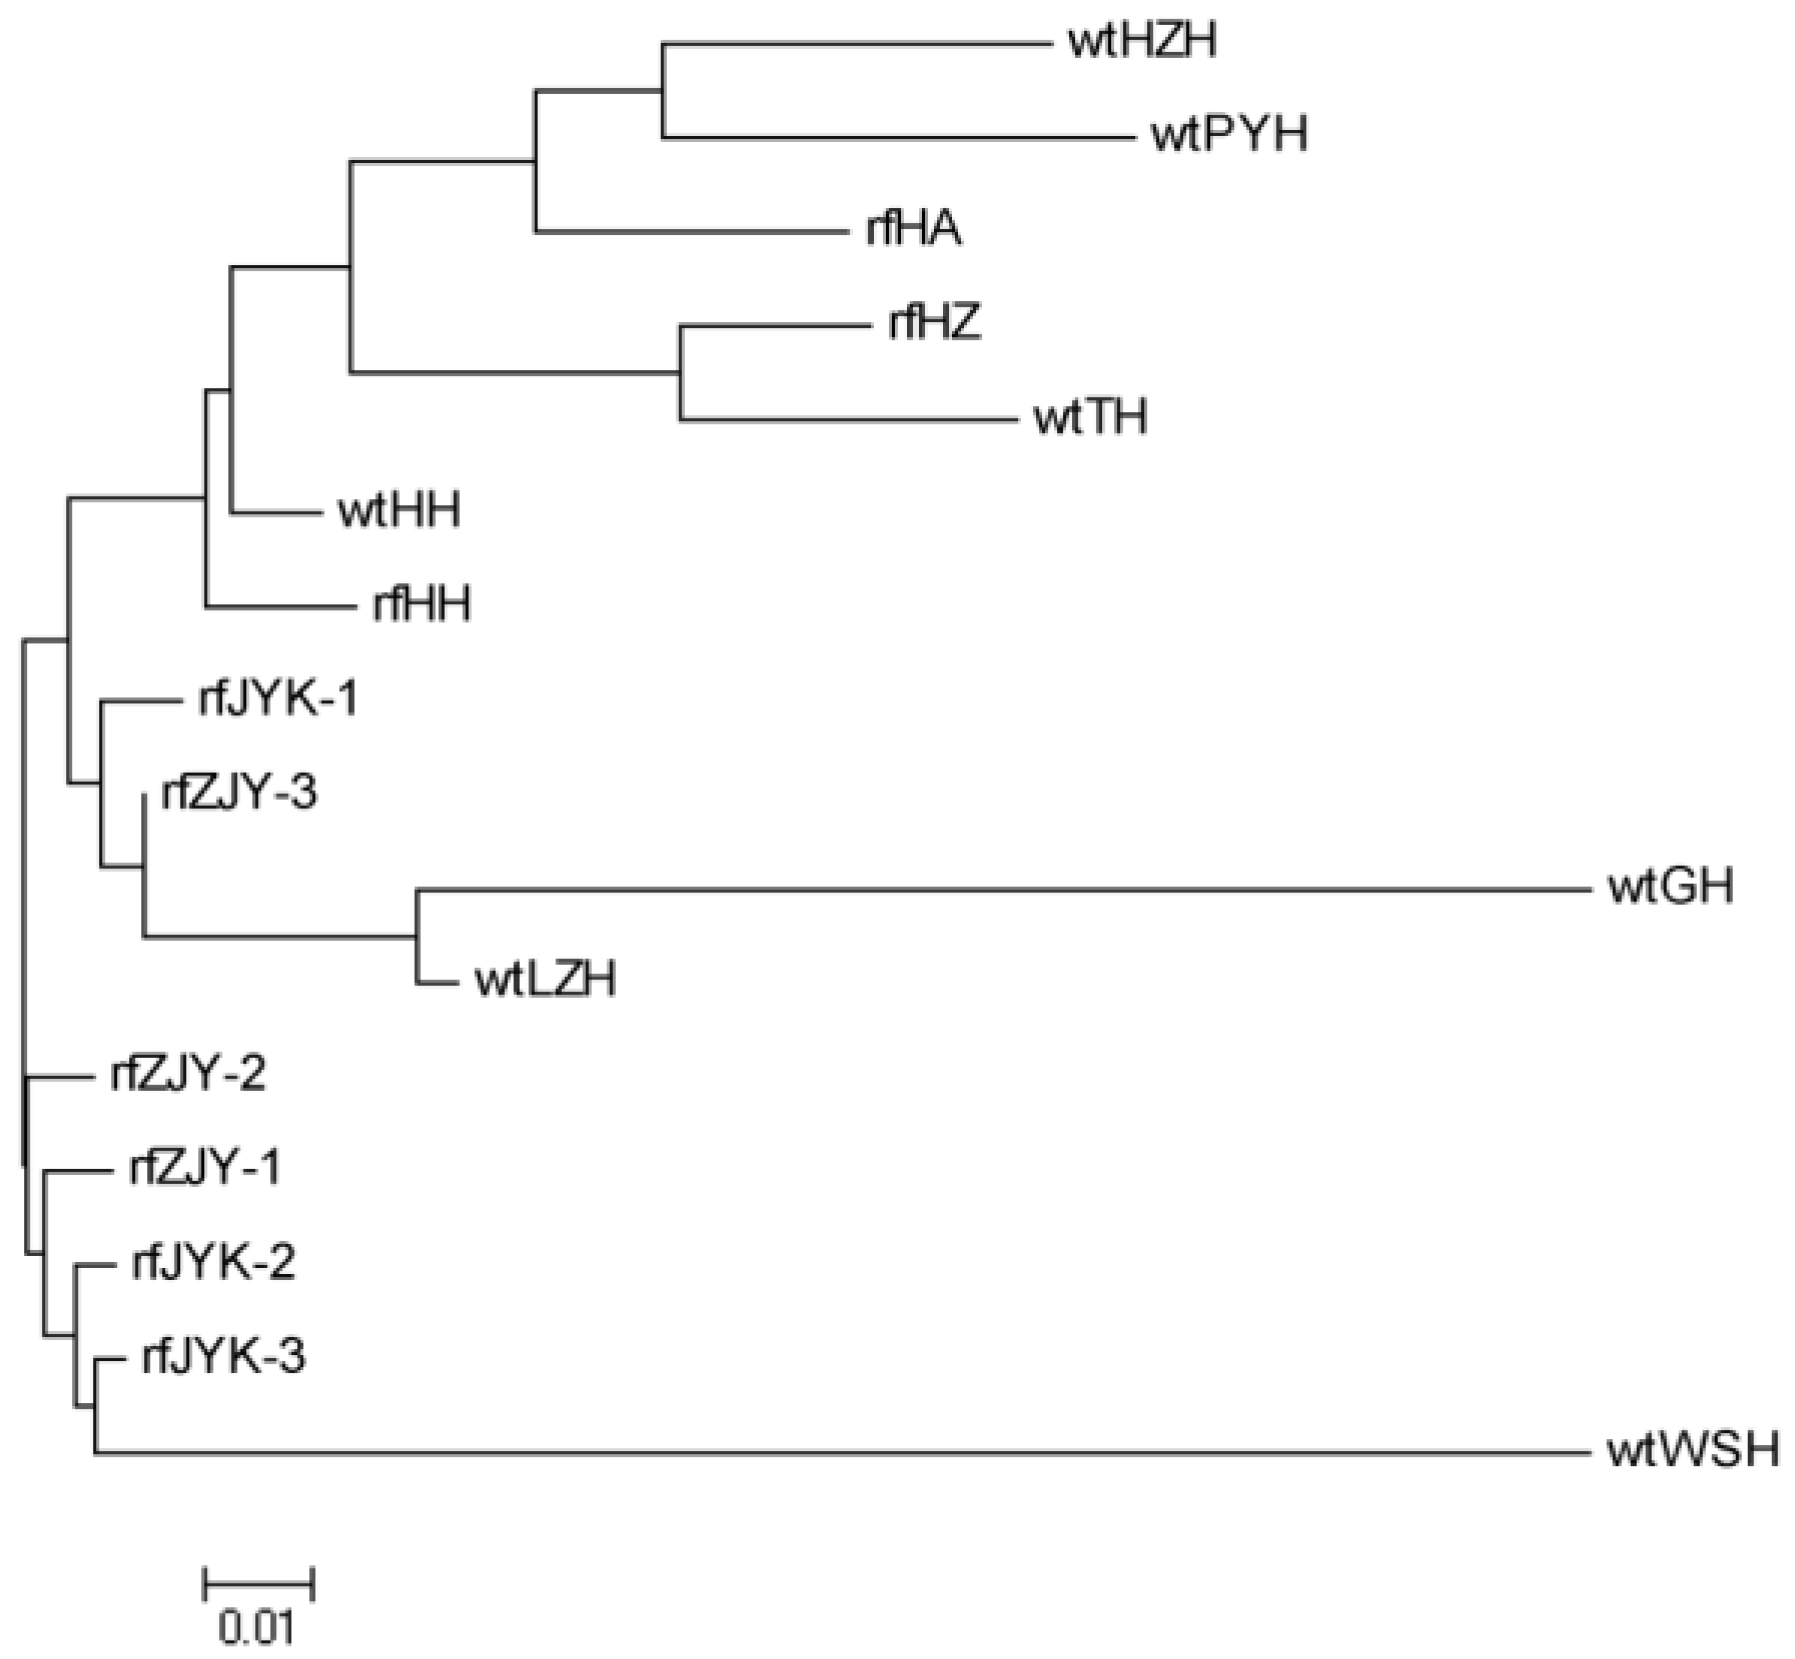
Fst values of cultured populations were all less than 0.05, indicating a slight degree of genetic differentiation, while there was a moderate to a large degree of genetic differentiation between wild populations. For example, the Fst value of 0.024 between wtHH and wtLZH was the smallest, which suggested the genetic differentiation is very small, resulting from close geographical distance, as they were both in the Hubei region. The maximum Fst value between wtGH and wtWSH was 0.1711, suggesting that there was a large genetic differentiation and fewer gene exchanges between the two populations due to the long geographical distance. The population structure of freshwater crayfish is significantly influenced by geographic position, which limits gene flow and thus facilitates differentiation between populations [52]. However, the Fst value was not completely correlated with distance, consistent with the conclusion that the isolation-by-distance pattern was not significant in the previous study [8], which may be due to human-mediated transmission, genetic drift and population size [3].
Characterization of the genetic divergence between the brood stocks and wild population could be helpful for defining better management strategies, such as establishment and maintenance of nursery populations, conservation of genetic diversity and promoting sustainable production of crayfish [53]. Intensive cultured populations usually have lower genetic diversity than wild populations due to inbreeding, the founder effect and the increase in genetic drift caused by the use of fewer parents [17,54,55,56]. In this study, we compared the genetic diversity between seven wild populations and nine cultured populations, and lower genetic differentiation and a high level of gene flow between the populations were detected. However, contrary to expectations, the genetic diversity of the cultured population was higher than that of the wild population, which could be that the cultured populations were produced from a sufficient number of parents with high levels of polymorphism. Therefore, we recommend that wild individuals continue to be introduced as hatchery stock and minimize inbreeding to maintain a high level of genetic diversity in the cultured population. In addition, due to their higher genetic variation of the native populations from the southeastern United States or Mexico, new genetic material should be brought in from the native range to increase genetic variation and reverse any inbreeding.
Qianjiang City of the Hubei province has been recognized as the hometown of red swamp crayfish in China by the Ministry of Agriculture of the People’s Republic of China [57]. The artificial breeding and culture model of crayfish is considered to be a popular model of crayfish production [5]. A population breeding strategy was applied, and several generations have been performed to obtain good characteristics, such as growth, disease resistance and suitability [58,
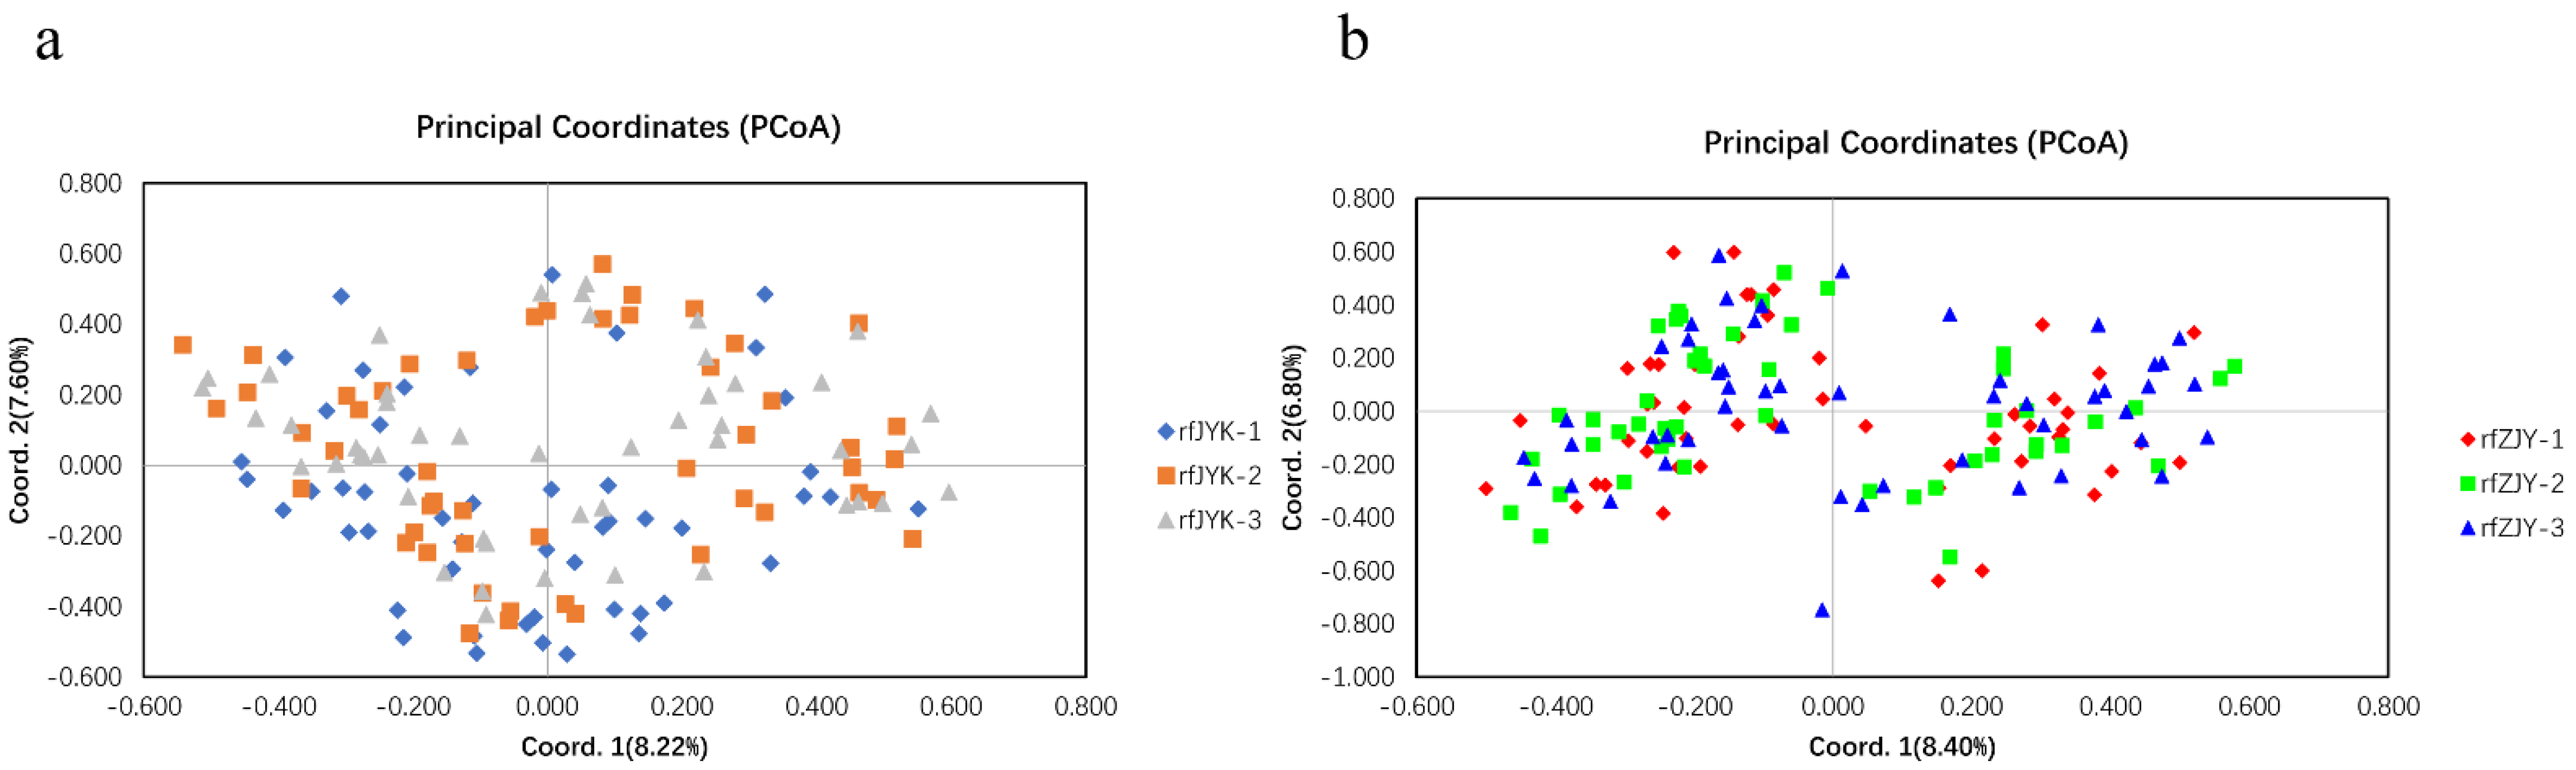
59]. To assess the effect of genetic breeding on the genetic diversity of the populations, we evaluated the genetic diversity of three consecutive generations from ZJY and JYK in Qianjiang City. No apparent differentiation of genetic diversity was observed, indicating that the two populations are of significant selection breeding potential because their aquaculture traits are better than other cultured populations.

5. Conclusions

Based on microsatellite markers, the genetic diversity of seven wild populations and nine cultured populations were investigated and reflected the effect of stock enhancement and release on the wild populations in the mid-lower Yangtze River. Therefore, continuous monitoring of the genetic diversity level and genetic structure changes of red swamp crayfish in the Yangtze River is necessary to protect the wild genetic resource and provide germplasm resources for cultured populations, avoiding adverse effects of anthropic disturbance. Overall, this study provides important genetic information for stock conservation and artificial breeding programs in red swamp crayfish.

Supplementary Materials

The following supporting information can be downloaded at: https://www.mdpi.com/article/10.3390/fishes7040142/s1, Table S1: The SSR banding patterns; Table S2: Sign tests and Wilcoxon tests for heterozygosity excess at 20 microsatellite loci in 16 populations.

Author Contributions

X.-F.G.: Investigation, software, formal analysis, data curation, writing—original draft preparation. M.L., Y.-L.Z., W.-Y.W., Z.L., and L.Z.: software, data validation. Z.-W.W.: conceptualization, methodology, supervision, validation, writing—review and editing. J.-F.G.: resources, supervision, writing—review and editing. All authors have read and agreed to the published version of the manuscript.

Funding

This study was funded by Key R&D projects in Hubei Province (2021BBA232) and the National Key R&D Program of China (2018YFD0901201).

Institutional Review Board Statement

The study was approved by Institutional Animal Care and Use Committee of IHB, CAS (protocol code 2021-015 and 12 November 2021).

Data Availability Statement

The authors declare that data supporting the findings of this study are available within the article.

Acknowledgments

We greatly thank Zhong-hu Tao and Na-na Shu from Qianjiang Fisheries Technology Extension Center for sample collecting.

Conflicts of Interest

The authors declare no conflict of interest.

References

  1. Dörr, A.J.M.; Scoparo, M.; Cardinali, I.; La Porta, G.; Caldaroni, B.; Magara, G.; Pallottini, M.; Selvaggi, R.; Cenci-Goga, B.; Goretti, E.; et al. Population Ecology and Genetic Diversity of the Invasive Alien Species Procambarus clarkii in Lake Trasimeno (Italy). Biology 2021, 10, 1059. [Google Scholar] [CrossRef] [PubMed]
  2. Li, Y.; Guo, X.; Cao, X.; Deng, W.; Luo, W.; Wang, W. Population Genetic Structure and Post-Establishment Dispersal Patterns of the Red Swamp Crayfish Procambarus Clarkii in China. PLoS ONE 2012, 7, e40652. [Google Scholar] [CrossRef] [Green Version]
  3. Yue, G.H.; Li, J.; Bai, Z.; Wang, C.M.; Feng, F. Genetic diversity and population structure of the invasive alien red swamp crayfish. Biol. Invasions 2010, 12, 2697–2706. [Google Scholar] [CrossRef]
  4. Yi, S.; Li, Y.; Shi, L.; Zhang, L.; Li, Q.; Chen, J. Characterization of Population Genetic Structure of red swamp crayfish, Procambarus clarkii, in China. Sci. Rep. 2018, 8, 5586. [Google Scholar] [CrossRef] [PubMed] [Green Version]
  5. Zhong, Y.; Tang, Z.; Huang, L.; Wang, D.; Lu, Z. Genetic diversity of Procambarus clarkii populations based on mitochondrial DNA and microsatellite markers in different areas of Guangxi, China. Mitochondrial DNA Part A 2020, 31, 48–56. [Google Scholar] [CrossRef]
  6. Li, X.L.; Li, F.; Zhu, J.J.; Gu, Z.M. Genetic diversity of the red swamp crayfish (Procambarus clarkii) resources based on SSR markers. J. Huazhong Agric. Univ. 2016, 35, 63–68. [Google Scholar] [CrossRef]
  7. Tan, Y.F.; Peng, G.H.; Xiong, L.J.; Peng, B.; Wu, Y.B.; Song, C.W.; Bai, X.F. Genetic diversity and structure analysis of 13 red swamp crayfish (Procambarus clarkii) populations in Yangtze River basin. J. Huazhong Agric. Univ. 2020, 39, 33–39. [Google Scholar] [CrossRef]
  8. Liu, F.; Qu, Y.-K.; Geng, C.; Wang, A.-M.; Zhang, J.-H.; Li, J.-F.; Chen, K.-J.; Liu, B.; Tian, H.-Y.; Yang, W.-P.; et al. Analysis of the population structure and genetic diversity of the red swamp crayfish (Procambarus clarkii) in China using SSR markers. Electron. J. Biotechnol. 2020, 47, 59–71. [Google Scholar] [CrossRef]
  9. Ellegren, H.; Galtier, N. Determinants of genetic diversity. Nat. Rev. Genet. 2016, 17, 422–433. [Google Scholar] [CrossRef] [Green Version]
  10. Gamfeldt, L.; Källström, B. Increasing intraspecific diversity increases predictability in population survival in the face of perturbations. Oikos 2007, 116, 700–705. [Google Scholar] [CrossRef]
  11. Allendorf, F.W.; Phelps, S.R. Loss of Genetic Variation in a Hatchery Stock of Cutthroat Trout. Trans. Am. Fish. Soc. 1980, 109, 537–543. [Google Scholar] [CrossRef]
  12. Gui, J.-F.; Zhou, L.; Li, X.-Y. Rethinking fish biology and biotechnologies in the challenge era for burgeoning genome resources and strengthening food security. Water Biol. Secur. 2021, 1, 100002. [Google Scholar] [CrossRef]
  13. Guo, W.; Wang, Z.-Y.; Wang, Y.-L.; Zhang, Z.-P.; Gui, J.-F. Isolation and characterization of six microsatellite markers in the large yellow croaker (Pseudosciaena crocea Richardson). Mol. Ecol. Notes 2005, 5, 369–371. [Google Scholar] [CrossRef]
  14. Li, F.-B.; Gui, J.-F. Clonal diversity and genealogical relationships of gibel carp in four hatcheries. Anim. Genet. 2008, 39, 28–33. [Google Scholar] [CrossRef] [PubMed]
  15. Guo, W.; Gui, J.-F. Microsatellite marker isolation and cultured strain identification in Carassius auratus gibelio. Aquac. Int. 2008, 16, 497–510. [Google Scholar] [CrossRef]
  16. Ha, H.P.; Nguyen, T.T.T.; Poompuang, S.; Na-Nakorn, U. Microsatellites revealed no genetic differentiation between hatchery and contemporary wild populations of striped catfish, Pangasianodon hypophthalmus (Sauvage 1878) in Vietnam. Aquaculture 2009, 291, 154–160. [Google Scholar] [CrossRef]
  17. Wang, L.; Meng, Z.; Liu, X.; Zhang, Y.; Lin, H. Genetic Diversity and Differentiation of the Orange-Spotted Grouper (Epinephelus coioides) Between and Within Cultured Stocks and Wild Populations Inferred from Microsatellite DNA Analysis. Int. J. Mol. Sci. 2011, 12, 4378–4394. [Google Scholar] [CrossRef] [Green Version]
  18. Cheng, W.; Wang, D.; Wang, C.; Du, H.; Wei, Q. Microsatellite markers reveal genetic divergence among wild and cultured populations of Chinese sucker Myxocyprinus asiaticus. Genet. Mol. Res. 2016, 15, gmr7581. [Google Scholar] [CrossRef]
  19. Coughlan, J.P.; Imsland, A.K.; Galvin, P.T.; Fitzgerald, R.D.; Naevdal, G.; Cross, T.F. Microsatellite DNA variation in wild populations and farmed strains of turbot from Ireland and Norway: A preliminary study. J. Fish Biol. 1998, 52, 916–922. [Google Scholar] [CrossRef]
  20. Lind, C.E.; Evans, B.S.; Knauer, J.; Taylor, J.J.; Jerry, D.R. Decreased genetic diversity and a reduced effective population size in cultured silver-lipped pearl oysters (Pinctada maxima). Aquaculture 2009, 286, 12–19. [Google Scholar] [CrossRef]
  21. Kalia, R.K.; Rai, M.K.; Kalia, S.; Singh, R.; Dhawan, A.K. Microsatellite markers: An overview of the recent progress in plants. Euphytica 2010, 177, 309–334. [Google Scholar] [CrossRef]
  22. Varshney, R.; Graner, A.; Sorrells, M.E. Genic microsatellite markers in plants: Features and applications. Trends Biotechnol. 2005, 23, 48–55. [Google Scholar] [CrossRef] [PubMed]
  23. Bassil, N.; Hummer, K.; Postman, J.D.; Fazio, G.; Baldo, A.; Armas, I.; Williams, R. Nomenclature and genetic relationships of apples and pears from Terceira Island. Genet. Resour. Crop Evol. 2008, 56, 339–352. [Google Scholar] [CrossRef]
  24. Peyran, C.; Planes, S.; Tolou, N.; Iwankow, G.; Boissin, E. Development of 26 highly polymorphic microsatellite markers for the highly endangered fan mussel Pinna nobilis and cross-species amplification. Mol. Biol. Rep. 2020, 47, 2551–2559. [Google Scholar] [CrossRef]
  25. Yi, T.; Guo, W.; Liang, X.; Yang, M.; Lv, L.; Tian, C.; Song, Y.; Zhao, C.; Sun, J. Microsatellite analysis of genetic diversity and genetic structure in five consecutive breeding generations of mandarin fish Siniperca chuatsi (Basilewsky). Genet. Mol. Res. 2015, 14, 2600–2607. [Google Scholar] [CrossRef]
  26. Zhou, Y.-L.; Wu, J.-J.; Wang, Z.-W.; Li, G.-H.; Zhou, L.; Gui, J.-F. Microsatellite polymorphism and genetic differentiation of different populations screened from genome survey sequencing in red-tail catfish (Hemibagrus wyckioides). Aquac. Rep. 2021, 19, 100614. [Google Scholar] [CrossRef]
  27. Chen, G.; Yue, Y.; Hua, Y.; Hu, D.; Shi, T.; Chang, Z.; Yang, X.; Wang, L. SSR marker development in Clerodendrum trichotomum using transcriptome sequencing. PLoS ONE 2019, 14, e0225451. [Google Scholar] [CrossRef]
  28. Ronoh, R.; Linde, M.; Winkelmann, T.; Abukutsa-Onyango, M.; Dinssa, F.F.; Debener, T. Development of next-generation sequencing (NGS)-based SSRs in African nightshades: Tools for analyzing genetic diversity for conservation and breeding. Sci. Hortic. 2018, 235, 152–159. [Google Scholar] [CrossRef]
  29. Wang, X.; Gan, B.; Yu, X.; Zhou, L.; Wang, Z.; Gui, J.; Yin, Z.; Tong, J. Transcript-associated microsatellites from gibel carp and their applicability of genetic analyses in Carassius auratus populations. J. Appl. Ichthyol. 2018, 34, 1108–1116. [Google Scholar] [CrossRef]
  30. Guo, X.-F.; Zhou, Y.-L.; Liu, M.; Wang, Z.-W.; Gui, J.-F. Integrated application of Iso-seq and RNA-seq provides insights into unsynchronized growth in red swamp crayfish (Procambarus clarkii). Aquac. Rep. 2022, 22, 101008. [Google Scholar] [CrossRef]
  31. Meirmans, P.G. USING THE AMOVA FRAMEWORK TO ESTIMATE A STANDARDIZED GENETIC DIFFERENTIATION MEASURE. Evolution 2006, 60, 2399–2402. [Google Scholar] [CrossRef] [PubMed]
  32. Meirmans, P.G.; Hedrick, P.W. Assessing population structure: FST and related measures. Mol. Ecol. Resour. 2010, 11, 5–18. [Google Scholar] [CrossRef] [PubMed]
  33. Mitra, R.L.; Greenstein, S.A.; Epstein, L.M. An algorithm for managing QT prolongation in coronavirus disease 2019 (COVID-19) patients treated with either chloroquine or hydroxychloroquine in conjunction with azithromycin: Possible benefits of intravenous lidocaine. HeartRhythm Case Rep. 2020, 6, 244–248. [Google Scholar] [CrossRef] [PubMed]
  34. Peakall, R.; Smouse, P.E. GenAlEx 6.5: Genetic analysis in Excel. Population genetic software for teaching and research—An update. Bioinformatics 2012, 28, 2537–2539. [Google Scholar] [CrossRef] [PubMed] [Green Version]
  35. Cornuet, J.M.; Luikart, G. Description and Power Analysis of Two Tests for Detecting Recent Population Bottlenecks From Allele Frequency Data. Genetics 1996, 144, 2001–2014. [Google Scholar] [CrossRef]
  36. Kalinowski, S.T.; Taper, M.L.; Marshall, T.C. Revising how the computer program cervus accommodates genotyping error increases success in paternity assignment. Mol. Ecol. 2007, 16, 1099–1106. [Google Scholar] [CrossRef]
  37. Tamura, K.; Peterson, D.; Peterson, N.; Stecher, G.; Nei, M.; Kumar, S. MEGA5: Molecular Evolutionary Genetics Analysis Using Maximum Likelihood, Evolutionary Distance, and Maximum Parsimony Methods. Mol. Biol. Evol. 2011, 28, 2731–2739. [Google Scholar] [CrossRef] [Green Version]
  38. Pritchard, J.K.; Stephens, M.; Donnelly, P. Inference of population structure using multilocus genotype data. Genetics 2000, 155, 945–959. [Google Scholar] [CrossRef]
  39. Fasoli, G.; Barrio, E.; Tofalo, R.; Suzzi, G.; Belloch, C. Multilocus analysis reveals large genetic diversity in Kluyveromyces marxianus strains isolated from Parmigiano Reggiano and Pecorino di Farindola cheeses. Int. J. Food Microbiol. 2016, 233, 1–10. [Google Scholar] [CrossRef] [Green Version]
  40. Garcia-Mas, J.; Oliver, M.; Gómez-Paniagua, H.; de Vicente, M. Comparing AFLP, RAPD and RFLP markers for measuring genetic diversity in melon. Theor. Appl. Genet. 2000, 101, 860–864. [Google Scholar] [CrossRef]
  41. Kaur, K.; Sharma, V.; Singh, V.; Wani, M.S.; Gupta, R.C. Development of novel SSR markers for evaluation of genetic diversity and population structure in Tribulus terrestris L. (Zygophyllaceae). 3 Biotech 2016, 6, 1–10. [Google Scholar] [CrossRef] [PubMed] [Green Version]
  42. Powell, W.; Morgante, M.; Andre, C.; Hanafey, M.; Vogel, J.; Tingey, S.; Rafalski, A. The comparison of RFLP, RAPD, AFLP and SSR (microsatellite) markers for germplasm analysis. Mol. Breed. 1996, 2, 225–238. [Google Scholar] [CrossRef]
  43. Zheng, X.H.; Lu, C.Y.; Zhao, Y.Y.; Lee, C.; Cao, D.C.; Chang, Y.M.; Liang, L.Q.; Sun, X.W. A Set of Polymorphic Trinucleotide and Tetranucleotide Microsatellite Markers for Silver Crucian Carp (Carassius auratus gibelio) and Cross-Amplification in Crucian Carp. Biochem. Genet. 2010, 48, 624–635. [Google Scholar] [CrossRef] [PubMed]
  44. Mulligan, C.J.; Kitchen, A.; Miyamoto, M.M. Comment on "Population Size Does Not Influence Mitochondrial Genetic Diversity in Animals". Science 2006, 314, 1390. [Google Scholar] [CrossRef] [Green Version]
  45. Huang, J.; Tang, S.; Cai, F.; Lin, Y.; Wu, Z. Microsatellite evidence of dispersal mechanism of red swamp crayfish (Procambarus clarkii) in the Pearl River basin and implications for its management. Sci. Rep. 2017, 7, 1–8. [Google Scholar] [CrossRef]
  46. Gherardi, F. Crayfish invading Europe: The case study of Procambarus clarkii. Mar. Freshw. Behav. Physiol. 2006, 39, 175–191. [Google Scholar] [CrossRef]
  47. Barbaresi, S.; Gherardi, F.; Mengoni, A.; Souty-Grosset, C. Genetics and Invasion Biology in Fresh Waters: A Pilot Study of Procambarus clarkii in Europe; Spinger: Berlin/Heidelberg, Germany, 2007; pp. 381–400. [Google Scholar] [CrossRef]
  48. Oficialdegui, F.J.; Clavero, M.; Sánchez, M.I.; Green, A.J.; Boyero, L.; Michot, T.C.; Klose, K.; Kawai, T.; Lejeusne, C. Unravelling the global invasion routes of a worldwide invader, the red swamp crayfish (Procambarus clarkii). Freshw. Biol. 2019, 64, 1382–1400. [Google Scholar] [CrossRef]
  49. Torres, E.; Álvarez, F. Genetic variation in native and introduced populations of the red swamp crayfish Procambarus clarkii (Girard, 1852) (Crustacea, Decapoda, Cambaridae) in Mexico and Costa Rica. Aquat. Invasions 2012, 7, 235–241. [Google Scholar] [CrossRef]
  50. Rodríguez-Serna, M.; Carmona-Osalde, C.; Olvera-Novoa, M.A.; Arredondo-Figuero, J.L. Fecundity, egg development and growth of juvenile crayfish Procambarus (Austrocambarus ) llamasi (Villalobos 1955) under laboratory conditions. Aquac. Res. 2000, 31, 173–179. [Google Scholar] [CrossRef]
  51. Na-Nakorn, U.; Brummett, R.E. Use and exchange of aquatic genetic resources for food and aquaculture: Clarias catfish. Rev. Aquac. 2009, 1, 214–223. [Google Scholar] [CrossRef]
  52. Hedgecock, D.; Stelmach, D.J.; Nelson, K.; Lindenfelser, M.E.; Malecha, S.R. GENETIC DIVERGENCE AND BIOGEOGRAPHY OF NATURAL POPULATIONS OF Macrobrachium rosenbergii. Proc. World Maric. Soc. 2009, 10, 873–879. [Google Scholar] [CrossRef]
  53. Nahavandi Genetic diversity of intensive cultured and wild tiger shrimp Penaeus monodon (Fabricius) in Malaysia using microsatellite markers. Afr. J. Biotechnol. 2011, 10, 15501–15508. [CrossRef]
  54. An, H.S.; Nam, M.M.; Myeong, J.I.; An, C.M. Genetic diversity and differentiation of the Korean starry flounder (Platichthys stellatus) between and within cultured stocks and wild populations inferred from microsatellite DNA analysis. Mol. Biol. Rep. 2014, 41, 7281–7292. [Google Scholar] [CrossRef] [PubMed]
  55. Duong, T.-Y.; Scribner, K.T. Regional variation in genetic diversity between wild and cultured populations of bighead catfish (Clarias macrocephalus) in the Mekong Delta. Fish. Res. 2018, 207, 118–125. [Google Scholar] [CrossRef]
  56. Norris, A.; Bradley, D.; Cunningham, E. Microsatellite genetic variation between and within farmed and wild Atlantic salmon (Salmo salar) populations. Aquaculture 1999, 180, 247–264. [Google Scholar] [CrossRef]
  57. Jin, S.; Jacquin, L.; Xiong, M.; Li, R.; Lek, S.; Li, W.; Zhang, T. Reproductive pattern and population dynamics of commercial red swamp crayfish (Procambarus clarkii) from China: Implications for sustainable aquaculture management. PeerJ 2019, 7, e6214. [Google Scholar] [CrossRef] [Green Version]
  58. Ford, M.J. Selection in Captivity during Supportive Breeding May Reduce Fitness in the Wild. Conserv. Biol. 2002, 16, 815–825. [Google Scholar] [CrossRef]
  59. Wang, J. An Estimator for Pairwise Relatedness Using Molecular Markers. Genetics 2002, 160, 1203–1215. [Google Scholar] [CrossRef]
Figure 1. Sampling locations of Procambarus clarkii populations, including 7 wild populations and 9 cultured populations. Blue represents the wild populations and red represents the cultured populations.
Fishes 07 00142 g001
Figure 2. Principal coordinate analysis (PCoA) in three successive generations of Jiyukou and Zhangjiayao populations. (a) Jiyukou populations. (b) Zhangjiayao populations. Population abbreviation as in Table 1, in parentheses along X and Y-axes: percent variance explained by PCoA1 and PCoA2.
Fishes 07 00142 g002
Figure 3. NJ phylogenetic tree of 16 Procambarus 9 larkia populations based on Nei’s genetic distance using 20 polymorphic SSR loci. Population abbreviation as in Table 1.
Fishes 07 00142 g003
Figure 4. Principal coordinate analysis (PCoA) of 800 individuals in 16 Procambarus clarkii populations. Population abbreviation as in Table 1. The purple circle refers to the wtWSH population, the green circle refers to the wtGH population. The two circled populations are the furthest from other populations and have a higher concentration of individuals within the population. In parentheses along the X- and Y-axes: percent variance explained by PCoA1 and PCoA2.
Fishes 07 00142 g004
Figure 5. Population structure analysis based on 20 polymorphic SSR loci. (a) Plot of delta K values from structure analysis; (b) bar plot from structure clustering analysis with K = 5.
Fishes 07 00142 g005
Table 1. Information of the crayfish populations analyzed in this study.
CodeLocationThe Sample QuantityLatitudeLongitudeDate of Sampling
CulturedrfHAJiangsu Huaian5033°42′ N118°87′ E13 June 2019
rfHHHubei Honghu5029°95′ N113°50′ E18 June 2020
rfHZZhejiang huzhou5030°90′ N120°11′ E7 July 2020
rfJYK-1Hubei Qianjiang5030°45′ N112°60′ E18 April 2019
rfJYK-2Hubei Qianjiang5030°45′ N112°60′ E24 September 2020
rfJYK-3Hubei Qianjiang5030°45′ N112°60′ E22 April 2021
rfZJY-1Hubei Qianjiang5030°37′ N112°75′ E18 April 2019
rfZJY-2Hubei Qianjiang5030°37′ N112°75′ E24 September 2020
rfZJY-3Hubei Qianjiang5030°37′ N112°75′ E22 April 2021
WildwtGHHubei Wuhan5030°58′ N113°04′ E7 May 2019
wtHHHubei Honghu5029°94′ N113°48′ E18 June 2020
wtHZHJiangsu Huaian5033°44′ N118°72′ E13 June 2020
wtLZHHubei Wuhan5030°25′ N113°53′ E20 July 2020
wtPYHJiangxi Jiujiang5029°27′ N116°25′ E5 June 2019
wtTHZhejiang Huzhou5030°97′ N120°09′ E7 July 2020
wtWSHShandong Weishan5034°69′ N117°28′ E14 June 2019
Cultured represents the cultured populations from rice fields (rf), wild represents the wild populations from natural lakes (wt), the code is an abbreviation of the sampling region.
Table 2. Information on different types of SSR.
SSR TypeNumber
Mono-nucleotide39,797
Di-nucleotide21,825
Tri-nucleotide9698
Tetra-nucleotide862
Penta-nucleotide601
Hex-nucleotide56
Total72,839
Table 3. Detailed information of 20 SSR loci with polymorphism.
LocusRepeat MotifPrimer Sequence (5′-3′)Tm (°C)Allele Ranges (bp)Fluorochromes
PC1(GA)8F: CGGATGGGCTGATGCTATTCACAATTG60269–283FAM
R: GTAGAAGATAGGAGATGAGGCCAC
PC2(CAC)7F: ATTGGAAGACCGGGTTCGAGGG58210–228HEX
R: GGCGTAGAGGAGGTGGTGGT
PC3(TG)7F: ACTCACTCCCTTGCCATGCAAGTT57198–210FAM
R: CTTATGTGACATGAAAAAAAAAGTCCT
PC4(GT)7F: CTTGTGGTGTTAAGTAGGGGGTG57192–204TAMRA
R: CACTAGTGATGCTTCACTCTTAAGTAATAC
PC5(GT)11F: ATGGTTAGTGTTGCTCCCAATGGGAT58177–197HEX
R: CACAAGTGTAGCTCTTTTCCAGTAACT
PC6(TA)6F: AGGTTCGAGCCCTTATCATGGC57281–291FAM
R: CTGATGTGGCCCATGCACTGT
PC7(AT)9F: CTCGTCTTACATTGACAGAGTACGT56304–320HEX
R: ACTAACCTCTCACTACATTACTACTGC
PC8(CCA)5F: AGCCCAGTAGACACCACTCGT56189–201ROX
R: AGGACTCTCCGATGATGACGGT
PC9(CA)6F: AGGTTCCCAGCCATGTTGATGCT57245–255HEX
R: GAACACGGATTTAGTAGTACATGGGT
PC10(TA)13F: ACCGACACCATCCTTGATACCTAC57195–219ROX
R: CATTTCCCACTTTGCTATAGCAGCT
PC11(TG)20F: GGCTTAAGTAATAATGCCTTGATGCAC57211–249FAM
R: AGAAGCAGCTGTGGAATGTAGGGT
PC12(TA)6F: ATTTCGGGGGTCATTGTCCTCGC59366–376ROX
R: ACCAACACCCTCCTCTTGTCCG
PC13(GT)7F: AGTCGGAGATTGTTTGCACGTATGGT58245–257ROX
R: GCCATTTTATCAGAATCTACATCAAGG
PC14(TG)8F: ACGCACGCTTGCATCTGTATGTGT57265–279TAMRA
R: GTCATCCCCAGAATTACCGACAGT
PC15(AC)12F: GACAATTAGGACATTTCTTAGGCGCTT57194–216HEX
R: GTCGTGGACCATTATCAAGTAGTGTG
PC16(AG)11F: ACGGATGGGCTGATGCTATTCAC57232–242TAMRA
R: CTGATGTAACGAGGTATTGTCTGTCC
PC17(ATA)9F: TCGTTTCTCCTGTATATCTACCGAGC58187–211TAMRA
R: ACACACCAGGCCAGGTCCATCTT
PC18(TG)6F: TCATTCTTAGGCAGGTAATTTTGTTAAAGC56145–155FAM
R: CCAGGAGGTTTGAGCATGAACTC
PC19(GCT)12F: CAGATCAGATTTGCTATGCAGTGTTGTGT59158–191HEX
R: AGGAATCTAATTGCTTATTCATTGCCTCC
PC20(TTG)5F: GGCTGAAGATATGATGACCAAACCACAC60275–287HEX
R: GCAAGAATAGGATCAGAATAAGAGGTAGG
Table 4. Genetic diversity measurements of 20 SSR loci in all individuals.
LocusNaNeHoHeFPICFst
PC152.220.6680.550−0.2130.4690.0339
PC241.980.4340.4940.1220.4230.0556
PC352.180.5230.5420.0360.440.0665
PC432.010.3270.5010.3480.3960.0856
PC532.260.5100.5570.0850.4730.0876
PC641.850.5400.461−0.1720.380.0488
PC741.610.3350.3800.1180.3120.0815
PC832.040.4970.5100.0260.3990.0499
PC921.050.0320.0430.2660.0420.1277
PC1072.650.2180.6230.6490.560.0797
PC11114.140.6850.7590.0970.7240.1172
PC1241.650.3370.3940.1450.3590.1714
PC1382.600.5390.6160.1250.5450.0850
PC1452.190.2890.5440.4680.4730.1261
PC1563.130.5060.6800.2560.6330.0877
PC1642.770.5660.6390.1140.5680.0901
PC1742.710.5780.6310.0850.5670.0807
PC1861.750.3760.4300.1240.3560.0741
PC1953.720.6690.7310.0850.6810.0854
PC2041.820.0290.4510.9350.3680.1926
Total97
Mean4.852.320.4330.5270.1850.4580.0914
Na: number of alleles; Ne: number of effective alleles; Ho: observed heterozygosity; He: expected heterozygosity; F: fixation index; PIC: polymorphic information content; Fst: F-statistics; Mean: mean values of the genetic diversity parameter of 20 loci.
Table 5. Statistical values of genetic diversity of 20 microsatellite loci in 16 populations.
PopulationNaNeHoHeIF
rfHA3.302.070.3980.4610.7700.148
rfHH3.052.130.4510.4680.7820.052
rfHZ3.202.200.4200.4960.8460.144
rfJYK-13.252.300.4520.5030.8630.106
rfJYK-23.452.270.4560.5160.8790.105
rfJYK-33.302.280.4530.5200.8880.122
rfZJY-13.252.260.4540.5090.8620.101
rfZJY-23.302.260.4630.5090.8650.087
rfZJY-33.502.300.4710.5230.8840.085
Mean3.29 ± 0.432.23 ± 0.030.446 ± 0.0080.501 ± 0.0070.849 ± 0.0140.106 ± 0.010
wtGH2.551.820.3920.3920.6230.055
wtHH2.952.200.4490.4970.8210.123
wtHZH3.152.010.4260.4700.7720.112
wtLZH2.802.220.4330.4950.8180.145
wtPYH2.802.030.4330.4680.7500.075
wtTH3.251.960.4180.4540.7780.099
wtWSH2.751.800.3500.3990.6660.120
Mean 2.89 ± 0.092.00 ± 0.060.414 ± 0.0130.454 ± 0.0160.747 ± 0.0280.104 ± 0.012
Population abbreviation as in Table 1. Na: number of alleles; Ne: number of effective alleles; Ho: observed heterozygosity; He: expected heterozygosity; I: Shannon’s information index; F: fixation index. Mean: mean values of the genetic diversity parameter of cultured and wild populations.
Table 6. Statistical values of genetic diversity of 20 microsatellite loci in three generations.
PopulationNaNeHoHeIFHomozygosity
rfJYK-13.252.300.4520.5030.8630.1060.497
rfJYK-23.452.270.4560.5160.8790.1050.484
rfJYK-33.302.280.4530.5200.8880.1220.480
rfZJY-13.252.260.4540.5090.8620.1010.491
rfZJY-23.302.260.4630.5090.8650.0870.491
rfZJY-33.502.300.4710.5230.8840.0850.477
Population abbreviation as in Table 1. Na: number of alleles; Ne: number of effective alleles; Ho: observed heterozygosity; He: expected heterozygosity; I: Shannon’s information index; F: fixation index; homozygosity: homozygosity.
Table 7. Matrix of pairwise Fst (below diagonal) and Nei’s genetic distance (above diagonal) between 16 populations.
rfHArfHHrfHZrfJYK-1rfJYK-2rfJYK-3rfZJY-1rfZJY-2rfZJY-3wtGHwtHHwtHZHwtLZHwtPYHwtTHwtWSH
rfHA\0.0720.0700.0930.0800.0760.0920.0880.0860.2420.0630.0610.1270.1010.1050.184
rfHH0.038\0.0720.0330.0420.0380.0360.0320.0310.1700.0240.0930.0520.1070.0940.196
rfHZ0.0370.037\0.0850.0750.0770.0870.0940.0920.2380.0650.1210.1230.1520.0490.213
rfJYK-10.0460.0170.042\0.0200.0200.0280.0190.0180.1330.0400.1120.0410.1200.0950.164
rfJYK-20.0400.0220.0360.011\0.0080.0130.0170.0120.1500.0380.1150.0370.1070.0980.145
rfJYK-30.0380.0200.0370.0100.004\0.0170.0170.0140.1380.0400.1040.0440.1110.1000.142
rfZJY-10.0460.0200.0420.0150.0070.008\0.0130.0170.1610.0370.1280.0460.1150.1000.147
rfZJY-20.0440.0170.0440.0100.0080.0080.007\0.0130.1580.0420.1250.0460.1130.1140.150
rfZJY-30.0430.0170.0430.0090.0050.0060.0080.006\0.1330.0350.1050.0310.0990.1140.170
wtGH0.1260.0930.1230.0740.0810.0790.0880.0880.071\0.1640.1860.1130.2020.2180.321
wtHH0.0340.0140.0350.0190.0180.0200.0170.0200.0160.090\0.0860.0480.0900.0880.156
wtHZH0.0270.0440.0550.0510.0500.0460.0550.0540.0460.0990.038\0.1360.0800.1210.222
wtLZH0.0640.0270.0590.0210.0170.0210.0210.0230.0150.0670.0240.063\0.1330.1420.205
wtPYH0.0490.0520.0730.0570.0480.0500.0520.0520.0440.1110.0420.0390.064\0.1600.240
wtTH0.0530.0460.0250.0450.0450.0460.0450.0520.0510.1110.0410.0530.0640.073\0.206
wtWSH0.0920.1010.1070.0840.0720.0730.0770.0770.0810.1710.0830.1060.1030.1180.104\
Population abbreviation as in Table 1; all Fst values were significantly different from zero (p < 0.05).
Table 8. Analysis of molecular variance of the 16 populations.
Source of Variationd.fSum of SquaresMean SquarePercentage of VariationF-Statistics
Among Populations15.00739.0649.278.17Fst0.0817
Among Individuals775.004368.065.6412.54Fis0.1365
Within Individuals791.003387.004.2879.29Fit0.2071
Total1581.008494.12 100.00Nm2.8092
d.f: degree of freedom; Fst: F-statistics; Fis: inbreeding coefficient; Fit: the overall inbreeding coefficient; Nm: gene flow.
Publisher’s Note: MDPI stays neutral with regard to jurisdictional claims in published maps and institutional affiliations.

