
Effect of Culture Period and Stocking Density on Input Demand and Scale Economies of Milkfish (Chanos chanos) Polycultures with White Shrimp (Penaeus indicus)

 and
and
Abstract
:1. Introduction
2. Methodology and Data
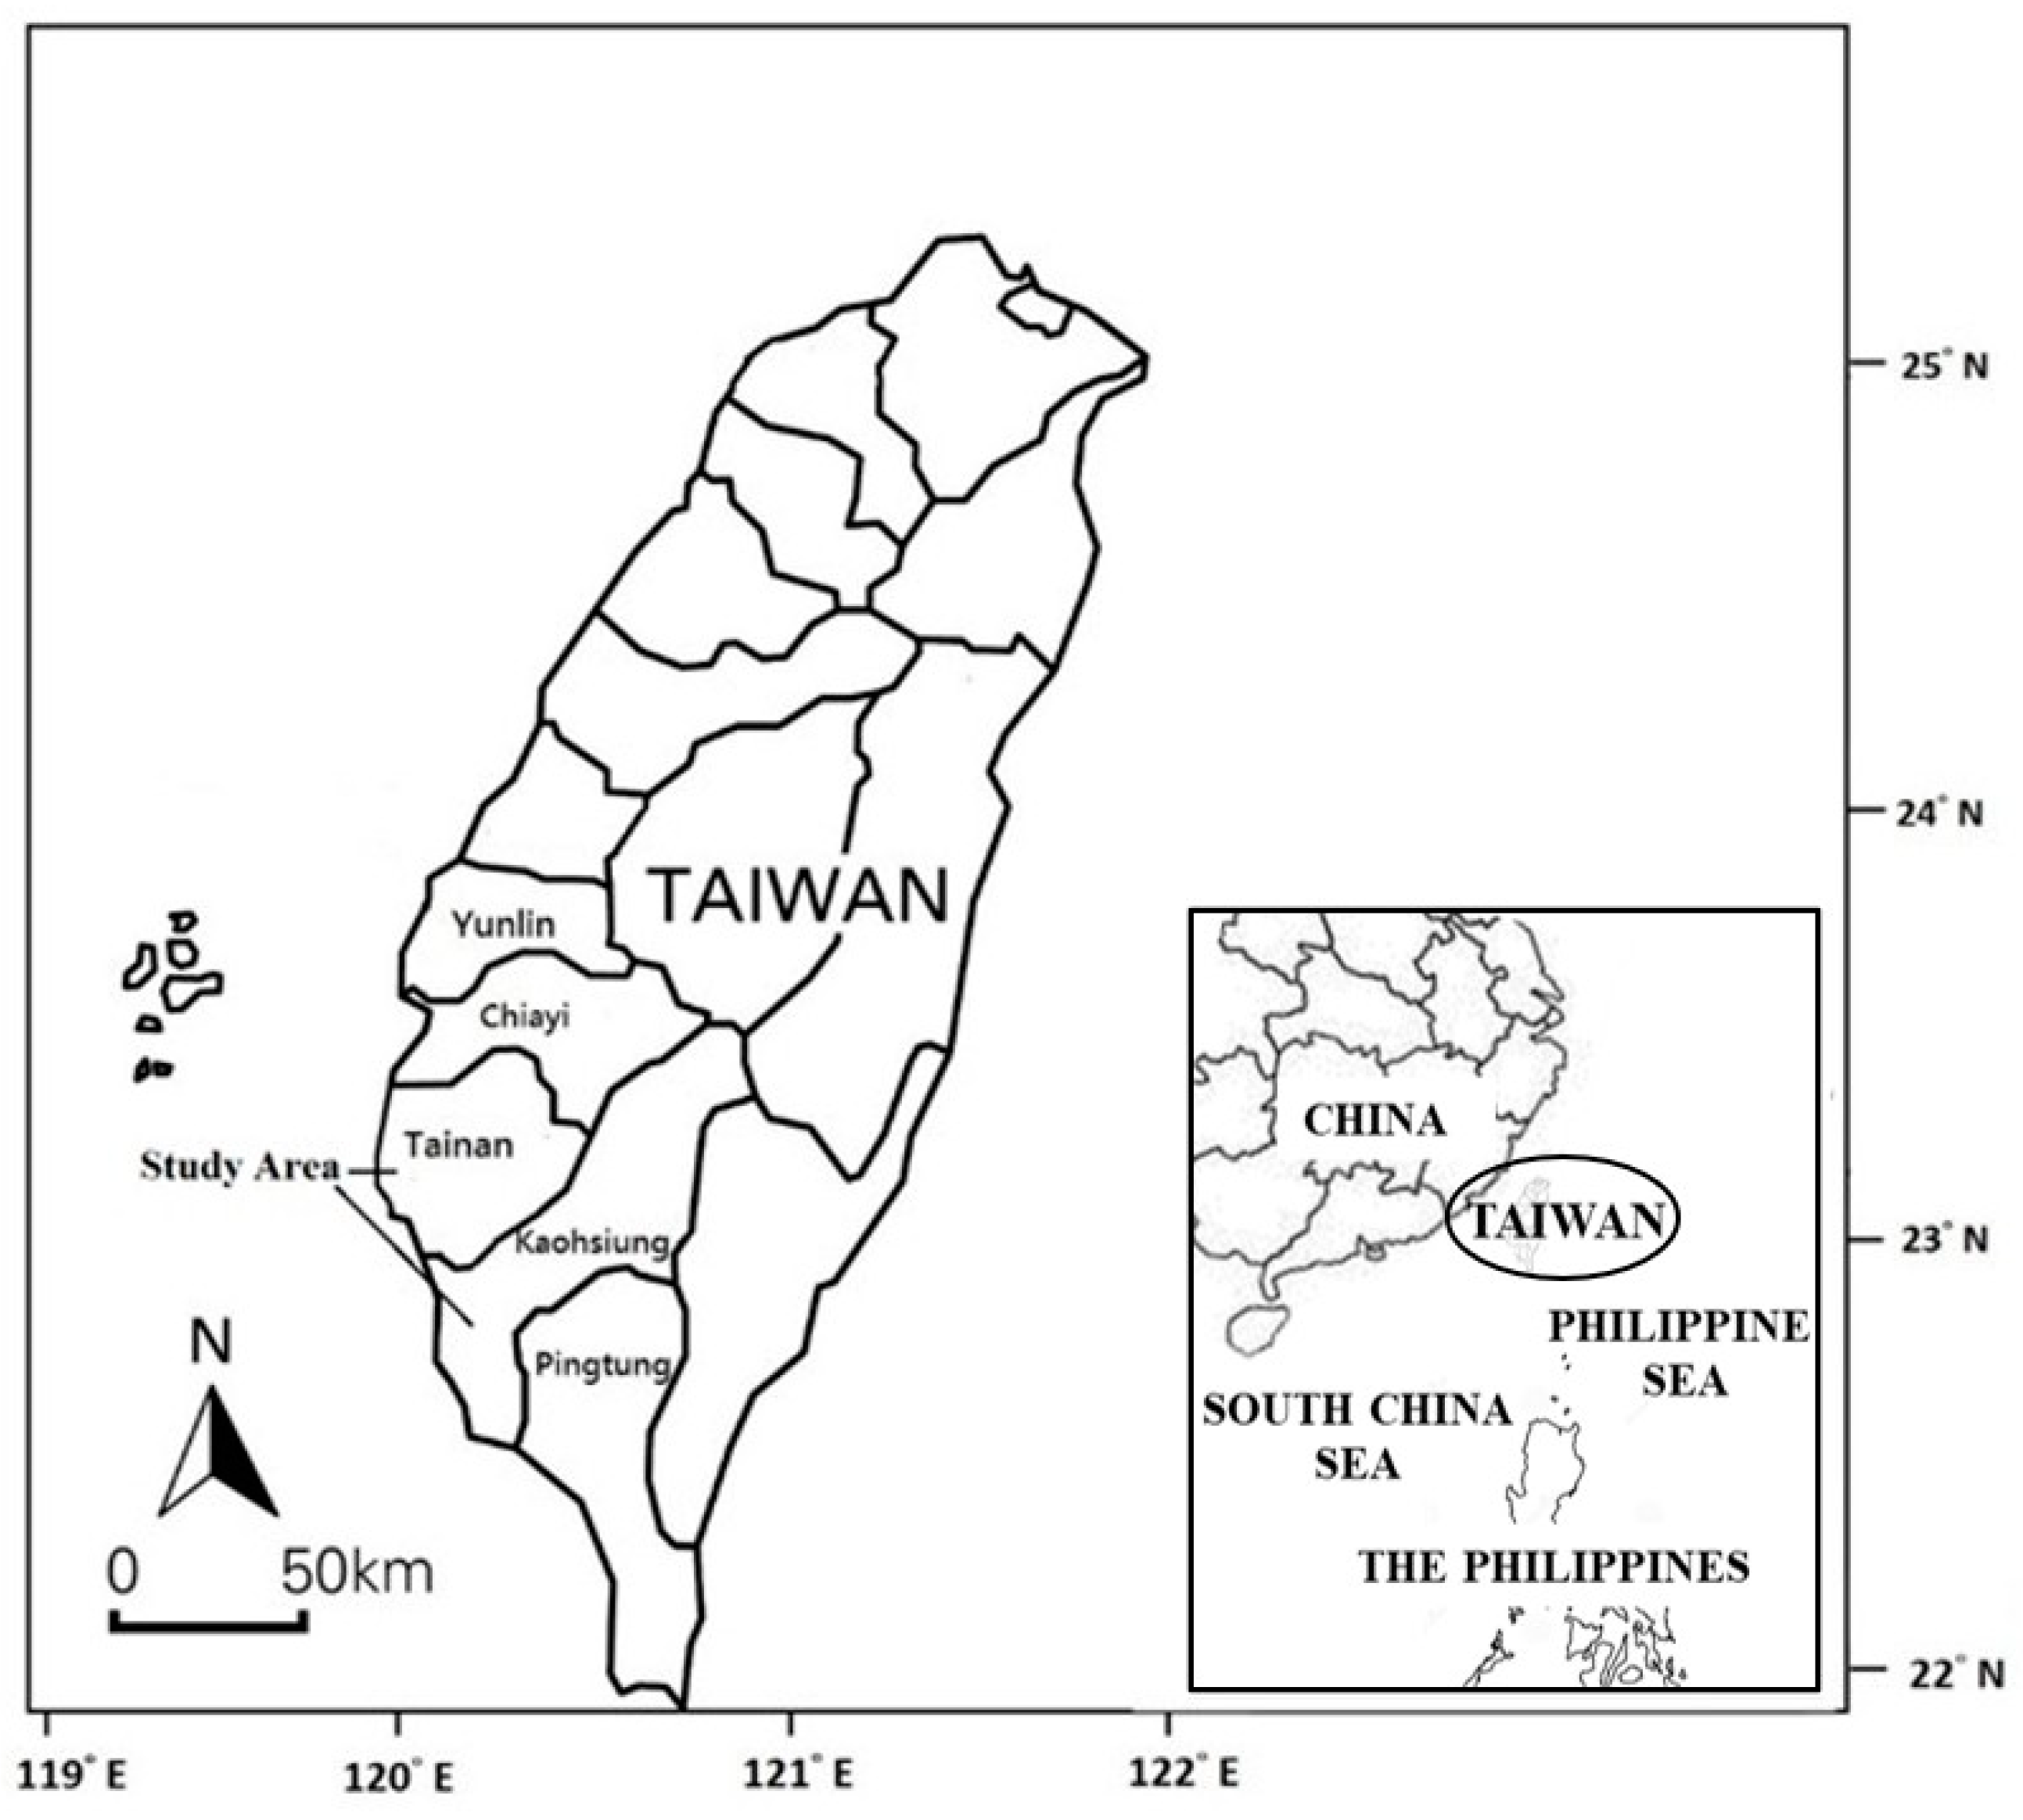
2.1. Study Areas and Culture Mode
2.2. Empirical Model
2.3. Economies of Scale and Input Demand Price Elasticity
2.4. Determinants of Overall Scale Economies
2.5. Data Sources and Variables Definitions
3. Results
3.1. Summary Descriptive Statistics
3.2. Canonical Discrimant Function Analysis
3.3. Parameter Estimation
3.4. Input Demand Price Elasticity Estimation
3.5. Scale Economies Estimation
3.6. Determinants of Scale Economies
4. Discussion
5. Conclusions
Supplementary Materials
Author Contributions
Funding
Institutional Review Board Statement
Data Availability Statement
Acknowledgments
Conflicts of Interest
References
- Lee, Y.C.; Lu, Y.H.; Lee, J.M.; Schafferer, C.; Yeh, C.Y.; Chu, T.W.; Huang, Y.W. A production economic analysis of different stocking density and fry size combinations of milkfish, Chanos chanos, farming in Taiwan. J. World Aquac. Soc. 2022, 53, 424–451. [Google Scholar] [CrossRef]
- Mangampa, M.; Burhanuddin, B. Field experiment of polyculture technology of tiger shrimp (P. monodon Farb.) Milkfish (Chanos chanos Forskal), and Seaweed (Gracilaria verrucosa) in Brackhiswater water pond of Borimasunggu village, Maros regency. Saintek Perikan. Indones. J. Fish. Sci. Technol. 2014, 10, 30–36. [Google Scholar] [CrossRef]
- Helminuddin, P.E.; Abdusysyahid, S. A Marketing and Financial Analysis of Milkfish (Chanos chanos) and Giant Tiger Prawn (Penaeus monodon) Farming in East Kalimantan. Int. J. Innov. Creat. Chang. 2020, 11, 581–591. Available online: https://www.ijicc.net/images/vol11iss4/11446_Helminuddin_2020_E_R.pdf (accessed on 3 October 2021).
- Eldani, A.; Primavera, J. Effect of different stocking combinations on growth, production and survival of milkfish (Chanos chanos Forsskål) and prawn (Penaeus monodon Fabricius) in polyculture in brackishwater ponds. Aquaculture 1981, 23, 59–72. [Google Scholar] [CrossRef]
- Jaspe, C.; Caipang, C.M.; Elle, B.J. Polyculture of white shrimp, Litopenaeus vannamei and milkfish, Chanos chanos as a strategy for efficient utilization of natural food production in ponds. Anim. Biol. Anim. Husb. 2011, 3, 96–104. Available online: https://agris.fao.org/agris-search/search.do?recordID=DJ2012069683 (accessed on 2 November 2021).
- Hoang, M.N.; Nguyen, P.N.; Maria Vital Estrocio Martins Bossier, A.; Bossier, P. The effects of two fish species mullet, Mugil cephalus, and tilapia, Oreochromis niloticus, in polyculture with white shrimp, Litopenaeus vannamei, on system performances: A comparative study. Aquac. Res. 2020, 51, 2603–2612. [Google Scholar] [CrossRef]
- Jamerlan, G.S.; Coloso, R.M.; Golez, N.V. Intensive Culture of Milkfish Chanos chanos in Polyculture with White Shrimp Penaeus indicus or Mud Crab Scylla Serrata in Brackishwater Earthern Ponds; Southeast Asian Fisheries Development Center, Aquaculture Department: Iloilo, Philippines, 2014; Available online: https://repository.seafdec.org.ph/handle/10862/3047 (accessed on 3 August 2021).
- Lalramchhani, C.; Balasubramanian, C.P.; Panigrahi, A.; Ghoshal, T.K.; Das, S.; Shyne Anand, P.S.; Vijayan, K.K. Polyculture of Indian White Shrimp (Penaeus indicus) with Milkfish (Chanos chanos) and its Effect on Growth Performances, Water Quality and Microbial Load in Brackishwater Pond. J. Coast. Res. 2019, 86, 43–48. [Google Scholar] [CrossRef]
- Bessa Junior, A.P.; Azevedo, C.M.S.B.; Pontes, F.S.T.; Henry-Silva, G.G. Polyculture of Nile tilapia and shrimp at different stocking densities. Rev. Bras. Zootec. 2012, 41, 1561–1569. [Google Scholar] [CrossRef] [Green Version]
- Tjoronge, M. Polikultur Rumput Laut Gracillaria sp. Dan Ikan Bandeng (Chanos chanos) Dengan Padat Penebaran Yang Berbeda. J. Penelit. Perikan. Indones. 2005, 11, 79–85. [Google Scholar] [CrossRef]
- Kholifah, U.; Trisyani, N.; Yuniar, I. Pengaruh padat tebar yang berbeda terhadap kelangsungan hidup dan pertumbuhan pada polikultur udang windu (Penaeus monodon Fab) dan ikan bandeng (Chanos chanos) pada Hapa di tambak Brebes–Jawa Tengah. Neptunus 2008, 14, 152–158. Available online: https://dspace.hangtuah.ac.id/xmlui/bitstream/handle/dx/675/neptunus%2014-2.pdf?sequence=1&isAllowed=y (accessed on 2 August 2021).
- Chiang, F.S.; Sun, C.H.; Yu, J.M. Technical efficiency analysis of milkfish (Chanos chanos) production in Taiwan—An application of the stochastic frontier production function. Aquaculture 2004, 230, 99–116. [Google Scholar] [CrossRef]
- Susilo, H. Analisis Ekonomi Usaha Budidaya Tambak dan Faktor-faktor yang Mempengaruhi Produksi. J. EPP 2007, 4, 19–23. Available online: http://agb.faperta.unmul.ac.id/wp-content/uploads/2017/04/jurnal-vol-4-no-2-heru-.pdf (accessed on 1 July 2021).
- Lelono, E.J.; Susilowati, I. Strengthening the performance of the pond in the achievement of food security. J. Ekon. Pembang. 2010, 11, 202–216. [Google Scholar]
- Sudarmo, H.; Fyka, S.A. Production and Efficiency of Pond Fish Farming Business Milkfish. Habitat 2017, 28, 14–21. [Google Scholar] [CrossRef]
- Roy, A.K.; Jens, N. Econometric approach for estimation of technical efficiency of aquaculture farms. In Applied Bioinformatics, Statistics and Economics in Fisheries Research; Roy, A.K., Serangi, N., Eds.; New India Publishing Agency: New Delhi, India, 2008; pp. 501–518. [Google Scholar]
- Alam, F. Measuring technical, allocative and cost efficiency of pangas (Pangasius hypophthalmus: Sauvage 1878) fish farmers of Bangladesh. Aquac. Res. 2011, 42, 1487–1500. [Google Scholar] [CrossRef]
- Mohan, D.M.; Javien, P.F.; Srichantuk, N.; Xinhua, Y.; Bhatta, R.; Thi Chau Dung, L. Technical efficiency of freshwater pond polyculture productionin selected Asian countries: Estimation and implication. Aquac. Econ. Manag. 2005, 9, 39–63. [Google Scholar] [CrossRef]
- Fisheries Agency. Fisheries Statistical Yearbook–Taiwan, Kinmen and Matsu Area, 2016; Fisheries Agency, Council of Agriculture: Taipei, Taiwan, 2020.
- Christensen, L.R.; Jorgenson, D.W.; Lau, L.J. Conjugate duality and the transcendental logarithmic production function. Econometrica 1971, 39, 255–256. [Google Scholar]
- McKay, L.; Lawrence, D.; Vlastuin, C. Profit, output supply, and input demand functions for multiproduct firms: The case of Australian agriculture. Int. Econ. Rev. 1983, 24, 323–339. [Google Scholar] [CrossRef]
- Ray, S.C. A translog cost function analysis of US agriculture, 1939–1977. Am. J. Agric. Econ. 1982, 64, 490–498. [Google Scholar] [CrossRef]
- Sidhu, S.S.; Baanante, C.A. Farm-level fertilizer demand for Mexican wheat varieties in the Indian Punjab. Am. J. Agric. Econ. 1979, 61, 455–462. [Google Scholar] [CrossRef]
- Sil, J.; Buccola, S. Efficiency of the multiplant, multiproduct firm. Am. J. Agric. Econ. 1995, 77, 1001–1011. [Google Scholar] [CrossRef]
- Zellner, A. An efficient method of estimating seemingly unrelated regressions and tests for aggregation bias. J. Am. Stat. Assoc. 1962, 57, 348–368. [Google Scholar] [CrossRef]
- Caves, D.W.; Christensen, L.R.; Swanson, J.A. Productivity growth, scale economics and capacity utilization in U.S. railroads, 1955–1974. Am. Econ. Rev. 1981, 71, 994–1002. Available online: https://www.jstor.org/stable/1803480 (accessed on 4 August 2021).
- Chang, C.C.; Huang, J.F.; Schafferer, C.; Lee, J.M.; Ho, L.M. Impacts of culture survival rate on culture cost and input factors: Case study of the hard clam (Meretrix meretrix) culture in Yunlin County, Taiwan. J. World Aquacult. Soc. 2020, 51, 139–158. [Google Scholar] [CrossRef]


| Variable | Symbol | Description |
|---|---|---|
| Cost variables | ||
| Total production cost (NTD/ha) | C | Total cost of milkfish polyculture white shrimp produced |
| Cost share of inputs | SL, SS, SK, SF, SO | Represents cost share of input labor (SL), fry (SS), capital (SK), feed (SF), and other miscellaneous production inputs (SO) |
| Output variables | ||
| Output of milkfish (kg/ha) | Ym | Total quantity of milkfish produced |
| Output of white shrimp(kg/ha) | Ys | Total quantity of white shrimp produced |
| Input price variables | ||
| Fry price (NTD/fry) | PS | The weighted average of milkfish and white shrimp fry buying price according to the ratio of purchase outlay |
| Capital price (NTD/ha) | PK | The equipment depreciation expense divided by the culture area |
| Feed price (NTD/kg) | PF | The total cost outlay for feed and fertilizer divided by the weight of feed and fertilizer |
| Labor price (NTD/ha) | PL | The total cost of family workers, workers, and casual laborers divided by the culture area |
| Other factor price (NTD/ha) | Po | The sum of water and electricity expenses, fishpond and equipment maintenance costs, loan cost, and drug and insurance expenses divided by the culture area |
| Farm- and farmer characteristics affecting scale economics | ||
| Overall scale economies | OSE | Estimates based on the estimated coefficients from the Translog cost model |
| Culture area (hectare) | Area | Represents the culture area of the farm |
| Culture time (months) | Time | Represents the culture period of the farm per production cycle |
| Water depth (meter) | Depth | Represents the pond’s water depth |
| Water source (dummy) | Fresh | Status of the fish farmer water use. ‘1′ indicates the use of fresh water, otherwise ‘0′ |
| Milkfish fry stocking density (fry/ha) | Densitym | Milkfish fry stocked per production cycle |
| White shrimp fry stocking density (fry/ha) | Densitys | White shrimp fry stocked per production cycle |
| Milkfish fry stocking size (inches/fry) | Size | Milkfish fry stocked per production cycle |
| Age of the farmer (years) | Age | Represents the age of fish farmer |
| Experience of the farmer (years) | Exp | Represents the number of years the farmer spent in fish farming |
| Gender of the farmer (dummy) | Male | ‘1′ indicates male, otherwise ‘0′ |
| Education of the farmer (dummy) | Edu | ‘1′ college or above, otherwise ‘0′ |
| White shrimp–milkfish fry stocking density ratio | Ratio | White shrimp fry stocking density divided by milkfish fry stocking density |
| Culture Mode | Overwinter (OWC) | Non-Overwinter (NOWC) | F Value a | ||||
|---|---|---|---|---|---|---|---|
| High White Shrimp–Milkfish Fry Stocking Density Ratio (SMR) | Low | High | Total | Low | High | Total | |
| No. of samples | 72 | 48 | 120 | 50 | 70 | 120 | |
| Cost variables | |||||||
| Total cost (NTD/ha) | 1,129,114 ± 630,266 | 920,667 ± 406,069 | 1,016,832 ± 558,433 | 528,773 ± 107,597 | 567,967 ± 143,316 | 551,636 ± 130,557 | 6.64 ** |
| Fry cost share (%) | 7.72 ± 3.07 | 10.05 ± 6.01 | 8.78 ± 4.65 | 9.05 ± 4.27 | 12.06 ± 6.00 | 10.86 ± 5.62 | 0.78 |
| Feed cost share (%) | 52.53 ± 15.41 | 46.36 ± 6.36 | 51.79 ± 12.53 | 31.25 ± 8.02 | 35.60 ± 10.97 | 33.86 ± 10.09 | 6.17 ** |
| Other cost share (%) | 15.65 ± 7.68 | 17.42 ± 3.81 | 16.73% ± 6.35 | 30.66 ± 9.75 | 24.97 ± 10.48 | 27.24 ± 10.59 | 8.06 ** |
| Labor cost share (%) | 21.63 ± 10.89 | 22.85 ± 8.68 | 22.69 ± 10.01 | 24.30 ± 7.67 | 21.89 ± 8.14 | 22.85 ± 8.04 | 0.69 |
| Capital cost share (%) | 2.47 ± 1.21 | 3.31 ± 1.10 | 2.84 ± 1.22 | 4.74 ± 1.52 | 5.48 ± 1.65 | 5.19 ± 1.62 | 0.12 |
| Output variables | |||||||
| Output of milkfish (kg/ha) | 17,310 ± 12,556 | 11,376 ± 3640 | 14,936 ± 10,351 | 5396 ± 1586 | 6031 ± 1525 | 5767 ± 1576 | 12.69 ** |
| Output of white shrimp(kg/ha) | 924 ± 677 | 1268 ± 654 | 1062 ± 697 | 1085 ± 831 | 1271 ± 1349 | 1194 ± 1161 | 0.91 |
| Input price variables | |||||||
| Fry price (NTD/fry) | 2.40 ± 0.73 | 2.21 ± 0.90 | 2.32 ± 0.80 | 4.43 ± 2.50 | 3.34 ± 2.55 | 3.79 ± 2.57 | 4.8 ** |
| Feed price (NTD/kg) | 15.18 ± 14.15 | 14.43 ± 12.60 | 14.88 ± 13.48 | 14.81 ± 113.18 | 14.59 ± 12.16 | 14.68 ± 12.46 | 1.54 |
| Other price (NTD/ha) | 95,666 ± 74,790 | 120,740 ± 12,2759 | 105,696 ± 97,353 | 96,220 ± 51,949 | 93,175 ± 83,565 | 94,444 ± 71,851 | 0.01 |
| Labor price (NTD/ha) | 105,370 ± 279,330 | 141,583 ± 361,550 | 119,855 ± 314,162 | 84,525 ± 63,615 | 93,913 ± 11,4975 | 90,001 ± 96,710 | 2.82 * |
| Capital prices (NTD/ha) | 17,626 ± 19,814 | 24,868 ± 26,063 | 20,523 ± 22,709 | 14,873 ± 7731 | 21,294 ± 20,856 | 18,618 ± 16,938 | 1.09 |
| Farm and farmer characteristics | |||||||
| Culture area (ha) | 3.01 ± 1.43 | 2.18 ± 1.57 | 2.68 ± 1.50 | 2.10 ± 1.33 | 3.11 ± 4.59 | 2.69 ± 3.63 | 4.34 ** |
| Culture period (month) | 11.95 ± 1.86 | 10.22 ± 1.40 | 11.26 ± 1.90 | 8.04 ± 1.16 | 7.68 ± 1.61 | 7.83 ± 1.45 | 12.47 ** |
| Water depth (cm) | 4.31 ± 0.73 | 3.39 ± 0.77 | 3.94 ± 0.89 | 3.83 ± 0.67 | 3.52 ± 1.01 | 3.65 ± 0.89 | 9.56 ** |
| Water source (fresh water) (%) | 61.11 | 87.5 | 71.66 | 94.00 | 91.43 | 92.5 | |
| Milkfish fry stocking density (fry/ha) | 27,455 ± 18,202 | 17,413 ± 8160 | 23,304 ± 15,546 | 7406 ± 1752 | 8304 ± 1760 | 7406 ± 1751 | 16.3 ** |
| White shrimp fry stocking density (fry/ha) | 665,484 ± 563,041 | 1,189,715 ± 479,869 | 882,407 ± 588,260 | 244,282 ± 116,174 | 632,193 ± 210,358 | 432,239 ± 257,034 | 0.4 |
| Survival rate of milkfish | 84.8% ± 5.3% | 87.1% ± 4.5% | 85.5% ± 5.07% | 92.5% ± 5.9% | 90.6% ± 6.0% | 91.4% ± 5.93% | 6.94 ** |
| Survival rate of white shrimp | 9.5% ± 0.5% | 7.1% ± 0.5% | 8.2% ± 0.5% | 18.8%V0.9% | 9.9% ± 0.6% | 13.3% ± 0.7% | 5.51 ** |
| Milkfish fry stocking size (inches/fry) | 2.99 ± 1.33 | 3.42 ± 1.08 | 3.16 ± 1.25 | 3.34 ± 1.22 | 3.21 ± 1.58 | 3.26 ± 1.44 | 3.62 * |
| Age of household head (years) | 60.97 ± 11.59 | 62.62 ± 10.75 | 61.63 ± 11.25 | 59.32 ± 14.20 | 56.81 ± 14.25 | 57.85 ± 14.23 | 1.66 |
| Experience of household head (years) | 26.27 ± 10.32 | 20.62 ± 7.95 | 24.01 ± 9.81 | 28.14 ± 7.63 | 29.71 ± 9.78 | 29.05 ± 8.95 | 9.14 ** |
| Gender of the farmer (male %) | 95.83% | 91.67% | 94.16% | 92.00% | 85.71% | 88.33% | |
| Education of the college and above (%) | 13.89% | 12.50% | 13.33% | 16.00% | 30.00% | 24.16% | |
| White shrimp–milkfish fry stocking density ratio | 24 ± 14 | 71 ± 11 | 43 ± 26 | 33 ± 14 | 75 ± 16 | 53 ± 25 | 10.01 ** |
| Overwinter (OWC) | ||||||||||
| Low White Shrimp–Milkfish Ratio | High White Shrimp–Milkfish Ratio | |||||||||
| Price for | Price for | |||||||||
| Demand for | Labor | Fry | Capital | Feed | Others | Labor | Fry | Capital | Feed | Others |
| Labor | −0.076 (0.046) | 0.343 (0.405) | −0.245 (0.677) | 0.132 (0.082) | 0.603 (0.127) ** | −0.535 (0.212) ** | 1.789 (1.035) | 1.542 (1.049) | 0.664 (0.234) ** | 0.573 (0.206) ** |
| Fry | −0.465 (0.131) ** | 0.577 (0.960) | 0.277 (0.233) | 1.121 (0.168) ** | −0.935 (0.195) ** | 0.045 (1.844) | 1.214 (0.336) ** | 0.625 (0.202) | ||
| Capital | −0.087 (0.190) | 0.113 (0.152) | 0.717 (0.195) ** | 0.279 (0.375) | −1.275 (0.705) | 0.550 (0.715) | ||||
| Feed | −0.121 (0.027) ** | 0.717 (0.025) ** | −0.363 (0.071) ** (0.517) ** | 0.889 (0.113) ** | ||||||
| Other miscellaneous | −0.284 (0.037) ** | −0.357 (0.068) ** | ||||||||
| Non-overwinter (NOWC) | ||||||||||
| Low White Shrimp–Milkfish Ratio | High White Shrimp–Milkfish Ratio | |||||||||
| Price for | Price for | |||||||||
| Demand for | Labor | Fry | Capital | Feed | Others | Labor | Fry | Capital | Feed | Others |
| Labor | −0.026 (0.030) | −0.539 (0.354) | 0.039 (0.605) | 0.401 (0.215) | −0.078 (0.163) | −0.036 (0.039) | 0.277 (0.206) | −1.034 (0.411) ** | 0.551 (0.173) ** | 0.107 (0.105) |
| Fry | −0.125 (0.242) | 0.857 (2.902) | 0.215 (1.417) | 0.520 (0.560) | −0.550 (0.079) ** | 1.338 (0.623) ** | 1.027 (0.234) ** | 0.349 (0.203) | ||
| Capital | −0.337 (0.188) | 0.299 (2.014) | 0.582 (1.164) | −0.022 (0.122) | 0.893 (0.544) | 0.043 (0.245) | ||||
| Feed | −0.409 (0.157) ** | 0.622 (0.523) | −0.527 (0.100) ** | 1.016 (0.243) ** | ||||||
| Other miscellaneous | −0.206 (0.090) ** | −0.243 (0.029) ** | ||||||||
| Culture Mode | Overwinter (OWC) | Non-Overwinter (NOWC) | ||
| White Shrimp–Milkfish Fry Stocking Density Ratio (SMR) | Low | High | Low | High |
| Range of Overall Scale Economies (OSE) | % of Farmers in OSE Interval | % of Farmers in OSE Interval | % of Farmers in OSE Interval | % of Farmers in OSE Interval |
| <0.7 | 2 | 17.4 | ||
| 0.7–0.8 | 8.3 | 3.9 | 63.8 | |
| 0.8–0.9 | 11.4 | 10.4 | 7.8 | 15.9 |
| 0.9–1.0 | 38.0 | 27.1 | 37.3 | 0 |
| 1.0–1.1 | 32.9 | 22.9 | 45.1 | 1.4 |
| 1.1–1.2 | 12.7 | 14.6 | 3.9 | 1.5 |
| 1.2–1.3 | 5.0 | 8.3 | ||
| >1.3 | 8.4 | |||
| Total | 100 | 100 | 100 | 100 |
| Mean overall scale economies | 1.022 | 1.033 | 0.982 | 0.756 |
| Standard deviation | 0.130 | 0.241 | 0.088 | 0.091 |
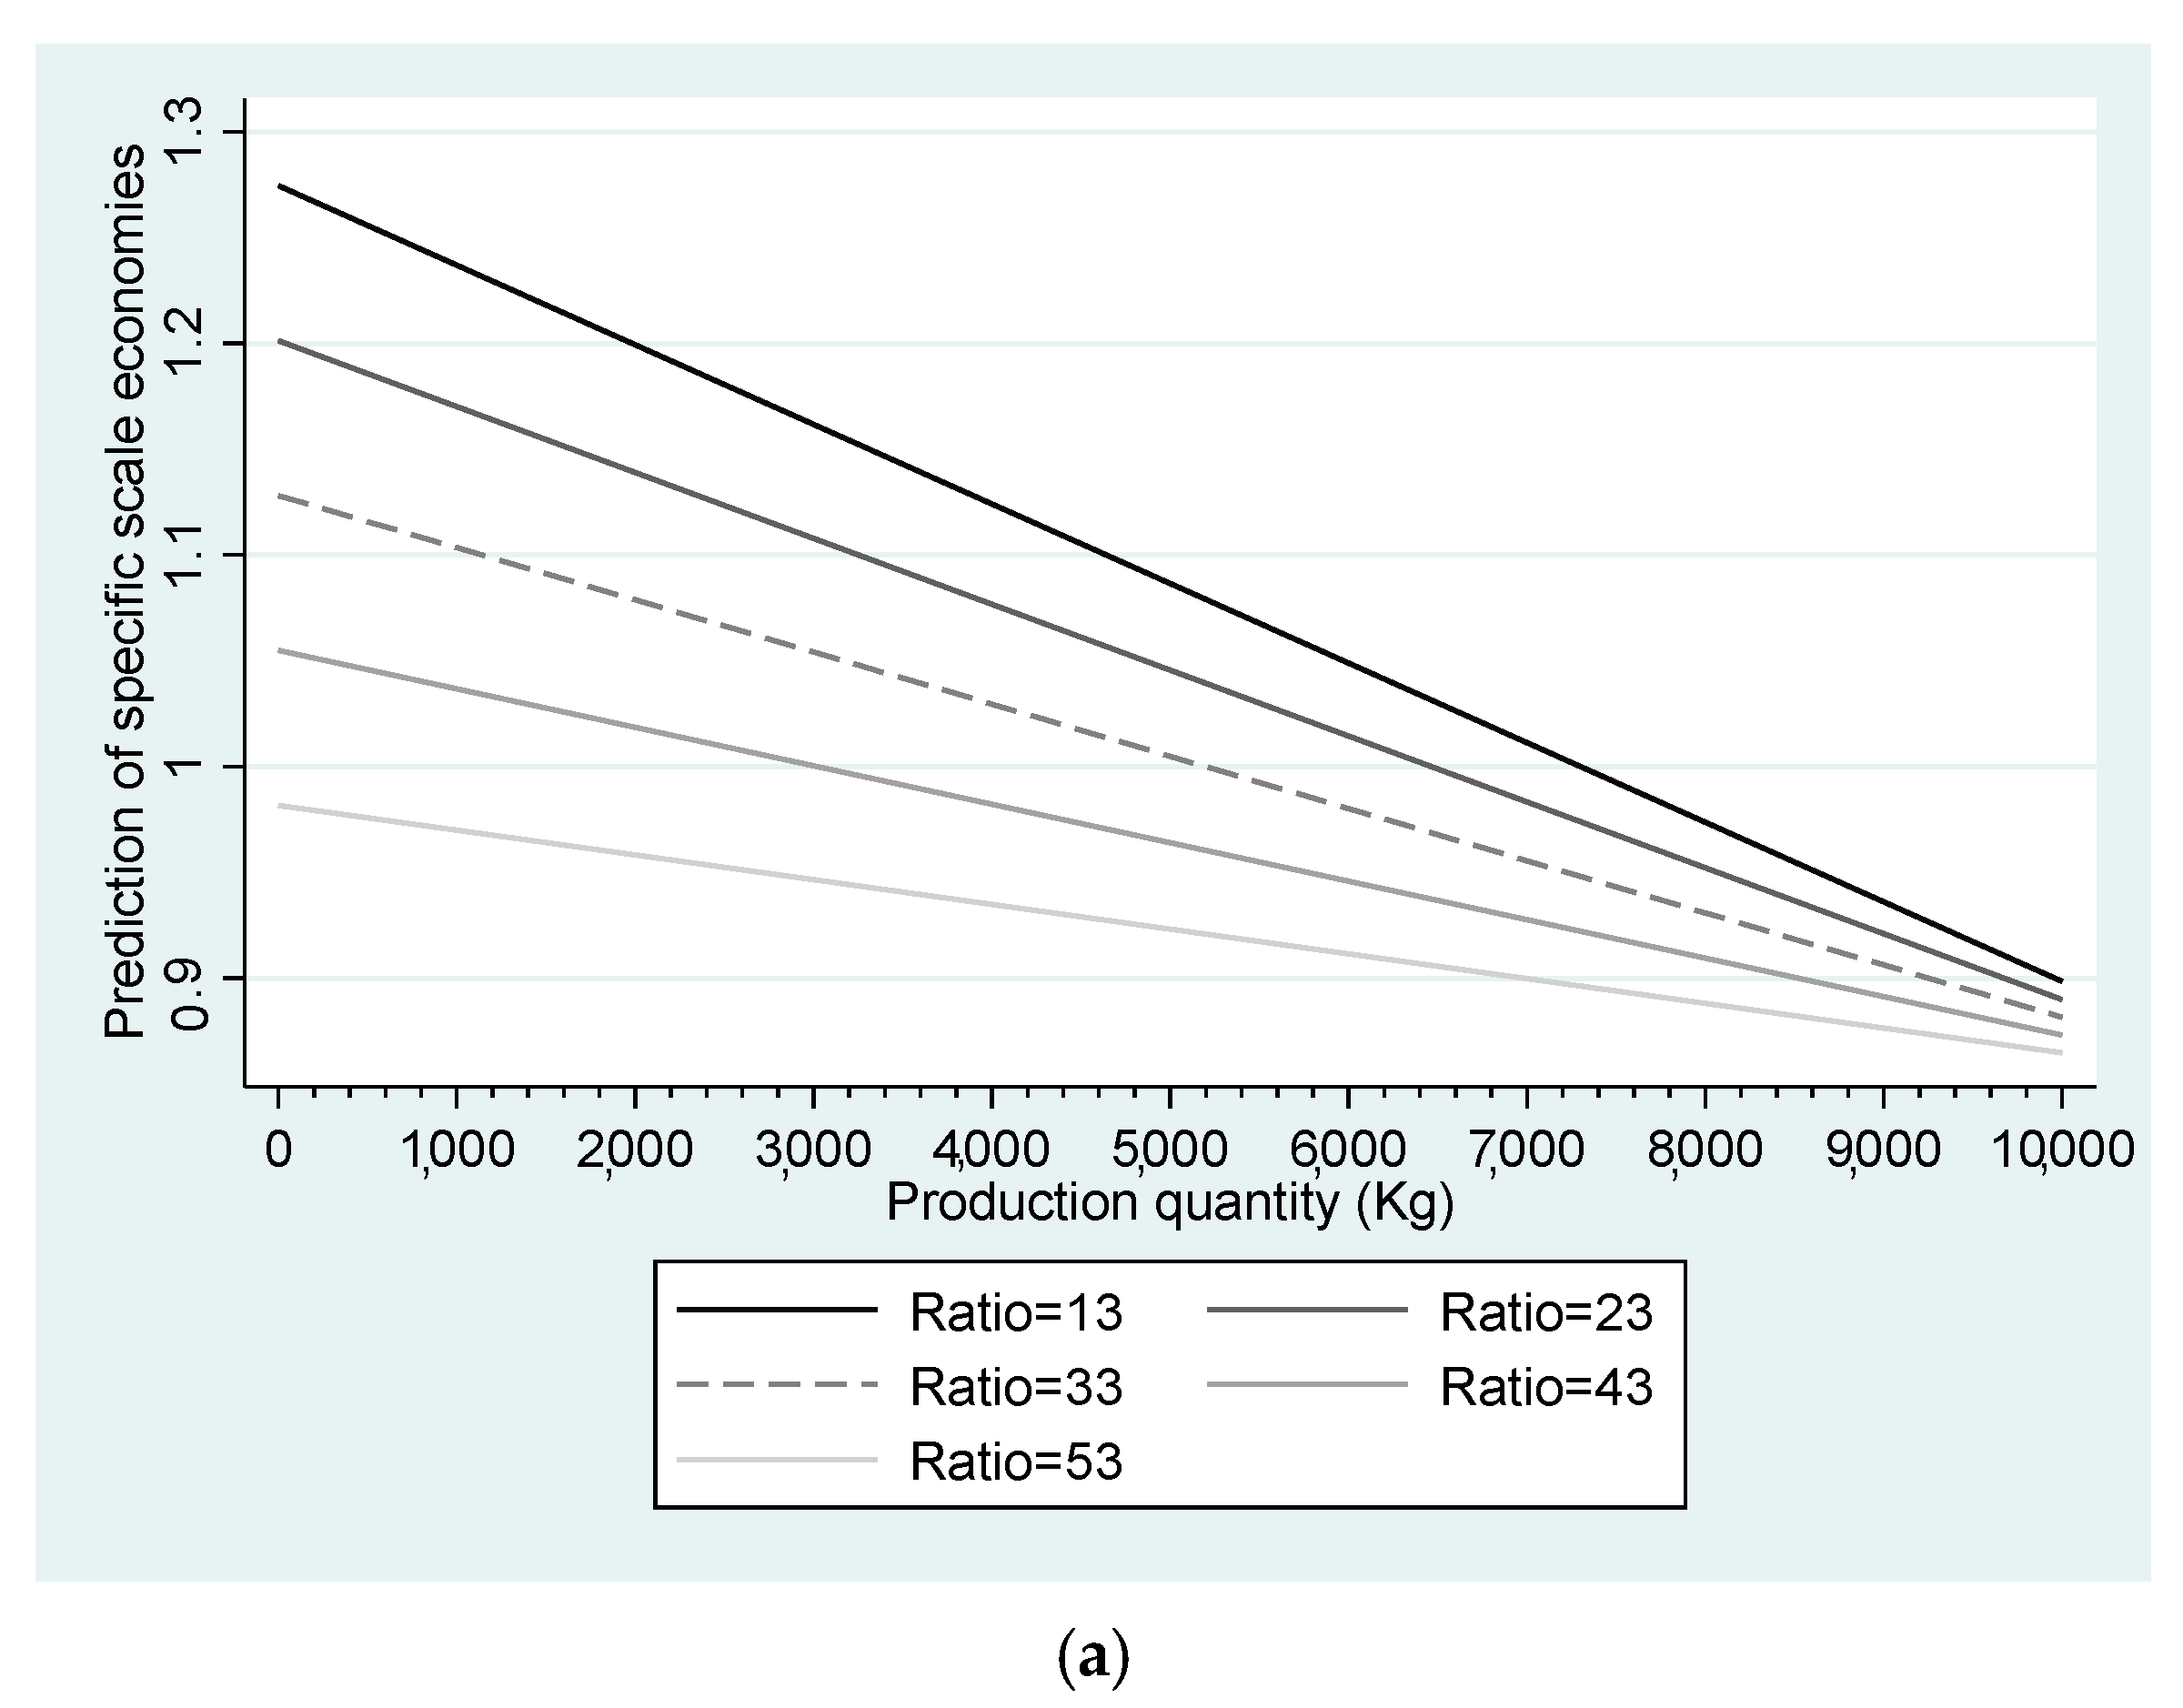
| Culture mode | White Shrimp–Milkfish Fry Stocking Density Ratio | Milkfish | Specific Scale Economies of Different Milkfish Stocking Density (Fry/ha) | Overall Scale Economies (OSE) | ||
| Specific Scale Economies (PSE) | <15,000 | 15,000–20,000 | >20,000 | |||
| Overwinter (OWC) | Low white shrimp–milkfish ratio | 1.023 (0.042) ** | 1.001 | 1.018 | 0.987 | 1.022 (0.043) ** |
| High white shrimp–milkfish ratio | 1.005 (0.110) ** | 1.060 | 1.036 | 0.947 | 1.033 (0.125) ** | |
| Total | 1.005 (0.046) ** | 1.104 | 1.041 | 0.984 | 1.033 (0.055) ** | |
| F value | 2.65 *,b | |||||
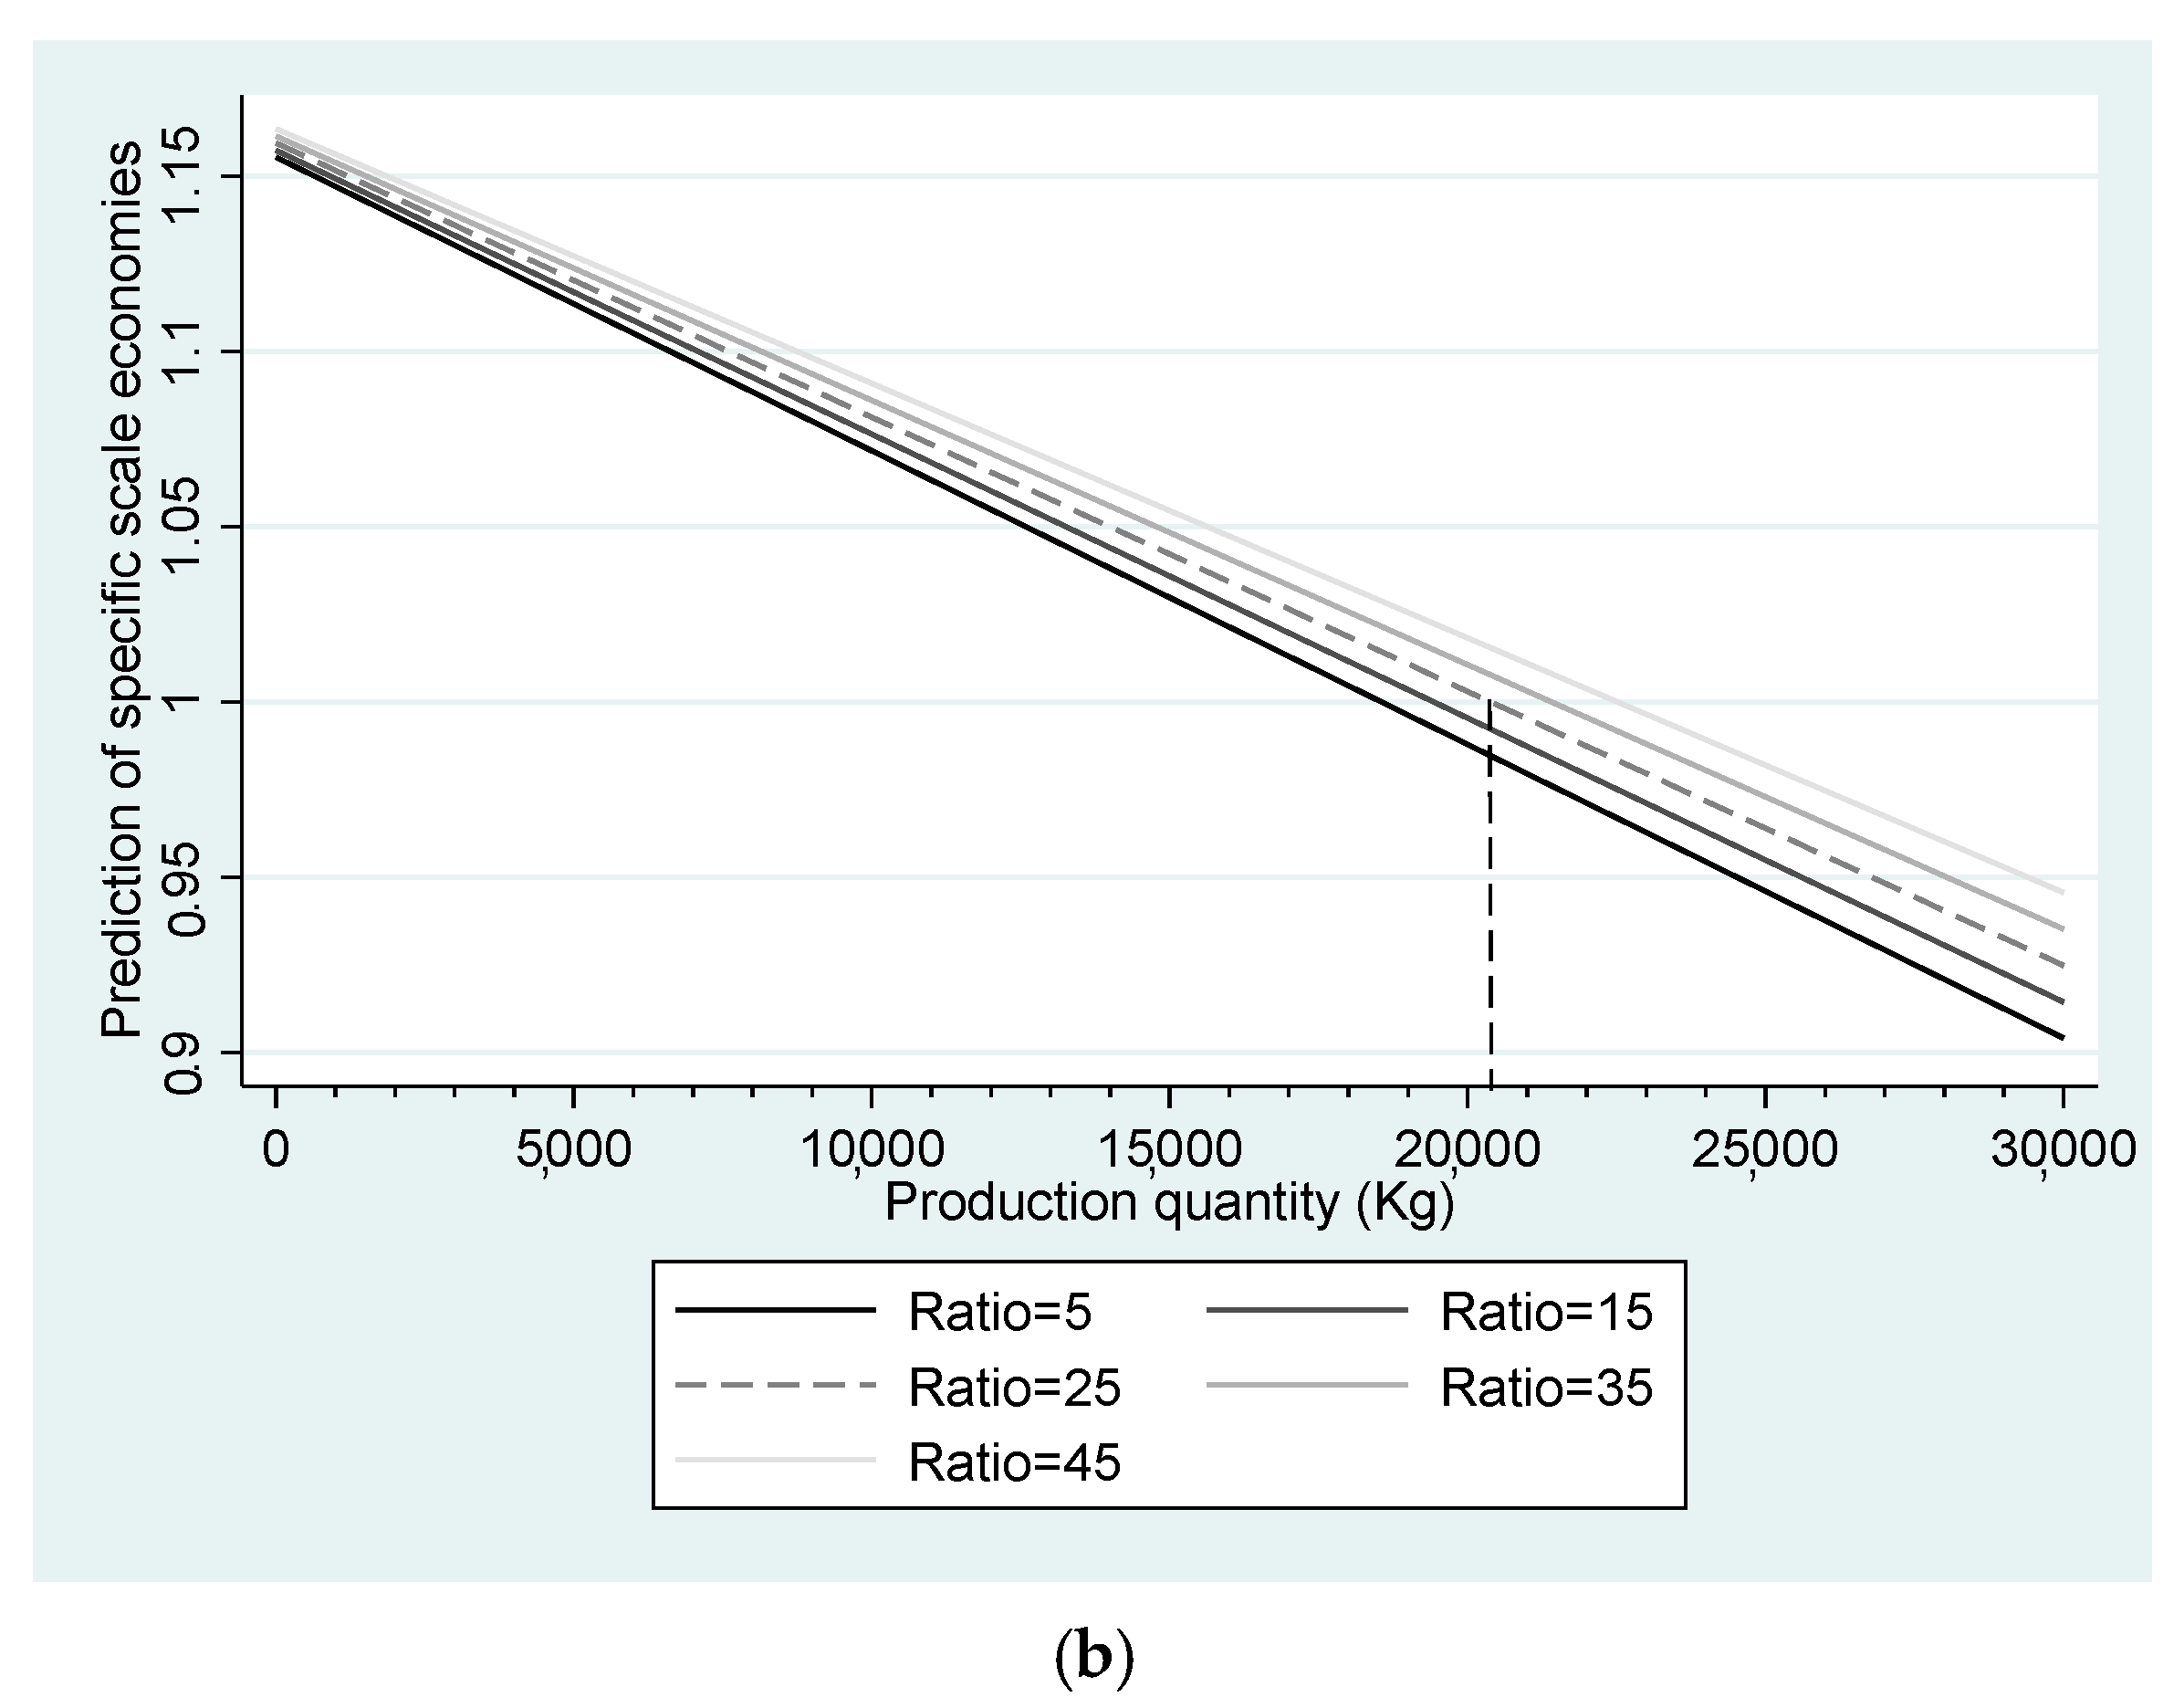
| Culture mode | White shrimp–Milkfish Fry Stocking Density Ratio | Milkfish | Specific Scale Economies of Different Milkfish Stocking Density (Fry/ha) | Overall Scale Economies (OSE) | ||
| Specific Scale Economies (PSE) | <7000 | 7000–9000 | >9000 | |||
| Non-overwinter (NOWC) | Low white shrimp–milkfish ratio | 0.996 (0.072) ** | 1.005 | 1.007 | 0.943 | 0.982 (0.068) ** |
| High white shrimp–milkfish ratio | 0.765 (0.079) ** | 0.785 | 0.727 | 0.796 | 0.756 (0.079) ** | |
| Total | 0.818 (0.061) ** | 0.825 | 0.795 | 0.841 | 0.829 (0.061) ** | |
| F value | 76.92 **,a | 5.47 **,c | 87.68 **,a | |||
| Low White Shrimp–Milkfish Ratio | ||||
| Variables | Coefficients | Standard Error | t | p > |t| |
| Yi | −0.000008 | 0.000002 | −3.68 | 0.000 |
| Ratio | 0.000203 | 0.001423 | 0.14 | 0.887 |
| Yi × Ratio | 0.00000003 | 0.00000008 | 0.33 | 0.741 |
| Constant | 1.1544 | 0.0416 | 27.69 | 0.000 |
| High white shrimp–milkfish ratio | ||||
| Variables | Coefficients | Standard Error | t | p > |t| |
| Yi | −0.000021 | 0.000115 | −0.02 | 0.986 |
| Ratio | −0.000787 | 0.021047 | −0.04 | 0.970 |
| Yi × Ratio | 0.0000001 | 0.000002 | 0.05 | 0.958 |
| Constant | 1.0029 | 1.2775 | 0.79 | 0.437 |
| Low white shrimp–milkfish ratio | ||||
| Variables | Coefficients | Standard Error | t | p > |t| |
| Yi | −0.000046 | 0.000014 | −3.10 | 0.003 |
| Ratio | −0.007320 | 0.002205 | −3.32 | 0.002 |
| Yi × Ratio | 0.00000064 | 0.00000038 | 1.69 | 0.098 |
| Constant | 1.3697 | 0.0838 | 16.33 | 0.000 |
| High white shrimp–milkfish ratio | ||||
| Variables | Coefficients | Standard Error | t | p > |t| |
| Yi | 0.000013 | 0.000018 | 0.73 | 0.465 |
| Ratio | 0.000372 | 0.000944 | 0.39 | 0.695 |
| Yi × Ratio | 0.00000005 | 0.0000002 | −0.35 | 0.728 |
| Constant | 0.6798 | 0.1073 | 6.33 | 0.000 |
| Parameter | Low White Shrimp–Milkfish Ratio | High White Shrimp–Milkfish Ratio | ||
|---|---|---|---|---|
| Coefficient | S.E. | Coefficient | S.E. | |
| Constant | 1.07201 ** | 0.10418 | 0.74905 ** | 0.06019 |
| Area | 0.00018 | 0.00554 | −0.01080 ** | 0.00182 |
| Time | −0.00924 | 0.00734 | −0.00116 | 0.00398 |
| Depth | −0.00802 | 0.01679 | 0.01844 ** | 0.00799 |
| Fresh | 0.10045 ** | 0.03728 | 0.03557 | 0.02550 |
| Densitym | −0.0000029 ** | 0.0000016 | −0.0000043 ** | 0.0000018 |
| Densitys | −0.00000002 | 0.00000004 | 0.00000001 | 0.00000002 |
| Size | −0.01951 ** | 0.00947 | −0.01171 ** | 0.00428 |
| Age | −0.00266 ** | 0.00097 | 0.00147 ** | 0.00058 |
| Exp | 0.00122 | 0.00144 | 0.00034 | 0.00073 |
| Edu | −0.01674 | 0.03657 | 0.00593 | 0.01688 |
| winter | 0.34013 ** | 0.03371 | 0.29896 ** | 0.01921 |
| R2 | 0.558 | 0.851 | ||
| F-value | 36.59 ** | 61.49 ** | ||
Publisher’s Note: MDPI stays neutral with regard to jurisdictional claims in published maps and institutional affiliations. |
© 2022 by the authors. Licensee MDPI, Basel, Switzerland. This article is an open access article distributed under the terms and conditions of the Creative Commons Attribution (CC BY) license (https://creativecommons.org/licenses/by/4.0/).
Share and Cite
Pai, W.-T.; Schafferer, C.; Lee, J.-M.; Ho, L.-M.; Lu, Y.-H.; Yang, H.-C.; Yeh, C.-Y. Effect of Culture Period and Stocking Density on Input Demand and Scale Economies of Milkfish (Chanos chanos) Polycultures with White Shrimp (Penaeus indicus). Fishes 2022, 7, 110. https://doi.org/10.3390/fishes7030110
Pai W-T, Schafferer C, Lee J-M, Ho L-M, Lu Y-H, Yang H-C, Yeh C-Y. Effect of Culture Period and Stocking Density on Input Demand and Scale Economies of Milkfish (Chanos chanos) Polycultures with White Shrimp (Penaeus indicus). Fishes. 2022; 7(3):110. https://doi.org/10.3390/fishes7030110
Chicago/Turabian StylePai, Wei-Tse, Christian Schafferer, Jie-Min Lee, Li-Ming Ho, Yung-Hsiang Lu, Han-Chung Yang, and Chun-Yuan Yeh. 2022. "Effect of Culture Period and Stocking Density on Input Demand and Scale Economies of Milkfish (Chanos chanos) Polycultures with White Shrimp (Penaeus indicus)" Fishes 7, no. 3: 110. https://doi.org/10.3390/fishes7030110
APA StylePai, W.-T., Schafferer, C., Lee, J.-M., Ho, L.-M., Lu, Y.-H., Yang, H.-C., & Yeh, C.-Y. (2022). Effect of Culture Period and Stocking Density on Input Demand and Scale Economies of Milkfish (Chanos chanos) Polycultures with White Shrimp (Penaeus indicus). Fishes, 7(3), 110. https://doi.org/10.3390/fishes7030110