
Modeling Discards in Stock Assessments: Red Grouper Epinephelus morio in the U.S. Gulf of Mexico


Abstract
:1. Introduction
2. Materials and Methods
2.1. Description of Discard Models and Simulations
2.1.1. Population and Fishery Dynamics
2.1.2. Retention-Function Approach
2.1.3. Separate-Fleet Approach
2.1.4. Simulation Scenarios
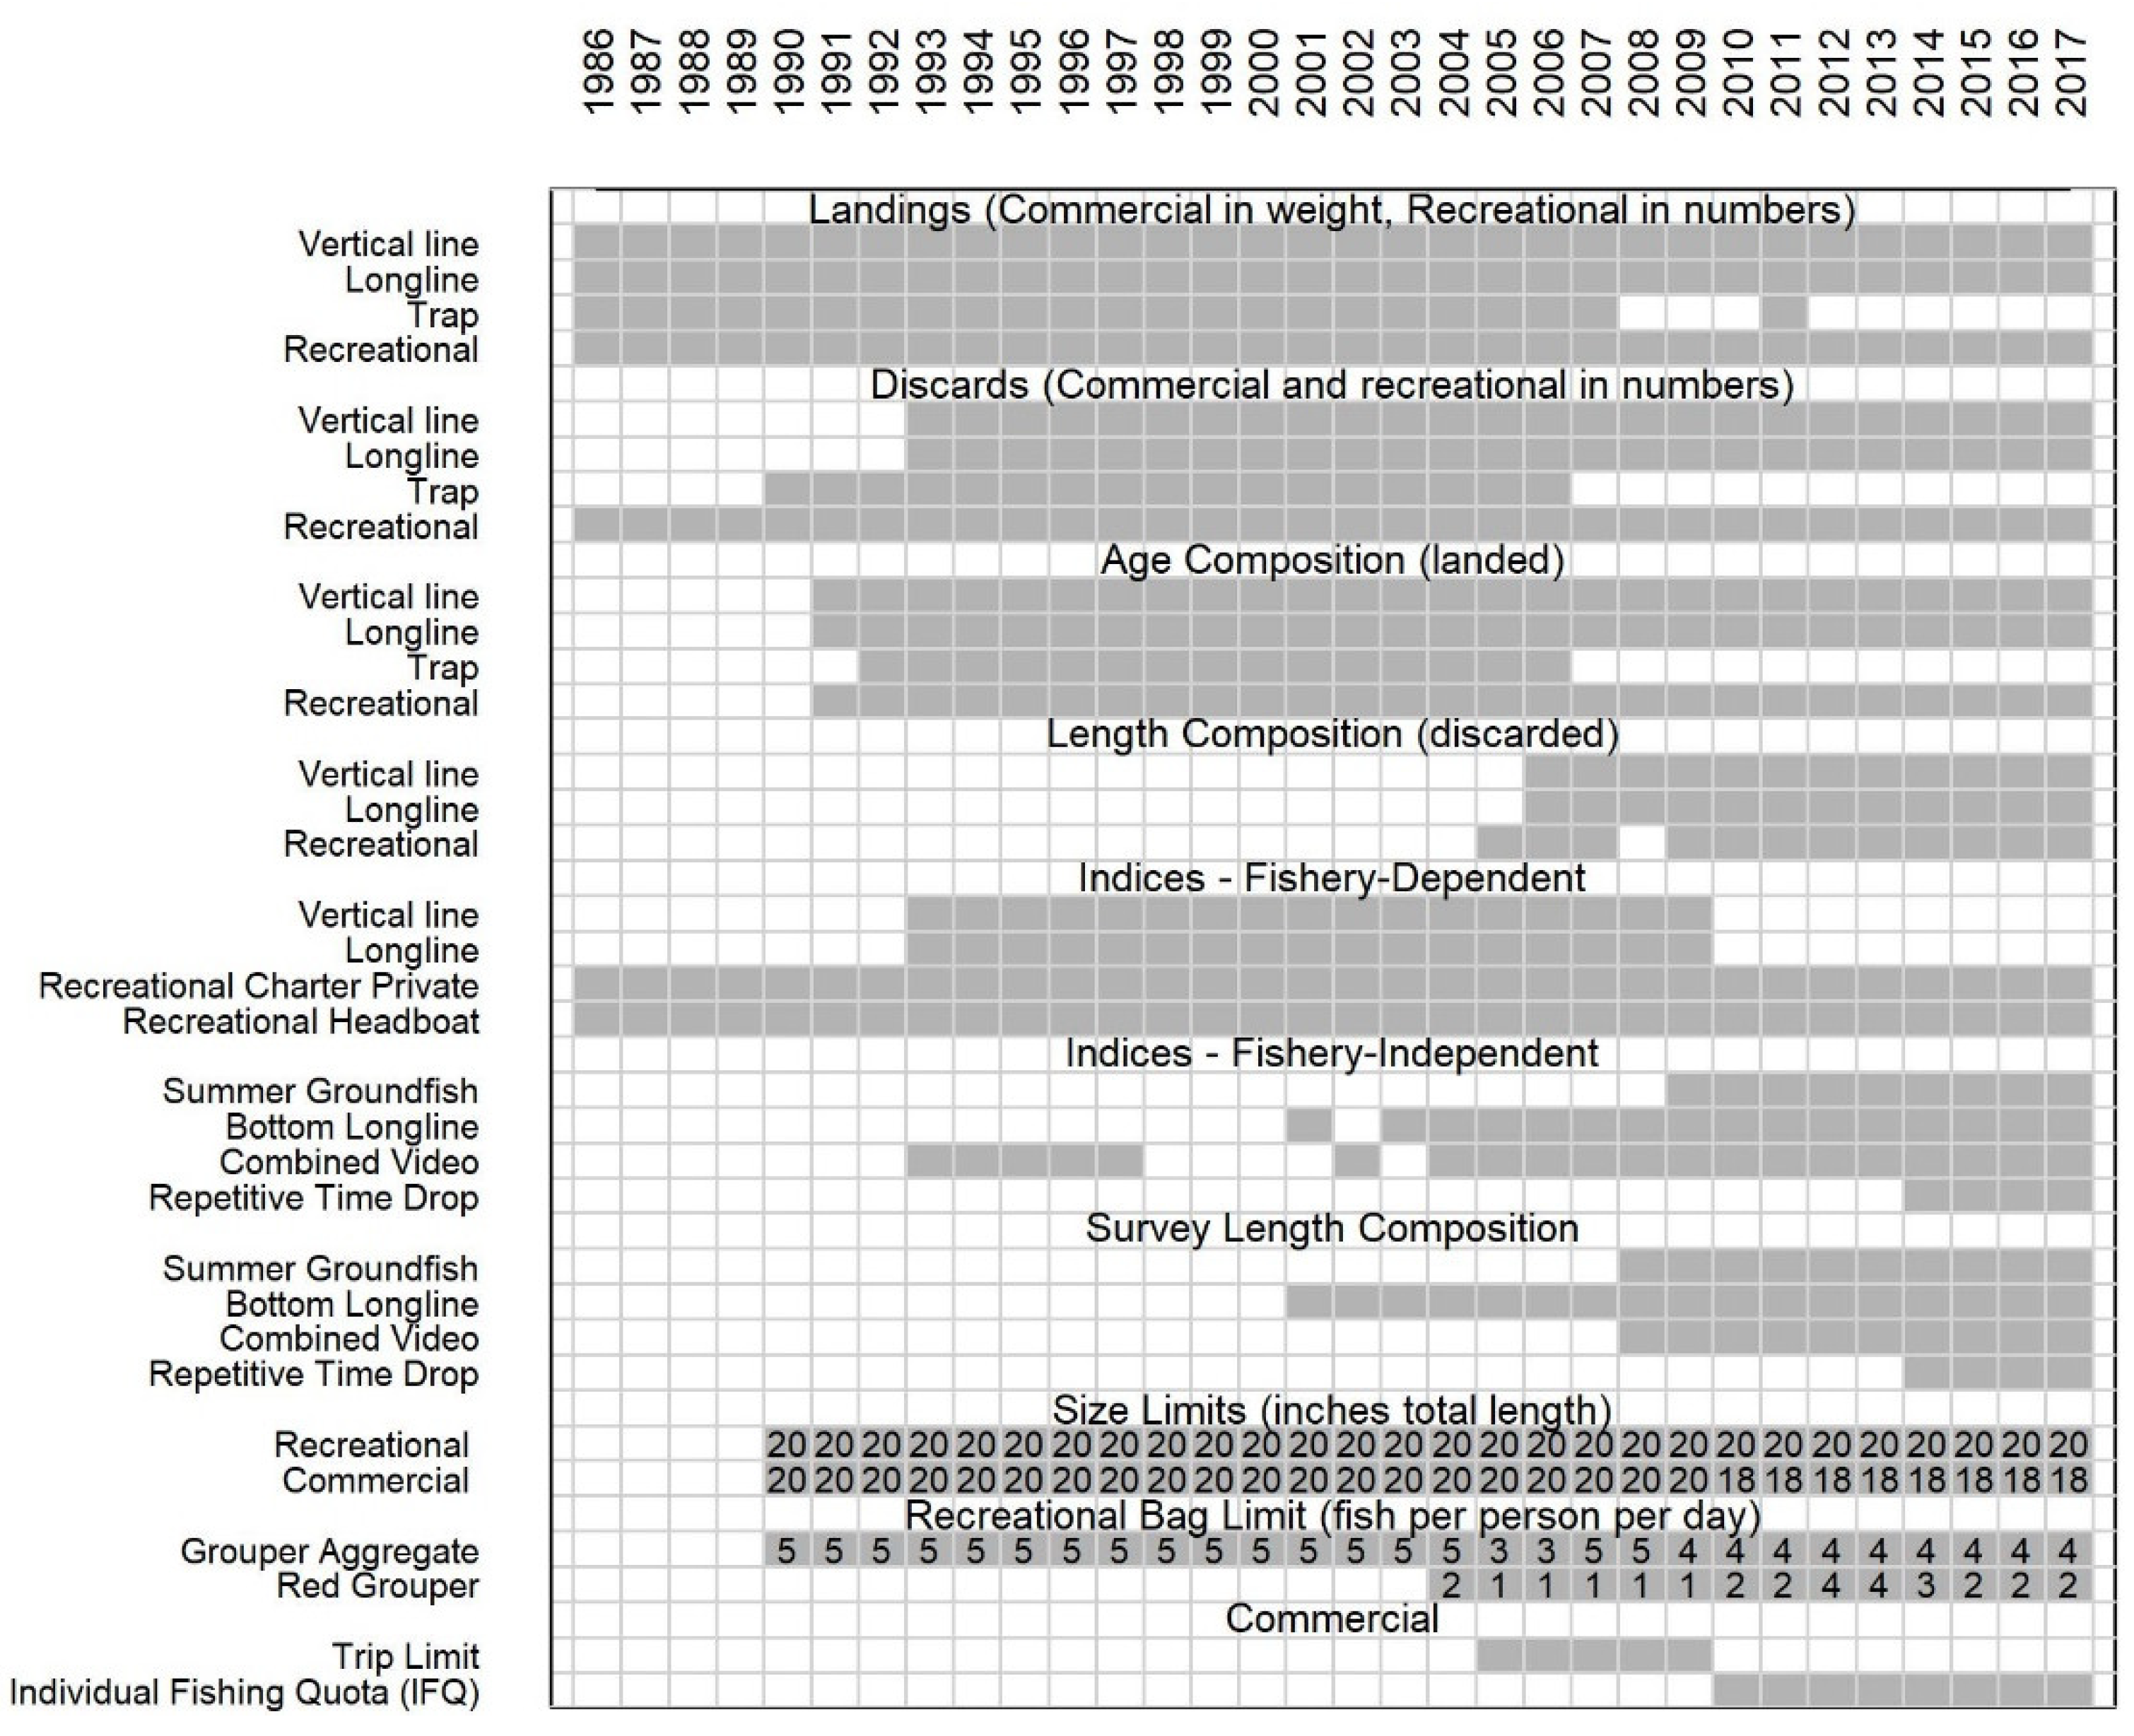
2.2. Case Study: Gulf Red Grouper
2.2.1. Base Model Configuration
2.2.2. Alternative Model Configurations
3. Results
3.1. Simulation Examples
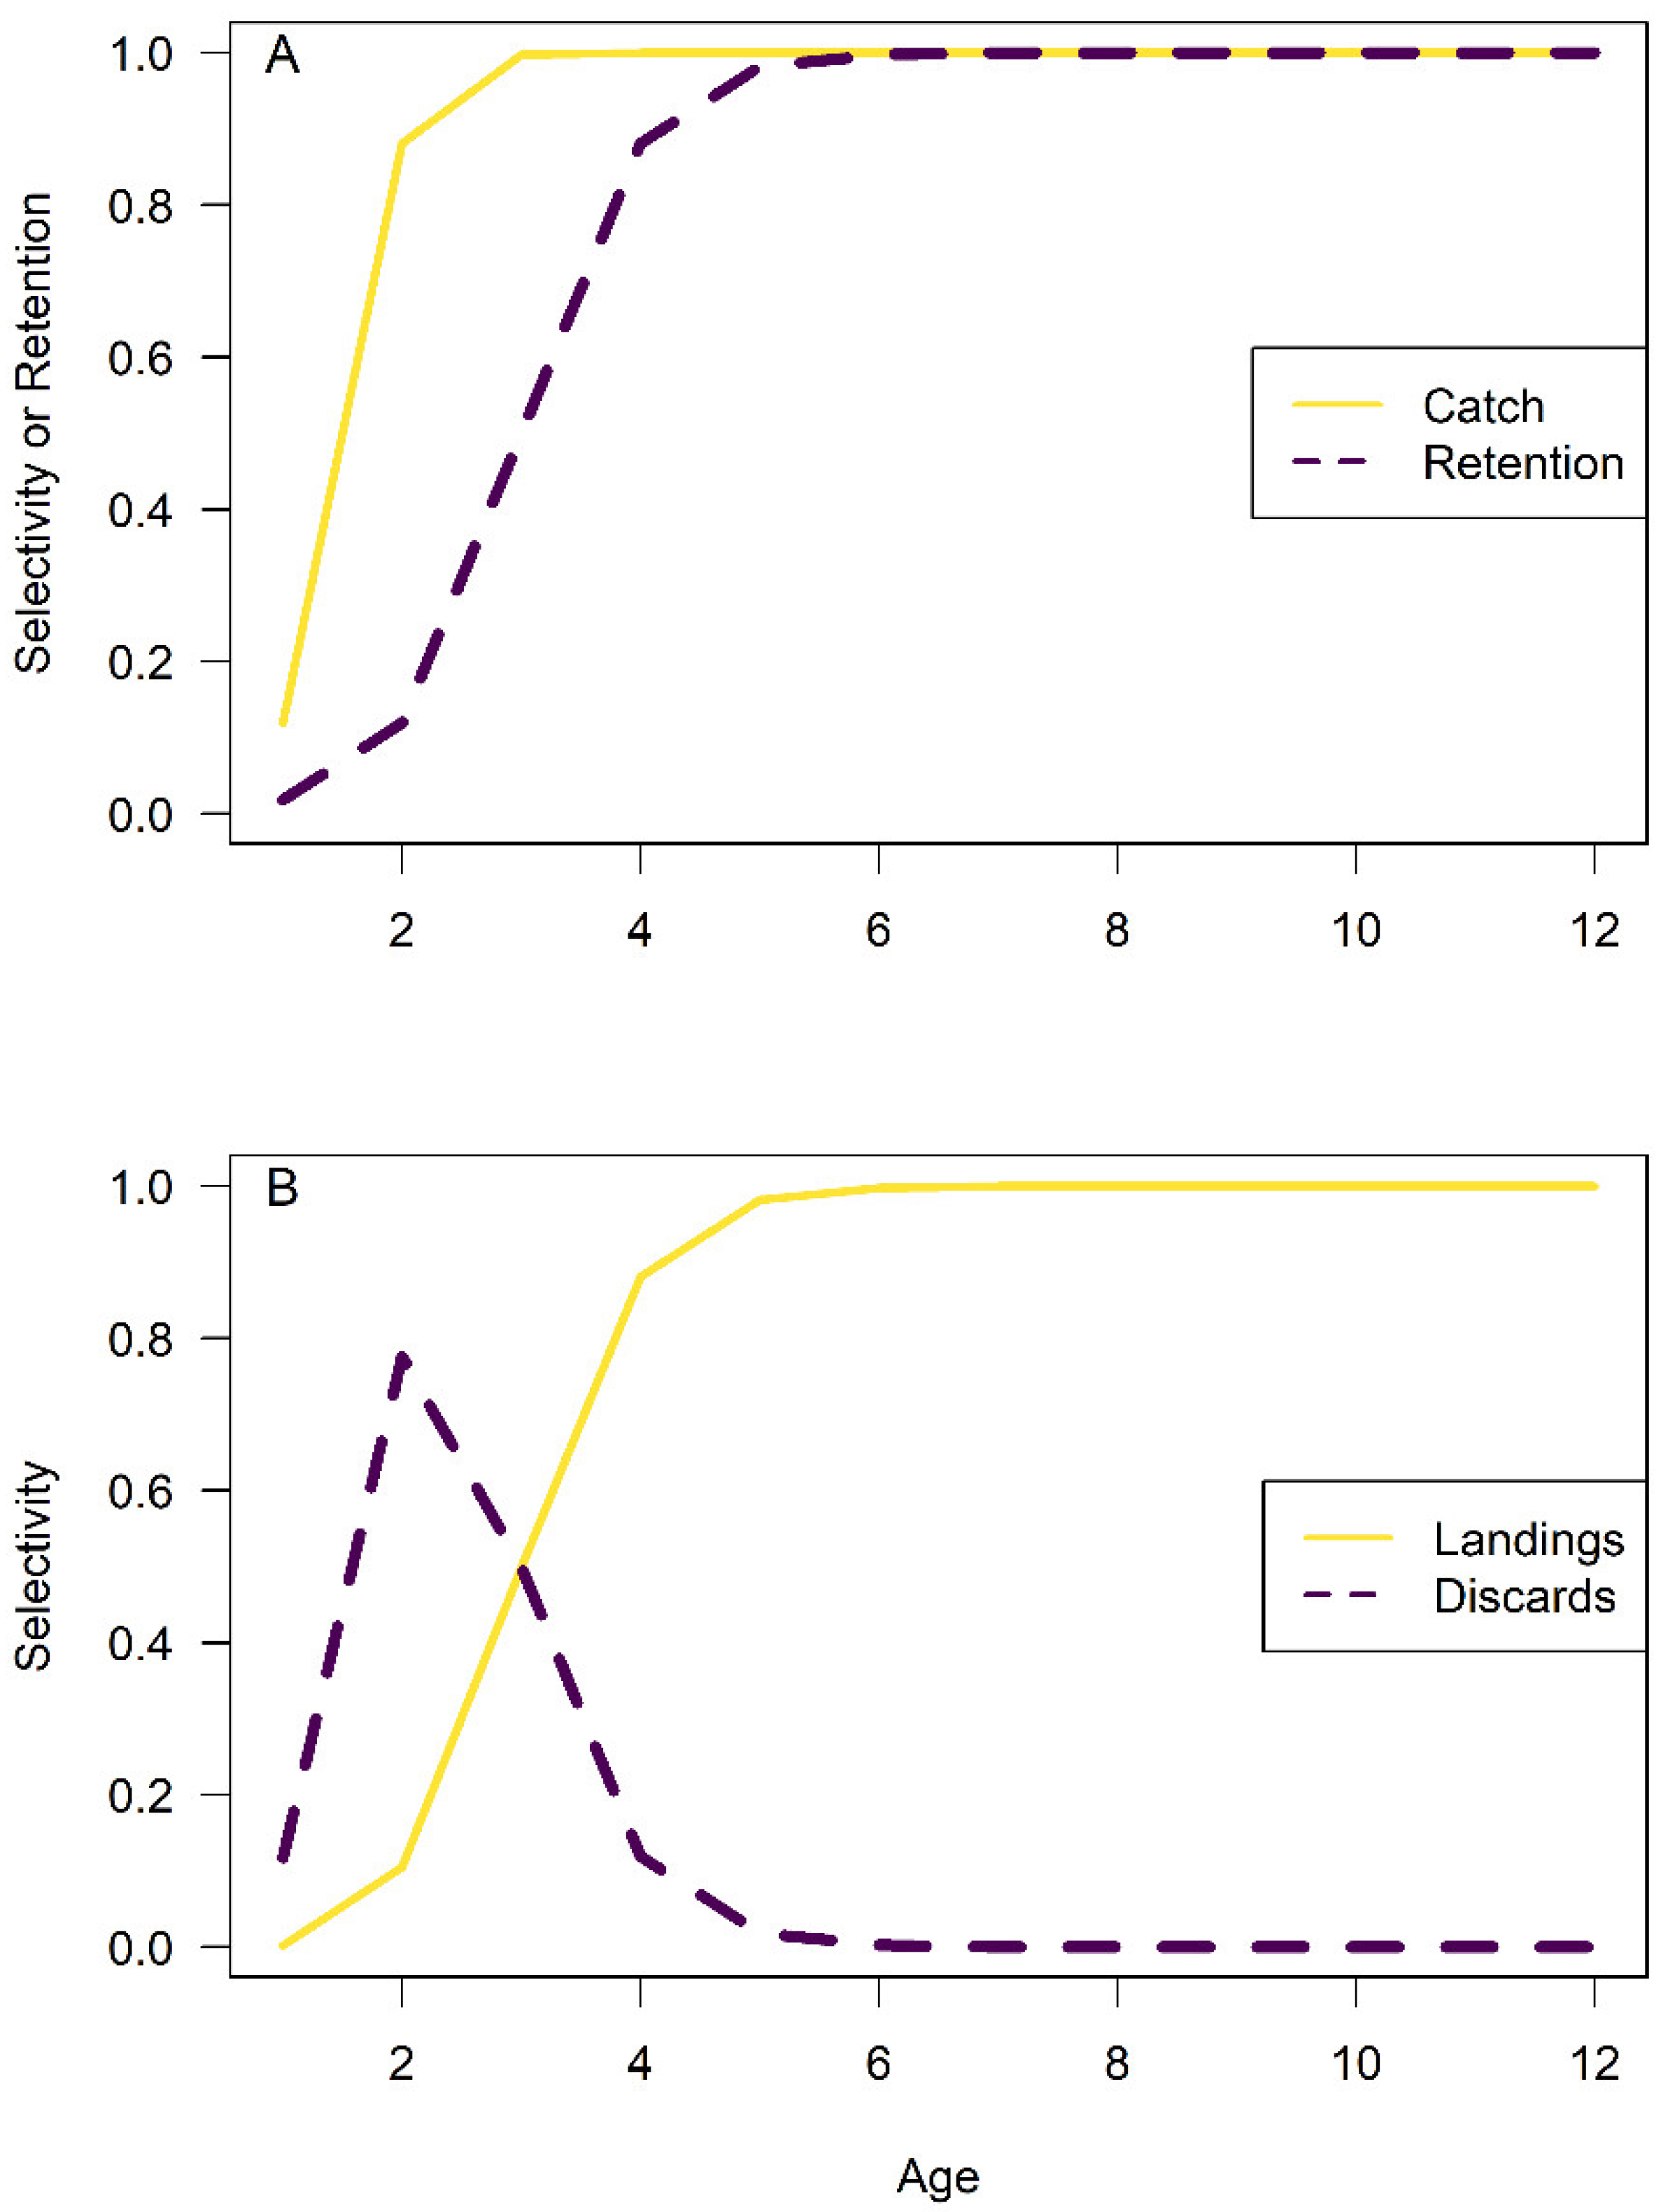
3.2. Gulf Red Grouper Case Study
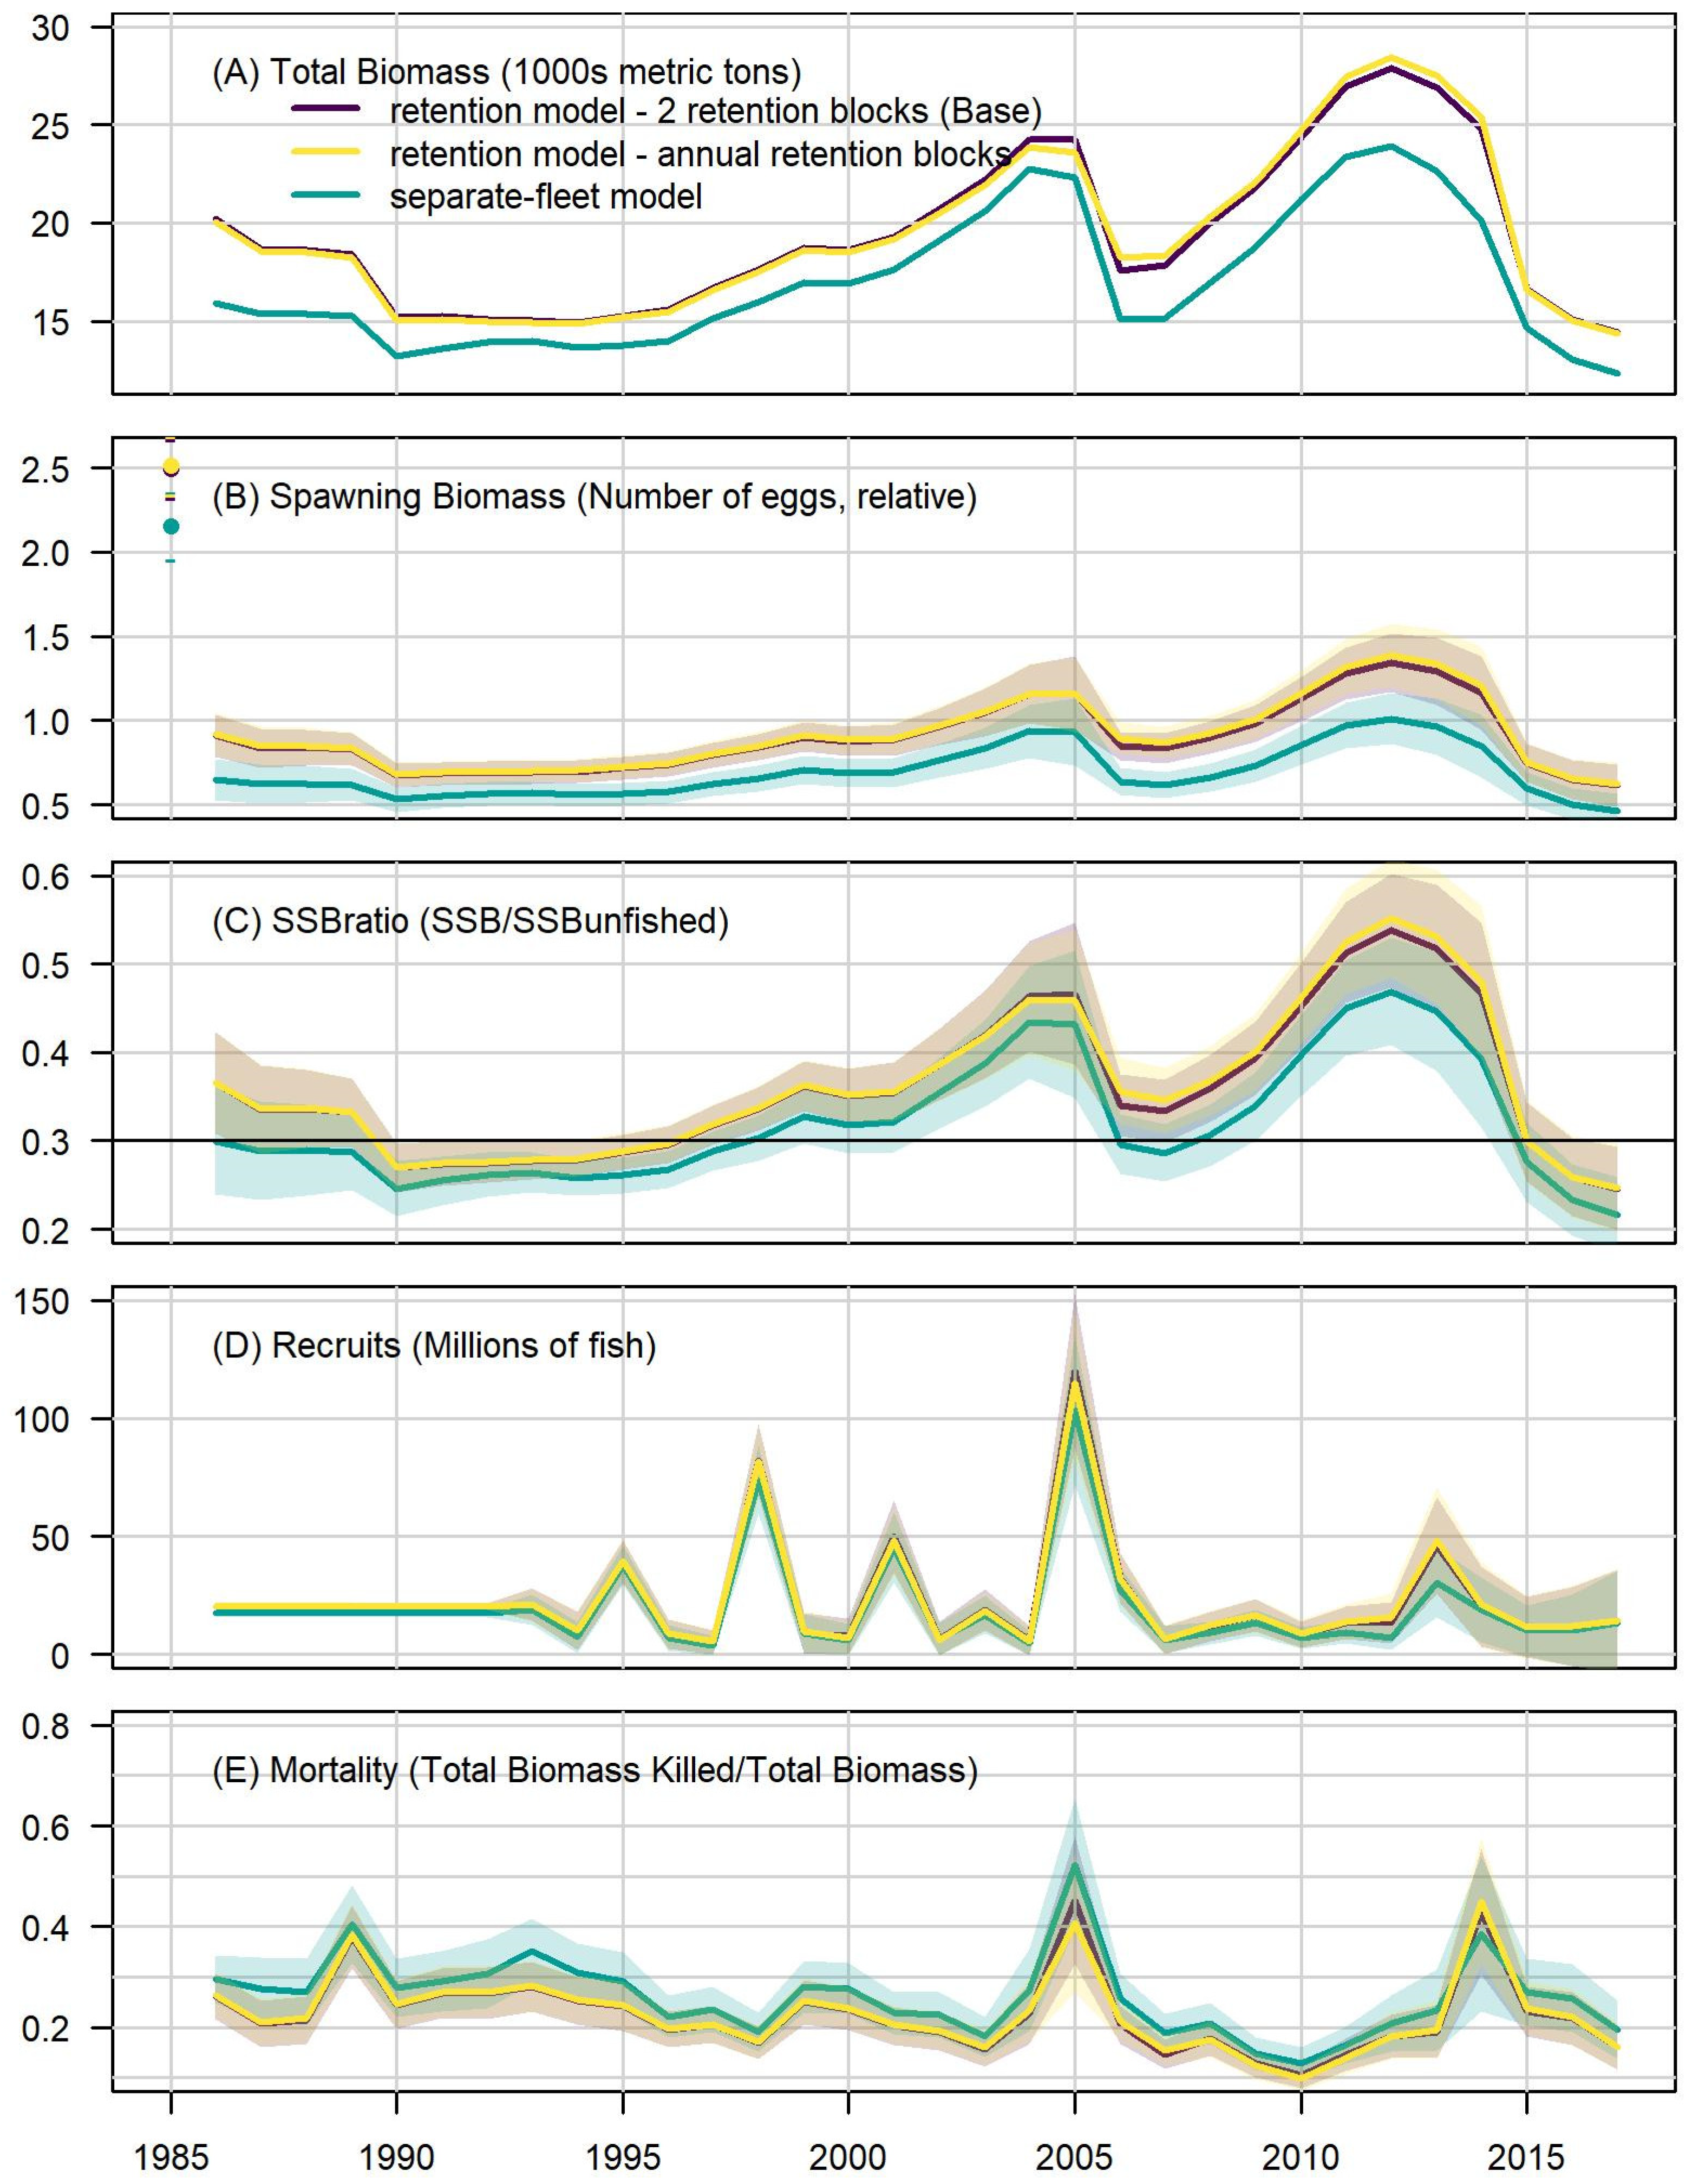
3.2.1. Comparison of Derived Quantities
3.2.2. Comparison of Benchmarks
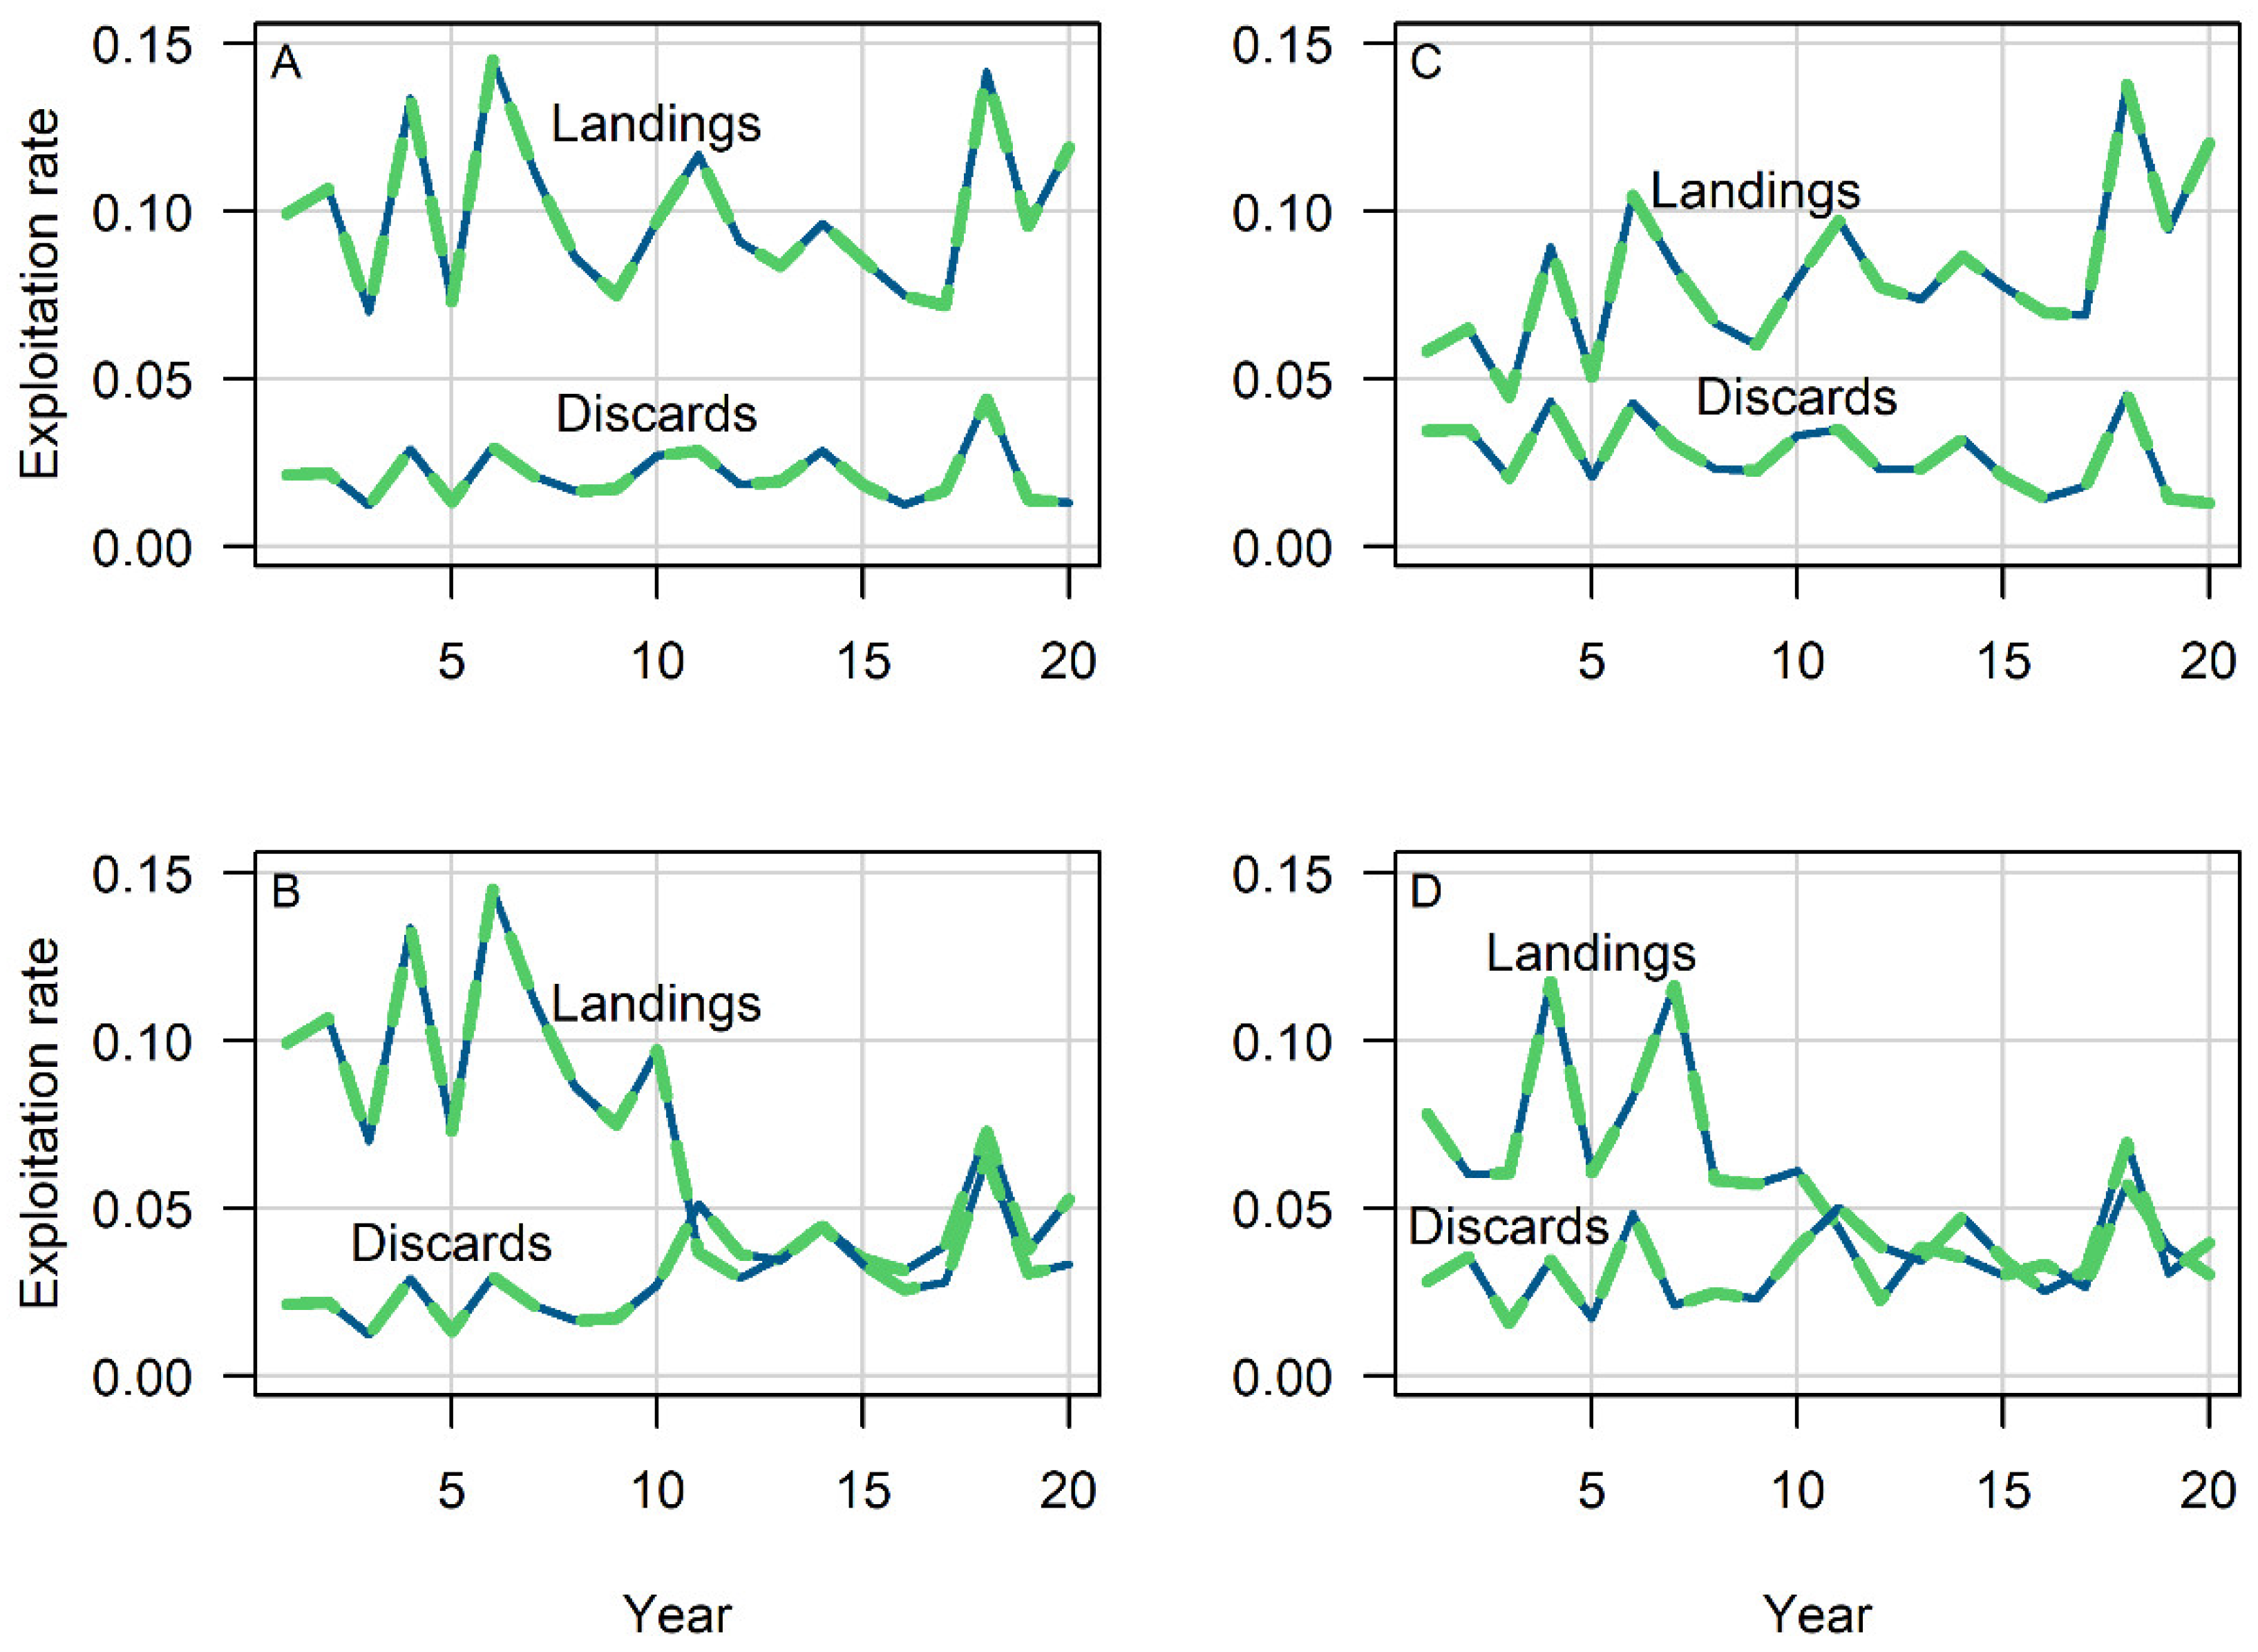
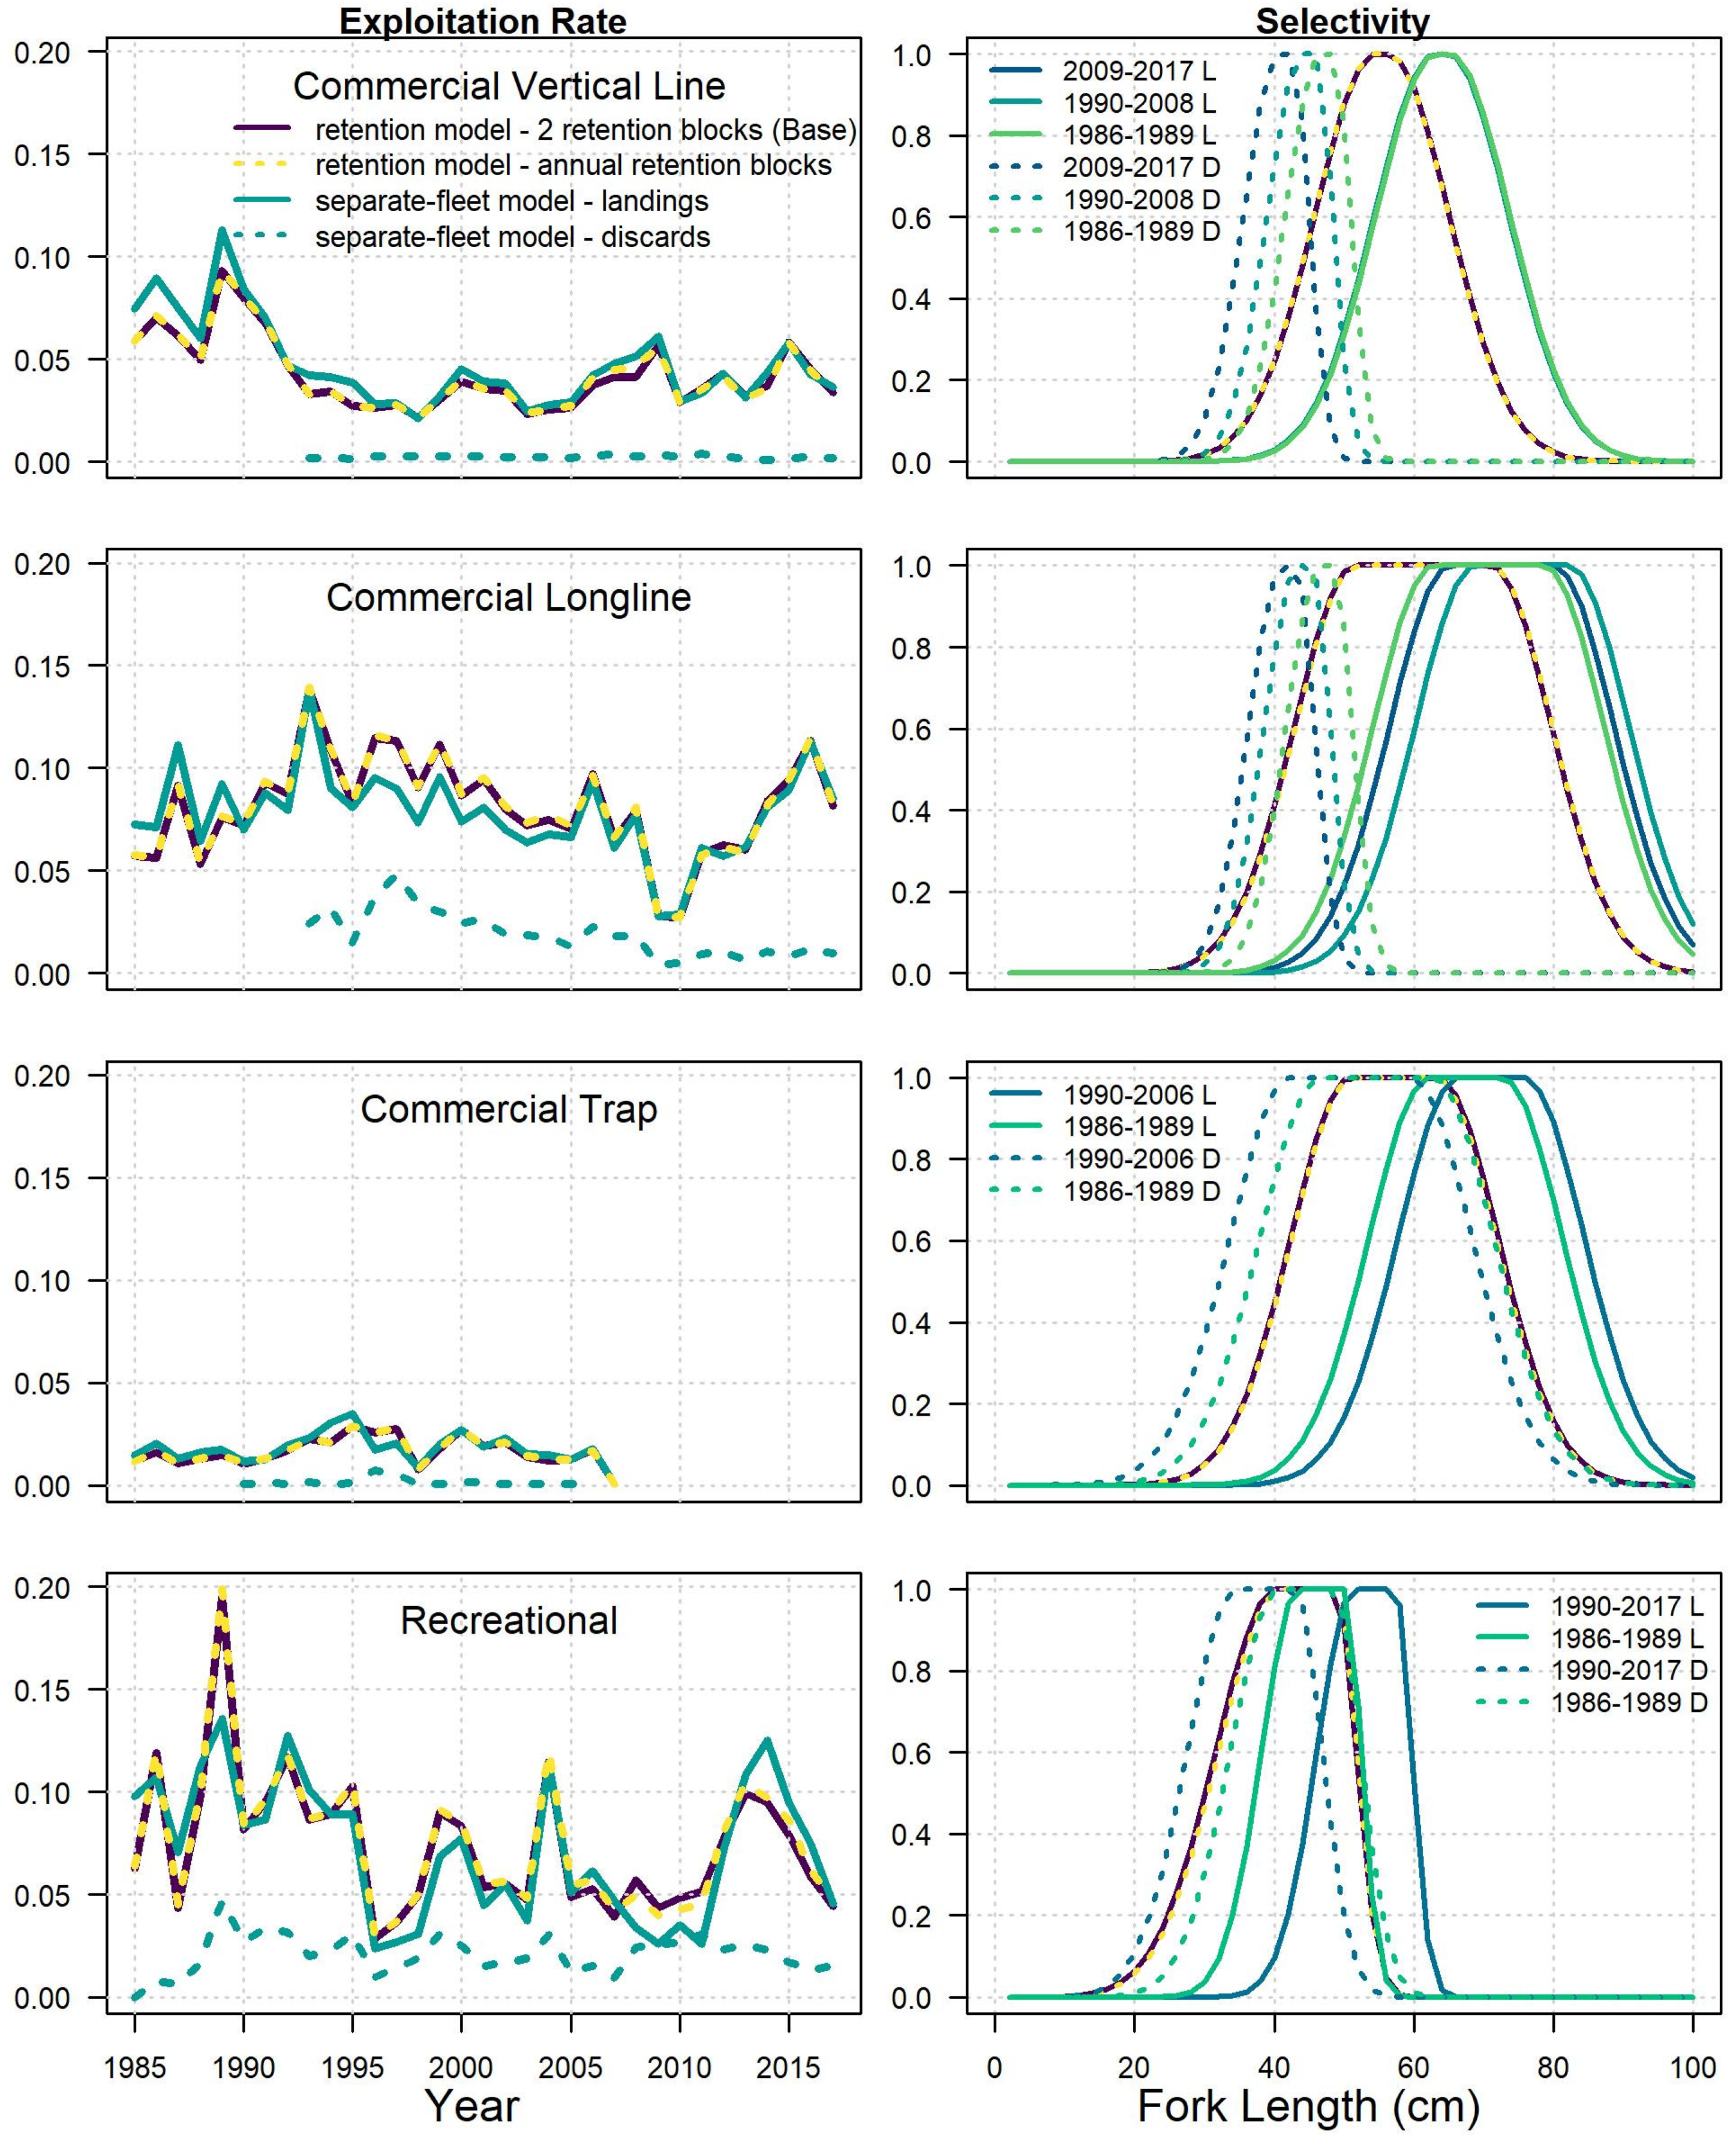
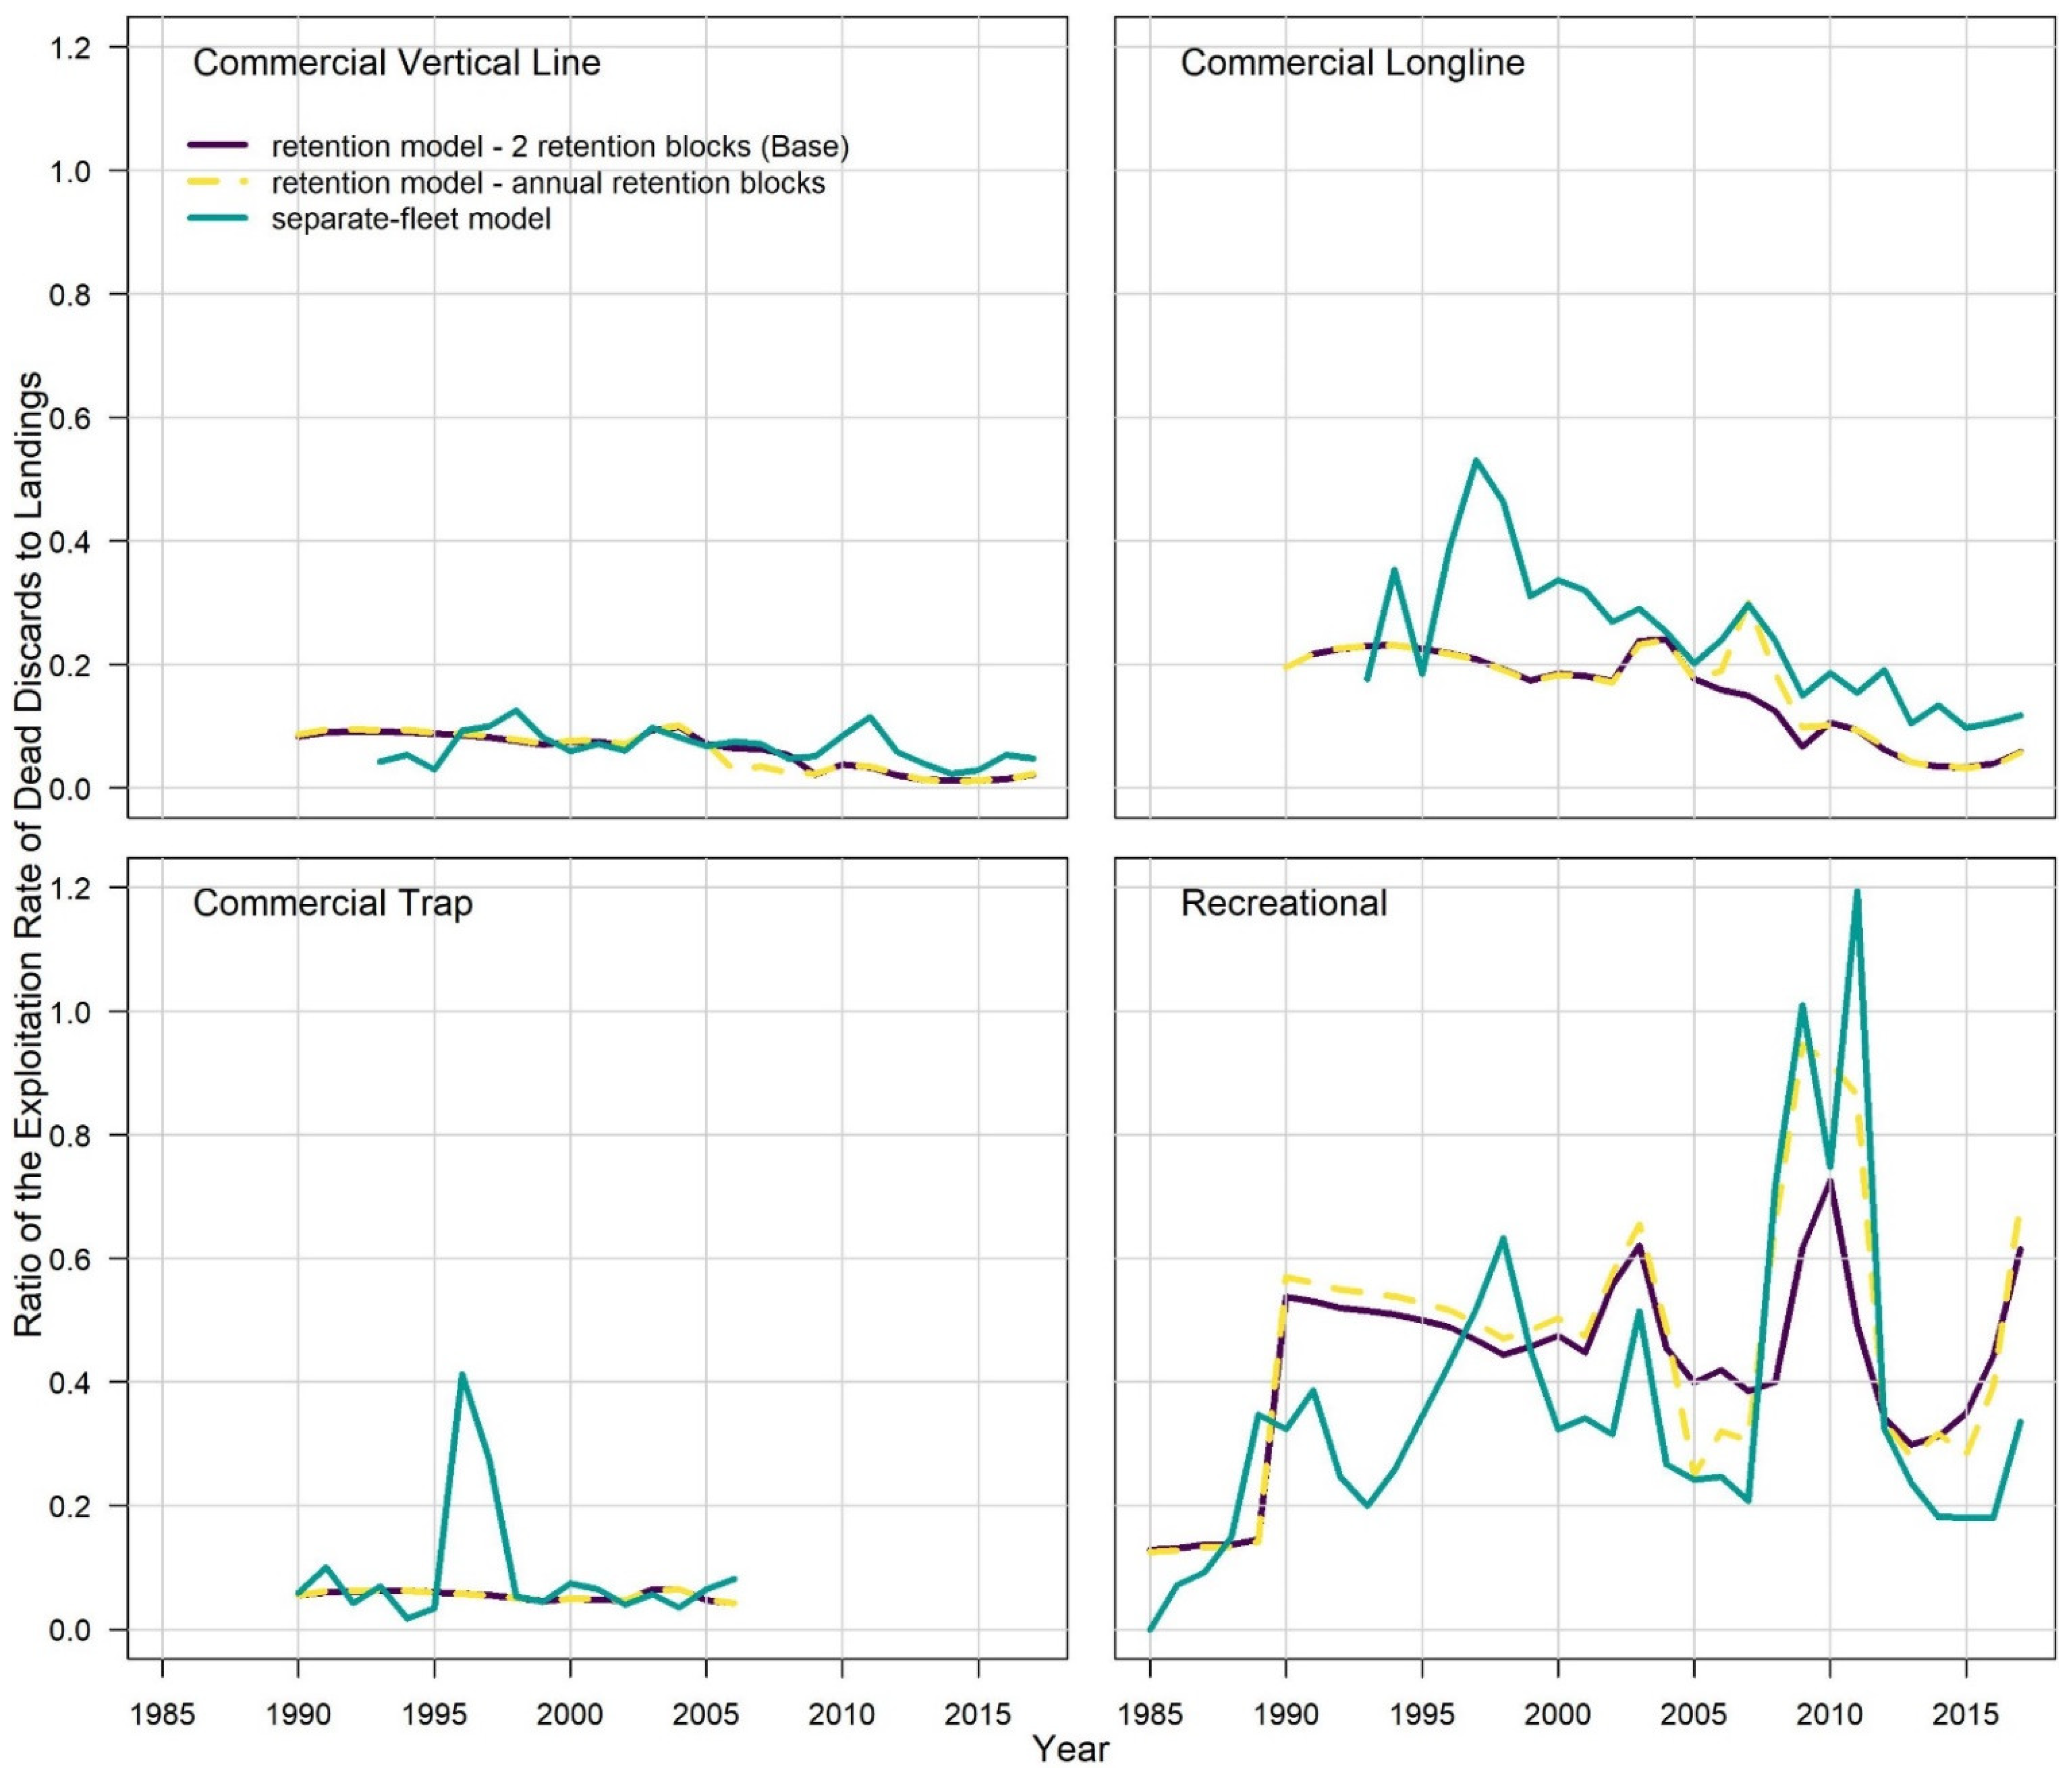
3.2.3. Fleet-Specific Trends in Exploitation Rate
3.2.4. Exploitation Patterns
4. Discussion
5. Conclusions
Supplementary Materials
Author Contributions
Funding
Data Availability Statement
Acknowledgments
Conflicts of Interest
References
- Davies, R.W.D.; Cripps, S.J.; Nickson, A.; Porter, G. Defining and estimating global marine fisheries bycatch. Mar. Policy 2009, 33, 661–672. [Google Scholar] [CrossRef]
- Davis, M.W. Key principles for understanding fish bycatch discard mortality. Can. J. Fish. Aquat. Sci. 2002, 59, 1834–1843. [Google Scholar] [CrossRef]
- Bartholomew, A.; Bohnsack, J.A. A review of catch-and-release angling mortality with implications for no-take reserves. Rev. Fish Biol. Fish. 2005, 15, 129–154. [Google Scholar] [CrossRef]
- Gillespie, A. Wasting the oceans: Searching for principles to control bycatch in international law. Int. J. Mar. Coast. Law 2002, 17, 161–193. [Google Scholar] [CrossRef]
- Harrington, J.M.; Myers, R.A.; Rosenberg, A.A. Wasted fishery resources: Discarded by-catch in the USA. Fish Fish. 2005, 6, 350–361. [Google Scholar] [CrossRef]
- Zeller, D.; Cashion, T.; Palomares, M.; Pauly, D. Global marine fisheries discards: A synthesis of reconstructed data. Fish Fish. 2018, 19, 30–39. [Google Scholar] [CrossRef] [Green Version]
- Crowder, L.B.; Murawski, S.A. Fisheries bycatch: Implications for management. Fisheries 1998, 23, 8–17. [Google Scholar] [CrossRef]
- Zhou, S. Fishery by-catch and discards: A positive perspective from ecosystem-based fishery management. Fish Fish. 2008, 9, 308–315. [Google Scholar] [CrossRef]
- Heath, M.R.; Cook, R.M.; Cameron, A.I.; Morris, D.J.; Speirs, D.C. Cascading ecological effects of eliminating fishery discards. Nat. Commun. 2014, 5, 3893. [Google Scholar] [CrossRef] [Green Version]
- Kelleher, K. Discards in the World’s Marine Fisheries. An Update; FAO Fisheries Technical Paper 470; Food and Agriculture Organization: Rome, Italy, 2005; 131p. [Google Scholar]
- Catchpole, T.L.; Frid, C.L.J.; Gray, T.S. Discards in North Sea fisheries: Causes, consequences and solutions. Mar. Policy 2005, 29, 421–430. [Google Scholar] [CrossRef]
- Campana, S.E. Transboundary movements, unmonitored fishing mortality, and ineffective international fisheries management pose risks for pelagic sharks in the Northwest Atlantic. Can. J. Fish. Aquat. Sci. 2016, 73, 1599–1607. [Google Scholar] [CrossRef]
- Borges, L. The evolution of a discard policy in Europe. Fish Fish. 2015, 16, 534–540. [Google Scholar] [CrossRef]
- Catchpole, T.L.; Elliott, S.; Peach, D.; Mangi, S.C.; Gray, T.S. How to deal with the EU landings obligation: Lessons from an English discard ban sea trial. ICES J. Mar. Sci. 2018, 75, 270–278. [Google Scholar] [CrossRef]
- Rochet, M.J.; Trenkel, V.M. Factors for the variability of discards: Assumptions and field evidence. Can. J. Fish. Aquat. Sci. 2005, 62, 224–235. [Google Scholar] [CrossRef]
- Feekings, J.; Bartolino, V.; Madsen, N.; Catchpole, T. Fishery discards: Factors affecting their variability within a demersal trawl fishery. PLoS ONE 2012, 7, e36409. [Google Scholar] [CrossRef] [Green Version]
- Pascoe, S. Bycatch Management and the Economics of Discarding; FAO Fisheries Technical Paper No. 370; Food and Agriculture Organization: Rome, Italy, 1997; 137p. [Google Scholar]
- Depestele, J.; Vandemaele, S.; Vanhee, W.; Polet, H.; Torreele, E.; Leirs, H.; Vincx, M. Quantifying causes of discard variability: An indispensable assistance to discard estimation and a paramount need for policy measures. ICES J. Mar. Sci. 2011, 68, 1719–1725. [Google Scholar] [CrossRef]
- Batsleer, J.; Hamon, K.G.; van Overzee, H.M.J.; Rijnsdorp, A.D.; Poos, J.J. High-grading and over-quota discarding in mixed fisheries. Rev. Fish. Biol. Fish. 2015, 25, 715–736. [Google Scholar] [CrossRef] [Green Version]
- Cass-Calay, S.L.; Arnold, W.S.; Bryan, M.D.; Schull, J. Report of the US Caribbean Fishery-Independent Survey Workshop. NOAA Technical Memorandum NMFS-SEFSC-688, 2016. Available online: https://repository.library.noaa.gov/view/noaa/10477 (accessed on 4 October 2021).
- Stratoudakis, Y.; Fryer, R.J.; Cook, R.M. Discarding practices for commercial gadoids in the North Sea. Can. J. Fish. Aquat. Sci. 1998, 55, 1632–1644. [Google Scholar] [CrossRef]
- Garner, S.B.; Patterson, W.F. Direct observation of fishing effort, catch, and discard rates of charter boats targeting reef fishes in the northern Gulf of Mexico. Fish. Bull. 2015, 113, 157–166. [Google Scholar] [CrossRef] [Green Version]
- Heath, M.R.; Cook, R.M. Hind-casting the quantity and composition of discards by mixed demersal fisheries in the North Sea. PLoS ONE 2015, 10, e0117078. [Google Scholar] [CrossRef] [Green Version]
- Williams, E.H. The effects of unaccounted discards and misspecified natural mortality on harvest policies based on estimates of spawners per recruit. N. Am. J. Fish. Manag. 2002, 22, 311–325. [Google Scholar] [CrossRef]
- Punt, A.E.; Smith, D.C.; Tuck, G.N.; Methot, R.D. Including discard data in fisheries stock assessments: Two case studies from south-eastern Australia. Fish. Res. 2006, 79, 239–250. [Google Scholar] [CrossRef]
- Aarts, G.; Poos, J.J. Comprehensive discard reconstruction and abundance estimation using flexible selectivity functions. ICES J. Mar. Sci. 2009, 66, 763–771. [Google Scholar] [CrossRef] [Green Version]
- Cook, R.M. Inclusion of discards in stock assessment models. Fish Fish. 2019, 20, 1232–1245. [Google Scholar] [CrossRef]
- Methot, R.D., Jr.; Wetzel, C.R. Stock synthesis: A biological and statistical framework for fish stock assessment and fishery management. Fish. Res. 2013, 142, 86–99. [Google Scholar] [CrossRef]
- R Core Team. R: A Language and Environment for Statistical Computing; R Foundation for Statistical Computing: Vienna, Austria, 2021; Available online: https://www.R-project.org/ (accessed on 4 October 2021).
- Methot, R.D., Jr.; Wetzel, C.R.; Taylor, I.G. Stock Synthesis User Manual Version 3.30.12; NOAA Fisheries: Seattle, WA, USA, 2018; 235p.
- Sagarese, S.R.; Vaughan, N.R.; Walter, J.F., III; Karnauskas, M. Enhancing single-species stock assessments with diverse ecosystem perspectives: A case study for Gulf of Mexico Red Grouper (Epinephelus morio) and red tides. Can. J. Fish. Aquat. Sci. 2021, 78, 1168–1180. [Google Scholar] [CrossRef]
- Pulver, J.R.; Lombardi, L.; Scott-Denton, E. Summary of Commercial Red Grouper (Epinephelus morio) Catch Data Based on Fishery Observer Coverage of the Gulf of Mexico Reef Fish Fishery; SEDAR42-DW-01; SEDAR: North Charleston, SC, USA, 2014; 40p. [Google Scholar]
- Gray, A.; Sauls, B. Size Distribution of Red Grouper Observed in for-Hire Recreational Fisheries in the Gulf of Mexico; SEDAR42-DW-14; SEDAR: North Charleston, SC, USA, 2014; 22p. [Google Scholar]
- Lazarre, D. A Summary of Red Grouper Size Distribution Data from Recreational Fishery Surveys in the Gulf of Mexico; SEDAR61-WP-13; SEDAR: North Charleston, SC, USA, 2018; 17p. [Google Scholar]
- SEDAR61—Gulf of Mexico Red Grouper Stock Assessment Report; SEDAR: North Charleston, SC, USA, 2019; 285p, Available online: http://sedarweb.org/sedar-61 (accessed on 4 October 2021).
- Pulver, J.R.; Stephen, J.A. Factors that influence discarding in the Gulf of Mexico commercial grouper-tilefish IFQ reef fish fishery. Fish. Res. 2019, 218, 218–228. [Google Scholar] [CrossRef]
- SEDAR 57—U.S. Caribbean Spiny Lobster Stock Assessment Report; SEDAR: North Charleston, SC, USA, 2019; 232p, Available online: http://sedarweb.org/sedar-57 (accessed on 4 October 2021).
- SEDAR 49—Gulf of Mexico Data-Limited Species Stock Assessment Report; SEDAR: North Charleston, SC, USA, 2016; 618p, Available online: http://sedarweb.org/sedar-49 (accessed on 4 October 2021).
- Runde, B.J.; Buckel, J.A.; Shertzer, K.W.; Bacheler, N.M.; Rudershausen, P.J.; Sauls, B. Repetitive capture of marine fishes: Implications for estimating number and mortality of releases. ICES J. Mar. Sci. 2020, 77, 2905–2917. [Google Scholar] [CrossRef]
- Scott-Denton, E.; Cryer, P.F.; Gocke, J.P.; Harrelson, M.R.; Kinsella, D.L.; Pulver, J.R.; Smith, R.C.; Williams, J.A. Descriptions of the US Gulf of Mexico reef fish bottom longline and vertical line fisheries based on observer data. Mar. Fish. Rev. 2011, 73, 1–26. [Google Scholar]
- Sauls, B.; Ayala, O. Circle hook requirements in the Gulf of Mexico: Application in recreational fisheries and effectiveness for conservation of reef fishes. Bull. Mar. Sci. 2012, 88, 667–679. [Google Scholar] [CrossRef]
- Agar, J.J.; Stephen, J.A.; Strelcheck, A.; Diagne, A. The Gulf of Mexico red snapper IFQ program: The first five years. Mar. Resour. Econ. 2014, 29, 177–198. [Google Scholar] [CrossRef]
- SEDAR 52—Gulf of Mexico Red Snapper Stock Assessment Report; SEDAR: North Charleston, SC, USA, 2018; 434p, Available online: http://sedarweb.org/sedar-52 (accessed on 4 October 2021).
- SEDAR 51—Gulf of Mexico Gray Snapper Stock Assessment Report; SEDAR: North Charleston, SC, USA, 2018; 428p, Available online: http://sedarweb.org/sedar-51 (accessed on 4 October 2021).
- SEDAR 72—Gulf of Mexico Gag Grouper Stock Assessment Report; SEDAR: North Charleston, SC, USA, 2021; 318p, Available online: http://sedarweb.org/sedar-72 (accessed on 4 October 2021).
- SEDAR 28 Update—Gulf of Mexico Cobia Stock Assessment Report; SEDAR: North Charleston, SC, USA, 2021; 147p, Available online: http://sedarweb.org/sedar-28 (accessed on 4 October 2021).
- Catchpole, T.L.; Enever, R.; Maxwell, D.L.; Armstrong, M.J.; Reese, A.; Revill, A.S. Constructing indices to detect temporal trends in discarding. Fish. Res. 2011, 107, 94–99. [Google Scholar] [CrossRef]
- Tsagarakis, K.; Palialexis, A.; Vassilopoulou, V. Mediterranean fishery discards: A review of the existing knowledge. ICES J. Mar. Sci. 2014, 71, 1219–1234. [Google Scholar] [CrossRef] [Green Version]
- Borges, L.; Zuur, A.F.; Rogan, E.; Officer, R. Modelling discard ogives from irish demersal fisheries. ICES J. Mar. Sci. 2006, 63, 1086–1095. [Google Scholar] [CrossRef] [Green Version]


| Parameter | Description | Value |
|---|---|---|
| General | ||
| M | Natural mortality rate | 0.2 |
| R | Expected recruitment in the absence of deviations | 1e6 |
| Standard deviation of recruitment deviations (log space) | 0.5 | |
| δ | Release mortality rate | 0.25 |
| Slope parameter of catch selectivity | 4.0 | |
| Location parameter of catch selectivity | 1.5 | |
| Base-level fishing rate | 0.3 | |
| Standard deviation of fishing rate deviations (log space) | 0.2 | |
| Simulation 1 | ||
| Slope parameter of retention function | 2.0 | |
| Location parameter of retention function | 3.0 | |
| p | Asymptotic retention | 1.0 |
| Simulation 2 | ||
| Slope parameter of retention function, years 1–10 | 2.0 | |
| Location parameter of retention function, years 1–10 | 3.0 | |
| Slope parameter of retention function, years 11–20 | 4.0 | |
| Location parameter of retention function, years 11–20 | 5.0 | |
| p | Asymptotic retention | 1.0 |
| Simulation 3 | ||
| Slope parameter of retention function | 2.0 | |
| Location parameter of retention function | 3.0 | |
| p | Asymptotic retention, increases linearly over years | (0.5, …, 1.0) |
| Simulation 4 | ||
| Slope parameter of retention function, years 1–10 | 2.0 | |
| Location parameter of retention function, years 1–10 | 3.0 | |
| Slope parameter of retention function, years 11–20 | 4.0 | |
| Location parameter of retention function, years 11–20 | 5.0 | |
| p | Asymptotic retention, varies randomly over years | p~U (0.5, 1.0) |
| Main Change | Retention Model— 2 Blocks (Base) | Retention Model— Annual Blocks | Separate-Fleet Model |
|---|---|---|---|
| Model Evaluation | |||
| Negative log likelihood (NLL) | 537.486 | 544.787 | 536.053 |
| Catch NLL | 36.5 | 34.5 | 3.18 |
| Survey NLL | −102.6 | −108 | −98.9 |
| Discard NLL | −30.1 | −31.4 | - |
| Length composition NLL | 287.3 | 300.3 | 292.2 |
| Age composition NLL | 335.5 | 338.4 | 322.9 |
| NLL maximum gradient | 0.000105 | 0.000225 | 0.009656 |
| Number of estimated parameters | 178 | 250 | 298 |
| Number of parameters with coefficient of variation (CV) > 1 (type of parameters) | 8 (Recruitment deviations) | 37 (Recruitment deviations, retention) | 35 (Fs, recruitment deviations, discard fleet selectivities) |
| Key Parameter Estimates (CV) | |||
| Recruitment variability () | 0.815 (0.114) | 0.811 (0.138) | 0.874 (0.140) |
| Natural log of virgin recruitment [ln(R0)] | 9.925 (0.004) | 9.933 (0.004) | 9.779 (0.005) |
| Commercial vertical line initial F (y−1) | 0.129 (0.187) | 0.130 (0.187) | 0.233 (0.448) |
| Commercial longline initial F (y−1) | 0.09 (0.200) | 0.091 (0.201) | 0.201 (0.544) |
| Commercial trap initial F (y−1) | 0.019 (0.219) | 0.02 (0.220) | 0.04 (1.163) |
| Recreational initial F (y−1) | 0.245 (0.204) | 0.246 (0.205) | 0.239 (0.190) |
| Red tide mortality in 2005 (y−1) | 0.339 (0.309) | 0.269 (0.401) | 0.398 (0.301) |
| Red tide mortality in 2014 (y−1) | 0.257 (0.429) | 0.286 (0.396) | 0.117 (1.141) |
| Criteria | Definition | Retention Model—2 Blocks (Base) | Retention Model—Annual Blocks | Separate-Fleet Model |
|---|---|---|---|---|
| Mortality Rate Criteria | ||||
| FMSYproxy = Maximum Fishing Mortality Threshold (MFMT) | Equilibrium fishing mortality that achieves a spawning potential ratio (SPR) of 30% | 0.26 | 0.26 | 0.29 |
| FCurrent | Average fishing mortality over last three years (2015–2017) | 0.20 | 0.21 | 0.24 |
| FCurrent/MFMT | Current fishery status | 0.78 | 0.79 | 0.82 |
| Overfishing in 2017? | No | No | No | |
| Biomass Criteria | ||||
| SSBMSYproxy | Equilibrium SSB when fishing at FMSYproxy | 748,241 | 754,383 | 646,482 |
| Minimum Stock Size Threshold (MSST) | 0.5×SSBMSYproxy | 374,120 | 377,192 | 323,241 |
| SSB0 | Virgin SSB | 2,494,130 | 2,513,280 | 2,153,750 |
| SSB2017 | SSB in terminal year | 613,517 | 620,817 | 464,086 |
| SSB2017/MSST | Current stock status | 1.64 | 1.65 | 1.44 |
| Overfished in 2017? | No | No | No | |
Publisher’s Note: MDPI stays neutral with regard to jurisdictional claims in published maps and institutional affiliations. |
© 2021 by the authors. Licensee MDPI, Basel, Switzerland. This article is an open access article distributed under the terms and conditions of the Creative Commons Attribution (CC BY) license (https://creativecommons.org/licenses/by/4.0/).
Share and Cite
Shertzer, K.W.; Williams, E.H.; Sagarese, S.R. Modeling Discards in Stock Assessments: Red Grouper Epinephelus morio in the U.S. Gulf of Mexico. Fishes 2022, 7, 7. https://doi.org/10.3390/fishes7010007
Shertzer KW, Williams EH, Sagarese SR. Modeling Discards in Stock Assessments: Red Grouper Epinephelus morio in the U.S. Gulf of Mexico. Fishes. 2022; 7(1):7. https://doi.org/10.3390/fishes7010007
Chicago/Turabian StyleShertzer, Kyle W., Erik H. Williams, and Skyler R. Sagarese. 2022. "Modeling Discards in Stock Assessments: Red Grouper Epinephelus morio in the U.S. Gulf of Mexico" Fishes 7, no. 1: 7. https://doi.org/10.3390/fishes7010007