Article

Stable Isotope Analysis of Food Web Structure and the Contribution of Carbon Sources in the Sea Adjacent to the Miaodao Archipelago (China)

1
College of Marine Sciences, Shanghai Ocean University, Shanghai 201306, China
2
Key Laboratory of Sustainable Development of Marine Fisheries, Ministry of Agriculture and Rural Affairs, Shandong Provincial Key Laboratory of Fishery Resources and Ecological Environment, Yellow Sea Fisheries Research Institute, Chinese Academy of Fishery Sciences, Qingdao 266071, China
3
Function Laboratory for Marine Fisheries Science and Food Production Processes, Pilot National Laboratory for Marine Science and Technology (Qingdao), Qingdao 266237, China
4
National Field Observation and Research Center for Changdao Marine Ecosystem, Changdao 265800, China
*
Author to whom correspondence should be addressed.
Fishes 2022, 7(1), 32; https://doi.org/10.3390/fishes7010032
Submission received: 13 December 2021 / Revised: 22 January 2022 / Accepted: 25 January 2022 / Published: 29 January 2022
(This article belongs to the Special Issue Sustainable Aquaculture and Fisheries)

Abstract

:
The littoral zones around archipelagos are highly productive coastal habitats that serve as biodiversity hotspots and provide valuable ecosystem services that are different from those of the pelagic and profundal zones. The littoral zone has complex basal carbon sources from different primary producers and is an important ocean–land transition area. Macroalgae are the main primary producers of the littoral zone, but their carbon contribution to consumers is rarely studied. Basal carbon sources determine the structure of the food web. In order to determine the contribution of basal carbon sources and the food web structure of the littoral zone, we used carbon and nitrogen stable isotope techniques and a Bayesian mixing model to study the autumn benthic food web in the sea adjacent to the Miaodao Archipelago. The potential carbon sources of the benthic food web biota in the sea adjacent to the Miaodao Archipelago in autumn are mainly algae (including phytoplankton and macroalgae) and SOM, but the contribution of POM is low. Macroalgae may play a more important role in the littoral zone benthic food webs. Although there are certain uncertainties in the model results, invertebrates and fish have obvious differences in their use of carbon sources. The trophic importance of different primary producers varies with functional feeding groups, and the resource utilization of different functional feeding groups may have certain spatial characteristics.

Graphical Abstract

1. Introduction

Since mankind entered the industrial revolution, the level of productivity has continued to increase, but many environmental problems have also arisen [1]. Among these, climate change caused mainly by CO2 is particularly prominent [2]. As the largest carbon pool on the planet, the ocean plays an important role in the carbon cycle [3]. The food web is an important part of the ocean carbon cycle and carbon sink [4]. As climate change and human activities intensify, the structures of ecosystems and their food webs are often reorganized [5]. The study of the marine food web describes many key processes in the ecosystem, such as trophic relations, material circulation, and energy flow [4,6]. However, the complexity of basic carbon sources has led to uncertainty in the structure of the food web and hindered the comprehensive understanding of the ocean food web and the ocean carbon cycle [7].
Studies have shown that many aquatic plants are the trophic foundation of the food web of ecosystems, such as freshwater, salt marsh, estuary, and shallow water coastal habitats [8,9]. In the ocean, phytoplankton is generally considered the basis of the marine food web [10]. Compared with freshwater ecosystems or open oceans, the sea areas adjacent to archipelagos are typical littoral zone areas, with shallower water depths and multiple sources of primary productivity [11]. Among these, the carbon contribution of terrestrial materials to the food web is unclear. In an investigation of the benthic ecosystem in the sea adjacent to the Miaodao Archipelago (China), we found that many captured organisms were entangled with macroalgae, and the biomass of macroalgae was considerable. However, the carbon contribution of macroalgae to marine benthic food webs has rarely been reported on a global scale [12]. It is unknown if the contribution of phytoplankton to the benthic food web in the sea adjacent to the island is still high because the food sources of many benthic organisms, invertebrates, and small fish cannot be directly analyzed through their stomach contents. For this purpose, we used carbon (δ13C: 13C/12C) and nitrogen (δ15N: 15N/14N) stable isotopes and Bayesian mixing models. Therefore, our study used the sea adjacent to the Miaodao Archipelago as the research area, and attempted to study the carbon contribution of different primary producers to consumers on the benthic food web from the perspective of stable isotopes.
The following questions were addressed in this study: (1) What is the trophic structure of the benthic food web in the sea adjacent to the Miaodao Archipelago in autumn? (2) What is the carbon contribution of different potential primary producers to the food web? (3) What role do macroalgae play in the benthic food web in the coastal waters of the Miaodao Archipelago? (4) What causes the difference in the use by consumers of carbon sources generated by primary producers of different functional feeding groups?

2. Materials and Methods

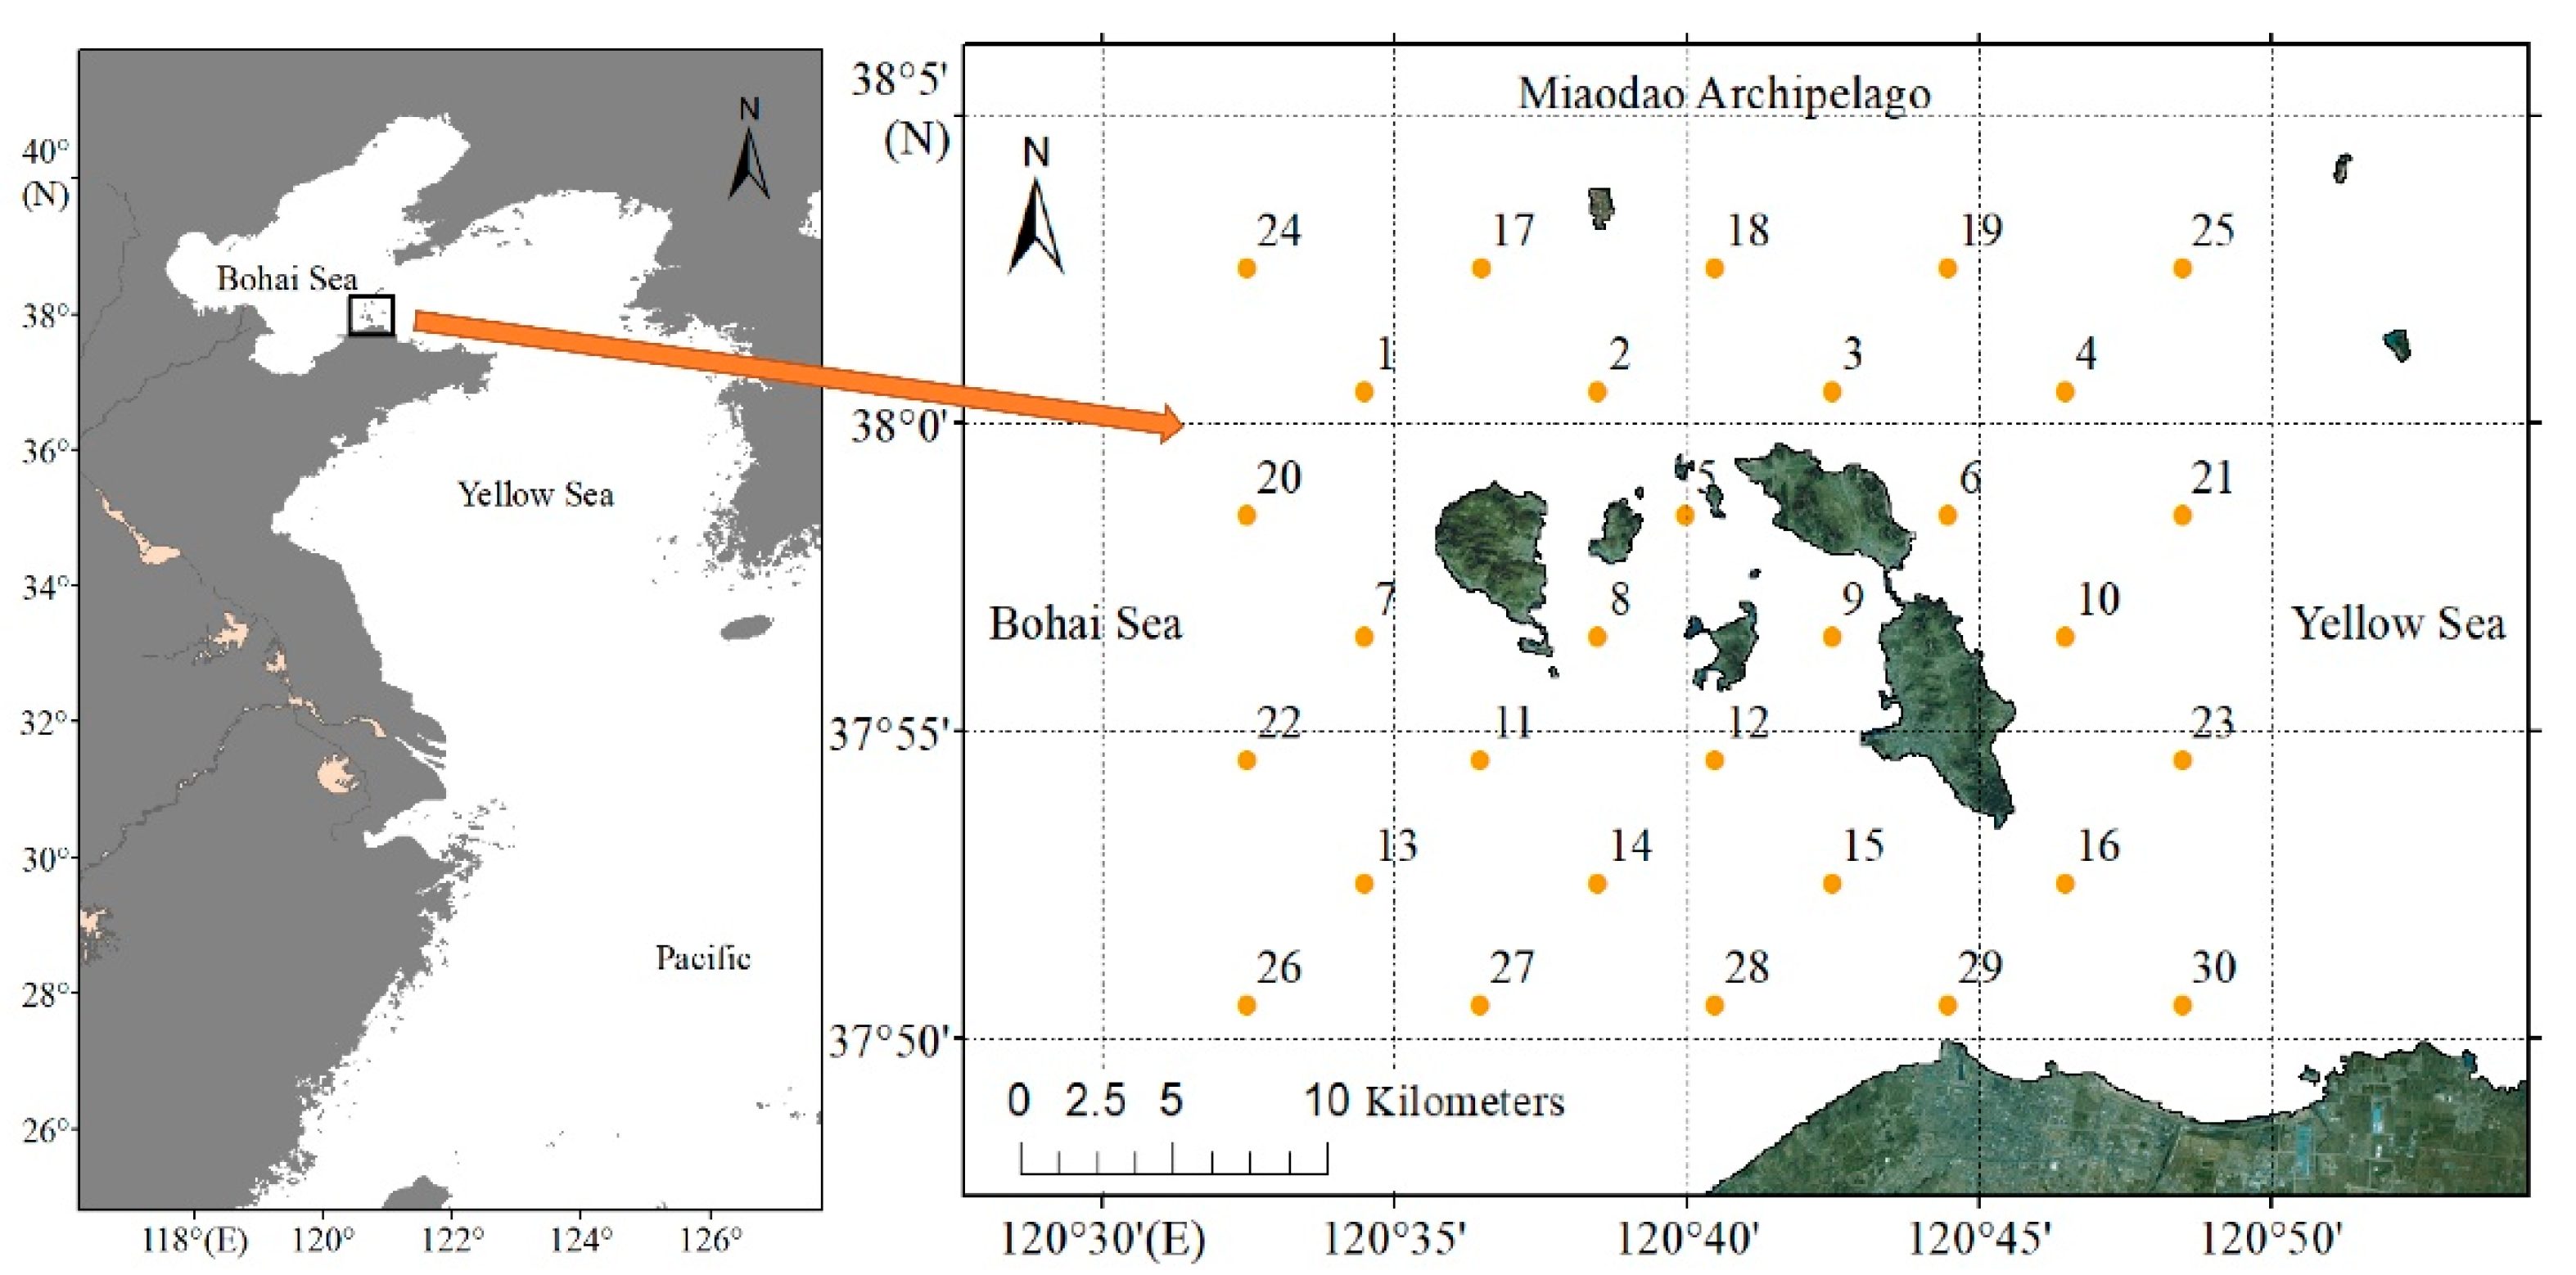
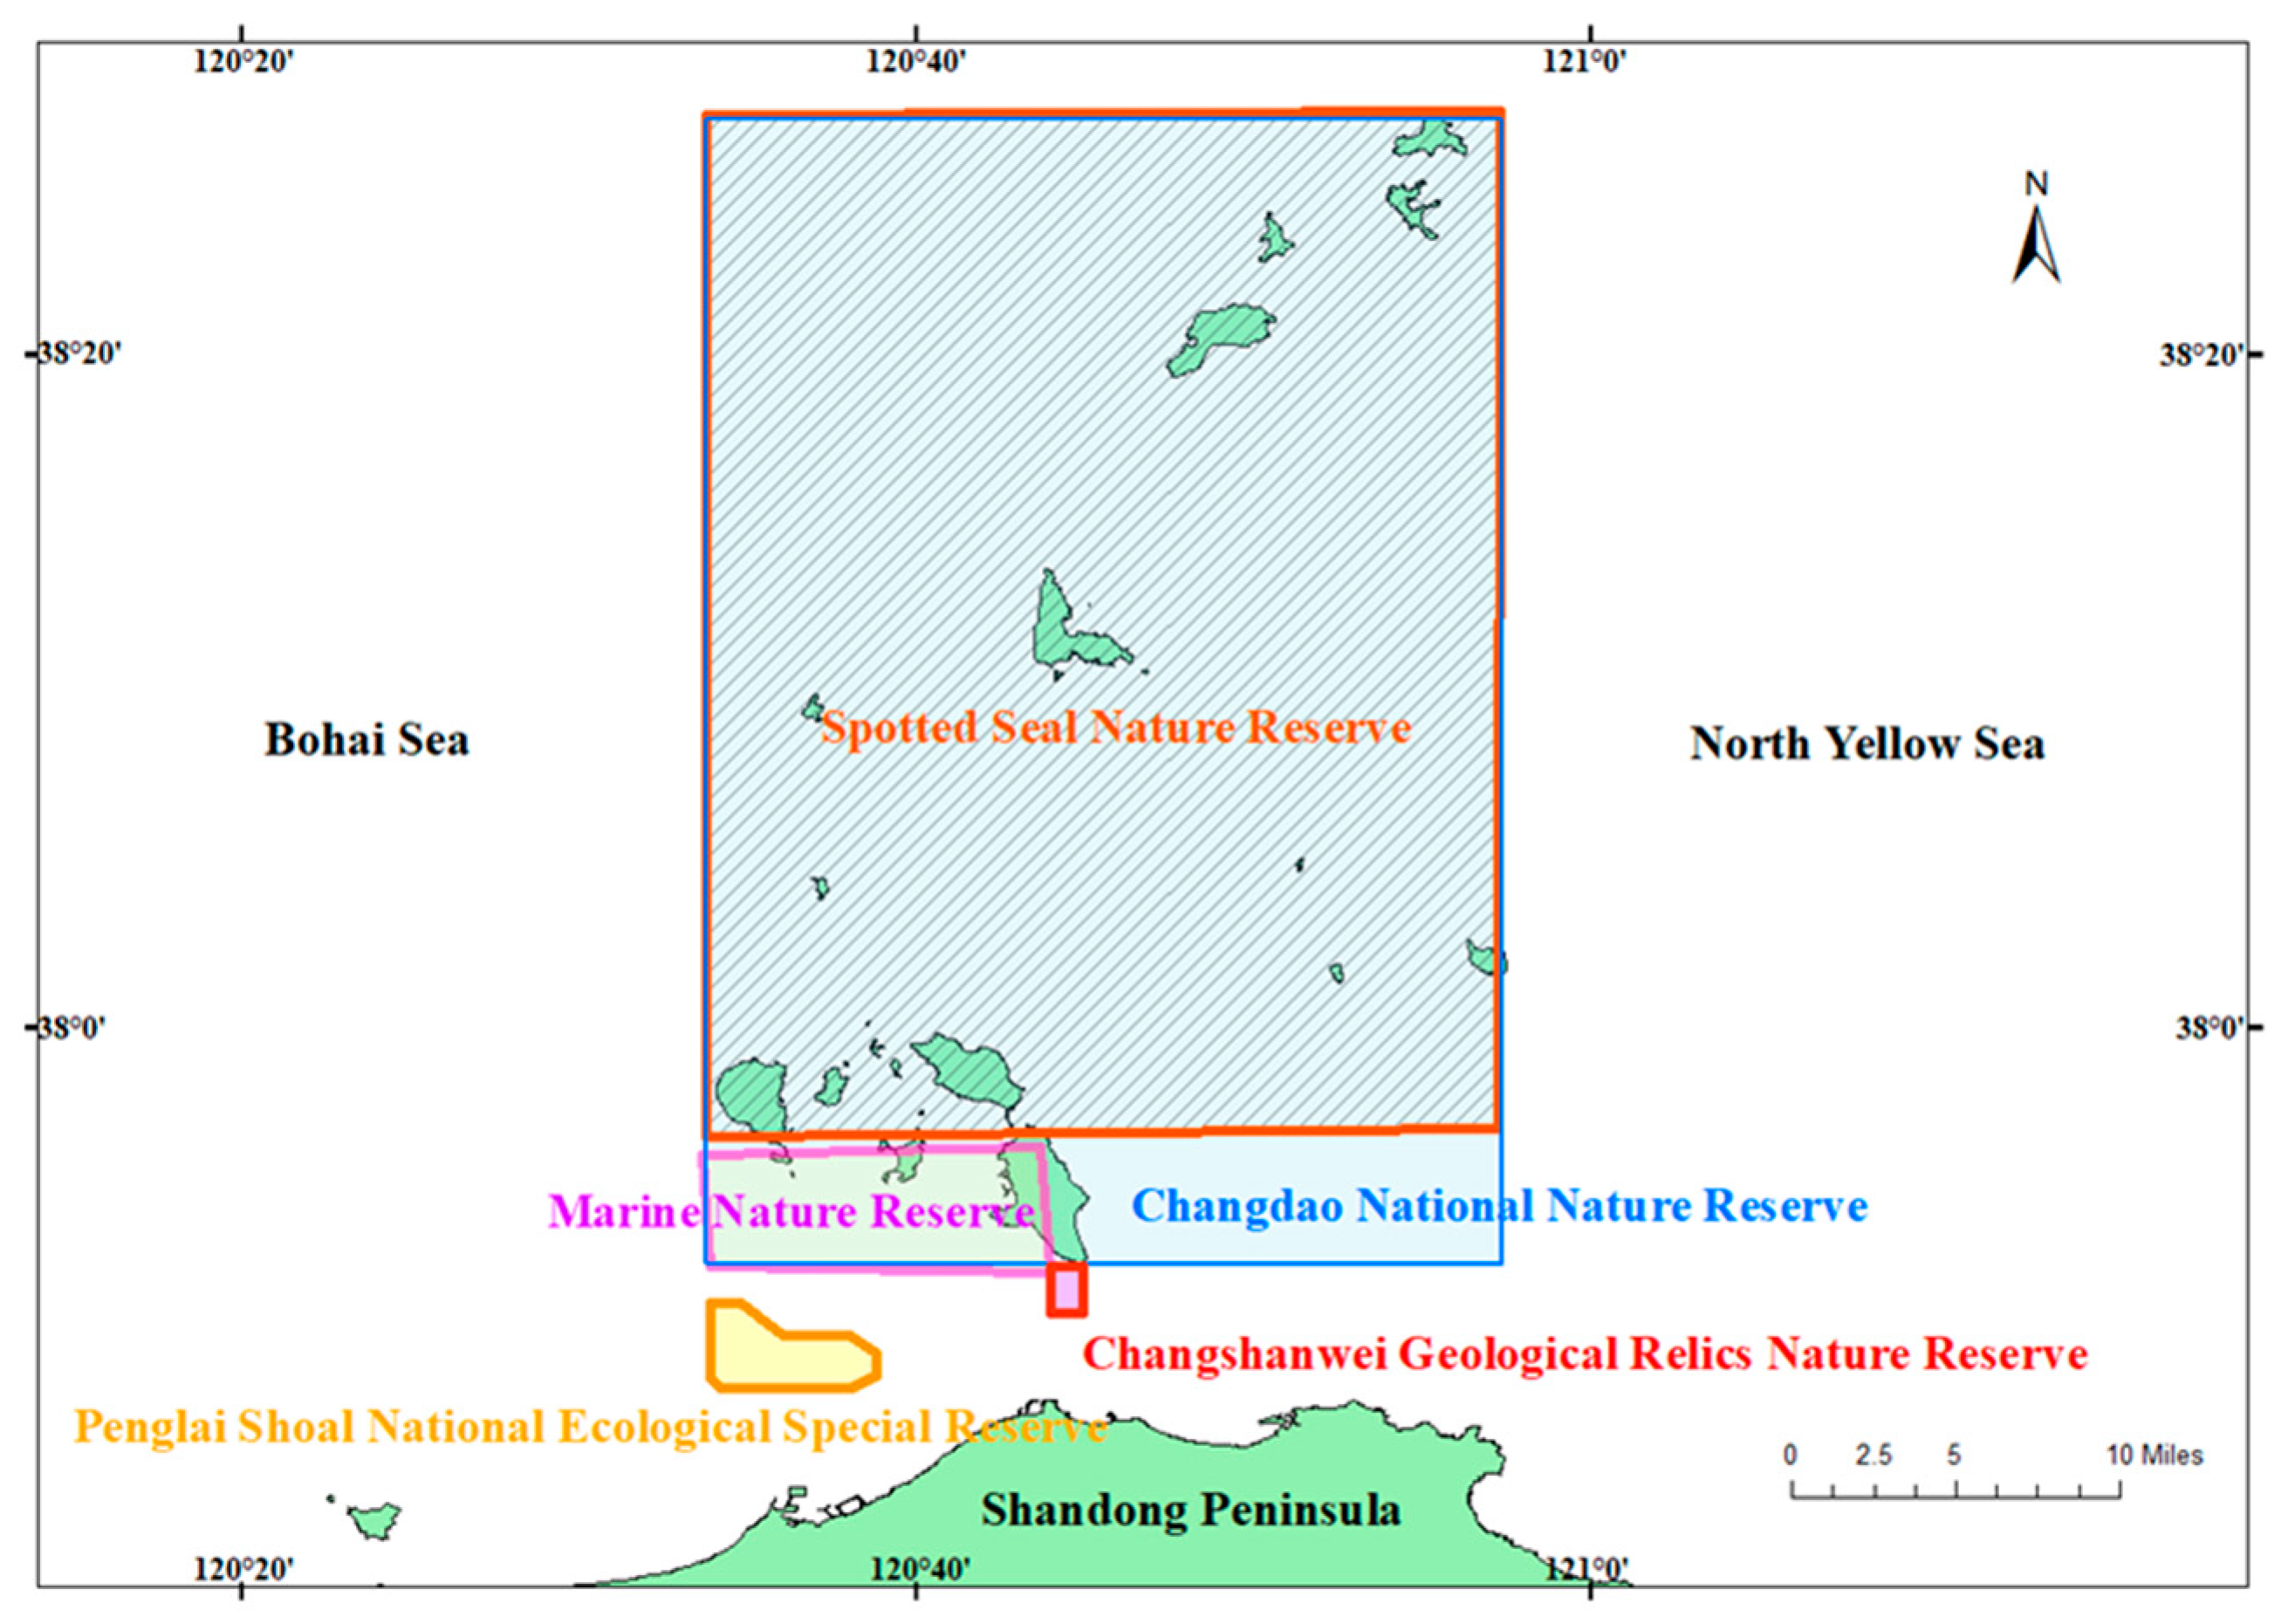
2.1. Study Area and Sampling

The Miaodao Archipelago, located in the Bohai Strait in northern China, is at the intersection of the Bohai Sea and the Yellow Sea [12]. It has a complete ecosystem, including sea areas, an intertidal zone, and island land, and has extremely rich biological resources [13]. The sea area is greatly affected by human activities and has obvious sea–land interaction [14]. Located in the Bohai Strait, Miaodao Archipelago is the feeding habitat and migration channel for many fishes and mammals, such as the West Pacific harbor seal (Phoca vitulina largha), East Asian finless porpoise (Neophocaena asiaeorientalis sunameri), Japanese Spanish mackerel (Scomberomorus niphonius), little yellow croaker (Larimichthys polyactis), silvery pomfret (Pampus argenteus), largehead hairtail (Trichiurus lepturus), and anchovy (Engraulis japonicus), and is also an important distribution area of more than 200 species of shellfish and macroalgae. The Miaodao Archipelago is also an important shellfish and algae farming area and a shipping route to and from land.
In this study, the sea areas adjacent to the Miaodao Archipelago were surveyed in September and November 2020 (Figure 1) at 30 sampling stations. The study site was located at 120.5° E to 120.8° E and 37.8° N to 38.0° N. Field sampling mainly included the collection of sedimentary organic matter (SOM), particulate organic matter (POM), macroalgae, phytoplankton, zooplankton, invertebrates, and fishes. All the samples were collected by a random sampling method.
The sediment was collected with a grab sediment sampler (5L: 305 × 150 × 480 mm), and the SOM samples were collected approximately 1 cm from the surface layer of the sediment [15]. POM samples (2.5 L) were collected from the sea surface layer (0.5 m below the sea surface), and prefiltered through 200 μm mesh sieves to remove large inorganic particles and zooplankton [15]. The prefiltered water samples were then passed through pre-combusted GF/F filters, and heated for 4 h at 450 °C for organic matter removal [16]. Standard small biological nets were used to collect phytoplankton from the bottom to the surface of the water. Mesh sieves (200 μm) were used to remove the zooplankton in the sample, and then the phytoplankton was selected using mesh sieves with particle diameters of 100 and 20 μm. After filtration, the samples were collected on the silk sieve; the sieve was rinsed repeatedly with distilled water, two kinds of granular phytoplankton samples were collected with a pump system and a GF/F glass fiber filter membrane, and the filter membrane was wrapped with tin foil [17]. The zooplankton samples were collected by vertical trawling from the bottom of the water to the water surface using a plankton net and placed in a bucket of filtered seawater; zooplankton stomach contents were drained in a cool place [18]. The zooplankton were divided into 4 particle size fractions with a sieve: >900, 500–900, 300–500, and 100–300 μm. After washing the screens repeatedly with distilled water, the samples of the four kinds of zooplankton were collected with GF/F filter membranes [17]. The filter membranes were wrapped with tin foil and stored in a refrigerator at −20 °C [18]. Due to the limitation of the sampling environment and conditions, macroalgae, aquatic invertebrates, and fish were collected using an Agassiz trawl (net rack: height 0.4 m, length 2.4 m; netting: length 9 m, net mouth height 2.5 m, mesh count 380 buckles). After collection, all samples were cryopreserved at −20 °C and brought back to the laboratory for species identification, body length (mm) and weight (g) measurements, and further stable isotope analysis.

2.2. Stable Isotope Analysis

The macroalgae were washed with distilled water, desalinated, and wrapped in tin foil for use. For the tissue samples, white muscle was collected near the first dorsal fin of fish, and abdominal muscle was collected from shrimp [19]. In large crabs, chelator muscles were taken, and abdominal muscles in smaller crabs. Carcass and wrist muscles were taken in cephalopods. The shell and stomach were removed, and the internal tissues of shellfish were used for stable isotope analysis. For other smaller invertebrates, if there was not enough white muscle tissue, the entire body was used for stable isotope analysis. Before performing δ13C analysis on SOM samples and small crustaceans from whole individuals, the samples were processed to remove the influence of inorganic carbon [20]. These isotope samples were divided into two halves; one half was treated with acid (1 mol/L hydrochloric acid) to remove inorganic carbon for δ13C analysis, and the other half was not acidified directly for δ15N analysis. Phytoplankton and zooplankton are usually ingested indiscriminately by phagocytosis, so we analyzed mixed samples of several species separately. All samples were dried at 60 °C for 48 h until a constant weight was reached. All samples were ground by a ball mill and loaded into a tin boat for stable isotope analysis. The glass fiber filter membrane samples were scraped off the filter membrane samples and loaded into the tin boat for stable isotope analysis [21].
Invertebrate and fish δ13C analysis did not need corrections because the δ13C shifts associated with lipid removal can be greatly variable and taxon-specific [22].
All isotope samples were measured with an elemental analyzer and an isotope ratio mass spectrometer at the Institute of Hydrobiology, Chinese Academy of Sciences, Wuhan. The reference materials for the analysis of carbon (δ13C) and nitrogen (δ15N) isotopes were VPDB (Pee Dee Belemnite) and pure N2 in air, respectively. The international standard materials were IAEA-USGS24 and IAEA-USGS25. Stable isotope ratios are expressed in the standard δ-unit notation (δ13C and δ15N) and are defined by the following equation:
Δ R = [   ( X sample     X standard ) / X standard ]   ×   10 3 ( )
where R stands for 13C or 15N, and X stands for 13C/12C or 15N/14N. The analytical precision of the carbon and nitrogen isotopic values was better than 0.1‰ and 0.2‰, respectively.
Through meta-analysis, Hussey (2014) established an empirical linear relationship between experimental Δ15N and the value of δ15N in prey consumed [23]. Research shows that with increasing trophic level (TL), consumers’ Δ15N process shows a decreasing trend. Hence, the constants (Δ15N = 3.4‰) were not subsequently considered in the contribution analysis, and a scaled Δ15N trophic framework was employed instead using the following equations:
Δ 15 N =   5.92     0.27 p
where p represents the value of δ15N for consumers.
According to the scaled trophic framework proposed by Hussey et al. (2014) based on experimental data, β0 = 5.92 [4.55, 7.33], β1 = −0.27 [−0.41, −0.14] [23]. The 95% highest posterior median (HPM) uncertainty intervals for the intercept (β0) and slope (β1) coefficients were [4.55, 7.33] and [−0.41, −0.14], respectively [24]. In addition, the following equations were used to calculate the trophic level (TL) of the consumers:
TL = log ( δ 15 N lim   δ 15 N base ) log ( δ 15 N lim   δ 15 N TL ) k +   TL base
Calculating a trophic level (TL) from this model requires Δ15Nlim and k values to be obtained from a meta-analysis:
k = log ( β 0 δ 15 N lim k ) δ 15 N lim = β 0 β 1
δ 15 N lim   =   β 0 β 1
where δ15Nlim is the saturating δ15N limit as TL increases, δ15Nbase is the δ15N value of the baseline, δ15NTL is the δ15N value of the consumer, k is the rate at which δ15N approaches δ15Nlim per TL, and TLbase is the baseline TL.
The trophic discrimination factors (TDFs) of ∆δ15N (3.24 ± 0.62) and ∆δ13C (0.4 ± 1.30) were selected as the default data and derived by averaging TDFs across all species from the major taxonomic groups [20].
The determination of the baseline is the key to the study of marine ecosystems using stable isotope technology. The sea depth of the waters adjacent to the Miaodao Archipelago is generally less than 20 meters, and thus belongs to the shallow sea ecosystem. Shallow sea ecosystems have high primary productivity due to abundant sunlight, continental runoff, and human activities, and are rich in zooplankton. Thus, the baseline of readily available zooplankton can be selected.

2.3. Statistical Analysis

The sampling site figures were constructed with ArcGIS (version 10.2, Esri Inc., RedLands, CA, USA). Stable Isotope Mixing Models in R (R 4.1.2) with the simmr package was used to estimate the contribution of multiple sources to each consumer species. Simmr is a package designed to solve mixing equations for stable isotopic data within a Bayesian framework [25,26]. In order to compare the niche relationships among different feeding function groups, the study used SIBER to calculate the niche repeatability of consumers [27]. All statistical analyses and data visualization were performed using R 4.1.2, Adobe Illustrator 2021, and Origin 2021 (OriginLab Corp., Northampton, MA, USA). PERMANOVA was used to examine potential differences for the two aspects as: (i) the δ13C and δ15N values of primary food resources, aquatic invertebrates, and fish; and (ii) trophic positions of aquatic consumers at three different reaches.

3. Results

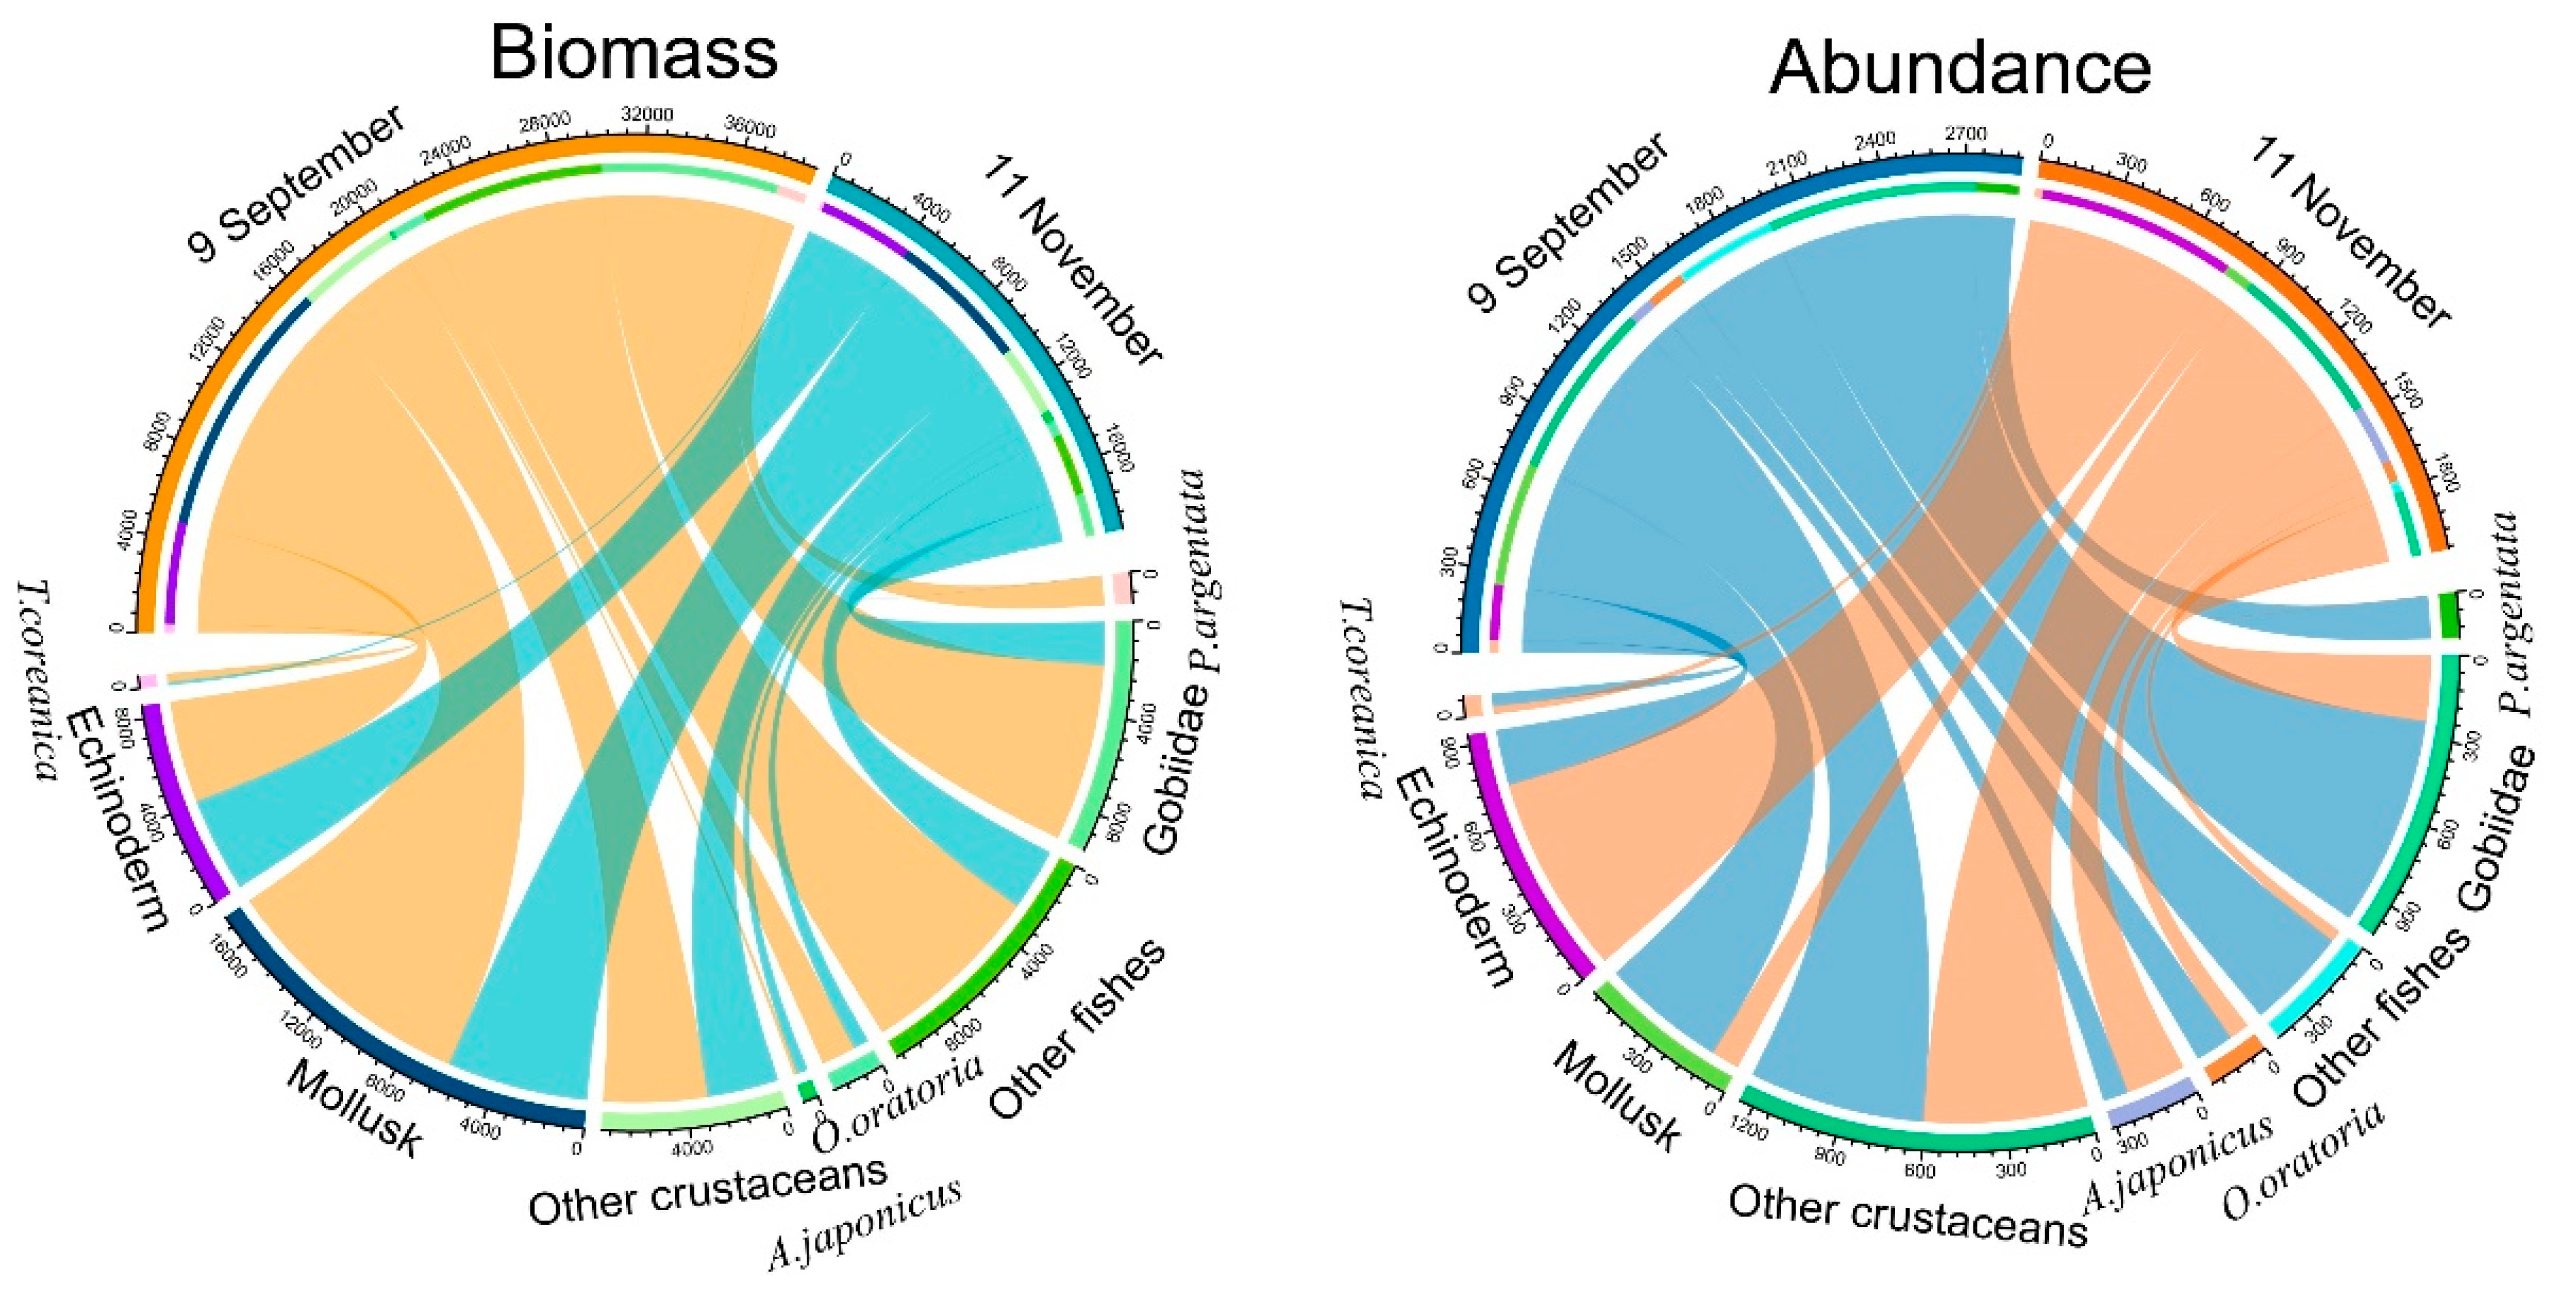
3.1. Fishery Resources
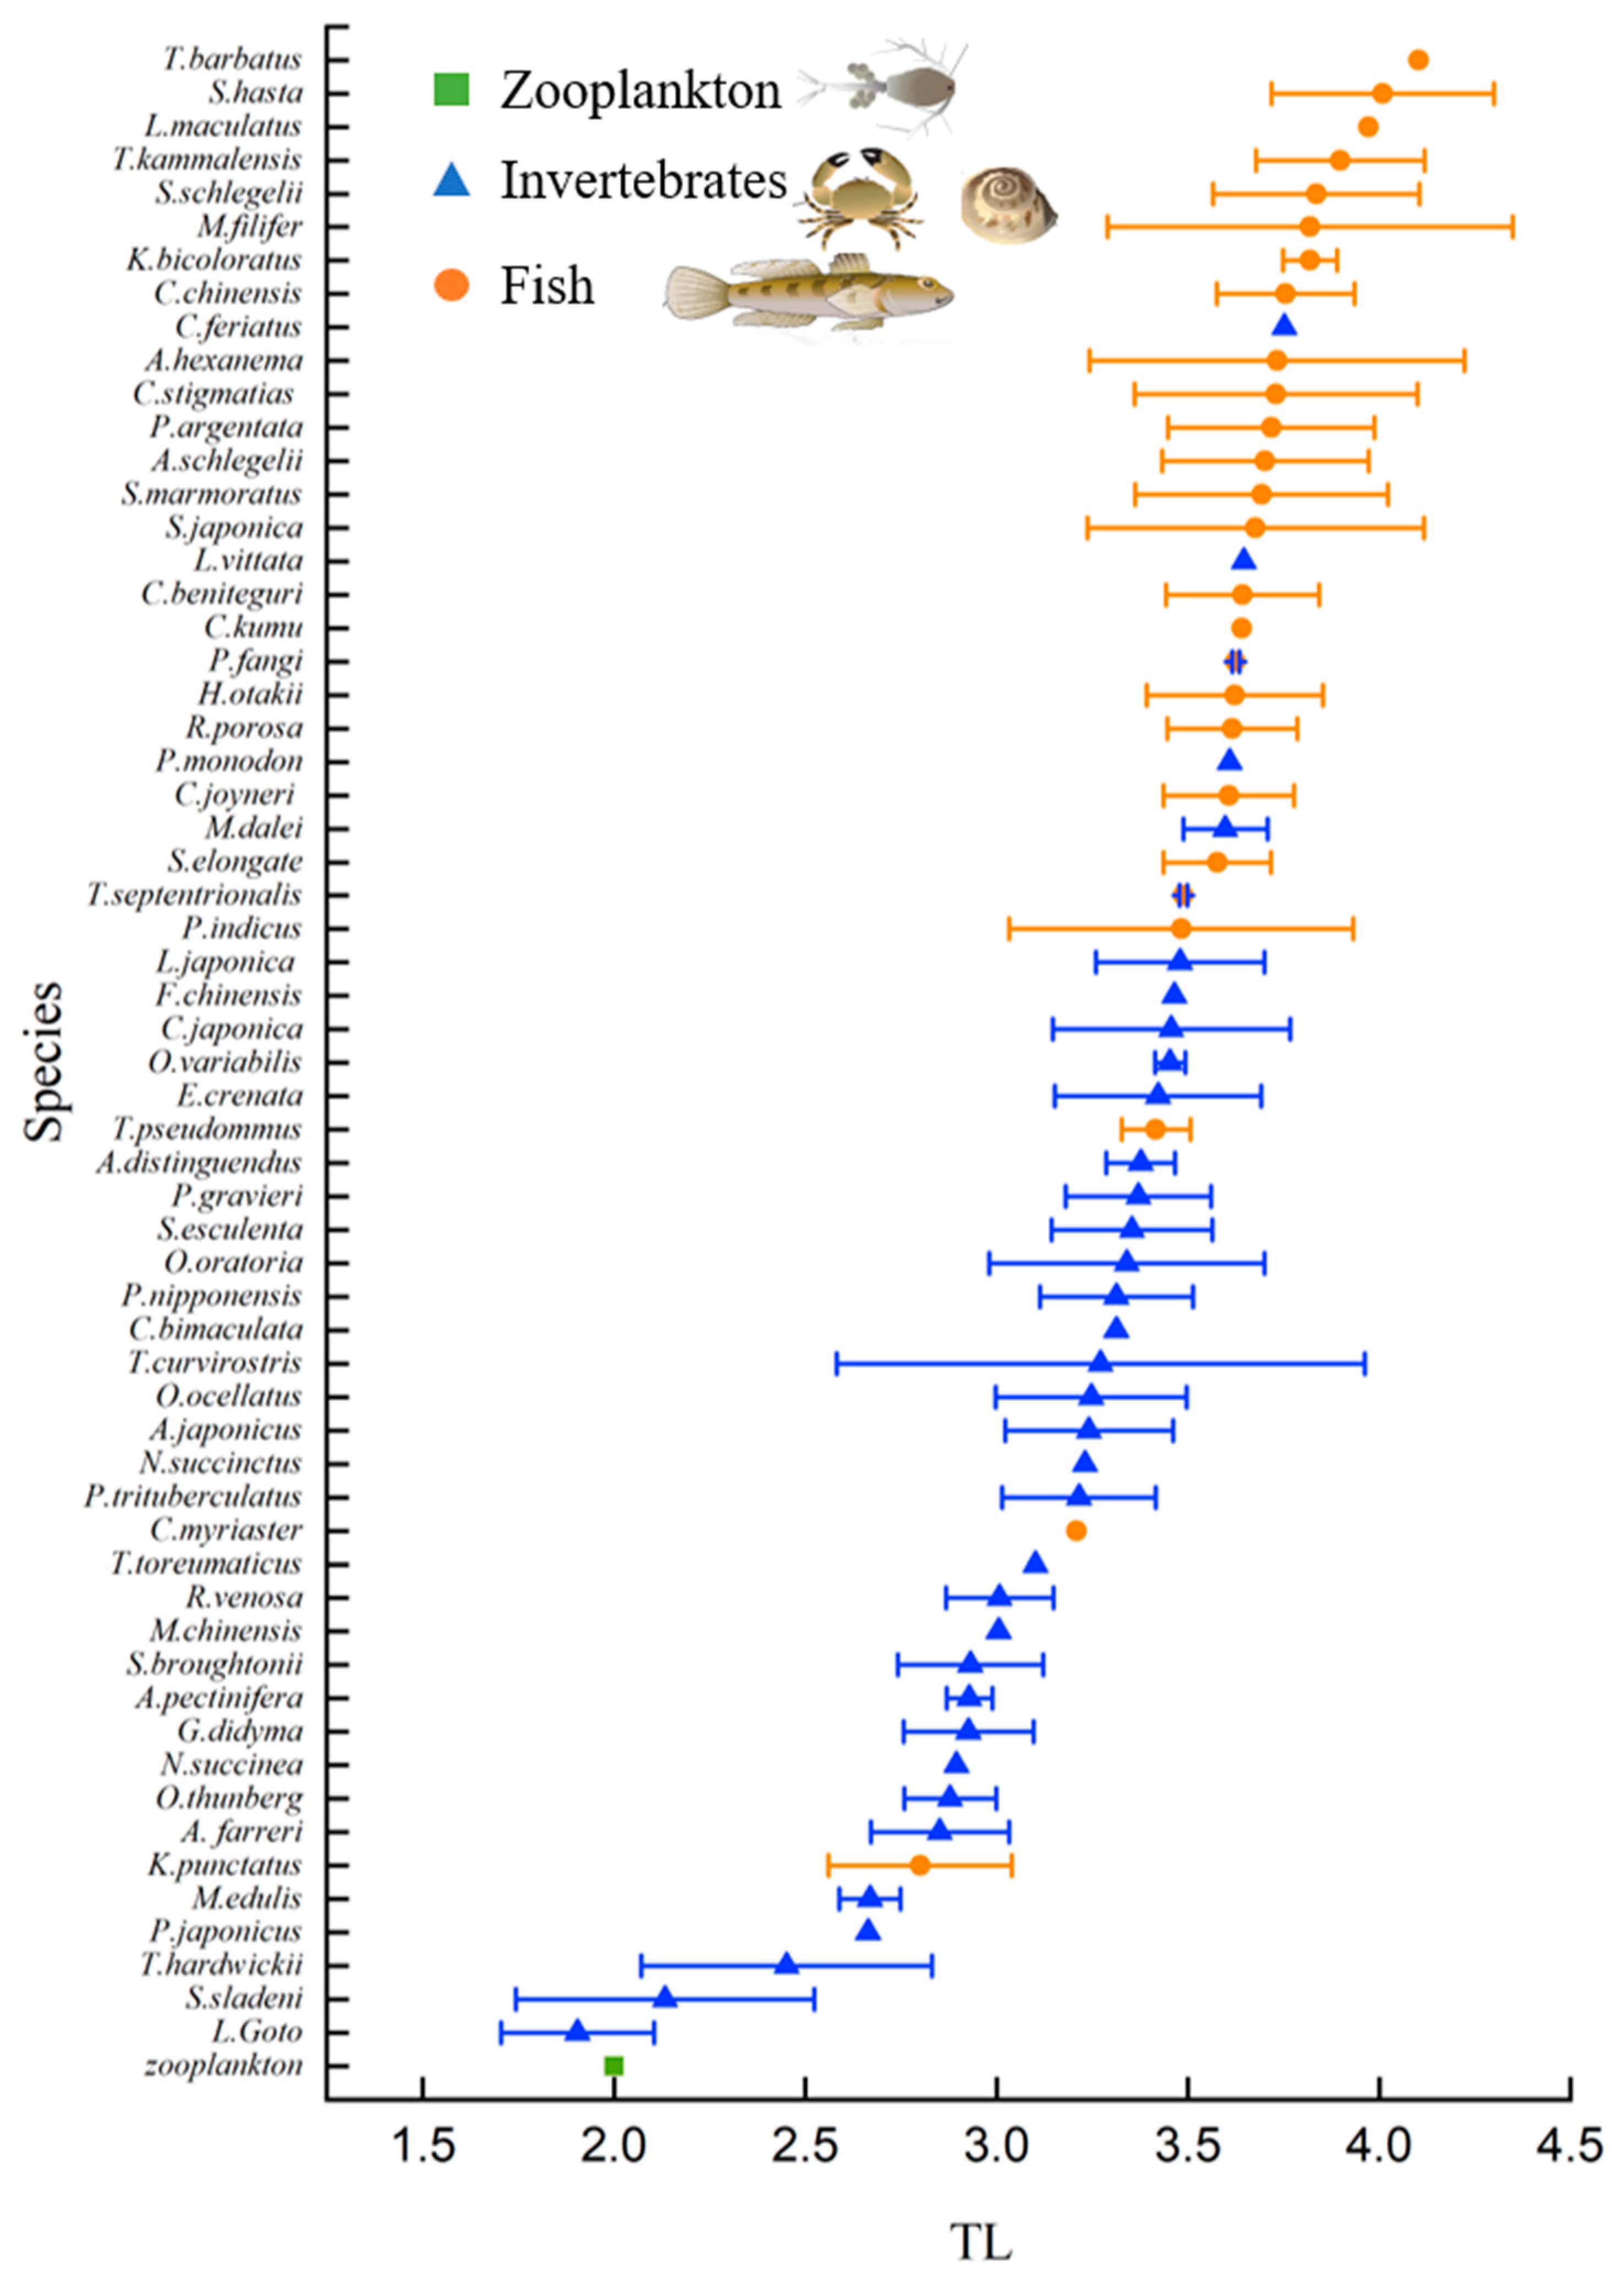
A total of 60 species of organisms were collected in this survey of the sea adjacent to the Miaodao Archipelago, most of which are benthic organisms, with 34 species of invertebrates and 26 species of fish. Fish accounted for 37.11% of all samples, shrimp accounted for 9.64%, crabs accounted for 12.63%, cephalopods accounted for 12.79%, and other species accounted for 27.83%.
The bottom fisheries community structure in September and November 2021 is shown in Figure 2. The main bottom-floor fishery resources consist of silver croaker (Pennahia argentata), Gobiidae, other fishes, squilla oratoria (Oratosquilla oratoria), Alpheus japonicus, other crustaceans, mollusks, echinoderms, and Terebratella coreanica. The biomass and abundance in September were higher than those in November. Mollusks account for most of the biomass, and other crustaceans account for the most abundance. Gobiidae are the main group of fish.
Consumers are mainly divided into aquatic invertebrates and fish. Among them, fishes are classified into omnivores, benthivores, and piscivores according to their feeding habits [28,29,30]. There were 26 species of fish consumers, and the dietary division is shown in Table 1. There were six kinds of omnivores, 16 kinds of benthivores, and four kinds of piscivores. The fish consumers were mainly benthivores.
In this study, the δ13C values of the adjacent marine communities in the Miaodao Archipelago ranged from −26.54‰ to −14.68‰, including the main basic carbon sources (primary producers) and consumers. For δ15N, the values ranged from 0.38‰ to 14.54‰ across all sampling sites. Primary producers mainly include phytoplankton, macroalgae, POM, and SOM, with δ13C values ranging from −26.54‰ to −16.92‰, with a wide distribution range. The range of δ15N is 0.38‰ to 8.58‰. The results of the permutation test (PERMANOVA) showed that there were significant differences in the carbon and nitrogen isotope ratios among various carbon sources (p < 0.05). Values of δ13C and δ15N for the potential carbon sources and consumers are shown in Table 2. There were significant differences in the δ13C and δ15N values of the invertebrates and fishes (PERMANOVA, p < 0.05). δ15N values are presented in a specific order: basic carbon sources < invertebrates < fishes.
The benthic food web structure (basal carbon sources and consumers) in the sea adjacent to the Miaodao Archipelago represented by stable isotopes is shown in Figure 3. This shows the stable isotope biplot (δ13C and δ15N ‰, mean ± SD) of basic carbon sources (primary producers), invertebrates, and fishes. The X-axis in Figure 3 reflects the main carbon sources in the food web [27]. These carbon sources show significant differences between marine and terrestrial areas (isotopic marine-terrestrial expected patterns) and significant differences between C3 plants and C4 plants (isotopic C3-C4 plant expected patterns) [31,32].

3.2. Trophic Level

The trophic level analysis showed that the trophic levels of the main consumers in the waters of the Miaodao Archipelago ranged from 1.90 (±0.2) to 4.10 (Figure 4), with a mean value of 3.34 (±0.23). The trophic levels of invertebrates ranged from 1.90 (±0.2) to 3.65, with a mean of 3.11 (±0.22). The trophic levels of fishes ranged from 2.80 (±0.24) to 4.10, with a mean of 3.66 (±0.24). Due to the fractionation effect, the δ15N values and trophic levels appeared in a specific order: zooplankton < invertebrates < fishes (PERMANOVA, p < 0.05).

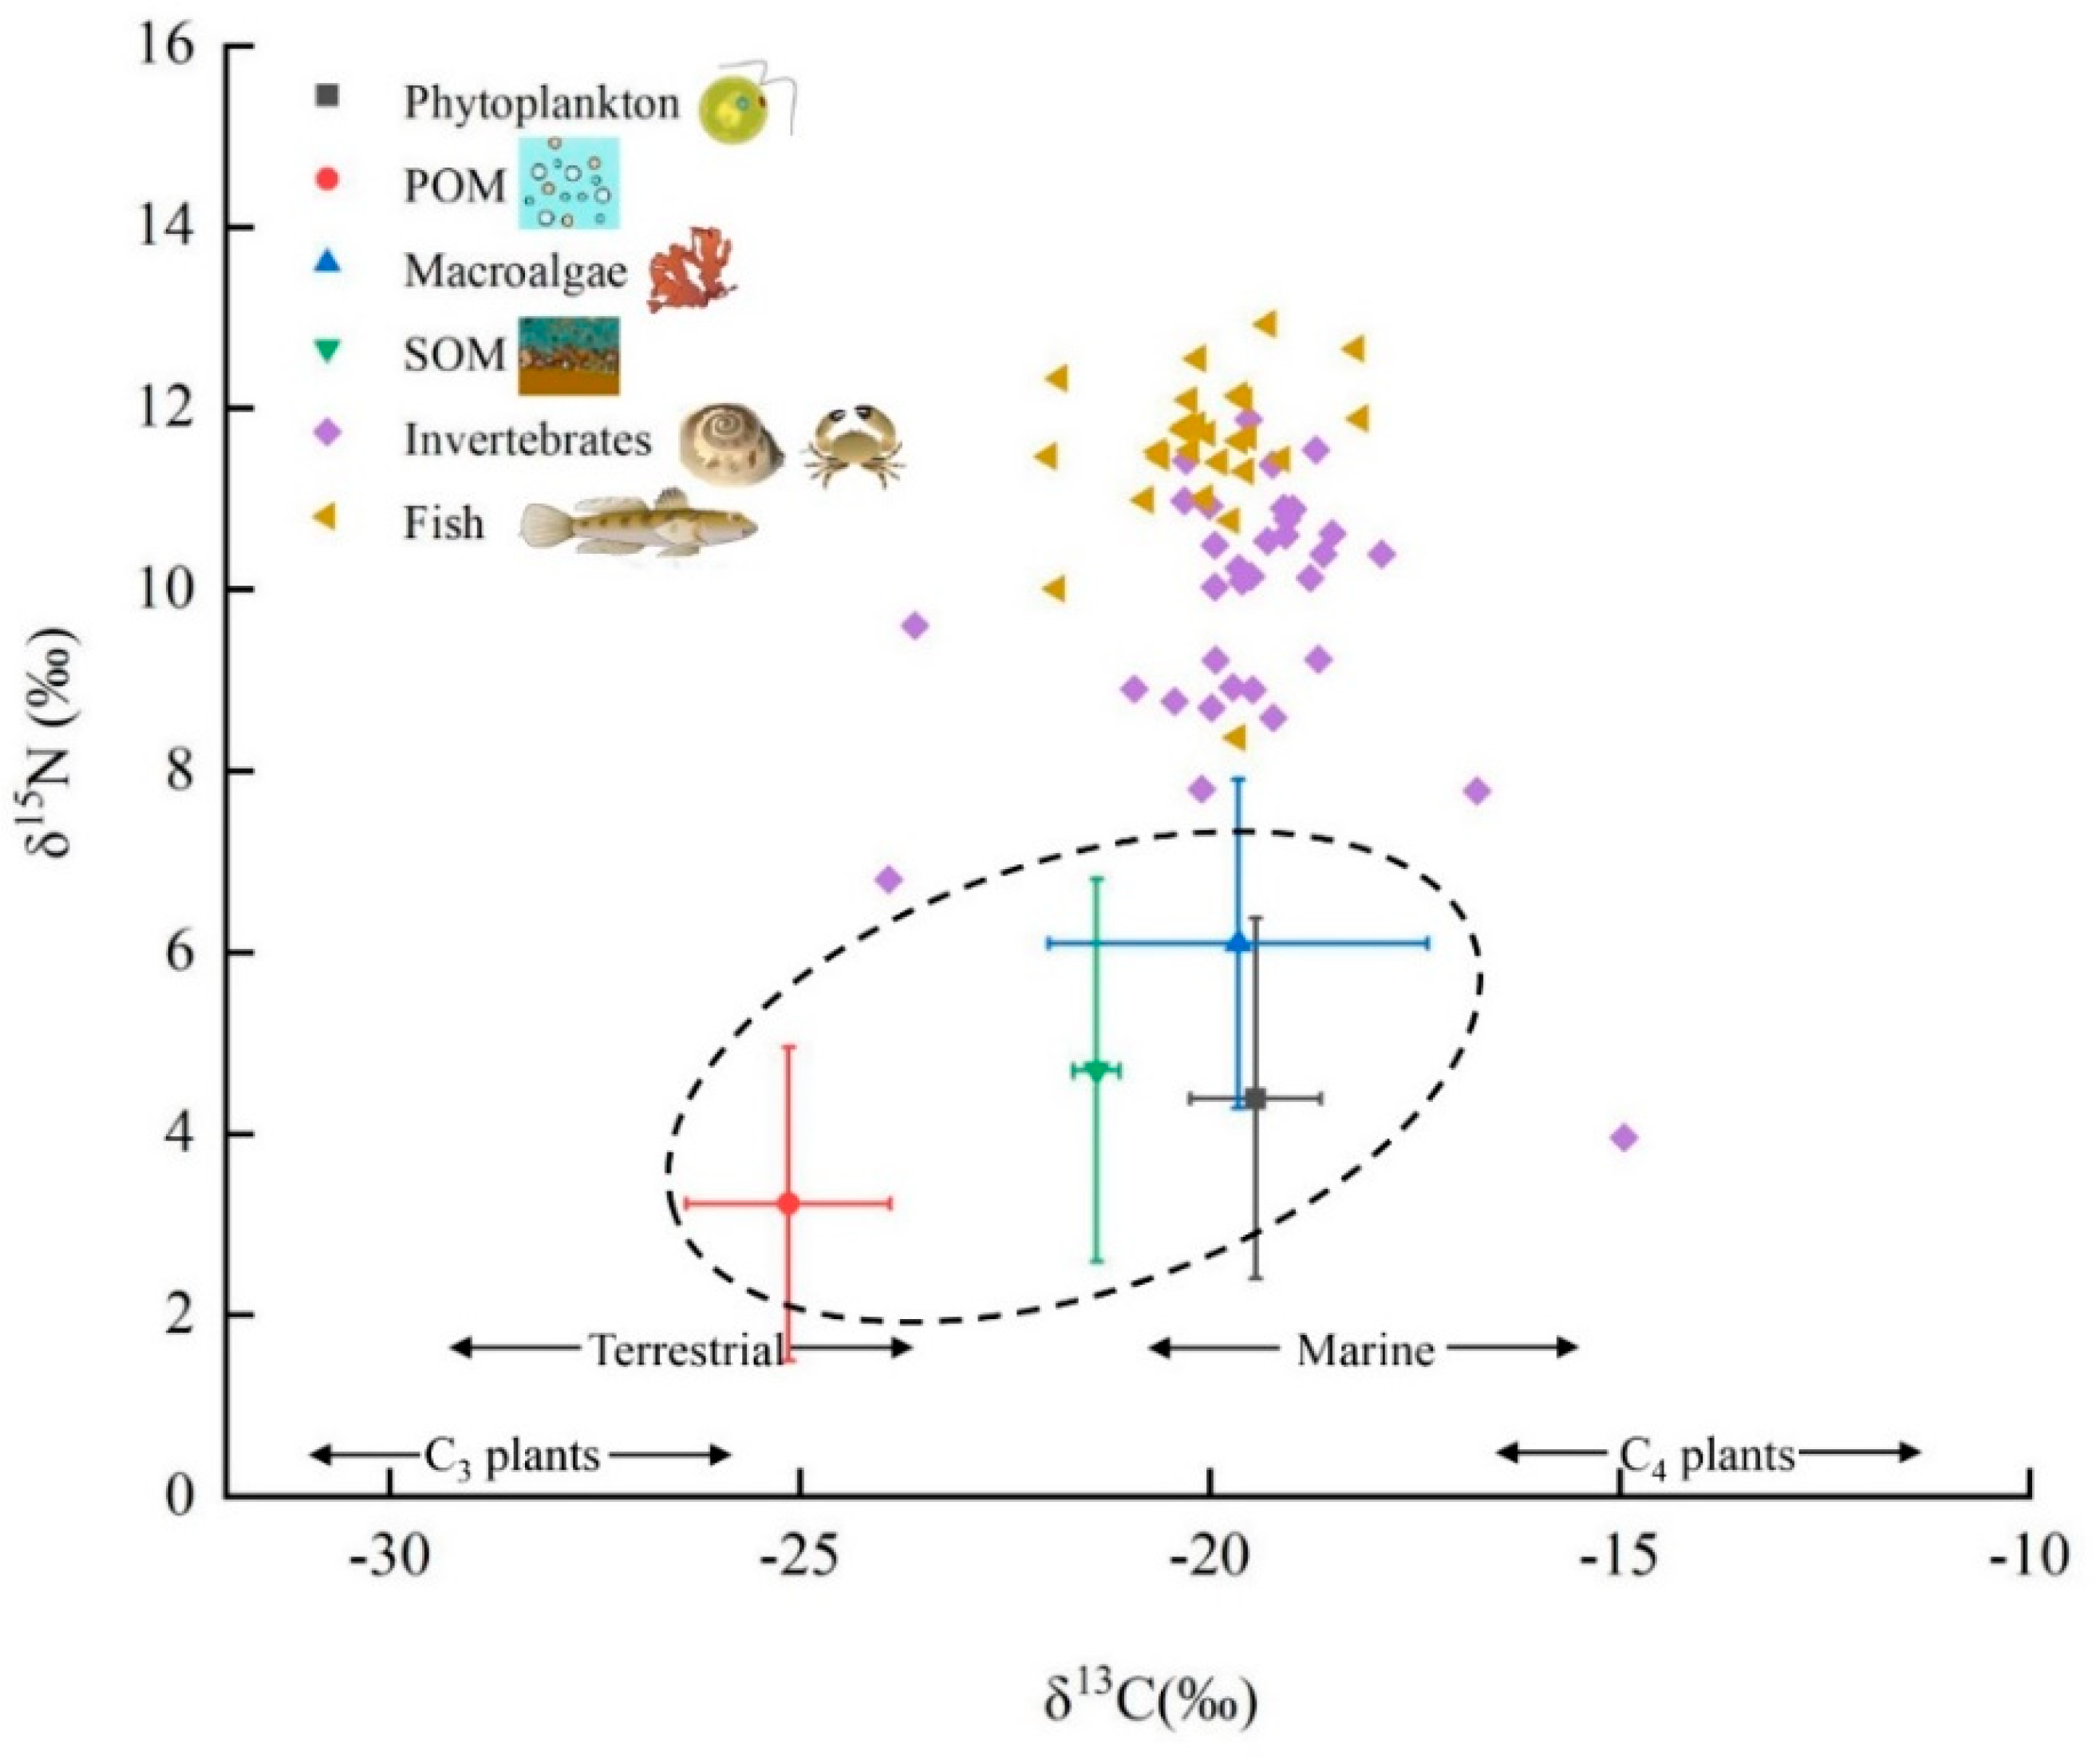
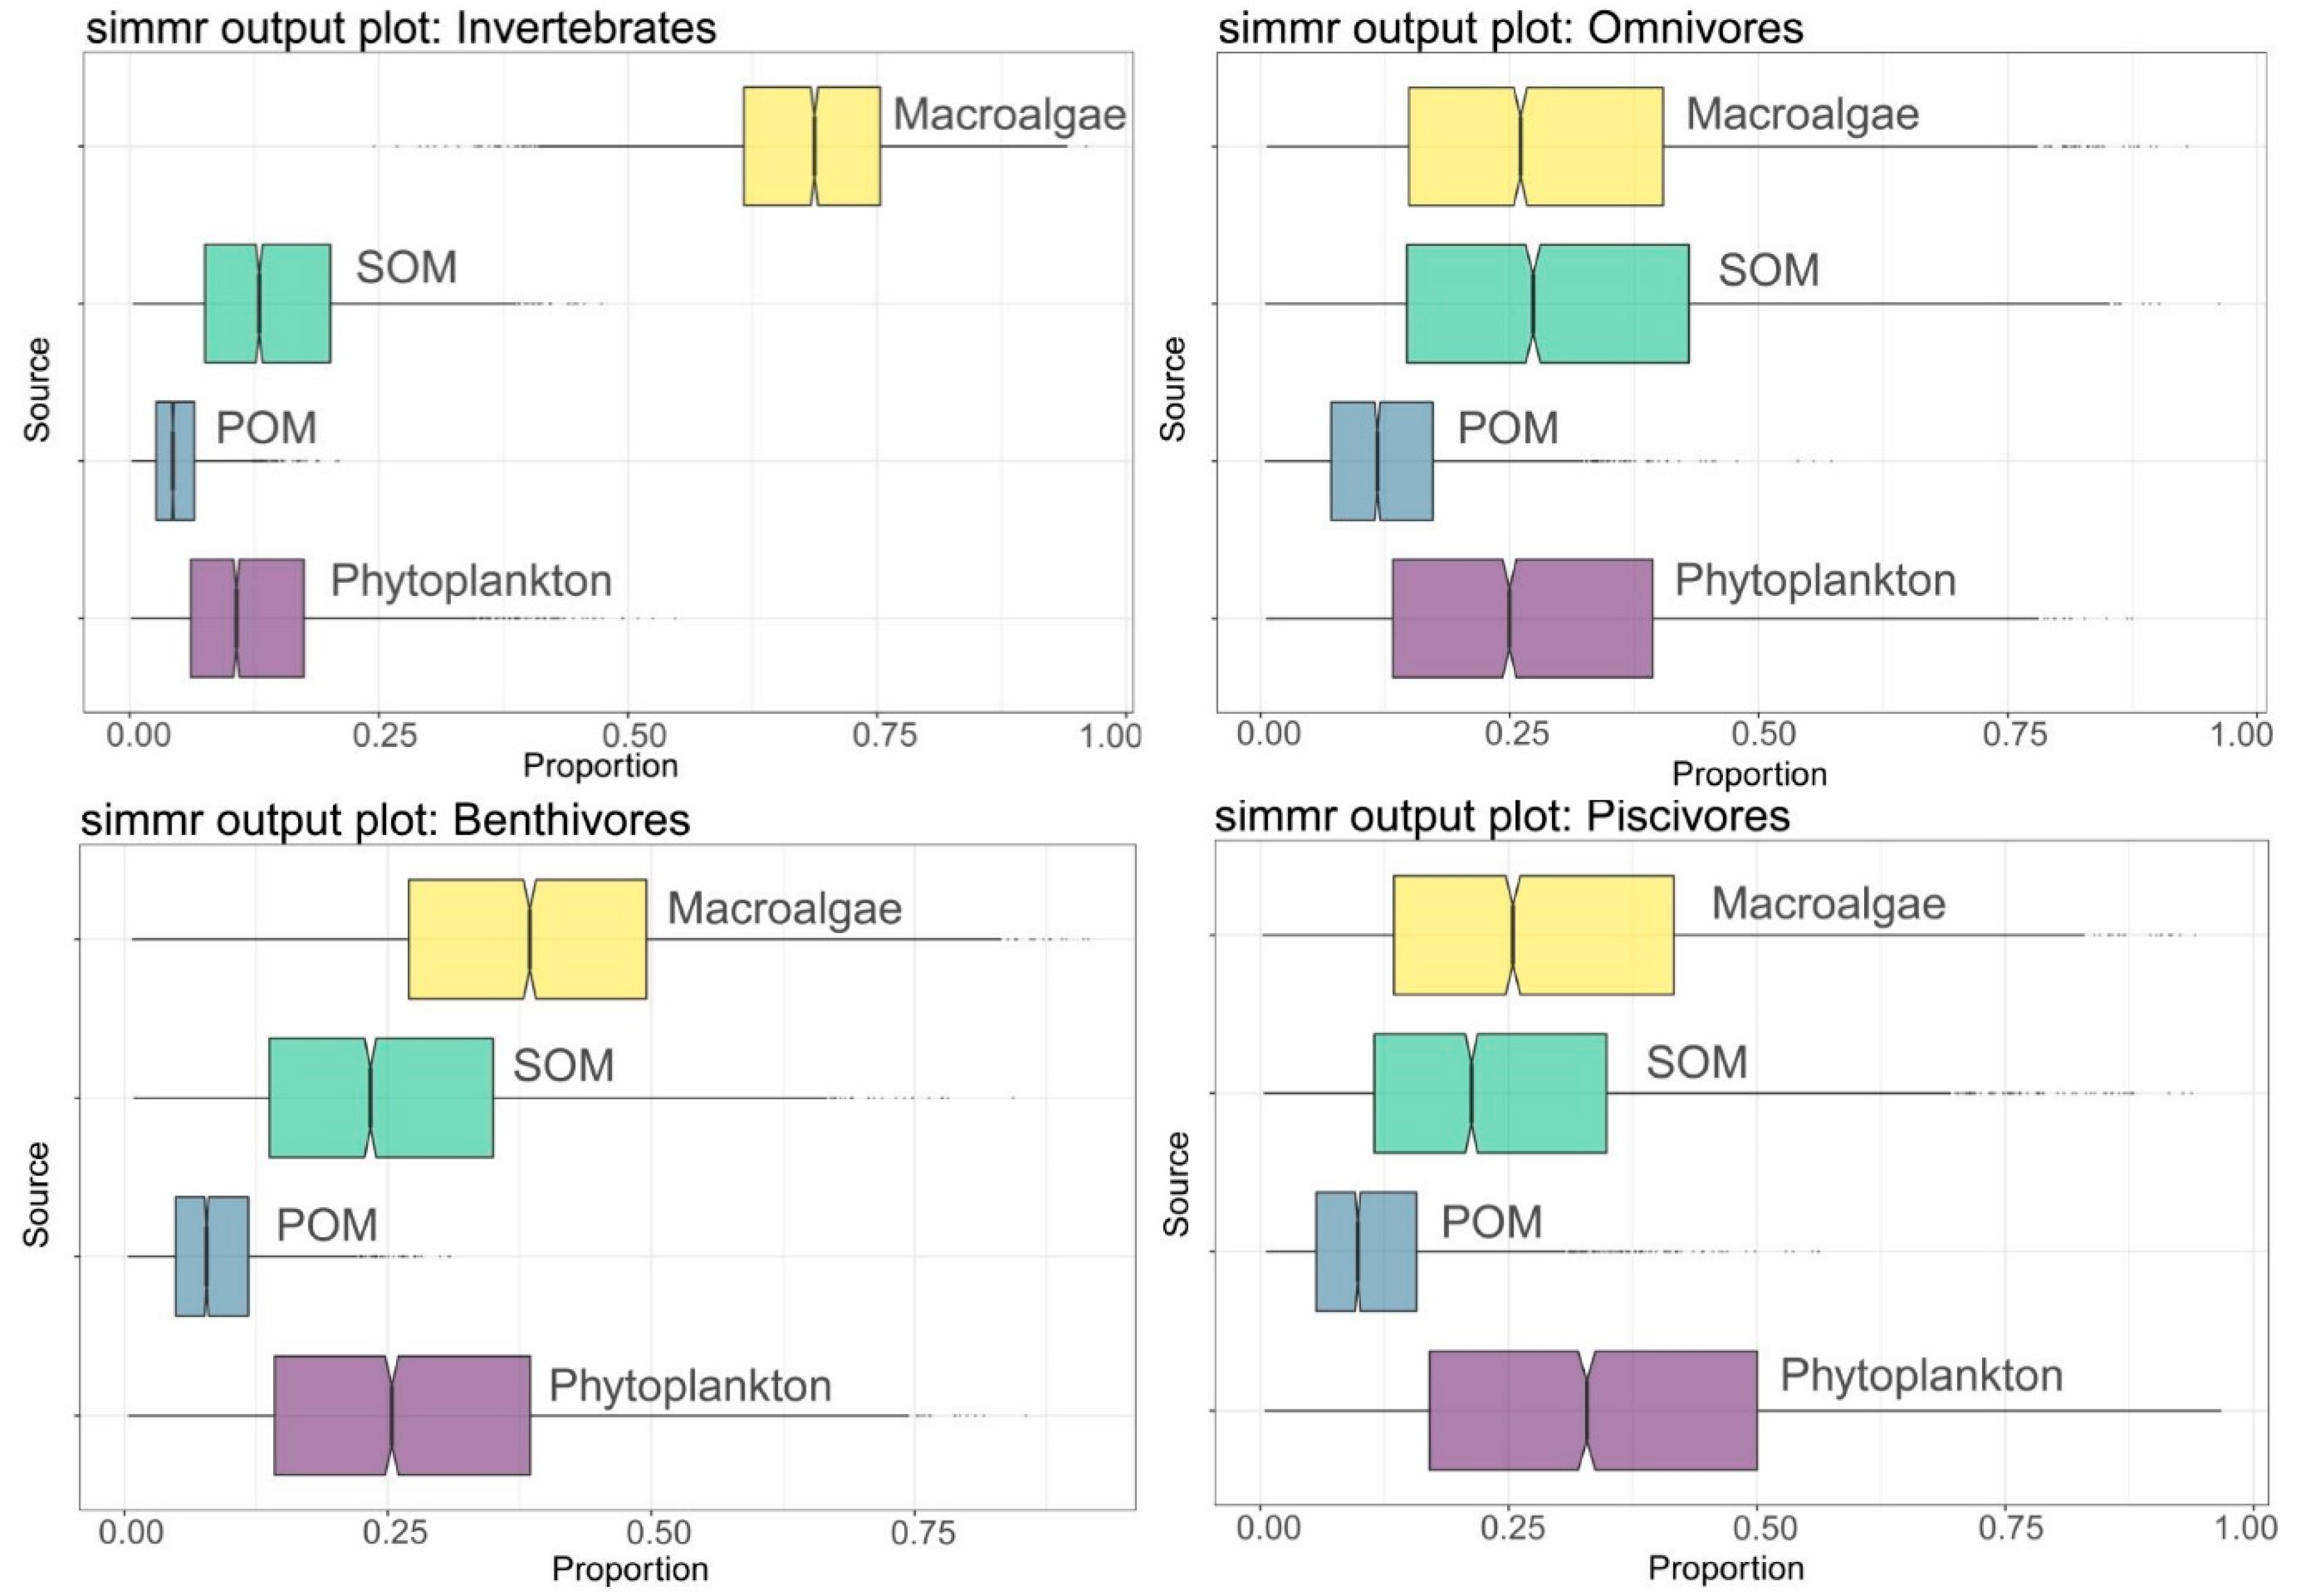
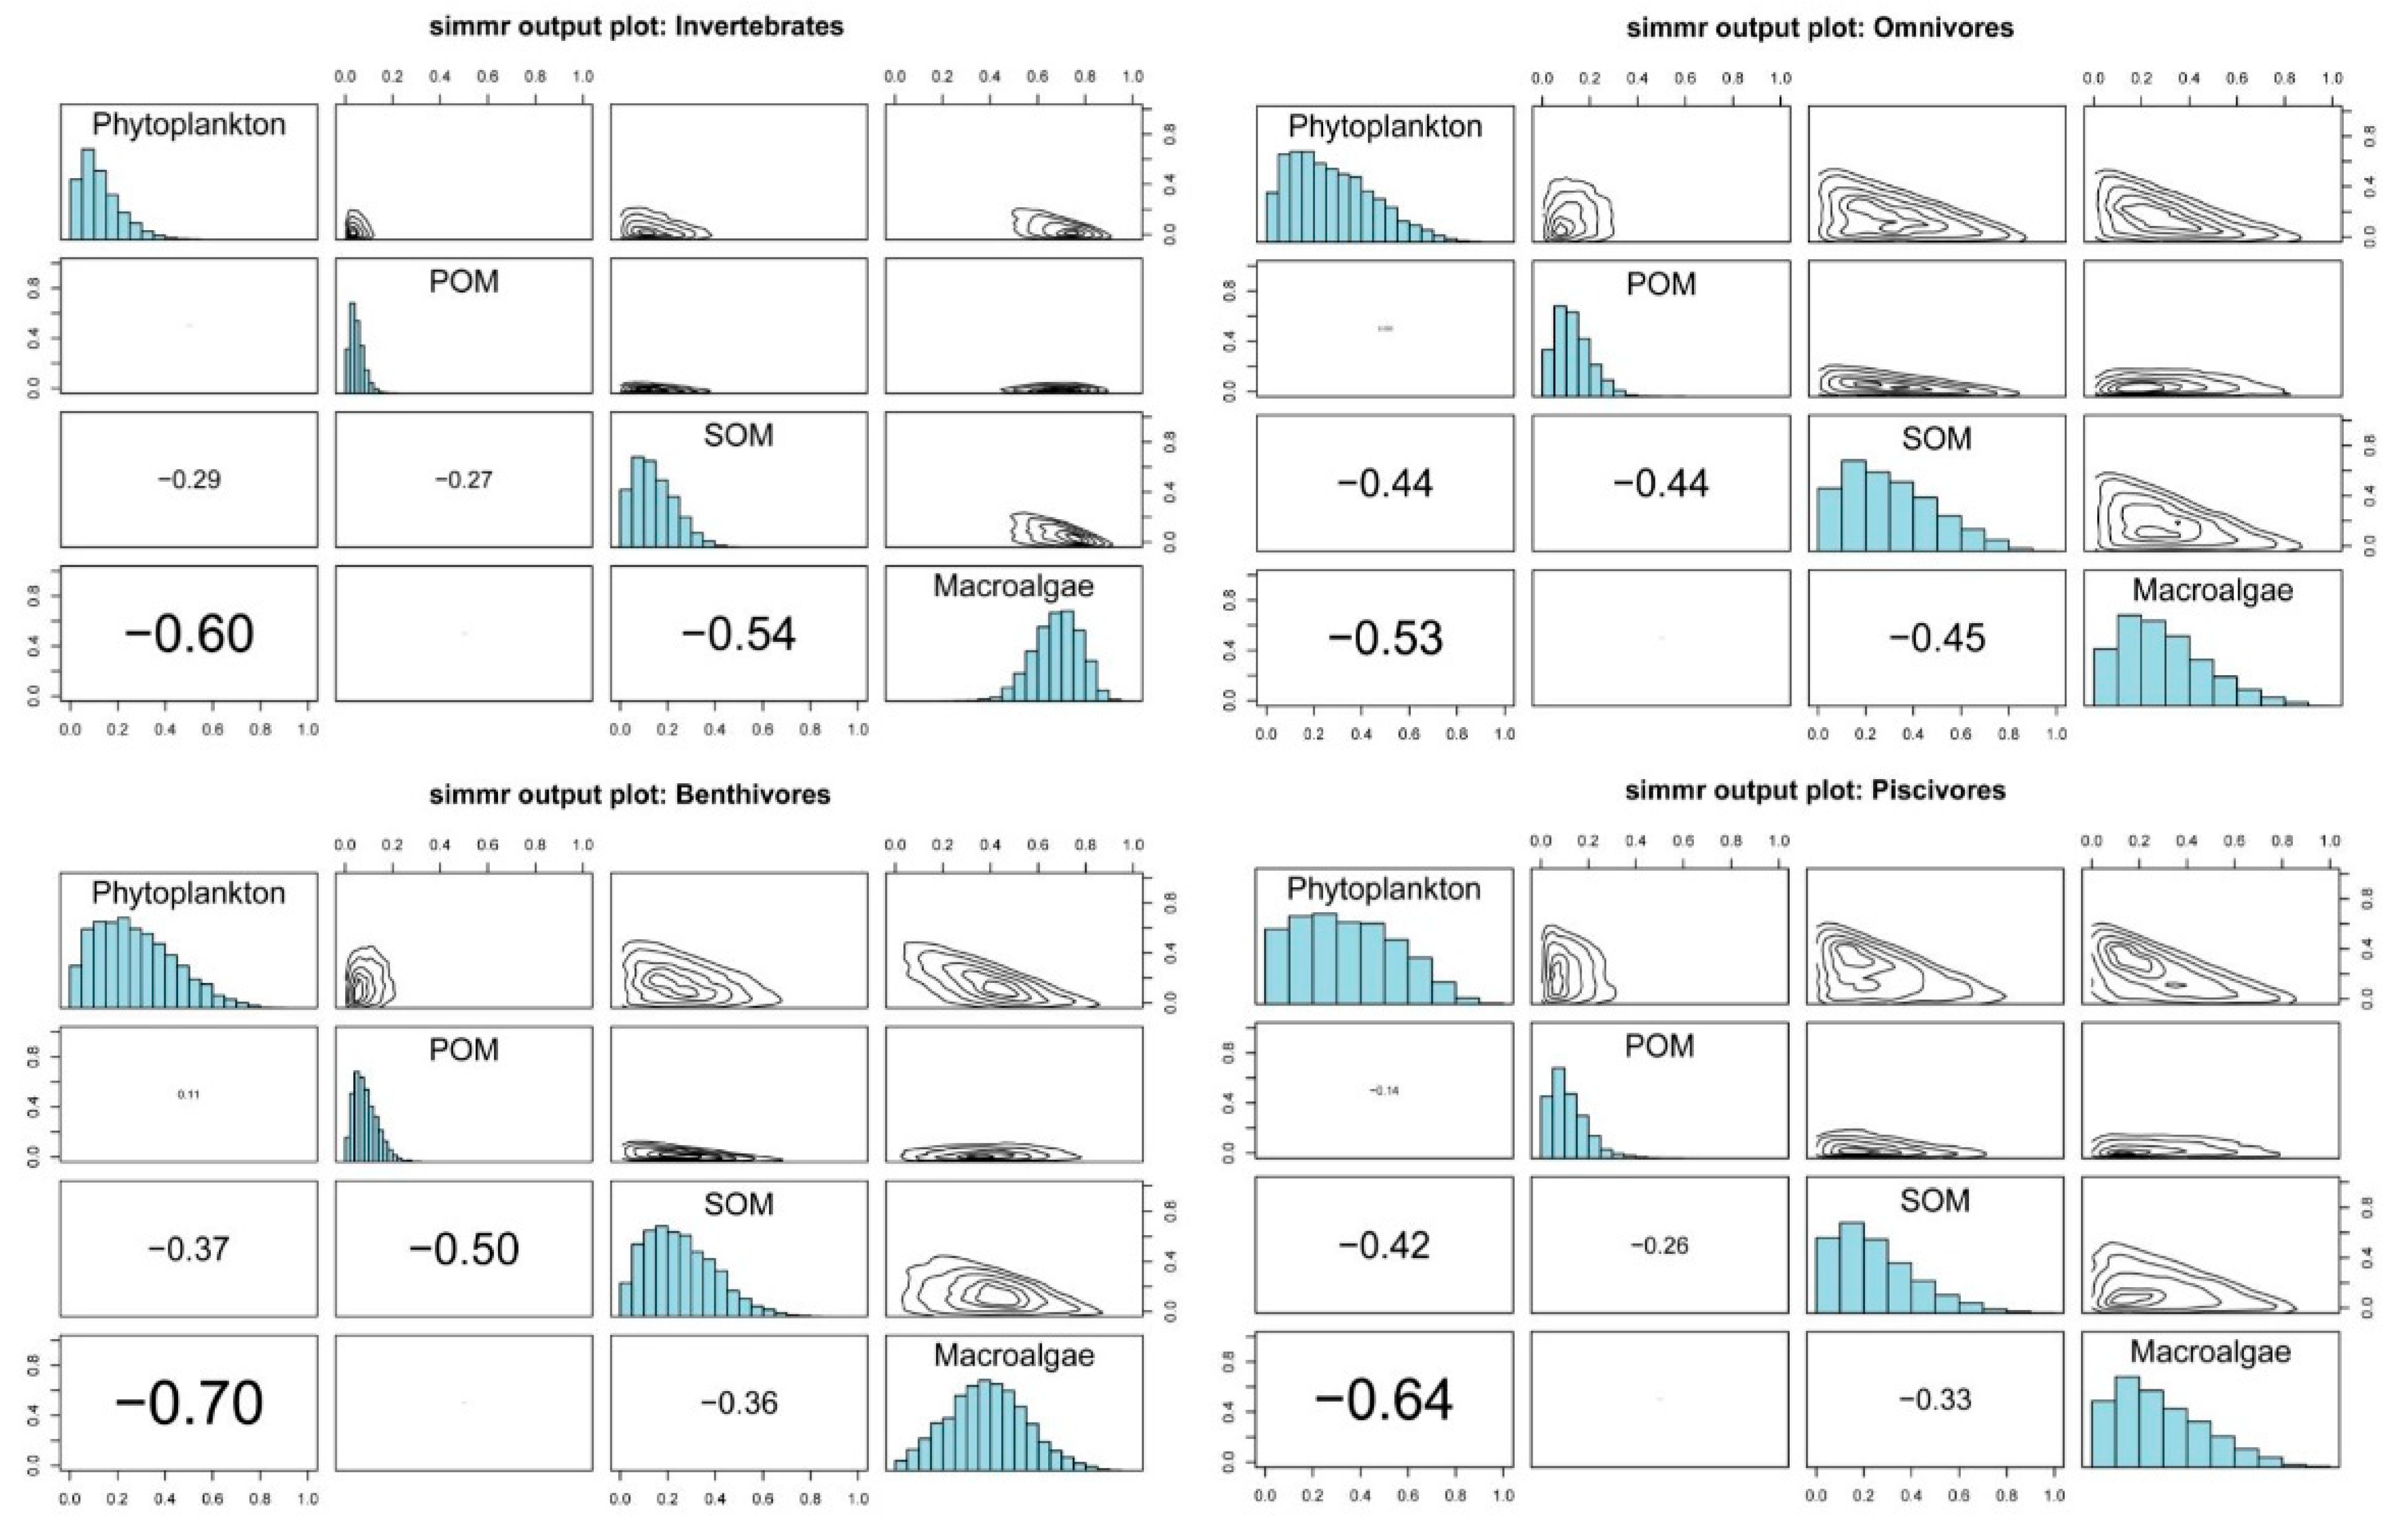
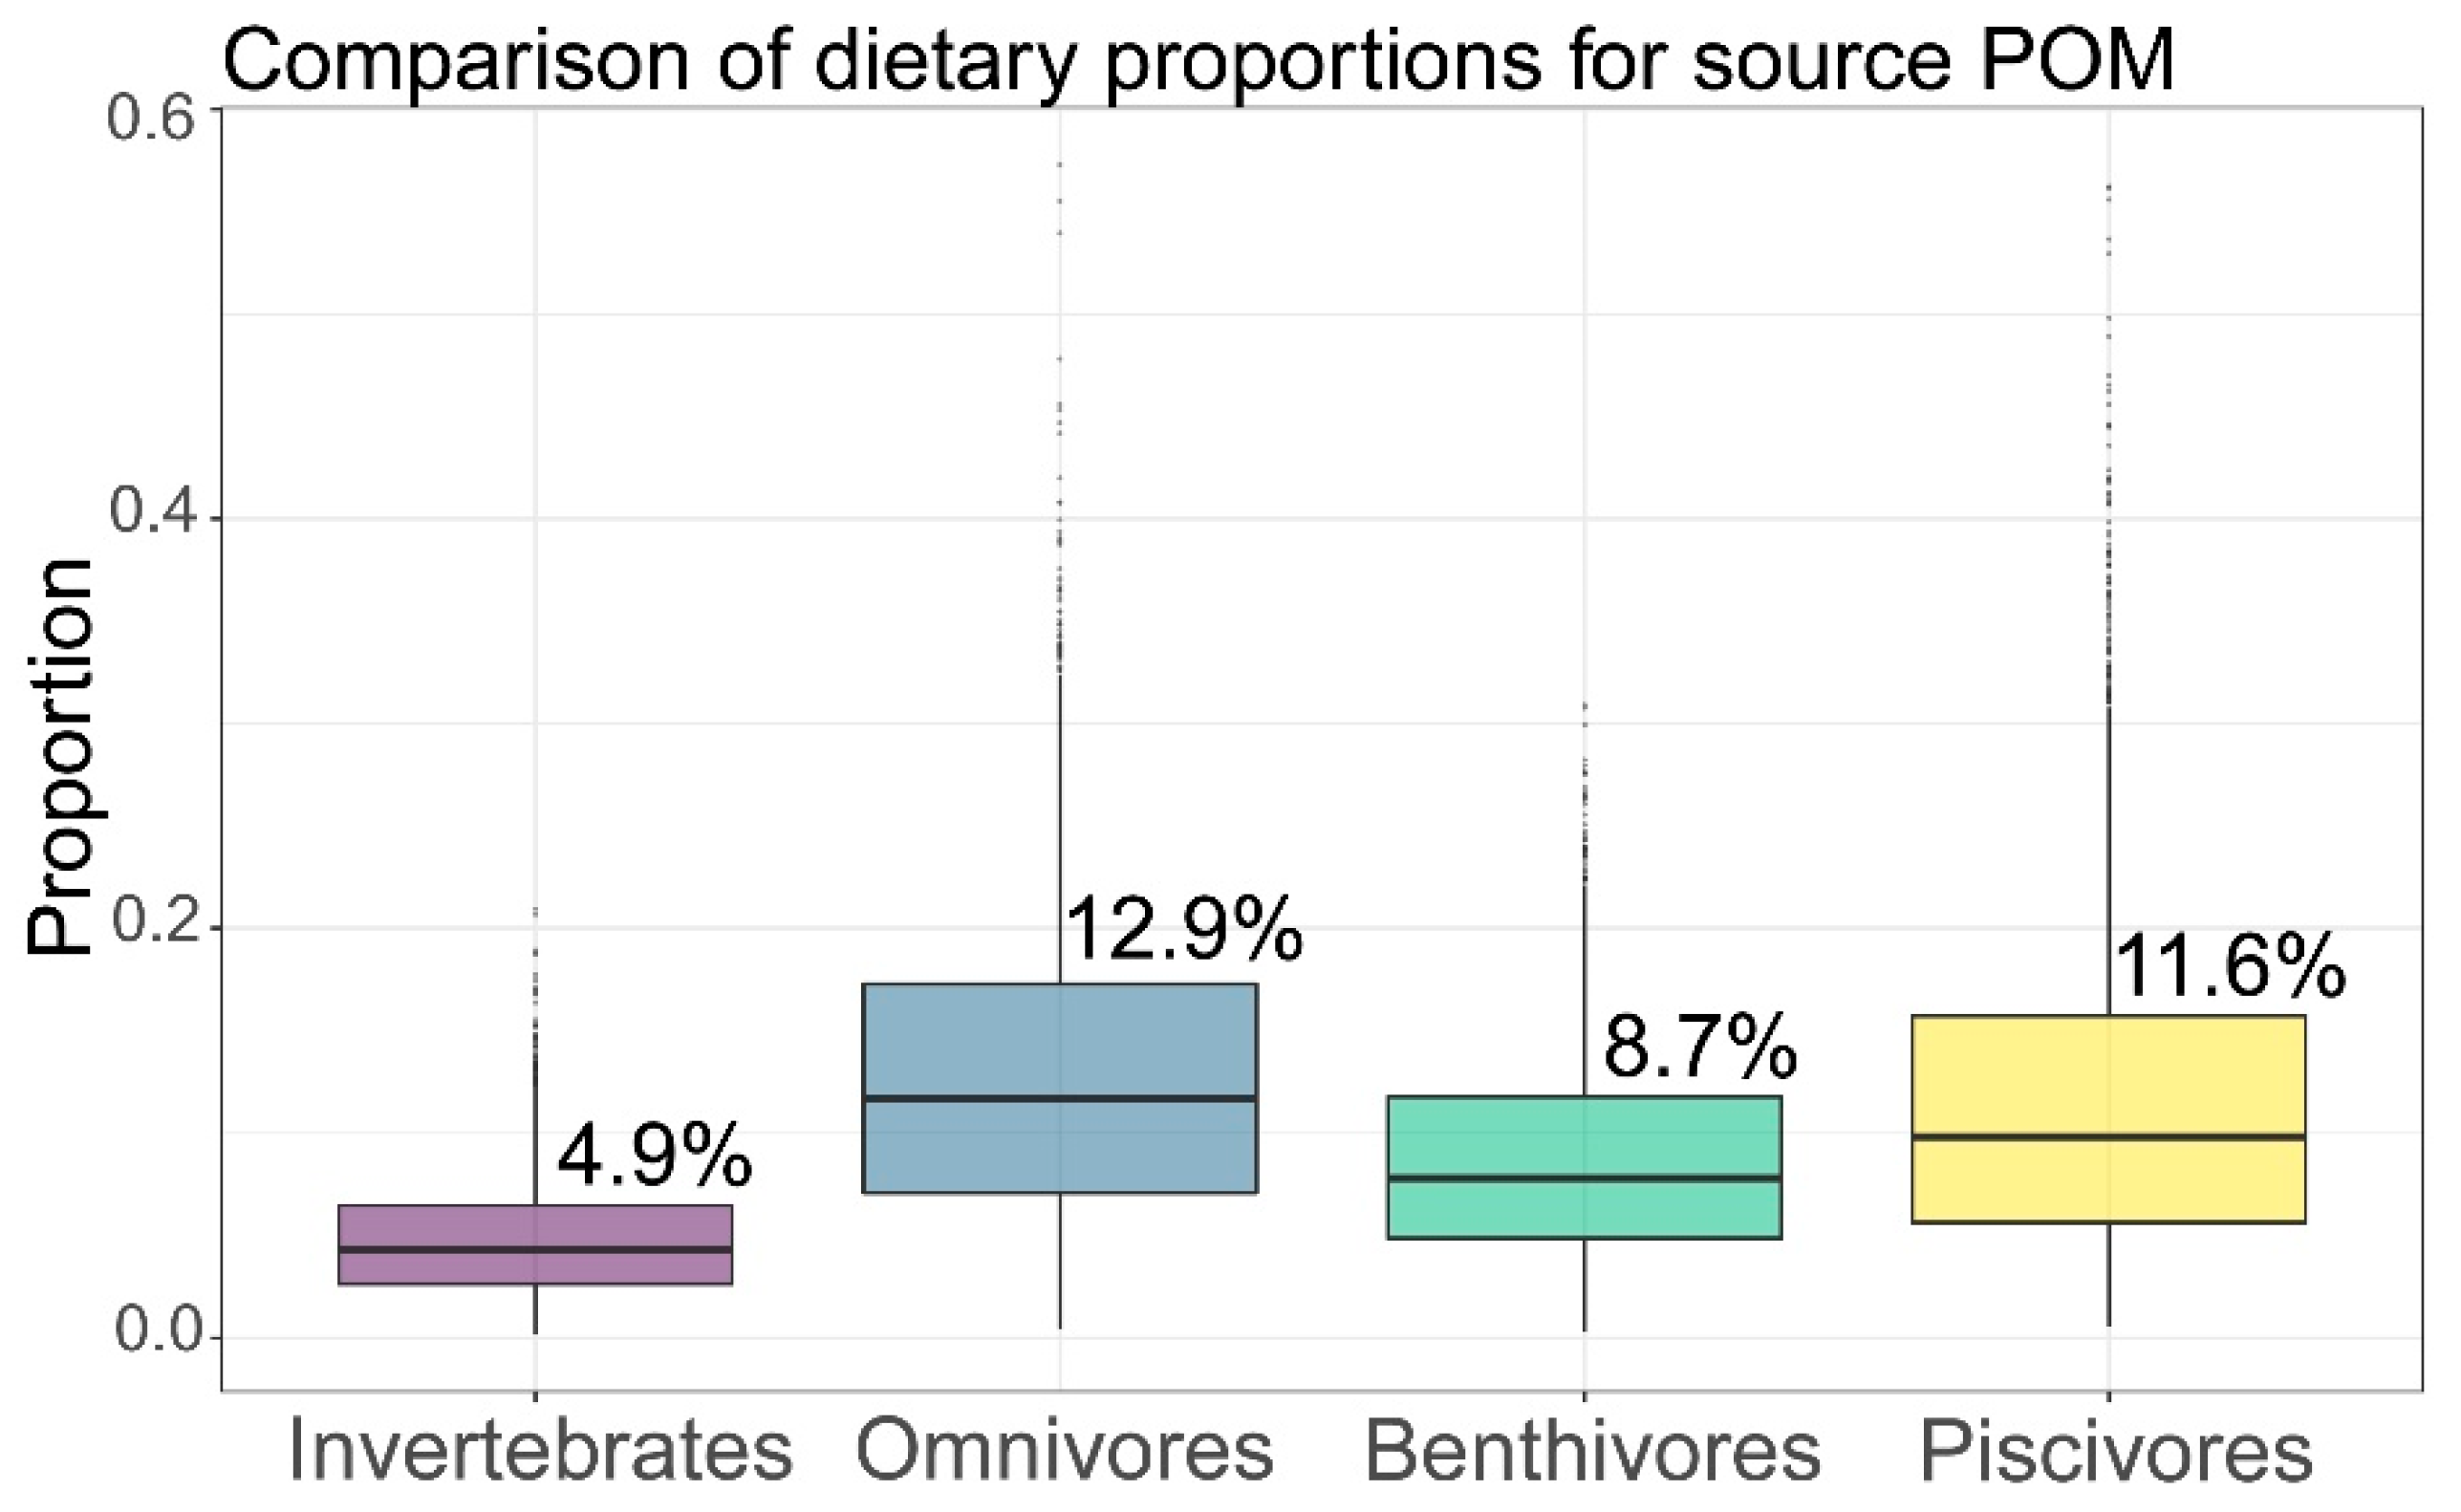
3.3. Basic Carbon Source Contribution

The analysis results of simmr were plotted as the box plot and matrix plot of the relative contribution of basic carbon sources to different consumers (Figure 5 and Figure 6). (Figure 5). Generally, the greater the length of the box, the greater the uncertainty of the result. We used the average value to represent the possible outcome of the relative contribution (Table 3).
In this study, phytoplankton, macroalgae, and SOM were the main carbon sources of the food web. POM has the lowest relative contribution. The contribution of macroalgae to the carbon source of invertebrates is higher than that of fish. Fish are more balanced in the carbon source utilization of phytoplankton, macroalgae, and SOM. Among them, omnivorous fish are the most balanced, benthivores have the highest carbon source utilization (38.6% (±16.5%)) of macroalgae, and piscivores have the highest carbon source utilization (34.4% (±20.6%)) for phytoplankton. Macroalgae contribute more to invertebrates and benthivores (68.1% and 38.6%), and may play a more important role in the benthic food web.

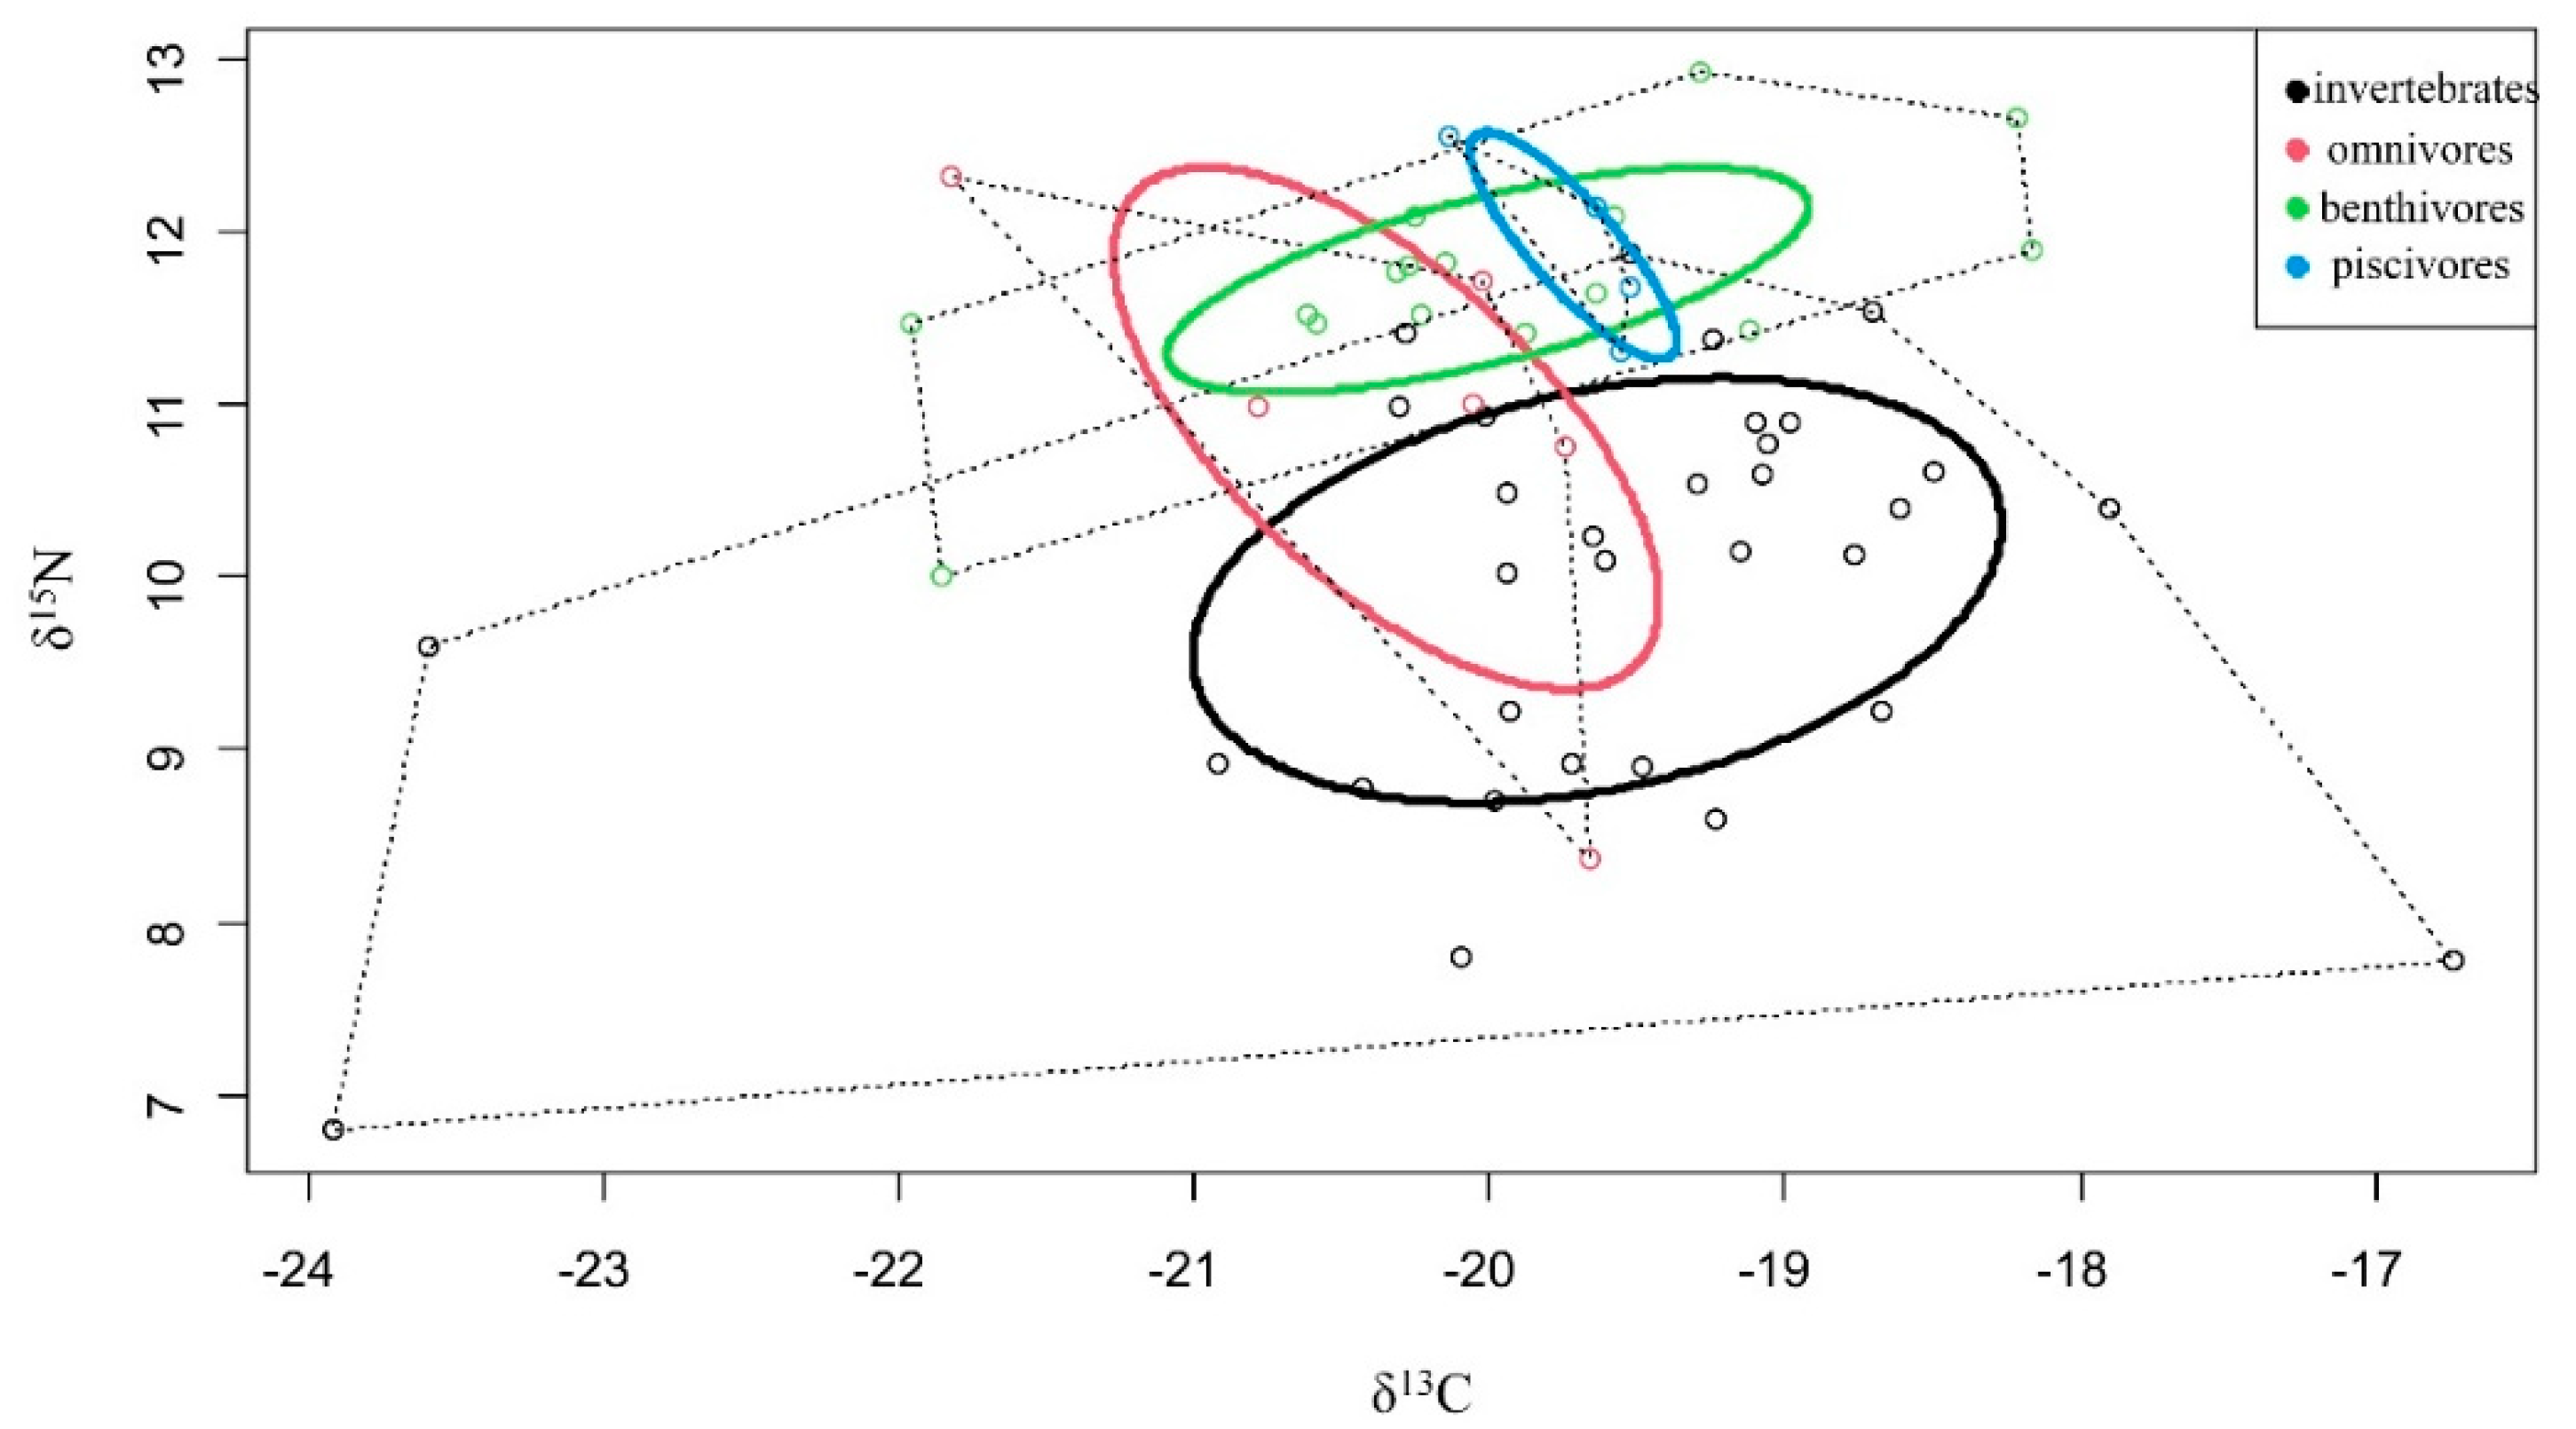
3.4. Isotopic Niche Width

The niche overlap between different functional feeding groups is shown in Figure 7. The specific values of total area (TA), standard ellipse area (SEA), and SEAc are shown in Table 4. We chose the 40% level as the proportion of SEA. SEAc is the small sample size corrected. Thus, we chose the SEAc as the isotopic niche. The analysis of SEAc indicated that the isotopic niche of invertebrates is the largest, followed by that of omnivores and benthivores, and piscivores have the smallest isotopic niche. Niche overlap between invertebrates and fish is low. There is a certain overlap in the niche of fish in different feeding functional groups.

4. Discussion

4.1. Division of Basic Carbon Sources and Consumers

Before analyzing the contribution of carbon sources, we first divided the basic carbon sources and the main consumers in the food web, and divided similar species into functional feeding groups to reduce uncertainty and errors in model calculations [33]. Basic energy source classification is complex, as it requires the inclusion of all potential food sources [29]. Qu (2019) examined the relative contribution of different basic food sources to estuarine consumers [32]. They divided the complex basic food sources by different regions (the subtidal zone, the intertidal zone, and the Yellow River) of the Yellow River (China). Autochthonous food sources included phytoplankton (POM), microphytobenthos, macroalgae, and Spartina alterniflora, and allochthonous food sources included terrestrial organic matter (TOM) in the Yellow River, Suaeda heteroptera, Phragmites australis, and Tamarix chinensis. The authors divided consumers into aquatic invertebrates and fishes. In this study, the basic carbon sources in the waters adjacent to the Miaodao Archipelago were also complicated, so the division of basic carbon sources was particularly important. The classification of consumers’ eating habits can reduce the uncertainty of SIAR model analysis, thus improving the reliability of the results.

4.2. Analysis of Potential Carbon Sources in Food Web

Understanding the source and transport pathways of carbon in the food web is the basis for studying the structure and function of the food web [34]. In this study, phytoplankton, macroalgae, and SOM were the main carbon sources of the food web. POM has the lowest carbon source contribution. The stable isotope ratios of POM suggest that terrestrial-derived organic matter is an important contributor to the bulk POM. The C/N values of POM further verified this. This shows that marine invertebrates and marine fish mainly use endogenous carbon from the ocean, such as organic carbon produced by photosynthesis of phytoplankton and macroalgae. This is obviously different from a freshwater ecosystem [35,36]; although the sea areas adjacent to Miaodao Archipelago are also greatly affected by human activities and sea–land interactions, the carbon source of the food web is still mainly oceanic. This is consistent with the results of other researchers. Cai et al. (1999), Xie et al. (2017), Gao et al. (2021), and Wei et al. (2013) all found that POM has the lowest contribution to consumers when they studied the basic marine food web [37,38,39,40].
Phytoplankton is an important primary producer of the ocean and the foundation of the marine food web. Its stable isotope composition is mainly derived from dissolved inorganic carbon in the sea [10]. Compared with previous studies, the carbon source contribution of phytoplankton is slightly lower in this study, which may be due to the fact that phytoplankton is more susceptible to changes in environmental conditions, such as changes caused by metal elements, temperature, ocean currents, and nutrient concentration [29]. Studies have shown that intensive cultivation of macroalgae may influence substances to inhibit the growth of phytoplankton, and compete with phytoplankton for nutrient resources, thereby reducing the biomass of phytoplankton and reducing its contribution to carbon sources [15]. In addition, the presence of cultured shellfish may also decrease the abundance of phytoplankton to a certain extent.
SOM is relatively more stable in surface sediments [41] and is less likely to be disturbed, making it a stable resource for consumers in the waters adjacent to the Miaodao Archipelago. In order to further determine the stability of the stable isotope of SOM, we compared the δ13C of SOM in the sea adjacent to the Miaodao Archipelago (Figure 8). The results showed that the δ13C values of SOM, as the main food source for consumers in the waters adjacent to the Miaodao Archipelago, differed very little within versus outside of the islands (extreme value 1.16‰; standard deviation 0.28‰). In addition, SOM samples collected in April 2021 were compared with SOM samples collected in autumn 2020, and it was found that SOM isotopic characteristics showed no significant seasonal changes, indicating that SOM was relatively less disturbed by the outside world and was a relatively stable food resource. Benthivores were the main group in the fish diet group, and the large number of benthivores and invertebrates was one factor resulting in the contribution of SOM to consumers at the sea bottom.
The stable isotope ratios of POM (values) suggest that terrestrial-derived organic matter was an important contributor to the bulk POM. The contribution of POM to omnivores and piscivores was higher than that of invertebrates and benthivores (Figure 9). This may be related to the spatial characteristics of POM and the wide range of activities of omnivorous fish and piscivorous fishes. Omnivorous fishes and piscivorous fishes are usually high-trophic-level fishes with larger body sizes and high swimming energy. In this study, the main major fishery stocks consisted of species such as A. schlegelii, S. schlegelii, S. elongata, L. maculatus, and K. punctatus. Frequent human activities introduce terrestrial organic matter into the marine environment, leading marine consumers to make it part of their diet. Carbon from terrestrial sources may have a greater impact on fish with a wide range of activities through the food web.
A major feature of the coastal ecosystem of islands is that it contains rich resources of macroalgae. Macroalgae not only provide a large amount of primary productivity for the food web through photosynthesis, but also provide a habitat for marine life and activities [42]. In the past, there has been a long-standing debate on the importance of primary producers such as macroalgae, salt marsh plants, and benthic microalgae. Increasing studies have shown that macroalgae occupy an important position in the biological food web of coastal waters [43]. Vizzini et al. (1995) found that macroalgae in the Sabaudia Lagoon on the Mediterranean coast were the main food source for benthic consumers [44]; Magni et al. (2008) in Santa Giusta Lagoon in Italy found that consumers’ food sources were mainly macroalgae [45]; and Wei Hujin et al. (2013) conducted research on the regional food web of a marine ranch in Xiangshan Harbor and found that macroalgae are an important carbon source for consumers [36]. In this study, macroalgae were found to be one of the main carbon sources of the benthic food web in the sea adjacent to the Miaodao Archipelago in the autumn, especially for benthic aquatic invertebrates. We suspect that macroalgae provide a large carbon source for benthic consumers in two main ways. First, perhaps the most intuitive pathway by which macroalgae production can support consumers is through direct grazing, where herbivorous taxa ingest fresh material, and then pass macroalgae-derived energy and nutrients through the food web when consumed by other fauna [46]. In the Miaodao Archipelago, there are a large number of biological resources such as cephalopods, crustaceans and echinoderms that directly feed on macroalgae. These invertebrates transmit primary productivity upwards through gnawing. A second means of obtaining energy from macroalgae to support nearshore consumers is by ingesting macroalgal debris. In this context, seasonal or continuous degradation of macroalgae leaves, in addition to sloppy feeding by major herbivores [47], lead to the production and settlement of large amounts of macroalgae debris in benthic ecosystems. These macroalgae debris are either utilized directly by suspended matter feeders or by sediment feeders/detrital animals. Importantly, the reported isotopic compositions of decaying macroalgal species vary by small magnitudes (e.g., −1.5‰ to 1.5‰), typically within the range of living macroalgae [48] Macroalgae produce debris, which enters the food web through the microbial loop, plankton, and fish ingestion. We suspect that this may be the main reason for the high contribution of macroalgae to consumers.

4.3. Marine Consumers’ Resource Utilization of Different Primary Producers’ Carbon Sources

The main consumers in the sea adjacent to the Miaodao Archipelago have certain spatial characteristics in their use of carbon sources. Invertebrates and benthivores, which are dominated by benthic organisms, make more use of macroalgae carbon sources, whereas their use of suspended particulate organic matter is very low. In contrast, omnivores and piscivores with a wider range of activities use more carbon sources from phytoplankton and POM. The analysis of SEA illustrates the similarities in the utilization of carbon sources in the functional feeding groups of fish because they have more overlap in the isotope niche. The difference in carbon source utilization between invertebrates and fish is also reflected in the low overlap of niches, indicating that they have lower competition for food resources. In addition, macroalgae showed significant carbon source contributions to benthic consumers in the littoral zone compared to the pelagic zone and the profundal zone. In the North Pacific, seasonal phytoplankton blooms and perennial growth patterns of macroalgae may be another reason for the high contribution. During the low phytoplankton abundance season, consumers may have to turn to feeding on macroalgae. In New Zealand, kelp and macroalgae constitute 60–90% of the basal carbon source for dolphin Tursiops sp. [49], highlighting the potential importance of macroalgae-derived carbon at the highest trophic levels [50]. However, the contribution of macroalgae to top predators is still poorly studied.

4.4. Application

There are numerous nature reserves in the waters adjacent to the Miaodao Archipelago (Figure 10). Marine protected areas (MPAs) are one of the most effective ways to restore damaged ecosystems [51]. The establishment of marine protected areas is important for maintaining biodiversity. Fish tend to have higher trophic levels than invertebrates, and their response to basal carbon sources is often indirect. At present, people pay more attention to the main fishery population in marine reserves, and the restoration of the main fishery population has higher ecological and economic benefits. However, a significant increase in fishery populations without regard to basic energy resources may have negative effects on other organisms and marine ecosystems [29]. The establishment of marine protected areas is also important for the protection of top predators, which tend to occupy higher trophic levels and narrower ecological niches, and are less able to cope with environmental changes. The results of this study are helpful for understanding the energy flow path of the marine ecosystem around islands, and have significance for the conservation of biodiversity of biological resources and the restoration of protected areas in the Miaodao Archipelago.
The rational growth and cultivation of macroalgae plays an important role in increasing ocean carbon sinks [52,53]. Based on the results of this study, the breeding of macroalgae can not only greatly increase the absorption of carbon dioxide in offshore waters, but also accumulate a certain amount of biological carbon into consumers through the support of carbon sources in the food web. Through rationally developed fisheries and aquaculture activities, humans remove the carbon accumulated in consumers from the ocean. Macroalgae contribute significantly to the carbon source of invertebrates, mainly shellfish. The mixed culture of shellfish and macroalgae can not only optimize the culture structure, but also increase the ocean carbon sink to a certain extent [54]. However, the ecosystem is a complex structure. When developing aquaculture and fishing strategies, a variety of factors should be considered.

5. Conclusions

This study aimed to investigate the food web structure in the waters adjacent to the Miaodao Archipelago and estimate the relative contribution of different basal carbon sources to organisms in different trophic levels. For this purpose, we used carbon (δ13C:13C/12C) and nitrogen (δ15N:15N/14N) stable isotopes and Bayesian mixing models.
The main conclusion is that the potential carbon sources of the autumn food web in the sea adjacent to the Miaodao Archipelago are mainly algae (phytoplankton, macroalgae) and SOM, of which algae contribute the most and POM has a lower contribution. The source of carbon is mainly endogenous carbon. Macroalgae may play a more important role in the littoral zone benthic food webs. The utilization of the resources of primary producers by fish is significantly different from that of invertebrates. The trophic importance of different primary producers varies with functional feeding groups. There are certain spatial characteristics in the resource utilization of different functional feeding groups.
However, although the carbon isotope characteristics of macroalgae in this study are relatively close to those of phytoplankton, there is a certain degree of resource competition, which may lead to a certain degree of uncertainty in the model analysis. Coupled with the differences in the seasonal and spatial distribution of macroalgae, it is indeed necessary to be more cautious in drawing conclusions. Furthermore, this study only studied the carbon sources of the benthic food web in the sea adjacent to the Miaodao Archipelago in autumn. Due to the uncertainty in the model and the seasonal and regional differences of algae, we remain cautious about the conclusions. The results of this study have reference value, but are not generally representative. In future studies, the number and representativeness of macroalgae samples should be increased to reduce the influence of seasonal and statistical factors. In addition, more advanced mixing models, such as MixSIAR, should be used to analyze food sources.

Author Contributions

Conceptualization, Y.Z.; methodology, Y.Z.; software, Y.Z.; validation, X.J., X.S. and T.Y.; formal analysis, Y.Z. and C.W.; investigation, Y.Z. and C.W.; resources, X.J., X.S. and T.Y.; data curation, Y.Z., X.S. and T.Y.; writing—original draft preparation, Y.Z.; writing—review and editing, Y.Z., G.T., X.S. and T.Y.; visualization, Y.Z.; supervision, X.J.; project administration, T.Y. and X.S.; funding acquisition, T.Y. and X.S. All authors have read and agreed to the published version of the manuscript.

Funding

This research was funded by [National Key R&D Program of China] grant number [2018YFD0900904], [the Innovation Team of Fishery Resources and Ecology in the Yellow Sea and Bohai Sea] grant number [2020TD01], [the Special Funds for Taishan Scholars Project of Shandong Province] grant number [NO.tsqn202103135] and [Central Public-interest Scientific Institution Basal Research Fund, YSFRI, CAFS] grant number [NO.20603022020017].

Institutional Review Board Statement

The study was conducted according to the guidelines of the Declaration of Helsinki. All sampling protocols, as well as fish rearing practices, were reviewed and approved by Institutional Animal Care and Use Committee (IACUC) of the Yellow Sea Fisheries Research Institute (14 March 2019).

Conflicts of Interest

The authors declare no conflict of interest.

References

  1. Metz, B.; Davidson, O.; Swart, R. Climate Change 2001: Mitigation, Contribution of Working Group III to the Third Assessment [TAR] Report of the Intergovernmental Panel on Climate Change (IPCC); Cambridge University Press: Cambridge, UK, 2001; ISBN 0521807697. [Google Scholar]
  2. Melillo, J.M.; Callaghan, T.V.; Woodward, F.I. Climate change: The IPCC scientific assessment. In Effects on Ecosystems; Cambridge University Press: Cambridge, UK, 1990; pp. 283–310. [Google Scholar]
  3. Liu, J.H.; Zhang, F.; Jiao, N.Z. Deciphering the mechanisms of carbon sink through a holistic view of interactions between land and ocean. Chin. Sci. Bull. 2015, 60, 3399–3405. (In Chinese) [Google Scholar] [CrossRef]
  4. Yen, J.D.L.; Cabral, R.B.; Cantor, M.; Hatton, I.; Kortsch, S.; Patrício, J.; Yamamichi, M. Linking structure and function in food webs: Maximization of different ecological functions generates distinct food web structures. J. Anim. Ecol. 2016, 85, 537–547. [Google Scholar] [CrossRef] [Green Version]
  5. Nagelkerken, I.; Goldenberg, S.U.; Ferreira, C.M.; Ullah, H.; Connell, S.D. Trophic pyramids reorganize when food web architecture fails to adjust to ocean change. Science 2020, 369, 829–832. [Google Scholar] [CrossRef]
  6. Bukovinszky, T.; van Veen, F.J.F.; Jongema, Y.; Dicke, M. Direct and indirect effects of resource quality on food web structure. Science 2008, 319, 804–807. [Google Scholar] [CrossRef]
  7. Middelburg, J.J. Stable isotopes dissect aquatic food webs from the top to the bottom. Biogeosciences 2014, 11, 2357–2371. [Google Scholar] [CrossRef] [Green Version]
  8. Lepoint, G.; Nyssen, F.; Gobert, S.; Dauby, P.; Bouquegneau, J.M. Relative impact of a seagrass bed and its adjacent epilithic algal community in consumer diets. Mar. Biol. 2000, 136, 513–518. [Google Scholar] [CrossRef] [Green Version]
  9. Andrade, C.; Ríos, C.; Gerdes, D.; Brey, T. Trophic structure of shallow-water benthic communities in the sub-Antarctic Strait of Magellan. Polar Biol. 2016, 39, 2281–2297. [Google Scholar] [CrossRef] [Green Version]
  10. Gillikin, D.P.; Lorrain, A.; Bouillon, S.; Willenz, P.; Dehairs, F. Stable carbon isotopic composition of Mytilus edulis shells: Relation to metabolism, salinity, δ13CDIC and phytoplankton. Org. Geochem. 2006, 37, 1371–1382. [Google Scholar] [CrossRef] [Green Version]
  11. Steinbauer, M.J.; Irl, S.D.H.; Beierkuhnlein, C. Elevation-driven ecological isolation promotes diversification on Mediterranean islands. Acta Oecologica 2013, 47, 52–56. [Google Scholar] [CrossRef]
  12. Shen, C.; Shi, H.; Zheng, W.; Ding, D. Spatial heterogeneity of ecosystem health and its sensitivity to pressure in the waters of nearshore archipelago. Ecol. Indic. 2016, 61, 822–832. [Google Scholar] [CrossRef]
  13. Chi, Y.; Shi, H.; Wang, X.; Qin, X.; Zheng, W.; Peng, S. Impact factors identification of spatial heterogeneity of herbaceous plant diversity on five southern islands of Miaodao Archipelago in North China. Chin. J. Oceanol. Limnol. 2016, 34, 937–951. [Google Scholar] [CrossRef]
  14. Chi, Y.; Shi, H.; Wang, Y.; Guo, Z.; Wang, E. Evaluation on island ecological vulnerability and its spatial heterogeneity. Mar. Pollut. Bull. 2017, 125, 216–241. [Google Scholar] [CrossRef]
  15. Xie, B.; Huang, C.; Wang, Y.; Zhou, X.Z.; Peng, G.G.; Tao, Y.C.; Huang, J.J.; Lin, X.Q.; Huang, L.F. Trophic gauntlet effects on fisheries recovery: A case study in Sansha Bay, China. Ecosyst. Heal. Sustain. 2021, 7, 1965035. [Google Scholar] [CrossRef]
  16. Kohlbach, D.; Graeve, M.; ALange, B.; David, C.; Peeken, I.; Flores, H. The importance of ice algae-produced carbon in the central Arctic Ocean ecosystem: Food web relationships revealed by lipid and stable isotope analyses: Ice algal carbon in Arctic food web. Limnol. Oceanogr. 2016, 61, 2027–2044. [Google Scholar] [CrossRef]
  17. Liu, H.; Xu, J.; Li, C.H.; Chen, Z.Z.; Huang, H.H. Stable isotopes of nitrogen in zooplankton in the southern South China Sea. J. Trop. Oceanogr. 2015, 2, 32–38. [Google Scholar] [CrossRef]
  18. Rollff, C. Seasonal variation in δ13C and δ15N of size-fractionated plankton at a coastal station in the northern Baltic proper. Mar. Ecol. Prog. Ser. 2000, 203, 47–65. [Google Scholar] [CrossRef] [Green Version]
  19. McIntyre, P.B.; Flecker, A.S. Rapid turnover of tissue nitrogen of primary consumers in tropical freshwaters. Oecologia 2006, 148, 12–21. [Google Scholar] [CrossRef]
  20. Post, D.M. Using stable isotopes to estimate trophic position: Models, methods, and assumptions. Ecology 2002, 83, 703–718. [Google Scholar] [CrossRef]
  21. Xu, J.; Wang, Y.Y.; Wang, K.; Zeng, Q.F.; Zhang, M.; Zhang, H. Collection, treatment and preservation of biologically stable isotopes in aquatic ecology. Acta Hydrobiol. Sin. 2020, 44, 989–997. [Google Scholar] [CrossRef]
  22. Logan, J.M.; Jardine, T.D.; Miller, T.J.; Bunn, S.E.; Cunjak, R.A.; Lutcavage, M.E. Lipid corrections in carbon and nitrogen stable isotope analyses: Comparison of chemical extraction and modelling methods. J. Anim. Ecol. 2008, 77, 838–846. [Google Scholar] [CrossRef]
  23. Hussey, N.E.; MacNeil, M.A.; McMeans, B.C.; Olin, J.; Dudley, S.F.; Cliff, G.; Wintner, S.P.; Fennessy, S.T.; Fisk, A.T. Rescaling the trophic structure of marine foodwebs. Ecol. Lett. 2014, 17, 239–250. [Google Scholar] [CrossRef]
  24. Reum, J.C.P.; Jennings, S.; Hunsicker, M.E. Implications of scaled δ15N fractionation for community predator-prey body mass ratio estimates in size-structured food webs. J. Anim. Ecol. 2015, 84, 1618–1627. [Google Scholar] [CrossRef]
  25. Parnell, A.C.; Phillips, D.L.; Bearhop, S.; Semmens, B.X.; Ward, E.J.; Moore, J.W.; Jackson, A.L.; Grey, J.; Kelly, D.J.; Inger, R. Bayesian stable isotope mixing models. Environmetrics 2013, 24, 387–399. [Google Scholar] [CrossRef] [Green Version]
  26. Phillips, D.L.; Inger, R.; Bearhop, S.; Jackson, A.; Moore, J.W.; Parnell, A.; Semmens, B.X.; Ward, E.J. Best practices for use of stable isotope mixing models in food-web studies. Can. J. Zool. 2014, 92, 823–835. [Google Scholar] [CrossRef] [Green Version]
  27. Jackson, A.L.; Inger, R.; Parnell, A.C.; Bearhop, S. Comparing isotopic niche widths among and within communities: SIBER-Stable Isotope Bayesian Ellipses in R: Bayesian isotopic niche metrics. J. Anim. Ecol. 2011, 80, 595–602. [Google Scholar] [CrossRef]
  28. Zhang, B. Food relationship of fish in the Bohai Sea. Adv. Fish. Sci. 2018, 3, 11–22. [Google Scholar] [CrossRef]
  29. Li, S.Y.; Han, D.Y.; Ma, Q.Y.; Xue, Y.; Ji, Y.P. Analysis of feeding habits of blenny fong in Jiaozhou Bay using stable carbon and nitrogen isotopes. Fish. Sci. China 2014, 21, 1220–1226. [Google Scholar] [CrossRef]
  30. Wang, R.F.; Liu, S.D.; Ren, Y.P.; Zhang, C.L.; Xu, B.D.; Xue, Y. Spatial heterogeneity of feeding habits of small-eyed greenfin in haizhou bay in autumn. Acta Ecol. Sin. 2019, 17, 6433–6442. [Google Scholar] [CrossRef]
  31. Darnaude, A.M. Fish ecology and terrestrial carbon use in coastal areas: Implications for marine fish production. J. Anim. Ecol. 2005, 74, 864–876. [Google Scholar] [CrossRef]
  32. Qu, P.; Zhang, Z.; Pang, M.; Li, Z.; Zhao, L.; Zhou, X.; Wang, W.; Li, X. Stable isotope analysis of food sources sustaining the subtidal food web of the Yellow River Estuary. Ecol. Indic. 2019, 101, 303–312. [Google Scholar] [CrossRef]
  33. Layman, C.A.; Araujo, M.S.; Boucek, R.; Hammerschlag-Peyer, C.M.; Harrison, E.; Jud, Z.R.; Matich, P.; Rosenblatt, A.; Vaudo, J.J.; Yeager, L. Applying stable isotopes to examine food-web structure: An overview of analytical tools. Biol. Rev. 2012, 87, 545–562. [Google Scholar] [CrossRef]
  34. Zheng, Y.; Niu, J.; Zhou, Q.; Xie, C.; Ke, Z.; Li, D.; Gao, Y. Effects of resource availability and hydrological regime on autochthonous and allochthonous carbon in the food web of a large cross-border river (China). Sci. Total. Environ. 2018, 612, 501–512. [Google Scholar] [CrossRef]
  35. Li, Y.K.; Gong, Y. Food web structure of the East Lake Taihu by analysis of stable carbon and nitrogen isotopes. Chin. J. Ecol. 2014, 33, 1534–1538. [Google Scholar] [CrossRef]
  36. Cai, D.L.; Meng, F.; Han, Y.B. Studies on 13C/12C ratios ai a tracer for food web in a marine ecosystem–the trophic relations in pelagic food webs in Laoshan Bay. Oceanol. Limnol. Sin. 1999, 6, 671–678. [Google Scholar]
  37. Xie, B.; Li, Y.K.; Zhang, H.; Zhang, S. Food web foundation and seasonal variation of trophic structure based on the stable isotopic technique in the marine ranching of Haizhou Bay, China. Chin. J. Appl. Ecol. 2017, 28, 2292–2298. [Google Scholar] [CrossRef]
  38. Gao, S.K.; Sun, W.; Zhang, S. The potential carbon source and trophic level analysis of main organisms in coastal water of Lüsi fishing ground, based on carbon and nitrogen stable isotope analysis. Haiyang Xuebao 2021, 43, 71–80. [Google Scholar] [CrossRef]
  39. Wei, H.J.; Zhu, X.M.; JI, Y.N.; JIANG, Y.Z.; LIN, N.; WANG, Y. Study on the food web structure and their trophic levels of marine ranching area in Xiangshan Harbor. J. Appl. Oceanogr. 2013, 32, 250–257. [Google Scholar] [CrossRef]
  40. Dodds, W.K.; Collins, S.; Hamilton, S.K.; Tank, J.L.; Johnson, S.; Webster, J.R.; Simon, K.S.; Whiles, M.R.; Rantala, H.M.; McDowell, W.; et al. You are not always what we think you eat: Selective assimilation across multiple whole-stream isotopic tracer studies. Ecology 2014, 95, 2757–2767. [Google Scholar] [CrossRef] [Green Version]
  41. Miyatake, T.; Moerdijk-Poortvliet, T.C.W.; Stal, L.J.; Boschker, H.T.S. Tracingcarbon flow from microphytobenthos to major bacterial groups in an intertidal marine sediment by using an in situ 13C pulse-chase method. Limnol. Oceanogr. 2014, 59, 1275–1287. [Google Scholar] [CrossRef] [Green Version]
  42. He, P.M.; Liu, Y.Y.; Zhang, J.W.; Wu, H.L.; Yu, K.F.; Huo, Y.Z.; Zhang, J.H. Research progress on the effects of macroalgae on carbon sink. J. Fish. Sci. China 2015, 22, 588–595. [Google Scholar]
  43. Currin, C.A.; Newell, S.Y.; Pearl, H.W. The role of standing dead Spartina alterniflora and benthic microalgae in saltmarsh food webs: Considerations based on multiple stable isotope analysis. Mar. Ecol. Prog. Ser. 1995, 121, 99–116. [Google Scholar] [CrossRef]
  44. Vizzini, S.; Mazzola, A. Seasonal variations in the stable carbon and nitrogen isotope ratios (13C/12C and 15N/14N) of primary producers and consumers in a western Mediterranean coastal lagoon. Mar. Biol. 2003, 142, 1009–1018. [Google Scholar] [CrossRef]
  45. Magni, P.; Rajagopal, S.; van der Velde, G.; Fenzi, G.; Kassenberg, J.; Vizzini, S.; Mazzola, A.; Giordani, G. Sediment features, macrozoobenthic assemblages and trophic relationships (δ13C and δ15N analysis) following a dystrophic event with anoxia and sulphide development in the Santa Giusta lagoon (western Sardinia, Italy). Mar. Pollut. Bull. 2008, 57, 125–136. [Google Scholar] [CrossRef] [PubMed]
  46. Smith, E.A.E.; Fox, M.D. Characterizing energy flow in kelp forest food webs: A geochemical review and call for additional research. Ecography 2021, 44, 1–16. [Google Scholar] [CrossRef]
  47. Yorke, C.E.; Page, H.M.; Miller, R.J. Sea urchins mediate the availability of kelp detritus to benthic consumers. Proc. R. Soc. B Boil. Sci. 2019, 286, 20190846. [Google Scholar] [CrossRef] [PubMed] [Green Version]
  48. Gabara, S.S. Trophic structure and potential carbon and nitrogen flow of a rhodolith bed at Santa Catalina Island inferred from stable isotopes. Mar. Biol. 2020, 167, 30. [Google Scholar] [CrossRef]
  49. Lusseau, S.M.; Wing, S.R. Importance of local production versus pelagic subsidies in the diet of an isolated population of bottlenose dolphins Tursiops sp. Mar. Ecol. Prog. Ser. 2006, 321, 283–293. [Google Scholar] [CrossRef] [Green Version]
  50. Lesage, V.; Hammill, M.; Kovacs, K. Marine mammals and the community structure of the Estuary and Gulf of St Lawrence, Canada: Evidence from stable isotope analysis. Mar. Ecol. Prog. Ser. 2001, 210, 203–221. [Google Scholar] [CrossRef]
  51. Worm, B. How to heal an ocean. Nature 2017, 543, 630–631. [Google Scholar] [CrossRef]
  52. Cernansky, R. The biodiversity revolution. Nature 2017, 546, 22–24. [Google Scholar] [CrossRef]
  53. Feng, Z.H.; Meng, Y.; Lu, W.; Chen, Q.F.; Yu, K.F.; Cai, C.E.; He, P.M. Studies on photosynthesis carbon fixation and ocean acidification prevention in Ulva prolifera. Acta Oceanol. Sin. 2012, 34, 162–168. [Google Scholar] [CrossRef]
  54. Li, J.; Guan, C.T. Preliminary analysis of carbon sink mechanism and potential of artificial reef ecosystem. Prog. Fish. Sci. 2013, 34, 65–69. [Google Scholar]
Figure 1. The location and sampling stations of the Miaodao Archipelago.
Fishes 07 00032 g001
Figure 2. Bottom fishery community composition in September and November 2021. Biomass (g/10 min) on the (left) and abundance (Ind/10 min) on the (right).
Fishes 07 00032 g002
Figure 3. Stable isotope biplot (δ13C and δ15N‰, mean ± SD) for the benthic food web (basal carbon sources and consumers) in the sea adjacent to the Miaodao Archipelago. Symbols represent the different functional groups. The dashed ellipse represents the main carbon sources (primary producers); green and the inverted triangle represent macroalgae, in which S. horueri, G. turuturu, and U. pertuca are the main macroalgae. The error bar is the 95% confidence interval. The figure indicates two expected isotope patterns (expected marine-terrestrial patterns and expected C3–C4 plant patterns).
Fishes 07 00032 g003
Figure 4. Continuity map of nutritional levels of consumers in the waters around the Miaodao Archipelago. (The orange circles represent fish, the blue triangles represent invertebrates, the green squares represent zooplankton, and the error bars represent the 95% confidence intervals).
Fishes 07 00032 g004
Figure 5. Relative contribution of different basic energy sources to consumers. Yellow boxes represent macroalgae; green boxes represent SOM; blue boxes represent POM; purple boxes represent phytoplankton.
Fishes 07 00032 g005
Figure 6. The matrix plot of the contribution of different base carbon sources to consumers. This shows the source histograms on the diagonal, contour plots of the relationship between the sources on the upper diagonal, and the correlation between the sources on the lower diagonal. Large negative correlations indicate that the model cannot discern between the two sources; in general, high correlations (negative or positive) are indicative of the model being unable to determine which food sources are being consumed, and are an unavoidable part of stable isotope mixing models.
Fishes 07 00032 g006
Figure 7. Isotopic niche width of functional feeding groups present in the sea adjacent to Miaodao Archipelago. Solid lines enclose the standard ellipse area (SEA), representing the isotopic niche of consumers. Dotted lines are the total area (TA) of the convex hulls representing the total niche width of the different consumers.
Fishes 07 00032 g007
Figure 8. SOM distribution of the sea area adjacent to the Miaodao Archipelago.
Fishes 07 00032 g008
Figure 9. POM distribution for consumers in the sea area adjacent to the Miaodao Archipelago.
Fishes 07 00032 g009
Figure 10. Schematic diagram of marine reserves in Miaodao Archipelago.
Fishes 07 00032 g010
Table 1. Function feeding group of fish consumers.
FishDietFishDietFishDiet
P. argentataBenthivoresC. chinensisBenthivoresR. porosaBenthivores
A. schlegeliiOmnivoresT. barbatusBenthivoresT. septentrionalisOmnivores
S. schlegeliiPiscivoresH. otakiiBenthivoresS. japonicaBenthivores
C. stigmatiasBenthivoresC. joyneriBenthivoresK. bicoloratusBenthivores
A. hexanemaBenthivoresP. fangiBenthivoresP. indicusOmnivores
S. hastaBenthivoresC. beniteguriBenthivoresS. elongatePiscivores
M. filiferBenthivoresT. pseudommusOmnivoresK. punctatusOmnivores
T. kammalensisOmnivoresL. maculatusPiscivoresC. kumuBenthivores
S. marmoratusPiscivoresC. myriasterBenthivores
Table 2. Values of δ13C and δ15N for the potential carbon sources and consumers.
CategoryNumberδ13C ± SD (‰)δ13C Range (‰)δ15N ± SD (‰)δ15N Range (‰)
phytoplankton12−19.44 ± 0.80−21.85~−18.524.39 ± 1.990.38~7.54
POM11−25.14 ± 1.24−26.54~−22.293.23 ± 1.731.38~7.59
SOM11−21.38 ± 0.28−21.85~−20.694.7 ± 2.110.85~8.96
macroalgae6−19.65 ± 2.31−22.05~−16.926.10 ± 1.813.64~8.58
invertebrates272−19.27 ± 2.05−25.43~−16.749.61 ± 1.742.84~13.06
fish208−20.04 ± 0.92−22.26~−15.1011.55 ± 0.897.35~14.54
Table 3. Summary statistics of simmr analysis for each group.
ConsumersInvertebratesOmnivoresBenthivoresPiscivores
SourcesMean%SD%Mean%SD%Mean%SD%Mean%SD%
Phytoplankton12.78.627.617.427.516.434.420.6
POM4.92.912.97.68.7511.67.9
SOM14.48.730.31925.214.524.917.1
Macroalgae68.11029.21838.616.52919.1
Table 4. Summary statistics of SIBER analysis for each group.
InvertebratesOmnivoresBenthivoresPiscivores
TA23.023.215.420.22
SEA4.885.631.560.21
SEAc5.043.291.680.29
Publisher’s Note: MDPI stays neutral with regard to jurisdictional claims in published maps and institutional affiliations.

