Article

Challenges for Sustainable Coastal Fisheries in a Changing Marine Environment: Spatiotemporal Impacts of Offshore Wind Farm Development in Taiwan


by
Yan-Lun Wu
1,
Po-Yuan Hsiao
1,
Yonatan Isai Valladares Ponce
1,
Sunardi Sunardi
1,
Aloysius Dimas Sanjaya Saliyo
1,
Li-Xiang Li
1 and
Kuo-Wei Lan
1,2,*
1
Department of Environmental Biology and Fisheries Science, National Taiwan Ocean University, Keelung 20224, Taiwan
2
Center of Excellence for Oceans, National Taiwan Ocean University, Keelung 20224, Taiwan
*
Author to whom correspondence should be addressed.
Fishes 2026, 11(8), 483; https://doi.org/10.3390/fishes11080483
Submission received: 16 July 2026 / Revised: 7 August 2026 / Accepted: 10 August 2026 / Published: 18 August 2026
(This article belongs to the Section Fishery Economics, Policy, and Management)

Abstract

Offshore wind farm (OWF) development raises concerns regarding potential conflicts with local fisheries and marine ecosystems. This study investigated the spatiotemporal dynamics of gillnet and trawl fisheries in the coastal waters off Changhua, Taiwan, across various development phases. (2016–2024). Spatial analysis revealed distinct operational patterns: gillnet fleets operated within and adjacent to wind farms, while trawl activities were concentrated in northern offshore waters, largely avoiding the development zone. The gillnet fishery demonstrated a significant increase in Income Per Unit Effort (IPUE), suggesting that local fishers successfully employed adaptive strategies. The IPUE of the trawl fishery indicated a slightly lower value during this period. These findings indicate that current OWF development has historically coexisted with gillnet fisheries without causing economic loss. The catch composition of gillnet fisheries remained stable, dominated by Silver croaker and Pharaoh cuttlefish. The species diversity indices of both fisheries showed a stable to increasing trend driven by seasonal variability rather than construction impacts. The habitat-driven shift in community structure was observed within the wind farm zone (gillnet fisheries), where the dominance of benthic species (e.g., Flatfish) transitioned toward reef-associated taxa (e.g., Spotted catfish, Black Sea bream). This indicates that the turbine foundations may function as artificial reefs, supporting a more complex assemblage. Nevertheless, the observed habitat alterations highlight the necessity for long-term monitoring to ensure the sustainable symbiosis of renewable energy expansion and marine resource conservation.
Key Contribution: We identified a habitat-driven shift in community structure within the wind farm zone (gillnet fisheries), where the dominance of benthic species (e.g., flatfish) transitioned toward reef-associated taxa (e.g., spotted catfish, black sea bream). Furthermore, the IPUE for the gillnet fishery demonstrated a significant increasing trend, suggesting that local fishers have successfully employed adaptive strategies. Conversely, the IPUE for the trawl fishery showed a slightly lower value during the study period.

1. Introduction

Climate change constitutes a pressing global challenge affecting both terrestrial and marine systems [1,2]. To address this issue, nearly 200 Parties to the United Nations Framework Convention on Climate Change adopted the Paris Agreement in 2015, committing to the mitigation of greenhouse gas emissions and the transition toward low-carbon energy systems [3]. Taiwan subsequently enacted the Greenhouse Gas Reduction and Management Act, establishing a statutory target to lower national emissions to 50% of 2005 levels by 2050 [4]. As countries confront the constraints of fossil fuels alongside concerns regarding nuclear safety, waste management, and the social impacts of onshore wind development, offshore wind energy has been identified as a crucial element of national energy transition policies. This marine-based renewable sector is frequently characterized as “Greening Blue Energy” [5]. The rapid expansion of offshore renewable energy introduces emerging environmental challenges for marine ecosystems and fisheries [6]. Offshore wind farms introduce distinct environmental stressors, including elevated underwater noise, electromagnetic fields, sediment resuspension, and hydrodynamic shifts throughout construction and operation [7,8]. Associated environmental perturbations can affect species behavior, interrupt ecological interactions, shift habitat suitability, and modulate the broader structure and function of marine ecosystems [8]. A previous study pointed out that the North Sea and the Baltic Sea offshore wind turbines have functioned as de facto marine protected areas, providing shelter for benthic habitats, invertebrates, fish, and marine mammals [9]. Turbine foundations in nearshore wind farms can act as artificial reefs, creating habitats for species such as Gadus morhua, Myoxocephalus scorpius, and Ctenolabrus rupestris, and may offer more effective protection than conventional marine protected areas. Post-installation investigations show that species diversity and abundance generally increase for benthic organisms and fish, while certain seabird species decline and migratory birds adjust flight routes due to wind farm barriers [9].
In Taiwan, the Bureau of Energy designated multiple offshore wind-farm planning sites along Taiwan’s western coast in 2015 [10]. In the Taiwan Strait, the offshore wind farm planning sites feature a shallow (average depth 60 m) sandy–muddy seabed and experience significant seasonal oceanographic fluctuations, such as tidal variations and current reversals. This habitat sustains highly productive, economically important fisheries, dominated by groups such as Synodontidae, Sciaenidae, and Leiognathidae [11,12,13,14]. The variation in oceanic conditions might influence the effects of the physiology, ecology and behavior of marine organisms, thereby influencing the structure and function of marine ecosystems, and even fishery resources indirectly [8]. The installation of large turbine foundations into this otherwise open seabed effectively introduces vertical artificial-reef-like structures, which may modify local hydrodynamics and change surrounding species assemblages [13,14].
Recent longitudinal assessments at the Formosa Wind Farm, located off the coast of Miaoli County, Taiwan, demonstrate that underwater turbine foundations function as artificial reefs, creating novel habitats and supporting successional changes in reef-associated fish assemblages within specific spatial extents [15]. Despite these documented ecological modifications, the broader implications of such habitat conversions for local fishery operations and socio-economic resilience (which in this study will be characterized by the ability of fishermen to adopt adaptive strategies to maintain expected income levels) in subtropical environments remain insufficiently characterized. Consequently, the present study evaluates the ecological and fishery-related consequences of offshore wind installations on Taiwan’s western coast. The research examines the mechanisms by which offshore wind farms modify habitat characteristics, drive shifts in species composition, and subsequently influence the sustainability of fishery resources and the livelihoods of coastal communities. Through the generation of region-specific scientific evidence, this investigation intends to inform environmental impact assessments, adaptive management strategies, and policy development, thereby supporting both renewable energy expansion and long-term ecosystem sustainability under dynamic marine environmental conditions.

2. Materials and Methods

2.1. Fishery-Dependent Data Collection and Community Characterization

The temporal scope of this study was stratified into three distinct phases based on the development timeline of the Zhong Neng Offshore Wind Farm (Site No. 29; https://znwp.com.tw/ (accessed on 9 August 2026)): the preparation phase (2016–2019), which involved site planning verification and environmental impact assessments; the investigation phase (2020–2021), dedicated to gathering comprehensive environmental baseline data through ecological, marine, and meteorological surveys; and the construction phase (2022–2024), characterized by the installation of foundation pilings. Fishery-dependent data were compiled from daily gillnet and trawl fishery conducted in the Changhua offshore wind farm zone and adjacent waters, integrated from logbooks filled out by fishermen. Bottom floating gillnets with a 5 cm mesh size, measuring 150 m long and 4 m wide, were used in the study area. Bottom trawling was operated using a net with a 1.5 cm codend mesh size and a length of 30 m, with a trawling duration of 120 min performed three times per trip. Anchoring is prohibited for all vessels within the northbound and southbound traffic lanes, the separation zone, and the buffer zones between the eastern/western sides of the Changhua Offshore Wind Farm Navigation Channel and the wind farms. If a master, after assessing potential risks, deems that navigating the sea area of the Changhua offshore wind farms or the navigation channel may compromise navigation safety, they shall consider vessel characteristics, loading status, hydrological conditions, and other relevant factors to seek alternative safe and navigable routes and properly formulate a passage plan. However, passage through the sea area between Mudou Island of Penghu and the wind farms on the western side off Changhua is discouraged [16].
For each fishing operation, recorded parameters included the date, geographic coordinates (Longitude and latitude), fishing duration, species identification, catch weight (kg), and abundance (number of individuals). To control the quality of protocols used the data which lack of above-element would be filtered out from this study. To characterize the spatiotemporal structure of fishery resources, biological data were aggregated to calculate seasonal ecological dominance indices. Furthermore, species were categorized into three ecological guilds based on habitat preferences documented in the fish database of Taiwan (https://fishdb.sinica.edu.tw/ (accessed on 9 August 2026)) and FishBase (https://www.fishbase.se/ (accessed on 9 August 2026)): nearshore benthopelagic, demersal (or reef-associated), and pelagic oceanic. Relative abundance for each species and ecological group was subsequently quantified using the following equation:
C a t c h   r a t e i = C a t c h i E f f o r t i
Catch ratei: the catch rate of species per fishing day i (kg/fishing days).
Catchi: the catch of species i (kg).
E f f o r t : the fishing effort i (fishing day).

2.2. Biodiversity Indices

(1)
Index of Relative Importance (IRI)
To quantify species dominance and ecological significance within the fish assemblage, the Index of Relative Importance (IRI) was calculated [17]. While originally established for dietary analysis, this metric is extensively applied in fisheries research to characterize community structure. The IRI was computed using the following equation adapted for fishery assemblages:
IRIk = (%Nk + %Wk) × %Fk
where %Nk, %Wk, and %Fk represent the percentage of numerical abundance, biomass (catch weight), and frequency of occurrence for species, respectively. Based on the calculated values, species were stratified into three categories of ecological significance: dominant species (IRI 1000), important species (100 IRI < 1000), and common species (10 IRI < 100) [18,19].
(2)
Shannon Diversity and Pielou’s Evenness Indices
The Shannon diversity index (H′) was employed to quantify fish community diversity and facilitate comparisons of assemblage variation among sampling stations [20]. Elevated index values generally signify greater species diversity, a condition often associated with stable environmental regimes. In contrast, lower diversity values typically indicate communities dominated by a limited number of species, a characteristic frequently observed in environments subject to strong hydrological variability. To augment this analysis, Pielou’s evenness index (J′) was computed to evaluate the uniformity of individual distribution among species [21]. As a derivative of H′, this metric quantifies the degree to which individuals are proportionally distributed across taxa, providing complementary insights into the structural complexity of the fish community.

2.3. Seasonal Catch Composition Analysis

To elucidate temporal variations in the relative contribution of fish species across different wind farm development phases, seasonal catch composition was analyzed. The percentage composition of each species was derived from total biomass for each season using the following equation:
C a t c h   c o m p o s i t i o n k   ( % ) = W k W t o t a l × 100
where W k is the total catch weight of species k during the season, and W t o t a l is the denotes the aggregate catch weight of all species collected within the same period. This metric quantifies the proportional contribution of individual taxa to the total assemblage, facilitating the assessment of species dominance and community shifts in response to seasonal dynamics and offshore wind farm development stages.

2.4. Compared the IRI Value Variation Through Different Phases

To quantify the degree of similarity in species composition between different phases, Pianka’s niche overlap index (Oj,k; Pianka, 1973 [22]) was calculated as follows:
O j k = i = 1 S P i j P i k i = 1 S P i j 2 i = 1 S P i k 2
where P i j and P i k represent the proportional importance of species i in phase j and phase k , respectively, derived from the standardized percent index of IRI (Pi,phase(j or k) = %IRIi,phase(j or k)). S denotes the combined pool of recorded species across both phases. Overlap values range from 0 (complete dissimilarity) to 1 (identical composition), with O j k   0.60 considered biologically significant overlap [23] (Wallace, 1981).

2.5. Income per Unit Effort (IPUE)

To evaluate the economic performance of commercial fisheries in the waters adjacent to Taichung and Changhua, the Income Per Unit Effort (IPUE) was utilized as a primary indicator. Species-specific wholesale prices were derived from the transaction database managed jointly by the Fisheries Agency (https://www.fa.gov.tw/ (accessed on 9 August 2026)) and the Aquaculture Development Foundation (https://efish.fa.gov.tw/efish/statistics/reportmap.htm (accessed on 9 August 2026)), supplemented by regional government fishery statistics and direct consultations with local fishers. These data were synthesized to establish representative average prices for economically important species captured within the study area (Appendix A). All monetary values in this evaluation are expressed in New Taiwan Dollar (NTD). The IPUE was subsequently calculated to quantify the monetary value generated per unit of fishing effort using the following equation:
I n c o m e   p e r   u n i t   e f f o r t ( I P U E ) i   = i = 1 j = n C a t c h i   ×   N T D i E f f o r t i
I P U E i : The revenue generated from species i per unit of fishing effort (NTD/trip/day).
Catchi: The total catch weight of species i (kg).
N T D i : The average market price of species i (NTD).
E f f o r t : The fishing effort (fishing day).

3. Result

3.1. Characterization of Fishing Effort for Gillnet and Trawl Fisheries

Daily catch records from gillnet and trawl fisheries in the coastal waters off Changhua were compiled for analysis. Gillnet fishery data were collected from January 2016 to October 2024, whereas trawl fishery data were obtained from November 2018 to October 2024. The compiled dataset indicates that gillnet operations consisted primarily of vessels in the CTR, CTS, and CT1 tonnage classes. The CTS class represented the dominant portion of the fleet (26 vessels), accounting for the majority of the annual total fishing days (109,406 days), followed by the CTR (4 vessels) and CT1 (1 vessel) classes (Table 1). For the trawl fishery, data were obtained exclusively from vessels in the CT3 tonnage class (4 vessels). Seasonal patterns of fishing activity showed that the number of fishing days was highest in autumn (48,946 trips) and summer (46,279 days), followed by spring, whereas winter exhibited the lowest activity, with only 12,214 fishing days recorded for gillnet fishery. For trawling fishery, the highest numbers of fishing days showed in summer (808 days) and lowest value showed in 376 days in winter (Table 1).
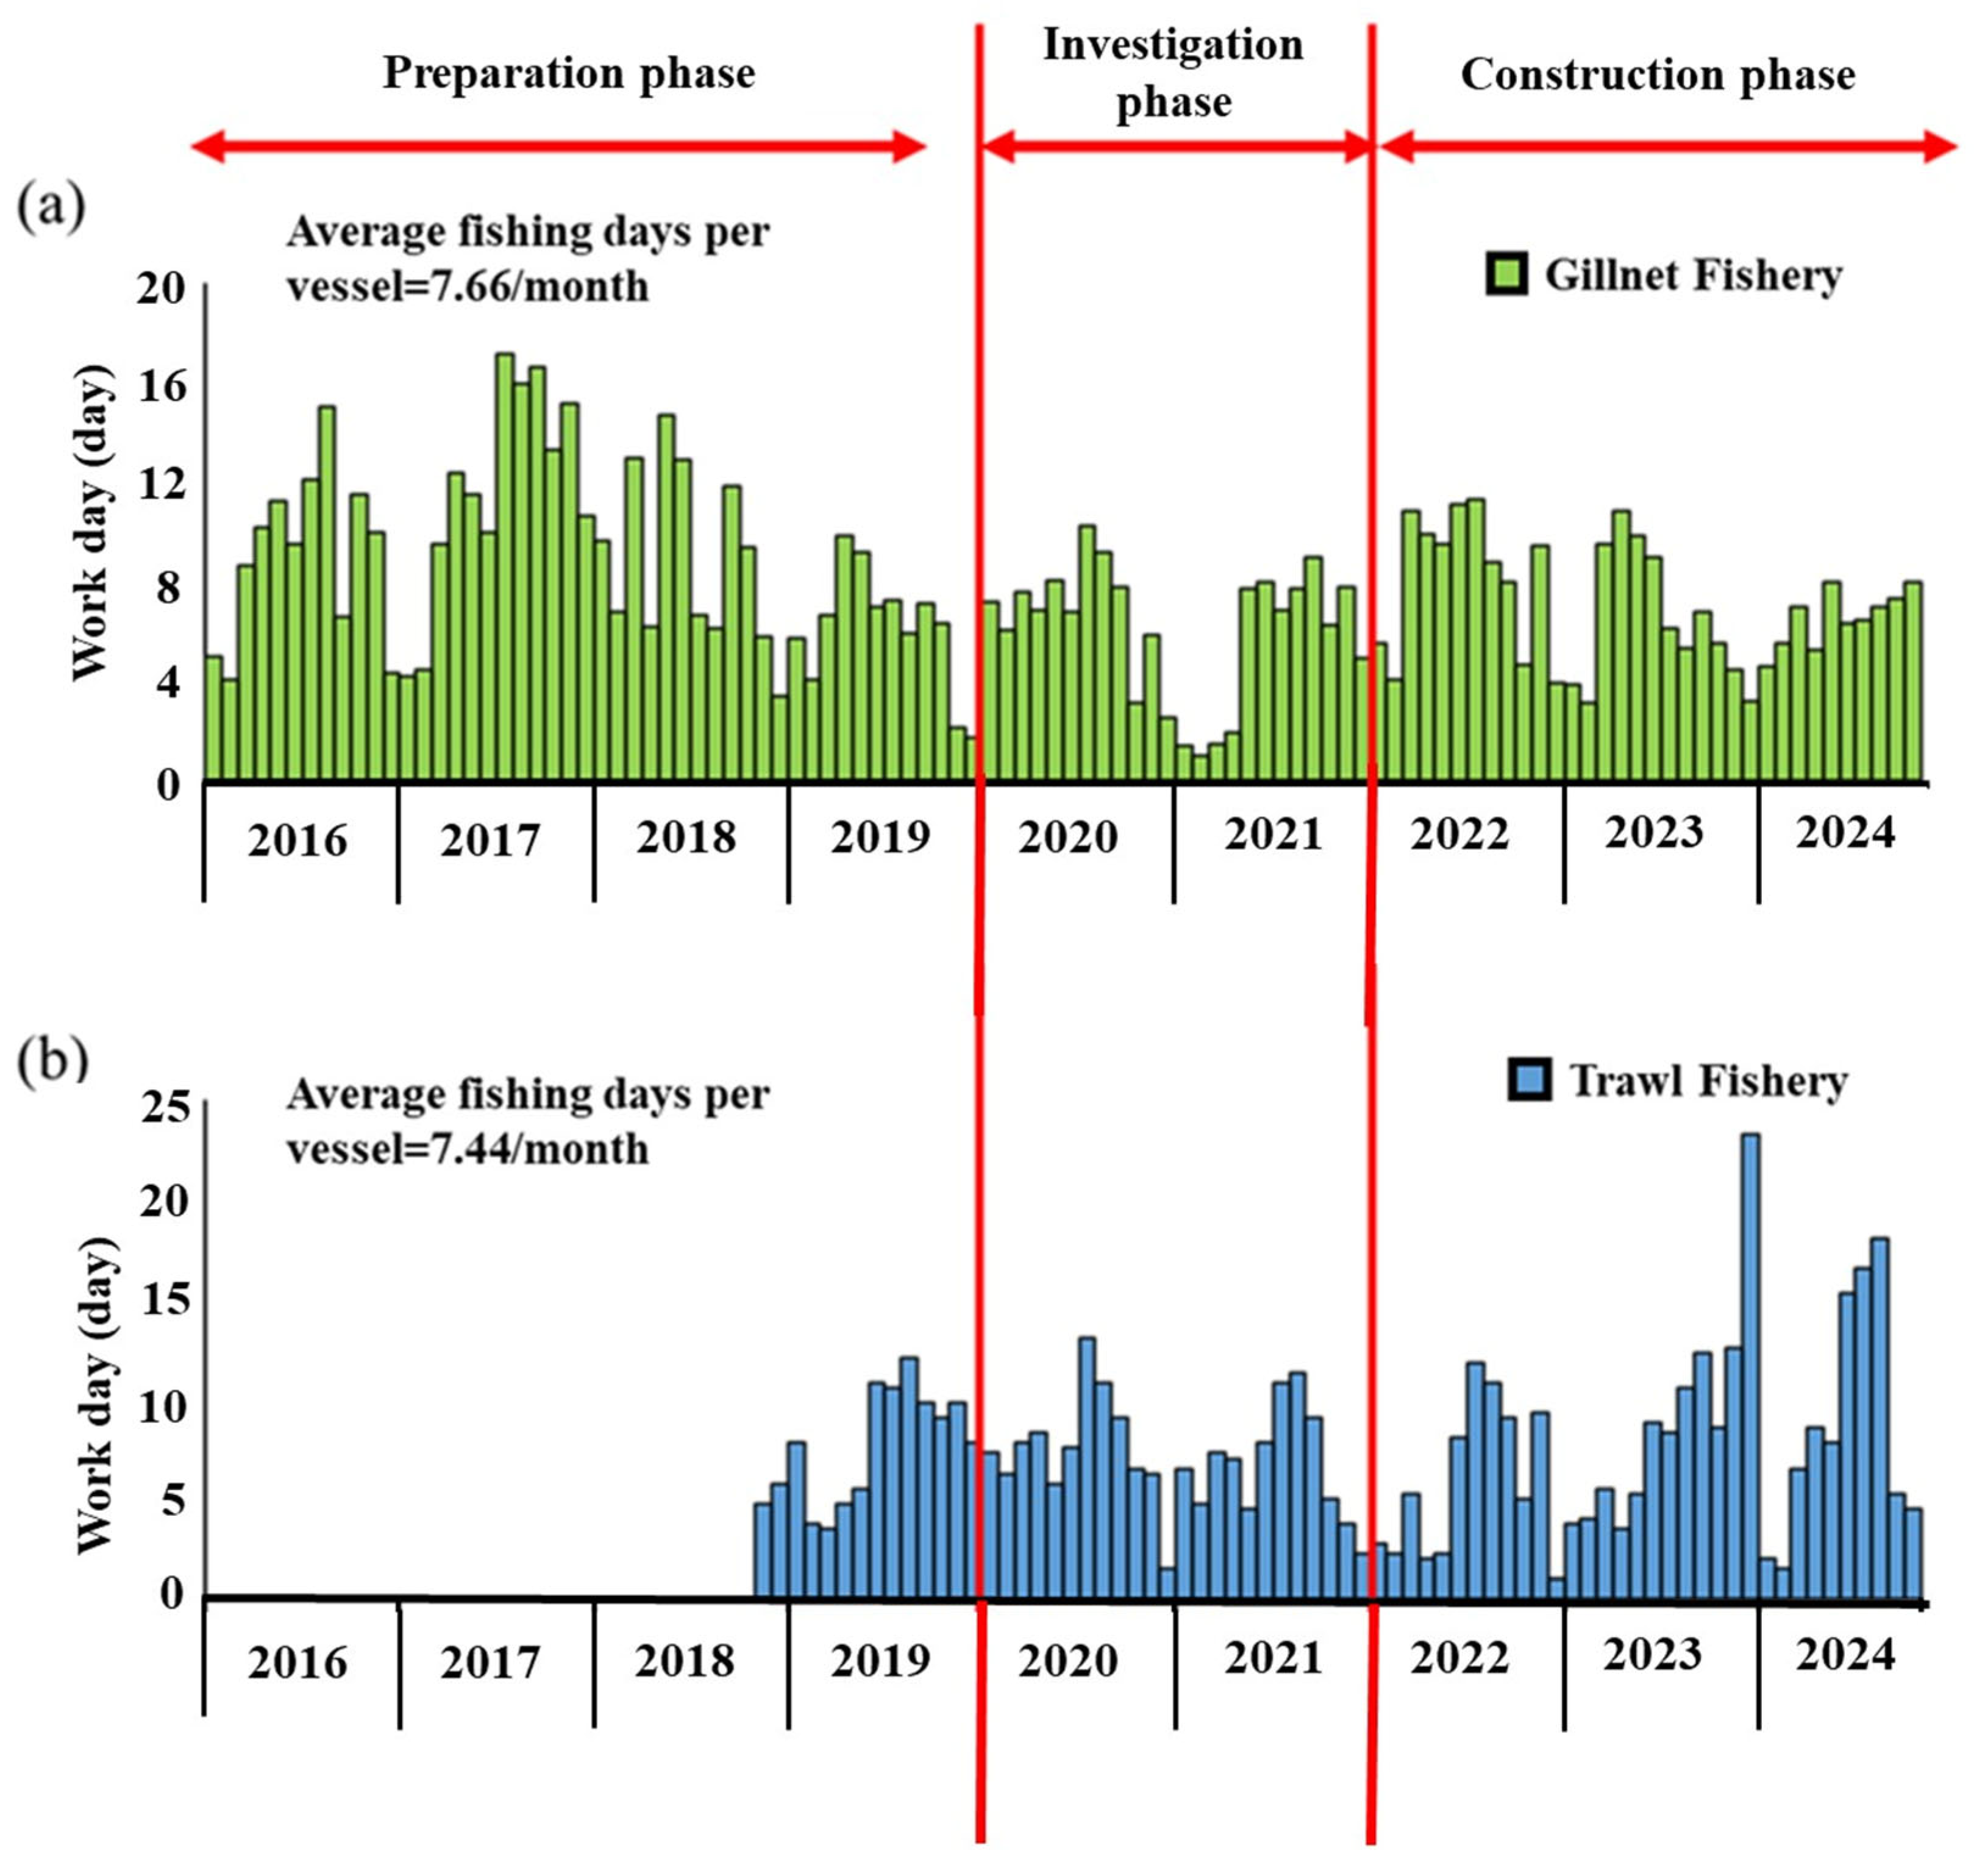
The monthly variations in the average number of fishing days for gillnet and trawl vessels show that gillnet vessels operated an average of 7.66 days per month, while trawl vessels operated 7.44 days per month (Figure 1). However, temporal trends differed significantly between the two fisheries. During the preparation period, the number of gillnet fishing days was consistently higher than during the subsequent investigation and construction periods. Specifically, a distinct decline in gillnet activity was observed during the investigation period (2020–2021), although seasonal low activity remained consistent from January to March across all years (Figure 1a). Conversely, for trawl fisheries, operational intensity appeared to increase during the later stages, with the construction period exhibiting high variability and peak fishing effort exceeding 20 days per month in late 2023 (Figure 1b).

3.2. Spatial Variations in Fishing Effort of Gillnet and Trawl Fishery

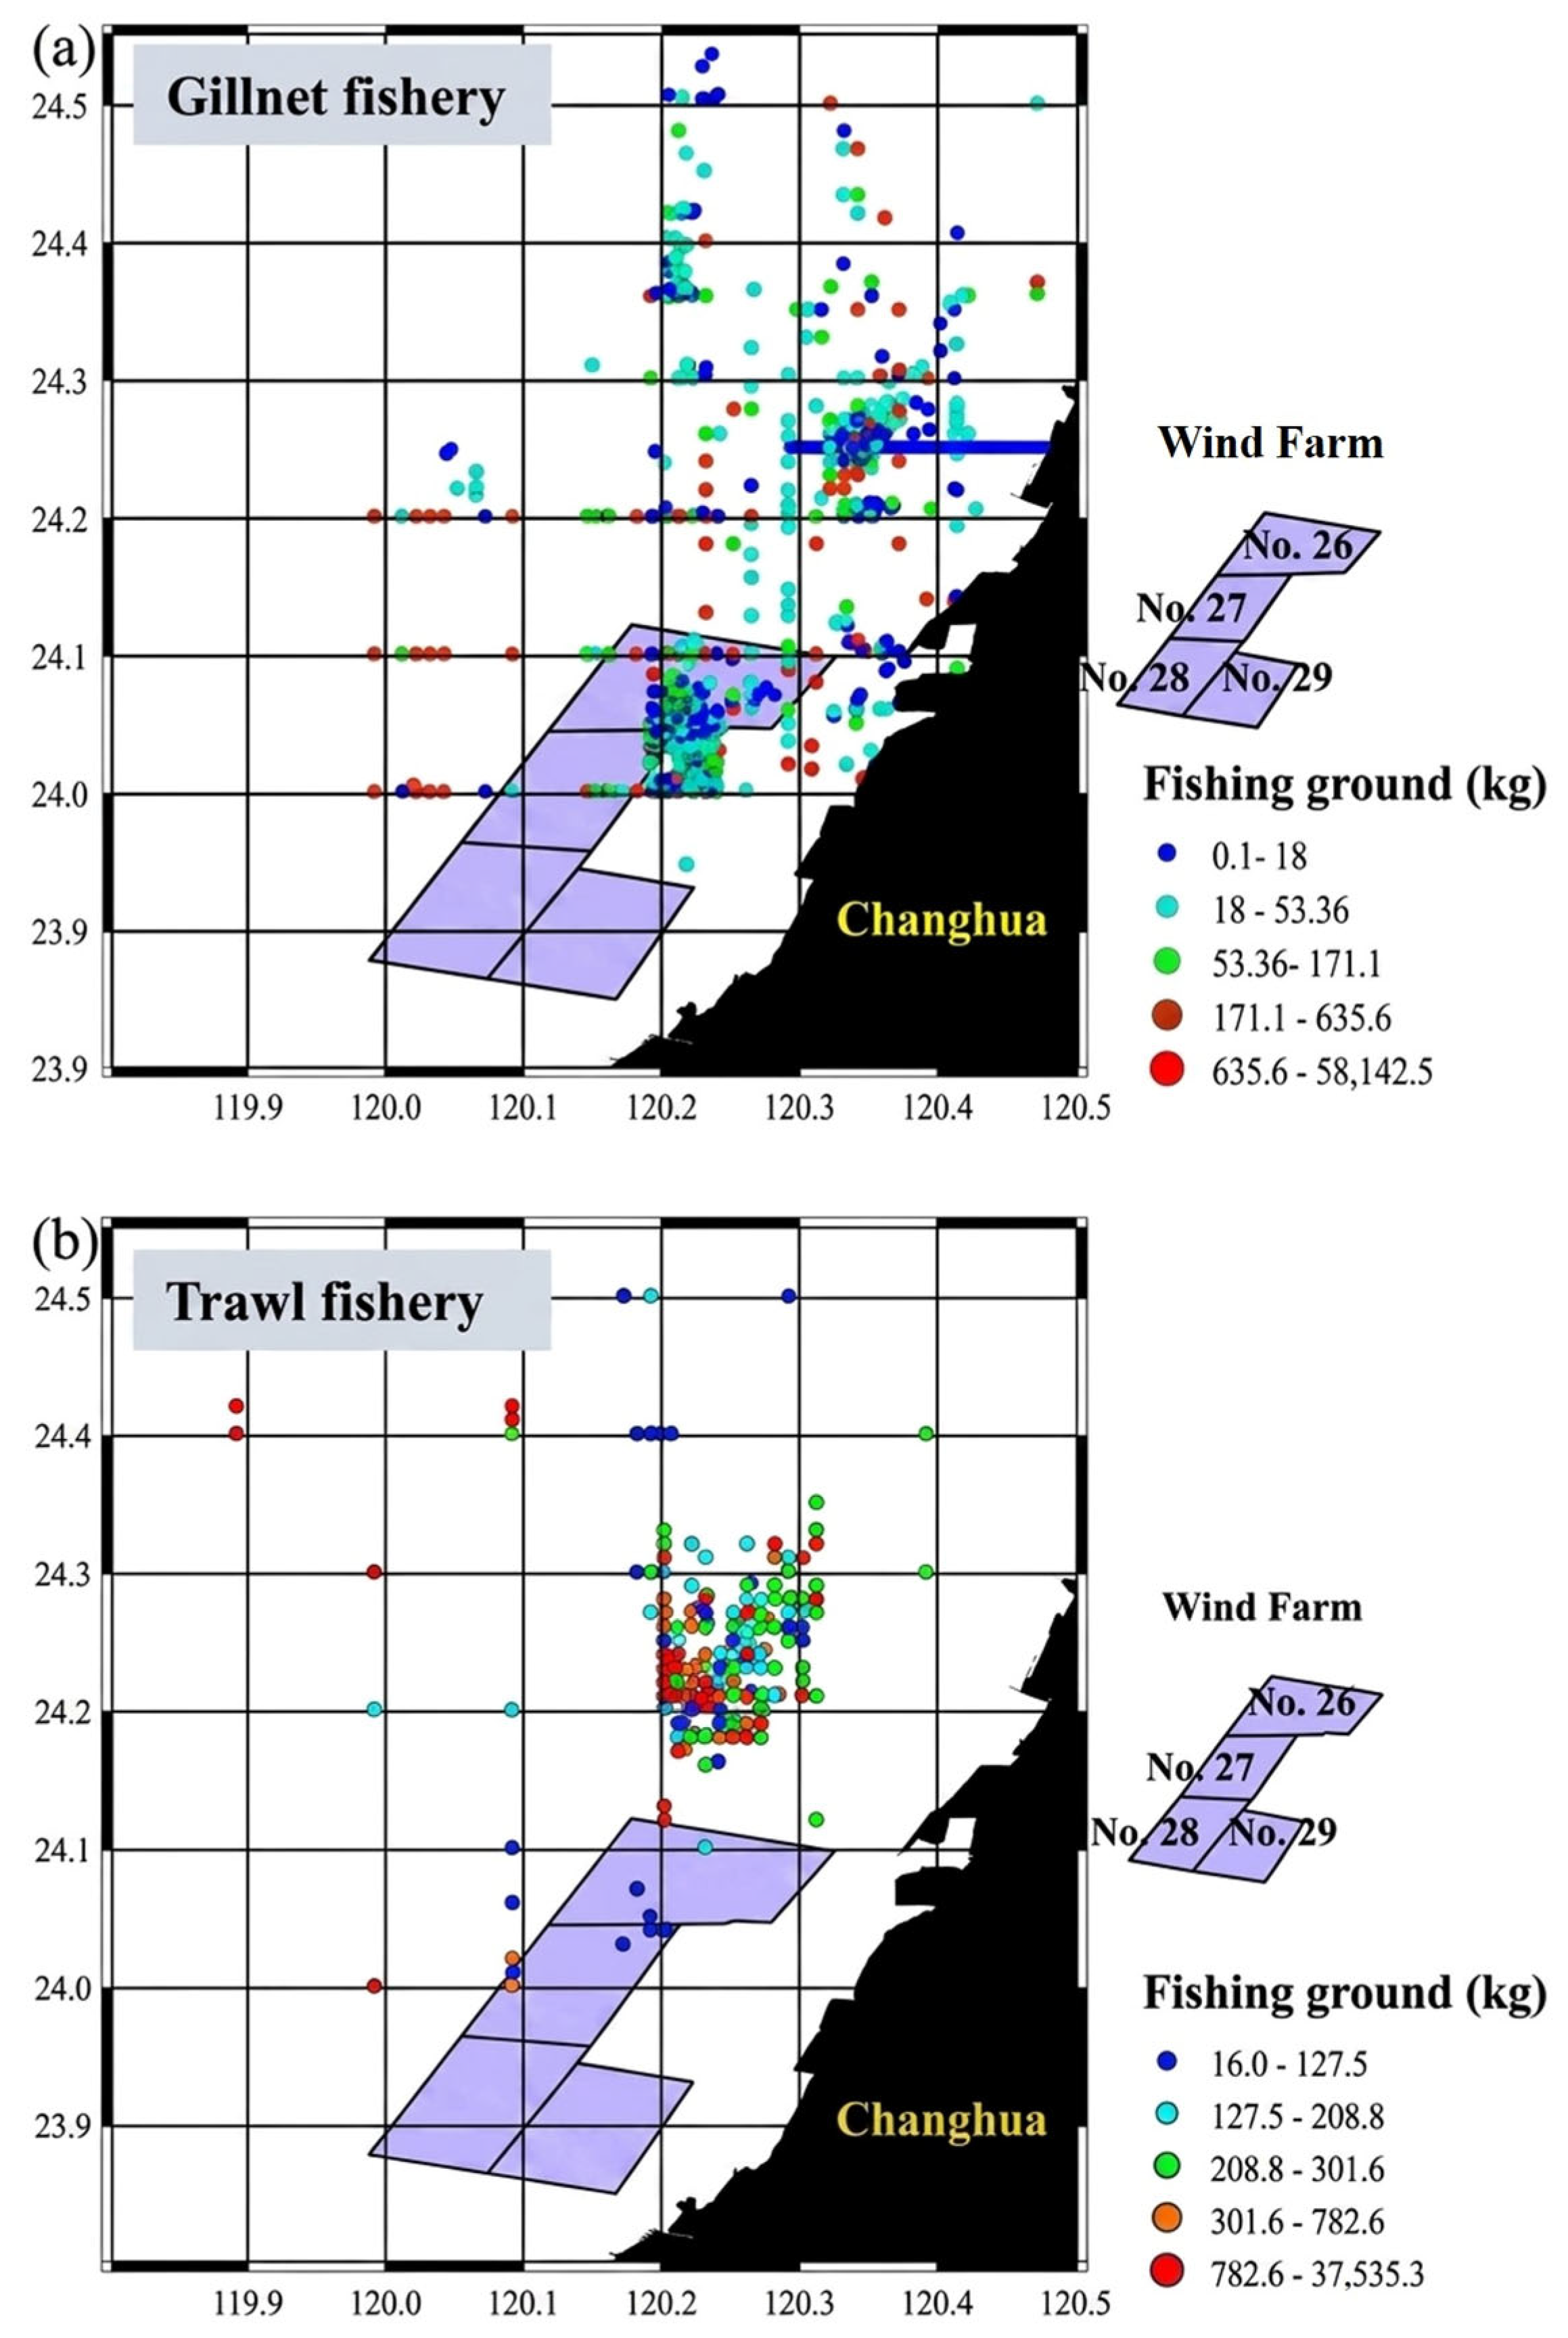
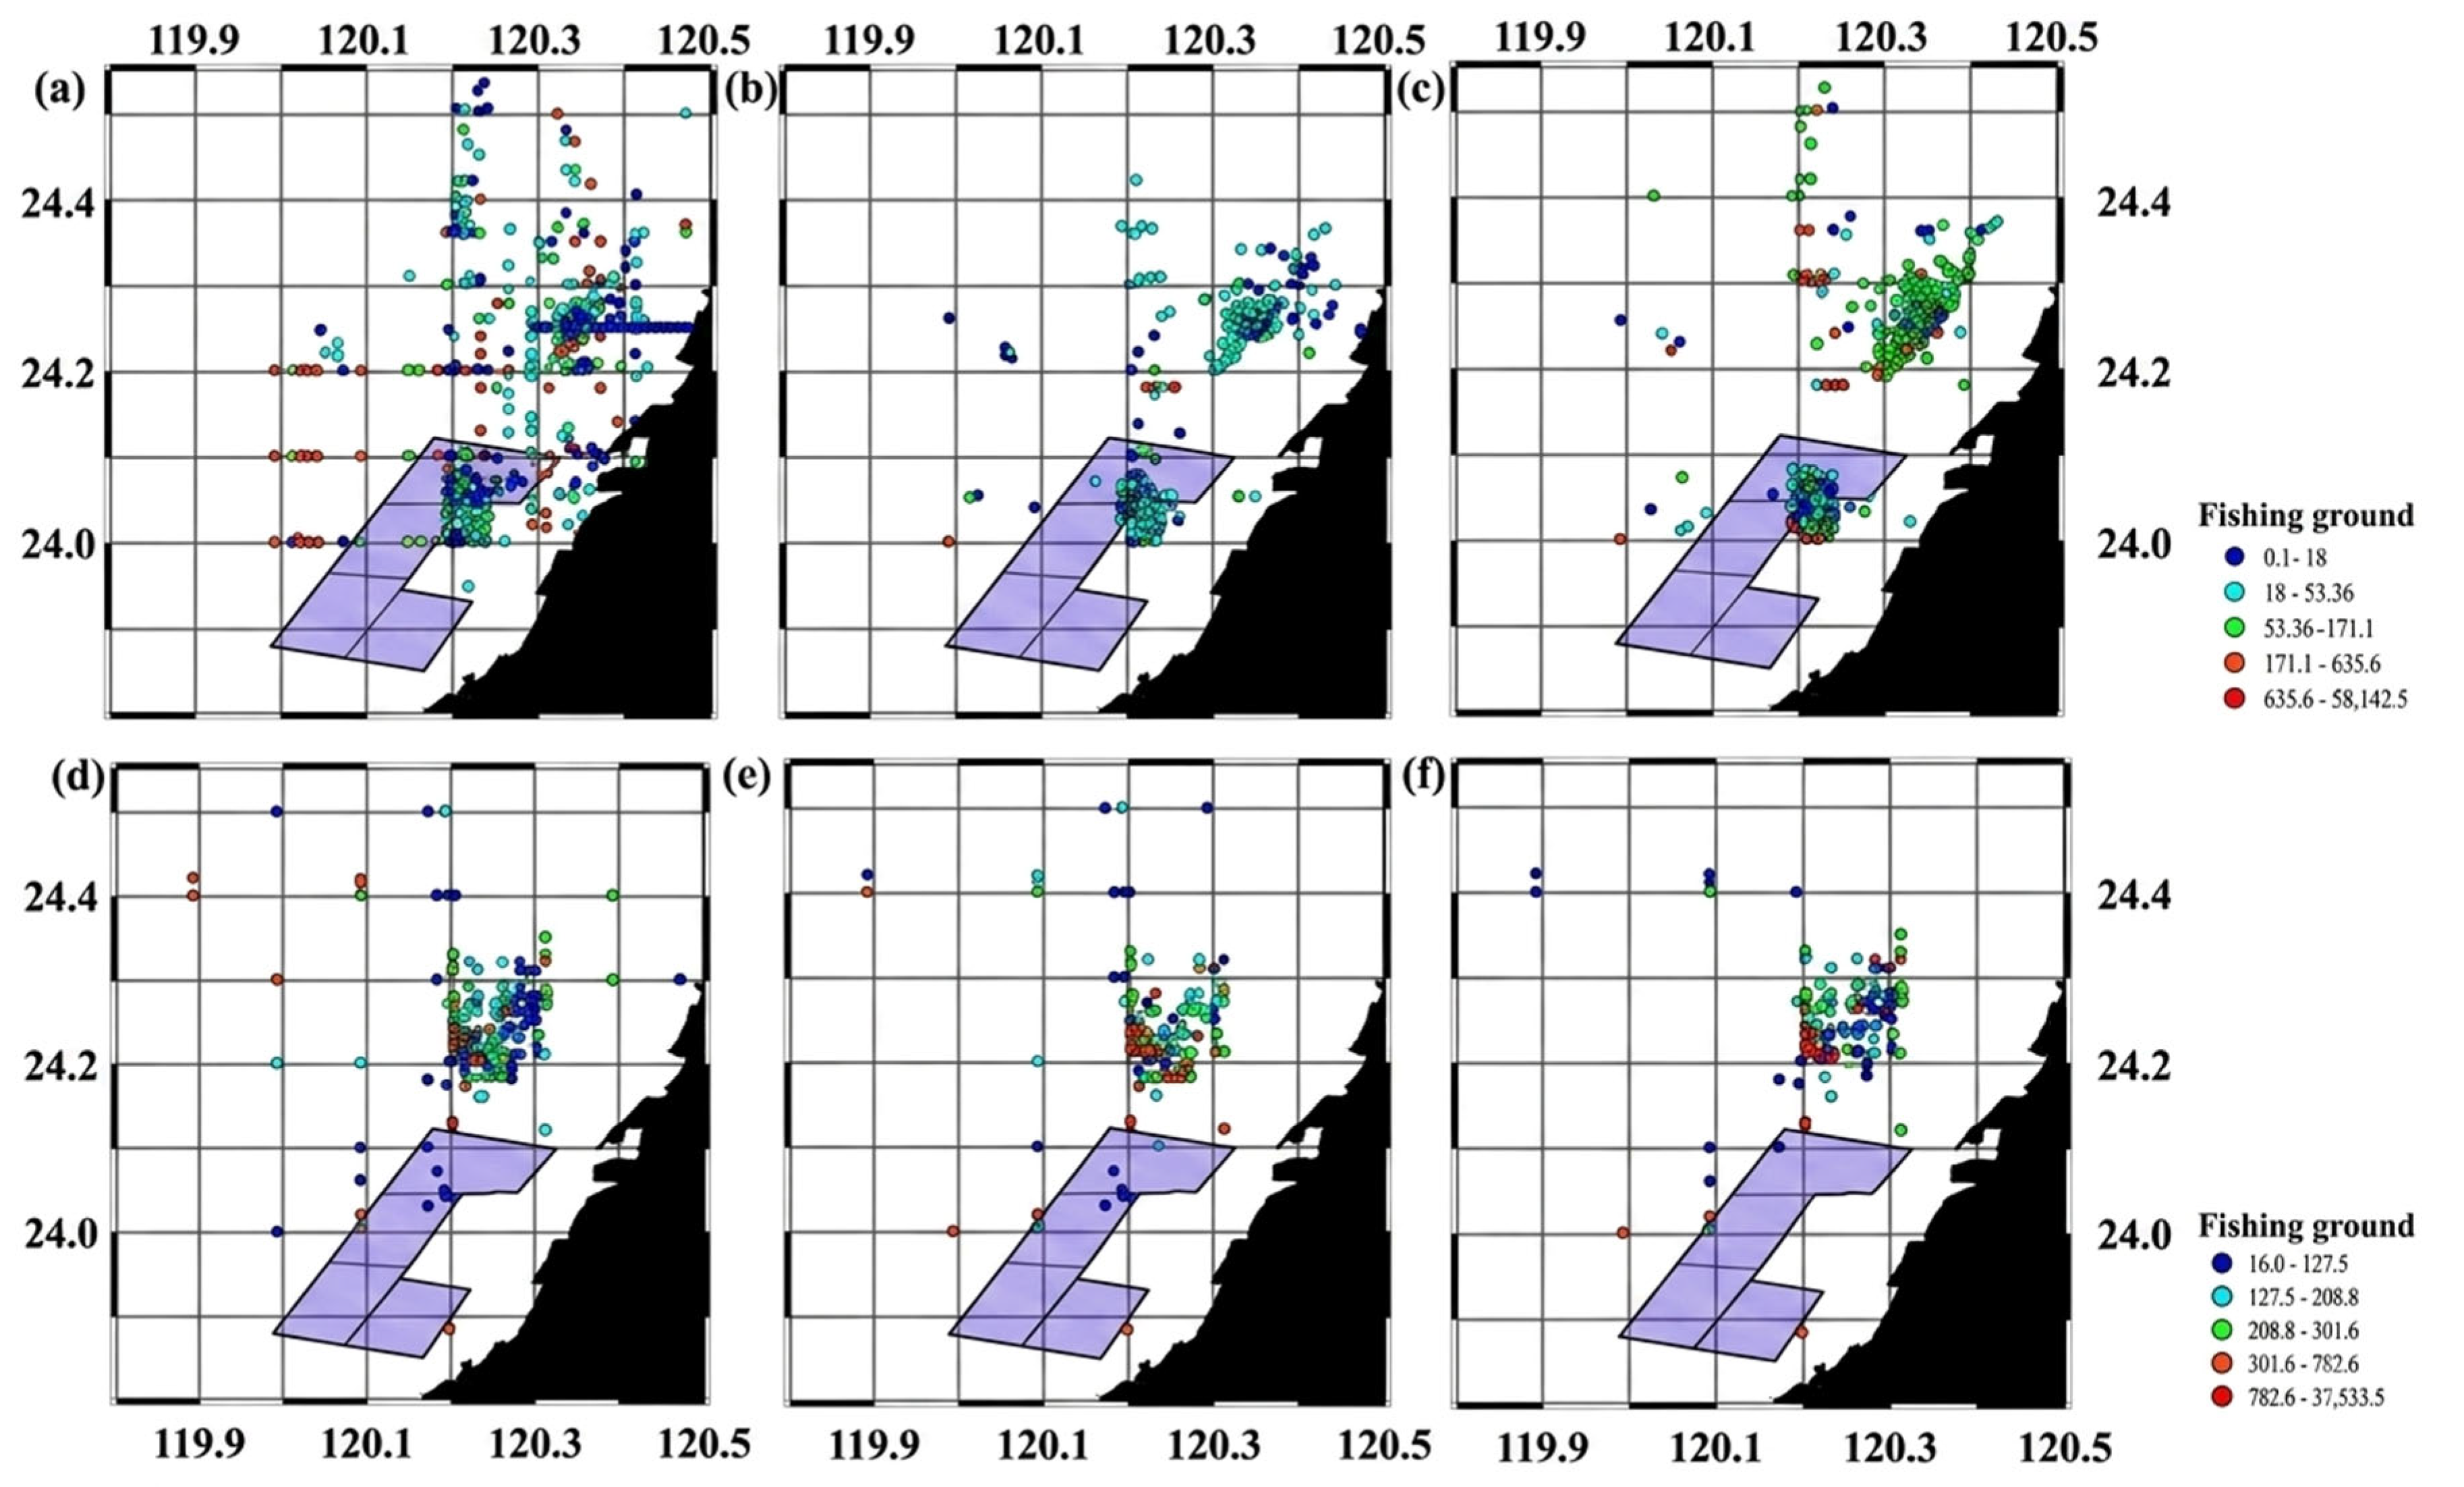
The spatial extent of fishing operations for gillnet and trawl fleets is depicted in Figure 2. Gillnet fishing grounds exhibited a broad latitudinal distribution, spanning from 24.0° N to 24.5° N and 120.1° E to 120.4° E, with significant operational overlap observed within the boundaries of Wind Farms No. 26 and No. 27 (Figure 2a). In contrast, trawl fishing effort was predominantly aggregated in the waters north of the wind farm development zone, clustered between 24.1° N and 24.3° N and 120.2° E to 120.3° E (Figure 2b). To assess the impact of development stages, spatiotemporal shifts in fishing grounds were analyzed across the three defined phases (Figure 3). During the preparation period phase (2016–2019), gillnet fishing grounds were widely distributed across the coastal waters off Taichung and Changhua, covering the designated areas of Wind Farms No. 26 (finished underwater pile driving operations in 2024;) and No. 27 (not started constructed) (Figure 3a–c). However, during the investigation phase (2020–2021), gillnet operations underwent a spatial contraction, becoming fragmented into two main areas: the waters adjacent to the wind farms and the peripheral zones outside the wind-farm boundaries (Figure 3b). This spatial segregation persisted into the construction phase (2022–2024) (Figure 3c). Regarding trawl fisheries, fishing activities during the preparation phase were already largely concentrated in peripheral areas outside the wind-farm boundaries, although sporadic operations occurred within the zones of Wind Farms No. 26 and No. 27 (Figure 3d). Subsequently, the spatial distribution of trawl fishing grounds showed high stability during the investigation and construction periods, with fishing activities consistently intensifying in the offshore peripheral waters north of the wind-farm area rather than within the development sites (Figure 3e–f).

3.3. Temporal Variations in Catch and Catch Rates

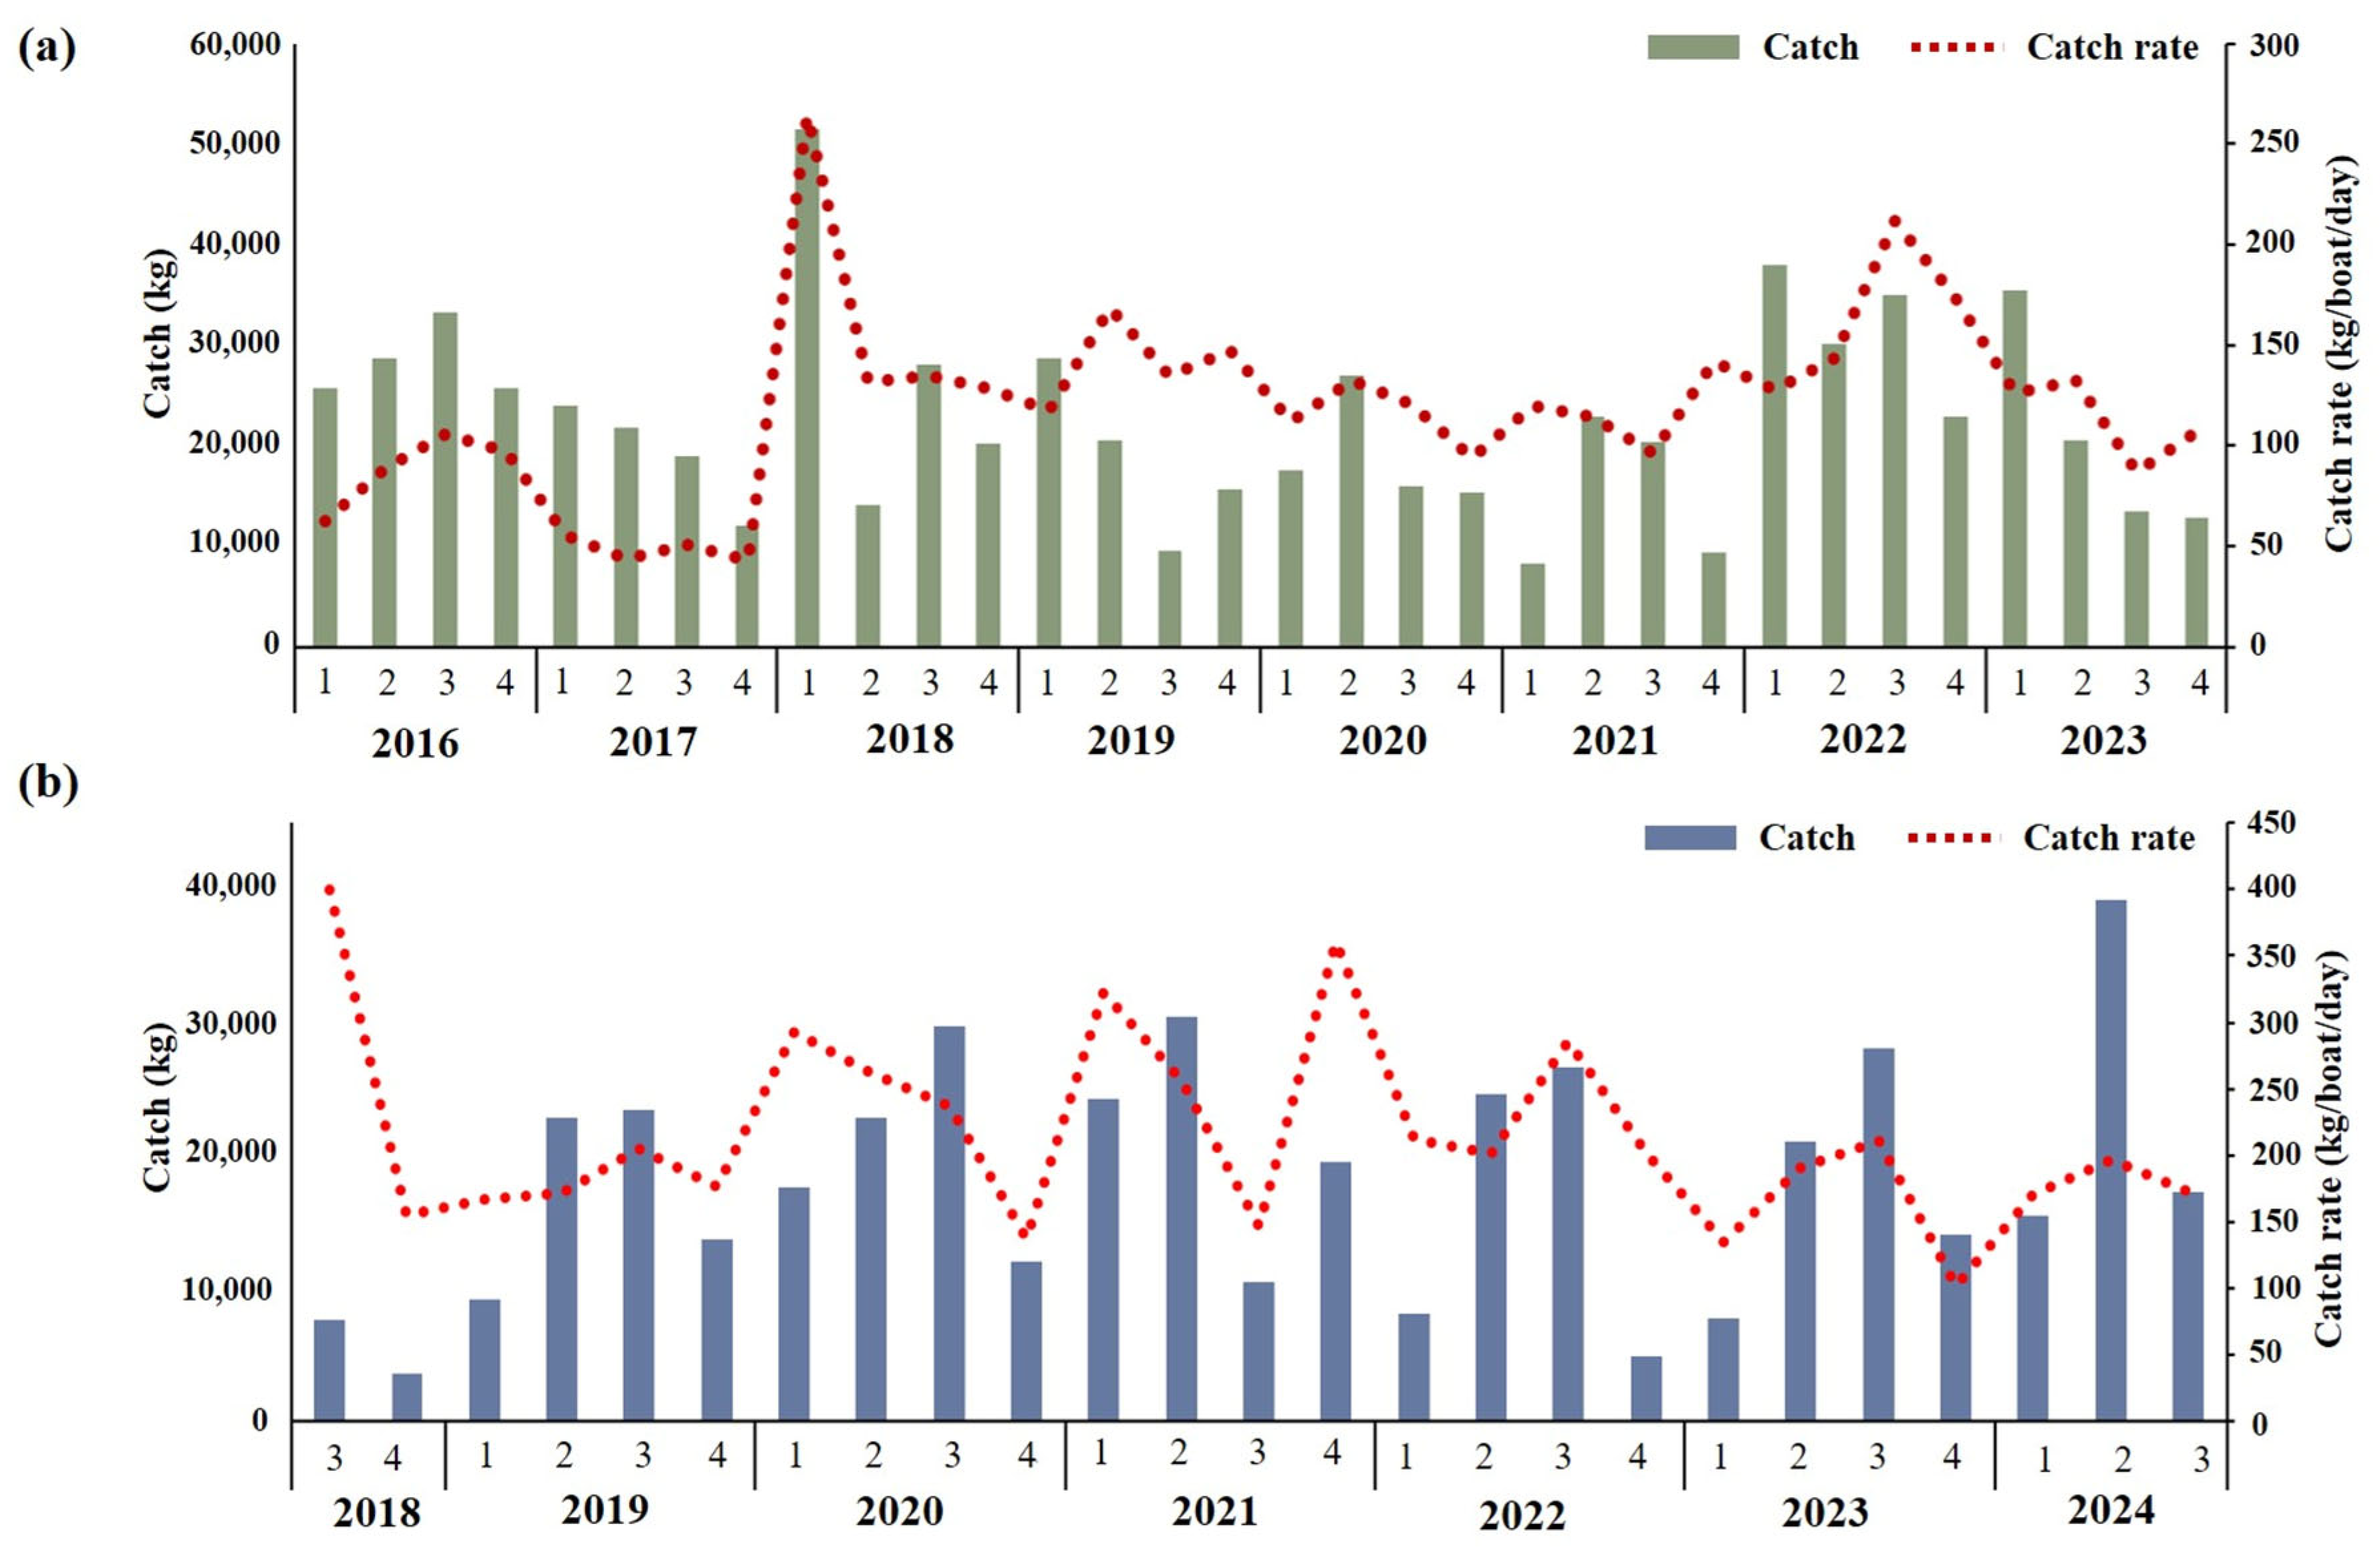
The temporal dynamics of total catch and catch rates (CPUE) for gillnet and trawl fisheries are presented in Figure 4. In the gillnet fishery, elevated catch volumes and catch rates were recorded during the preparation phase (2016–2019), with a notable peak in abundance observed in early 2018 (Figure 4). Subsequently, a comparative reduction was observed during the investigation phase (2020–2021). During the construction phase (2022–2023), although initial values were stable, a distinct declining trend in catch rates was documented over the progression of the development activities (Figure 4a). Conversely, the trawl fishery exhibited significant seasonal oscillation in both catch and catch rates (Figure 4b). Unlike the gillnet fishery, the influence of offshore wind farm development stages on trawl fishery performance appeared negligible, with no distinct deviation observed across the three phases (Figure 4b).

3.4. Seasonal Variations in Catch Composition of Gillnet and Trawl Fisheries

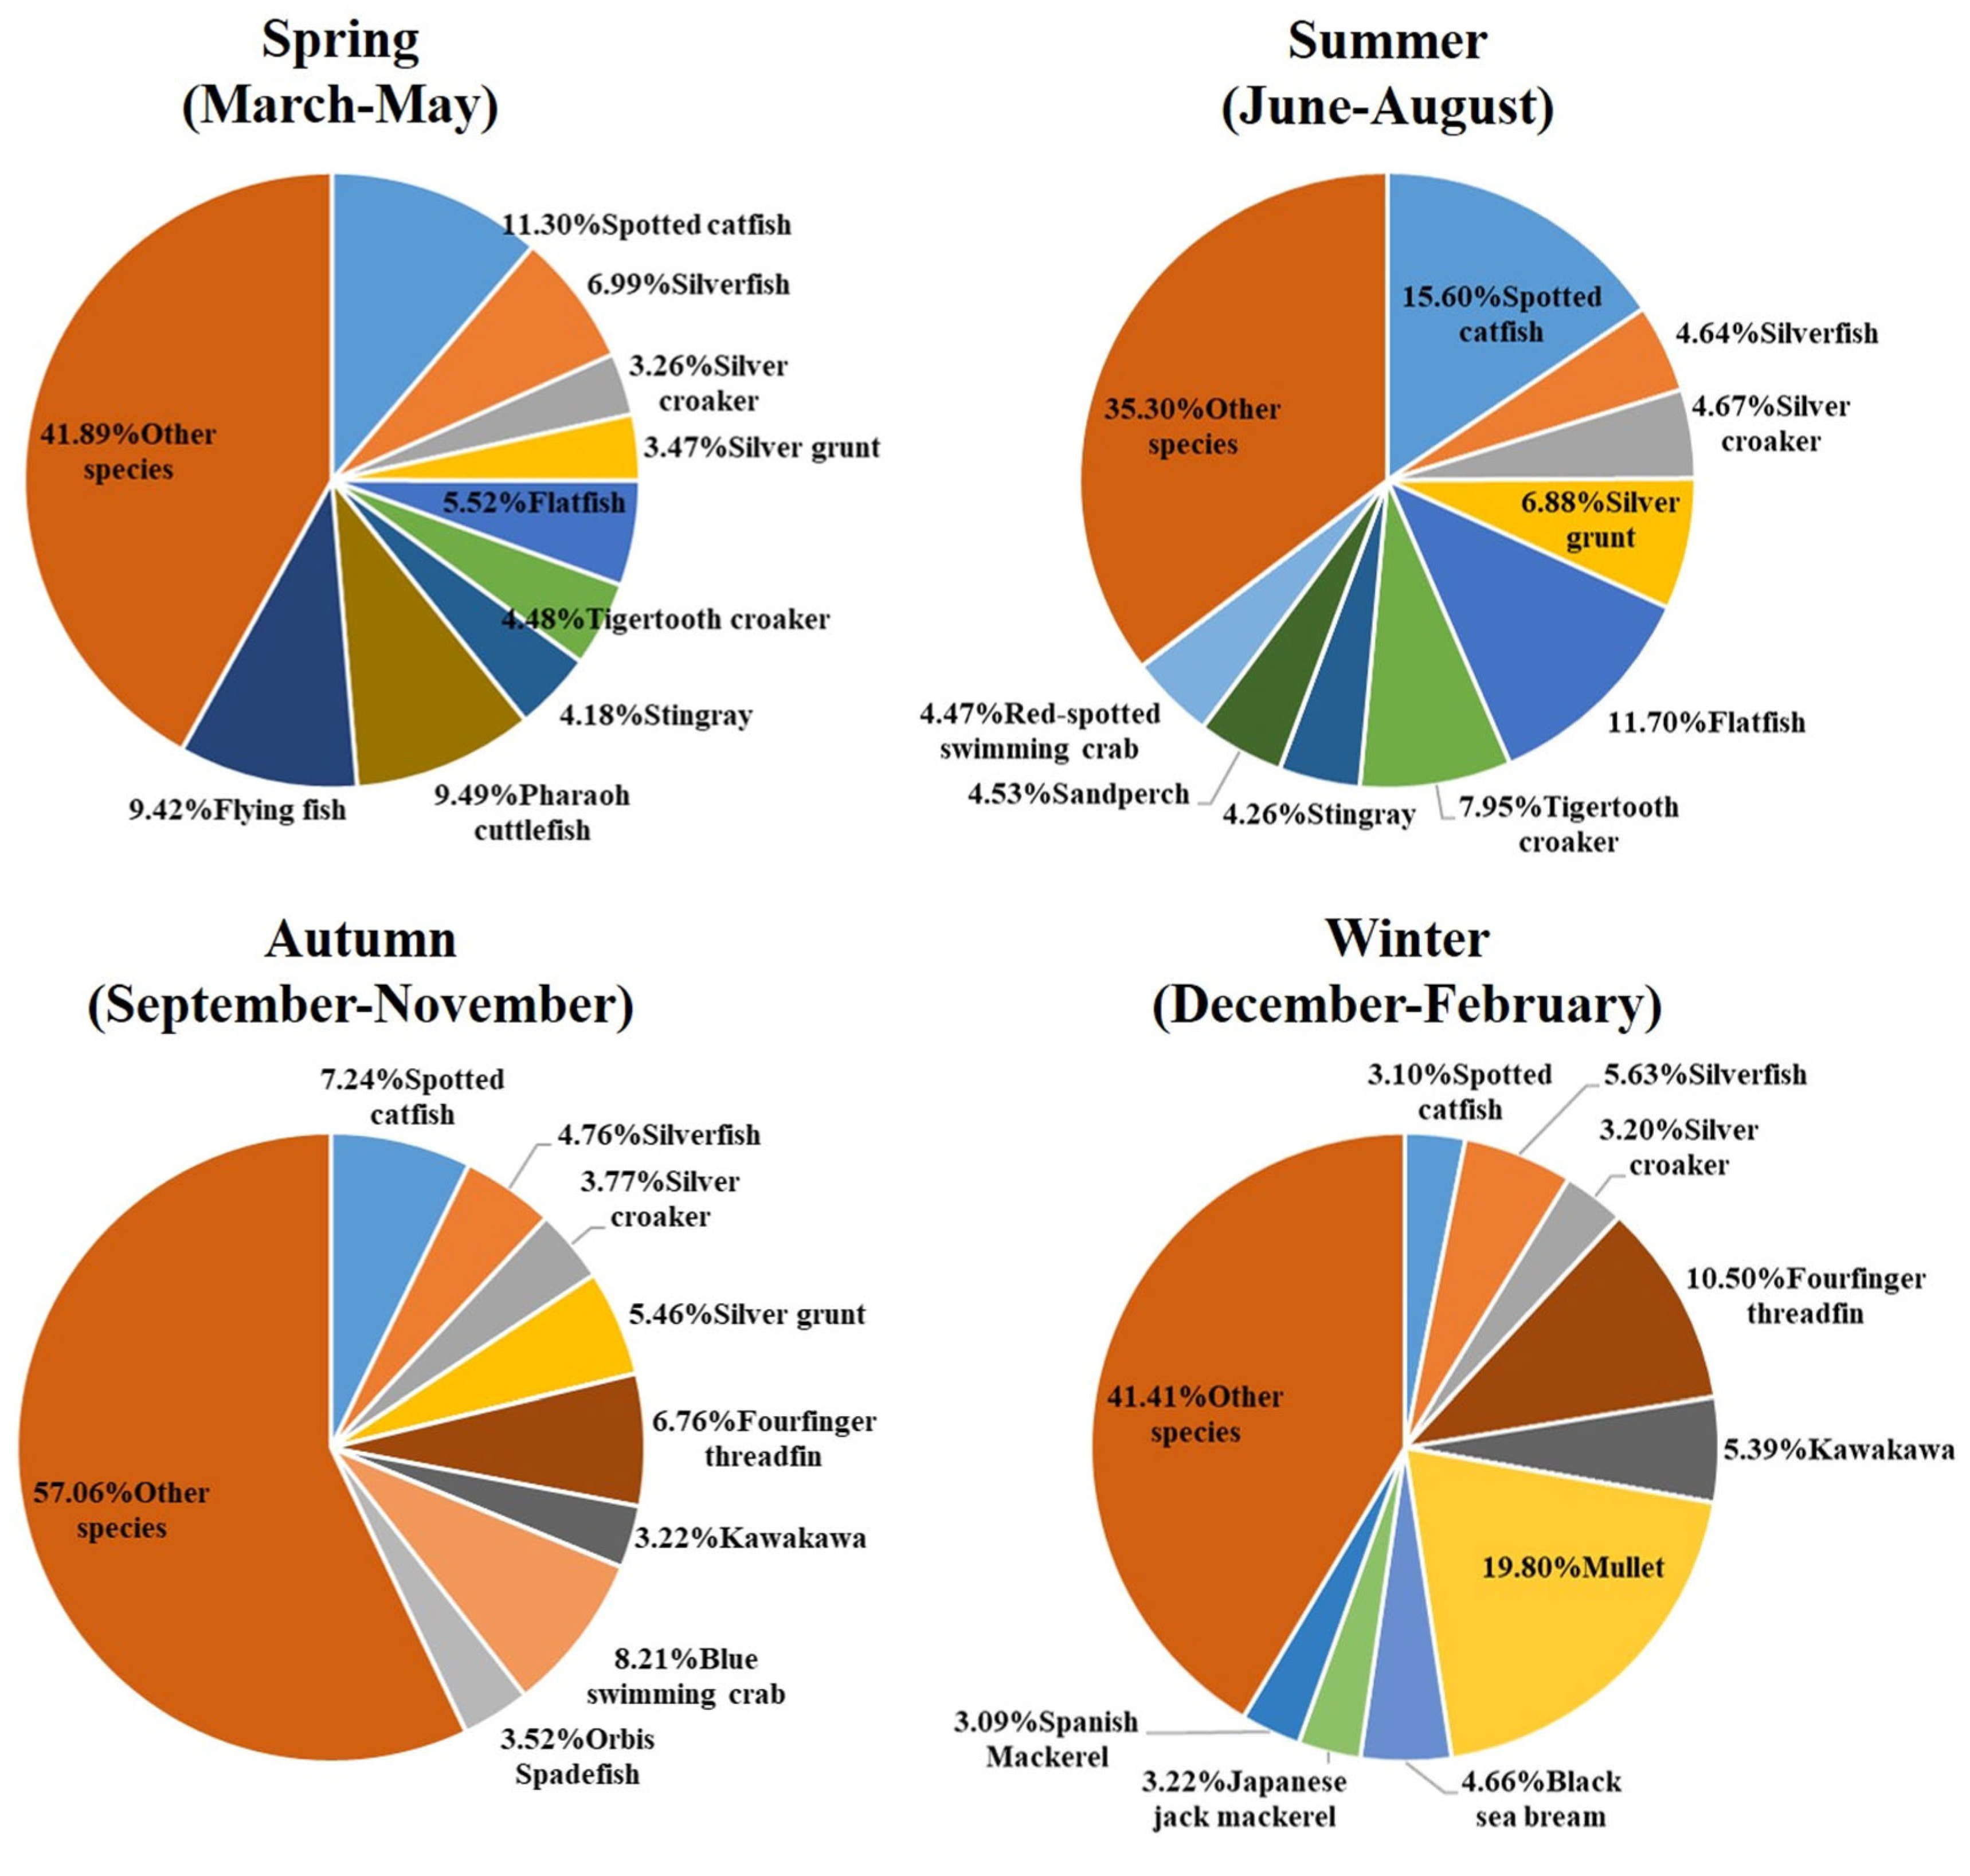
Distinct seasonal heterogeneity in species composition was evident within the gillnet fishery (Figure 5). During spring, the assemblage was dominated by spotted catfish (11.3%), pharaoh cuttlefish (9.49%), flying fish (9.42%), and silverfish (6.99%). In summer, spotted catfish (15.6%), flatfish (11.7%), and tigertooth croaker (7.95%) constituted the primary catch components. The autumn catch composition shifted toward blue swimming crab (8.21%), spotted catfish (7.24%), and fourfinger threadfin (6.76%), whereas the winter season was characterized by a high abundance of mullet (19.8%) and fourfinger threadfin (10.5%). Despite these seasonal fluctuations, spotted catfish, silverfish, and silver croaker appeared consistently across multiple seasons, indicating that these taxa represent the persistent core fishery resources in the coastal waters off Changhua (Figure 5).
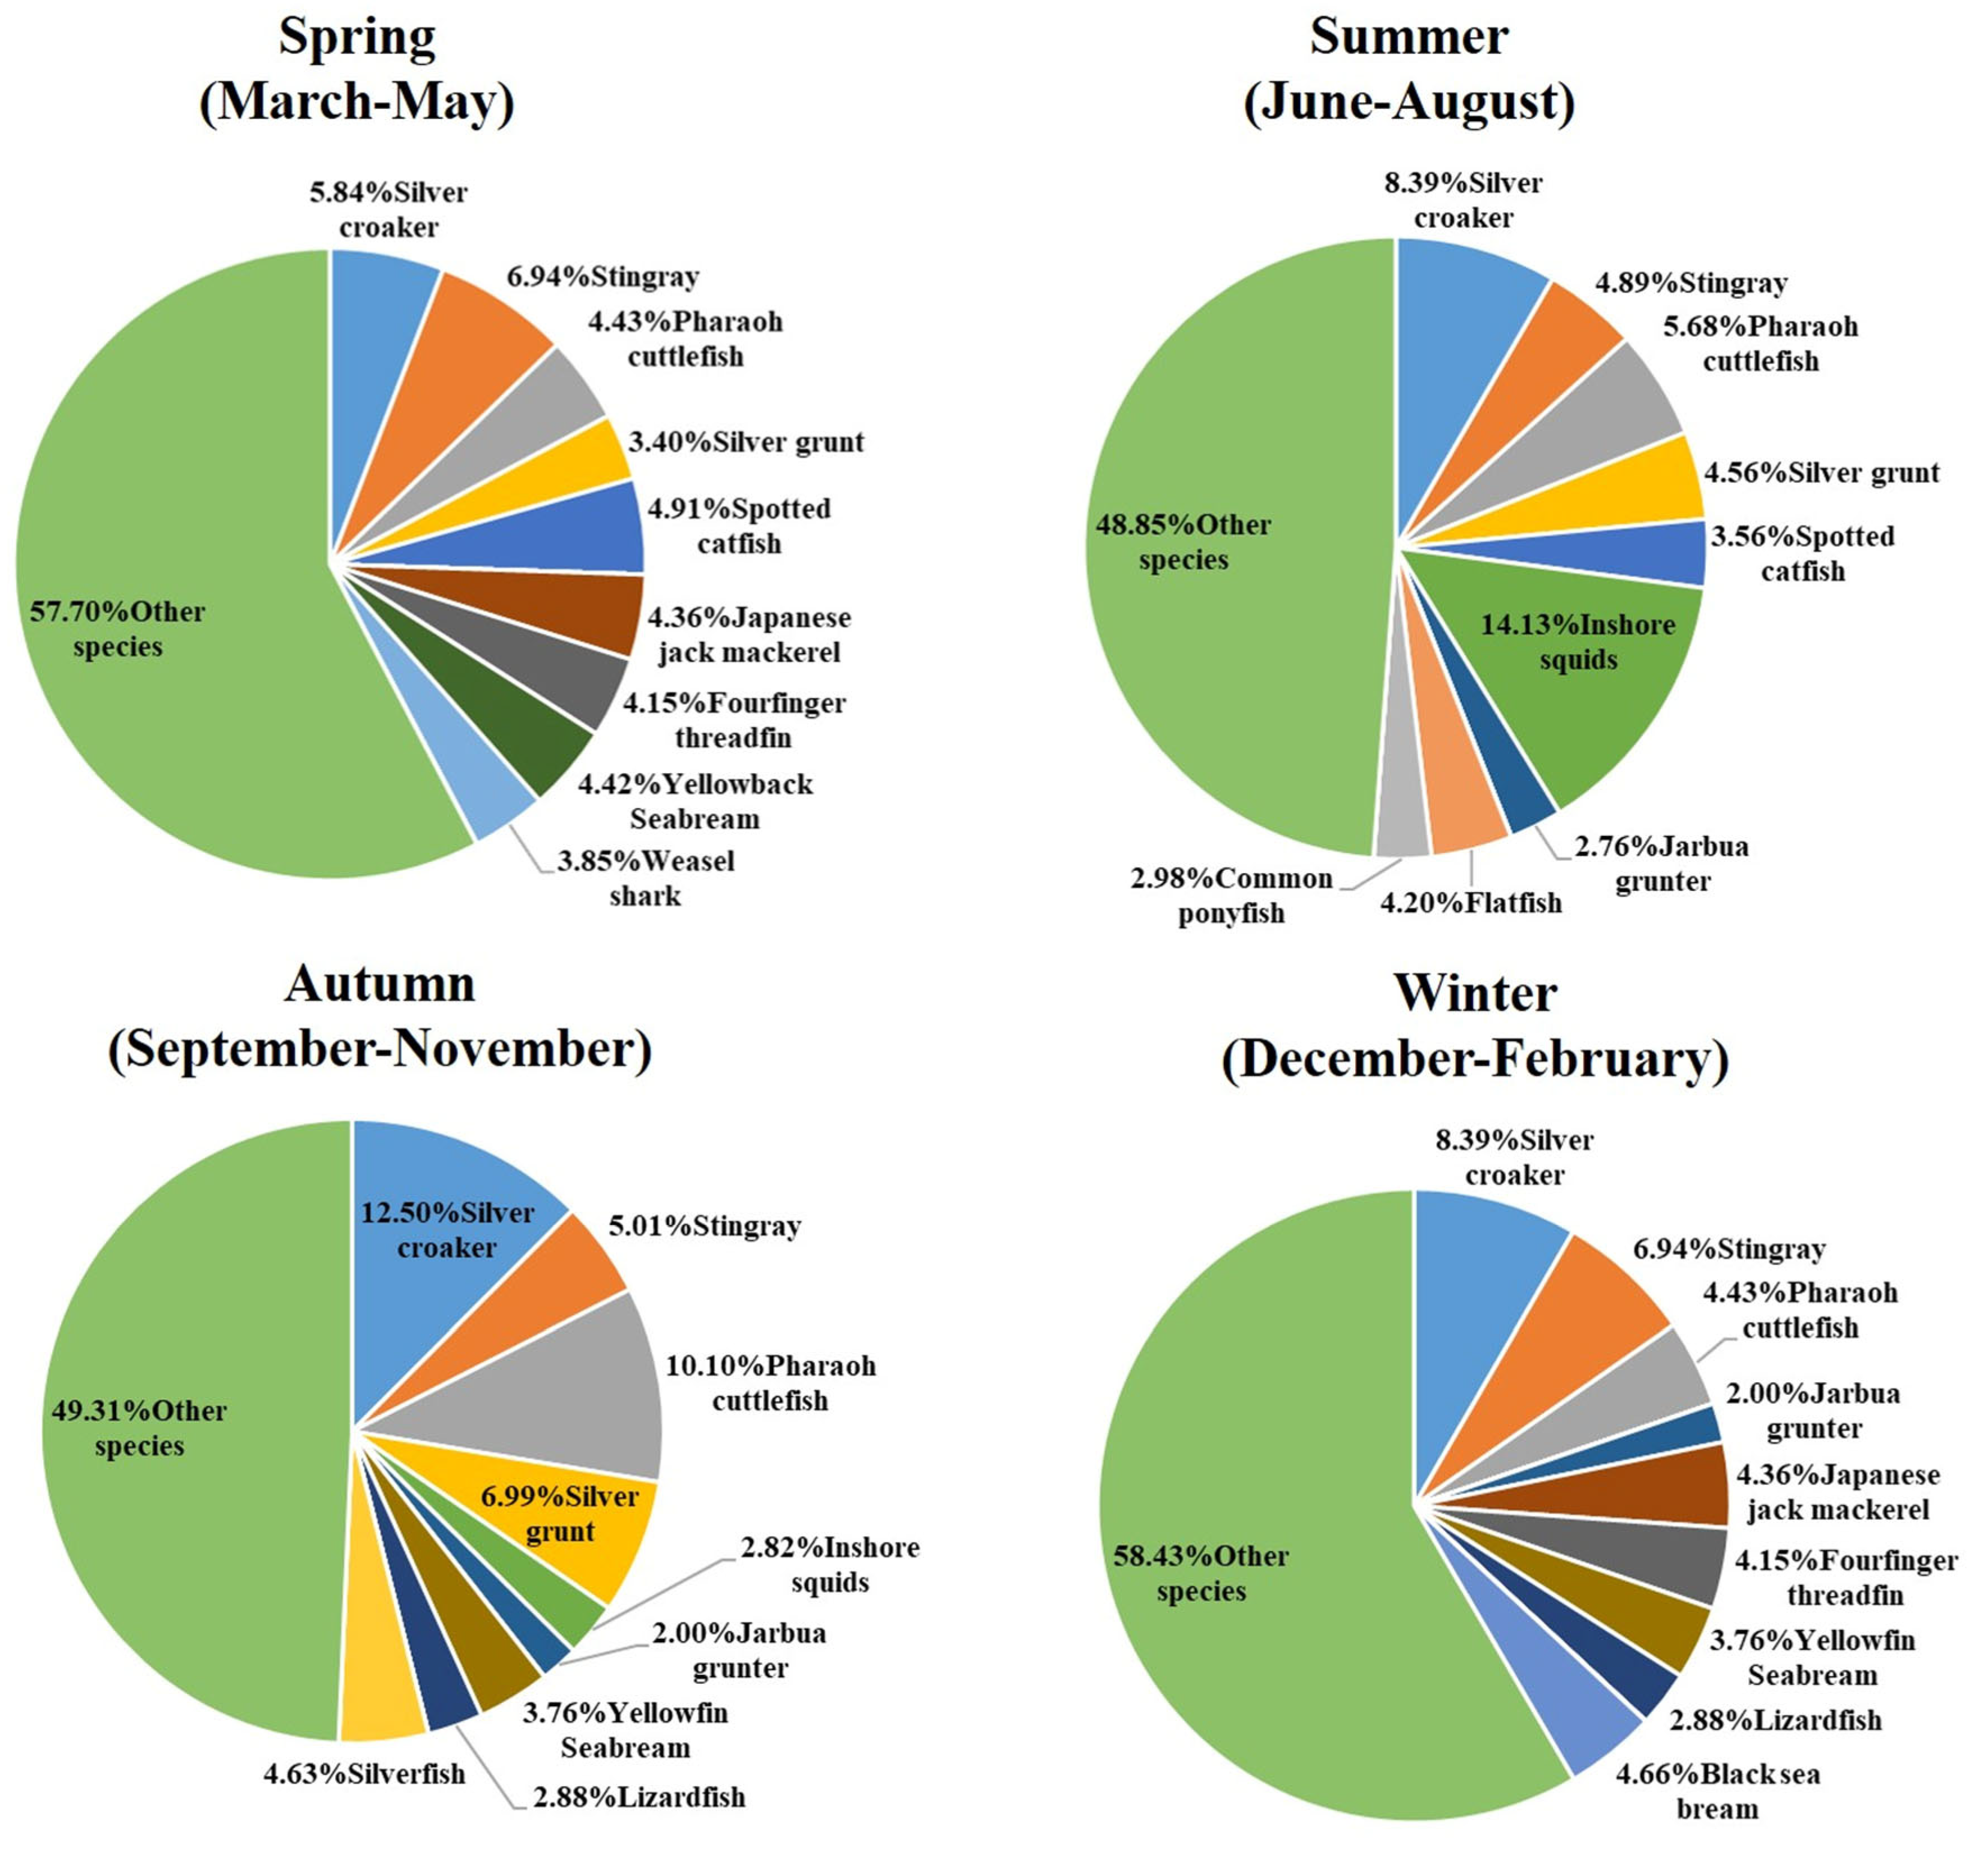
Conversely, the trawl fishery demonstrated specific seasonal assemblages (Figure 6). In spring, the catch was primarily composed of stingray (6.94%), silver croaker (5.84%), spotted catfish (4.91%), and pharaoh cuttlefish (4.43%). Summer catches were characterized by a predominance of inshore squids (14.13%), silver croaker (8.39%), and pharaoh cuttlefish (5.68%). In autumn, silver croaker (12.5%) and pharaoh cuttlefish (10.1%) remained dominant, supplemented by significant contributions from silver grunt (6.99%). During winter, silver croaker (8.39%) retained its dominance, followed by stingray (6.94%) and black sea bream (4.66%) (Figure 6).

3.5. Relative Importance and Biodiversity Indices of Gillnet and Trawling Fishery

(1)
Relative importance index (IRI)
The analysis of the Index of Relative Importance (IRI) revealed pronounced seasonal and temporal variability in the community structure of Changhua coastal waters. In the gillnet fishery, the overall assemblage was characterized by the dominance of Silver croaker (IRI = 1410), Spotted catfish (IRI = 1191), and Fourfinger threadfin (IRI = 1021) (Table 2). Distinct shifts in species dominance were observed across different wind farm development phases. During the preparation (2018–2019) and investigation (2020–2022) phases, the community was primarily dominated by Silver croaker, Flatfish, and Silver grunt (Table 2). However, a marked transition occurred during the construction phase (2022–present), where dominance shifted to Spotted catfish (IRI = 1674), Fourfinger threadfin (IRI = 1570), Pharaoh cuttlefish (IRI = 1255), and Silver grunt (IRI = 1147), indicating a restructuring of the demersal community (Table 2).
Conversely, the trawl fishery exhibited greater stability in dominant species composition. Silver croaker (IRI = 1889), Pharaoh cuttlefish (IRI = 1478), and Stingray (IRI = 1095) were identified as the primary dominant species (IRI 1000) across the study period (Table 3). Additionally, Inshore squid, Silver grunt, and Japanese jack mackerel were classified as ecologically important species (100 IRI < 1000). Comparisons between development phases indicated that the core dominant taxa in the trawl fishery remained consistent, with Silver croaker and Pharaoh cuttlefish maintaining high dominance values regardless of the wind farm construction status (Table 3). Pianka’s niche overlap index was also slightly lower between the preparation phase and the construction phase (0.72), indicating that species composition may have begun to vary across different phases (Table 4).
(2)
Biodiversity index
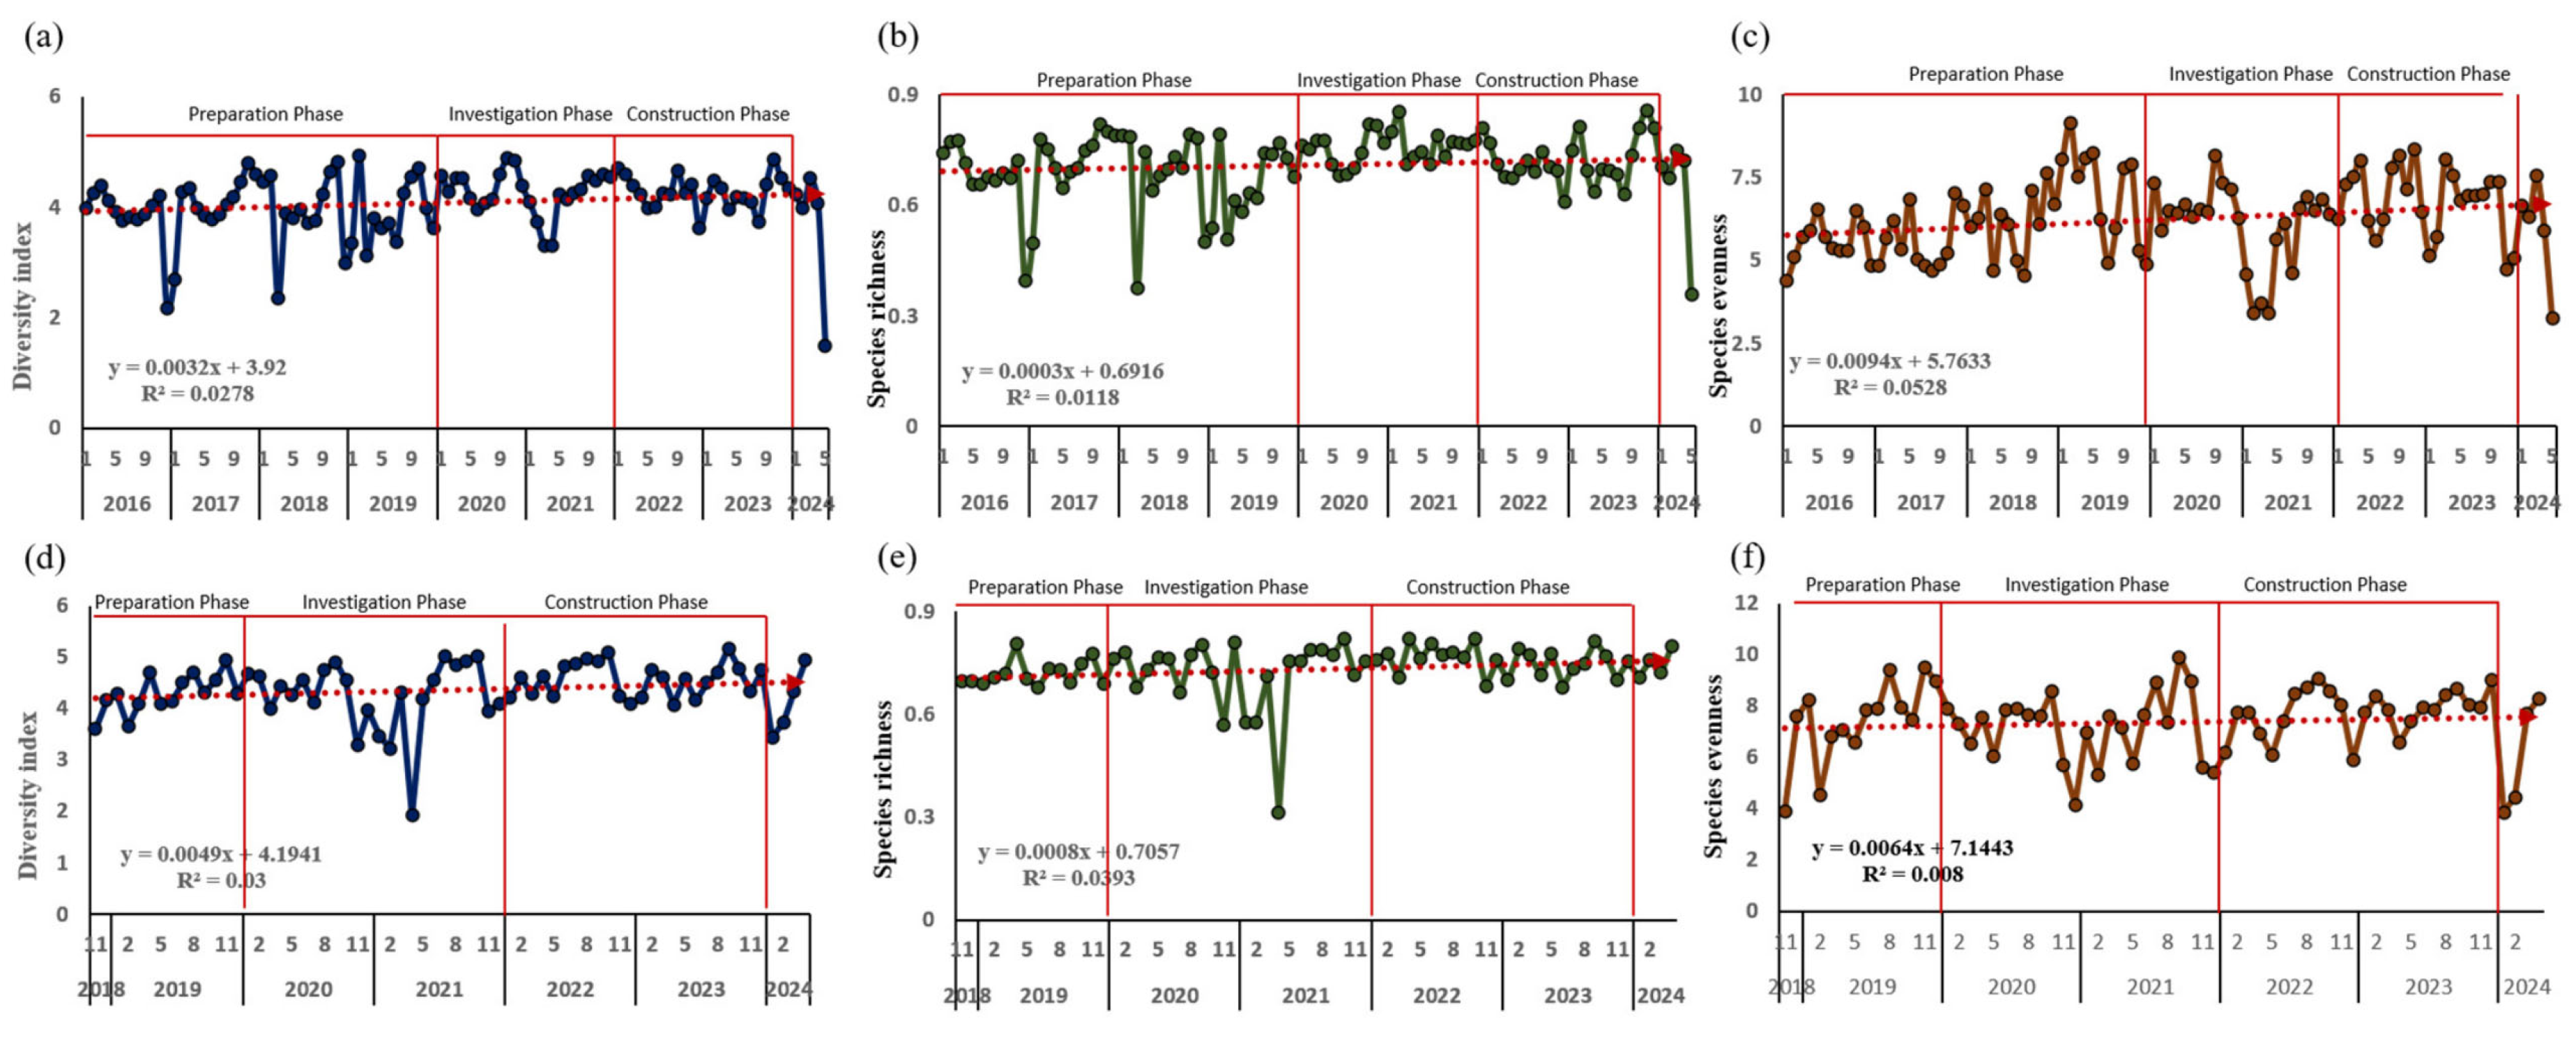
Temporal trends in biodiversity indices were evaluated to assess community stability for both fisheries. The Shannon diversity index (H′) fluctuated between 1.91 and 5.17 for the gillnet fishery and between 1.48 and 4.92 for the trawl fishery, with both fisheries exhibiting a slight increasing trend over the study period (Figure 7a,d). Species evenness (J′) displayed interannual variability comparable to the diversity index, suggesting that the distribution of individuals among species remained dynamic yet stable (Figure 7b,e). Notably, species richness (d) derived from both gillnet and trawl catch data demonstrated a distinct upward trajectory over time, indicating an increase in the number of recorded species in the adjacent waters during the progression of wind farm development (Figure 7c,f).

3.6. Spatiotemporal Variations in Economic Performance (IPUE)

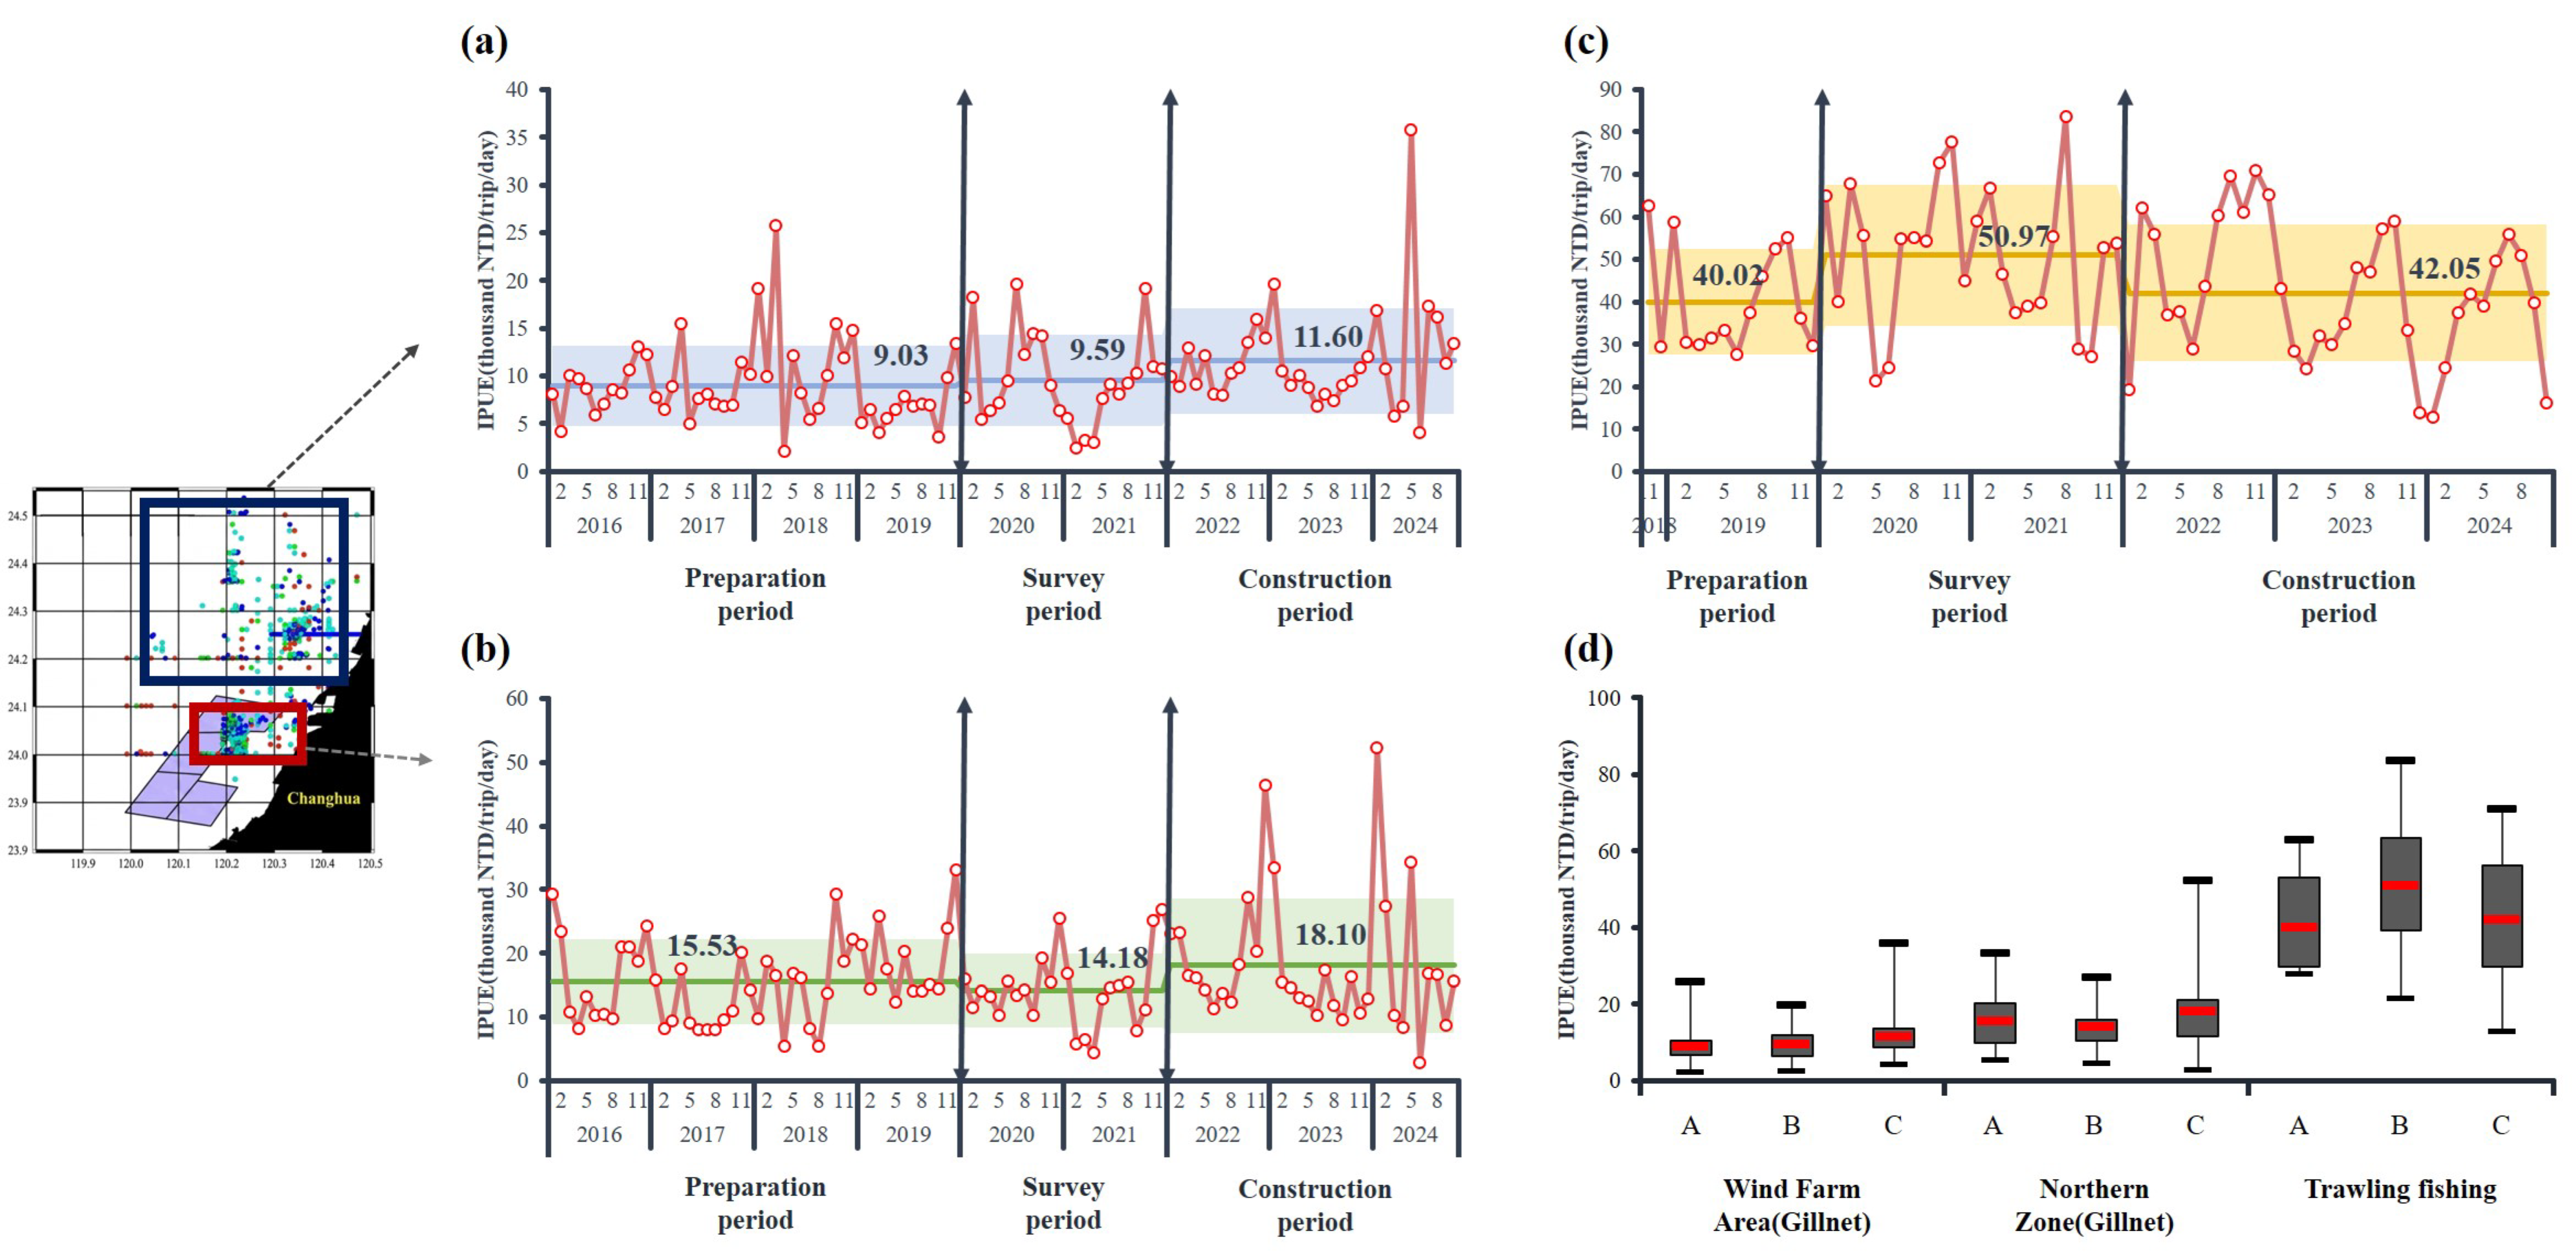
For gillnet within the Northern Zone (blue box), a consistent upward trajectory in economic efficiency was observed throughout the study period. The mean IPUE increased progressively from the preparation phase (8.60 thousand NTD/trip/day) to the investigation phase (9.59), reaching a maximum during the construction phase (11.59) (Figure 8a). Gillnet within the Wind Farm Zone (red box) exhibited a more complex, non-linear pattern. The baseline mean IPUE during the preparation phase was relatively high (15.53 thousand NTD/trip/day) but experienced a distinct decline to 14.16 during the investigation phase, coinciding with intensive geophysical investigations. Notably, economic performance rebounded significantly during the construction phase, reaching the highest observed mean value of 18.09 thousand NTD/trip/day, suggesting a potential recovery or adaptation in fishing efficiency despite the ongoing development (Figure 8b). The trawl fishery, which primarily located in the northern offshore waters, demonstrated significantly higher overall economic returns per unit effort compared to the gillnet sector. The mean IPUE rose sharply from the preparation phase (39.06) to a peak during the investigation phase (49.62). Although a moderate reduction was noted during the construction phase (42.05), the economic yield remained elevated compared to the baseline period (Figure 8c).
The Northern Zone (blue box) gillnet fishery displayed a linear increase in median IPUE across the three phases (Preparation < Investigation < Construction). In contrast, the Wind Farm Zone (red box) fishery showed greater variance, particularly during the construction phase, indicating increased heterogeneity in catch success rates near the development sites.Trawl fisheries maintained the highest magnitude of economic efficiency, though with substantial inter-annual variability, particularly during the investigation phase (Figure 8d).

4. Discussion

4.1. Fishery Characteristics and Regional Comparisons of Species Assemblages

The gillnet fishery was primarily composed of spotted catfish, pharaoh cuttlefish, flatfishes, tigertooth croaker, blue swimming crab, red-spotted swimming crab, fourfinger threadfin, silver grunt, silverfish, mullets, and black sea bream (Table 2; Figure 5). Comparatively, Li (2020) pointed out that fishery catches in the southwestern waters of Taiwan were dominated by mesopelagic and demersal species [24]. In their study, during summer, the catch was primarily composed of Taiwanese inshore squid and sliverfish (Trichiurus lepturus), with Japanese jack mackerel and chub mackerel (Scomber australasicus) identified as dominant species. In winter, catches were mainly composed of mackerels (Scombridae spp.) and greater amberjack (Seriola dumerili), with chub mackerel (Scomber australasicus) and round scad (Decapterus maruadsi) representing the dominant species. Based on the catch composition of otter trawl investigations conducted in waters ranging from Wangong, Changhua County, to Fangliao, Pingtung County, cephalopods constituted an important component of the catch [25]. The six dominant cephalopod species were the Sepia pharaonis (31.4%), Sepia esculenta (14.5%), Loliolus beka (7.7%), Sepia vietnamica (7.6%), Inioteuthis japonica (5.4%), and Euprymna morsei (4.4%), collectively accounting for 80.3% of the total cephalopod catch. The cephalopod assemblage also exhibited pronounced spatial variability across the study area [25]. Previous study pointed out that the northern of the Chang-Yuen Ridge, the dominant species during spring and summer included silver croaker, tigertooth croaker, pharaoh cuttlefish, swimming crabs, and javelin grunter (Pomadasys kaakan), whereas during autumn and winter the assemblage was dominated by silver croaker, black sea bream, fourfinger threadfin, and javelin grunter [26]. In contrast, in the southern area of Chang-Yuen Ridge, the dominant species in spring and summer were silver croaker and tigertooth croaker, while during autumn and winter, the assemblage was primarily composed of fourfinger threadfin and silver croaker. Zhou (2023) also examined fisheries associated with offshore wind farm development off Miaoli and found that CTS- and CTR-class vessels dominated local operations [27]. The primary target species included cuttlefish, spotted catfish, javelin grunter, flatfishes, unicorn leatherjacket filefish (Aluterus monoceros), silver croaker, Spanish mackerel, and greater amberjack (Seriola dumerili) [27]. Zhou (2023) also documented a southwestward displacement of fishing grounds in response to wind farm development, and the observe species composition closely aligns with the findings of the present study [27].

4.2. Effects of Offshore Wind Farms on Marine Ecosystems and Local Fisheries

This study examined temporal variations in species diversity indices before and after offshore wind farm construction. Consistent with the trends observed in biodiversity analysis, species diversity was primarily driven by interannual variability, whereas the specific impact of wind farm construction appeared relatively limited (Figure 7). However, it is not clear if the limited impact is due to the short frame of the construction phase. But some previous studies still indicated that offshore wind farm development does not substantially reduce local fishery resources, and that benthic species may exhibit increasing trends in both diversity and richness following wind farm installation [9,28]. Shimada et al. (2022) also pointed out the establishment of offshore wind farms does not significantly impact local fishery resources, catch yields, or the income of local communities [28]. This suggests that wind farm development may coexist with ongoing fishing activities without causing economic losses. Hammar et al. (2016) also highlighted that offshore wind farm areas in Northern Europe could serve as de facto marine protected areas by restricting fishing activities [9]. Moreover, structures of wind farms may function as artificial reefs, providing new habitats that support local fisheries. Several studies already suggested that offshore wind farms have the potential not only to generate renewable energy but also to contribute to marine conservation and the sustainable use of fishery resources [7,8,10,13,14,15]. Conversely, however, other research cautions that OWF development can exert significant environmental stressors. Ou and Chen (2016) noted that both the construction and operational phases might impact benthic habitats, demersal organisms, migratory species, and marine mammals, thereby altering the surrounding marine ecosystem and local fisheries [29]. While elevated %IRI values for coral reef species during construction (Table 4) indicate an ‘artificial reef effect’ that enhances reef-associated biodiversity, this shift entails a direct trade-off. The loss of benthic habitat diminishes suitable grounds for demersal resources, thereby adversely impacting the bottom trawling fisheries.
This dichotomy in potential outcomes underscores the critical necessity for continuous, long-term monitoring of fishery resources. Systematic assessment is essential to elucidate the dynamic responses of species abundance and distribution, ensuring that offshore wind energy expansion proceeds in harmony with the sustainable utilization of local fishery resources. Although shifts in marine species composition and diversity driven by wind farm development may prompt local fishers to adjust their fishing grounds as an adaptive strategy, the observed spatial changes in trawling activity most likely stem from physical exclusion during construction rather than spontaneous operational shifts.

4.3. Economic Impacts and Fishery Adaptation

Contrary to the general declining trends in Taiwan’s coastal fisheries reported by previous studies [30,31], this investigation reveals that offshore wind farm development has exerted limited negative impact on local fishery economics. Notably, the average IPUE for gillnet fisheries increased from 8.60 to 11.59 thousand NTD/trip/day during the construction phase. The observed economic resilience suggests that local fishermen may have employed adaptive strategies—such as shifting fishing grounds or targeting high-value species like mullet (Mugil cephalus)—to mitigate potential displacement losses; however, further empirical validation via spatial tracking or fisher interviews is required to confirm these operational shifts. Nonetheless, these results align with international assessments indicating that offshore wind farms do not inevitably compromise fishery yields [28] and may function as de facto marine protected areas or artificial reefs [9]. Consequently, while current construction activities appear compatible with local fishery revenue, continuous long-term monitoring is essential to track resource dynamics and ensure the sustainable coexistence of renewable energy development and traditional fisheries. However, fluctuations in market prices can also introduce variability into revenue-based IPUE metrics. Future research should incorporate detailed annual species-specific price data to better isolate true catch effort dynamics from price-driven variations.

4.4. Study Limitation

Several limitations of this study must be considered when interpreting our findings. First, our reliance on self-reported fishery logbook data introduces potential uncertainty regarding taxonomic resolution and species identification consistency across vessel captains. While official logbooks provide extensive spatiotemporal coverage, independent verification, such as port sampling or onboard observer coverage, remains limited. Second, the observed spatial redistribution of trawl fisheries, particularly their absence within active development zones, primarily reflects physical exclusion and enforced safety buffer zones during survey and construction phases rather than voluntary operational shifts. Consequently, assessing the full socio-economic impact on trawl fleets requires cautious interpretation, as spatial displacement may impose localized habitat loss and operational squeezing despite stable overall catches. Third, although the relative increase in %IRI values for coral reef species during construction suggests an artificial reef effect, this ecological gain entails an inherent trade-off. The introduction of hard turbine foundations permanently reduces benthic habitat, benefiting static reef-associated species at the direct expense of soft-sediment demersal resources targeted by trawlers. Finally, while Index of IPUE metrics indicate economic resilience among gillnet fleets, these trends could be partially confounded by market price fluctuations or broader economic variables rather than true increases in stock abundance or fishing efficiency. Future research incorporating species-specific auction price indices, fine-scale spatial tracking using Vessel Monitoring System or Automatic Identification System data, and direct fisher interviews will be essential to disentangle market noise, validate behavioral adaptations, and fully quantify the long-term ecological and operational impacts of offshore wind energy development on coastal fisheries.

5. Conclusions and Remarks

This study elucidated the spatiotemporal dynamics of gillnet and trawl fisheries in the coastal waters off Changhua throughout the pre-construction, investigation, and construction phases of offshore wind farm development. Contrary to initial concerns regarding resource depletion, the results indicate that the construction phase did not significantly compromise fishery productivity or biological diversity. Biodiversity indices, including species richness and evenness, demonstrated a stable to increasing trajectory, with community composition remaining governed primarily by natural seasonal drivers rather than development activities. Biologically, the community structure exhibited distinct responses based on habitat type. The trawl fishery, operating primarily in the northern offshore soft-bottom grounds, maintained a highly stable demersal assemblage dominated by Silver croaker and Pharaoh cuttlefish, indicating that sedimentary habitats outside the immediate development zone remained resilient. In contrast, the gillnet fishery within the wind farm zone demonstrated a notable shift in dominant taxa during the construction phase. The transition from a community dominated by Flatfish (strict soft-bottom species) to one characterized by Spotted catfish and the persistent presence of reef-associated species suggests an incipient ecological succession. This shift likely reflects the alteration of habitat characteristics, where the introduction of turbine foundations provides artificial hard substrates that may function as artificial reefs, supporting a more complex, mixed assemblage. However, this so-called succession may also be the result of the influence of noise or vibration-driven displacement of sensitive species. Economically, the anticipated decline in fishery revenue was not observed. A key finding is the resilience of the gillnet fishery, which exhibited a marked increase in IPUE during the construction phase (rising to 11.59 thousand NTD/trip/day). This suggests that local fishers might have adopted adaptive strategies—shifting operations to peripheral zones or targeting high-value species—thereby mitigating displacement losses. In summary, while offshore wind farm construction activities appear compatible with local fishery revenue to date, the observed species composition shifts point to an ongoing alteration of the marine habitat. The composition of coral reef species showed an increasing trend, highlighting the need for continuous long-term monitoring to confirm whether a ‘reef effect’ exists in the wind farm area. Such monitoring is essential to ensure sustainable symbiosis between renewable energy expansion and traditional coastal fisheries.

Author Contributions

Conceptualization, Y.-L.W., L.-X.L. and K.-W.L.; Methodology, P.-Y.H. and L.-X.L.; Formal analysis, Y.I.V.P.; Investigation, Y.-L.W., Y.I.V.P. and A.D.S.S.; Resources, Y.-L.W.; Data curation, S.S.; Writing—review and editing, Y.-L.W. and K.-W.L.; Visualization, Y.-L.W., P.-Y.H. and L.-X.L.; Supervision, K.-W.L.; Project administration, K.-W.L.; Funding acquisition, K.-W.L. All authors have read and agreed to the published version of the manuscript.

Funding

This research was funded by National Science and Technology Council (grant number: 114-2611-M-019-004 and 114-2621-M-019-006) and China Steel (Taiwan).

Institutional Review Board Statement

Not applicable.

Informed Consent Statement

Not applicable.

Data Availability Statement

The datasets presented in this article are not readily available because fisherman fishing ground protection principle. Requests to access the datasets should be directed to kwlan@mail.ntou.edu.tw.

Conflicts of Interest

The study has received research grants from Company China Steel (Taiwan). The funding sponsors had no role in the design of the study; in the collection, analyses, or interpretation of data; in the writing of the manuscript, and in the decision to publish the results.

Appendix A. Fishing Average Prices for Each Species in 2024

NumberComman NameScientific NameAverage Price in 2025 (kg/NTD)Habitat Characteristics
1Japanese seabassLateolabrax japonicus123.7Benthic
2Hilsa shadTenualosa ilisha252Pelagic
3Gazami crabPortunus trituberculatus143.7Benthic
4Chicken gruntParapristipoma trilineatum189.7Reef-associated
5Trash fish/BycatchMixed species11.2Benthic/Pelagic
6Yellowstripe scadSelaroides leptolepis169.8Pelagic
7Japanese jack mackerelTrachurus japonicus42.4Pelagic
8FlatheadPlatycephalidae spp.111.5Benthic
9Fourfinger threadfinEleutheronema tetradactylum147Benthic
10Goldlined seabreamRhabdosargus sarba234.4Reef-associated
11White croakerPennahia argentata81.9Benthic
12White croaker/OtherP. argentata/Various81.9Benthic
13Largehead hairtailTrichiurus lepturus135.9Pelagic
14Pacific rudderfishPsenopsis anomala228.8Pelagic
15Greater amberjackSeriola dumerili191.6Reef-associated
16Silver sillagoSillago sihama262.8Benthic
17Yellowback seabreamDentex hypselosomus154.5Benthic
18Other speciesVarious spp.153Benthic/Pelagic
19Other fish speciesVarious spp.153Benthic/Pelagic
20Other/Greater amberjackVarious/S. dumerili191.6Reef-associated
21Other/StingrayVarious/Dasyatis spp.52Benthic
22Other/Shrimps & CrabsVarious/Decapoda153Benthic
23Other/CephalopodsVarious/Cephalopoda178.5Pelagic/Benthic
24Other/FlatfishVarious/Pleuronectiformes73.4Benthic
25Other/Mi-iuy croakerVarious/Miichthys miiuy153.3Benthic
26Other (Shellfish)Various (Mollusca)132.2Benthic
27Pacific rudderfishPsenopsis anomala228.8Pelagic
28Pacific rudderfish/OtherP. anomala/Various228.8Pelagic
29LizardfishSynodontidae spp.43Benthic
30Lizardfish/FlatheadSynodontidae/Platycephalidae43Benthic
31Jarbua teraponTerapon jarbua261.3Benthic
32Blue mackerelScomber australasicus34.4Pelagic
33Pharaoh cuttlefishSepia pharaonis169Benthic
34Requiem sharkCarcharhinidae spp.44.5Pelagic
35Requiem shark/OtherCarcharhinidae/Various44.5Pelagic
36Requiem shark/SharkSelachimorpha44.5Pelagic
37Saddle gruntPomadasys maculatus189.7Benthic
38Reeve’s croakerChrysochir aureus298.3Benthic
39Blood spotted crabPortunus sanguinolentus179.3Benthic
40Maculated sea catfishArius maculatus30Benthic
41ThreadfinPolynemidae spp.147Benthic
42Mahi-mahi (Dolphinfish)Coryphaena hippurus78.5Pelagic
43Narrow-barred Spanish mackerelScomberomorus commerson386.2Pelagic
44Spanish mackerel/OtherS. commerson/Various386.2Pelagic
45Yellowtail scadAtule mate169.8Pelagic
46Yellowtail scad/OtherAtule mate/Various169.8Pelagic
47Ponyfish (Slipmouth)Leiognathus equulus193.5Benthic
48Yellowfin seabreamAcanthopagrus latus215.6Reef-associated
49Black croakerAtrobucca nibe149.2Benthic
50Black seabreamAcanthopagrus schlegelii227.1Reef-associated
51Black jewfishProtonibea diacanthus153.3Benthic
52Black pomfretParastromateus niger163.5Pelagic
53Orbicular batfishPlatax orbicularis124.5Reef-associated
54Mangrove red snapperLutjanus argentimaculatus213.6Reef-associated
55StingrayDasyatis spp.52Benthic
56Shrimps & Crabs/Blood spotted crabDecapoda/P. sanguinolentus179.3Benthic
57CephalopodsCephalopoda178.5Pelagic/Benthic
58Cephalopods/OtherCephalopoda/Various178.5Pelagic/Benthic
59FlatfishPleuronectiformes73.4Benthic
60Flathead grey mulletMugil cephalus58.8Pelagic
61Squid (Nerit Squid)Uroteuthis spp.226.2Pelagic
62Hammerhead sharkSphyrnidae spp.76.9Pelagic
63Mi-iuy croakerMiichthys miiuy153.3Benthic
64SharkSelachimorpha44.5Pelagic
65SharkSelachimorpha44.5Pelagic
66Shark/Requiem sharkSelachimorpha44.5Pelagic
67Scaly hairfin anchovyJohnius distinctus79.2Benthic

References

  1. Kennedy, V.S.; Twilley, R.R.; Kleypas, J.A.; Cowan, J.H., Jr.; Hare, S.R. Coastal and Marine Ecosystems & Global Climate Change; Pew Center on Global Climate Change: Washington, DC, USA, 2002. [Google Scholar]
  2. Hoegh-Guldberg, O.; Bruno, J.F. The impact of climate change on the world’s marine ecosystems. Science 2010, 328, 1523–1528. [Google Scholar] [CrossRef] [Scilit] [PubMed]
  3. Rhodes, C. The 2015 Paris Climate Change Conference: Cop21. Sci. Prog. 2016, 99, 104–197. [Google Scholar] [CrossRef] [Scilit] [PubMed]
  4. Ministry of Environment. Greenhouse Gas Reduction and Management Act Preannounced to Change Name to Climate Change Response Act. 2021. Available online: https://www.moenv.gov.tw/en/news/press-releases/16531.html (accessed on 9 August 2026).
  5. Wilhelmsson, D.; Malm, T.; Thompson, R.; Tchou, J.; Sarantakos, G.; McCormick, N.; Luitjens, S.; Gullström, M.; Patterson Edwards, J.K.; Amir, O.; et al. (Eds.) Greening Blue Energy: Identifying and Managing the Biodiversity Risks and Opportunities of Offshore Renewable Energy; IUCN: Gland, Switzerland, 2010; 102p. [Google Scholar]
  6. Copping, A.E.; Hemery, L.G.; Overhus, D.M.; Garavelli, L.; Freeman, M.C.; Whiting, J.M.; Gorton, A.M.; Farr, H.K.; Rose, D.J.; Tugade, L.G. Potential environmental effects of marine renewable energy development—The state of the science. J. Mar. Sci. Eng. 2020, 8, 879. [Google Scholar] [CrossRef] [Scilit]
  7. Leung, D.Y.C.; Yang, Y. Wind energy development and its environmental impacts. Renew. Sustain. Energy Rev. 2012, 16, 1031–1039. [Google Scholar] [CrossRef] [Scilit]
  8. Saidur, R.; Rahim, N.A.; Islam, M.R.; Solangi, K.H. Environmental impact of wind energy. Renew. Sustain. Energy Rev. 2011, 15, 2423–2430. [Google Scholar] [CrossRef] [Scilit]
  9. Hammar, L.; Perry, D.; Gullström, M. Offshore wind power for marine conservation. Open J. Mar. Sci. 2015, 6, 66–78. [Google Scholar]
  10. Bureau of Energy; Ministry of Economic Affairs. Guidelines for Application for Offshore Wind Farm Site Planning. 2015. Available online: https://eiger.law/wp-content/uploads/2016/10/Offshore-Wind-Farm-Site-Application-Regulations.pdf (accessed on 9 August 2026).
  11. Jan, S.; Wang, J.; Chern, C.S.; Chao, S.Y. Seasonal variation of the circulation in the Taiwan Strait. J. Mar. Syst. 2002, 35, 249–268. [Google Scholar] [CrossRef] [Scilit]
  12. Liu, J.P.; Liu, C.S.; Xu, K.H.; Milliman, J.D.; Chiu, J.K.; Kao, S.J.; Lin, S.W. Flux and fate of small mountainous rivers derived sediments into the Taiwan Strait. Mar. Geol. 2008, 256, 65–76. [Google Scholar] [CrossRef] [Scilit]
  13. Hajisamae, S.; Yeesin, P.; Chaimongkol, S. Habitat utilization by fishes in a shallow, semi-enclosed estuarine bay in southern Gulf of Thailand. Estuar. Coast. Shelf Sci. 2006, 68, 647–655. [Google Scholar] [CrossRef] [Scilit]
  14. Degraer, S.; Carey, D.A.; Coolen, J.W.; Hutchison, Z.L.; Kerckhof, F.; Rumes, B.; Vanaverbeke, J. Offshore wind farm artificial reefs affect ecosystem structure and functioning. Oceanography 2020, 33, 48–57. [Google Scholar] [CrossRef] [Scilit]
  15. Shao, K.T.; Chang, C.H.; Chen, C.Y.; Ho, L.T.; Shao, Y.T.; Chiang, H.C.; Lee, W.-N.; Tsai, H.J.; Huang, T.-Y.; Chang, C.Y. Spatio-temporal Dynamics of Fish Assemblages at an Offshore Wind Farm and a Comparison with Mature Artificial Reefs. Front. Mar. Sci. 2026, 13, 1733177. [Google Scholar] [CrossRef] [Scilit]
  16. Ministry of Transportation and Communications. Safety regulations for the navigation of work vessels during the construction and operation of offshore wind farms [Navigation Guidelines for Changhua Offshore Wind Farm Channel]. Laws & Regulations Retrieving System of MOTC. 2021. Available online: https://motclaw.motc.gov.tw/webMotcLaw2018/Law/ArticleContent?type=-1&LawID=H0175000 (accessed on 9 August 2026).
  17. Pinkas, L.; Oliphant, M.S.; Iverson, I.L.K. Food habits of albacore, bluefin tuna, and bonito in California waters. Calif. Fish. Game Fish. Bull. 1971, 152, 1–105. [Google Scholar]
  18. Zhang, H.; Xian, W.; Liu, S. Autumn ichthyoplankton assemblage in the Yangtze Estuary shaped by environmental factors. PeerJ 2016, 4, e1922. [Google Scholar] [CrossRef] [Scilit] [PubMed]
  19. Li, F.; Zhu, M.; Chen, W.; Su, B.; Yang, Y.; Wang, B. Interannual variation of ichthyoplankton community structure in the Yellow River estuary, China. Water 2023, 15, 1040. [Google Scholar] [CrossRef] [Scilit]
  20. Shannon, C.E. A mathematical theory of communication. Bell Syst. Tech. J. 1948, 27, 379–423. [Google Scholar] [CrossRef] [Scilit]
  21. Pielou, E.C. The measurement of diversity in different types of biological collections. J. Theor. Biol. 1966, 13, 131–144. [Google Scholar] [CrossRef] [Scilit]
  22. Pianka, E.R. The structure of lizard communities. Annu. Rev. Ecol. Syst. 1973, 4, 53–74. [Google Scholar] [CrossRef] [Scilit]
  23. Wallace, R.K., Jr. An assessment of diet overlap indexes. Trans. Am. Fish. Soc. 1981, 110, 72–76. [Google Scholar] [CrossRef] [Scilit]
  24. Li, W.-H. Seasonal Composition and Structure of the Ecosystem in the Southwestern Waters of Taiwan and the Effects of Fishing. Master’s Thesis, National Taiwan Ocean University, Keelung, Taiwan, 2022. [Google Scholar]
  25. Hsu, Y.-W. Species Composition and Spatiotemporal Distribution of Cephalopods in the Southwestern Coastal Waters of Taiwan. Master’s Thesis, National Sun Yat-sen University, Kaohsiung, Taiwan, 2019. [Google Scholar]
  26. Li, L.-X. Preliminary Study on Seasonal Variations in Coastal Gillnet Fishery Resources in the Yun-Chang Ridge Area. Master’s Thesis, National Taiwan Ocean University, Keelung, Taiwan, 2015. [Google Scholar]
  27. Chou, C.-H. A Study on the Impacts of Offshore Wind Farm Development on Fishing Activities in Miaoli. Master’s Thesis, National Taiwan Ocean University, Keelung, Taiwan, 2023. [Google Scholar]
  28. Shimada, H.; Asano, K.; Nagai, Y.; Ozawa, A. Assessing the impact of offshore wind power deployment on fishery: A synthetic control approach. Environ. Resour. Econ. 2022, 83, 791–829. [Google Scholar] [CrossRef] [Scilit]
  29. Ou, C.-H.; Chen, C.-J. Offshore Wind Power Development and Coexistence with Fisheries; Special Report; Fisheries Agency, Council of Agriculture, Executive Yuan: Kaohsiung, Taiwan, 2014; pp. 34–45.
  30. Wang, T.K. Studies on the Management and Reformation of Taiwan Inshore Fishery. Master’s Thesis, National Sun Yat-sen University, Kaohsiung, Taiwan, 2012. (In Chinese with English abstract). [Google Scholar]
  31. Su, W.Y. A Study on Management Strategies of Coastal and Offshore Capture Fisheries in Penghu. Master’s Thesis, National Taiwan Ocean University, Keelung, Taiwan, 2020. (In Chinese with English abstract). [Google Scholar]
Figure 1. Monthly average fishing days of (a) gillnet vessels and (b) trawl vessels from 2016 to 2024.
Fishes 11 00483 g001
Figure 2. Spatial distribution map of total catch by (a) gillnet and (b) trawl vessels (purple grids indicate the locations of wind farms No. 26–29).
Fishes 11 00483 g002
Figure 3. Spatial distribution of fishing grounds for gillnet and trawl fisheries during different offshore wind-farm development phases. Panels (ac) show gillnet fishing activities during the (a) preparation period, (b) investigation period, and (c) construction period. Panels (df) illustrate trawl fishing activities during the (d) preparation period, (e) investigation period, and (f) construction period. Colored points represent fishing locations, with color intensity indicating fishing effort levels. Shaded polygons denote the offshore wind-farm areas.
Fishes 11 00483 g003
Figure 4. Seasonal variations in catch (bars) and catch rate (CPUE; dashed red line) for (a) the gillnet fishery and (b) the trawl fishery during the study period. Seasons are defined as: 1 = spring (March–May), 2 = summer (June–August), 3 = fall (September–November), and 4 = winter (December–February).
Fishes 11 00483 g004
Figure 5. Seasonal species composition (%) of the gillnet fishery aggregated across the entire study period (2016–2024). Pie charts show the relative contribution of major species to total gillnet catches in spring (March–May), summer (June–August), autumn (September–November), and winter (December–February). Percentages represent the proportion of each species in the total catch for each season; remaining catches are grouped as other species.
Fishes 11 00483 g005
Figure 6. Seasonal species composition (%) of the trawling fishery aggregated across the entire study period (2016–2024). Pie charts show the relative contribution of major species to total gillnet catches in spring (March–May), summer (June–August), autumn (September–November), and winter (December–February). Percentages represent the proportion of each species in the total catch for each season; remaining catches are grouped as other species.
Fishes 11 00483 g006
Figure 7. Temporal variations in biodiversity indices for the gillnet and trawl fisheries during the study period. Panels (ac) show results for the gillnet fishery, including (a) diversity index (Shannon index), (b) species richness, and (c) species evenness. Panels (df) show corresponding results for the trawl fishery, including (d) diversity index (Shannon index), (e) species richness, and (f) species evenness. Solid lines with points represent observed seasonal values, and red dashed lines indicate fitted linear trends over time.
Fishes 11 00483 g007
Figure 8. Spatiotemporal variations in economic performance (IPUE) and catch volume across development phases. The map indicates the designated Northern Zone (blue box) and Wind Farm Zone (red box). Panels (ac) illustrate seasonal total catch (bars) and average IPUE (red lines) for (a) gillnet in the Northern Zone, (b) gillnet in the Wind Farm Zone, and (c) trawling fishery. Horizontal red lines represent the mean IPUE for each development phase (Preparation, Investigation, Construction). The shaded areas represent ±1 standard deviation (SD) from the mean IPUE. Panel (d) presents boxplots comparing the distribution of IPUE across the three phases (A: Preparation, B: Investigation, C: Construction) for each fishing sector.
Fishes 11 00483 g008
Table 1. Tonnage classes and cumulative seasonal fishing days of gillnet and trawl vessels from 2016 to 2024.
Tonnage ClassFleet
(Number of Vessels)
Spring
(Mar–May)
Summer
(Jun–Aug)
Autumn
(Sep–Nov)
Winter
(Dec–Feb)
Annual Total Fishing Days
Gillnet
CTR423954216377386311,247
CTS2620,47538,37440,19910,358109,406
CT1113593689497499311,015
Total number of vessels3124,22946,27948,94612,214131,668
Trawling
CT344038085563762143
Fleet
(number of vessels)
Fishing Days
Table 2. Ecological dominance (IRI index) of major gillnet catch species before and after offshore wind farm construction (2016–2024).
SpeciesPeriodPreparation (2018~2019)Investigation (2020~2022)Construction (2022−)Total
Common NameScientific NameW%F%IRIW%F%IRIW%F%IRIW%F%IRI
Silver croakerPennahia argentata6.76%89.49%1298.958.37%99.80%1810.345.21%99.70%1124.246.55%99.90%1410.51
Spotted catfishArius maculatus7.99%61.11%993.177.89%45.80%742.703214.48%53.47%1674.9810.05%57.99%1191.15
Fourfinger threadfinPolynemidae spp.3.93%89.93%723.6785.24%69.05%747.828.73%83.19%1570.755.70%87.19%1021.82
FlatfishBothidae spp.5.54%99.80%1063.927.20%80.98%1131.523.94%70.19%598.40875.32%90.85%933.81
Silver gruntPomadasys kaakan2.98%86.86%529.817.29%86.07%1297.225.64%94.06%1147.734.60%93.39%882.52
Tigertooth croakerOtolithes ruber4.41%88.96%827.136.45%69.59%956.643.14%58.90%400.234.36%79.08%731.05
Pharaoh cuttlefishSepia pharaonis2.87%70.71%420.933.97%66.18%551.997.17%80.94%1255.274.44%76.46%708.69
Blue swimming crabPortunus pelagicus4.86%84.51%664.323.85%76.10%477.151.34%56.86%165.033.56%77.88%448.87
Black sea breamAcanthopagrus schlegelii2.55%66.42%336.453.31%58.05%385.063.30%66.56%475.652.93%67.77%395.47
SandperchSillaginidae2.22%47.99%210.435.31%50.68%538.214.36%54.52%514.423.45%53.19%364.98
Silver fishTrichiurus lepturus8.17%26.17%490.223.45%23.52%187.942.86%28.68%177.615.63%27.65%358.69
StingrayDasyatidae spp.2.82%42.16%265.202.33%40.60%213.203.11%50.21%337.972.83%46.49%294.55
Table 3. Ecological dominance (IRI index) of major trawling catch species before and after offshore wind farm construction (2018–2024).
SpeciesPeriodPreparation (2018~2019)Investigation (2020~2022)Construction (2022–)Total
Common NameScientific NameW%F%IRIW%F%IRIW%F%IRIW%F%IRI
Silver croakerPennahia argentata10.44%99.60%2209.136.29%99.90%1480.959.05%99.90%2121.888.39%99.80%1889.21
Pharaoh cuttlefishSepia pharaonis6.70%99.24%1368.347.35%99.54%1663.406.29%94.51%1347.446.89%98.25%1478.18
StringrayDasyatidae spp.6.23%87.01%1196.544.48%81.07%891.466.69%81.55%1335.425.58%83.47%1095.02
Inshore squidLoligo spp.5.93%77.64%1016.675.65%85.80%1191.374.92%55.11%663.695.60%75.49%995.27
Silver gruntPomadasys kaakan5.80%91.99%1081.283.47%70.69%548.895.07%78.55%887.974.66%80.73%808.41
Japanese jack mackerelTrachurus japonicus5.25%68.13%725.786.50%49.31%717.432.93%50.62%330.825.31%56.87%648.87
Yellowback seabreamDentex tumifrons5.92%77.19%981.153.06%41.37%302.051.35%28.18%90.583.77%52.10%448.72
Mangrove snapperLutjanus argentimaculatus1.45%66.92%203.093.62%69.77%583.432.71%66.83%417.082.63%67.99%396.50
Jarbua grunterTerapon jarbua3.05%86.86%546.571.84%56.95%238.652.14%53.62%261.162.35%67.69%348.13
Silver fishTrichiurus lepturus2.18%61.03%301.552.20%53.89%300.011.73%55.36%240.982.09%56.98%288.93
LizardfishSynodus spp.3.03%95.17%462.392.29%97.71%386.291.88%89.03%288.112.48%94.70%393.35
Weasel sharkSelachimorpha spp.2.28%56.19%282.881.83%44.12%198.201.87%46.13%211.342.00%49.24%232.15
Table 4. Compared the IRI value variation through different phases by using Pianka’s niche overlap index.
Preparation Period (2018~2019)Investigation Phase (2020~2022)Construction Phase (2022–)
Preparation phase (2018~2019)1.00--
Investigation phase (2020~2022)0.881.00-
Construction phase (2022–)0.720.851.00
Disclaimer/Publisher’s Note: The statements, opinions and data contained in all publications are solely those of the individual author(s) and contributor(s) and not of MDPI and/or the editor(s). MDPI and/or the editor(s) disclaim responsibility for any injury to people or property resulting from any ideas, methods, instructions or products referred to in the content.