Article

Environmental DNA Metabarcoding Reveals the Variations in Fish Diversity Across the Yangtze River Basin and the Effects of the Three Gorges Dam


1
Institute of Hydroecology, Ministry of Water Resources and Chinese Academy of Sciences, Wuhan 430079, China
2
Key Laboratory of Ecological Impacts of Hydraulic-Projects and Restoration of Aquatic Ecosystem, Ministry of Water Resources, Wuhan 430079, China
3
Innovation Team of the Changjiang Water Resources Commission for River and Lake Ecosystem Restoration Key Technology of Changjiang Water Resources Commission, Wuhan 430079, China
4
School of Resources and Environmental Engineering, Anhui University, Hefei 230601, China
5
Department of Ecology and Environment of Hubei Province, Xiangyang Ecological Environment Monitoring Center, Xiangyang 441000, China
*
Author to whom correspondence should be addressed.
Fishes 2026, 11(8), 484; https://doi.org/10.3390/fishes11080484
Submission received: 21 July 2026 / Revised: 13 August 2026 / Accepted: 14 August 2026 / Published: 18 August 2026
(This article belongs to the Section Biology and Ecology)

Abstract

It is imperative that freshwater fish biodiversity research incorporates diverse components, encompassing taxonomy, phylogeny and function, alongside multifaceted facets, including richness, divergence and regularity. This comprehensive approach is essential to facilitate a more profound comprehension of freshwater ecosystem functions, to elucidate the mechanisms underpinning fish community assembly, and to accurately assess the impacts of anthropogenic disturbance. Consequently, this scientific understanding can inform the development of effective fish conservation and ecosystem management strategies. This study utilized environmental DNA metabarcoding to assess the diversity of fish across the entire Yangtze River, encompassing the upper reach (Upper), the Three Gorges Reservoir area (RES_SX), and the downstream reach (Down). The results indicated that 150 distinct fish species were detected, with the RES_SX area exhibiting a significantly lower taxonomic diversity and fish detection rate in comparison to the other two regions. Conversely, phylogenetic and functional diversity exhibited stability post-normalization by taxonomic richness. Furthermore, investigation of the divergence facet of alpha-diversity demonstrated a reduction in clustering and an improvement of overdispersion on the phylogenetic and functional diversity, respectively, in the RES_SX and Down regions. Beta-diversity analysis further revealed lower taxonomic beta-diversity but higher phylogenetic and functional beta-diversity in the RES_SX area. A substantial degree of geographic distance-dependent similarity was identified for all three components of beta-diversity in the Upper Reach. Conversely, these components were found to be disrupted in the Down Reach. Finally, an analysis of the assembly mechanism revealed stochastic processes, dispersal limitation and drift as the dominant factors shaping the fish communities, with reduced dispersal limitation in the RES_SX area. This study provides novel insights into the multidimensional diversity of fish populations in response to dam construction, emphasizing the necessity of integrating multiple facets of diversity for accurate impact assessment and supporting evidence-based conservation of fish species in the Yangtze River.
Key Contribution: 1. eDNA metabarcoding revealed 150 fish species across the Yangtze River. 2. Three Gorges Dam reduced taxonomic but not phylogenetic/functional diversity. 3. Beta-diversity decoupling was detected in the Three Gorges Reservoir area. 4. Geographic distance-dependent similarity disappeared below the dam. 5. Dispersal limitation was reduced in the Three Gorges Reservoir area.

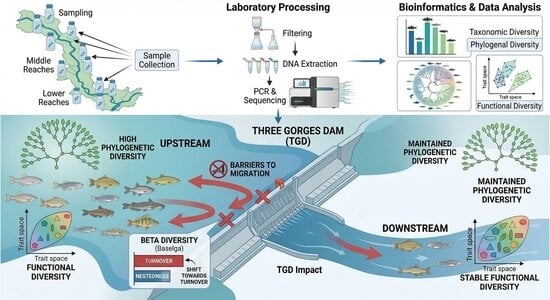
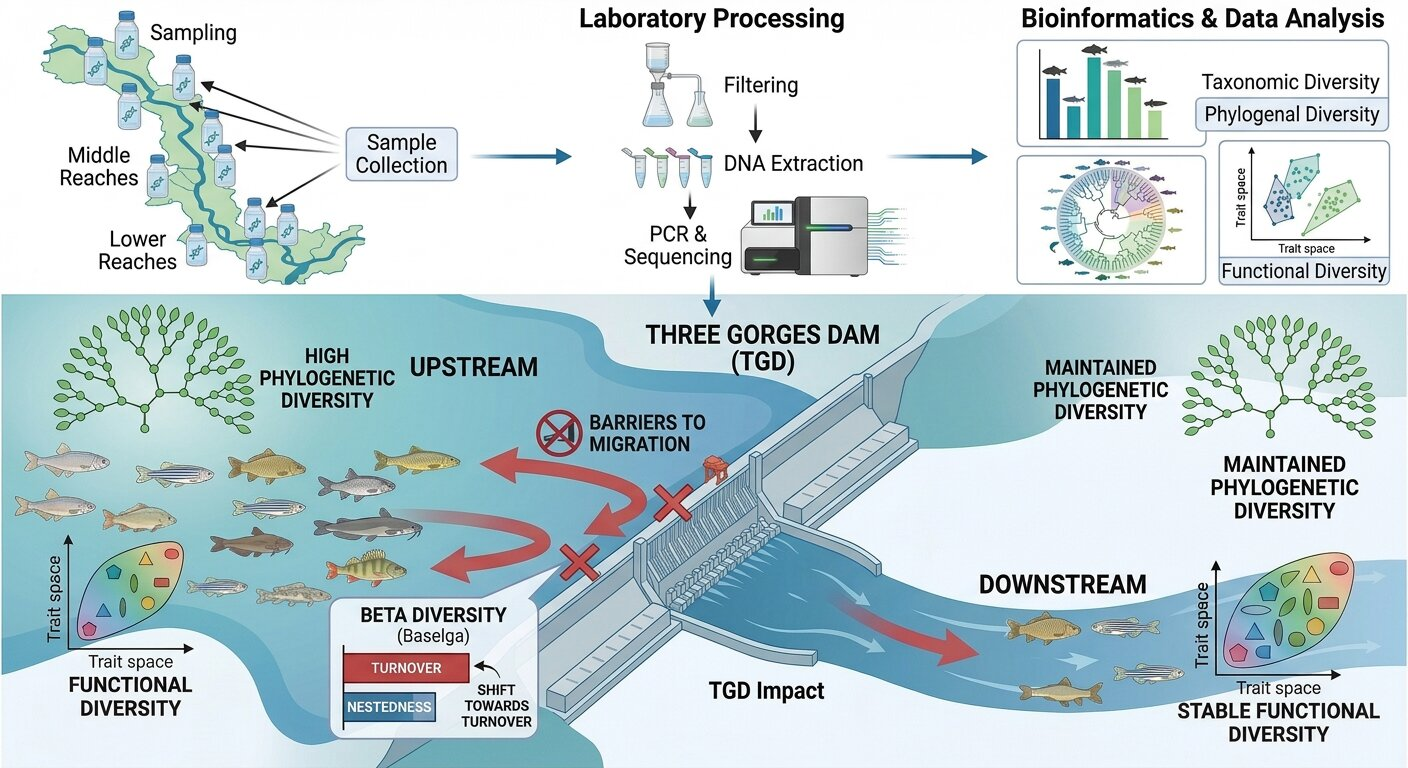
Graphical Abstract

1. Introduction

The spatial arrangement of freshwater fish species and their functional traits shapes biodiversity patterns in aquatic systems [1]. Such spatial patterns are widely recognized as key drivers governing ecosystem functioning and the capacity of natural communities to withstand external perturbations [2]. Taxonomic diversity, encompassing species richness, evenness and assemblage composition, quantifies the total count of species within a community alongside their relative abundances [3]. However, research conducted in rivers and coastal systems has demonstrated that sites exhibiting comparable species richness can exhibit significant disparities in ecological roles and vulnerability. This indicates that taxonomic metrics may underestimate the actual changes occurring in assemblages [4]. Consequently, the investigation of fish biodiversity should encompass diverse components, including taxonomic, phylogenetic, and functional dimensions. This multifaceted approach is likely to provide a more comprehensive and informative representation of ecosystems than any individual dimension alone [5]. Ecologists frequently adopt phylogenetic structure to explore ecological questions. It provides an effective approach for disentangling community assembly processes (e.g., environmental filtering and dispersal) and predicting how biological communities react to perturbations like hydropower damming and alien species invasion [6]. The underlying rationale is that phylogenetically close species generally share comparable traits and adaptability to environmental conditions. Moreover, studies on river and marine fish have illustrated that functional diversity often displays divergent responses compared with taxonomic or phylogenetic diversity, and is potentially more sensitive to habitat degradation [7]. Consequently, functional loss can lead to a deterioration in ecosystem functioning, even when species richness appears to be stable. Integrating all three components has been shown to enhance the detection of changes in assemblage structure, thereby revealing different sensitivities to fragmentation or environmental gradients [8].
For a particular diversity component, three facets are identified: richness, divergence, and regularity [9]. The concept of biodiversity, measured in terms of species richness, is widely accepted as a reliable indicator of changes in biodiversity, both in terms of gains and losses, within fish communities [10]. Divergence is defined as the presence of significant variation in the body shapes, trophic niches, or evolutionary lineages of fish assemblages [11]. The term “regularity” is employed to denote the uniformity of trait values or evolutionary branch lengths across species, and the question of whether functions or lineages are concentrated or dispersed in ecological or phylogenetic space [12]. Multidimensional assessments of fish biodiversity covering richness, divergence and regularity advance our understanding of both the total number of co-occurring species, the magnitude of their trait dissimilarity, and the uniform allocation of ecological functions among species [13]. This information is imperative for predicting ecosystem functioning, responses to disturbance, and effective conservation planning [14].
In addition to the alpha-diversity, the investigation of beta-diversity in fish communities provides insights into the mechanisms and drivers of variation in fish assemblages among sites [15]. Research conducted on stream and river fish has demonstrated a strong correlation between beta-diversity and environmental gradients, as well as spatial factors. This correlation is instrumental in elucidating the relative roles of environmental filtering versus dispersal in community assembly [16]. Beta-diversity partitioning illustrates that the displacement of indigenous fish species by alien taxa can boost turnover rates and induce regional homogenization concurrently. Consequently, this method uncovers biological invasion impacts that remain hidden if analyses are limited to total beta-diversity [17]. In summary, the investigation of fish beta-diversity, with its subsequent partitioning into species turnover and nestedness, provides a mechanistic insight into community assembly, clarifies the impacts of human activity, and directly supports spatial planning and the conservation of freshwater fish [18].
The Yangtze River extends over 6300 km, ranking first among all rivers in Asia and third globally. Its source lies on the Tibetan Plateau; the river runs through central China and finally discharges into the East China Sea close to Shanghai [19]. It has been identified as a vital resource for China’s economic development, agricultural production, cultural activities, and transportation infrastructure [20]. Decades of overfishing, dam construction, pollution, and habitat destruction have resulted in significant declines in fish populations and the extinction of iconic species, including the Chinese paddlefish and the baiji dolphin [21]. Consequently, the Yangtze River 10-Year Fishing Ban was implemented in January 2021 and will be in effect until 2030, as stipulated in the Yangtze River Protection Law, with the objective of restoring biodiversity and fishery resources [22]. Moreover, the Three Gorges Dam is a substantial concrete gravity dam constructed on the Yangtze in Hubei Province, in a picturesque stretch known as the Three Gorges [23]. Designed principally to achieve flood control, hydropower production and navigational enhancement; the scheme comprises one of the world’s largest hydropower facilities together with a large upstream reservoir [24]. The project has resulted in substantial electricity generation and enhanced shipping conditions; however, it is also contentious due to its large-scale resettlement, environmental impacts, and alterations to the river’s ecosystems [25]. Several studies have examined the early effects of the Yangtze River 10-Year Fishing Ban [26] and the Three Gorges Dam’s impacts on Yangtze fish assemblages [27]. Nevertheless, comprehensive datasets are urgently needed to guide evidence-based management of Yangtze fish biodiversity.
The objective of this study is to unveil the intricate patterns of biodiversity and their associated community structures for fish species across the Yangtze River. This endeavour employs metabarcoding technology, utilizing environmental DNA (eDNA), as a tool to analyze the biodiversity present. The current research aims to characterize the existing status of fish assemblages and examine regional differences in fish diversity. Furthermore, an exploration was conducted into the associations between diverse components and the potential repercussions of the Three Gorges Dam. The findings of this study have the potential to enhance the diagnosis of impacts and the design of conservation and fisheries policies.

2. Materials and Methods

2.1. Sample Collection

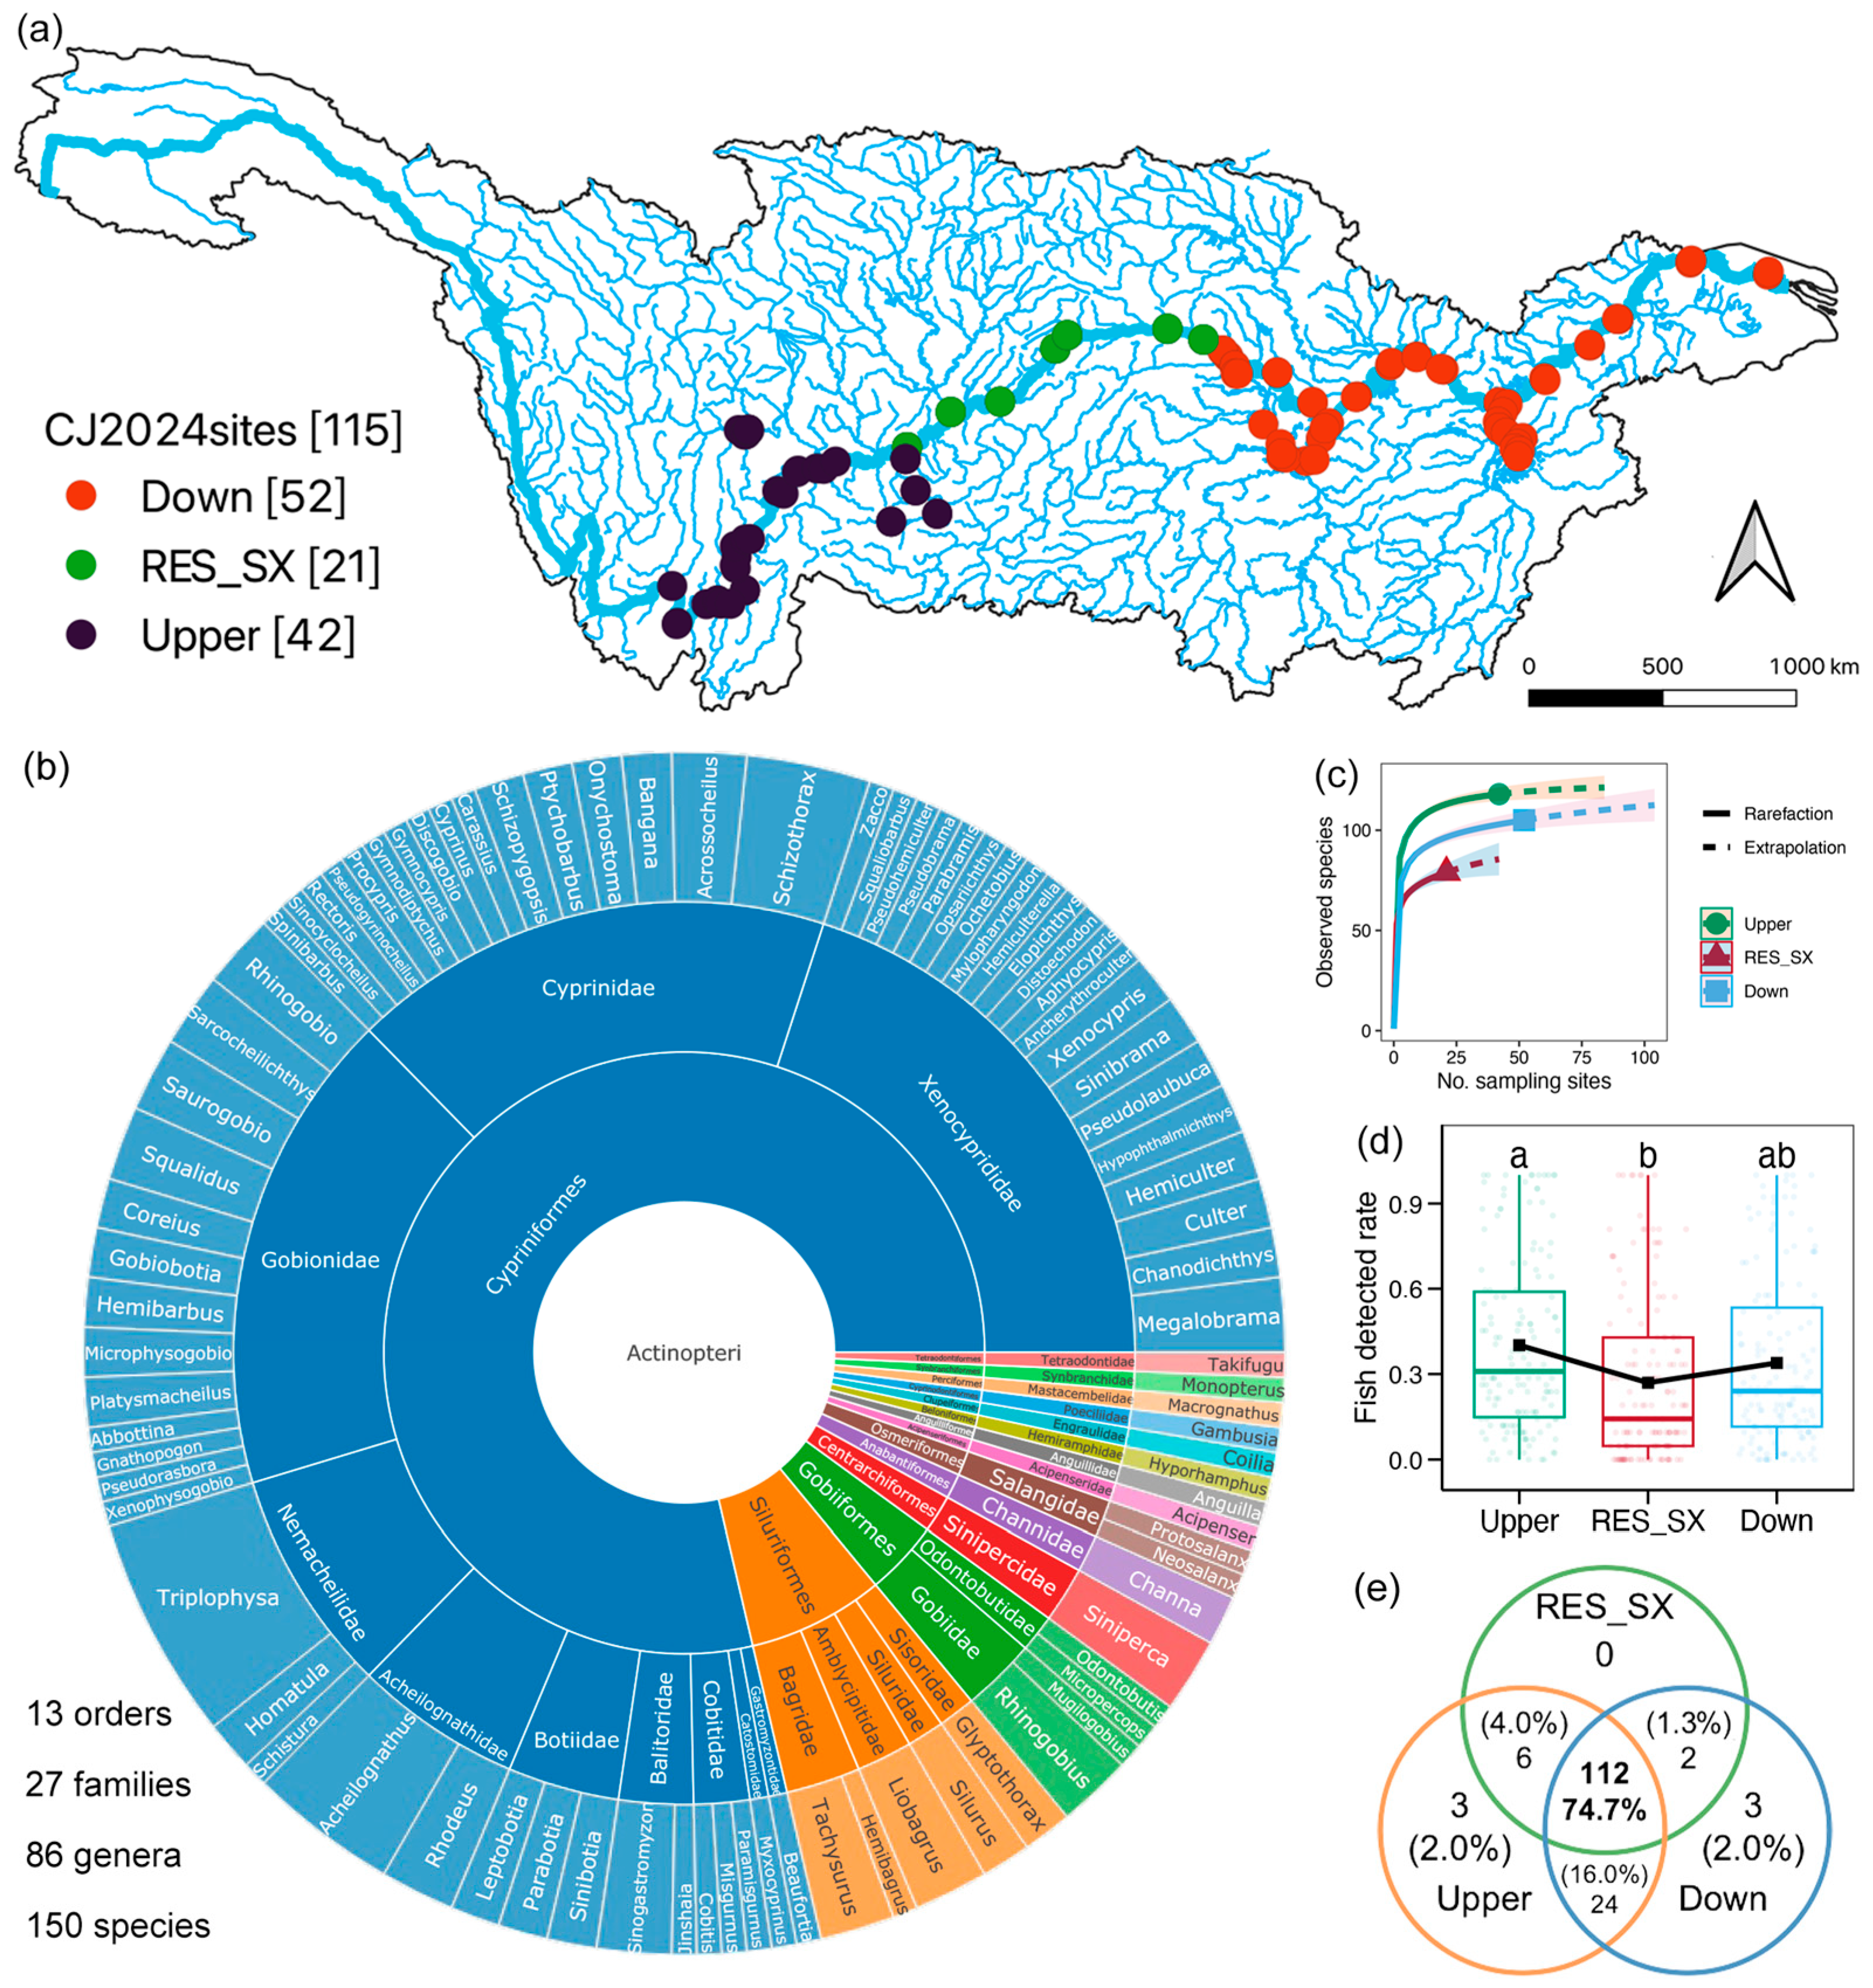
In this study, 115 sampling sites were deployed across the Yangtze River basin. Specifically, 42 sites belonged to the upstream section (Upper), 21 sites to the Three Gorges Reservoir area (RES_SX), and 52 sites to the downstream section (Down) (Figure 1a). Sample collection took place between March and April 2024. Around 2 L of water were retrieved at each sampling station via a water sampler produced by Wuhan Shuitiandi Instruments (Wuhan, China). Water samples were filtered through 0.22 μm polycarbonate membranes (Millipore Corporation, Billerica, MA, USA) to get rid of particulate impurities. Afterwards, filter membranes were rapidly frozen in liquid nitrogen and maintained at −80 °C prior to DNA extraction.

2.2. eDNA Extraction and Metabarcoding Sequencing

Genomic eDNA was isolated from filter samples with the DNeasy PowerWater Kit (Qiagen, Germantown, MD, USA) according to the manufacturer’s guidelines. Then, 1% agarose gel electrophoresis was applied to confirm successful DNA extraction, and a NanoDrop ND-1000 Spectrophotometer (NanoDrop, Wilmington, DE, USA) was used to assess DNA quality. The fish 12S rRNA marker was amplified employing Tele02_F/Tele02_R primers (Tele02_F: 5′-AAACTCGTGCCAGCCACC-3′; Tele02_R: 5′-GGGTATCTAATCCCAGTTTC-3′) [28]. Developed for teleost species that constitute the major fish fauna of the Yangtze River, these primers have been extensively used to investigate Yangtze fish diversity [20,27,29]. Detailed PCR conditions and library construction workflows followed methods reported previously [29]. The prepared libraries were then subjected to next-generation sequencing on the MGI-G99 platform at Shanghai BIOZERON Biotech Co., Ltd. (Shanghai, China), complying with standard sequencing protocols.

2.3. Fish Species Recognization

Prior to fish species annotation, raw 12S rRNA gene sequencing reads underwent quality preprocessing with Trimmomatic v0.36 [30]. The trimming workflow included two steps: sliding window filtering (10 bp window, quality cutoff = 20) to cut off 3′ end bases with Phred scores < 20, and removal of truncated reads shorter than 100 bp. FLASH v1.2.11 was adopted to merge paired-end reads into contigs; we set the minimum overlap length to 10 bp and the maximum mismatch density to 0.2 to avoid unreliable contig assembly [31]. Demultiplexing relied on exact matching of barcodes and primer sequences with zero mismatches, and sequence orientation was unified in the following step. Chimeras were detected and discarded using USEARCH v10 by the UPARSE algorithm, combining reference-based filtering against the GOLD database v11.0 and de novo chimera checking. High-quality sequences were then grouped into ASVs using the DADA2 plugin implemented in QIIME2 [32]. We carried out taxonomic classification using BLASTn v2.14.1 (uclust algorithm, identity ≥ 99%, E-value ≤ 1 × 10⁻⁵) against the NCBI nt database (2024_04 release), and filtered out all non-piscine sequences. ASVs with read counts below 10 were excluded from downstream computation. In accordance with the historical checklist of Yangtze aquatic fauna [33], only fish species confirmed to occur in the Yangtze River were preserved for subsequent analyses.

2.4. Biodiversity Indices Calculation

All calculations of the biodiversity indices were performed in the R v4.4.2 platform.

2.4.1. Taxonomic Indices

The taxonomic alpha-diversity was assessed by the Chao1 index, which was calculated using the “vegan” package [34] based on the final fish taxa table. However, as the eDNA method is yet to be shown to reliably quantify taxa abundance [35], it precludes the assessment of the divergence and regularity facets of the taxonomic alpha-diversity. Furthermore, the taxonomic betadiversity between each of the two studied samples was computed based on the Gower’s dissimilarity distance using the “cluster” package [36]. The two components of taxonomic beta-diversity, namely taxa turnover and taxa nestedness, were quantified by means of the “betapart” package [37].

2.4.2. Phylogenetic Indices

Sequence alignment of ASVs was performed in the MUSCLE program [38], followed by phylogenetic tree reconstruction using FastTree [39]. Faith’s PD was estimated relying on the ASV matrix and the resulting phylogeny through the “picante” package [40] to quantify phylogenetic alpha diversity within fish communities. Phylogenetic divergence and evenness were evaluated using two metrics: Mean Pairwise Distance (MPD), reflecting the average phylogenetic separation between species [41], and Variance in Pairwise Distance (VPD), which quantifies variability in pairwise phylogenetic distances [42]. MPD responds to deep-time diversification processes [43], so phylogenetic basal clustering or overdispersion will directly shape MPD outcomes. Zintzen et al. [44] highlighted that VPD enables detection of complex phylogenetic configurations, such as communities containing both ancient distinct lineages and recently formed species clusters. Owing to positive covariation between these phylogenetic indices and species richness, SES values were calculated based on 1000 null phylogenies. Random shuffling of tree tip labels was implemented to remove the confounding correlation with taxonomic richness. If data follow a normal distribution, SES values above 1.96 suggest significant phylogenetic overdispersion (p < 0.05), while values lower than −1.96 correspond to significant trait-based species clustering [45]. For phylogenetic beta diversity estimation, unweighted UniFrac distances were calculated with the “GUniFrac” package [46], and the turnover fraction of UniFrac dissimilarity was decomposed using the “betapart” package.

2.4.3. Functional Indices

To evaluate functional diversity within fish communities, functional trait information was compiled from an earlier study that identified the target fish species [47]. We computed the FDiv index to characterize functional divergence, relying on species composition and functional trait data; all analyses were implemented via the “FD” package [48]. As outlined by Myers et al. [49], the mean pairwise functional distance index (MPFD) was utilized to calculate the divergence and regularity of functional alpha-diversity. This index corresponds to the mean functional distance between all species pairs. In addition, the variance in pair-wise functional distance (VPFD) index was employed to quantify the regularity of the functional distances among species. We calculated SES values for these metrics via a null model with 1000 randomised assignments of functional traits across species. In order to ascertain functional beta-diversity, the Jaccard’s dissimilarity distance metric was utilized. Furthermore, the ‘betapart’ package was employed to facilitate the decomposition of functional turnover.

2.4.4. Hill Numbers

The unifying concept of Hill numbers was further employed to document the richness facet of phylogenetic and functional alpha-diversity indices using the “hillR” package [50]. As demonstrated in previous work, Hill numbers can estimate the effective number of sampling units: species for taxonomic diversity, phylogenetic branch segments, and functional distances for functional trait diversity [51]. This mathematical framework simultaneously considers species presence and abundance patterns. The present study was predicated exclusively on taxa occurrence; consequently, Hill numbers with q = 0 were utilised in order to capture functional and phylogenetic diversity. With regard to traditional phylogenetic and functional indicators, SES values for the Hill numbers were also computed in order to decorrelate them from the taxonomic richness.

2.5. Statistics Analysis

All statistical analyses were also accomplished in the R v4.4.2 platform and visualized by the “ggplot2” package [52].
The species accumulation curves of fish communities, as derived from the species tables, were accomplished by means of the ‘iNEXT’ package [53]. The Venn diagram was generated using the “VennDiagram” package [54] to identify the shared and unique fish species across different regions. A comparison was made of the differences in the average fish detected rate and fish numbers belonging to different functional guilds among three regions. This was achieved by means of the Kruskal–Wallis test with the post hoc test Dunn’s test using the “FSA” package [55]. Dunn’s test was utilized to evaluate the disparities in alpha-diversity, beta-diversity, SES of Hill’s numbers for phylogenetic and functional diversity, and species turnover rate of fish communities across disparate regions. Principal coordinate analysis (PCoA) and adonis test, based on three beta-diversity facets, were executed using the “ape” and “vegan” packages, respectively. The application of generalized linear models was undertaken for the purpose of evaluating the associations between functional diversity and the other two diversity metrics of fish communities at the alpha and beta levels, respectively. The geographic distance between each of two stations in a single tributary was calculated by the “geosphere” package based on their longitude and latitude [56]. Subsequently, the geographic distance-dependent similarity (GDDS) for each beta-diversity distance in the Upper and Down regions, respectively, were assessed by linear regression.
We aimed to reveal the assembly mechanisms governing fish communities in the present work. The iCAMP approach, a null model analysis built upon phylogenetic binning, was used to infer community assembly processes [57]. This approach enables quantification of diverse ecological processes: all detected taxa are first sorted into separate bins based on phylogenetic relatedness. Null-model-based phylogenetic diversity analysis determines the prevailing process for each bin, using βNRI and the modified Raup–Crick (RC) index to measure taxonomic β-diversity. For each bin, homogeneous selection accounts for pairwise comparisons where βNRI < −1.96, and heterogeneous selection covers cases with βNRI > 1.96. For pairwise comparisons with |βNRI| ≤ 1.96, further partitioning is conducted using the RC index. Homogenizing dispersal is represented by comparisons with RC < −0.95, whereas dispersal limitation occurs when RC > 0.95. The remaining pairwise comparisons that meet both |βNRI| ≤ 1.96 and |RC| ≤ 0.95 are classified as drift. The procedure is repeated for each phylogenetic bin. Next, process proportions from each bin are weighted by bin relative abundance, and summed to obtain the relative importance of each ecological process at the entire community level. Standardized effect size Cohen’s d was adopted to examine regional shifts in assembly processes.

3. Results

3.1. Recognization of Fish Species

Across the 114 samples, a total of 150 fish species belonging to 13 orders, 27 families, and 86 genera were identified through eDNA metabarcoding (Figure 1b). The species accumulation curves of the three regions under consideration exhibited a tendency to be asymptotic, thus indicating that the sample size collected could potentially represent the full diversity of fish species present within the Yangtze River (Figure 1c). A total of 145, 120, and 141 fish species were identified from the Upper, RES_SX, and Down samples, respectively (Figure S1). The mean fish detection rate in the RES_SX samples (26.95%) was found to be significantly lower than that in the Upper group (40.13%) (Dunn’s test, p < 0.05, Figure 1d). In the Down region, the average detection rate of fish exhibited a marginal recovery (33.90%), yet it failed to fully revert to the level documented in the Upper region (Figure 1d). Of the three regions under scrutiny, 112 fish species were shared by all three regions, accounting for 74.7% of the total fish species detected (Figure 1e). Four fish species, Cyprinus carpio, Hypophthalmicthys nobilis, Triplophysa orientalis, and Zacco platypus, were detected in all of the studied samples (Figure S1). Furthermore, the presence of three additional fish species, namely Schizothorax sinensis, Schizopygopsis malacanthus and Triplophysa stewarti, was detected in the Upper and RES_SX regions at a rate of 100% (Figure S1). Furthermore, three additional species of fish were identified in the upper samples: Carassius auratus, Schizothorax wangchiachii, and Gymnocypris potanini (Figure S1).
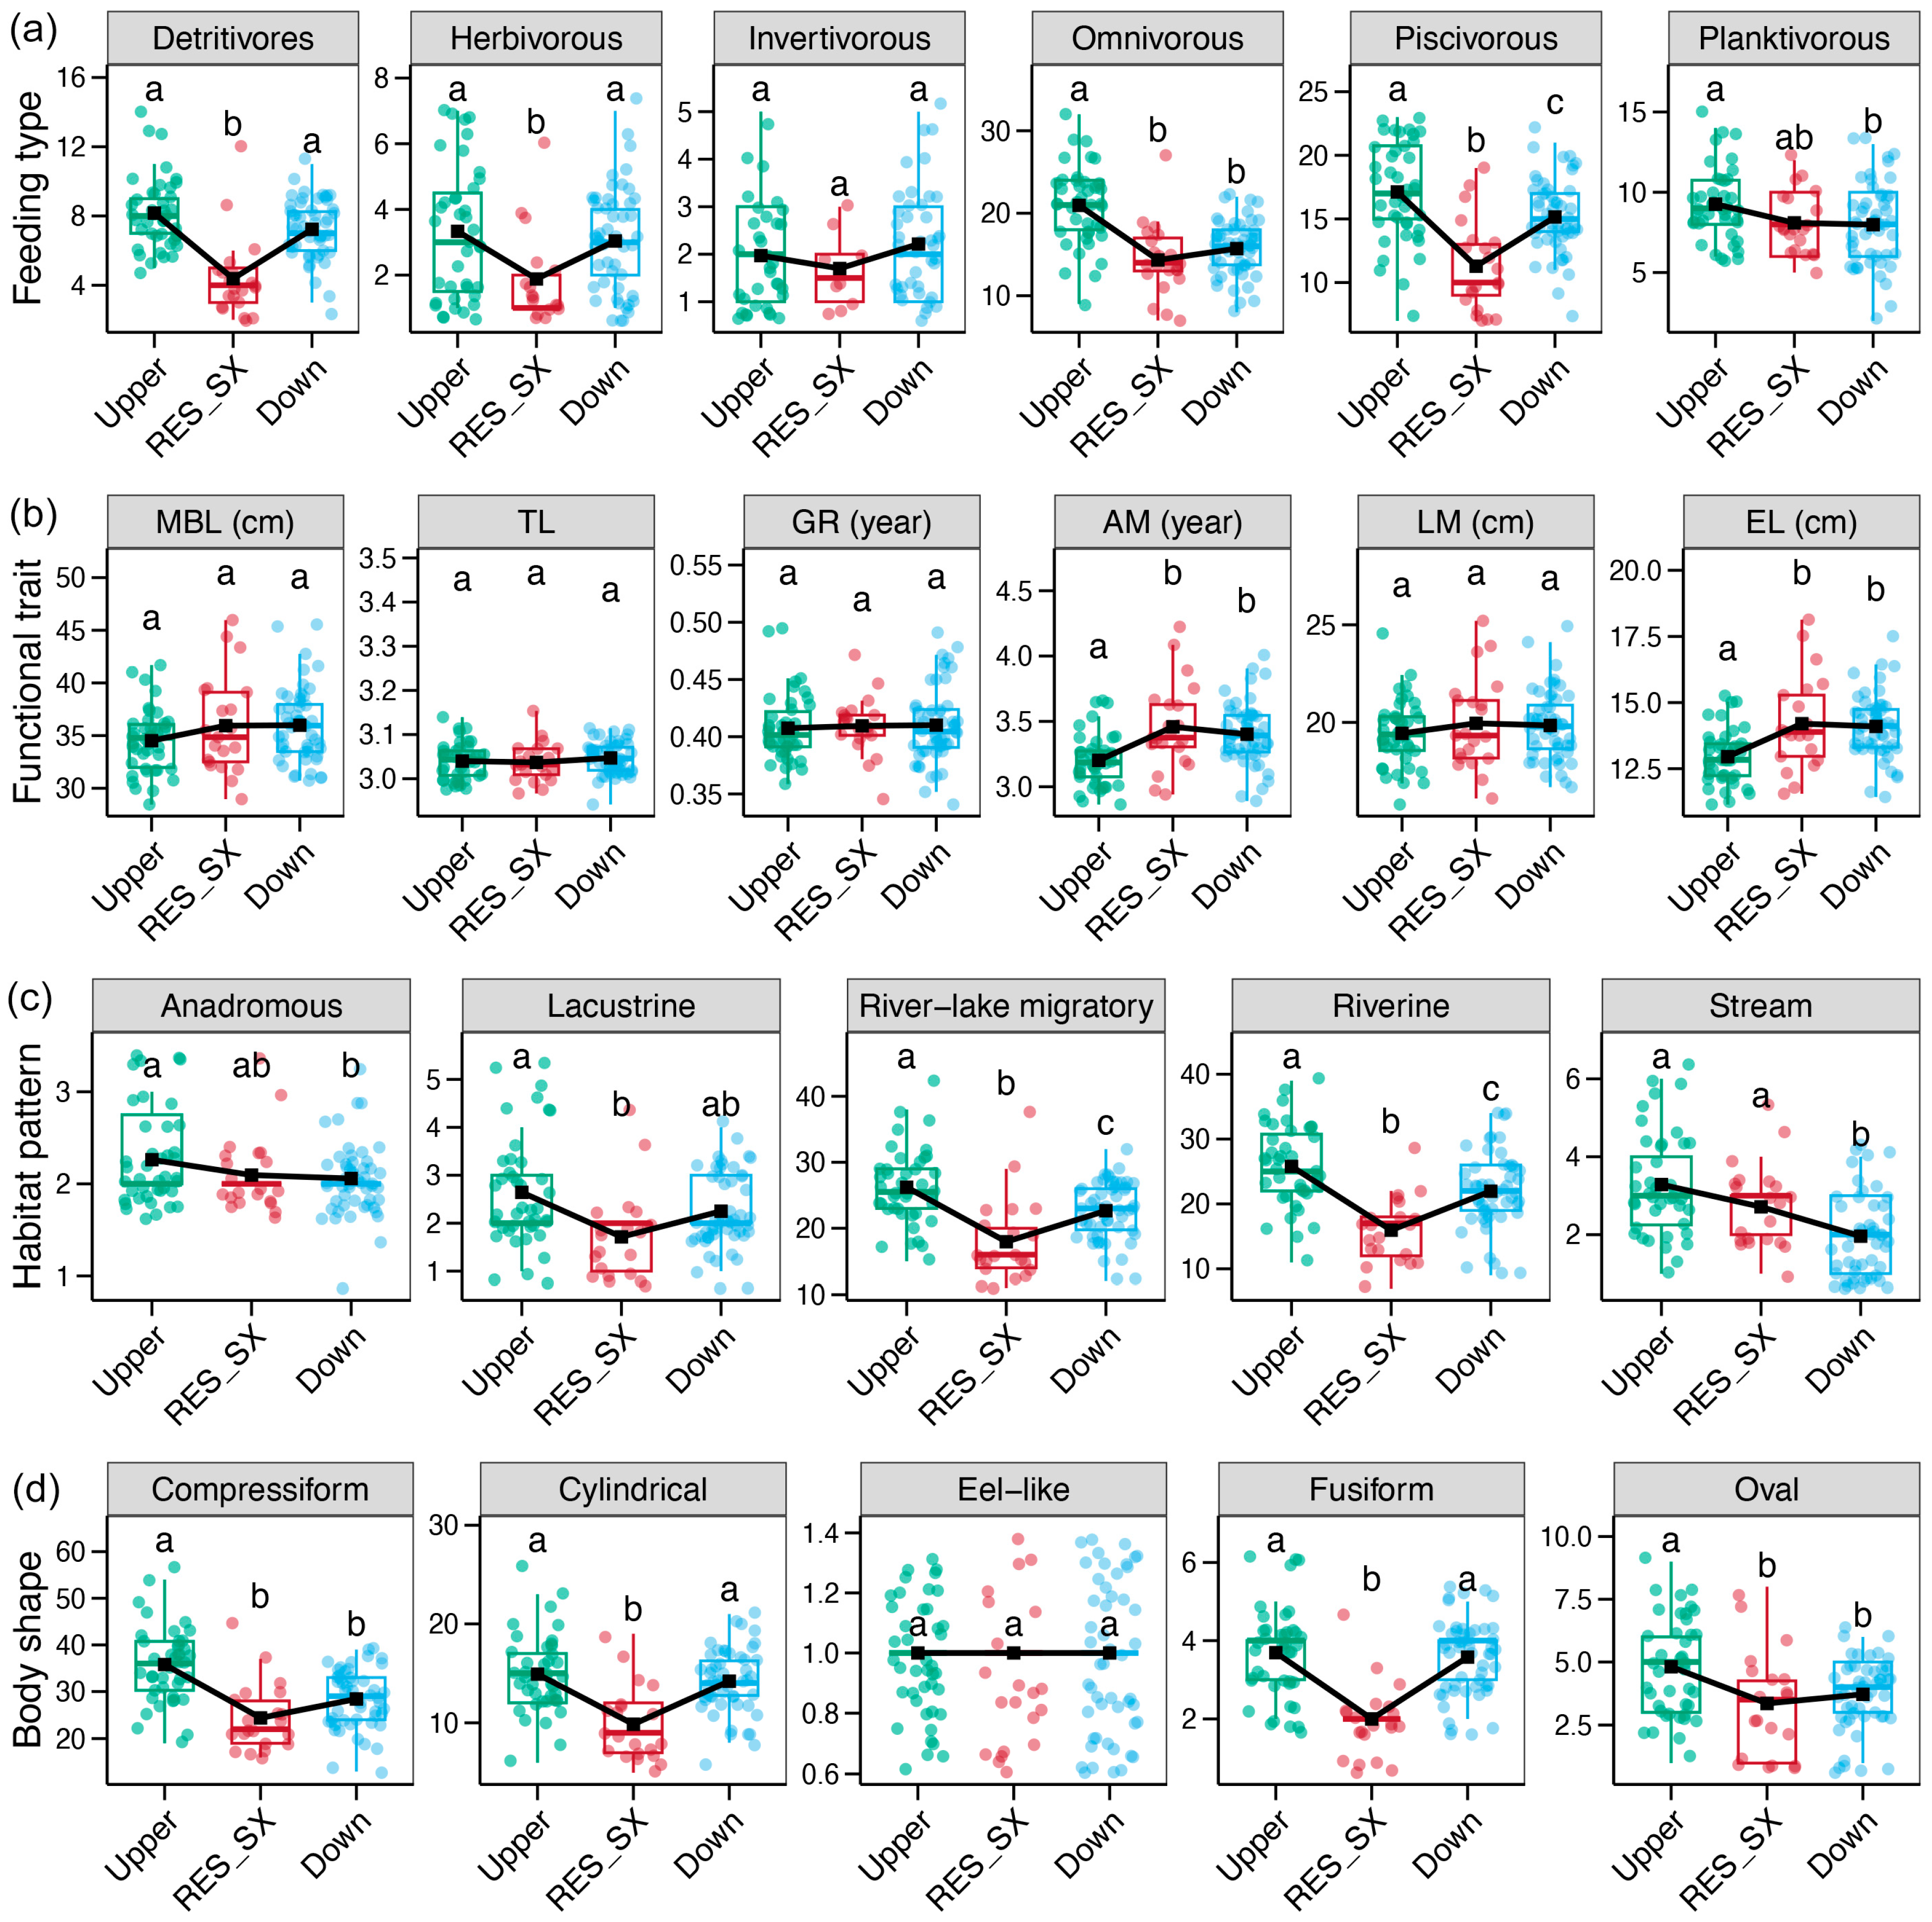
Three endemic fish species were identified in the Upper region (Sinibotia superciliaris, Sinibrama taeniatus, and Platysmacheilus exiguus) and the Down region (Acheilognathus omeiensis, Monopterus albus, and Megalobrama pellegrini), respectively (Figure 1e). Conversely, the RES_SX region was found to be devoid of endemic fish species, with 24 fish species absent from this region (Figure 1e and Table S1). A further comparison was made of the differences in fish numbers belonging to different ecological types across the three regions. With the exception of planktivorous fish, the fish number of all other feeding guilds in the RES_SX area was significantly lower than that in the Upper Reach (Dunn’s test, p < 0.05, Figure 2a). The numbers of detritivores, herbivorous, and invertivorous fish recovered in the Down region, while piscivorous fish showed partial recovery (Figure 2a). Conversely, the Down region exhibited a significantly lower abundance of omnivorous and planktivorous fish compared to the Upper reach (Dunn’s test, p < 0.05, Figure 2a). Furthermore, the mean AM and EL of fish species identified from the RES_SX and Down regions were found to be significantly higher than those in the Upper Reach (Dunn’s test, p < 0.05, Figure 2b). For fish exhibiting divergent habitat patterns, the RES_SX region exhibited a significant decline in the numbers of lacustrine, river-lake migratory, and riverine fish species when compared to the Upper Reach (Dunn’s test, p < 0.05, Figure 2c). The numbers of these fish taxa showed partial recovery in the Down region, whereas the numbers of anadromous and stream fish species in the Down region remained significantly lower than those in the Upper reach (Dunn’s test, p < 0.05, Figure 2c). Furthermore, the RES_SX area exhibited a significantly lower diversity of compressiform, cylindrical, fusiform, and oval fish species when compared to the Upper Reach (Dunn’s test, p < 0.05, Figure 2d). Notably, the prevalence of cylindrical and fusiform fish species in the lower reach has been observed (Figure 2d).

3.2. Variations in Alpha-Diversity of Fish Communities

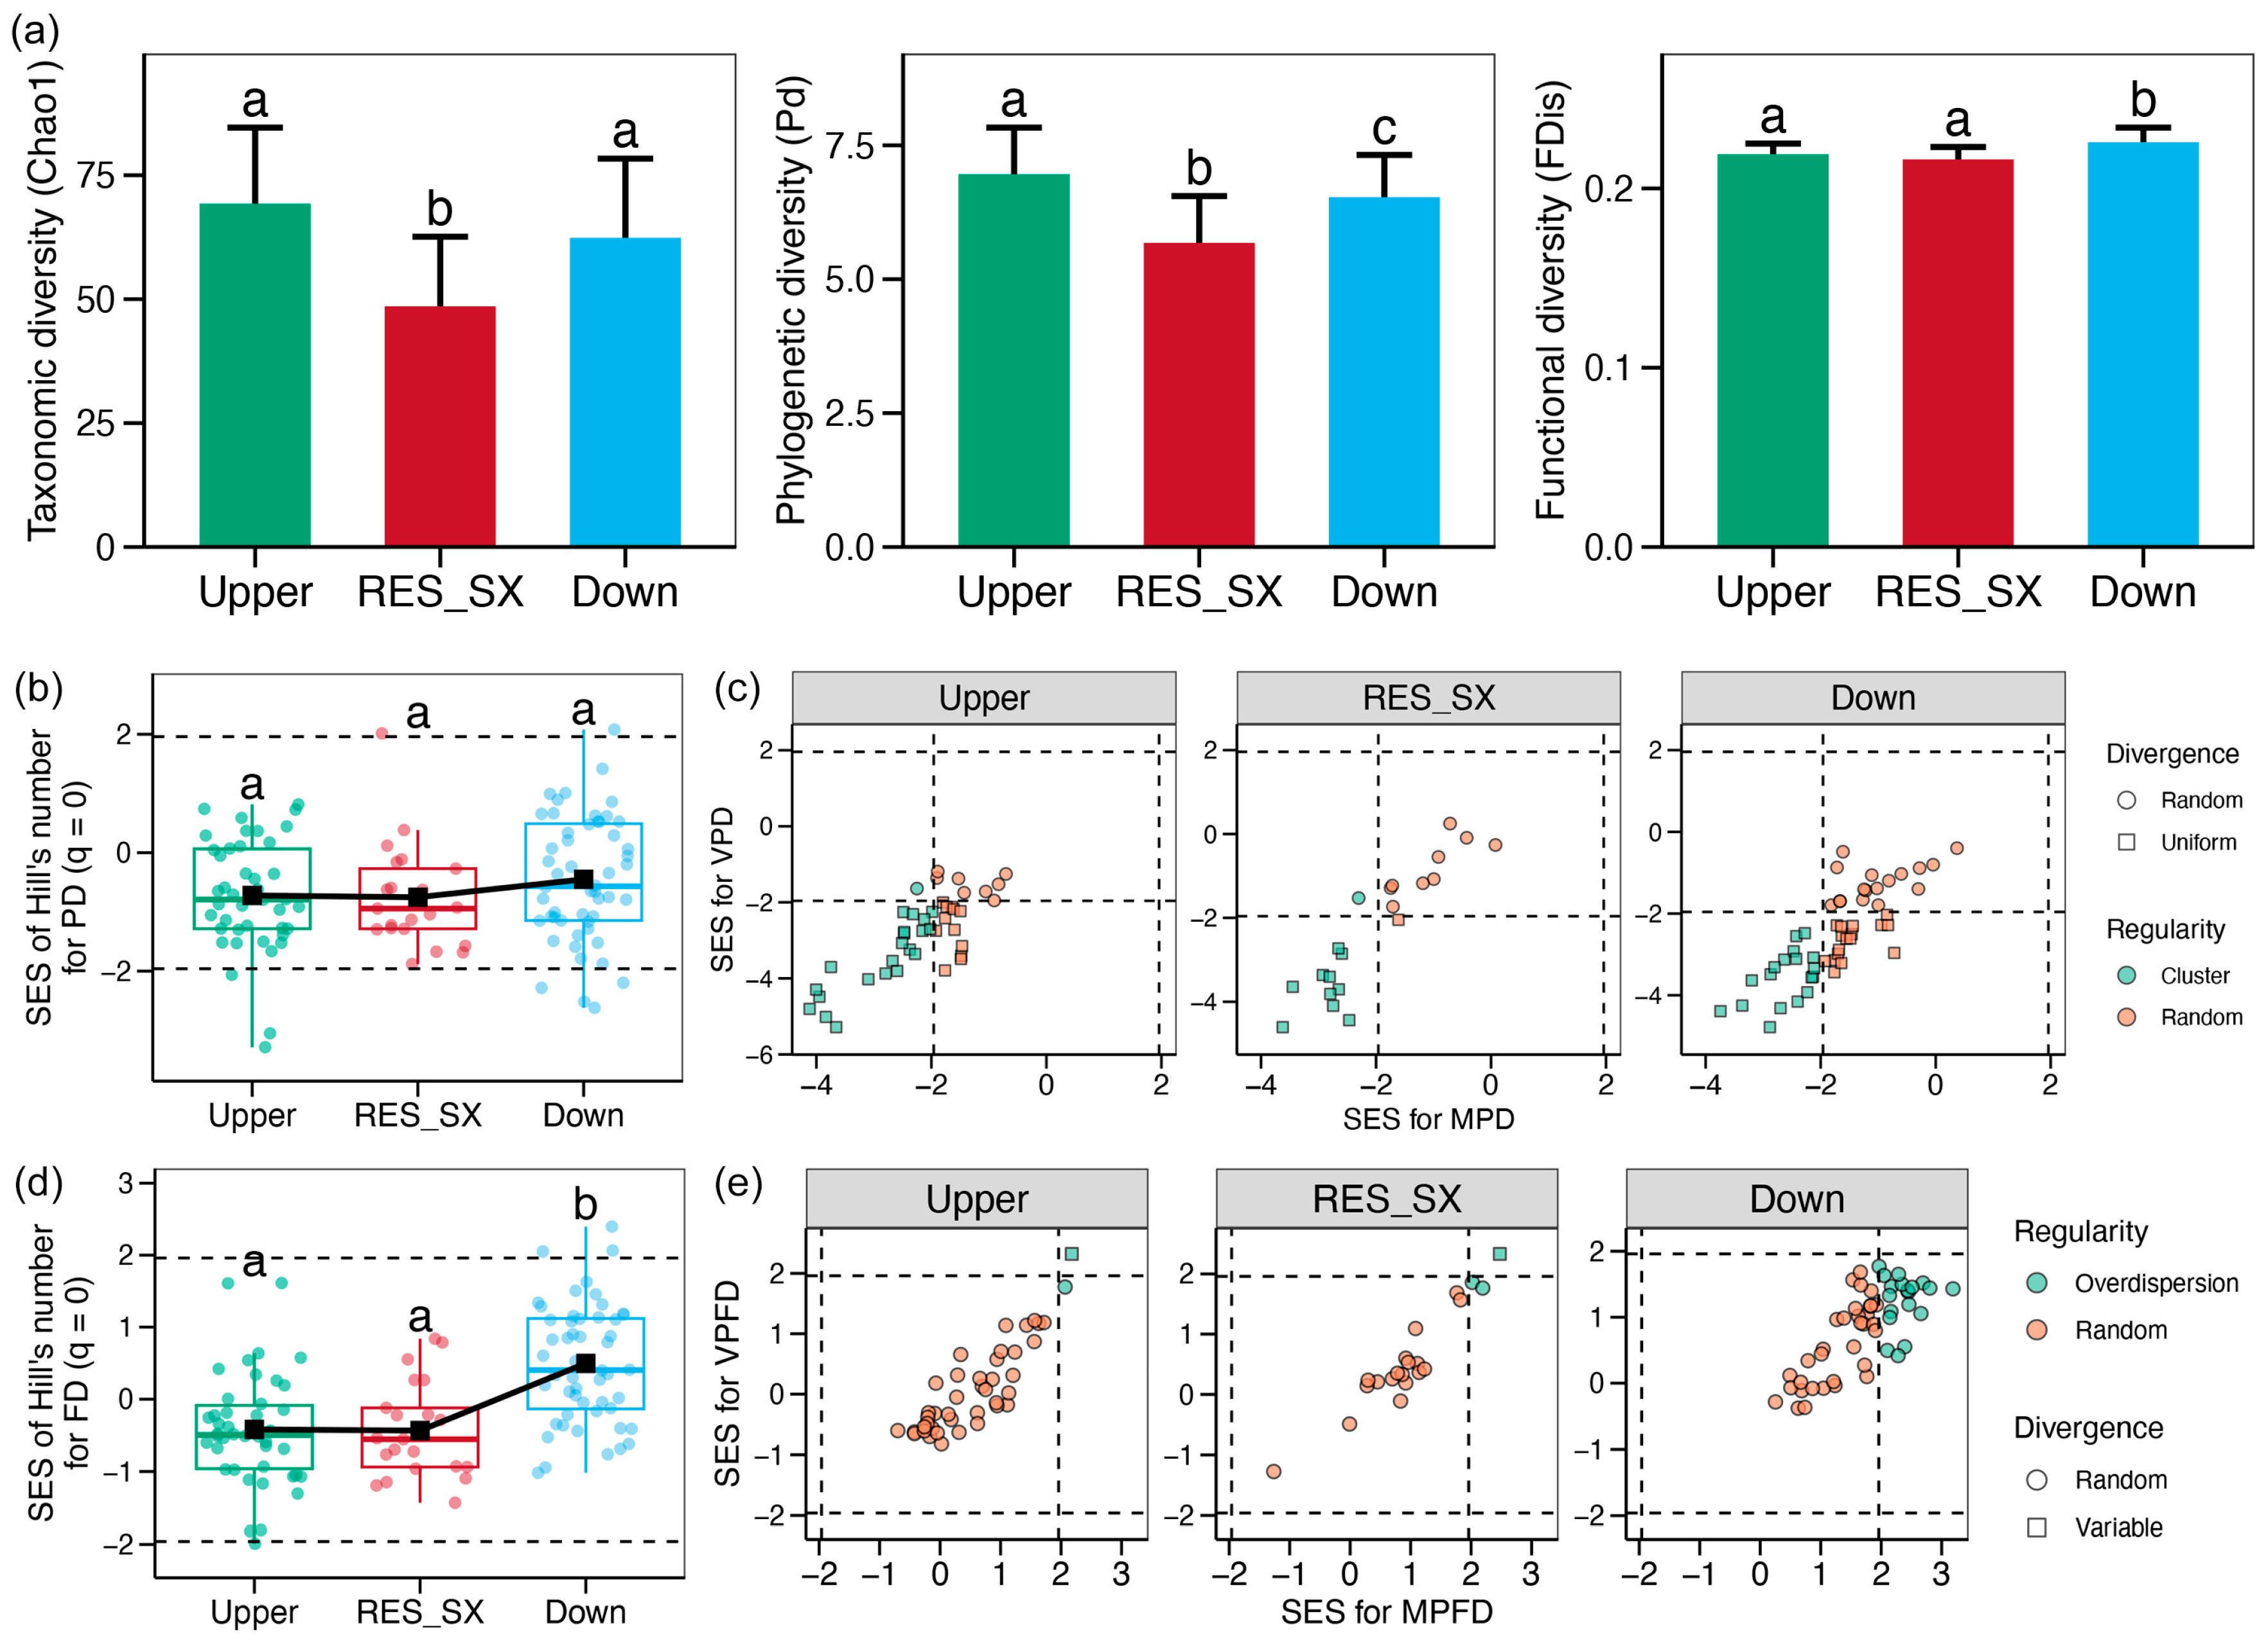
The differences in the three components of alpha-diversity of fish communities along the Yangtze River were then compared (Figure 3a). Fish communities in the RES_SX area exhibited the lowest taxonomic and phylogenetic alpha-diversity, which were significantly lower than those in the Upper and Down regions (Dunn’s test, p < 0.05). The taxonomic diversity of fish communities was found to be similar in the Upper and Down regions (Dunn’s test, p > 0.05). Conversely, the phylogenetic diversity of fish communities exhibited a significantly higher level in the Upper reach than in the Down region (Dunn’s test, p < 0.05). Furthermore, the functional diversity of fish communities in the Down region was found to be significantly higher than in the Upper and RES_SX areas (Dunn’s test, p < 0.05).
In consideration of the substantial disparities in taxonomic diversity among the fish communities in the three regions, a direct comparison of their phylogenetic and functional diversity may be influenced by the species richness background. Therefore, the SES values of the phylogenetic and functional alpha-diversity indices, which were decorrelated from the taxonomic richness, were compared across different regions. The SES of Hill’s number for phylogenetic alpha-diversity among different regions was not significantly varied (Dunn’s test, p > 0.05, Figure 3b). For each station, the values of SES for MPD in 22 (53.66%), 11 (51.74%), and 18 (34.63%) sites from the Upper, RES_SX, and Down regions, respectively, were lower than −1.96 (Figure 3c). The results indicated a substantial decrease in the clustering of fish phylogenetic diversity in the Down region in comparison to other regions. Concurrently, the SES values for VPD in 33 (80.49%), 11 (51.74%), and 35 (67.31%) sites from the Upper, RES_SX, and Down regions, respectively, were lower than −1.96 (Figure 3c). This indicated that the uniformity of fish phylogenetic diversity decreased markedly in the RES_SX area and recovered somewhat in the Down reach, but still remained lower than that in the Upper reach.
The SES of Hill’s number exhibited a significant increase in the Down region compared to the Upper and RES_SX areas (Dunn’s test, p < 0.05, Figure 3d). This finding indicates a higher level of functional diversity in the fish communities of the Down region. For each station, the SES values for MFPD in 2 (0.32%), 3 (14.29%), and 19 (36.54%) sites from the Upper, RES_SX, and Down regions, respectively, were higher than 1.96 (Figure 3e). This finding indicated the presence of overispersion in the fish functional diversity in both the RES_SX and Down regions. Conversely, the SES values for VFPD in 1 (0.16%), 1 (4.76%), and 0 (0.00%) sites from the Upper, RES_SX, and Down regions, respectively, were higher than 1.96 (Figure 3e). This demonstrated no apparent variations in the regularity of fish functional diversity among different regions. Furthermore, an investigation was conducted into the associations between the various components of fish alpha-diversity. However, no significant correlations were observed among the components in all three regions or in a single region (linear regression, p > 0.05, Figure S2).

3.3. Variations in Beta-Diversity of Fish Communities

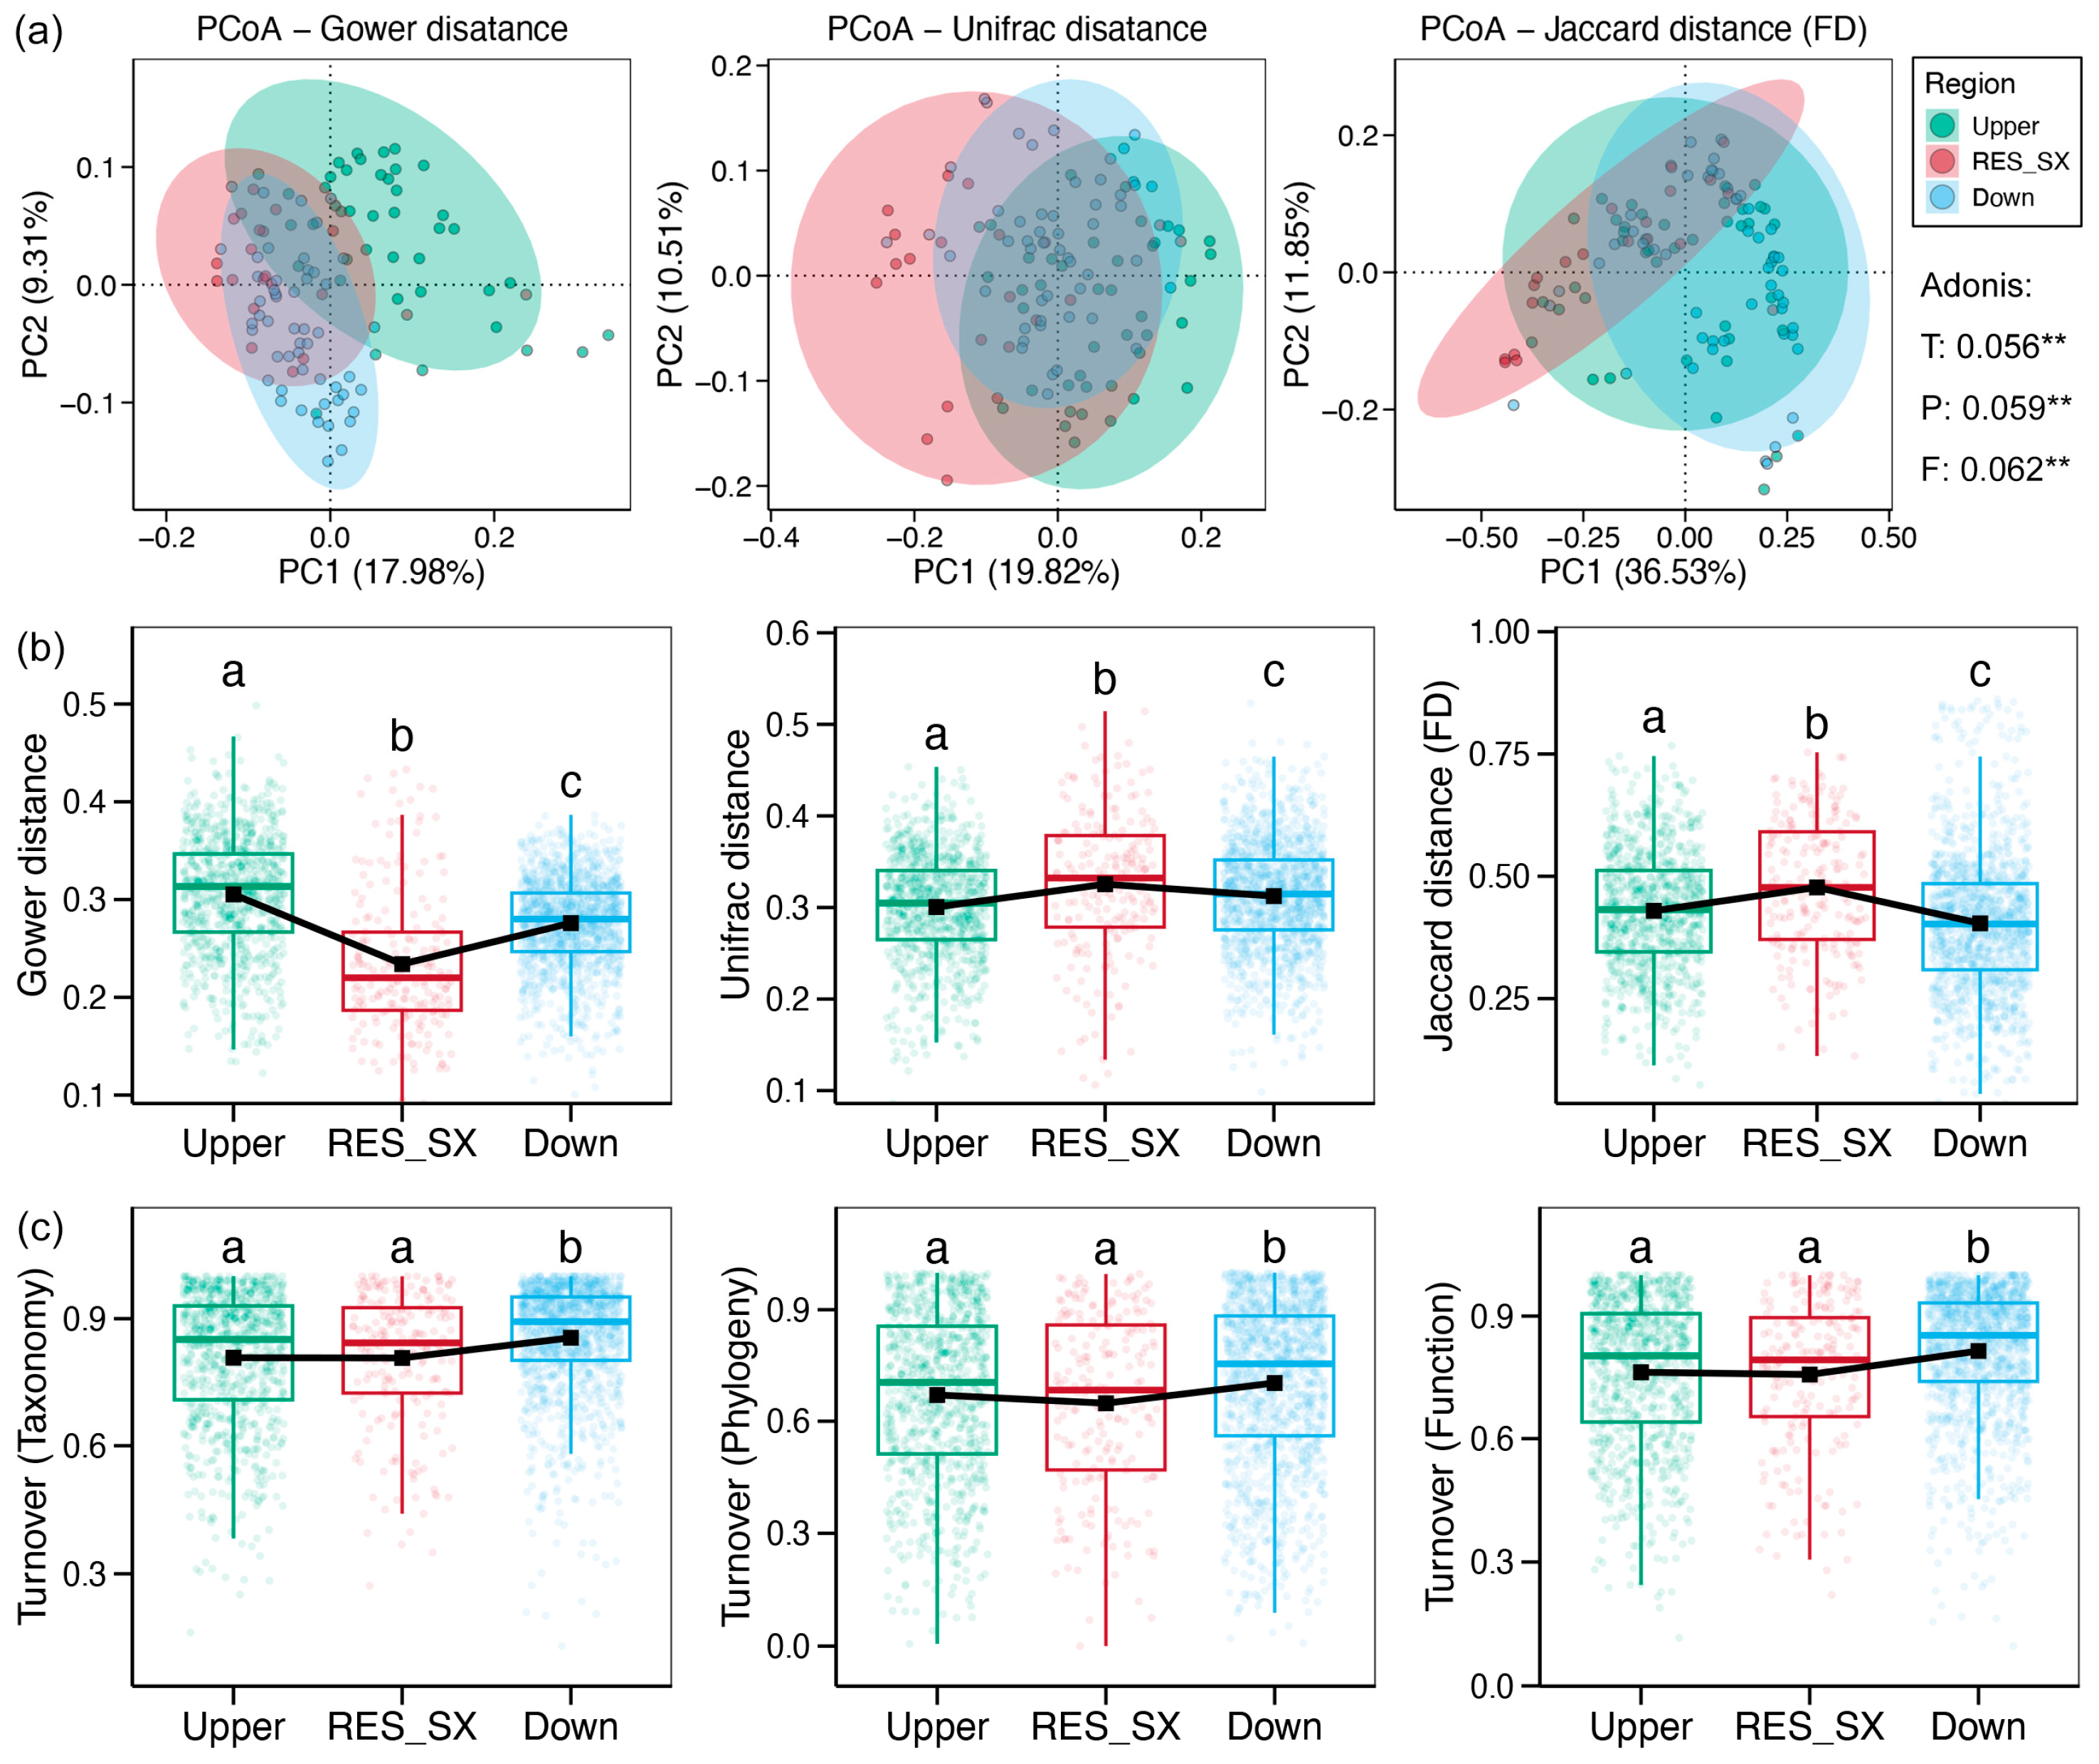
A comparison of the alpha-diversity and three components of beta-diversity of fish communities was also made among different regions. PCoA plots demonstrated the presence of distinct clusters for samples originating from disparate regions. A statistically significant impact of regional divergence was identified for all three components of fish beta-diversity (Adonis test, p < 0.05, Figure 4a). The taxonomic beta-diversity (Gower distance) of fish communities in the RES_SX area was the lowest, being significantly lower than that in the Upper and Down regions (Dunn’s test, p < 0.05, Figure 4b). Concurrently, the taxonomic beta-diversity of fish communities in the Down region was found to be significantly lower than that in the Upper region (Dunn’s test, p < 0.05, Figure 4b). The pattern of phylogenetic beta-diversity (Unifrac distance) was contrary to that of taxonomic beta-diversity. The phylogenetic beta-diversity of fish communities in the RES_SX area was found to be the highest, being significantly higher than that in the Upper and Down regions (Dunn’s test, p < 0.05, Figure 4b). Concurrently, the phylogenetic beta-diversity of fish communities in the Down region exhibited a significantly higher level of diversity compared to that in the Upper region (Dunn’s test, p < 0.05, Figure 4b). The functional beta-diversity (Jaccard distance) of fish communities in the RES_SX area was also the highest, being significantly higher than that in the Upper and Down regions (Dunn’s test, p < 0.05, Figure 4b). Concurrently, the functional beta-diversity of fish communities in the Upper region exhibited a significantly higher level of diversity compared to that in the Down region (Dunn’s test, p < 0.05, Figure 4b). Furthermore, analysis of beta-diversity partitioning indicated that species turnover in the Down reach was significantly higher than that observed in the Upper reach and the RES_SX area (Dunn’s test, p < 0.05, Figure 4c).
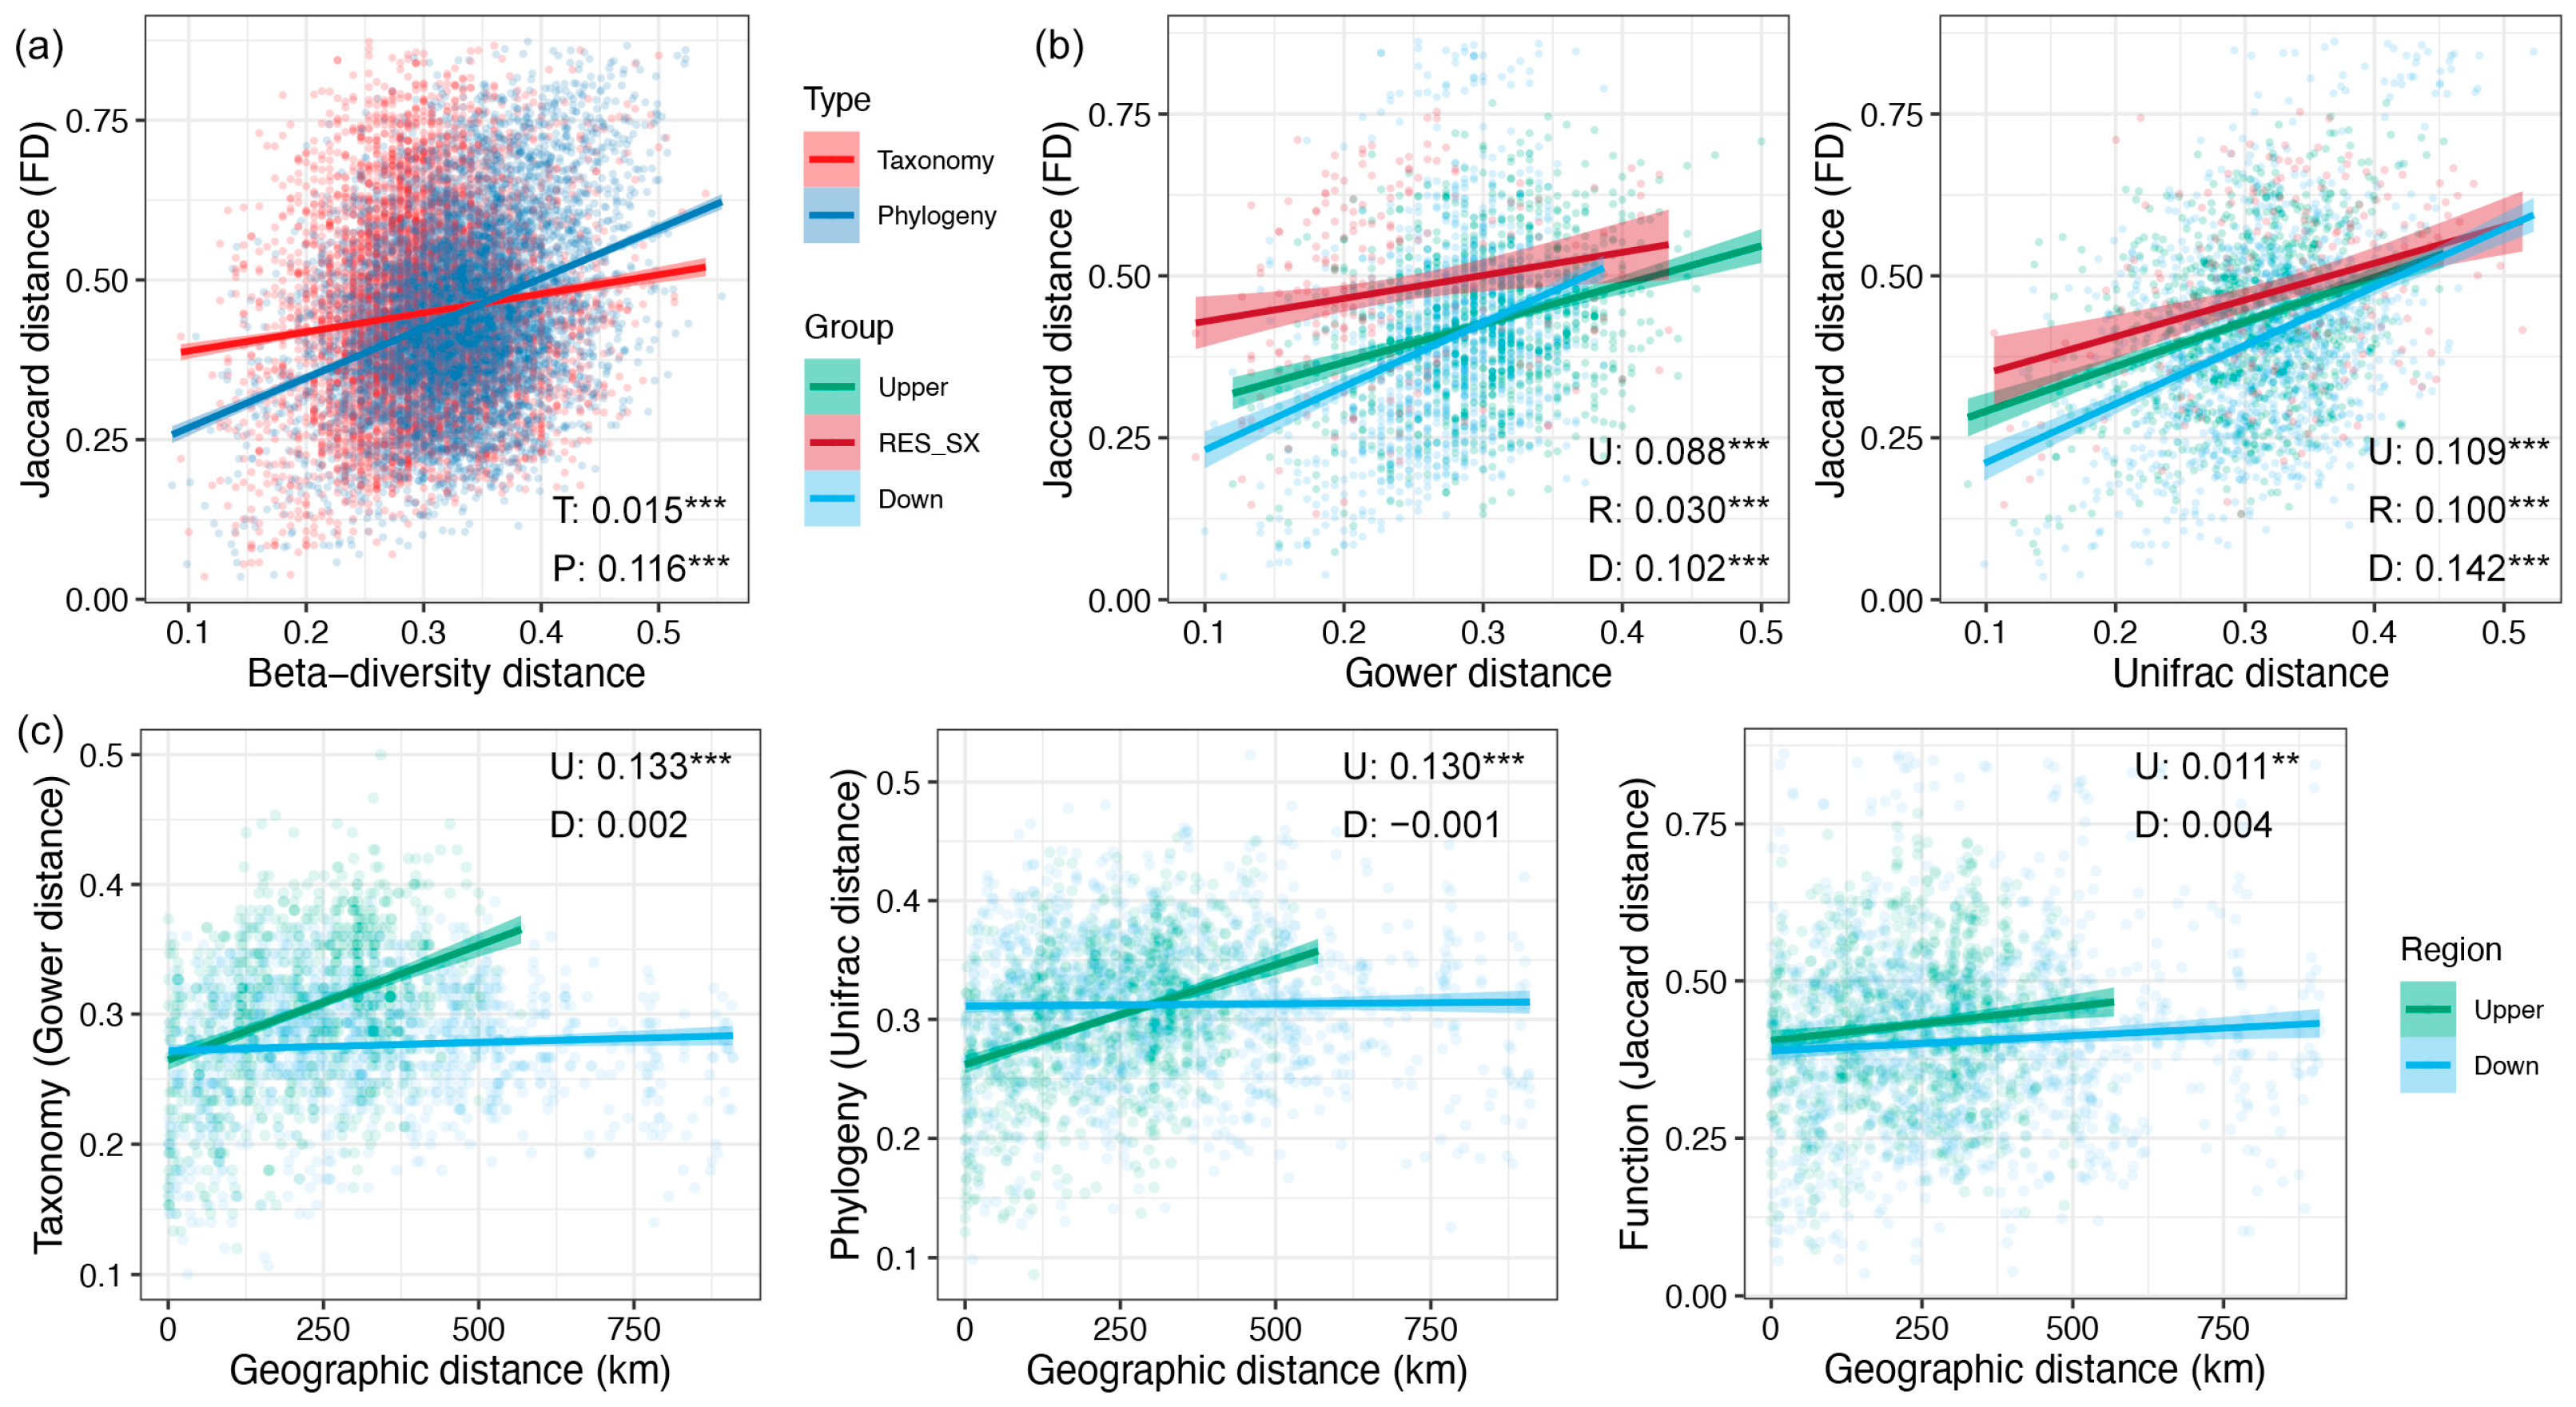
Across the entire study area and within each individual region, a significant correlation was identified between the taxonomic and phylogenetic beta-diversity of fish communities and their functional beta-diversity (linear regression, p < 0.05, Figure 5a,b). In general, the strength of the associations between the phylogenetic and functional be-ta-diversity distances was higher than those between the taxonomic and functional beta-diversity distances (Figure 5a,b). Moreover, the association strength of beta-diversity in the RES_SX area was found to be lower than that in the Upper Reach. In contrast, the association strength of beta-diversity in the Down Reach was found to be significantly higher than that in both the Upper Reach and the RES_SX area (Figure 5b). Furthermore, in the Upper region, all three beta-diversity components exhibited significant GDDS, whereas such distance dependence was observed to disappear in the Down region of the RES_SX area (Figure 5c).

3.4. Assembly Mechanisms of Fish Communities

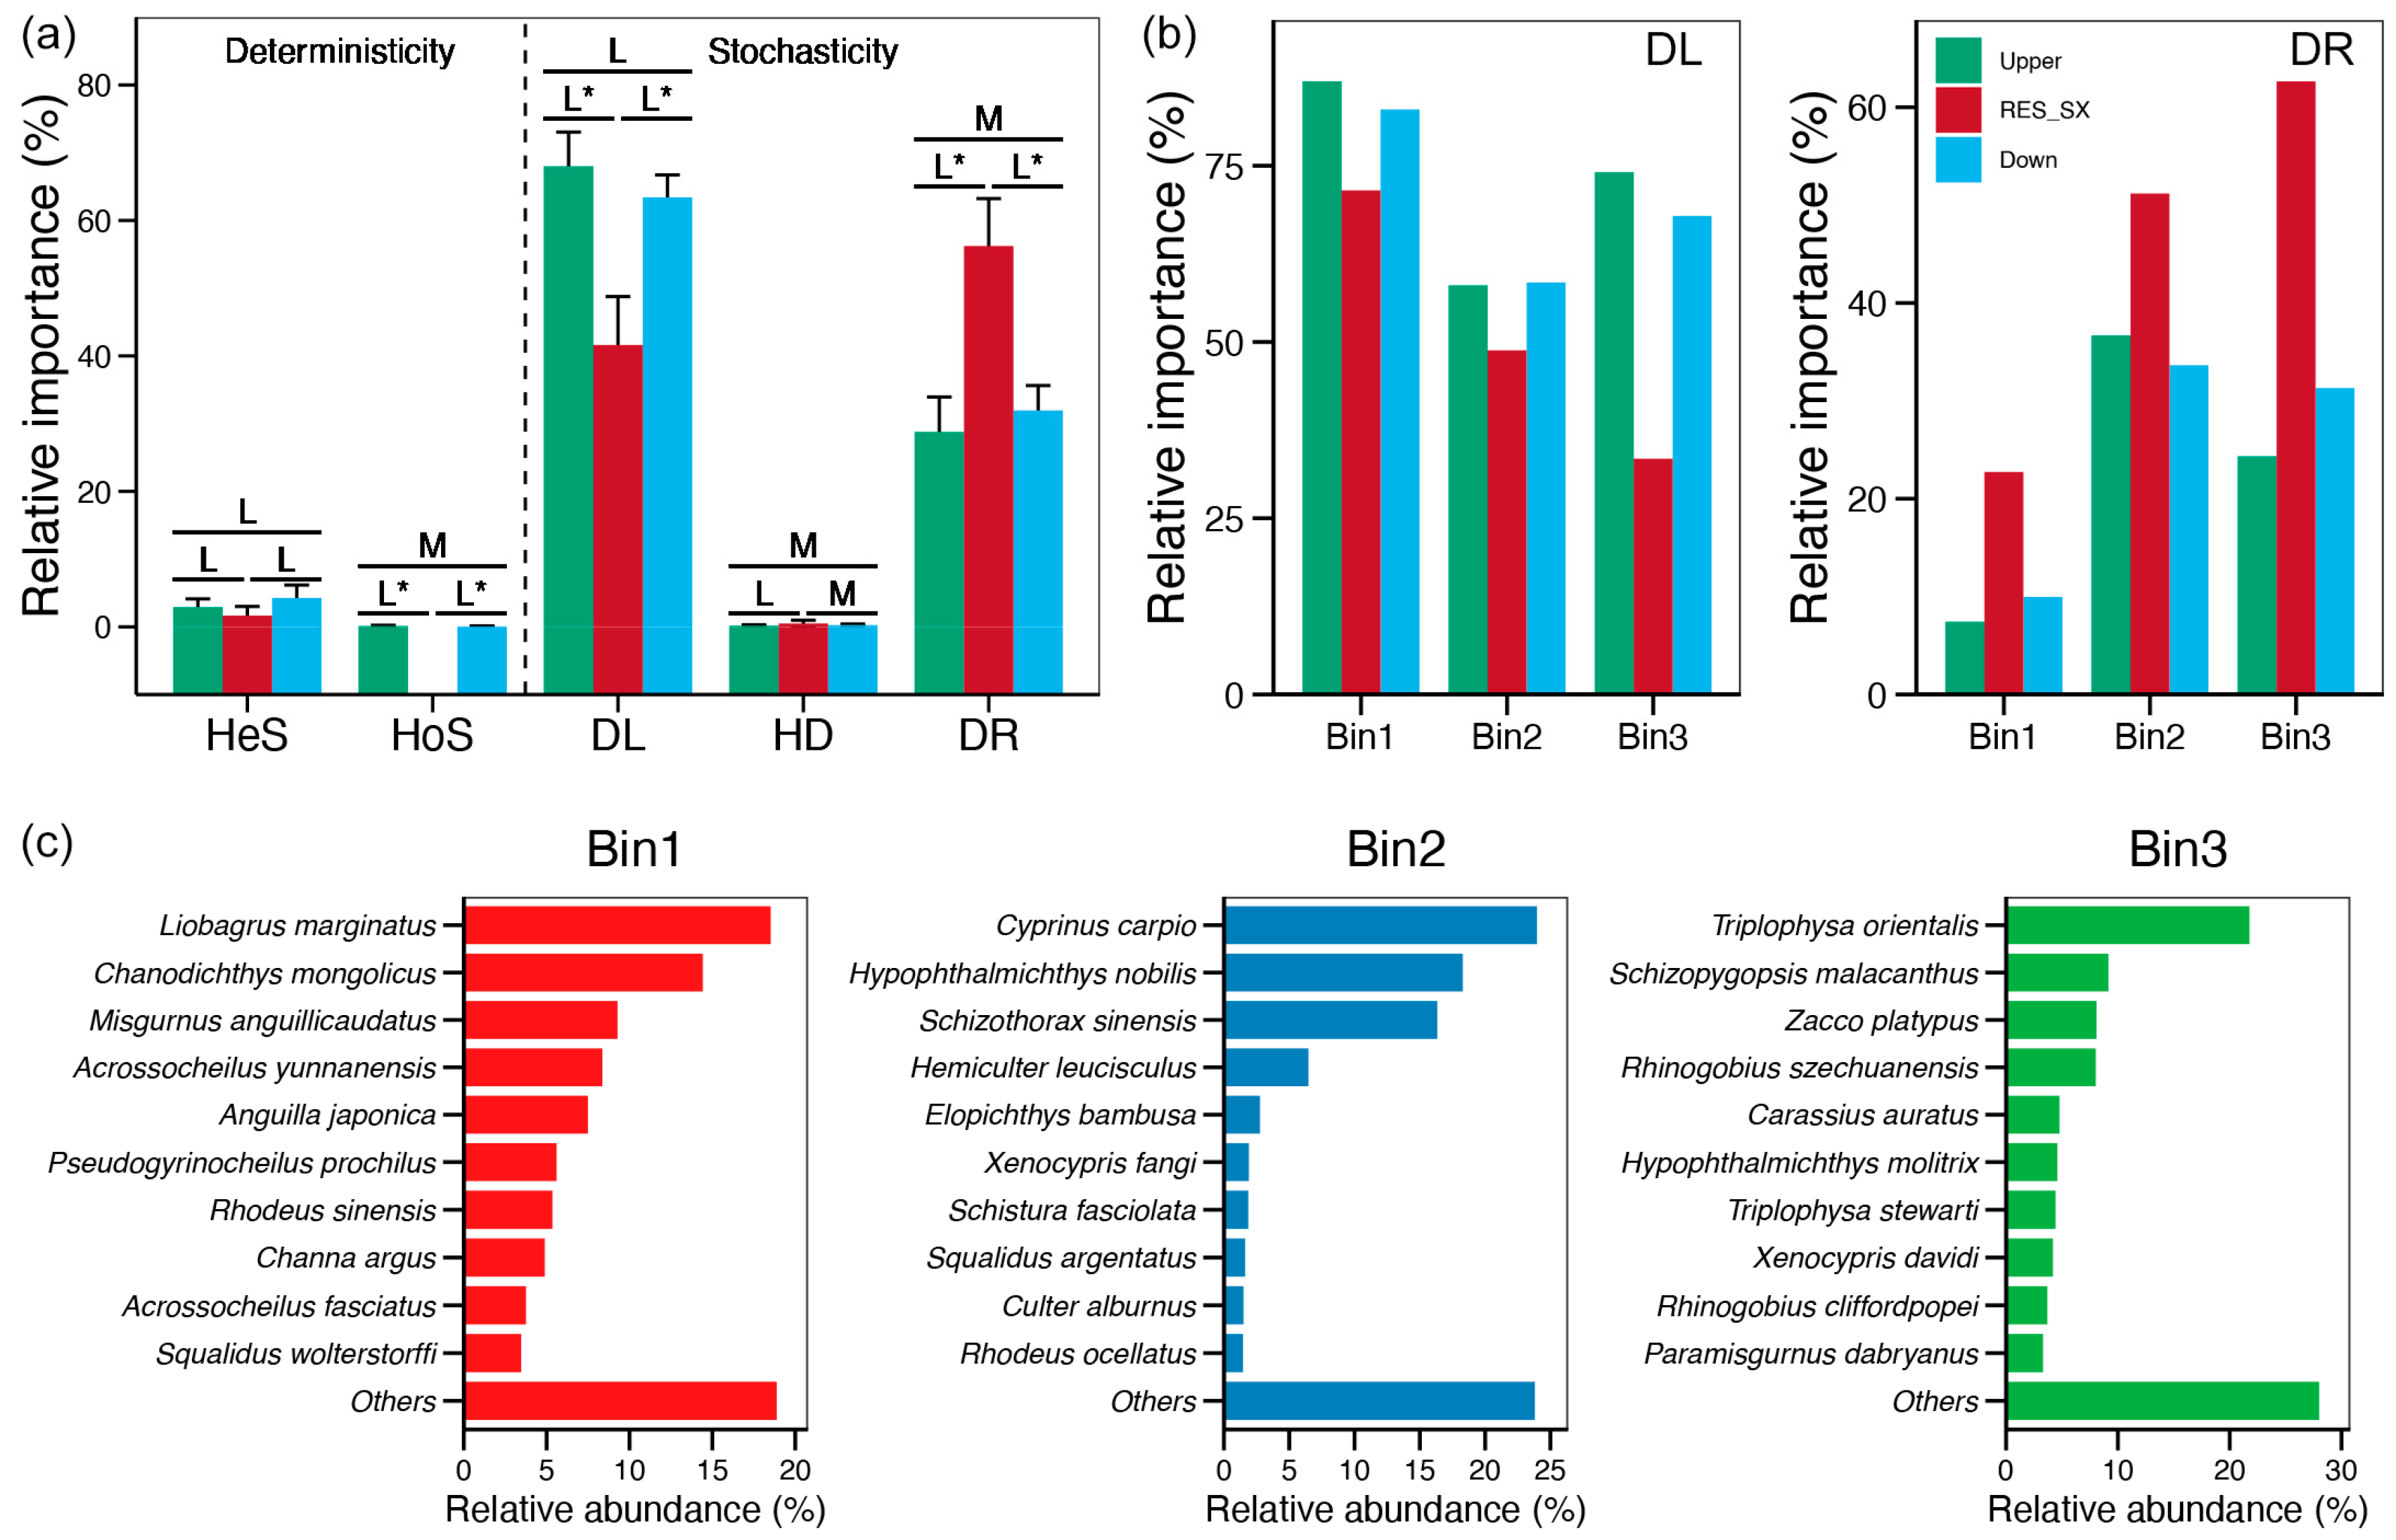
The iCAMP was found to be a reliable indicator of stochastic processes, which were observed to be dominant in the assembly of fish communities across all three regions studied (Figure 6a). Among these, dispersal limitation (DL) and drift (DR) were found to be representative stochastic processes that shaped the fish communities (Figure 6a). The relative importance of DL and DR was found to be significantly lower and higher in the RES_SX region, respectively, in comparison to the Upper and Down regions (p < 0.05, Figure 6a). The iCAMP results indicate that fish species inhabiting the Yangtze River were categorised into three distinct bins (Figure 6b). The three bins exhibited synergistic effects on the contribution of ecological processes shaping community structure. Specifically, Bin1 demonstrated a higher level of contribution to DL, whereas Bin3 exhibited a more pronounced contribution to DR (Figure 6b). The most prevalent species in the Bin1 were Liobagrus marginatus and Chanodichthys mongolicus (Figure 6c). For Bin2, the species of particular importance included Cyprinus carpio, Hypophthalmichthys nobilis, and Schizothorax sinensis (Figure 6c). Triplophysa orientalis was identified as the most significant species (Figure 6c).

4. Discussion

A plethora of studies conducted on the biodiversity of fish species inhabiting the Yangtze River have underscored the presence of a rich yet diminishing ecosystem. A total of 443 species were documented prior to 2017, whereas the 2017–2021 project, as outlined by Yang et al. [33] (2023), recorded a mere 323 fish species. In the present study, a total of 150 fish species were identified, which is significantly lower than the documented historical record. On the one hand, the present study adopted eDNA technology, which may not encompass 100% of the historical fish information in the Yangtze River due to limitations of primers and databases [58]. Deploying multiple primer pairs in follow-up studies should be executed to overcome this taxonomic coverage limitation of single primer. Conversely, to circumvent the occurrence of excessive false positives, we implemented highly rigorous annotation standards. This may have resulted in the underestimation of biodiversity, particularly in relation to the detection of rare fish species [59]. Furthermore, the samples in this study were collected at a single time point, providing only a temporal snapshot of fish diversity in the Yangtze River. Consequently, the observed diversity level is necessarily lower than that derived from multi-year longterm surveys [19]. Despite a certain degree of underestimation of fish diversity, the major fish taxa recovered in this study are largely consistent with historical records in the Yangtze River. As Yang et al. [33] demonstrate, semimigratory Cyprinidae species such as common carp (Cyprinus carpio) and bighead carp (Hypophthalmichthys nobilis) were dominant species across the entire Yangtze River. The results of this study demonstrated that the Yangtze River exhibited substantial deterioration in fish diversity prior to the implementation of the recent protection strategy. This finding underscores the enduring challenge posed by the conservation of the Yangtze River and underscores the necessity for the development of additional conservation strategies that are targeted towards the recovery of endemic fish species.
It is of particular significance to note that the taxonomic diversity of fish exhibited a reduction in the RES_SX area in comparison with other regions. This phenomenon may be indicative of the deleterious impact of the Three Gorges Dam on the biodiversity of the Yangtze River. The construction of the dam has resulted in the formation of a substantial barrier along the river continuum, thereby impeding the upstream–downstream movements essential for spawning and feeding by numerous migratory species [60]. Furthermore, the regulation of reservoirs has been demonstrated to have a significant impact on the natural flood pulses, altering the timing, magnitude, and duration of high flows that are known to trigger the spawning of key riverine fish species [61]. Furthermore, the processes of flow regulation and sediment trapping have resulted in modifications to channel morphology, thereby disconnecting floodplain lakes and wetlands that historically functioned as key spawning and nursery habitats for numerous species of Yangtze fish [62]. Consequently, numerous endemic upper Yangtze species are now confronted with augmented extinction risk due to their circumscribed distributions and specialised habitat or flow requirements [63]. These observations were consistent with the significant decline in the abundance of fish species exhibiting distinct habitat patterns and body shapes in the RES_SX area, as documented in the present study.
However, it is fortunate that such negative impacts were only observed at the taxonomic level. Subsequent to standardization for taxonomic richness, no substantial variations in phylogenetic and functional diversity of fishes were identified in the RES_SX region in comparison to the Upper reach. In general, taxonomic diversity in certain areas may appear stable or even increase due to the proliferation of a few tolerant or non-native species. However, functional diversity declines and assemblages become more homogeneous, meaning many specialized, endemic forms are being lost [64]. This uncommon phenomenon can be partially interpreted from a theoretical perspective through the exploration of the diversity divergence facet in the present study. The results obtained from the study indicated a divergent trend for the phylogenetic and functional diversity of fishes at the RES_SX area and the Down region. Phylogenetic overdispersion has been demonstrated to result in the maintenance of evolutionary branches in the presence of taxonomic loss [6]. Meanwhile, functional redundancy, whereby multiple species fill similar ecological roles, has been shown to induce replacement of lost species by others with similar traits due to taxon-function decoupling [65]. This phenomenon of decoupled commonality has been observed in instances where environmental pressures, such as pollution or habitat alteration, have led to the selection of functionally equivalent species from different lineages. This process has been shown to maintain the overall functional and phylogenetic structure despite a reduction in species diversity [66]. This pattern underscores the importance of monitoring multiple facets of diversity for effective conservation, as taxonomic metrics alone may fail to capture the full picture of ecosystem resilience [67].
As was the case with the results of alpha diversity, the taxonomic beta-diversity of fish communities was also decreased in the RES_SX area, while the phylogenetic and functional beta-diversity were increased. Beta-diversity measures the compositional turnover between communities. Taxonomic beta-diversity has been demonstrated to reflect species identity differences [68], while phylogenetic and functional versions have been shown to capture evolutionary history or trait-based differences. It is evident from the extant literature that taxonomic homogenisation has been observed to occur in conjunction with functional or phylogenetic differentiation [69,70]. This phenomenon, termed decoupling, occurs when functionally novel invaders replace species without resulting in a complete convergence of trait space. However, the present study did not observe any unique fish species in the RES_SX samples. The replacement of taxa by distant relatives or uniquetrait species has also been demonstrated to be capable of boosting phylogenetic or functional beta-diversity, despite the presence of a smaller number of unique taxa [71]. Moreover, environmental filtering due to the Three Gorges Dam has been shown to maintain trait/evolutionary divergence even as taxonomic similarity rises [16]. Beta-diversity uncoupling in fish communities, where taxonomic, phylogenetic and functional facets diverge, complicates conservation by revealing hidden losses or gains not captured by species counts alone [72]. Relying solely on taxonomic beta-diversity may overlook the phenomenon of functional differentiation amid homogenization. Thus, when facets decouple spatially, complementary metrics beyond taxonomy should be used [3].
Geographic distance is typically associated with the decay of fish community similarity, due to limitations in species dispersal over large scales. The findings of this study indicated that the GDDS of the fish community, as determined by all three components of beta-diversity, had disappeared following the construction of the Three Gorges Dam. This outcome appears to be reasonable, given the significant alterations to hydrology and habitats caused by the Three Gorges Dam. Prior to the construction of the dam, the natural flow of the river and subsequent dispersal of its inhabitants resulted in the formation of distinct communities that were separated by considerable distances. However, following the impoundment of the river, this pattern underwent a transformation due to the homogenisation effect [73]. Surveys of the Yangtze upstream revealed a decline in fish stability following the construction of the Three Gorges Dam [74]. Furthermore, the taxonomic diversity in the downstream region exhibited a shift from under- to over-dispersion, which is consistent with our own findings. The presence of analogous patterns in cascade dams (e.g., Wujiang River) substantiates the phenomenon of homogenisation, wherein indigenous declines and exotic increases obliterate disparities based on geographical distance. Analogous patterns were also observed in cascade dams, which confirmed homogenisation, with native declines and alien increases erasing distance-based differences [75]. Furthermore, an analysis of the assembly mechanism indicated that dispersal limitation was reduced in the RES_SX area. The hydrologic stability that ensues following the construction of a dam is conducive to species interactions, rather than dispersal limitation, thereby further eroding the GDDS pattern [76]. As posited by Chang et al. [77] a low GDDS has the capacity to mask the risk of functional homogenisation. This is due to the fact that while it facilitates species mixing, it concomitantly diminishes local uniqueness when barriers are dismantled. Furthermore, low-dispersal communities are more vulnerable to invasion facilitation [78], emphasising the necessity for future conservation strategies to prioritise the management of invasive species.

5. Conclusions

The present study utilized eDNA metabarcoding to systematically investigate the multidimensional diversity of fish (taxonomic, phylogenetic and functional) across the Yangtze River. The results indicated that 150 distinct fish species were detected, with the RES_SX area exhibiting a significantly lower taxonomic diversity and fish detection rate in comparison to the other two regions. This observation serves as an indicator of the adverse impact of the Three Gorges Dam. It is noteworthy that such deleterious effects were only observed at the taxonomic level; phylogenetic and functional diversity remained stable, attributed to phylogenetic overdispersion and functional redundancy. Furthermore, analysis of beta-diversity revealed decoupling among the three diversity facets, with lower taxonomic beta-diversity but higher phylogenetic and functional beta-diversity in the RES_SX area, and the disappearance of post-dam. The analysis revealed that stochastic processes (dispersal limitation and drift) dominated fish community assembly, with reduced dispersal limitation in the RES_SX area. This study underscores the significance of incorporating diverse facets of diversity in the evaluation of dam-induced impacts on freshwater fish communities. It is recommended that future research place a greater emphasis on the collection of data over an extended period of time, with the objective of overcoming the inherent limitations of a single, instantaneous observation. This approach should be focused on invasive species dynamics.

Supplementary Materials

The following supporting information can be downloaded at: https://www.mdpi.com/article/10.3390/fishes11080484/s1. Figure S1: The detected rate of each fish species across all studied samples or in a single region. Figure S2: (a) Linear regression of the taxonomic and phylogenetic alpha-diversity of fish communities, respectively, with their functional alpha-diversity across all three studied regions. (b) Linear regression of the taxonomic alpha-diversity of fish communities with their functional alpha-diversity in different regions. (c) Linear regression of the phylogenetic alpha-diversity of fish communities with their functional alpha-diversity in different regions. Table S1: Species list for taxa that disappeared in the RES_SX area.

Author Contributions

W.C.: writing—original draft, investigation, formal analysis, data curation. C.W. and S.C.: data curation, formal analysis. Z.J.: supervision. Y.W. and Z.L.: investigation, supervision. G.G., M.W. and X.Z.: writing—reviewing and editing, methodology. P.M.: project administration, resources, conceptualization. All authors have read and agreed to the published version of the manuscript.

Funding

The authors sincerely thank all the crew members for their help with manuscript writing and data analysis. This study was supported by the National Key Research and Development Program of China [grant number 2024YFC3210901] and the National Natural Science Foundation of China [grant number 52200231].

Data Availability Statement

The original contributions presented in this study are included in the article/Supplementary Material. Further inquiries can be directed to the corresponding author.

Conflicts of Interest

The authors declare no conflicts of interest.

References

  1. Mathon, L.; Baletaud, F.; Lebourges-Dhaussy, A.; Lecellier, G.; Menkes, C.; Bachelier, C.; Bonneville, C.; Dejean, T.; Dumas, M.; Fiat, S.; et al. Three-dimensional conservation planning of fish biodiversity metrics to achieve the deep-sea 30 × 30 conservation target. Conserv. Biol. 2025, 39, e14368. [Google Scholar] [PubMed]
  2. Beaugrand, G. Towards an understanding of large-scale biodiversity patterns on land and in the sea. Biology 2023, 12, 339. [Google Scholar] [CrossRef] [Scilit] [PubMed]
  3. Lin, L.; Deng, W.; Huang, X.; Kang, B. Fish taxonomic, functional, and phylogenetic diversity and their vulnerabilities in the largest river in southeastern China. Ecol. Evol. 2021, 11, 11533–11548. [Google Scholar] [CrossRef] [Scilit] [PubMed]
  4. Fang, G.; Zhang, Y.; Yu, H.; Chen, C.; Liang, J.; Tang, Y. Taxonomic and functional diversities reveal different fish assemblage dynamics of stow net fishery in Haizhou Bay. Heliyon 2024, 10, e39428. [Google Scholar] [CrossRef] [Scilit] [PubMed]
  5. Zhang, C.; Zhu, R.; Sui, X.; Li, X.; Chen, Y. Understanding patterns of taxonomic diversity, functional diversity, and ecological drivers of fish fauna in the Mekong River. Glob. Ecol. Conserv. 2021, 28, e01711. [Google Scholar] [CrossRef] [Scilit]
  6. Qiao, J.; Liu, Y.; Yao, W.; Ma, H.; Yu, L.; Zhao, Q.; Ouyang, L. Changes in Fish Taxonomic and Phylogenetic Diversity and Their Driving Factors in a Reservoir in the Karst Basin of Southwest China. Animals 2026, 16, 145. [Google Scholar] [CrossRef] [Scilit] [PubMed]
  7. Meng, Z.; Brosse, S.; Xiang, M.; Hu, F.; Wang, X.; Fu, X.; Yang, D.; Li, X. Assessing fish taxonomic and functional β diversity to inform effective conservation strategies in a large reservoir of the Yangtze River Basin. Water Biol. Secur. 2025, 5, 100407. [Google Scholar] [CrossRef] [Scilit]
  8. Lin, L.; Liu, Y.; Lin, H.; Kang, B. Considering species functional and phylogenetic rarity in the conservation of fish biodiversity. Divers. Distrib. 2024, 30, e13804. [Google Scholar] [CrossRef] [Scilit]
  9. Rozanski, R.; Trenkel, V.M.; Lorance, P.; Valentini, A.; Dejean, T.; Pellissier, L.; Eme, D.; Albouy, C. Disentangling the components of coastal fish biodiversity in southern Brittany by applying an environmental DNA approach. Environ. DNA 2022, 4, 920–939. [Google Scholar] [CrossRef] [Scilit]
  10. Che, X.; Zhang, M.; Zhao, X.; Zhang, Q.; Zhao, Y.; Møller, A.P.; Zou, F. Long-term trends in the phylogenetic and functional diversity of Anatidae in South China coastal wetlands. Ecol. Appl. 2021, 31, e02344. [Google Scholar] [CrossRef] [Scilit] [PubMed]
  11. Scheiner, S.M.; Kosman, E.; Presley, S.J.; Willig, M.R. The components of biodiversity, with a particular focus on phylogenetic information. Ecol. Evol. 2017, 7, 6444–6454. [Google Scholar] [CrossRef] [Scilit] [PubMed]
  12. Bitomský, M.; Mládková, P.; Pakeman, R.J.; Duchoslav, M. Clade composition of a plant community indicates its phylogenetic diversity. Ecol. Evol. 2020, 10, 3747–3757. [Google Scholar] [CrossRef] [Scilit] [PubMed]
  13. Schmera, D.; Ricotta, C.; Podani, J. Components of functional diversity revisited: A new classification and its theoretical and practical implications. Ecol. Evol. 2023, 13, e10614. [Google Scholar] [CrossRef] [Scilit] [PubMed]
  14. Kling, M.M.; Mishler, B.D.; Thornhill, A.H.; Baldwin, B.G.; Ackerly, D.D. Facets of phylodiversity: Evolutionary diversification, divergence and survival as conservation targets. Philos. Trans. R. Soc. B Biol. Sci. 2019, 374, 1763. [Google Scholar] [CrossRef] [Scilit] [PubMed]
  15. Lin, P.; Fujiwara, M.; Ma, B.; Xia, Z.; Wu, X.; Wang, C.; Gao, X. Ecological drivers shaping mainstem and tributary fish communities in the upper Jinsha River, southeastern Qinghai-Tibet Plateau. Ecol. Process. 2025, 14, 8. [Google Scholar] [CrossRef] [Scilit]
  16. Stoczynski, L.; Scott, M.C.; Bower, L.; Peoples, B.K. Effects of environment and metacommunity delineation on multiple dimensions of stream fish beta diversity. Front. Ecol. Evol. 2023, 11, 1077994. [Google Scholar] [CrossRef] [Scilit]
  17. Gavioli, A.; Milardi, M.; Soininen, J.; Soana, E.; Lanzoni, M.; Castaldelli, G. How does invasion degree shape alpha and beta diversity of freshwater fish at a regional scale? Ecol. Evol. 2022, 12, e9493. [Google Scholar] [CrossRef] [Scilit] [PubMed]
  18. Fang, G.; Liang, J.; Jiang, R.; Zhang, Y.; Chen, J.; Chen, C.; Yang, M.; Zhou, Y. Taxonomic and Functional Beta Diversity Patterns and Their Driving Factors of the Fish Assemblages Around Marine Islands. J. Mar. Sci. Eng. 2025, 13, 674. [Google Scholar] [CrossRef] [Scilit]
  19. Yin, S.; Yi, Y.; Liu, Q.; Luo, Q.; Chen, K. A review on effects of human activities on aquatic organisms in the Yangtze River Basin since the 1950s. River 2022, 1, 104–119. [Google Scholar] [CrossRef] [Scilit]
  20. Chen, F.; Xue, G.; Wang, Y.; Zhang, H.; Clift, P.D.; Xing, Y.; Xie, P. Evolution of the Yangtze River and its biodiversity. Innovation 2023, 4, 100417. [Google Scholar] [CrossRef] [Scilit] [PubMed]
  21. Wang, H.; Wang, P.; Xu, C.; Sun, Y.; Shi, L.; Zhou, L.; Jeppesen, E.; Chen, J.; Xie, P. Can the “10-year fishing ban” rescue biodiversity of the Yangtze River? Innovation 2022, 3, 100235. [Google Scholar] [CrossRef] [Scilit] [PubMed]
  22. Wang, H.; Chen, J.; Wang, P.; Jeppesen, E.; Xie, P. How to manage fish within and after the 10-year fishing ban. Innovation 2024, 5, 100694. [Google Scholar] [CrossRef] [Scilit] [PubMed]
  23. Tang, C.; Yan, Q.; Li, W.; Yang, X.; Zhang, S. Impact of dam construction on the spawning grounds of the four major Chinese carps in the Three Gorges Reservoir. J. Hydrol. 2022, 609, 127694. [Google Scholar] [CrossRef] [Scilit]
  24. Li, J.; Liao, L.; Dai, X. Economic and Agricultural Impacts of Building a Dam—Evidence from Natural Experience of the Three-Gorges Dam. Agriculture 2022, 12, 1372. [Google Scholar] [CrossRef] [Scilit]
  25. Tan, Z.; Wang, X.; Li, Y.; Zhang, Z.; Xue, C.; Yao, J.; You, H. The impact of Three Gorges Dam on the hydrological connectivity of “off-stream” floodplains. J. Hydrol. 2024, 629, 130619. [Google Scholar] [CrossRef] [Scilit]
  26. Xiong, F.; Li, Z.; Brosse, S.; Olden, J.D.; Cooke, S.J.; Yang, B.; Chen, Y. Fishing ban halts seven decades of biodiversity decline in the Yangtze River. Science 2026, 391, 719–723. [Google Scholar] [CrossRef] [Scilit] [PubMed]
  27. Li, Y.; Yang, J.; Wang, Y.; Wu, H.; Ma, Y.; Wu, F.; Wang, J. Sediment eDNA reveals damming triggered changes in algal and fish communities at the Three Gorges Reservoir in China. Environ. Res. 2025, 276, 121474. [Google Scholar] [CrossRef] [Scilit] [PubMed]
  28. Zhang, C.; Fujiwara, M.; Pawluk, M.; Liu, H.; Cao, W.; Gao, X. Changes in taxonomic and functional diversity of fish communities after catastrophic habitat alteration caused by construction of Three Gorges Dam. Ecol. Evol. 2020, 10, 5829–5839. [Google Scholar] [CrossRef] [Scilit] [PubMed]
  29. Huang, J.; Dong, X.; Zhou, X.; Qi, Z.; Wang, Z.; Ran, J.; Xiao, K.; Pan, X.; Chen, H.; Liu, Z.; et al. Microbial Community Succession Sustains Fish Diversity in the Upper Yangtze River Reserve. Adv. Sci. 2025, 12, e05928. [Google Scholar] [CrossRef] [Scilit] [PubMed]
  30. Bolger, A.M.; Lohse, M.; Usadel, B. Trimmomatic: A flexible trimmer for Illumina sequence data. Bioinformatics 2014, 30, 2114–2120. [Google Scholar] [CrossRef] [Scilit] [PubMed]
  31. Magoč, T.; Salzberg, S.L. FLASH: Fast length adjustment of short reads to improve genome assemblies. Bioinformatics 2011, 27, 2957–2963. [Google Scholar] [CrossRef] [Scilit] [PubMed]
  32. Bokulich, N.A.; Kaehler, B.D.; Rideout, J.R.; Dillon, M.; Bolyen, E.; Knight, R.; Huttley, G.A.; Gregory Caporaso, J. Optimizing taxonomic classification of marker-gene amplicon sequences with qiime 2′s q2-feature-classifier plugin. Microbiome 2018, 6, 90. [Google Scholar] [CrossRef] [Scilit] [PubMed]
  33. Yang, H.L.; Shen, L.; He, Y.F.; Tian, H.W.; Gao, L.; Wu, J.M.; Mei, Z.G.; Wei, N.; Wang, L.; Zhu, T.B.; et al. Status of aquatic organisms resources and their environments in the Yangtze River system (2017–2021). J. Fish. China 2023, 47, 3–30. [Google Scholar]
  34. Dixon, P. VEGAN, a package of R functions for community ecology. J. Veg. Sci. 2003, 14, 927–930. [Google Scholar] [CrossRef]
  35. Rourke, M.L.; Fowler, A.M.; Hughes, J.M.; Broadhurst, M.K.; DiBattista, J.D.; Fielder, S.; Walburn, J.W.; Furlan, E.M. Environmental DNA (eDNA) as a tool for assessing fish biomass: A review of approaches and future considerations for resource surveys. Environ. DNA 2022, 4, 9–33. [Google Scholar] [CrossRef] [Scilit]
  36. Maechler, M.; Rousseeuw, P.; Struyf, A.; Hubert, M.; Hornik, K. Cluster: Cluster Analysis Basics and Extensions, R Package Version 2.1.8.1; CRAN: Vienna, Austria, 2025. [Google Scholar]
  37. Baselga, A.; Orme, C.D.L. Betapart: An R package for the study of beta diversity. Methods Ecol. Evol. 2012, 3, 808–812. [Google Scholar] [CrossRef] [Scilit]
  38. Edgar, R.C. MUSCLE: Multiple sequence alignment with high accuracy and high throughput. Nucleic Acids Res. 2004, 32, 1792–1797. [Google Scholar] [CrossRef] [Scilit] [PubMed]
  39. Price, M.N.; Dehal, P.S.; Arkin, A.P. FastTree 2–approximately maximum-likelihood trees for large alignments. PLoS ONE 2010, 5, e9490. [Google Scholar] [CrossRef] [Scilit] [PubMed]
  40. Kembel, S.W.; Cowan, P.D.; Helmus, M.R.; Cornwell, W.K.; Morlon, H.; Ackerly, D.D.; Blomberg, S.P.; Webb, C.O. Picante: R tools for integrating phylogenies and ecology. Bioinformatics 2010, 26, 1463–1464. [Google Scholar] [CrossRef] [Scilit] [PubMed]
  41. Tucker, C.M.; Cadotte, M.W.; Carvalho, S.B.; Jonathan Davies, T.; Ferrier, S.; Fritz, S.A.; Grenyer, R.; Helmus, M.R.; Jin, L.S.; Mooers, A.O.; et al. A guide to phylogenetic metrics for conservation, community ecology and macroecology. Biol. Rev. 2017, 92, 698–715. [Google Scholar] [CrossRef] [Scilit] [PubMed]
  42. Eme, D.; Anderson, M.J.; Myers, E.M.V.; Roberts, C.D.; Liggins, L. Phylogenetic measures reveal eco-evolutionary drivers of biodiversity along a depth gradient. Ecography 2020, 43, 689–702. [Google Scholar] [CrossRef] [Scilit]
  43. Mazel, F.; Davies, T.J.; Gallien, L.; Renaud, J.; Groussin, M.; Münkemüller, T.; Thuiller, W. Influence of tree shape and evolutionary time-scale on phylogenetic diversity metrics. Ecography 2016, 39, 913–920. [Google Scholar] [CrossRef] [Scilit] [PubMed]
  44. Leprieur, F.; Albouy, C.; DeBortoli, J.; Cowman, P.F.; Bellwood, D.R.; Mouillot, D. Quantifying phylogenetic beta diversity: Distinguishing between “true” turnover of lineages and phylogenetic diversity gradients. PLoS ONE 2012, 7, e42760. [Google Scholar] [CrossRef] [Scilit] [PubMed]
  45. Zintzen, V.; Anderson, M.J.; Roberts, C.D.; Diebel, C.E. Increasing variation in taxonomic distinctness reveals clusters of specialists in the deep sea. Ecography 2011, 34, 306–317. [Google Scholar] [CrossRef] [Scilit]
  46. Chen, J.; Zhang, X.; Yang, L.; Zhang, L. GUniFrac: Generalized UniFrac Distances, Distance-Based Multivariate Methods and Feature-Based Univariate Methods for Microbiome Data Analysis. R Package Version 1.9. 2025. Available online: https://CRAN.R-project.org/package=GUniFrac (accessed on 13 August 2026).
  47. Jiang, Z.; Dai, B.; Wang, C.; Xiong, W. Multifaceted biodiversity measurements reveal incongruent conservation priorities for rivers in the upper reach and lakes in the middle-lower reach of the largest river-floodplain ecosystem in China. Sci. Total Environ. 2020, 739, 140380. [Google Scholar] [CrossRef] [Scilit] [PubMed]
  48. Magneville, C.; Loiseau, N.; Albouy, C.; Casajus, N.; Claverie, T.; Escalas, A.; Leprieur, F.; Maire, E.; Mouillot, D.; Villéger, S. MFD: An R package to compute and illustrate the multiple facets of functional diversity. Ecography 2022, 2022, e05904. [Google Scholar] [CrossRef] [Scilit]
  49. Myers, E.M.V.; Anderson, M.J.; Liggins, L.; Harvey, E.S.; Roberts, C.D.; Eme, D. High functional diversity in deep-sea fish communities and increasing intraspecific trait variation with increasing latitude. Ecol. Evol. 2021, 11, 10600–10612. [Google Scholar] [CrossRef] [Scilit] [PubMed]
  50. Li, D. HillR: Taxonomic, functional, and phylogenetic diversity and similarity through Hill Numbers. J. Open Source Softw. 2018, 3, 1041. [Google Scholar] [CrossRef] [Scilit]
  51. Chao, A.; Chiu, C.H.; Jost, L. Unifying species diversity, phylogenetic diversity, functional diversity, and related similarity and differentiation measures through hill numbers. Annu. Rev. Ecol. Evol. Syst. 2014, 45, 297–324. [Google Scholar] [CrossRef] [Scilit]
  52. Wickham, H. Ggplot2: Elegant Graphics for Data Analysis; Springer: New York, NY, USA, 2016. [Google Scholar]
  53. Hsieh, T.C.; Ma, K.; Chao, A. INEXT: An R package for rarefaction and extrapolation of species diversity (Hill numbers). Methods Ecol. Evol. 2016, 7, 1451–1456. [Google Scholar] [CrossRef] [Scilit]
  54. Chen, H.; Boutros, P.C. VennDiagram: A package for the generation of highly-customizable Venn and Euler diagrams in R. BMC Bioinform. 2011, 12, 35. [Google Scholar] [CrossRef] [Scilit] [PubMed]
  55. Ogle, D.H.; Doll, J.C.; Wheeler, A.P.; Dinno, A. FSA: Simple Fisheries Stock Assessment Methods. R Package Version 0.10.0. 2025. Available online: https://CRAN.R-project.org/package=FSA (accessed on 13 August 2026).
  56. Hijmans, R. Geosphere: Spherical Trigonometry. R Package Version 1.5–20. 2024. Available online: https://CRAN.R-project.org/package=geosphere (accessed on 13 August 2026).
  57. Ning, D.; Yuan, M.; Wu, L.; Zhang, Y.; Guo, X.; Zhou, X.; Yang, Y.; Arkin, A.P.; Firestone, M.K.; Zhou, J. A quantitative framework reveals ecological drivers of grassland microbial community assembly in response to warming. Nat. Commun. 2020, 11, 4717. [Google Scholar] [CrossRef] [Scilit] [PubMed]
  58. Nneji, L.M.; Oladipo, S.O.; Nneji, I.C.; Atofarati, O.T.; Asiamah, M.K.; Adelakun, K.M. Evaluating eDNA metabarcoding for fish biodiversity assessment in Nigerian aquatic ecosystems: Potential, limitations, and comparisons with traditional methods. J. Freshw. Ecol. 2025, 40, 2541689. [Google Scholar] [CrossRef] [Scilit]
  59. Shen, Y.; Zhang, Y.; Cheng, R.; Wang, W.; Duan, C.; Liu, Z.; Chen, Q.; Li, Y.; Wang, M.; Luo, Y. Diversity and spatiotemporal dynamics of fish communities in the Chongqing section of the upper Yangtze River based on eDNA metabarcoding. Ecol. Evol. 2023, 13, e10681. [Google Scholar] [CrossRef] [Scilit] [PubMed]
  60. Song, Y.; Cheng, F.; Murphy, B.R.; Xie, S. Downstream effects of the Three Gorges Dam on larval dispersal, spatial distribution, and growth of the four major Chinese carps call for reprioritizing conservation measures. Can. J. Fish. Aquat. Sci. 2018, 75, 141–151. [Google Scholar] [CrossRef] [Scilit]
  61. Yu, L.; Lin, J.; Chen, D.; Duan, X.; Peng, Q.; Liu, S. Ecological flow assessment to improve the spawning habitat for the four major species of carp of the Yangtze River: A study on habitat suitability based on ultrasonic telemetry. Water 2018, 10, 600. [Google Scholar] [CrossRef] [Scilit]
  62. Cheng, L.; Opperman, J.J.; Tickner, D.; Speed, R.; Guo, Q.; Chen, D. Managing the Three Gorges Dam to implement environmental flows in the Yangtze River. Front. Environ. Sci. 2018, 6, 64. [Google Scholar] [CrossRef] [Scilit]
  63. Zhang, C.; Liu, F.; Liu, H.; Wang, C.; Lin, P.; Gao, X. Temporal Changes in Taxonomic and Functional Diversity of Fish Assemblages in the Upper Yangtze River After Impoundment of the Three Gorges Reservoir, China. Front. Environ. Sci. 2022, 10, 875789. [Google Scholar] [CrossRef] [Scilit]
  64. Liu, X.; Qin, J.; Xu, Y.; Ouyang, S.; Wu, X. Biodiversity decline of fish assemblages after the impoundment of the Three Gorges Dam in the Yangtze River Basin, China. Rev. Fish. Biol. Fish. 2019, 29, 177–195. [Google Scholar] [CrossRef] [Scilit]
  65. Zhang, P.; Li, Y.; Peng, X.; Wang, L.; Kong, Y.; Tian, H.; Kang, B. Long-term effects of environmental changes on taxonomic, functional, and phylogenetic alpha and beta diversity of fish communities in the Minjiang Estuary. Environ. Biol. Fishes 2025, 108, 1531–1549. [Google Scholar] [CrossRef] [Scilit]
  66. Cheaib, B.; Le Boulch, M.; Mercier, P.L.; Derome, N. Taxon-function decoupling as an adaptive signature of lake microbial metacommunities under a chronic polymetallic pollution gradient. Front. Microbiol. 2018, 9, 869. [Google Scholar] [CrossRef] [Scilit] [PubMed]
  67. Nakamura, G.; Vicentin, W.; Súarez, Y.R. Functional and phylogenetic dimensions are more important than the taxonomic dimension for capturing variation in stream fish communities. Austral Ecol. 2018, 43, 2–12. [Google Scholar] [CrossRef] [Scilit]
  68. Bower, L.M.; Stoczynski, L.; Peoples, B.K.; Patrick, C.J.; Brown, B.L. Multiple dimensions of functional diversity affect stream fish taxonomic β-diversity. Freshw. Biol. 2023, 68, 437–451. [Google Scholar] [CrossRef] [Scilit]
  69. Campbell, S.E.; Mandrak, N.E. Functional differentiation accompanies taxonomic homogenization in freshwater fish communities. Ecology 2020, 101, e03188. [Google Scholar] [CrossRef] [Scilit] [PubMed]
  70. Liao, C.; Wang, J.; Ye, S.; Li, W.; Correa, S.B.; Zhang, T.; Liu, J. Multifaceted fish diversities respond differently to impounding age and longitudinal location along a reservoir cascade. Front. Ecol. Evol. 2022, 10, 955053. [Google Scholar] [CrossRef] [Scilit]
  71. Wu, N.; Lv, Y.; Zhang, M.; Wang, Y.; Peng, W.; Qu, X. Understanding the relative roles of local environmental, geo-climatic and spatial factors for taxonomic, functional and phylogenetic β-diversity of stream fishes in a large basin, Northeast China. Ecol. Evol. 2022, 12, e9567. [Google Scholar] [CrossRef] [Scilit] [PubMed]
  72. Castro, S.A.; Rojas, P.; Vila, I.; Jaksic, F.M. Covariation of taxonomic and functional facets of β-diversity in Chilean freshwater fish assemblages: Implications for current and future processes of biotic homogenization. PLoS ONE 2023, 18, e0281483. [Google Scholar] [CrossRef] [Scilit] [PubMed]
  73. Gao, X.; Fujiwara, M.; Winemiller, K.O.; Lin, P.; Li, M.; Liu, H. Regime shift in fish assemblage structure in the Yangtze River following construction of the Three Gorges Dam. Sci. Rep. 2019, 9, 4212. [Google Scholar] [CrossRef] [Scilit] [PubMed]
  74. Zhang, S.; Lu, Q.; Wang, Y.; Wang, X.; Zhao, J.; Yao, M. Assessment of fish communities using environmental DNA: Effect of spatial sampling design in lentic systems of different sizes. Mol. Ecol. Resour. 2020, 20, 242–255. [Google Scholar] [CrossRef] [Scilit] [PubMed]
  75. Cheng, R.; Zhou, X.; Zhang, Y.; Li, Q.; Zhang, J.; Luo, Y.; Chen, Q.; Liu, Z.; Li, Y.; Shen, Y. EDNA reveals spatial homogenization of fish diversity in a mountain river affected by a reservoir cascade. J. Environ. Manag. 2024, 361, 121248. [Google Scholar] [CrossRef] [Scilit] [PubMed]
  76. Liu, X.; Olden, J.D.; Wu, R.; Ouyang, S.; Wu, X. Dam construction impacts fish biodiversity in a subtropical river network, China. Diversity 2022, 14, 476. [Google Scholar] [CrossRef] [Scilit]
  77. Chang, T.; Gong, Z.; Shang, K.; Hu, P. Dispersal limitation dominates riverine fish communities in the areas of the water diversion project in the western Sichuan Plateau, China. Animals 2025, 15, 730. [Google Scholar] [CrossRef] [Scilit] [PubMed]
  78. Xu, M.; Fang, M.; Usoof, A.M.; Mandrak, N.E.; Chu, C.; Qian, H.; Cao, Y.; Liu, C.; Cuthbert, R.N.; Li, S.-P.; et al. Ecological similarity governs non-native fish establishment while human pressure and native diversity shape invasion richness. Sci. Adv. 2025, 11, eadw4347. [Google Scholar] [CrossRef] [Scilit] [PubMed]
Figure 1. (a) Map of sampling. The numbers in the square brackets are sample numbers from the whole river or different regions. (b) The taxonomic tree of recognized fish species. (c) Species accumulation curves of the three regions. (d) Differences in the fish detected rate among three regions. The black square represents the average fish detected rate in a single region. Boxplots labeled with distinct lowercase letters denote statistically significant differences between regions (Dunn’s test, p < 0.05). (e) The Venn diagram shows the number of common and endemic fish species in different regions.
Fishes 11 00484 g001
Figure 2. Differences in the numbers of fish species with different feeding types (a), functional traits (b), habitat patterns (c), and body shapes (d) among three regions. The black square represent the average fish detected rate in a single region. Different lowercases letters above boxes represent significant differences between different regions (Dunn’s test, p < 0.05).
Fishes 11 00484 g002
Figure 3. (a) Differences in the three components of alpha-diversity of fish communities along the Yangtze River. (b) Variations in standardized effect size (SES) of Hill numbers for phylogenetic diversity (PD) at q = 0 among regions. (c) Spatial distribution of SES values derived from mean pairwise phylogenetic distance (MPD) and variance in pairwise phylogenetic distance (VPD). (d) Interregional differences in SES values of Hill numbers for functional diversity (FD) at q = 0. (e) Distribution of SES values calculated for mean pairwise functional distance (MPFD) and variance in pairwise functional distance (VPFD). The height of each bar and black squares correspond to the average of each metric in individual regions. Different lowercase letters positioned above error bars or boxes in the same subfigure mark significant interregional differences (Dunn’s HSD test, p < 0.05). The dashed lines in panels (c,e) represent the threshold values (−1.96 and 1.96).
Fishes 11 00484 g003
Figure 4. (a) Principal coordinates analyses (PCoA) and adonis test based on the three components of beta-diversity, respectively, for the fish communities among different regions. ** represents the p-value of adonis test lower than 0.05. (b) Differences in the three components of beta-diversity, respectively, for the fish communities among different regions. (c) Differences in the turnover rate for the three components of beta-diversity, respectively, for the fish communities among different regions. The black square represent the average value of corresponding indicator in a single region. Different lowercases letters above boxes represent significant differences between regions (Dunn’s test, p < 0.05).
Fishes 11 00484 g004
Figure 5. (a) Linear regression of the taxonomic and phylogenetic beta-diversity of fish communities, respectively, with their functional beta-diversity across all three studied regions. (b) Linear regression of the taxonomic and phylogenetic beta-diversity of fish communities, respectively, with their functional beta-diversity in different regions. (c) Geographic distance-dependent similarity (GDDS) of different beta-diversity components of fish communities respectively between the Upper and Down regions. ** and *** represent the p-value of linear regression lower than 0.05 and 0.01, respectively.
Fishes 11 00484 g005
Figure 6. (a) The relative importance of various ecological processes derived from iCAMP analysis across sampling regions. Significant outcomes from one-sided bootstrap tests are marked with asterisks (*, p < 0.05). L and M stand for large (|d| > 0.8) and medium (0.5 < |d| ≤ 0.8) effect sizes of Cohen’s d, which is defined as interregional mean differences divided by the pooled standard deviation. DL, dispersal limitation; DR, drift and other assembly processes; HD, homogenizing dispersal; HeS, heterogeneous selection; HoS, homogeneous selection. (b) Relative importance of DL and DR governing the assembly of phylogenetic bins in all samples. (c) Relative abundance of fish species belonging to separate phylogenetic bins.
Fishes 11 00484 g006
Disclaimer/Publisher’s Note: The statements, opinions and data contained in all publications are solely those of the individual author(s) and contributor(s) and not of MDPI and/or the editor(s). MDPI and/or the editor(s) disclaim responsibility for any injury to people or property resulting from any ideas, methods, instructions or products referred to in the content.