Article

Artificial Feeds Induce Hepatic Steatosis and Metabolic Reprogramming in Mandarin Fish (Siniperca chuatsi)

1
Anhui Province Key Laboratory of Aquaculture and Stock Enhancement, Hefei 230001, China
2
Anhui Academy of Agricultural Sciences Fisheries Research Institute, Hefei 230001, China
3
Pearl River Fisheries Research Institute, Chinese Academy of Fishery Sciences, Guangzhou 510380, China
*
Author to whom correspondence should be addressed.
Fishes 2026, 11(7), 407; https://doi.org/10.3390/fishes11070407
Submission received: 2 June 2026 / Revised: 3 July 2026 / Accepted: 7 July 2026 / Published: 9 July 2026
(This article belongs to the Section Nutrition and Feeding)

Abstract

Artificial feeds are considered a sustainable alternative to natural live feeds for mandarin fish (Siniperca chuatsi) aquaculture, but their impacts on hepatic metabolism and growth remain unclear. In this study, a total of 800 adult mandarin fish with an initial mean body weight of 152.4 ± 8.7 g were reared for 150 days, and we compared growth performance, liver histology and liver metabolomics of fish fed artificial (AF) or natural live feeds (NF). No significant differences were observed in body length, weight, or condition factor, but the hepatosomatic index (HSI) was significantly higher in the AF group (p < 0.01), accompanied by visible hepatomegaly, pale liver color and severe hepatic steatosis. Partial least squares-discriminant analysis (PLS-DA) showed clear separation of liver metabolomes between groups. Metabolic correlation network analysis revealed tightly connected functional modules of amino acids and lipids, and key metabolites demonstrated significant group-specific changes: energy metabolism intermediates (L-alanine, α-ketoglutarate, phosphoenolpyruvate) and stress-related indicators (cortisol, γ-aminobutyric acid) were significantly upregulated in the NF group, whereas lipid metabolites (cholesterol, phosphatidylcholine, ceramide) and progesterone were remarkably elevated in the AF group. Kyoto Encyclopedia of Genes and Genomes (KEGG) analysis revealed upregulation of lipid-related pathways in the AF group and FoxO signaling pathway in the NF group. These findings confirm that artificial feeds drive hepatic lipid metabolism reprogramming without altering growth, but induce obvious hepatic steatosis in mandarin fish. Our findings provide a metabolic foundation for optimizing artificial feed formulations to improve hepatic health and sustainable culture of mandarin fish.
Key Contribution: This study reveals the effects of artificial feeds on hepatic metabolism and tissue structure in mandarin fish (Siniperca chuatsi), confirming that artificial feeds can maintain growth equivalent to natural live feeds but induce significant hepatic lipid metabolism reprogramming and severe hepatic steatosis. It clarifies the core metabolic trade-off between the two feeding regimes and the coordinated regulatory pattern of hepatic amino acid and lipid metabolic modules, providing a systematic basis for artificial feed optimization and hepatic health regulation in farmed mandarin fish.

1. Introduction

Global aquaculture intensification has driven increasing demand for cost-effective and sustainable feed resources, especially for high-value carnivorous fish species. For carnivorous fish, traditional aquaculture practices rely heavily on live prey (e.g., live baitfish) [1,2], which poses challenges such as high production costs, ethical concerns over prey species welfare, and risks of disease transmission (e.g., viruses or parasites) [3,4]. Artificial compound feeds have emerged as a practical alternative to address these limitations, with benefits including standardized nutrient profiles, improved operational convenience, and reduced reliance on wild capture fisheries. Nevertheless, the transition from natural live prey to formulated feeds is often accompanied by suboptimal physiological outcomes in farmed fish, such as disrupted metabolic homeostasis, excessive hepatic lipid accumulation, and reduced stress resilience [3,5,6]. Accumulating evidence indicates that such dietary-induced metabolic alterations stem from two interrelated categories of driving factors: differences in nutrient composition that directly modulate hepatic metabolic flux, and differences in feed characteristics that indirectly regulate metabolic pathway activation [7,8,9]. Specifically, the direct regulatory effect is determined by both macronutrient levels and their in vivo bioavailability, while the indirect regulatory cascade involves not only physical feed form and predation-associated energy cost, but also feed-induced shifts in gut microbiota that further reshape hepatic metabolism via the gut–liver axis [5,10]. Therefore, understanding the physiological and metabolic adaptations to artificial feeds—particularly at the organ and molecular levels—is critical for guiding targeted feed formulation optimization and advancing the sustainable intensification of global aquaculture.
Fish livers perform diverse core metabolic tasks, including nutrient transformation, energy balance maintenance and toxicant clearance. These physiological features make the liver a suitable tissue to examine dietary-induced physiological shifts [11,12,13]. For carnivorous fish like S. chuatsi, which have evolved to thrive on high-lipid, high-protein prey, hepatic metabolism plays an even more pivotal role: it orchestrates the synthesis, oxidation, and storage of lipids, regulates glycogen turnover to maintain blood glucose stability, and mediates the biotransformation of xenobiotics (e.g., feed additives or environmental contaminants) [14,15]. Hepatic metabolism is also tightly linked to other physiological systems: for instance, liver-derived lipoproteins transport lipids to peripheral tissues, while hepatocyte-secreted proteins (e.g., albumin or clotting factors) support systemic homeostasis [16,17]. Notably, hepatic function is highly sensitive to dietary composition—small shifts in macronutrient ratios (e.g., protein–lipid balance) or micronutrient availability (e.g., vitamins or minerals) can trigger profound changes in metabolic flux, ranging from adaptive adjustments in enzyme activity to pathological states like hepatic steatosis (fatty liver disease) [18,19]. Given this centrality, understanding how artificial feeds alter hepatic metabolism in mandarin fish is essential for identifying the root causes of suboptimal performance and designing targeted feed improvements.
Metabolomics, a high-throughput analytical approach, has emerged as a powerful tool for deciphering systemic metabolic alterations in response to environmental or nutritional stimuli [20,21]. Metabolomics characterizes global small-molecule metabolite profiles and captures cellular metabolic states, bridging gene expression and phenotypic traits [21]. Previous studies in aquaculture species, such as Micropterus salmoides and Ctenopharyngodon idella, have employed metabolomics to elucidate the impacts of diet on growth performance, lipid metabolism, and stress responses [22,23]. However, research focusing on carnivorous species like mandarin fish—especially regarding the hepatic adaptive responses to artificial feeds versus nature live feeds—remains scarce.
The mandarin fish (Siniperca chuatsi), a carnivorous freshwater species native to East Asia, holds significant economic and ecological importance in China’s aquaculture industry [6]. Renowned for its rapid growth rate, high market value, and nutritional benefits, mandarin fish farming has expanded rapidly over the past few decades [9]. Prior studies on S. chuatsi have explored growth metrics, digestive enzyme activities, muscle nutrient composition, and gut microbiota under different feeding regimes [3,5,24]. Extensive research suggests that live-fed mandarin fish exhibit higher growth rates and feed conversion efficiency, potentially due to the high bioavailability of nutrients in live prey and stimulation of natural predatory behaviors, while artificial-fed fish often show signs of metabolic stress, including lipid accumulation, oxidative damage, and altered amino acid profiles [25]. However, the association between hepatic metabolic reprogramming and histological lesions induced by artificial feeds remains poorly characterized. It is still unclear which hepatic metabolic pathways are primarily altered by artificial feed administration, and how these metabolic rearrangements are linked to hepatic structural damage. Elucidating these regulatory patterns is essential to understand the metabolic trade-offs between feeding strategies and guide targeted optimization of artificial feeds.
In this study, we employed untargeted metabolomics coupled with multivariate statistical analyses and histological observation to compare hepatic metabolic profiles and tissue morphology of S. chuatsi reared on live versus artificial feeds. We aimed to (1) identify key differences in hepatic metabolite profiles and tissue morphology between the two feeding regimes; (2) reveal core metabolic pathways and regulatory networks associated with hepatic steatosis induced by artificial feeds. The results will provide mechanistic insights into metabolic trade-offs between feeding strategies and inform targeted improvements in feed formulation, ultimately enhancing the sustainability and productivity of mandarin fish aquaculture.

2. Materials and Methods

2.1. Animal Feeding Experiment

The experiment was conducted at a commercial fishery farm in Anhui, China, with a standardized mandarin fish culture system. A total of 800 homogenous-sized mandarin fish (152.4 ± 8.7 g) were randomly reared in 8 separate tanks (100 fish per tank), each four tanks designated as a distinct treatment group. Each tank functioned as an independent biological replicate with a separate water supply and independent feeding management. To avoid pseudoreplication, fish selected for subsequent histological and metabolomic assays were randomly sampled across different replicate tanks within each treatment. Fish in the NF group were reared on live Cirrhinus mrigala (17.2% crude protein and 4.3% crude lipid, wet weight basis), while the AF group received artificial compound feed. The feed formulation was designed based on the nutritional requirements of mandarin fish reported in previous published studies [26], and is consistent with the commercial feed commonly used in mandarin fish farming production. The feed was produced via industrial standardized processing, including ultrafine raw material crushing, proportional batching, uniform mixing, and high-temperature twin-screw extrusion molding [26], which ensured stable nutrient uniformity and water resistance. The ingredient composition and proximate nutrient analysis of the artificial feed are shown in Table 1.
The fish were fed to apparent satiation twice daily at 08:00 and 17:00 for 150 days. Throughout the experimental period, water quality parameters were maintained: water temperature was 28 ± 1 °C, dissolved oxygen was kept above 5.0 mg/L, and both nitrite and ammonia nitrogen were maintained below 0.1 mg/L. During the experiment, fish were maintained under a natural photoperiod and ambient water temperature (22–30 °C). Water quality parameters (dissolved oxygen ≥ 6 mg L−1, pH 7.0–7.5, ammonia nitrogen ≤ 0.2 mg L−1, nitrite ≤ 0.05 mg L−1) were monitored weekly. Survival rate was recorded daily, and calculated as (number of surviving fish at the end of the trial/initial number of fish) × 100%.

2.2. Sample Collection

At the end of the culture experiment, the experimental fish were starved for 24 h and anesthetized with tricaine methanesulfonate (MS-222, 200 mg L−1; Sigma, Burlington, MA, USA). All fish were weighed and measured. Four fish per tank were randomly sampled for histological observation and metabolomic profiling. The abdominal cavity was opened immediately, and the whole liver was excised, rinsed with pre-cooled phosphate-buffered saline, and blotted dry with filter paper. Body length was measured with a digital vernier caliper (CD-12C, Mitutoyo, Kanagawa, Japan) to the nearest 0.1 cm. Body weights were determined using an electronic analytical balance (ACS-30, Haozhan, Kunshan Youkeweite Electronic Technology Co., Ltd., Suzhou, China) to the nearest 0.1 g. Liver weights were determined using an electronic analytical balance (YHM-30002, Yingheng, Huizhou Yingheng Electronic Technology Co., Ltd., Huizhou, China) to the nearest 0.01 g. The condition factor (CF) and hepatosomatic index (HSI) were calculated using the following formulas: CF = (body weight/body length3) × 100; HSI = (liver weight/body weight) × 100. A total of 500 mg liver samples were randomly collected from 16 fish per group: 8 samples were fixed in Bouin’s fixative (Phygene, Fujian, China) for histological observation, and the remaining 8 samples were immediately frozen in liquid nitrogen and stored at −80 °C for subsequent metabolomic profiling.

2.3. Liver Histological Observation

Hepatic histological analysis for S. chuatsi was performed following the protocol reported in the previous study [27]. Briefly, the liver tissues were sequentially dehydrated in a graded ethanol series (70%, 80%, 90%, 95%, 100%) for 15 min per concentration, cleared in xylene (Bioisco, Jiangsu, China) for two 15 min cycles, infiltrated with paraffin, and cut into 5 μm thick sections. The sections were then subjected to hematoxylin–eosin (H&E) staining, with 5 min of hematoxylin (Bioisco, Jiangsu, China) staining followed by 3 min of eosin (Bioisco, Jiangsu, China) counterstaining [28]. Tissue morphological features were observed and imaged using a light microscope (BX40F4, Olympus, Tokyo, Japan).

2.4. Metabolomic Profiling

Frozen tissue samples preserved at −80 °C were first thawed on an ice bath and homogenized under liquid nitrogen. For each 20 mg aliquot of homogenized sample, 400 μL of methanol/water mixture (7:3, v/v) spiked with internal standard was added. The mixture was vortexed at 1500 rpm for 5 min, incubated on ice for 15 min, and then centrifuged at 12,000 rpm and 4 °C for 10 min. A 300 μL aliquot of the supernatant was collected, kept at −20 °C for 30 min, and subjected to a second centrifugation at 12,000 rpm and 4 °C for 3 min. Ultimately, 200 μL of the supernatant was withdrawn for LC-MS analysis.
Metabolomic analysis was performed on a Vanquish Horizon UHPLC system coupled with an Orbitrap Exploris 120 mass spectrometer (Thermo Fisher Scientific, Waltham, MA, USA), following an untargeted metabolomics workflow [21,29]. Both positive and negative electrospray ionization modes were applied to maximize metabolite coverage. For positive ion mode analysis, samples were eluted from a T3 column (Waters ACQUITY Premier HSS T3 Column 1.8 µm, 2.1 mm × 100 mm) using 0.1% formic acid in water (solvent A) (Adamas, Shanghai, China) and 0.1% formic acid in acetonitrile (solvent B) (Adamas, Shanghai, China) in the following gradient: 5 to 20% in 2 min, increased to 60% in the following 3 min, increased to 99% in 1 min and held for 1.5 min, then come back to 5% mobile phase B within 0.1 min, and held for 2.4 min. The analytical conditions were as follows, column temperature, 40 °C; flow rate, 0.4 mL/min; injection volume, 4 μL; the same elution gradient was applied for negative ion mode acquisition.
Mass spectrometric detection adopted a data-dependent acquisition mode that switched between full-scan MS and MSn events, with dynamic exclusion enabled. The instrument was operated in both positive and negative ionization mode, with full scan analysis over m/z 75-1000 at 35,000 resolution. Key MS settings were as follows: ion spray voltage, 3.5 kV (positive mode) and 3.2 kV (negative mode); sheath gas flow rate 30 arbitrary units (Arb); auxiliary gas flow rate 5 Arb; ion transfer tube temperature 320 °C; vaporizer temperature 300 °C; collision energy 30, 40, and 50 V; signal intensity threshold 1 × 10⁶ counts per second (cps); top speed 10; and exclusion duration 3 s.

2.5. Metabolomic Analysis

All data preprocessing, statistical analysis and pathway enrichment were performed using the MetaboAnalyst 5.0 web platform (https://www.metaboanalyst.ca/ (accessed on 10 April 2026)), following a standard untargeted metabolomics workflow [29]. Raw peak intensity data were first processed via sum normalization, generalized logarithm transformation and auto-scaling to reduce systematic bias and improve data normality. Multivariate analysis (partial least squares-discriminant analysis, PLS-DA) and hierarchical clustering were then conducted to visualize global metabolic differences between the NF and AF groups. Differentially expressed metabolites (DEMs) between the two groups were screened using a dual threshold: variable importance in projection (VIP) score > 1 from the PLS-DA model, and p < 0.05 after false discovery rate (FDR) correction in Student’s t-test. Pathway enrichment analysis was performed by mapping DEMs to the Kyoto Encyclopedia of Genes and Genomes (KEGG) pathway database integrated in MetaboAnalyst 5.0 web platform (https://www.metaboanalyst.ca/ (accessed on 10 April 2026). The significance of each enriched pathway was quantified by the negative log-transformed p-value (-log p). A metabolic correlation network was constructed using Gephi software (version 0.10.1). Pairwise Pearson correlation coefficients were calculated for all DEMs, and only correlations with |r| > 0.8 and p < 0.05 were retained as significant edges for network visualization.

2.6. Statistical Analysis

Body length, body weight, CF, and HSI of mandarin fish are presented as mean ± standard error (SE). Each dataset was assessed for normality using the Shapiro–Wilk test and homogeneity of variance using Levene’s test. For statistical analysis, independent samples t-test was performed using R (v3.6.1) to determine statistical significance between the AF and NF groups. A p-value < 0.05 was considered statistically significant.

3. Results

3.1. Effects of Dietary Types on Growth Performance and Liver Histological Structure of Mandarin Fish

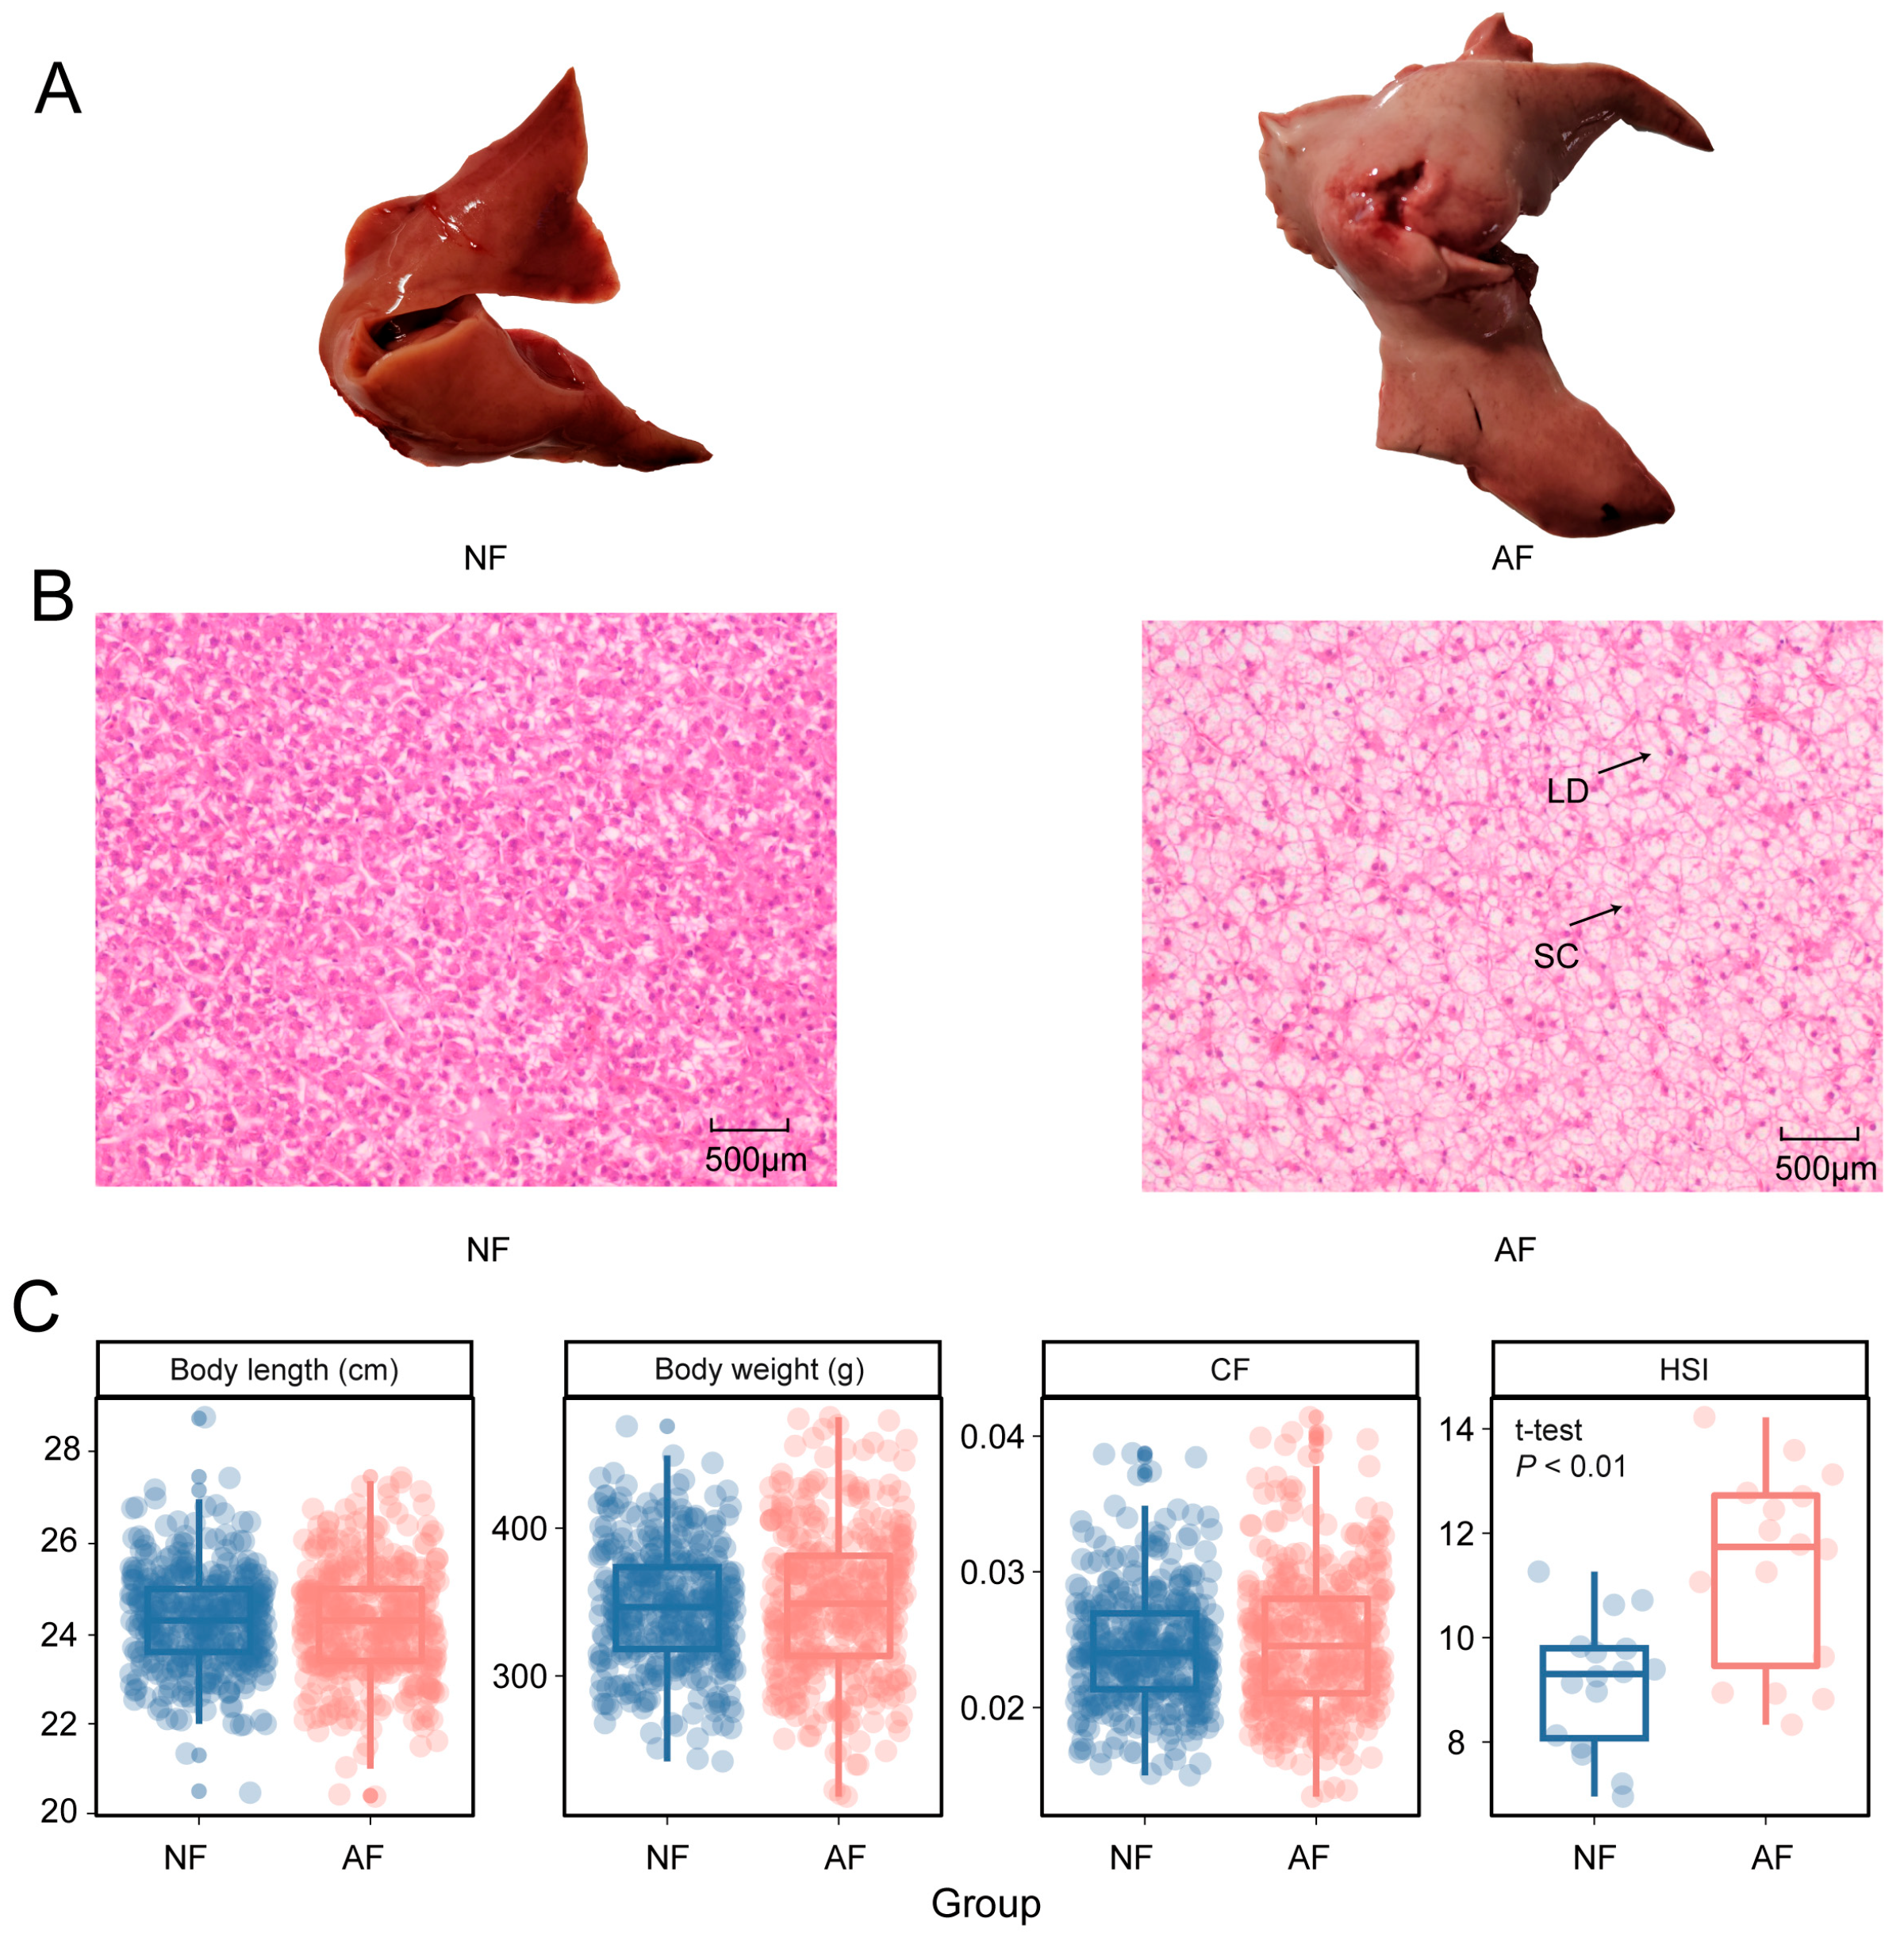
The overall survival rate exceeded 95% in both groups with no significant difference, and no abnormal mortality events occurred during the trial. After 150 days of feeding, there were no significant differences in body length, body weight, or condition factor between the AF and NF groups (p > 0.05, Figure 1C). The final body weight of the NF group was 346.7 ± 40.4 g (n = 387), and that of the AF group was 349.5 ± 49.7 g (n = 391), indicating comparable growth performance between the two feeding regimes. In contrast, the hepatosomatic index (HSI) of the AF group was significantly higher than that of the NF group (p < 0.01), with the AF group showing a 32.6% increase in liver weight compared to the NF group. The unchanged condition factor indicated that whole-body nutritional status and growth were comparable between groups, and the elevated HSI reflected liver-specific changes.
Gross morphological observation of the liver showed distinct differences between the two groups (Figure 1A). Livers from the NF group exhibited a typical, healthy reddish-brown coloration with a compact, uniform structure. In contrast, livers of AF group fish were visibly enlarged, pale in color, and displayed irregular surface contours. Histologically, NF fish showed normal hepatic architecture, with tightly packed hepatocytes and clear cellular boundaries. The AF group, however, displayed severe hepatic steatosis, characterized by widespread cytoplasmic vacuolization, and reduced cellular density (Figure 1B). These histological features indicated that artificial feed administration induced significant hepatic lipid accumulation and structural damage in mandarin fish.

3.2. Metabolite Identification and Multivariate Statistical Analysis

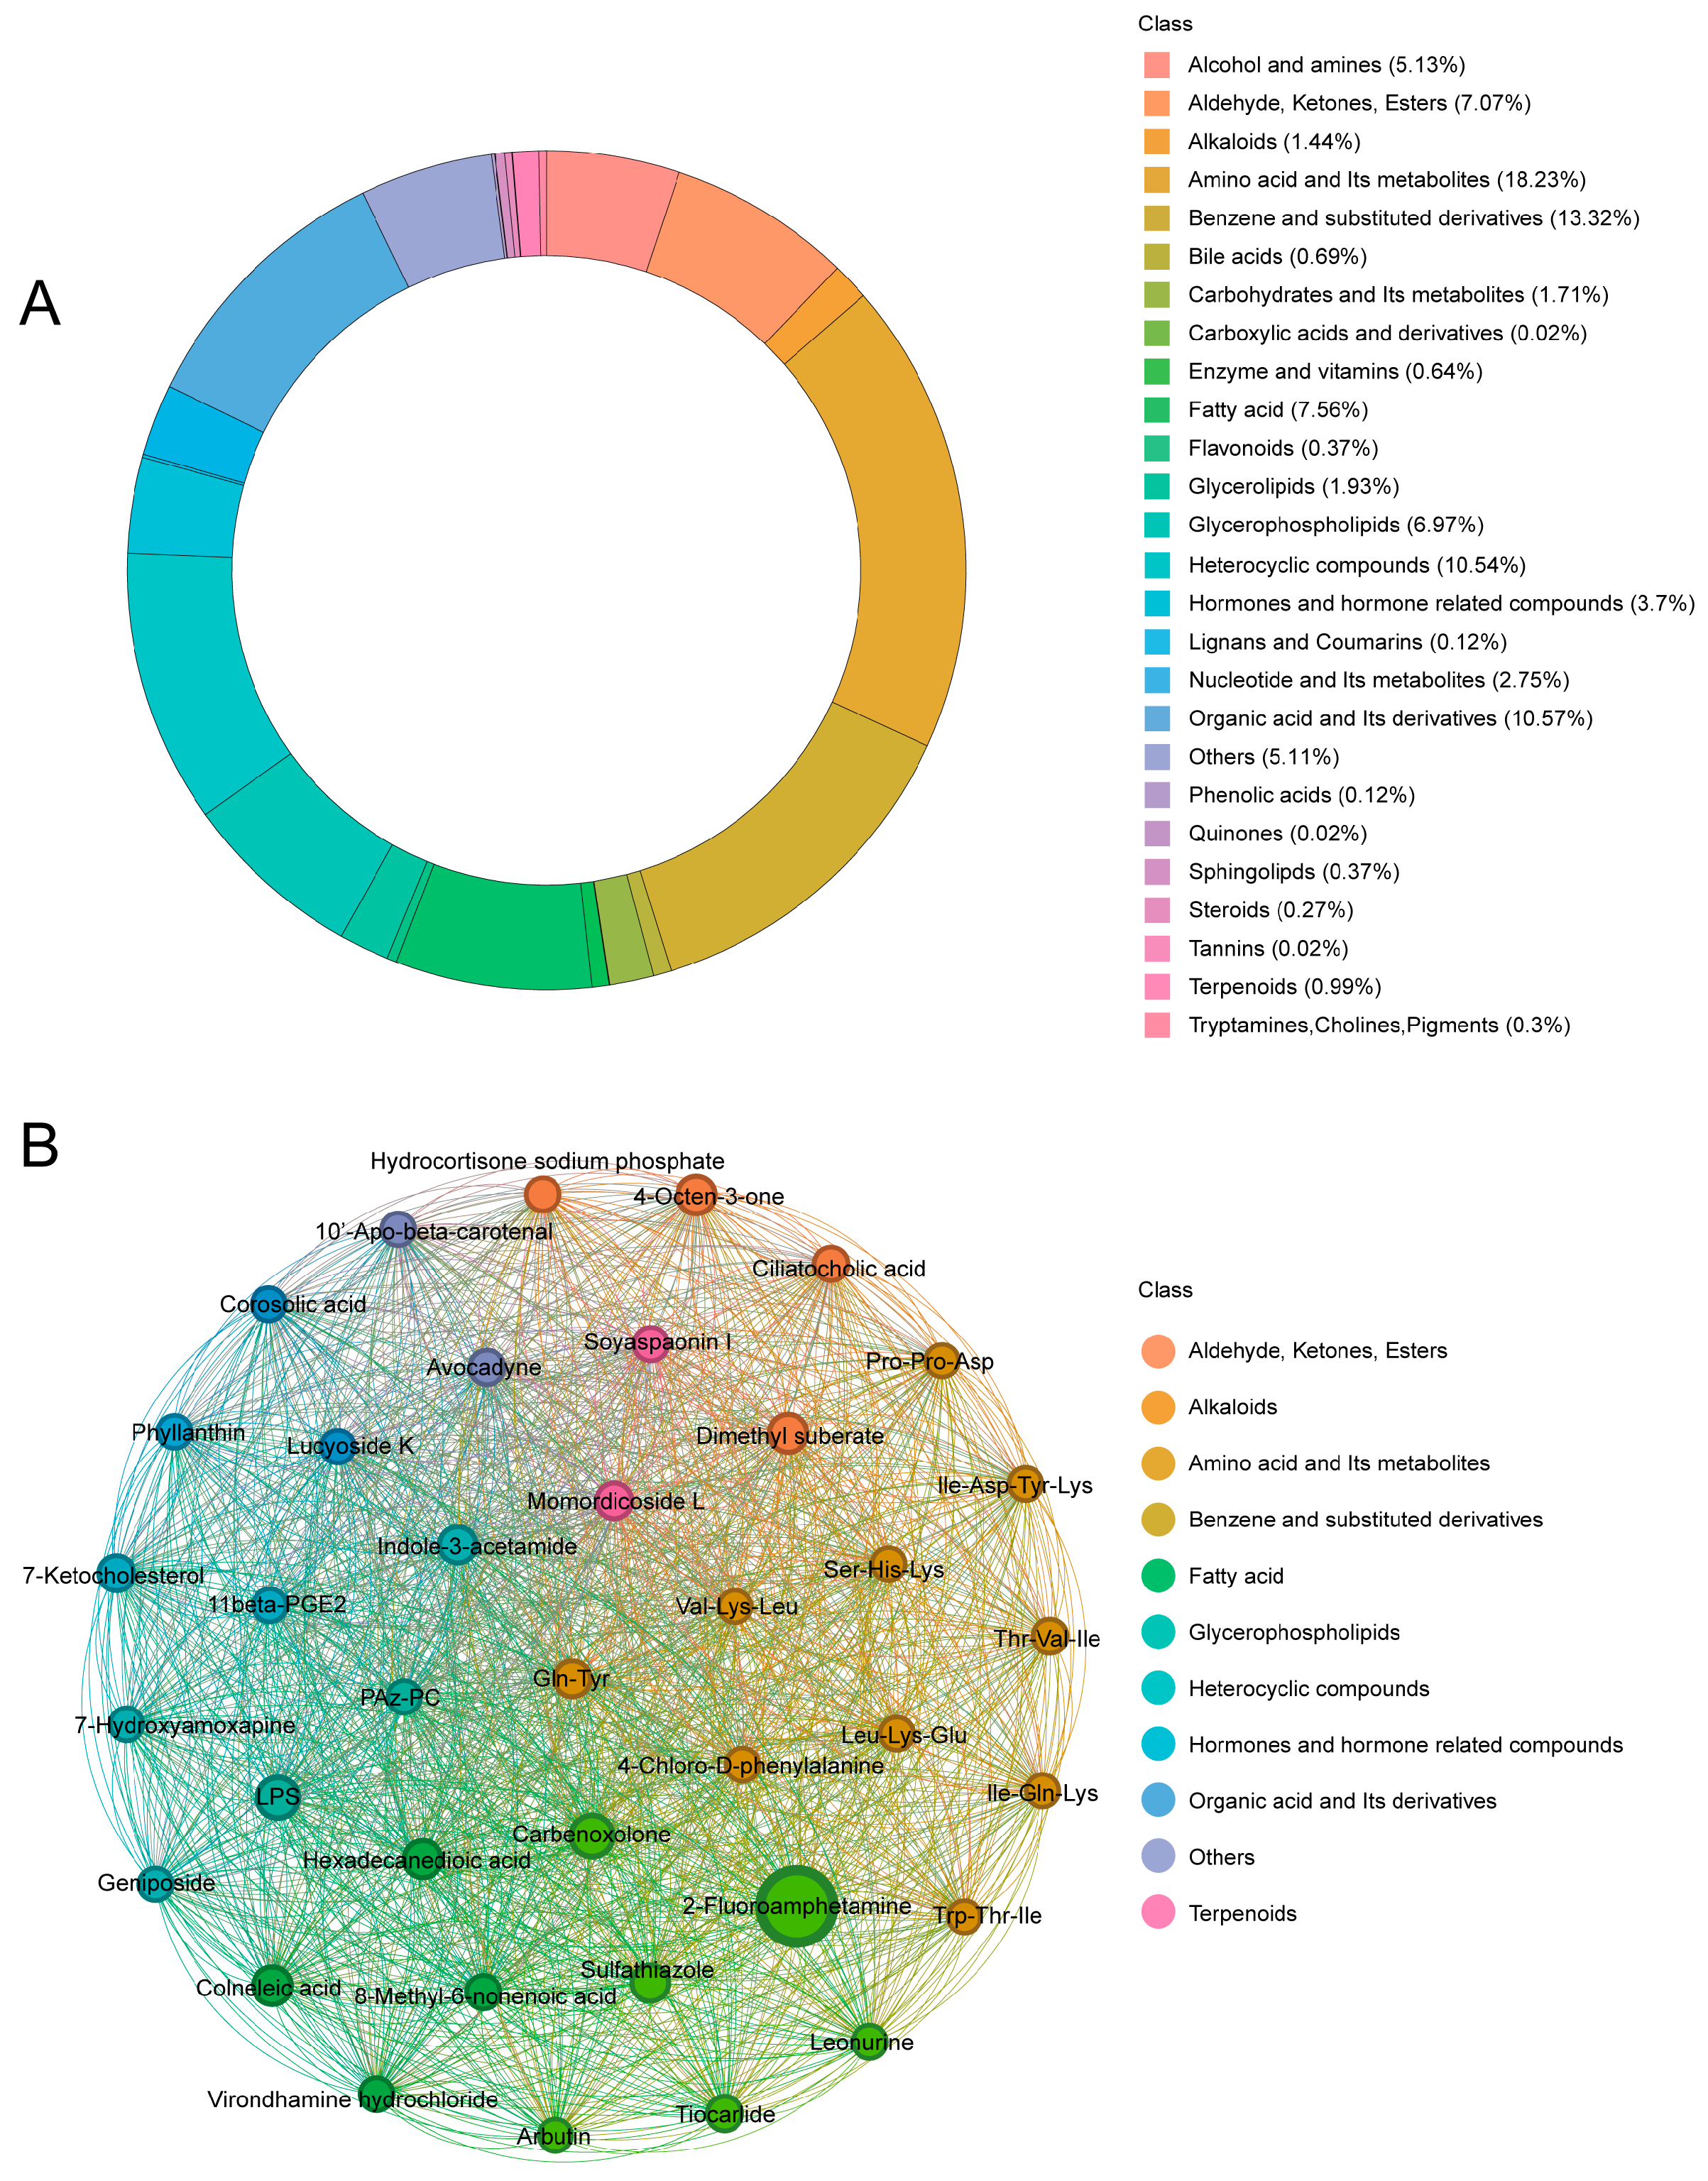
A total of 4032 distinct annotated metabolites involving 26 categories were detected in all liver samples from both groups (Table S1). The largest proportion of metabolites belonged to amino acids and their metabolites (18.23%), followed by benzene and substituted derivatives (13.32%), heterocyclic compounds (10.54%), organic acids and their derivatives (10.57%), fatty acids (7.56%), aldehydes/ketones/esters (7.07%), and glycerophospholipids (6.97%). Minor metabolite classes, including alcohols/amines (5.13%), phenols, terpenoids, and sphingolipids, collectively accounted for the remaining annotated metabolites (Figure 2A). The correlation network is presented in Figure 2B, in which each node represents an individual metabolite colored by its corresponding chemical class and edges denote significant pairwise correlations between metabolites. The network reveals tightly connected functional modules: Within the amino acid class, metabolites including Pro-Pro-Asp, Ile-Asp-Tyr-Lys, and Thr-Ile show extremely strong correlations with one another. Similarly, lipid- and fatty-acid-related metabolites such as Colneleic acid, hexadecanedioic acid, and sulfathiazole exhibit high internal connectivity, reflecting coordinated regulation of lipid metabolism. Among all nodes, 2-fluoroamphetamine acts as a prominent hub, with extensive strong correlations to metabolites across multiple classes.
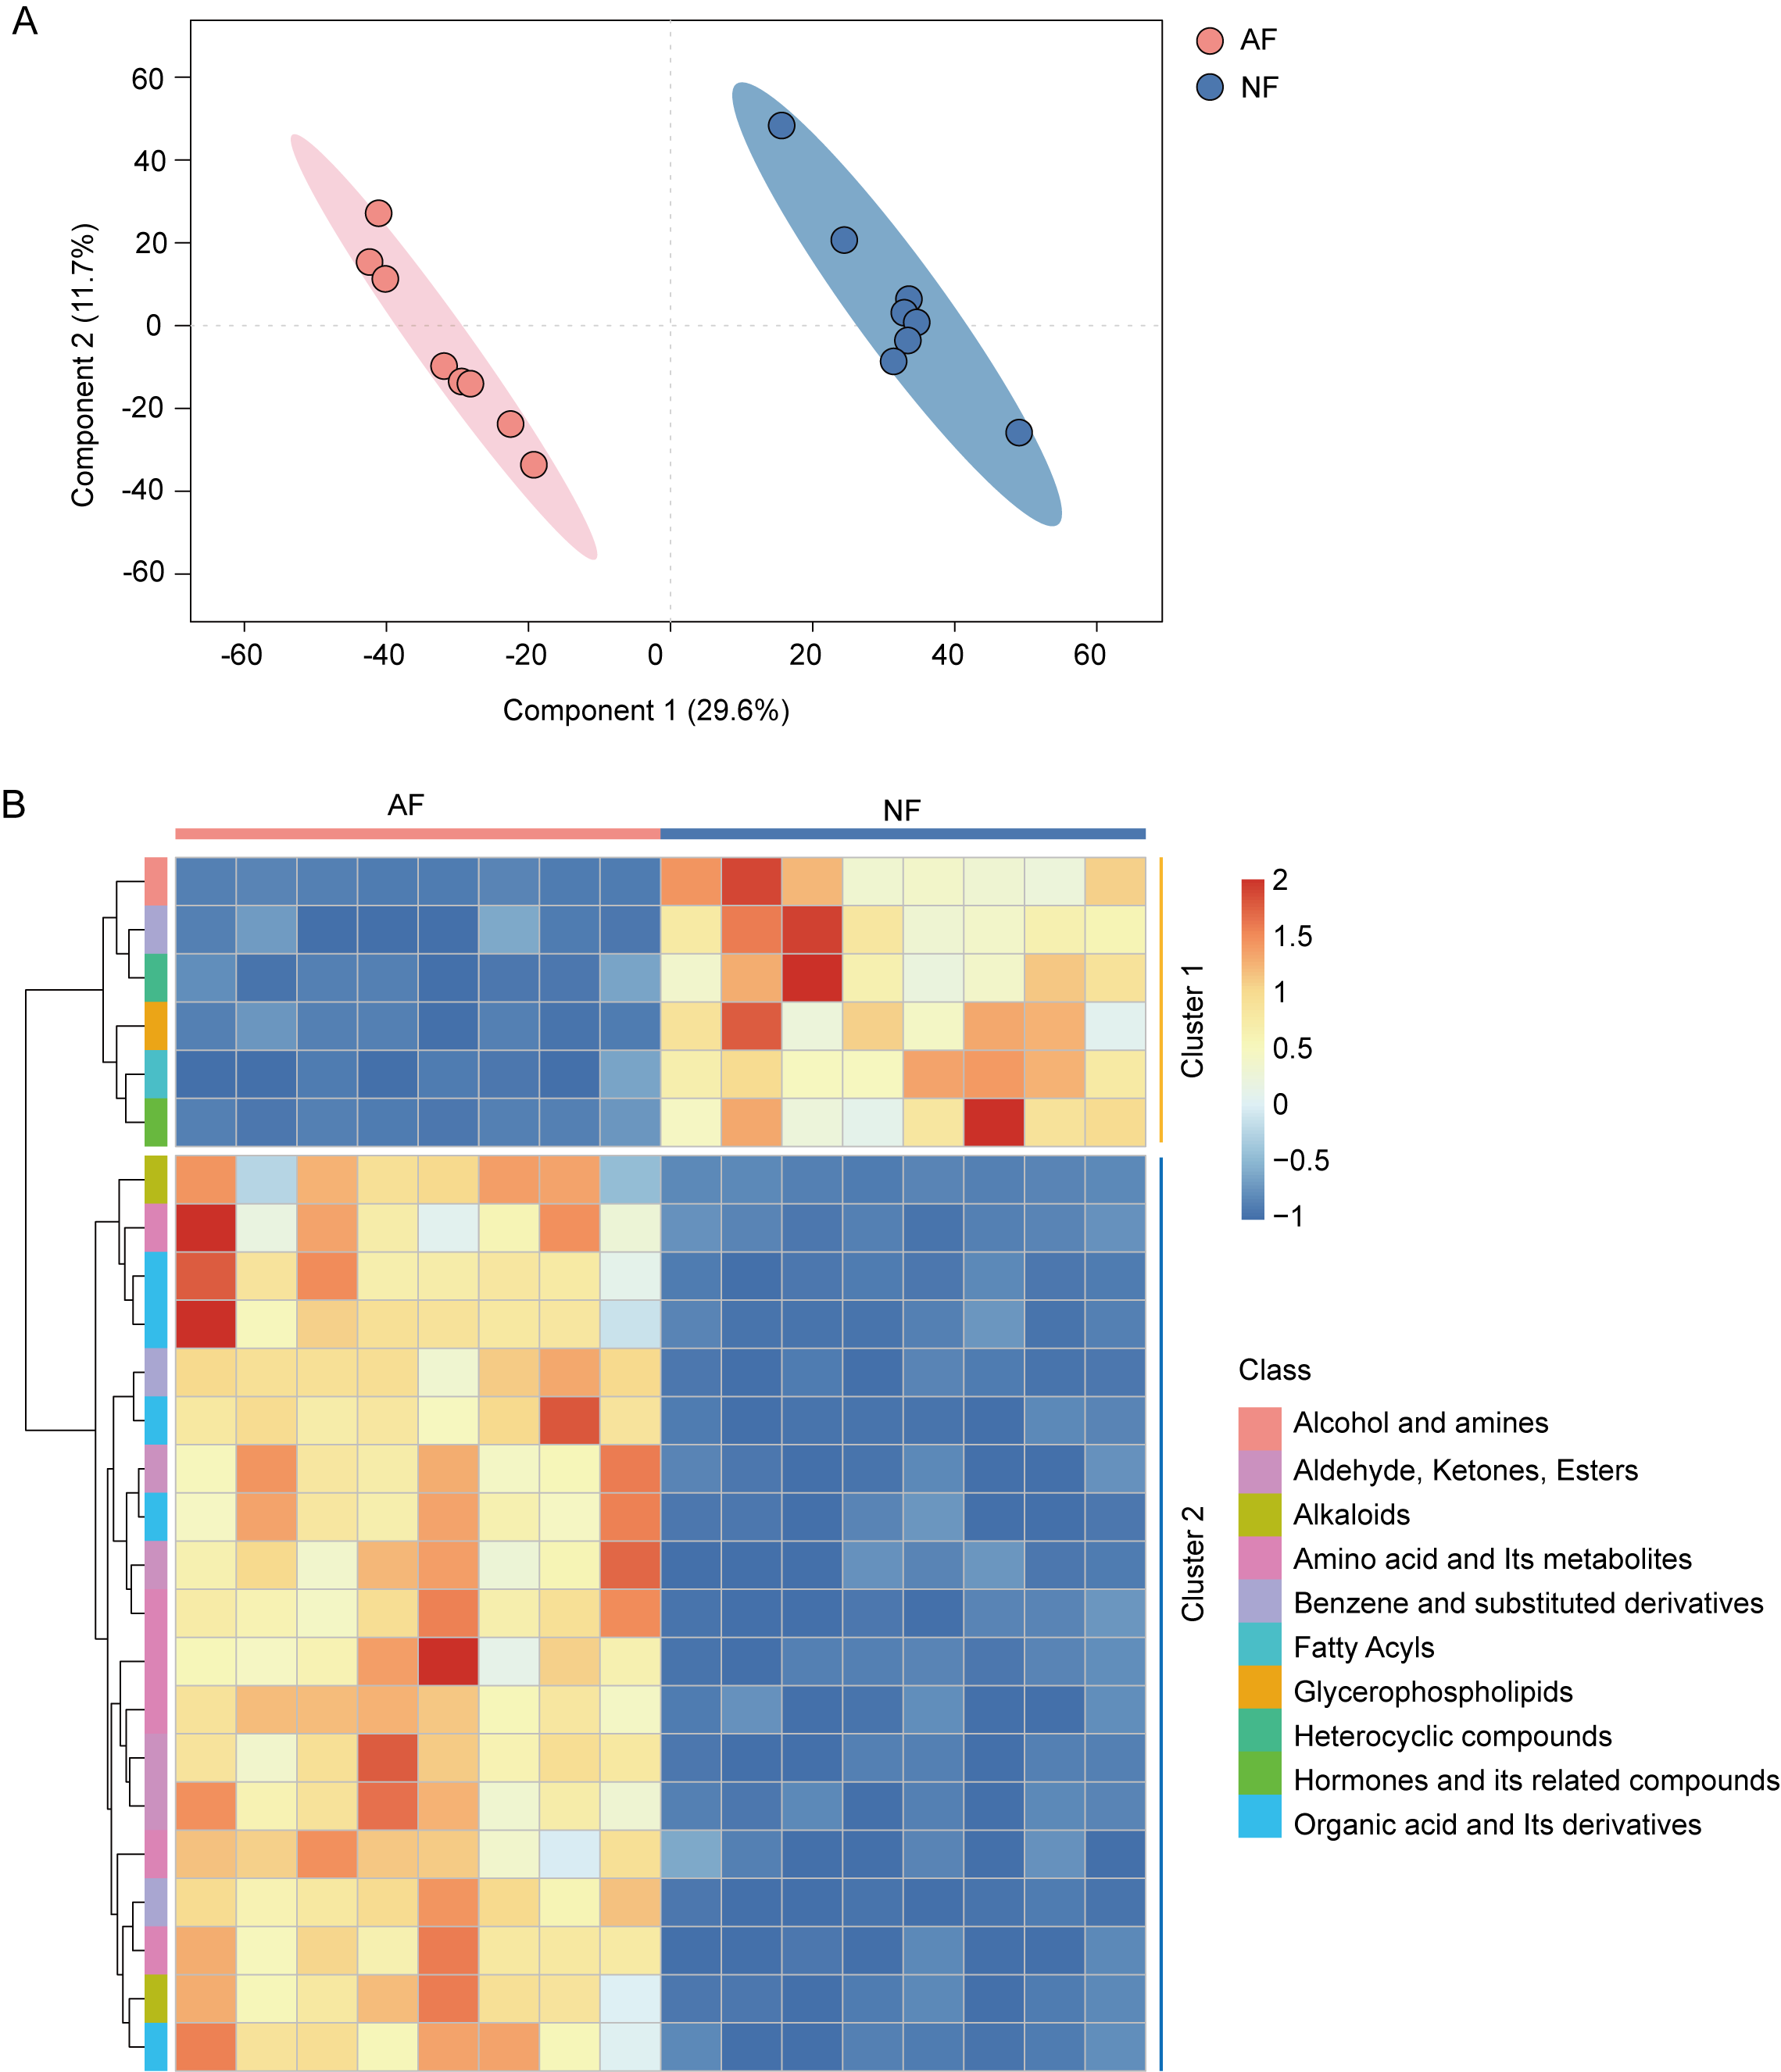
The partial least squares discrimination analysis (PLS-DA) showed clear separation of samples between the NF and AF groups (Figure 3A). The first principal component (PC1) separated samples well with a 29.6% variance contribution, while the second principal component (PC2) accounted for 11.7%. Cluster analysis of the top 25 significantly different metabolites (p < 0.05) between the NF and AF groups revealed two clusters (Figure 3B). Metabolite levels in Cluster 1 were significantly lower in the AF group than those in the NF groups, while the levels of metabolites in Cluster 2 were significantly higher in the AF group than those in the NF groups. The differentially expressed metabolites (DEMs) clustered in Cluster 1 were mainly composed of alcohol and amines, glycerophospholipids, and heterocyclic compounds. The DEMs in Cluster 2 were mainly composed of aldehyde, ketones, esters, amino acid and its metabolites, fatty acyls, and organic acid and its derivatives.
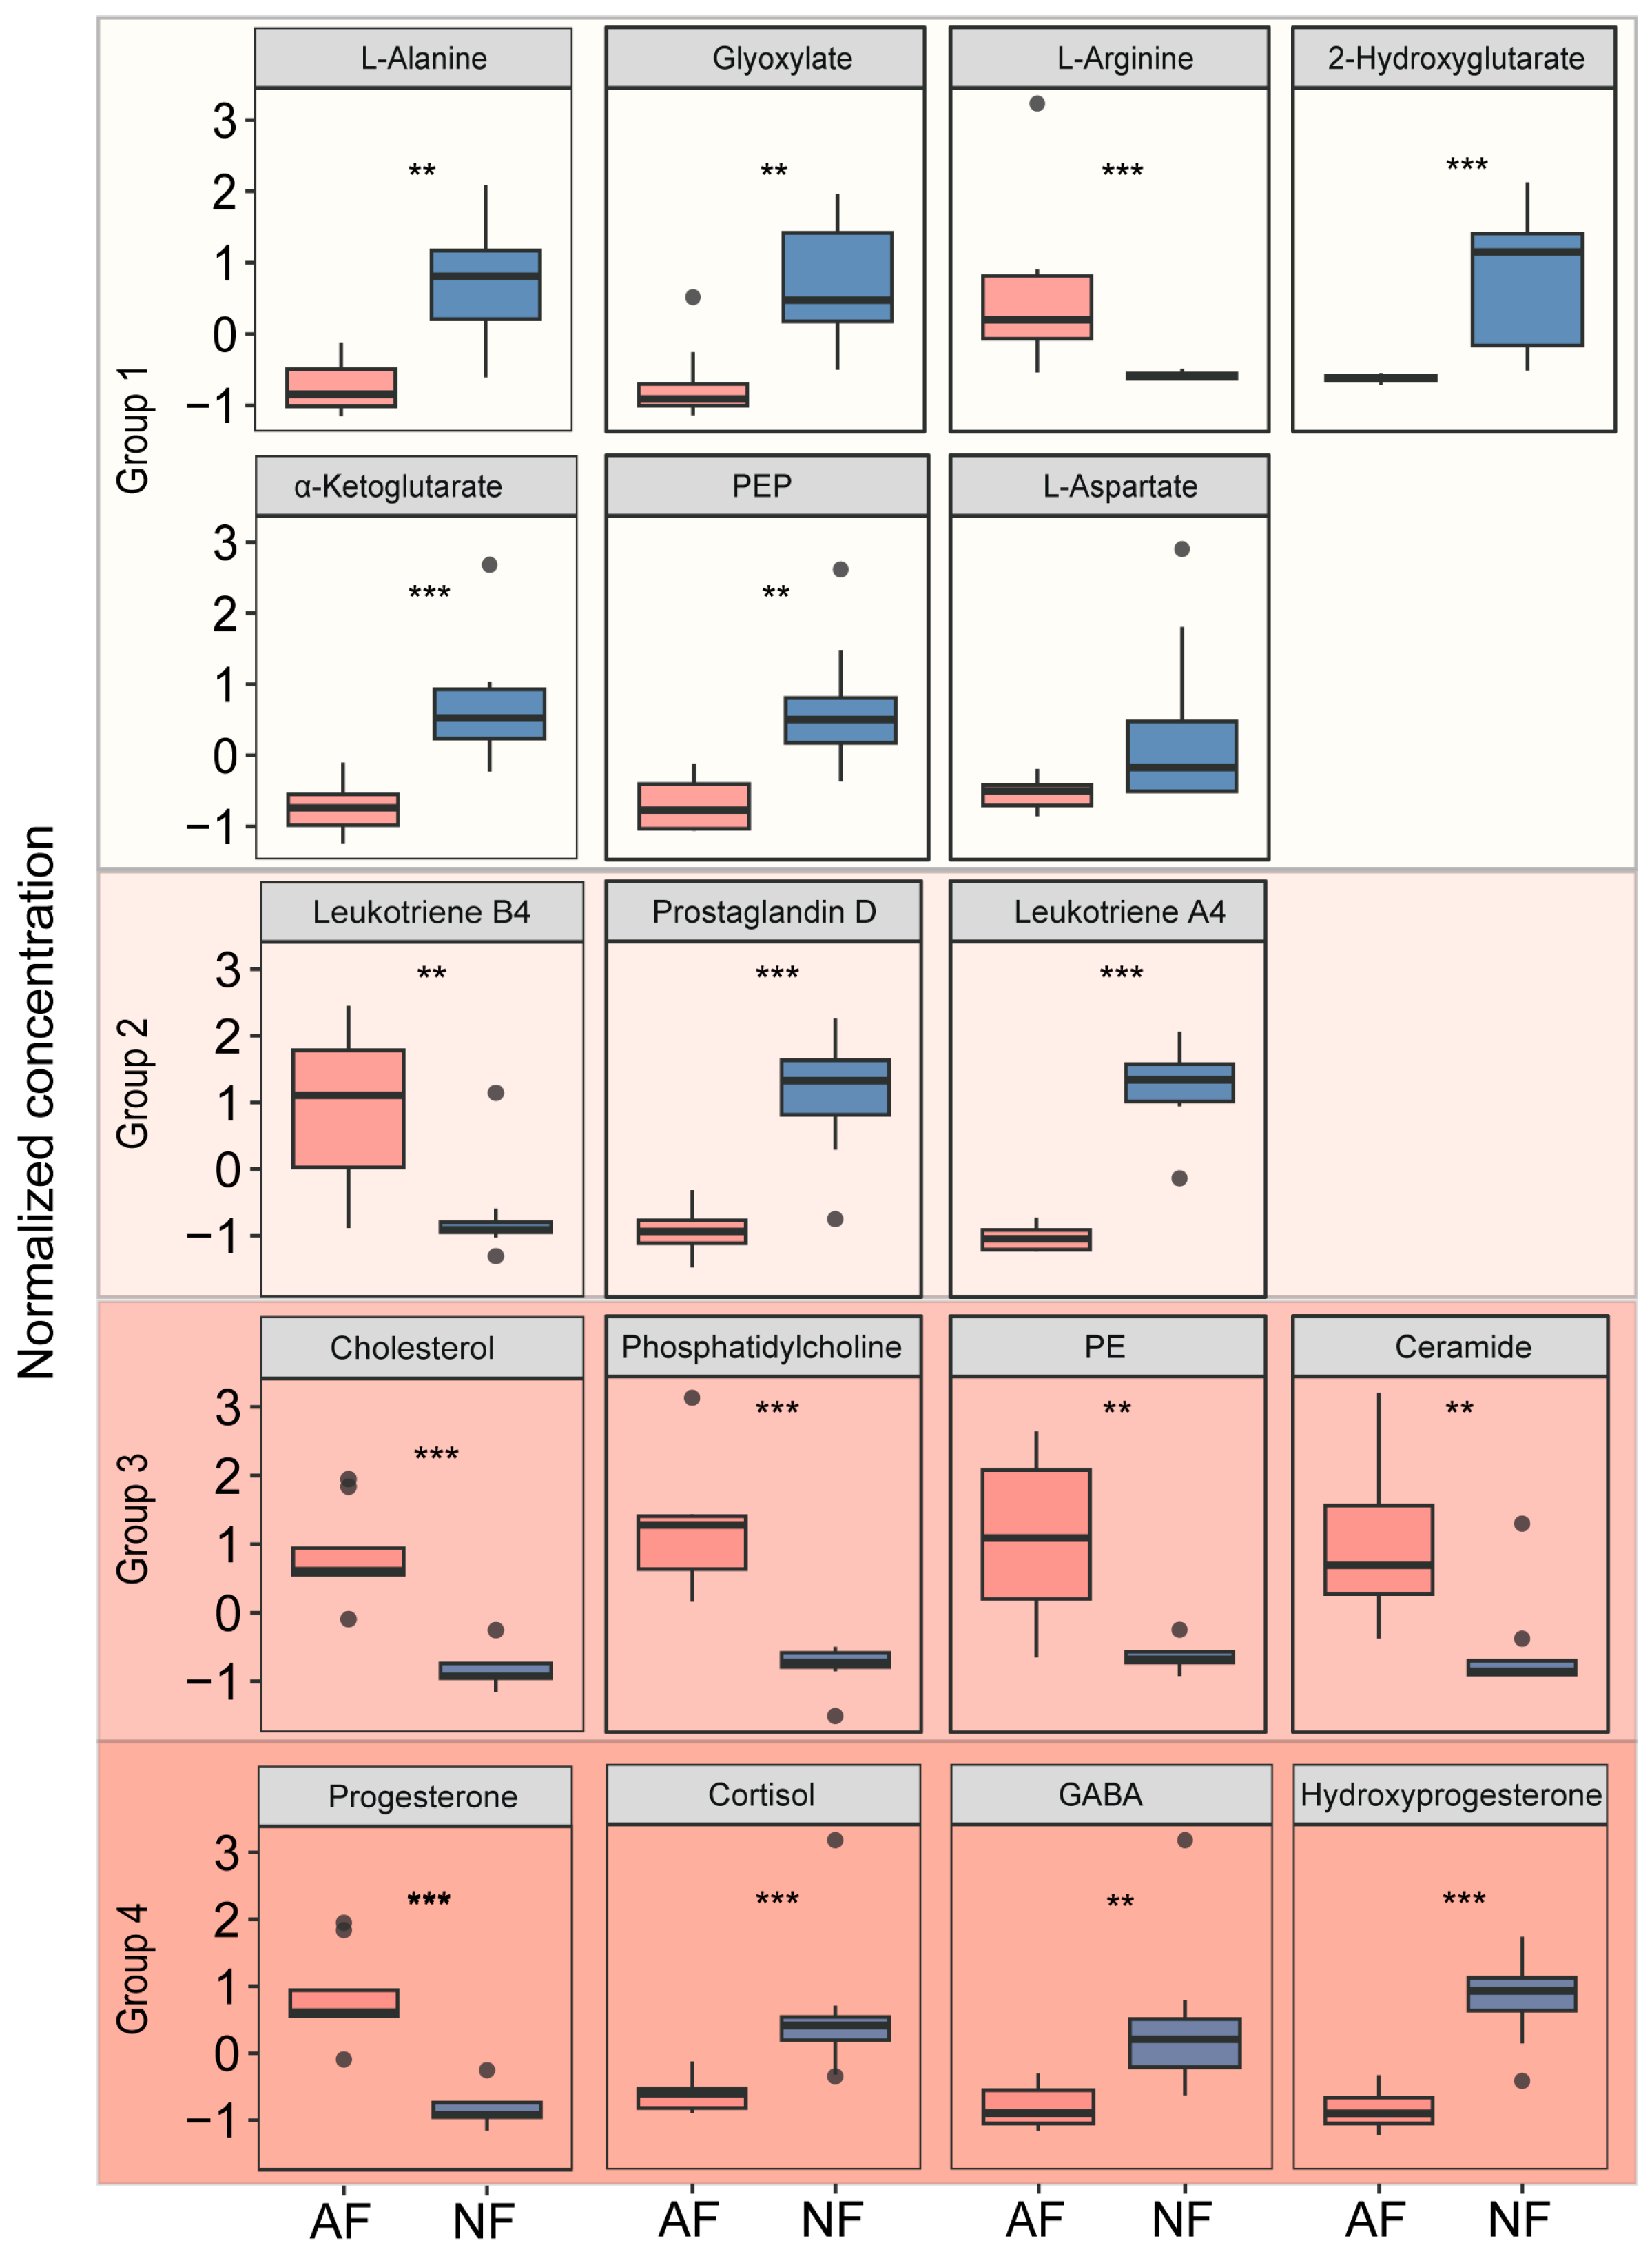
Functional classification of the DEMs showed distinct group-specific patterns (Figure 4). In terms of energy metabolism intermediates, L-alanine, glyoxylate, 2-hydroxyglutarate, α-ketoglutarate, and phosphoenolpyruvate (PEP) were significantly upregulated in the NF group (p < 0.01), indicating more active energy metabolism in the liver of the NF group. For eicosanoid-related metabolites, leukotriene B4 was significantly elevated in the AF group (p < 0.01), while prostaglandin D and leukotriene A4 were significantly higher in the NF group (p < 0.001). Regarding lipid-related metabolites, cholesterol, phosphatidylcholine, phosphatidylethanolamine (PE), and ceramide showed significantly higher normalized concentrations in the AF group than in the NF group (p < 0.01). Phosphatidylcholine is a core structural component of very-low-density lipoprotein (VLDL) responsible for hepatic lipid export, and ceramide is a bioactive lipid mediator associated with hepatic steatosis progression [30,31]. For steroid hormones and neurotransmitters, progesterone was significantly upregulated in the AF group (p < 0.001), whereas cortisol, γ-aminobutyric acid (GABA), and hydroxyprogesterone were significantly increased in the NF group (p < 0.01), indicating differences in stress response and endocrine regulation between the two feeding regimes. Cortisol is a primary stress hormone in fish, and GABA is an inhibitory neurotransmitter involved in stress regulation.

3.3. KEGG Pathway Enrichment Analysis of Differentially Expressed Metabolites (DEMs)

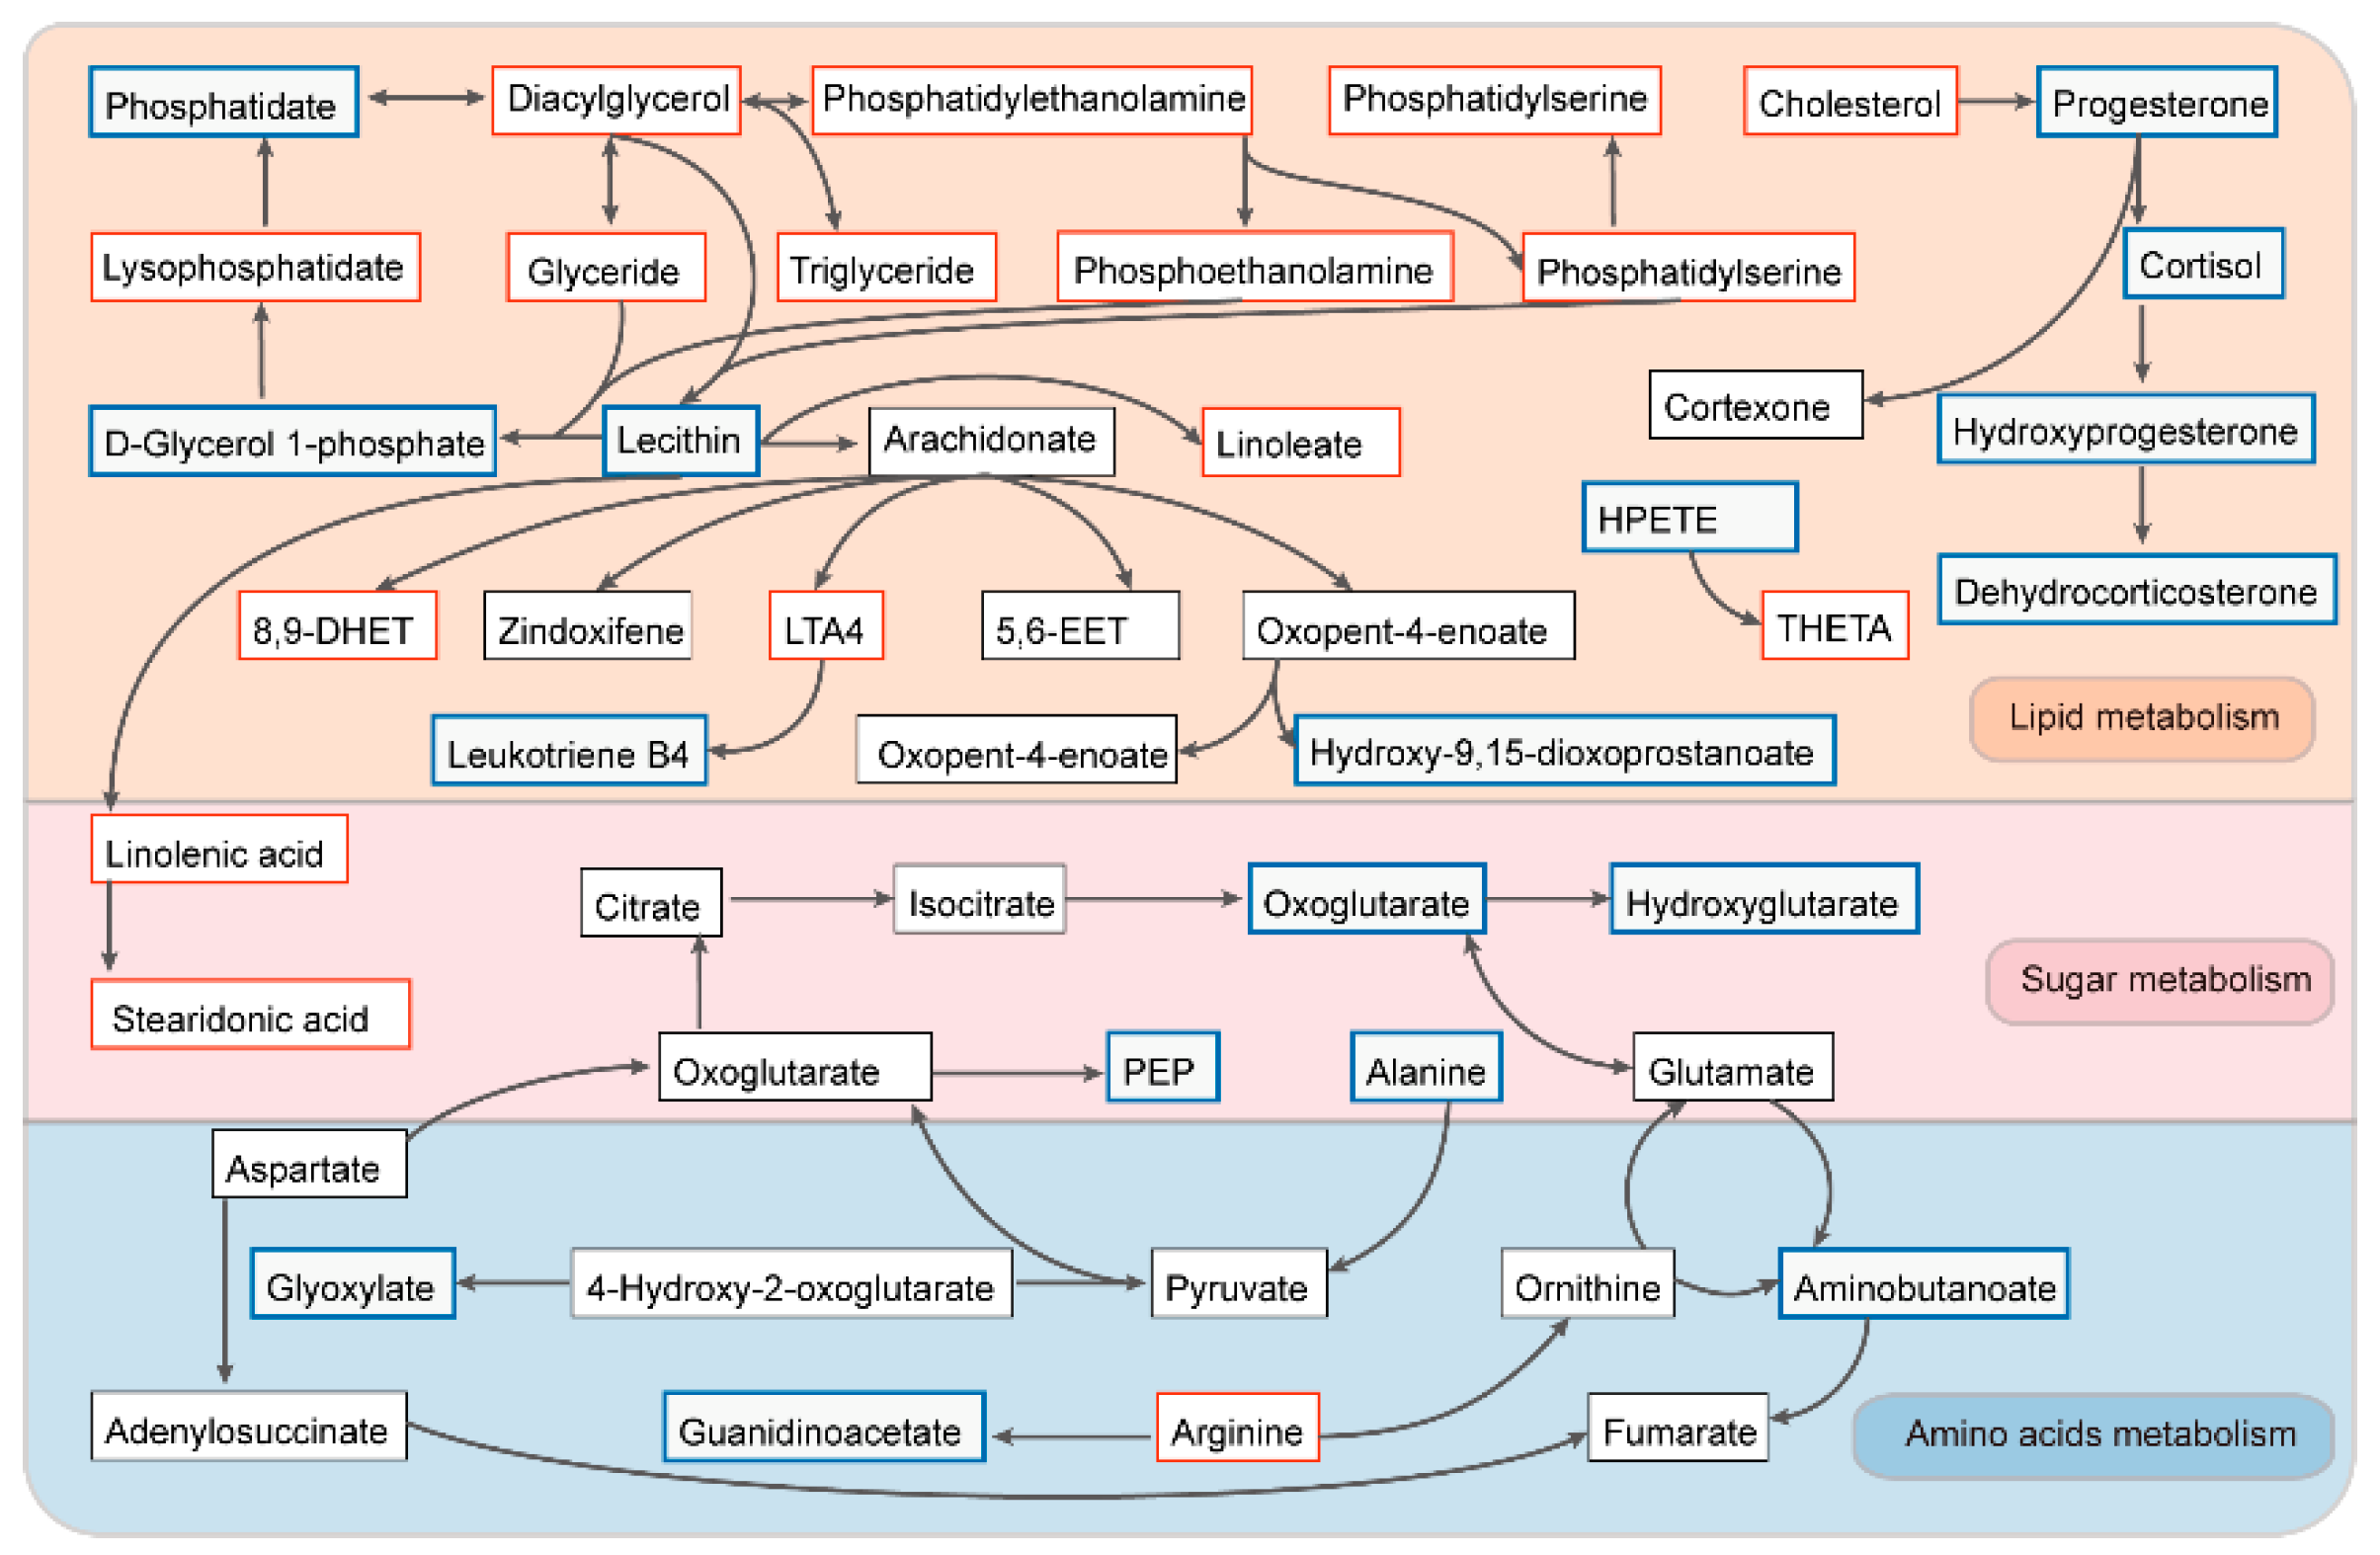
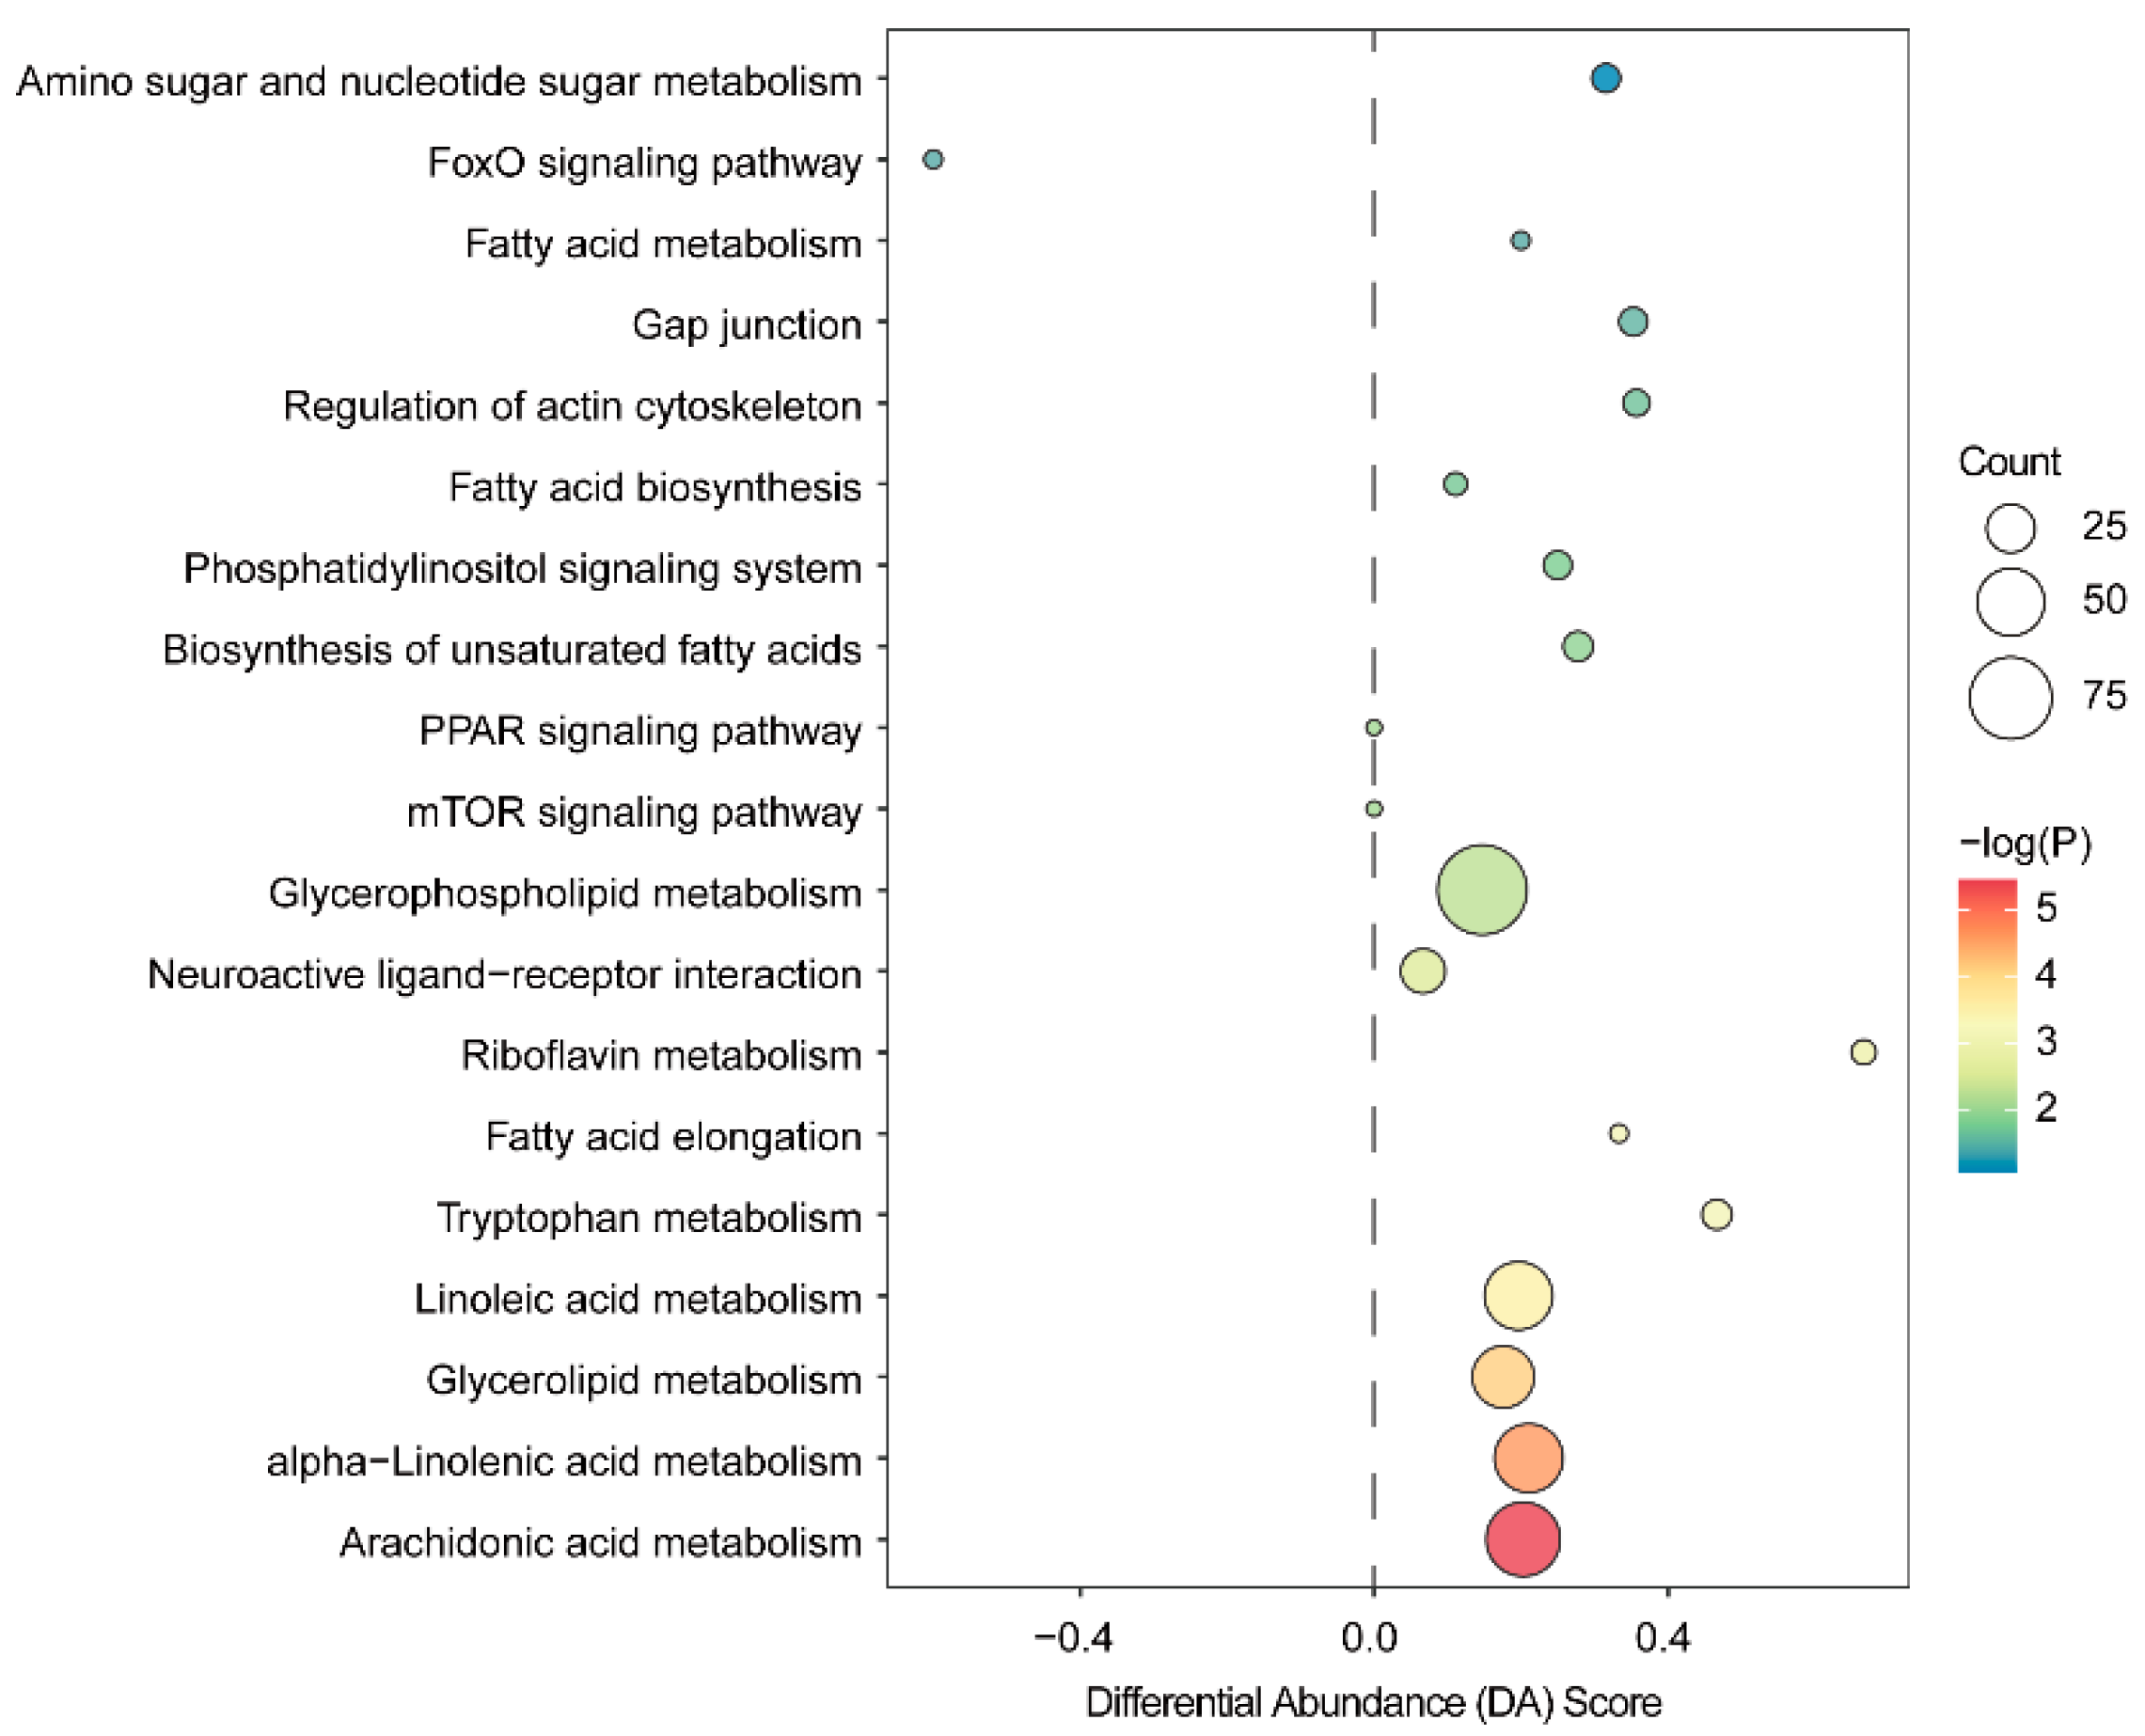
These DEMs were associated with lipid metabolism, sugar metabolism, and amino acid metabolism (Figure 5). Kyoto Encyclopedia of Genes and Genomes (KEGG) pathway enrichment analysis was performed using DEMs between the NF and AF groups (Figure 6). Most enriched pathways were significantly upregulated in the AF group, including lipid-related pathways such as arachidonic acid metabolism, alpha-linolenic acid metabolism, glycerolipid metabolism, linoleic acid metabolism, fatty acid elongation, and glycerophospholipid metabolism. In contrast, the FoxO signaling pathway was significantly upregulated in the NF group.

4. Discussion

This study integrated growth performance, liver histological structure, and hepatic metabolomic data to reveal the differences in hepatic metabolic adaptation between mandarin fish fed artificial feeds (AF) and natural live feeds (NF). The present findings demonstrate that while artificial feeds maintain growth comparable to live prey, they trigger extensive hepatic lipid metabolism reprogramming and pathological structural changes represented by hepatic steatosis. These findings shed light on the metabolic adaptations underlying the successful transition from live prey to artificial feeds, with implications for improving aquaculture practices.

4.1. Dissociated Phenotypes of Growth and Hepatic Health

In the present study, the most prominent phenotypic difference was the significant increase in HSI in the AF group, despite no significant changes in body length, body weight, and condition factor between the two groups. This dissociated phenotype indicates that artificial feeds support normal growth but might cause liver-specific metabolic overload. This finding, combined with histological observations of severe cytoplasmic vacuolization and loose arrangement of hepatocytes in the AF group, indicates that the increase in liver weight is attributed to both enhanced hepatic metabolic activity and excessive lipid accumulation. This pattern indicates that artificial feeds do not alter overall growth (i.e., body size and condition factor), but redirect nutritional resources toward hepatic metabolism. This observation matches the physiological function of livers: the organ prioritizes processing and storing surplus dietary nutrients [12].
Consistent with our growth results, previous work on mandarin fish has repeatedly found comparable growth rates between artificial feed and live prey groups, despite clear differences at the physiological and molecular levels. For instance, research has reported altered digestive enzyme activities and shifted intestinal microflora in artificial-fed mandarin fish hybrids relative to live prey-fed counterparts, even with similar body weight gain [5]. Further research has revealed that domestication to artificial feeds induced adaptive remodeling of the entire digestive tract in mandarin fish, including changes in intestinal morphology and digestive enzyme secretion patterns [9]. Our findings extend these prior observations from the digestive system to the liver, revealing that hepatic metabolic remodeling is another key component of the adaptive response to artificial feeds.
Similar phenotypes have been widely reported in other carnivorous fish species. In Epinephelus coioides, high dietary coconut oil replacing fish oil significantly promoted hepatic lipid deposition without affecting growth performance and body condition [32]. In Pelteobagrus vachelli and Lates calcarifer, dietary manipulation of lipid sources or nutrient levels also induced remarkable hepatic metabolic alterations and steatosis, but left growth and condition factor unchanged [33,34]. This pattern verifies that excess lipid is preferentially deposited in the liver rather than peripheral somatic tissues. As the core metabolic hub for nutrient processing, the liver first stores surplus nutrients from artificial feeds as metabolic reserves; systemic fat deposition only occurs when hepatic storage capacity is saturated [11,12]. By contrast, live prey feeding leads to more balanced nutrient allocation across somatic tissues, thus supporting comparable growth with lower hepatic mass [35].

4.2. Metabolic Flexibility Under Live Prey Feeding

The clear separation of hepatic metabolomic profiles between the AF and NF groups in PLS-DA analysis confirms that dietary type is a key driver of the hepatic metabolic phenotype of mandarin fish. Metabolic correlation network analysis further revealed that amino acid and lipid metabolism form tightly linked functional modules in the liver of mandarin fish, indicating that the adaptation to artificial feeds involves the synergistic regulation of multiple metabolic pathways, rather than independent changes in individual metabolites. Live prey feeding is characterized by fluctuating nutrient intake and predation-associated energy expenditure, which requires high adaptive capacity of the liver to maintain energy homeostasis. In the NF group, we observed coordinated upregulation of multiple energy metabolism intermediates, including the tricarboxylic acid cycle intermediate α-ketoglutarate, glycolytic intermediate PEP, and gluconeogenic substrate L-alanine. This metabolic profile indicates enhanced central carbon metabolism flux and active gluconeogenesis, which enables the liver to rapidly regulate blood glucose levels in response to intermittent food intake from live prey. At the transcriptomic level, artificial feed altered the expression of genes related to stress response and energy metabolism in the intestine of mandarin fish, which aligns with the metabolic shifts observed in our liver samples [36].
This adaptive pattern is consistent with the FoxO signaling pathway activation observed in the NF group. FoxO transcription factors are core regulators of cellular stress resistance and energy metabolism, which can upregulate gluconeogenesis and fatty acid oxidation to maintain energy supply during nutritional fluctuations [37,38]. Meanwhile, the significant elevation of cortisol and GABA in the NF group further supports the activation of stress adaptation mechanisms. Cortisol is the primary glucocorticoid in fish, which promotes hepatic gluconeogenesis and lipid mobilization under stress conditions [39]. GABA, as an inhibitory neurotransmitter, is involved in regulating stress response and feeding behavior. Together, these metabolic changes reflect the adaptive flexibility of the mandarin fish liver, which enables efficient adaptation to the variable nutritional environment of live prey feeding [15].

4.3. Hepatic Lipid Metabolism Reprogramming Induced by Artificial Feeds

The AF group showed comprehensive upregulation of lipid metabolism pathways and accumulation of multiple lipid metabolites, which is the core metabolic feature of artificial feed-induced hepatic steatosis. Phosphatidylcholine is a core component of very-low-density lipoprotein (VLDL) responsible for hepatic lipid transport, and its upregulation may be a compensatory response to excessive hepatic lipid accumulation; meanwhile ceramide, as a bioactive lipid mediator, is closely associated with the progression of hepatic steatosis and inflammatory response [39,40]. Ceramide accumulation can induce hepatocyte apoptosis and promote the progression of fatty liver disease to steatohepatitis. The elevation of leukotriene B4, a pro-inflammatory eicosanoid, further indicates the presence of inflammatory activation in the liver of the AF group. These findings suggest that artificial feed-induced steatosis is not merely a passive lipid storage process, but is accompanied by active lipid signaling regulation and inflammatory response, which may pose long-term risks to liver function and fish health.
KEGG pathway enrichment analysis further clarified the core regulatory pathways of hepatic metabolic adaptation to artificial feeds. The AF group showed significant activation of multiple lipid metabolism-related pathways, including arachidonic acid metabolism, α-linolenic acid metabolism, glycerolipid metabolism, linoleic acid metabolism, fatty acid elongation, and glycerophospholipid metabolism. These pathways are not only involved in the synthesis and catabolism of structural and storage lipids, but also closely related to the regulation of inflammatory response and membrane fluidity in fish liver [30,31]. However, the continuous activation of these lipid synthesis pathways also leads to excessive lipid deposition in hepatocytes, which ultimately induces hepatic steatosis, forming a “metabolic adaptation–lipid overload–structural damage” cascade response.

4.4. Drivers of Phenotypic Differences: Nutrient Composition vs. Feed State

An important consideration is that the observed differences between groups may arise from two aspects: the difference in nutrient composition (higher protein and lipid levels in AF on a wet weight basis) and the difference in feed state (live prey vs. formulated feed, including physical form, palatability, and predation energy cost).
In terms of nutrient composition, the artificial feed had much higher protein and lipid concentrations on a wet weight basis than live prey. However, on a dry matter basis, the protein and lipid levels of the artificial feed are within the range commonly used for carnivorous fish feeds, and are consistent with previous studies on mandarin fish artificial feeds [9]. The higher water content of live prey leads to lower nutrient concentration per unit wet weight, but fish can compensate by increasing prey intake. In this study, both groups were fed to apparent satiation, and the comparable growth performance suggests that the actual nutrient intake for growth was similar between groups.
In terms of feed state, live prey feeding requires predation behavior, which increases energy expenditure and metabolic stress, as reflected by the upregulation of cortisol and FoxO pathway in the NF group. In contrast, artificial feeds are easily ingested, reducing the energy cost of predation and allowing more nutrients to be used for metabolism and storage. The stable nutrient supply of artificial feeds also reduces the need for metabolic flexibility, leading to a shift in hepatic metabolism toward lipid synthesis and storage. Beyond energy expenditure and nutrient stability, differences in intestinal microbial communities may also contribute to the observed metabolic divergence. Previous studies have demonstrated that mandarin fish fed artificial feeds had significantly different gut microbiota composition compared to those fed live prey, with higher abundance of lipid-metabolizing bacterial taxa [36,41]. Shifts in gut microbiota can alter nutrient extraction efficiency and modulate hepatic lipid metabolism via the gut–liver axis, which may act as an additional driver of hepatic steatosis under artificial feeding.
Overall, the observed hepatic metabolic differences are the combined result of both nutrient composition and feed state. This study reflects the actual production scenario of mandarin fish farming, and the findings have direct practical relevance. Future studies using isonitrogenous and isolipidic diets can further separate the independent effects of nutrient level and feed physical state.

4.5. Implications for Artificial Feed Optimization

These findings have important guiding significance for the optimization of artificial feed formulations for mandarin fish. The significant activation of hepatic lipid synthesis pathways and the occurrence of steatosis in the AF group indicate that the lipid level and fatty acid composition of the current commercial feed do not fully match the metabolic capacity of mandarin fish. Adjusting the dietary protein-to-lipid ratio, optimizing the fatty acid profile, and adding functional additives that promote lipid transport and oxidation may alleviate excessive hepatic lipid deposition while maintaining normal growth performance [42]. Additionally, the non-significant difference in growth between the two groups suggests that adjusting the macronutrient ratio of artificial feeds may redirect nutrients from hepatic storage to growth, thereby improving feed efficiency and production performance. It should be emphasized that although artificial feeds induce hepatic steatosis, they still have obvious advantages in terms of production cost, biosecurity, and operational convenience, and remain the development direction of sustainable mandarin fish aquaculture. The key is to optimize feed formulation and feeding strategies based on metabolic mechanisms to achieve a balance between growth performance and hepatic health.


5. Conclusions

In conclusion, this study systematically demonstrates that artificial feeds induce significant hepatic metabolic adaptation in adult mandarin fish, characterized by comprehensive lipid metabolism reprogramming, synergistic regulation of amino acid and lipid metabolic modules, and altered stress and endocrine-related metabolite profiles. Artificial feeds can support growth equivalent to natural live feeds, but simultaneously induce obvious hepatomegaly and severe hepatic steatosis in mandarin fish. The activation of multiple lipid synthesis and metabolism pathways is the core metabolic feature of the liver under artificial feeding, while the upregulation of the FoxO signaling pathway reflects adaptive metabolic flexibility of mandarin fish to live prey feeding. These findings not only clarify the biological trade-offs between artificial feeds and natural live feeds in mandarin fish culture, but also provide a systematic histological and metabolic basis for the precise optimization of artificial feed formulations and the regulation of hepatic health in farmed mandarin fish, which is of great significance for promoting the sustainable and intensive development of the mandarin fish aquaculture industry. In practical aquaculture, the identified core lipid metabolic pathways and key differential metabolites can serve as functional targets to guide the adjustment of dietary nutrient ratios and the screening of feed additives. This will help alleviate artificial feed-induced hepatic steatosis, reduce the risk of fatty liver-related diseases in farming production, and ultimately improve production efficiency and support the sustainable intensification of mandarin fish aquaculture.

Supplementary Materials

The following supporting information can be downloaded at https://www.mdpi.com/article/10.3390/fishes11070407/s1. Table S1: all_sample_data.

Author Contributions

Conceptualization, Y.S. and M.W.; methodology, B.Z. and J.H.; software, Y.J. and Q.L.; validation, M.W.; resources, Y.S. and M.W.; writing—original draft preparation, Y.S. and M.W.; writing—review and editing, Y.S. and M.W.; visualization, Y.S. All authors have read and agreed to the published version of the manuscript.

Funding

This work was supported by the China Agriculture Research System (CARS-45); the Special Fund for Anhui Agriculture Research System (AARS-08); the New doctoral talents project of Anhui Academy of Agricultural Sciences (XJBS-202434, XJBS-202530); the team project of Anhui Academy of Agricultural Sciences (2025YL049); the Scientific Research Project of Anhui Academy of Agricultural Sciences (2026YL045, 2026ZH011); and the Huizhou Stinky Mandarin Fish Industry Research Institute (HZCGY2025001).

Institutional Review Board Statement

The care and use of S. chuatsi followed animal use protocols approved by the Anhui Academy of Agricultural Sciences (approval code: AAAS2025-22 and approval date: 13 March 2025).

Data Availability Statement

Supplementary data to this article can be found online at Mendeley Data, V1, https://data.mendeley.com/datasets/8rxhggwfvt/1.

Conflicts of Interest

The authors declare no conflict of interest.

References

  1. Liang, X.-F.; Lin, X.; Li, S.; Liu, J.-K. Impact of Environmental and Innate Factors on the Food Habit of Chinese Perch Siniperca chuatsi (Basilewsky) (Percichthyidae). Aquac. Res. 2008, 39, 150–157. [Google Scholar] [CrossRef]
  2. Liang, X.F.; Kiu, J.K.; Huang, B.Y. The Role of Sense Organs in the Feeding Behaviour of Chinese Perch. J. Fish Biol. 1998, 52, 1058–1067. [Google Scholar] [CrossRef]
  3. Chen, X.; Sun, C.; Dong, J.; Li, W.; Tian, Y.; Hu, J.; Ye, X. Comparative Analysis of the Gut Microbiota of Mandarin Fish (Siniperca chuatsi) Feeding on Compound Diets and Live Baits. Front. Genet. 2022, 13, 797420. [Google Scholar] [CrossRef] [PubMed]
  4. Tao, J.-J.; Gui, J.-F.; Zhang, Q.-Y. Isolation and Characterization of a Rhabdovirus from Co-Infection of Two Viruses in Mandarin Fish. Aquaculture 2007, 262, 1–9. [Google Scholar] [CrossRef]
  5. Li, Y.; Li, J.; Lu, J.; Li, Z.; Shi, S.; Liu, Z. Effects of Live and Artificial Feeds on the Growth, Digestion, Immunity and Intestinal Microflora of Mandarin Fish Hybrid (Siniperca chuatsi ♀ × Siniperca scherzeri ♂). Aquac. Res. 2017, 48, 4479–4485. [Google Scholar] [CrossRef]
  6. Luo, X.; Zhang, W.; Dai, Y.; Ma, L.; Bo, Q.; You, H.; Sun, H.; Liu, H.; Jiang, J.; Chen, Z. Industrial Breeding and Domestication of Mandarin Fish (Siniperca chuatsi) in Tianjin, China. Fish. Aquat. Sci. 2025, 28, 491–500. [Google Scholar] [CrossRef]
  7. Collins, S.A.; Mansfield, G.S.; Desai, A.R.; Van Kessel, A.G.; Hill, J.E.; Drew, M.D. Structural Equation Modeling of Antinutrients in Rainbow Trout Diets and Their Impact on Feed Intake and Growth. Aquaculture 2013, 416–417, 219–227. [Google Scholar] [CrossRef]
  8. Li, Y.; Shi, J.; Shi, S.; Liu, Z.; Li, J. Effect of Live, Frozen and Artificial Feeds on Digestive Enzymes, Aminotransferase, Histology of Liver and Intestine in Mandarin Fish Hybrid (Siniperca chuatsi ♀ × Siniperca scherzeri ♂). Isr. J. Aquac. Bamidgeh 2015, 67, 20701. [Google Scholar] [CrossRef]
  9. Shen, Y.; Li, H.; Zhao, J.; Tang, S.; Zhao, Y.; Bi, Y.; Chen, X. The Digestive System of Mandarin Fish (Siniperca chuatsi) Can Adapt to Domestication by Feeding with Artificial Diet. Aquaculture 2021, 538, 736546. [Google Scholar] [CrossRef]
  10. Chen, X.; Yi, H.; Liu, S.; Zhang, Y.; Su, Y.; Liu, X.; Bi, S.; Lai, H.; Zeng, Z.; Li, G. Probiotics Improve Eating Disorders in Mandarin Fish (Siniperca chuatsi) Induced by a Pellet Feed Diet via Stimulating Immunity and Regulating Gut Microbiota. Microorganisms 2021, 9, 1288. [Google Scholar] [CrossRef] [PubMed]
  11. Cao, Q.; Shan, H.; Zhao, J.; Deng, J.; Xu, M.; Kang, H.; Li, T.; Zhao, Y.; Liu, H.; Jiang, J. Liver Fibrosis in Fish Research: From an Immunological Perspective. Fish. Shellfish Immun. 2023, 139, 108885. [Google Scholar] [CrossRef] [PubMed]
  12. Naiel, M.A.E.; Negm, S.S.; Ghazanfar, S.; Shukry, M.; Abdelnour, S.A. The Risk Assessment of High-Fat Diet in Farmed Fish and Its Mitigation Approaches: A Review. J. Anim. Physiol. Anim. Nutr. 2023, 107, 948–969. [Google Scholar] [CrossRef] [PubMed]
  13. Sun, Y.; Deng, Q.; Zhang, Q.; Zhou, X.; Chen, R.; Li, S.; Wu, Q.; Chen, H. Hazards of Microplastics Exposure to Liver Function in Fishes: A Systematic Review and Meta-Analysis. Mar. Environ. Res. 2024, 196, 106423. [Google Scholar] [CrossRef] [PubMed]
  14. Enes, P.; Panserat, S.; Kaushik, S.; Oliva-Teles, A. Nutritional Regulation of Hepatic Glucose Metabolism in Fish. Fish Physiol. Biochem. 2009, 35, 519–539. [Google Scholar] [CrossRef] [PubMed]
  15. Sheridan, M.A. Coordinate Regulation of Feeding, Metabolism, and Growth: Perspectives from Studies in Fish. Gen. Comp. Endocrinol. 2021, 312, 113873. [Google Scholar] [CrossRef] [PubMed]
  16. Andreeva, A.M. The Strategies of Organization of the Fish Plasma Proteome: With and without Albumin. Russ. J. Mar. Biol. 2019, 45, 263–274. [Google Scholar] [CrossRef]
  17. Wang, J.; Liang, X.-F.; He, S.; Li, J.; Huang, K.; Zhang, Y.-P.; Huang, D. Lipid Deposition Pattern and Adaptive Strategy in Response to Dietary Fat in Chinese Perch (Siniperca chuatsi). Nutr. Metab. 2018, 15, 77. [Google Scholar] [CrossRef] [PubMed]
  18. Craig, S.R.; Washburn, B.S.; Gatlin, D.M. Effects of Dietary Lipids on Body Composition and Liver Function in Juvenile Red Drum, Sciaenops Ocellatus. Fish Physiol. Biochem. 1999, 21, 249–255. [Google Scholar] [CrossRef]
  19. Santos, R.F.B.; Reis, R.G.A.; Siqueira, M.S.; Silva, M.I.; Reges, J.A.U.; Braz, P.H.; Fantini-Hoag, L.; Godoy, A.C.; Honorato, C.A. Effect of Increasing Lipid Levels on Liver Metabolism, Intestinal Morphology and Production Performance of Discus Fish (Symphysodon aequifasciatus). Braz. J. Biol. 2024, 84, e284766. [Google Scholar] [CrossRef] [PubMed]
  20. Roques, S.; Deborde, C.; Richard, N.; Skiba-Cassy, S.; Moing, A.; Fauconneau, B. Metabolomics and Fish Nutrition: A Review in the Context of Sustainable Feed Development. Rev. Aquac. 2020, 12, 261–282. [Google Scholar] [CrossRef]
  21. Sun, Y.-X.; Hu, L.-S.; Dong, Y.-W. Microhabitat-Specific Diurnal Metabolomic Responses of the Intertidal Limpet Cellana toreuma to Winter Low Temperature. iScience 2023, 26, 106128. [Google Scholar] [CrossRef] [PubMed]
  22. Pu, D.; Wang, Z.; Zheng, J.; Li, P.; Wei, X.; Li, D.; Gao, L.; Zhou, L.; Wang, Y. Effects of Ammonia Stress on Liver Tissue Structure, Enzyme Activities, and Metabolome of Juvenile Largemouth Bass Micropterus salmoides. Metabolites 2024, 14, 649. [Google Scholar] [CrossRef] [PubMed]
  23. Wang, J.; Ma, L.-X.; Dong, Y.-W. Coping with Harsh Heat Environments: Molecular Adaptation of Metabolic Depression in the Intertidal Snail Echinolittorina radiata. Cell Stress Chaperones 2022, 28, 477–491. [Google Scholar] [CrossRef] [PubMed]
  24. Li, H.; Niu, S.; Pan, H.; Wang, G.; Xie, J.; Tian, J.; Zhang, K.; Xia, Y.; Li, Z.; Yu, E.; et al. Modulation of the Gut Microbiota by Processed Food and Natural Food: Evidence from the Siniperca chuatsi Microbiome. PeerJ 2024, 12, e17520. [Google Scholar] [CrossRef] [PubMed]
  25. Peng, J.; Bao, L.; Tuo, Y.; Chu, W.; Fang, H. Research Progress on Nutritional Requirements and Formulated Feeds for Siniperca: A Comprehensive Review. Fishes 2024, 9, 487. [Google Scholar] [CrossRef]
  26. Kim, Y.-O.; Oh, S.-Y.; Lee, W.-S. Feeding Ratio Affects Growth, Body Composition, and Blood Chemistry of Mandarin Fish (Siniperca scherzeri) in Recirculating Aquaculture System. Fish. Aquat. Sci. 2021, 24, 219–227. [Google Scholar] [CrossRef]
  27. Xu, D.; Xiang, X.; Li, X.; Xu, N.; Zhang, W.; Mai, K.; Ai, Q. Effects of Dietary Vegetable Oils Replacing Fish Oil on Fatty Acid Composition, Lipid Metabolism and Inflammatory Response in Adipose Tissue of Large Yellow Croaker (Larimichthys crocea). J. Mar. Sci. Eng. 2022, 10, 1760. [Google Scholar] [CrossRef]
  28. Henwood, A.F. Hematoxylin and Eosin Staining of Mucins of the Gastrointestinal Tract. J. Histotechnol. 2017, 40, 21–24. [Google Scholar] [CrossRef]
  29. Cambiaghi, A.; Ferrario, M.; Masseroli, M. Analysis of Metabolomic Data: Tools, Current Strategies and Future Challenges for Omics Data Integration. Brief. Bioinform. 2017, 18, 498–510. [Google Scholar] [CrossRef] [PubMed]
  30. Tocher, D.R. Metabolism and Functions of Lipids and Fatty Acids in Teleost Fish. Rev. Fish. Sci. 2003, 11, 107–184. [Google Scholar] [CrossRef]
  31. Xie, D.; Chen, C.; Dong, Y.; You, C.; Wang, S.; Monroig, Ó.; Tocher, D.R.; Li, Y. Regulation of Long-Chain Polyunsaturated Fatty Acid Biosynthesis in Teleost Fish. Prog. Lipid Res. 2021, 82, 101095. [Google Scholar] [CrossRef] [PubMed]
  32. Wang, K.; Song, T.; Ke, L.; Sun, Y.; Ye, J. Dietary High Levels of Coconut Oil Replacing Fish Oil Did Not Affect Growth, but Promoted Liver Lipid Deposition of Orange-Spotted Groupers (Epinephelus coioides). Animals 2024, 14, 1534. [Google Scholar] [CrossRef] [PubMed]
  33. Fu, Z.; Zhou, S.; Yu, G.; Yang, R.; Han, M.; Ma, Z. Influence of Non-Protein Diets on Hepatic Metabolism and Endocrine in Barramundi (Lates calcarifer). Front. Mar. Sci. 2021, 8, 649747. [Google Scholar] [CrossRef]
  34. Zhao, S.-B.; Wu, W.-J.; Dai, X.-F.; Zhu, L.-Y.; Lu, Y.-X.; Wu, T.-X. Effects of Substituting Palm Oil for Fish Oil and Soy Oil in Feed on the Growth Performance and Muscular Fatty Acid Composition of Pelteobagrus Vachelli. Acta Hydrobiol. Sin. 2017, 41, 1000–1009. [Google Scholar] [CrossRef]
  35. Niu, S.-H.; Li, H.-Y.; Pan, H.-J.; Xie, J.; Wang, G.-J.; Xia, Y.; Gong, W.-B. Effects of Live Prey Fish and Artificial Diet on Nutrient Compositions and Texture Properties in the Muscle of Mandarin Fish (Siniperca chuatsi). Acta Hydrobiol. Sin. 2023, 47, 37–44. [Google Scholar] [CrossRef]
  36. Zheng, J.; Yao, Y.; Rui, Q.; Zhou, Y.; Li, F.; Jiang, W.; Chi, M.; Liu, S.; Cheng, S.; Chen, J.; et al. Effect of Different Feeding Regimens on Physiological Indicators, Intestinal Transcriptome, and Bacterial Flora of Mandarin Fish (Siniperca chuatsi). Comp. Biochem. Phys. D 2024, 52, 101301. [Google Scholar] [CrossRef] [PubMed]
  37. Cheng, Z. FoxO Transcription Factors in Mitochondrial Homeostasis. Biochem. J. 2022, 479, 525–536. [Google Scholar] [CrossRef] [PubMed]
  38. Rodriguez-Colman, M.J.; Dansen, T.B.; Burgering, B.M.T. FOXO Transcription Factors as Mediators of Stress Adaptation. Nat. Rev. Mol. Cell Biol. 2024, 25, 46–64. [Google Scholar] [CrossRef] [PubMed]
  39. Herrera, M.; Herves, M.A.; Giráldez, I.; Skar, K.; Mogren, H.; Mortensen, A.; Puvanendran, V. Effects of Amino Acid Supplementations on Metabolic and Physiological Parameters in Atlantic Cod (Gadus morhua) under Stress. Fish Physiol. Biochem. 2017, 43, 591–602. [Google Scholar] [CrossRef] [PubMed]
  40. Kaur, K.; Krogdahl, Å.; Kortner, T.M. Phosphatidylcholine in Krill Meal and Krill Oil as a Source of Choline for Prevention of Intestinal Steatosis in Atlantic Salmon. Aquacu. Res. 2023, 2023, 4001633. [Google Scholar] [CrossRef]
  41. Fang, W.; Leng, X.; Yun, B.; Wang, L.; Qian, X. A Comparative Study of Natural or Artificial Feed on Physiological Health and Gut Microbiota in Mandarin Fish (Siniperca chuats). Aquac. Int. 2025, 33, 241. [Google Scholar] [CrossRef]
  42. Fei, S.; Chen, Z.; Liu, H.; Jin, J.; Yang, Y.; Han, D.; Zhu, X.; Xie, S. Dietary Carbohydrate to Lipid Ratio Affects Growth, Reproductive Performance and Health of Female Yellow Catfish (Pelteobagrus fulvidragrus): A Lipidomics Analysis. Anim. Nutr. 2024, 19, 429–441. [Google Scholar] [CrossRef] [PubMed]
Figure 1. The HE staining of the liver tissue sections and growth performance of mandarin fish in the natural live feed (NF) or artificial feed (AF) groups. (A) Gross morphology of the liver; (B) histological structure of the liver (n = 3); (C) growth performance of mandarin fish in the two groups. CF: the condition factor; HSI: hepatosomatic index; SC: swelling cells; LD: lipid droplets.
Fishes 11 00407 g001
Figure 2. Classification and correlation network of identified metabolites. (A) Classification of annotated metabolites; (B) metabolic correlation network of key differential metabolites.
Fishes 11 00407 g002
Figure 3. Metabolic profiling comparison between NF and AF groups via partial least squares-discriminant analysis (PLS-DA) and hierarchical heatmap. (A) PLS-DA score plot illustrating the overall metabolic divergence between the two groups. (B) Heatmap displaying the top 25 significantly differential metabolites between groups. Ellipses on PLS-DA score plots represent a confidence interval of 95%. In the heatmap, columns represent individual samples (n = 8 per group) and rows correspond to metabolites; the color gradient shifts from deep blue (low relative abundance, cold tone) to dark red (high relative abundance, warm tone).
Fishes 11 00407 g003
Figure 4. Relative concentration alterations of core differential metabolites. Metabolites categorized into Groups 1 to 4 were related to energy metabolism, inflammation and immunity, lipid homeostasis, steroid hormones and neurotransmitters, respectively. All metabolite datasets were log-transformed for normality and homogeneity and presented as mean ± SE (n = 8). Black circles represent outlier data points falling beyond the 1.5× interquartile range. Asterisks denote statistically significant differences between the AF and NF groups as determined by Student’s t-test: ** p < 0.01, *** p < 0.001. The “normalized concentration” on the y-axis represents the relative abundance of metabolites after sum normalization and generalized logarithm transformation, which is used for inter-group statistical comparison. Metabolite codes: PEP, Phosphoenolpyruvate; PE, Phosphatidylethanolamine; GABA, γ-aminobutyric acid.
Fishes 11 00407 g004
Figure 5. Pathways of differentially expressed metabolites between the NF and AF groups. The red box indicated metabolites whose relative concentrations were significantly higher in AF group than those in NF groups. The blue box indicated metabolites whose relative concentrations were significantly lower in the AF group than those in NF groups. Metabolite codes: HPETE, Arachidonic acid 5-hydroperoxide; THETA, Trihydroxyicosatrienoic acid; LTA4, Leukotriene A4; 5,6-EET, 5,6-Epoxyeicosatrienoic acid; PEP, Phosphoenolpyruvate.
Fishes 11 00407 g005
Figure 6. KEGG metabolic pathway analysis of metabolites for which content significantly differs between the NF and AF groups. The abscissa presents the degree of difference between groups for each pathway; the ordinate represents the name of each metabolic pathway. The degree of difference is explained by the negative log-transformed p-value. The gray lines represent the differential abundance score of 0, and the significantly higher enriched pathways in the AF group are shown on the right of the line, while the significantly higher enriched pathways in the NF group are shown on the left of the line. The color of each circle is based on the negative log-transformed p-value and the size is based on the count of DEMs.
Fishes 11 00407 g006
Table 1. Ingredient composition and proximate analysis of the artificial feed (dry matter basis).
IngredientsContent (%)Proximate CompositionContent (%)
Fish meal55.0Crude protein48.7
Soybean meal12.0Crude lipid12.3
Chicken meal8.0Crude ash16.8
Wheat flour10.0Moisture10.2
Fish oil5.0Crude fiber2.7
Soybean oil3.0
Mineral premix2.0
Vitamin premix1.0
Choline chloride0.5
Calcium dihydrogen phosphate1.5
Others2.0
Note: The vitamin and mineral premixes provide per kilogram of feed: vitamin A, 8000 IU; vitamin D3, 2000 IU; vitamin E, 150 mg; vitamin K3, 10 mg; thiamine, 20 mg; riboflavin, 20 mg; pyridoxine, 20 mg; cyanocobalamin, 0.05 mg; ascorbic acid, 500 mg; niacin, 100 mg; pantothenic acid, 50 mg; folic acid, 5 mg; biotin, 0.5 mg; Fe, 80 mg; Zn, 60 mg; Mn, 30 mg; Cu, 5 mg; Se, 0.3 mg; I, 0.8 mg.
Disclaimer/Publisher’s Note: The statements, opinions and data contained in all publications are solely those of the individual author(s) and contributor(s) and not of MDPI and/or the editor(s). MDPI and/or the editor(s) disclaim responsibility for any injury to people or property resulting from any ideas, methods, instructions or products referred to in the content.