Article

No-Take Protection Supports Richer Fish Assemblages at a Grey Nurse Shark (Carcharias taurus) Aggregation Site


1
National Marine Science Centre, Southern Cross University, Coffs Harbour, NSW 2450, Australia
2
Australian Fisheries Management Authority, Australian Government, Canberra, ACT 2609, Australia
*
Author to whom correspondence should be addressed.
Fishes 2026, 11(7), 408; https://doi.org/10.3390/fishes11070408
Submission received: 5 June 2026 / Revised: 2 July 2026 / Accepted: 7 July 2026 / Published: 9 July 2026

Abstract

No-take Marine Protected Areas (MPAs) are widely used to conserve biodiversity and rebuild fish populations, but their ecological benefits can vary among locations and habitats. Cod Grounds Marine Park protects a key aggregation site for the critically endangered grey nurse shark (Carcharias taurus), providing an opportunity to assess whether no-take protection is associated with enhanced fish assemblages and prey availability. Fish communities were surveyed using baited remote underwater video systems (BRUVs) at protected and nearby fished reefs across seven sampling periods between 2015 and 2018. Protected reefs supported different assemblages, as well as approximately 9% more species and 50% greater fish abundance than fished reefs. Species identified as potential grey nurse shark prey were approximately 55% more abundant inside the reserve, and grey nurse sharks were recorded exclusively within the marine park. In contrast, water temperature and variation in compliance effort explained little variation in fish assemblage metrics. These findings highlight the ecological value of protecting key aggregation habitat for grey nurse sharkss by supporting richer reef fish communities and greater prey availability.
Key Contribution: This study demonstrates that a small offshore no-take reserve supports richer and more abundant fish assemblages than adjacent fished reefs and may enhance prey resources for the critically endangered grey nurse shark (Carcharias taurus).

1. Introduction

Fishing pressure and habitat degradation have driven widespread declines in marine biodiversity and altered ecosystem structure across coastal systems worldwide [1,2]. Marine Protected Areas (MPAs), particularly no-take reserves, are widely implemented to conserve biodiversity and rebuild ecosystem function [3,4]. Numerous studies demonstrate that no-take spatial protection can increase fish biomass [5], species richness [6], and the abundance of exploited species [7] while also enhancing ecosystem resilience to climate-driven changes such as tropicalisation [8,9]. However, ecological responses to protection vary among locations, habitats, and taxa [10,11]. The effectiveness of no-take MPAs is influenced by factors such as reserve size and age, habitat quality, connectivity, fishing pressure in surrounding areas, and levels of compliance and enforcement [12,13,14,15,16], highlighting the importance of site-specific evaluations.
Beyond rebuilding exploited fish populations, marine reserves can influence ecosystem structure and habitat quality for higher trophic level predators by increasing prey availability and reducing fishing mortality [8,17]. The grey nurse shark Carcharias taurus, also known as the sand tiger or ragged-tooth shark, is a predator of conservation concern and is globally listed as Critically Endangered on the IUCN Red List [18]. The east Australian population was listed as Critically Endangered following severe declines since the 1960s [19], mainly attributed to fishing mortality, including targeted capture, bycatch and post-release mortality from incidental hooking, spearfishing, and protective beach meshing programs [20,21,22]. Recovery potential is further constrained by life-history characteristics, such as slow growth, late maturity, and low reproductive output [23], as well as emerging pressures such as climate-related reductions in reproductive success [24].
Along the east coast of Australia, grey nurse sharks exhibit transient movements but strong site fidelity, forming aggregations at several inshore rocky reef habitats [25]. These aggregation sites provide shelter and support important life-history stages [26], yet many are also popular sites for fishing and recreational diving [27]. To reduce fishing pressure and protect critical habitat, no-take MPAs were established around several key aggregation sites [28,29]. While such protection reduces direct fishing mortality, the conservation value of these areas may also depend on their ability to sustain prey resources and maintain ecological processes that support foraging opportunities. Evaluating fish assemblages and prey availability within protected habitats is therefore important for understanding the broader ecological role of marine reserves in supporting grey nurse shark recovery.
Despite the recognised importance of grey nurse shark aggregation sites, relatively few studies have examined whether no-take protection influences fish assemblages and prey availability at these locations. The present study used baited remote underwater video systems (BRUVs) to compare fish assemblage structure, species richness, and the abundance of grey nurse shark prey between areas inside the Cod Grounds Marine Park and nearby reefs open to fishing. Environmental conditions and compliance records were also considered to assess whether differences between protected and fished reefs could be explained by factors other than protection. We hypothesised that protected reefs would support higher fish richness, greater overall abundance, and increased availability of shark prey.

2. Materials and Methods

2.1. Study Area and Sampling Design

The study was carried out at Cod Grounds Marine Park, a no-take marine reserve located in temperate waters approximately 5.5 km offshore from the mid-north coast of New South Wales (NSW), Australia (31°40′ S, 152°48′ E) (Figure 1). The 4 km2 reserve protects a series of submerged rocky pinnacles that occur at depths of approximately 20–40 m and represent an important aggregation site for the critically endangered grey nurse shark (C. taurus). In 2018, the park boundaries were slightly expanded and the zoning classification revised to a National Park zone (IUCN category II), while maintaining prohibition of extractive activities [30].
Surveys were conducted during seven sampling periods: April 2015, March and September 2016, April and August 2017, and April and August 2018. Eight study sites were selected using high-resolution bathymetric mapping to locate appropriate reef habitat (Figure 1). The location of sampling sites was constrained by the distribution of suitable reef habitat within and adjacent to the relatively small marine park. During the first sampling period, three sites within the marine park and four reference sites were surveyed. From the second sampling period onwards, an additional protected site was incorporated, resulting in four protected and four reference sites for all subsequent surveys.
Fish communities were sampled using baited remote underwater video (BRUV) systems, a non-destructive method widely used to assess fish assemblage composition and relative abundance on temperate reefs [31]. BRUVs are particularly suitable for deeper habitats and high-conservation areas where diver-based surveys are logistically challenging or undesirable [32]. Four replicate BRUVs were deployed at each sampling site, with deployments spaced 75–200 m apart. Each BRUV consisted of a steel frame supporting a video camera oriented towards a bait bag attached to a 1.5 m bait arm. Approximately 500 g of pilchards (Sardinops spp.) were used as bait, which has been shown to produce consistent responses in reef BRUV studies [33]. Deployments lasted a minimum of 30 min plus soaking time, which provides representative estimates of rocky reef fish assemblages [34]. Video deployments with obstructed views or poor bait visibility were excluded and repeated to ensure data quality.
Environmental variables were measured during surveys from 2016 to 2018. Water temperature, salinity and pH were measured using calibrated field instrumentation (HQ40d multimeter, Hach Pacific, Penrith, NSW, Australia), while water clarity was estimated using replicate Secchi disc deployments at each site.

2.2. Video Analysis and Response Variables

Video footage was analysed to identify fish species and quantify relative abundance. Abundance was estimated using the MaxN metric, defined as the maximum number of individuals of a species observed simultaneously within a single video frame during a deployment. This conservative metric reduces the likelihood of repeatedly counting the same individuals [35]. For each deployment, species richness and total fish abundance were calculated. Species occurrence was calculated as the percentage of site surveys in which a species was detected, with a species considered present if it was recorded in at least one of the four BRUV deployments conducted at a site during a sampling period. Additional response variables were derived by summing MaxN values across ecologically relevant groupings, including fisheries-target species, non-target species, elasmobranchs, including grey nurse sharks, and species identified as potential prey of grey nurse sharks. Analyses were also conducted on the most abundant families to explore patterns among dominant taxonomic groups.
Target species were defined according to regional fisheries stock status reports and recreational fishing guides for New South Wales and Queensland [36,37]. All remaining taxa were classified as non-target species. Grey nurse shark prey species were identified from published dietary records for the east Australian population of the species [38]. These include elasmobranch species as well as demersal and pelagic teleost primary to tertiary consumers. Given limited information on the diet of grey nurse sharks in eastern Australia, prey classifications were treated as indicative rather than exhaustive.
To evaluate whether enforcement effort influenced ecological responses within the marine park, compliance information was also compiled for the study period. Compliance metrics were obtained from marine park compliance records and included the number of enforcement patrols (aerial and vessel-based) and the number of enforcement actions (i.e., infringement notices and written cautions) recorded between sampling periods.

2.3. Statistical Analysis

Highly abundant mid-water schooling planktivores, including mado (Atypichthys strigatus), one-spot puller (Chromis hypsilepis) and yellowtail scad (Trachurus novaezelandiae), were excluded from all analyses because their patchy distribution and schooling behaviour can obscure patterns in reef-associated assemblages.
Multivariate differences in fish assemblage composition were tested using permutational multivariate analysis of variance (PERMANOVA) [39] based on Bray–Curtis similarity matrices calculated from log(x + 1) transformed MaxN data. Analyses included Zone (marine park vs. fished reefs; fixed), Time (seven sampling periods; random), and Site nested within Zone (random). Analyses were conducted in PRIMER v7 with the PERMANOVA+ add-on using 9999 permutations. Where significant interactions occurred, pairwise tests were used to examine differences among factor levels. Non-metric multidimensional scaling (nMDS) was used to visualise patterns in assemblage structure. Similarity percentage (SIMPER) analysis based on log(x + 1) transformed abundance data was used to identify species contributing most to differences between zones. Univariate response variables including species richness, total fish abundance, and abundance of important groups were analysed using PERMANOVA based on Euclidean distance matrices calculated from log(x + 1) transformed data. Because one protected site was added after the first sampling period, the dataset was slightly unbalanced. PERMANOVA is relatively robust for unbalanced sampling designs, allowing all available observations to be retained in the analyses.
The relationship between grey nurse shark abundance and prey abundance was examined using Pearson correlation analysis. Mean abundance of grey nurse sharks and potential prey species was calculated for each sampling period within the marine park, and correlations were used to assess whether periods of higher prey abundance were associated with greater shark abundance.
Environmental influences on fish assemblage metrics were assessed using linear mixed-effect models (LMMs) fitted in R [40] using the lme4 package. Response variables (species richness, total abundance, target species abundance, non-target species abundance, and grey nurse shark prey abundance) were averaged at the site level for each sampling period to match the resolution of environmental predictors. Models included Zone (marine park vs. fished), Temperature, and Water clarity as fixed effects, with Time included as a random effect. Prior to analysis, environmental predictors were examined for collinearity using Pearson correlation coefficients. Temperature was moderately correlated with salinity (r = 0.72) and pH (r = −0.66), while clarity showed weak correlations with other variables (r < 0.40). To avoid multicollinearity and reduce model complexity, only temperature and clarity were retained for analysis. Response variables were log(x + 1) transformed where necessary to improve normality and homogeneity of variance.
Compliance metrics (i.e., patrol effort and enforcement actions) were available only at the sampling-period level within the marine park. To match this resolution, species richness, total abundance, target species abundance, and grey nurse shark prey abundance were averaged across sites within each sampling period. Simple linear models (LMs) were then used to examine relationships between compliance metrics and fish assemblage responses.

3. Results

3.1. Fish Assemblage Composition

Across 220 BRUV deployments conducted between 2015 and 2018, a total of 114 fish species from 54 families were recorded (see Table S1 for complete list). Species accumulation curves indicated broadly comparable sampling completeness inside and outside the Cod Grounds Marine Park (Figure S1). The most species-rich families were Labridae (17 species), Serranidae (7), Monacanthidae (6), Carangidae (5), and Cheilodactylidae (4), whereas the remaining families were represented by three species (9 families), two species (8 families), or a single species (31 families).
In terms of abundance, the most dominant families were Kyphosidae (drummers), Labridae (wrasses), Sparidae (breams), and Carangidae (jacks). The most abundant species overall were silver sweep (Scorpis lineolata), snapper (Chrysophrys auratus), southern maori wrasse (Ophthalmolepis lineolatus), silver trevally (Pseudocaranx dentex), and half-banded seaperch (Hypoplectrodes maccullochi) (Table 1). Dominant species were consistently recorded across most deployments inside and outside the marine park, with differences primarily reflected in mean abundance rather than occurrence (Table 1).
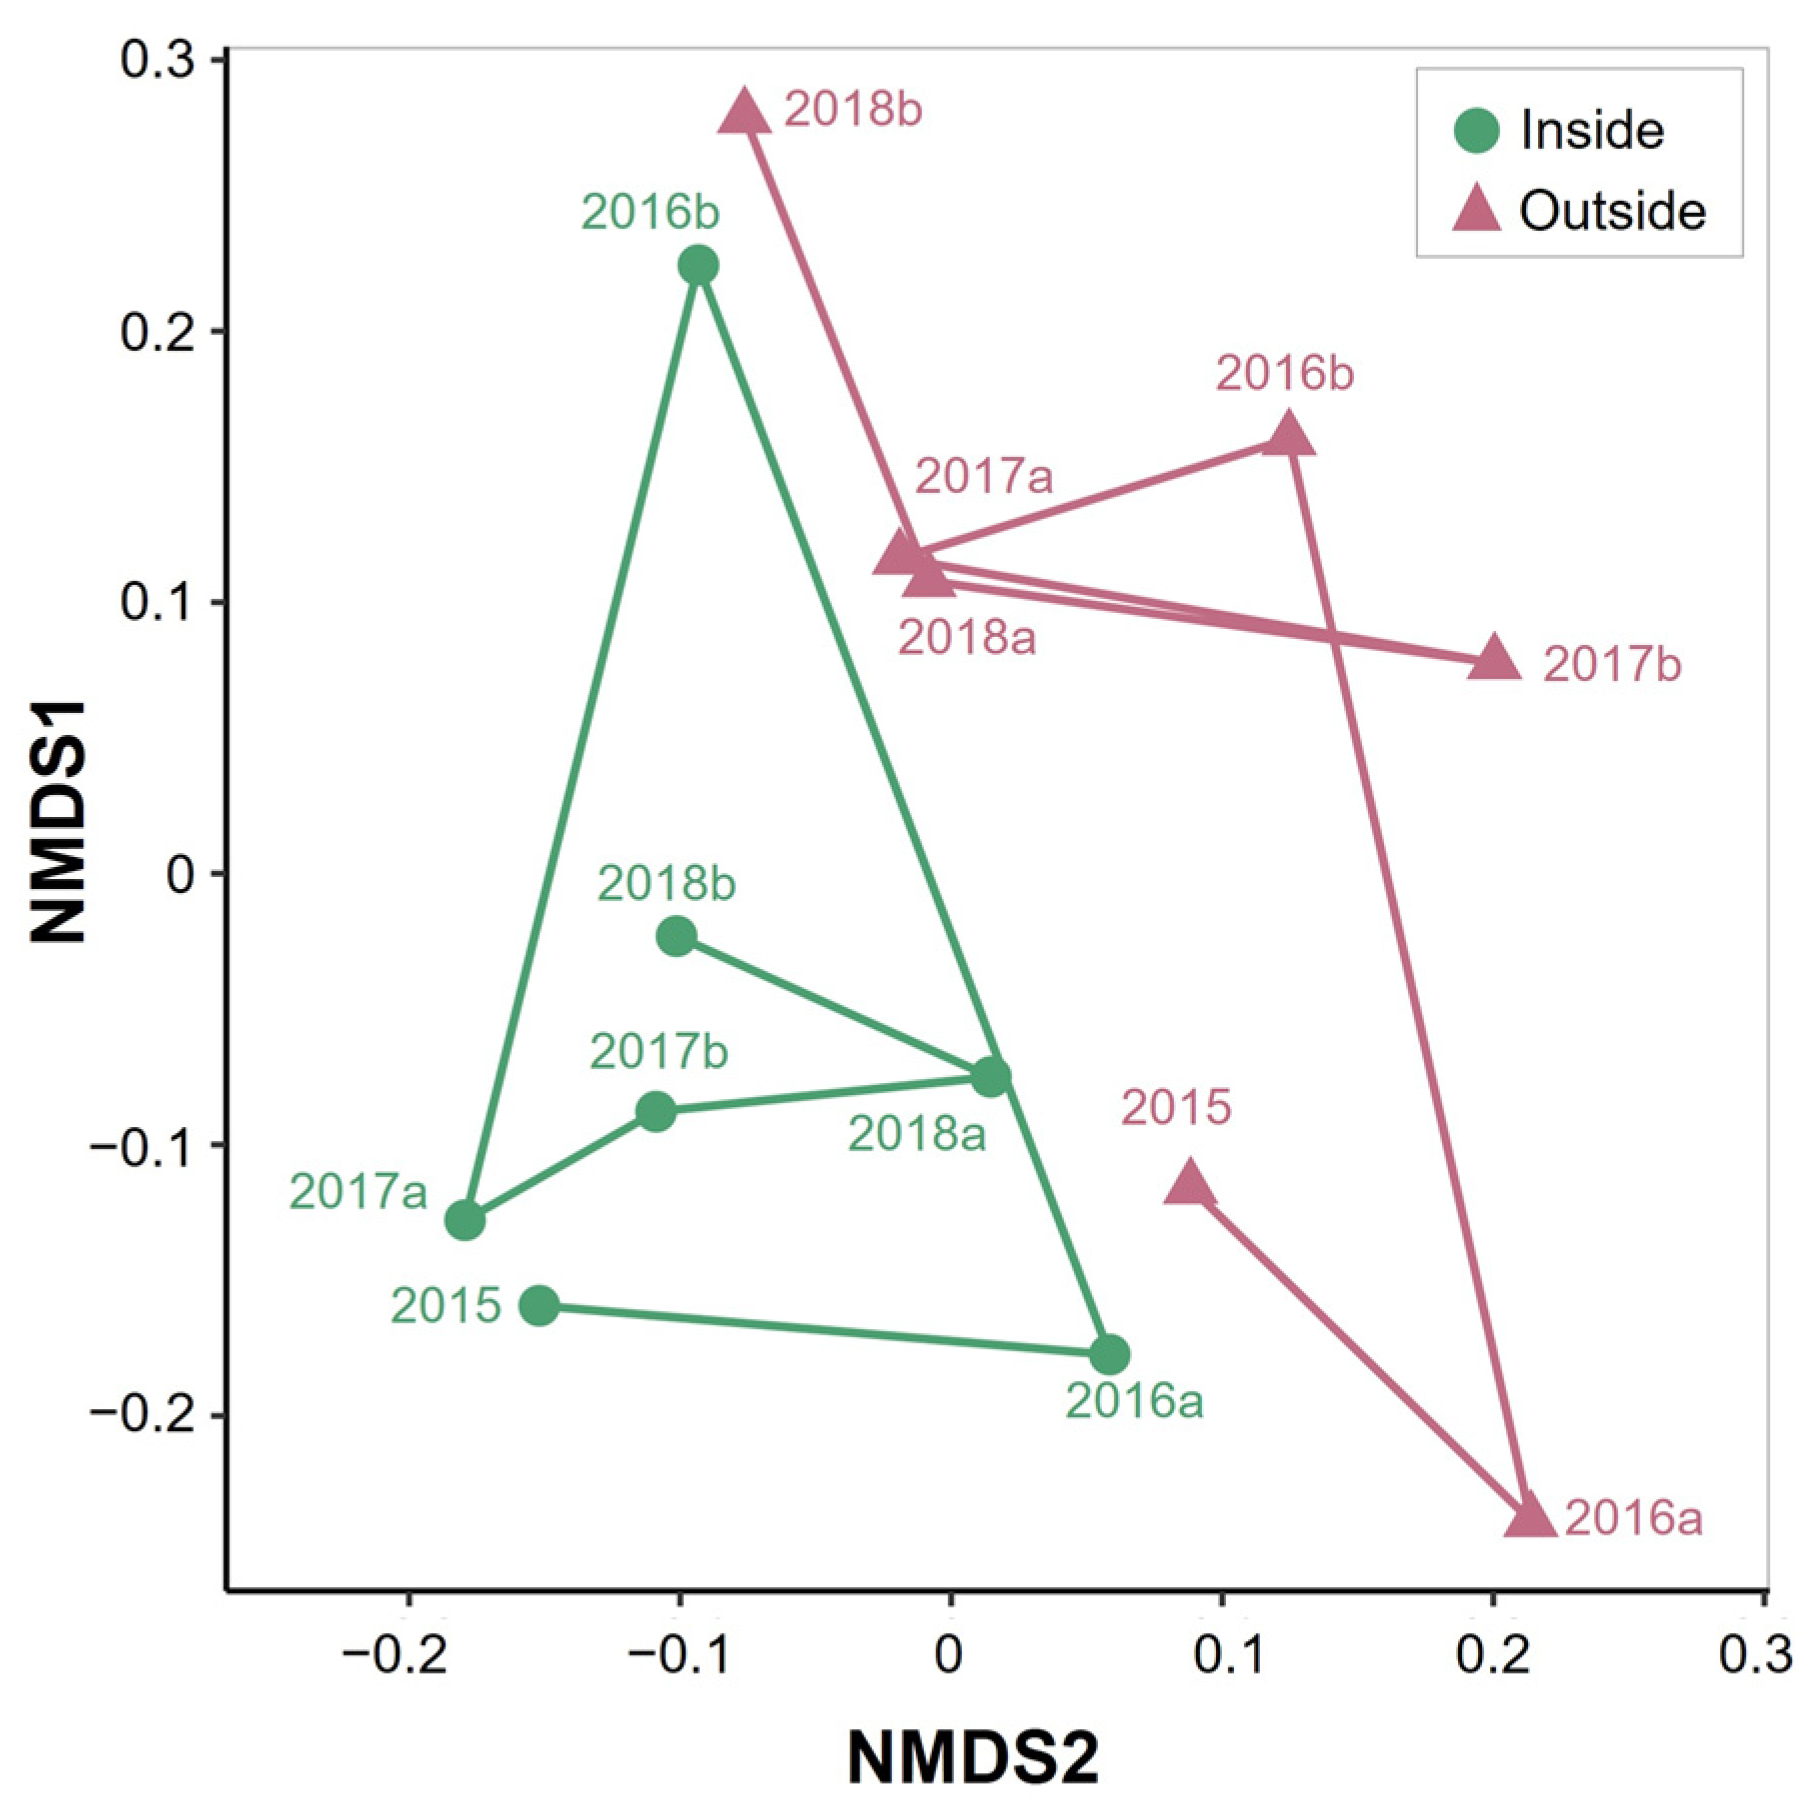
Multivariate analyses detected significant differences in assemblage composition between reefs inside and outside the marine park (PERMANOVA, Zone: p < 0.05; Table 2). The magnitude of these differences varied among sampling periods (Time × Zone: p < 0.05). Ordination of community structure using nMDS showed a clear separation between fish assemblages inside and outside the marine park (Figure 2). Temporal trajectories within the marine park were more constrained and clustered through time, whereas assemblages from outside the marine park showed greater dispersion among sampling periods. Pairwise comparisons showed significant differences between zones in March and September 2016 (p = 0.03 for both periods), with similar but weaker patterns observed during other sampling periods. SIMPER analysis indicated that differences in assemblage structure between inside and outside the marine park were primarily driven by a small number of species. Silver sweep (S. lineolata; contribution: 9.9%), snapper (C. auratus; 4.9%), and painted wrasse (Coris picta; 3.8%) were more abundant inside the marine park, whereas silver trevally (P. dentex; 4.5%) and green moray (G. prasinus; 3.6%) were more abundant in fished areas. Together these species accounted for approximately 27% of total dissimilarity.

3.2. Univariate Community Metrics

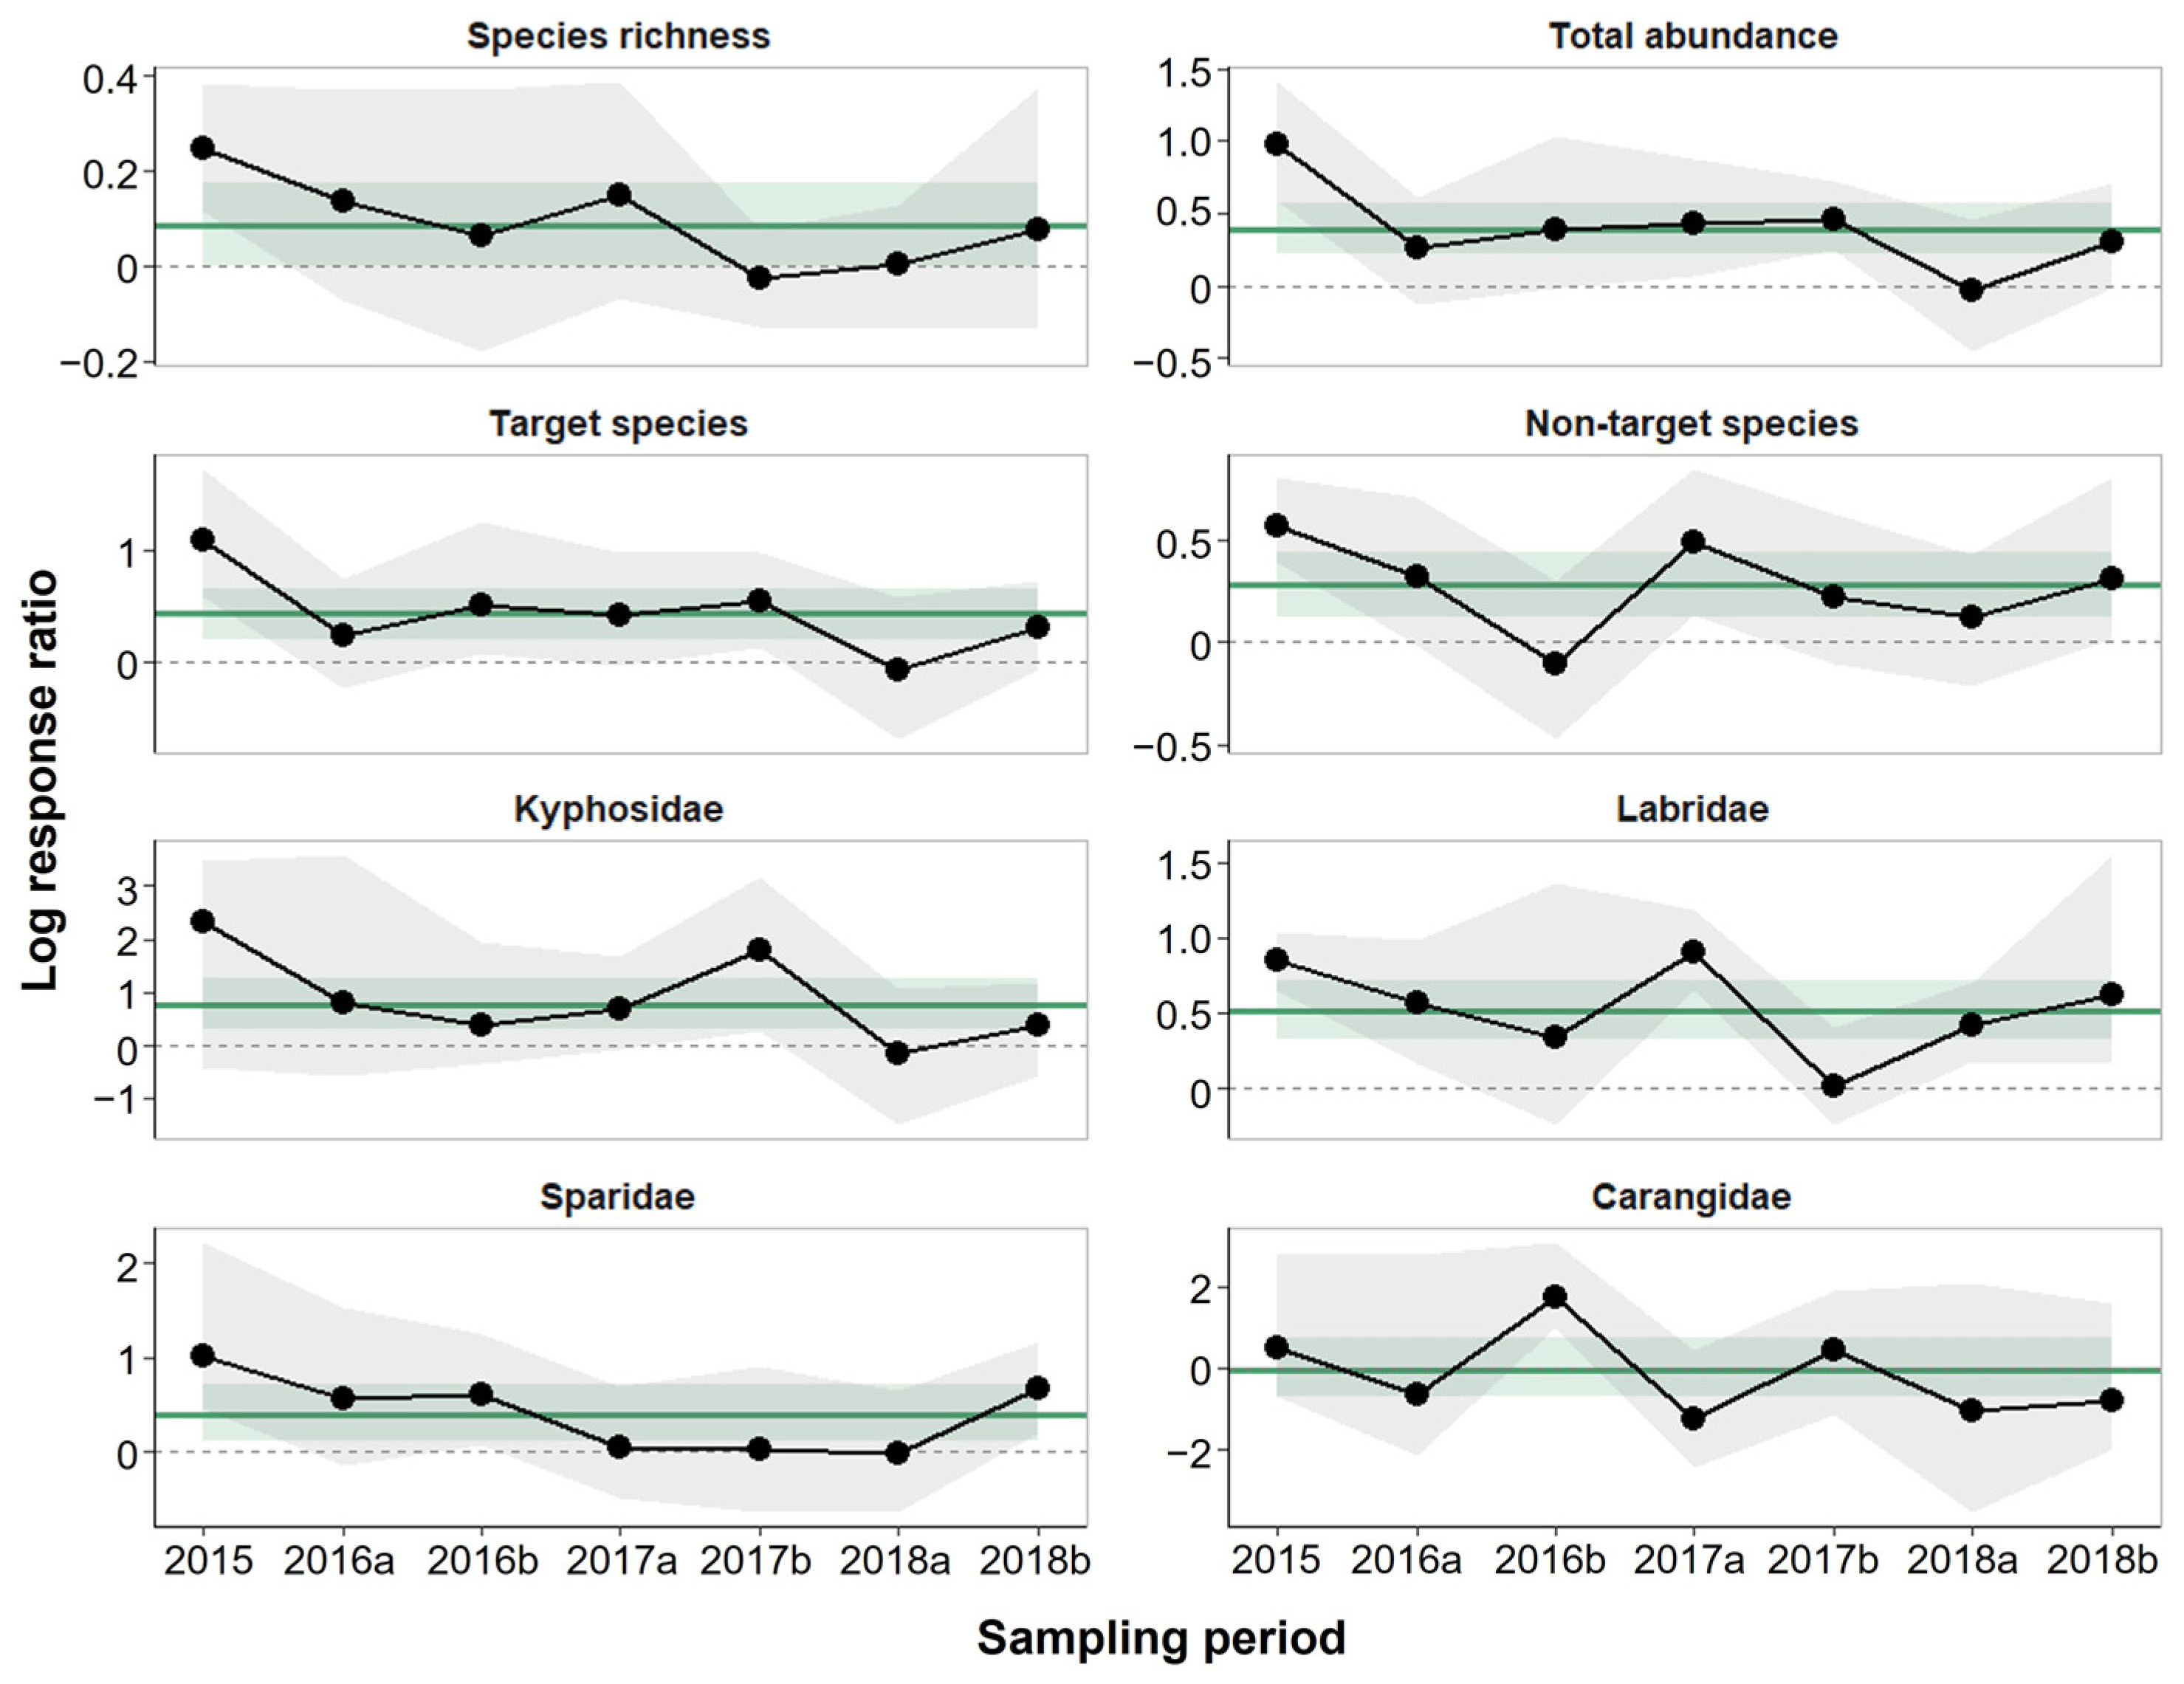
Univariate analyses revealed consistently positive responses of fish populations to marine park protection, with the strongest effects observed for total abundance and target species (Figure 3).
Both species richness and total fish abundance were significantly higher inside than outside the marine park (Zone: p < 0.05 and p < 0.001, respectively; Table 2). On average, protected reefs supported 9% more species (mean per site ± SE: 15.18 ± 0.36 inside the marine park vs. 13.72 ± 0.61 outside) and 50% greater total fish abundance (50.76 ± 1.96 vs. 32.58 ± 3.63) (Figure 3). Although some temporal variability occurred, these differences remained consistent across sampling periods (Time × Zone: p > 0.05).
Target species exhibited the strongest response to protection, with significantly higher abundance inside than outside the marine park across most sampling periods (p < 0.01; Table 2). Non-target species were also significantly more abundant within protected reefs (p < 0.05), although the magnitude of this response was smaller (Figure 3).
Responses among major taxonomic groups were more variable (Figure 3). Labridae (mean ± SE: 7.44 ± 0.40 inside the marine park vs. 4.42 ± 0.40 outside) and Sparidae (4.39 ± 0.29 vs. 2.89 ± 0.43) were significantly more abundant inside the marine park. Kyphosidae also showed substantially higher abundance on protected reefs (18.55 ± 2.99 vs. 8.49 ± 1.59), although this response was not consistent across all sampling periods (Figure 3). In contrast, Carangidae showed little overall difference between zones (2.86 ± 0.63 vs. 2.89 ± 0.92; p > 0.05), while abundance varied significantly through time (Time × Zone: p < 0.01), with differences detected only in September 2016 (2016b; p = 0.03).

3.3. Elasmobranchs, Grey Nurse Sharks, and Potential Prey

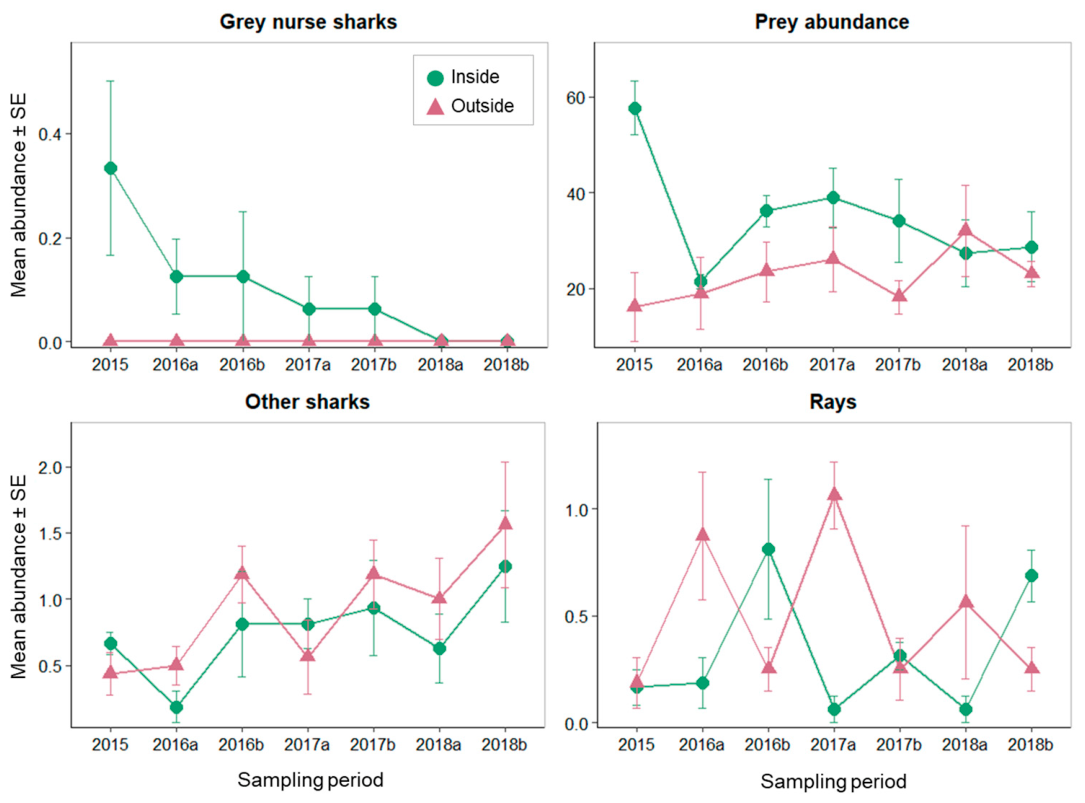
Overall, 20 elasmobranch species were recorded throughout the study (Table 3). The shark assemblages were dominated by benthic reef-associated species, including Port Jackson sharks (Heterodontus portusjacksoni) and wobbegongs (Orectolobus spp.). Rays were primarily represented by stingrays (Dasyatis brevicaudata), fiddler rays (Trygonorrhina fasciata), and coffin rays (Hypnos monopterygium). PERMANOVA tests for sharks (excluding grey nurse sharks) detected a significant effect of Time, but no overall effect of Zone (Table 2). For rays, a significant Time × Zone interaction was detected (Table 2), with post hoc comparisons indicating significant differences between areas inside and outside the marine park in three sampling periods (2016a, 2017a, 2018b; Figure 4), although no consistent overall difference between zones was observed. Elasmobranch richness was low across all sampling periods and closely tracked abundance (correlation coefficient r > 0.98).
Grey nurse sharks (C. taurus) were recorded exclusively within the Cod Grounds Marine Park, with no individuals observed at reference sites (Figure 4). Abundance declined across sampling periods, and no sharks were recorded during the final survey. PERMANOVA tests indicated a significant Time × Zone interaction (p = 0.05; Table 2).
Within the marine park, grey nurse shark abundance was positively correlated with prey abundance across sampling periods (r = 0.78, p = 0.037). Species identified as potential grey nurse shark prey were significantly more abundant within the marine park than outside (Table 2, Figure 4), representing a difference of approximately 55%. In total, 32 potential prey species from 22 families were recorded across the study, with species such as silver sweep (S. lineolata), snapper (C. auratus), silver trevally (P. dentex), and Eastern red scorpionfish (Scorpaena cardinalis) among the most abundant. Overall, 60% (19) of the prey species were also identified as taxa targeted by fishers.

3.4. Environmental Drivers of Fish Community Structure

Water temperature and water clarity varied among sampling periods, with temperatures approximately 5 °C higher during autumn (March–April; 24.0 ± 0.6 °C) than spring (August–September; 18.5 ± 0.2 °C). However, environmental variables explained little variation in fish assemblage metrics. Neither temperature nor water clarity were significant predictors of species richness, total abundance, target species abundance, non-target species abundance, or grey nurse shark prey abundance (Table 4).
In contrast and consistent with PERMANOVA results, Zone remained a significant predictor of several response variables when included in the same models, with higher abundance of total, target, non-target, and prey taxa observed within the marine park, while species richness did not differ significantly (Table 4).

3.5. Compliance and Enforcement

Compliance effort varied among sampling periods (9–31 patrols and 0–14 actions per period) but showed no clear relationship with ecological responses within the marine park. Patrol effort was not related to total abundance (R2 = 0.04, p = 0.69), species richness (R2 = 0.08, p = 0.58), target species abundance (R2 = 0.05, p = 0.68), or prey abundance (R2 = 0.04, p = 0.72). Enforcement actions also had non-significant relationships with response variables, including total abundance of fishes (R2 = 0.45, p = 0.15) and species richness (R2 = 0.31, p = 0.25).

4. Discussion

4.1. Fish Assemblages

Fish assemblages at Cod Grounds Marine Park were consistently richer and more abundant than those at nearby reefs open to fishing. Protected reefs supported approximately 9% more species and 50% greater total abundance. It is possible that the reserve was established in an area that initially supported higher fish abundance, as no baseline surveys were conducted prior to the establishment of the marine park. Consequently, some of the observed differences between reefs inside and outside the marine park may reflect pre-existing ecological variation in addition to the effects of protection. This interpretation is further complicated by the limited availability of comparable reef habitat, slightly shallower reference sites, and the relatively small size of Cod Grounds Marine Park, which constrained the spatial arrangement of survey sites. Nevertheless, the magnitude and persistence of differences observed between protected and reference reefs align with patterns reported by no-take reserves along the NSW coast and globally [32,41,42,43]. While protection status remained a significant predictor of several response variables, water temperature and clarity did not explain variation in fish assemblage metrics, suggesting that short-term variation in the environmental variables measured during this study was unlikely to be the primary driver of the observed differences between protected and fished reefs. However, more frequent sampling over longer timeframes would be required to fully assess the influence of seasonal and interannual environmental variability.
The strongest response to no-take protection occurred among fisheries-targeted taxa, such as snapper (C. auratus) and yellowtail kingfish (S. lalandi), which were consistently more abundant within the marine park than on adjacent reefs. This pattern is widely reported in similar marine reserves [43,44] and likely reflects reduced fishing mortality following protection [14]. Differences between protected and fished areas may also be amplified by spatial patterns of fishing effort. Density-dependent emigration from protected reefs can create spillover of fishes across reserve boundaries, which in turn can attract concentrated fishing activity along reserve edges [45]. This behaviour, often referred to as “fishing the line”, can reduce fish abundance immediately outside reserve boundaries where fishing effort becomes spatially concentrated [46].
Although responses were strongest among targeted taxa, non-target species were also more abundant inside the marine park, suggesting that protection influences broader ecological processes beyond direct reductions in fishing mortality. Indirect responses may arise through changes in trophic interactions and behavioural dynamics within reef assemblages, potentially producing cascading effects on fish communities and habitats [5,8]. For example, recovery of predatory fishes inside no-take reserves can reduce the abundance of grazing sea urchins, which in turn can facilitate increases in macroalgal cover and habitat quality [47].
Protection alone does not guarantee strong ecological outcomes in marine protected areas. Global analyses show that the most effective reserves combine several additional characteristics, including adequate size, sufficient age, isolation, and effective management [14]. Among these, compliance and enforcement are widely recognised as critical determinants of reserve performance [48] as illegal fishing can substantially erode ecological benefits by reducing biomass and altering community structure [49,50]. At Cod Grounds, however, variation in patrol effort and enforcement actions showed no clear relationship with ecological metrics. Rather than indicating that compliance is unimportant, this suggests that enforcement was likely sufficient to maintain the effectiveness of protection throughout the study period. In addition, patrol and enforcement records may reflect variation in management activity rather than actual illegal fishing pressure [51], and any ecological responses to changes in compliance are likely to occur over longer timeframes than those examined here. For a relatively small, discrete offshore reserve such as Cod Grounds Marine Park, consistently adequate compliance may therefore be more important than short-term fluctuations in enforcement effort.

4.2. Elasmobranch Assemblages

Elasmobranchs recorded at Cod Grounds included several shark and ray species typical of temperate rocky reefs, dominated by benthic reef-associated taxa such as wobbegongs (Orectolobus spp.), and several batoids including stingrays (D. brevicaudata). Despite substantial differences in teleost fish assemblages between reefs inside and outside the marine park, the broader elasmobranch assemblage showed limited responses to protection.
Sharks (excluding grey nurse sharks) varied significantly through time but showed no overall difference between protected and fished reefs. Some of the most abundant taxa, including wobbegongs and carpet sharks, are benthic reef-associated species that often show relatively strong site attachment [52] and experience comparatively low fishing pressure. For such species, marine park protection may not necessarily produce strong changes in abundance, if fishing mortality is already limited. At the same time, many pelagic sharks, such as tiger or whaler sharks, undertake movements spanning hundreds of square kilometres [53], far exceeding the 4 km2 area of the Cod Grounds reserve. Effective protection of many elasmobranch species may require relatively large or connected marine protected areas to encompass their broader habitat use [54]. Consistent with this, the Great Barrier Reef Marine Park has been shown to support higher shark abundance than nearby areas open to fishing, although responses are mostly species-specific [55]. Habitat associations may further influence these patterns. Some benthic sharks, such as wobbegongs, occur across a wide range of reef conditions and can persist in degraded habitats such as boulder barrens or artificial reef structures [56]. If these species are less dependent on high-quality reef habitat, differences in habitat condition between reefs inside and outside the marine park may exert weaker influences on their distribution.
Rays displayed a different pattern, where greater abundances fluctuated between inside and outside the marine park, with fished areas showing relatively higher abundance in spring and no-take areas higher abundance in autumn. Many ray species follow seasonal patterns of abundance [57], where movements are often linked to temperature shifts, prey availability, or reproductive behaviour [58]. Recurring movements in and out of protected areas have been observed previously and may be associated with habitat requirements of specific life-history stages [59]. These seasonal movements may therefore obscure potential protection effects if individuals regularly move between protected and fished reefs throughout the year.

4.3. Grey Nurse Sharks and Prey

In contrast to the broader elasmobranch assemblage, grey nurse sharks (C. taurus) were recorded exclusively within the marine park, reinforcing the importance of Cod Grounds as an aggregation site for the critically endangered east Australian population [60]. Although detections declined over the study period and no sharks were recorded during the final survey, non-detection during individual BRUV surveys does not necessarily indicate that grey nurse sharks were absent from the marine park. However, grey nurse sharks were never recorded at any of the four reference sites despite repeated surveys across seven sampling periods, suggesting that these adjacent fished reefs were used considerably less frequently than the protected aggregation site.
The grey nurse sharks’ strong site fidelity, combined with frequent movements among aggregation sites, may help explain this pattern. Detection probability is likely influenced by the species’ relatively low population size, seasonal differences in site use among males, females, and juveniles, and the short residence times of individuals at aggregation sites. Tagged grey nurse sharks have been shown to occupy Cod Grounds throughout much of the year, but individuals typically remain for less than a week at a time [38]. The most recent population assessment estimated approximately 1420 adults on Australia’s east coast [61], indicating that the species remains rare despite evidence of recent recovery [62].
Prey species of grey nurse sharks were significantly more abundant inside the marine park, with protected reefs averaging 55% higher prey abundance. Many species consumed by grey nurse sharks are also targeted by fishers, suggesting that the higher prey availability observed inside the marine park reflects the same reduction in fishing mortality that structured overall fish assemblages. In this context, marine park protection may benefit grey nurse sharks indirectly by reducing competition with fisheries for food, while simultaneously lowering the risk of direct capture or incidental hooking [63]. The positive correlation observed between prey abundance and grey nurse shark detections is consistent with the hypothesis that prey availability contributes to habitat use at Cod Grounds Marine Park. However, as this relationship is correlative, other factors including seasonal movements, population dynamics, and broader environmental variability may also influence grey nurse shark occurrence.
Despite additional prey availability, grey nurse sharks are highly mobile and frequently move between protected and fished areas [64,65]. Fishing pressure in areas adjacent to reserves may therefore still pose risks through incidental hooking or bycatch. Earlier population viability analyses predicted that without reductions in fishing mortality the east Australian population could decline towards quasi-extinction within a few decades, highlighting the sensitivity of this species to even low levels of additional mortality [66]. Small reserves centred on known aggregation sites can provide important protection of critical habitat, but broader spatial management may further enhance conservation outcomes. Networks of interconnected protected areas or buffer zones around key aggregation sites may reduce exposure to fishing mortality for seasonally resident, site-faithful species such as the grey nurse shark [53]. However, longer-term recovery constraints for elasmobranchs are not limited to fishing mortality alone. Warming-associated reproductive and fertility impacts could further constrain recovery for low fecundity species [24], reinforcing the importance of protecting the highest-quality habitats and reducing avoidable mortality wherever possible.

5. Conclusions

This study provides site-specific evidence that no-take protection at Cod Grounds Marine Park is associated with consistently richer and more abundant reef fish assemblages, with especially strong responses among fisheries-targeted species. Grey nurse sharks were detected exclusively within the protected area during surveys, and prey taxa were significantly more abundant inside the reserve. Although grey nurse shark detections declined over the study period, their complete absence from adjacent reference reefs suggests that Cod Grounds Marine Park continues to function as an important aggregation site for the species. These findings indicate that Cod Grounds Marine Park supports productive reef fish communities while protecting an important aggregation site for grey nurse sharks. However, the temporal decline in shark detections also highlights that local protection alone is unlikely to determine patterns of site use, emphasising the importance of broader-scale conservation measures for this highly mobile species.

Supplementary Materials

The following supporting information can be downloaded at https://www.mdpi.com/article/10.3390/fishes11070408/s1, Figure S1: Species accumulation curves for BRUV surveys inside (green) and outside (pink) Cod Grounds Marine Park, showing cumulative species richness with increasing sampling effort. Shaded areas represent standard deviation from 1000 random permutations.; Table S1: Mean abundance (MaxN ± SE) of all fish species recorded inside (Marine park) and outside (Fished areas) Cod Grounds Marine Park. Values represent site-level means, averaged across BRUV replicates and sampling periods.

Author Contributions

Conceptualization, B.P.K.; Methodology, B.P.K.; Software, B.P.K. and L.T.M.; Validation, L.T.M., B.P.K., E.J.P. and A.T.; Formal Analysis, B.P.K., L.T.M. and E.J.P.; Investigation, L.T.M., B.P.K., E.J.P. and A.T.; Resources, B.P.K. and E.J.P.; Data Curation, E.J.P. and A.T.; Writing—Original Draft Preparation, L.T.M. and B.P.K.; Writing—Review and Editing, L.T.M., B.P.K., E.J.P. and A.T.; Visualization, L.T.M.; Supervision, B.P.K.; Project Administration, B.P.K.; Funding Acquisition, B.P.K. All authors have read and agreed to the published version of the manuscript.

Funding

This research was funded by Parks Australia.

Data Availability Statement

The data presented in this study are available from the corresponding author upon request.

Acknowledgments

We thank Dylon Grogen, Rick Tate, and Jamie David for assistance with fieldwork. We also thank John Prichard, Emily Harris, Cath Sampson, Candace McBride, David Morris, John Lloyd, and Andrew Read for their contributions to the study’s conception and design, and for providing helpful comments on earlier drafts.

Conflicts of Interest

The authors declare no conflicts of interest.

Abbreviations

The following abbreviations are used in this manuscript:
BRUVBaited Remote Underwater Video
IUCNInternational Union for Conservation of Nature
LMMLinear Mixed-Effects Model
MaxNMaximum number of individuals observed simultaneously in a video frame
MPAMarine Protected Area
nMDSNon-metric Multidimensional Scaling
NSWNew South Wales
PERMANOVAPermutational Multivariate Analysis of Variance
SIMPERSimilarity Percentage Analysis

References

  1. Halpern, B.S.; Walbridge, S.; Selkoe, K.A.; Kappel, C.V.; Micheli, F.; D’Agrosa, C.; Bruno, J.F.; Casey, K.S.; Ebert, C.; Fox, H.E.; et al. A Global Map of Human Impact on Marine Ecosystems. Science 2008, 319, 948–952. [Google Scholar] [CrossRef] [PubMed]
  2. O’hara, C.C.; Frazier, M.; Halpern, B.S. At-Risk Marine Biodiversity Faces Extensive, Expanding, and Intensifying Human Impacts. Science 2021, 372, 84–87. [Google Scholar] [CrossRef] [PubMed]
  3. Costello, M.J. Long Live Marine Reserves: A Review of Experiences and Benefits. Biol. Conserv. 2014, 176, 289–296. [Google Scholar] [CrossRef]
  4. Grorud-Colvert, K.; Sullivan-Stack, J.; Roberts, C.; Constant, V.; Horta E Costa, B.; Pike, E.P.; Kingston, N.; Laffoley, D.; Sala, E.; Claudet, J.; et al. The MPA Guide: A Framework to Achieve Global Goals for the Ocean. Science 2021, 373, eabf0861. [Google Scholar] [CrossRef] [PubMed]
  5. Allard, H.; Ayling, A.M.; Shears, N.T. Long-Term Changes in Reef Fish Assemblages after 40 years of No-Take Marine Reserve Protection. Biol. Conserv. 2022, 265, 109405. [Google Scholar] [CrossRef]
  6. Davis, T.R.; Harasti, D. Forty Years of No-Take Protection Preserves Local Fish Diversity in a Small Urban Marine Protected Area. Coasts 2023, 3, 401–413. [Google Scholar] [CrossRef]
  7. Coleman, M.A.; Palmer-Brodie, A.; Kelaher, B.P. Conservation Benefits of a Network of Marine Reserves and Partially Protected Areas. Biol. Conserv. 2013, 167, 257–264. [Google Scholar] [CrossRef]
  8. Babcock, R.C.; Shears, N.T.; Alcala, A.C.; Barrett, N.S.; Edgar, G.J.; Lafferty, K.D.; McClanahan, T.R.; Russ, G.R. Decadal Trends in Marine Reserves Reveal Differential Rates of Change in Direct and Indirect Effects. Proc. Natl. Acad. Sci. USA 2010, 107, 18256–18261. [Google Scholar] [CrossRef] [PubMed]
  9. Bates, A.E.; Barrett, N.S.; Stuart-Smith, R.D.; Holbrook, N.J.; Thompson, P.A.; Edgar, G.J. Resilience and Signatures of Tropicalization in Protected Reef Fish Communities. Nat. Clim. Change 2014, 4, 62–67. [Google Scholar] [CrossRef]
  10. Langhammer, P.F.; Bull, J.W.; Bicknell, J.E.; Oakley, J.L.; Brown, M.H.; Bruford, M.W.; Butchart, S.H.M.; Carr, J.A.; Lewis, T.; Macfarlane, N.B.W.; et al. The Positive Impact of Conservation Action. Science 2024, 384, 453–458. [Google Scholar] [CrossRef] [PubMed]
  11. Alonso Aller, E.; Jiddawi, N.S.; Eklöf, J.S. Marine Protected Areas Increase Temporal Stability of Community Structure, but Not Density or Diversity, of Tropical Seagrass Fish Communities. PLoS ONE 2017, 12, e0183999. [Google Scholar] [CrossRef] [PubMed]
  12. Bates, A.E.; Cooke, R.S.C.; Duncan, M.I.; Edgar, G.J.; Bruno, J.F.; Benedetti-Cecchi, L.; Côté, I.M.; Lefcheck, J.S.; Costello, M.J.; Barrett, N.; et al. Climate Resilience in Marine Protected Areas and the ‘Protection Paradox. Biol. Conserv. 2019, 236, 305–314. [Google Scholar] [CrossRef]
  13. Clausius, E.; Edgar, G.J.; Phillips, G.A.C.; Mellin, C.; Oh, E.; Stuart-Smith, R. Habitat and Local Factors Influence Fish Biomass Recovery in Marine Protected Areas. Proc. R. Soc. B Biol. Sci. 2025, 292, 20242708. [Google Scholar] [CrossRef] [PubMed]
  14. Edgar, G.J.; Stuart-Smith, R.D.; Willis, T.J.; Kininmonth, S.; Baker, S.C.; Banks, S.; Barrett, N.S.; Becerro, M.A.; Bernard, A.T.F.; Berkhout, J.; et al. Global Conservation Outcomes Depend on Marine Protected Areas with Five Key Features. Nature 2014, 506, 216–220. [Google Scholar] [CrossRef] [PubMed]
  15. Goetze, J.S.; Wilson, S.; Radford, B.; Fisher, R.; Langlois, T.J.; Monk, J.; Knott, N.A.; Malcolm, H.; Currey-Randall, L.M.; Ierodiaconou, D.; et al. Increased Connectivity and Depth Improve the Effectiveness of Marine Reserves. Glob. Change Biol. 2021, 27, 3432–3447. [Google Scholar] [CrossRef] [PubMed]
  16. Kelaher, B.P.; Page, A.; Dasey, M.; Maguire, D.; Read, A.; Jordan, A.; Coleman, M.A. Strengthened Enforcement Enhances Marine Sanctuary Performance. Glob. Ecol. Conserv. 2015, 3, 503–510. [Google Scholar] [CrossRef]
  17. Chin, A.; Molloy, F.J.; Cameron, D.; Day, J.C.; Cramp, J.; Gerhardt, K.L.; Heupel, M.R.; Read, M.; Simpfendorfer, C.A. Conceptual Frameworks and Key Questions for Assessing the Contribution of Marine Protected Areas to Shark and Ray Conservation. Conserv. Biol. 2023, 37, e13917. [Google Scholar] [CrossRef] [PubMed]
  18. Rigby, C.L.; Carlson, J.; Derrick, D.; Dicken, M.; Pacoureau, N.; Simpfendorfer, C. Report Card: Carcharias taurus, Sand Tiger Shark; The IUCN Red List of Threatened Species: Gland, Switzerland, 2021. [Google Scholar]
  19. Fisheries Scientific Committee (FSC). Final Determination: Carcharias taurus—Grey Nurse Shark; Fisheries Scientific Committee (FSC): Nelson Bay, Australia, 2008. [Google Scholar]
  20. Bansemer, C.S.; Bennett, M.B. Retained Fishing Gear and Associated Injuries in the East Australian Grey Nurse Sharks (Carcharias taurus): Implications for Population Recovery. Mar. Freshw. Res. 2010, 61, 97–103. [Google Scholar] [CrossRef]
  21. Johnson, D.D.; Barnes, T.C.; Candy, S.G. Optimising Fisheries Monitoring for Rare and Protected Species: A South-Eastern Australian Case Study Shows Low Levels of Interaction with a Critically Endangered Species. Reg. Stud. Mar. Sci. 2024, 77, 103669. [Google Scholar] [CrossRef]
  22. Robbins, W.D.; Peddemors, V.M.; Broadhurst, M.K.; Gray, C.A. Hooked on Fishing? Recreational Angling Interactions with the Critically Endangered Grey Nurse Shark Carcharias taurus in Eastern Australia. Endanger. Species Res. 2013, 21, 161–170. [Google Scholar] [CrossRef]
  23. Pollard, D.A.; Lincoln Smith, M.P.; Smith, A.K. The Biology and Conservation Status of the Grey Nurse Shark (Carcharias taurus Rafinesque 1810) in New South Wales, Australia. Aquat. Conserv. 1996, 6, 1–20. [Google Scholar]
  24. Coulon, N.; Feunteun, E.; Carpentier, A.; Lizé, A. The Overlooked Threat of Global Warming on Elasmobranch Fertility. Fish Fish. 2026, 27, 41–55. [Google Scholar] [CrossRef]
  25. Bruce, B.D.; Stevens, J.D.; Bradford, R.W. Designing Protected Areas for Grey Nurse Sharks off Eastern Australia; CSIRO Marine Research: Hobart, Tasmania, 2005. [Google Scholar]
  26. Bansemer, C.S.; Bennett, M.B. Reproductive Periodicity, Localised Movements and Behavioural Segregation of Pregnant Carcharias taurus at Wolf Rock, Southeast Queensland, Australia. Mar. Ecol. Prog. Ser. 2009, 374, 215–227. [Google Scholar] [CrossRef]
  27. NSW Department of Primary Industries. Protecting the Grey Nurse Shark: A Guide for Recreational Fishers and Divers; Threatened Species Unit 2014; NSW Department of Primary Industries: Orange, Australia, 2014.
  28. Lynch, T.P.; Harcourt, R.; Edgar, G.; Barrett, N. Conservation of the Critically Endangered Eastern Australian Population of the Grey Nurse Shark (Carcharias taurus) through Cross-Jurisdictional Management of a Network of Marine-Protected Areas. Environ. Manag. 2013, 52, 1341–1354. [Google Scholar] [CrossRef] [PubMed]
  29. Otway, N.M.; Burke, A.L.; Morrison, N.S.; Parker, P.C. Monitoring and Identification of NSW Critical Habitat Sites for Conservation of Grey Nurse Sharks; NSW Fisheries Office of Conservation 2003; Port Stephens Fisheries Centre: Nelson Bay, Australia, 2003.
  30. Director of National Parks. Temperate East Marine Parks Network Management Plan 2018; Director of National Parks: Canberra, Australia, 2018. [Google Scholar]
  31. Whitmarsh, S.K.; Fairweather, P.G.; Huveneers, C. What Is Big BRUVver up to? Methods and Uses of Baited Underwater Video. Rev. Fish. Biol. Fish. 2017, 27, 53–73. [Google Scholar]
  32. Kelaher, B.P.; Coleman, M.A.; Broad, A.; Rees, M.J.; Jordan, A.; Davis, A.R. Changes in Fish Assemblages Following the Establishment of a Network of No-Take Marine Reserves and Partially-Protected Areas. PLoS ONE 2014, 9, e85825. [Google Scholar] [CrossRef] [PubMed]
  33. Wraith, J.; Lynch, T.; Minchinton, T.E.; Broad, A.; Davis, A.R. Bait Type Affects Fish Assemblages and Feeding Guilds Observed at Baited Remote Underwater Video Stations. Mar. Ecol. Prog. Ser. 2013, 477, 189–199. [Google Scholar] [CrossRef]
  34. Harasti, D.; Malcolm, H.; Gallen, C.; Coleman, M.A.; Jordan, A.; Knott, N.A. Appropriate Set Times to Represent Patterns of Rocky Reef Fishes Using Baited Video. J. Exp. Mar. Biol. Ecol. 2015, 463, 173–180. [Google Scholar] [CrossRef]
  35. Harvey, E.S.; Cappo, M.; Butler, J.J.; Hall, N.; Kendrick, G.A. Bait Attraction Affects the Performance of Remote Underwater Video Stations in Assessment of Demersal Fish Community Structure. Mar. Ecol. Prog. Ser. 2007, 350, 245–254. [Google Scholar] [CrossRef]
  36. NSW Department of Primary Industries (DPI). NSW Recreational Saltwater Fishing Guide 2015; NSW Department of Primary Industries (DPI): Nowra, Australia, 2015.
  37. NSW Department of Primary Industries (DPI). Status of Fisheries Resources in NSW 2013-14; Stewart, J., Hegarty, A., Young, C., Fowler, A., Craig, J., Eds.; NSW Department of Primary Industries (DPI): Mosman, Australia, 2015.
  38. Otway, N.M.; Louden, B.M. Occupation of Aggregation Sites and Migratory Movements of the Grey Nurse Shark (Carcharias taurus) off Eastern Australia 2025; NSW Department of Primary Industries and Regional Development: Nelson Bay, Australia, 2025.
  39. Anderson, M.J. Permutational Multivariate Analysis of Variance (PERMANOVA). In Wiley StatsRef: Statistics Reference Online; Wiley: Hoboken, NJ, USA, 2017; pp. 1–15. [Google Scholar]
  40. R Core Team R: A Language and Environment for Statistical Computing; R Foundation for Statistical Computing: Vienna, Austria, 2025.
  41. Kelaher, B.P.; Tan, M.; Figueira, W.F.; Gillanders, B.M.; Connell, S.D.; Goldsworthy, S.D.; Hardy, N.; Coleman, M.A. Fur Seal Activity Moderates the Effects of an Australian Marine Sanctuary on Temperate Reef Fish. Biol. Conserv. 2015, 182, 205–214. [Google Scholar] [CrossRef]
  42. Hollitzer, H.A.L.; May, F.; Blowes, S.A. A Meta-Analysis Examining How Fish Biodiversity Varies with Marine Protected Area Size and Age. Ecosphere 2023, 14, e4733. [Google Scholar] [CrossRef]
  43. Knott, N.A.; Williams, J.; Harasti, D.; Malcolm, H.A.; Coleman, M.A.; Kelaher, B.P.; Rees, M.J.; Schultz, A.; Jordan, A. A Coherent, Representative, and Bioregional Marine Reserve Network Shows Consistent Change in Rocky Reef Fish Assemblages. Ecosphere 2021, 12, e03447. [Google Scholar] [CrossRef]
  44. Malcolm, H.A.; Williams, J.; Schultz, A.L.; Neilson, J.; Johnstone, N.; Knott, N.A.; Harasti, D.; Coleman, M.A.; Jordan, A. Targeted Fishes Are Larger and More Abundant in ‘No-Take’ Areas in a Subtropical Marine Park. Estuar. Coast. Shelf Sci. 2018, 212, 118–127. [Google Scholar] [CrossRef]
  45. Franceschini, S.; Lynham, J.; Madin, E.M.P. A Global Test of MPA Spillover Benefits to Recreational Fisheries. Sci. Adv. 2024, 10, 9783. [Google Scholar] [CrossRef]
  46. Molloy, P.P.; McLean, I.B.; Côté, I.M. Effects of Marine Reserve Age on Fish Populations: A Global Meta-Analysis. J. Appl. Ecol. 2009, 46, 743–751. [Google Scholar] [CrossRef]
  47. Sangil, C.; Clemente, S.; Martín-García, L.; Hernández, J.C. No-Take Areas as an Effective Tool to Restore Urchin Barrens on Subtropical Rocky Reefs. Estuar. Coast. Shelf Sci. 2012, 112, 207–215. [Google Scholar] [CrossRef]
  48. Bergseth, B.J.; Arias, A.; Barnes, M.L.; Caldwell, I.; Datta, A.; Gelcich, S.; Ham, S.H.; Lau, J.D.; Ruano-Chamorro, C.; Smallhorn-West, P.; et al. Closing the Compliance Gap in Marine Protected Areas with Human Behavioural Sciences. Fish. Fish. 2023, 24, 695–704. [Google Scholar] [CrossRef]
  49. Iacarella, J.C.; Clyde, G.; Bergseth, B.J.; Ban, N.C. A Synthesis of the Prevalence and Drivers of Non-Compliance in Marine Protected Areas. Biol. Conserv. 2021, 255, 108992. [Google Scholar] [CrossRef]
  50. Harasti, D.; Davis, T.R.; Jordan, A.; Erskine, L.; Moltschaniwskyj, N. Illegal Recreational Fishing Causes a Decline in a Fishery Targeted Species (Snapper: Chrysophrys auratus) within a Remote No-Take Marine Protected Area. PLoS ONE 2019, 14, e0209926. [Google Scholar] [CrossRef] [PubMed]
  51. Read, A.D.; West, R.J.; Kelaher, B.P. Using Compliance Data to Improve Marine Protected Area Management. Mar. Policy 2015, 60, 119–127. [Google Scholar] [CrossRef]
  52. Huveneers, C.; Harcourt, R.G.; Otway, N.M. Observation of Localised Movements and Residence Times of the Wobbegong Shark Orectolobus halei at Fish Rock, NSW, Australia. Cybium 2006, 30, 103–111. [Google Scholar]
  53. Chapman, D.D.; Feldheim, K.A.; Papastamatiou, Y.P.; Hueter, R.E. There and Back Again: A Review of Residency and Return Migrations in Sharks, with Implications for Population Structure and Management. Ann. Rev. Mar. Sci. 2015, 7, 547–570. [Google Scholar] [CrossRef] [PubMed]
  54. Nakhostin, M.; Dulvy, N.K. Spatial Scale and Conservation Options for Carpet Sharks. Biol. Conserv. 2025, 308, 111211. [Google Scholar] [CrossRef]
  55. Espinoza, M.; Cappo, M.; Heupel, M.R.; Tobin, A.J.; Simpfendorfer, C.A. Quantifying Shark Distribution Patterns and Species-Habitat Associations: Implications of Marine Park Zoning. PLoS ONE 2014, 9, e106885. [Google Scholar] [CrossRef] [PubMed]
  56. Carraro, R.; Gladstone, W. Habitat Preferences and Site Fidelity of the Ornate Wobbegong Shark (Orectolobus ornatus) on Rocky Reefs of New South Wales. Pac. Sci. 2006, 60, 207–223. [Google Scholar] [CrossRef]
  57. Tagliafico, A.; Butcher, P.A.; Colefax, A.P.; Clark, G.F.; Kelaher, B.P. Variation in Cownose Ray Rhinoptera neglecta Abundance and Group Size on the Central East Coast of Australia. J. Fish. Biol. 2020, 96, 427–433. [Google Scholar] [CrossRef] [PubMed]
  58. Le Port, A.; Lavery, S.; Montgomery, J.C. Conservation of Coastal Stingrays: Seasonal Abundance and Population Structure of the Short-Tailed Stingray Dasyatis brevicaudata at a Marine Protected Area. ICES J. Mar. Sci. 2012, 69, 1427–1435. [Google Scholar] [CrossRef]
  59. Kraft, S.; Winkler, A.C.; Abecasis, D. Seasonal Movement Dynamics of the Commercially Important Thornback Ray (Raja clavata) in a Coastal Marine Protected Area. Ocean Coast. Manag. 2024, 254, 107210. [Google Scholar] [CrossRef]
  60. Dwyer, R.G.; Rathbone, M.; Foote, D.L.; Bennett, M.; Butcher, P.A.; Otway, N.M.; Louden, B.M.; Jaine, F.R.A.; Franklin, C.E.; Kilpatrick, C. Marine Reserve Use by a Migratory Coastal Shark, Carcharias taurus. Biol. Conserv. 2023, 283, 110099. [Google Scholar] [CrossRef]
  61. Bradford, R.; Harasti, D.; Westlake, E.L.; Thomson, R.; Feutry, P.; Baylis, S.; Mayne, B.; Anderson, C.; Hillary, R.; Gunasekera, R.; et al. NESP2 MaC Hub Project 3.13: Eastern Grey Nurse Shark, Carcharias taurus, Population Abundance and Trend 2025; National Environmental Science Program; CSIRO Environment: Hobart, Tasmania, 2025. [Google Scholar]
  62. Bradford, R.; Thomson, R.; Bravington, M.; Foote, D.; Gunasekera, R.; Bruce, B.; Harasti, D.; Otway, N.; Feutry, P. A Close-Kin Mark-Recapture Estimate of the Population Size and Trend of East Coast Grey Nurse Shark; CSIRO Oceans & Atmosphere: Hobart, Tasmania, 2018. [Google Scholar]
  63. Bond, M.E.; Babcock, E.A.; Pikitch, E.K.; Abercrombie, D.L.; Lamb, N.F.; Chapman, D.D. Reef Sharks Exhibit Site-Fidelity and Higher Relative Abundance in Marine Reserves on the Mesoamerican Barrier Reef. PLoS ONE 2012, 7, e32983. [Google Scholar] [CrossRef] [PubMed]
  64. Knip, D.M.; Heupel, M.R.; Simpfendorfer, C.A. To Roam or to Home: Site Fidelity in a Tropical Coastal Shark. Mar. Biol. 2012, 159, 1647–1657. [Google Scholar] [CrossRef]
  65. Otway, N.M.; Ellis, M.T. Pop-up Archival Satellite Tagging of Carcharias taurus: Movements and Depth/Temperature-Related Use of South-Eastern Australian Waters. Mar. Freshw. Res. 2011, 62, 607–620. [Google Scholar]
  66. Otway, N.M.; Bradshaw, C.J.A.; Harcourt, R.G. Estimating the Rate of Quasi-Extinction of the Australian Grey Nurse Shark (Carcharias taurus) Population Using Deterministic Age- and Stage-Classified Models. Biol. Conserv. 2004, 119, 341–350. [Google Scholar] [CrossRef]
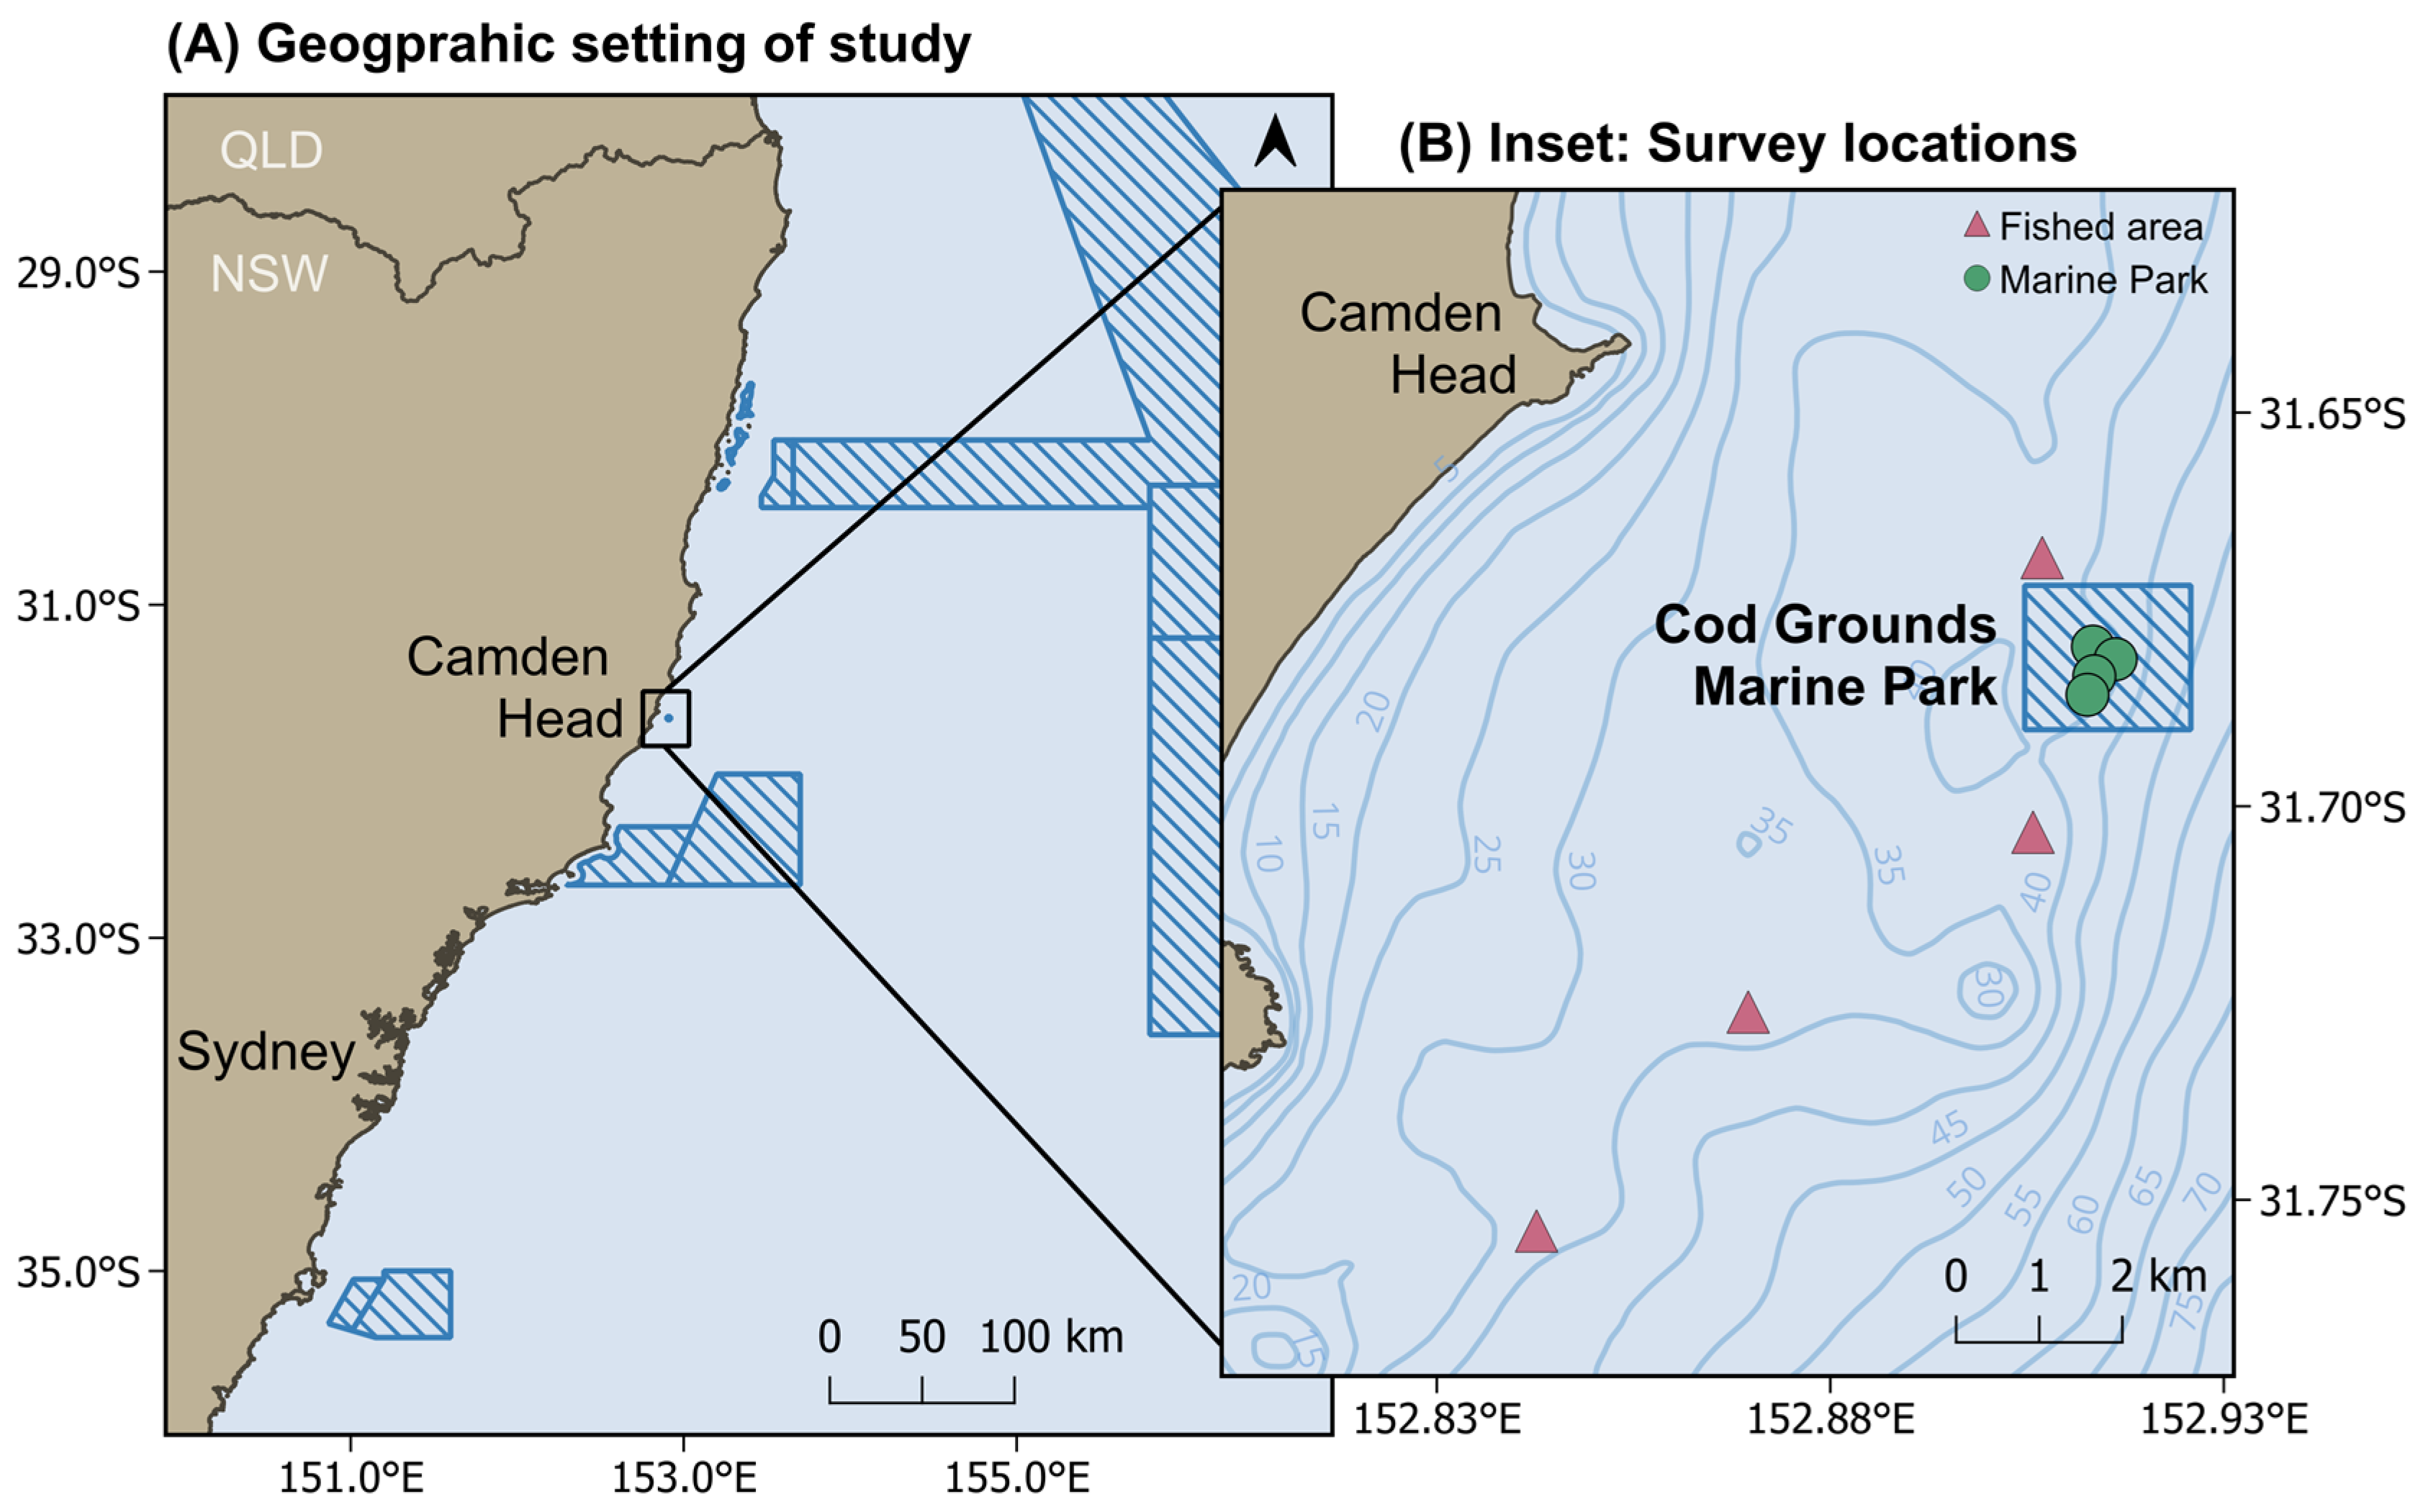
Figure 1. Location of Cod Grounds Marine Park off the mid-north coast of New South Wales (NSW), Australia (A), and detailed map showing BRUV survey sites inside the marine park (green circles) and at nearby fished reefs (pink triangles) (B). Blue contour labels indicate water depth (m).
Fishes 11 00408 g001
Figure 2. Non-metric multidimensional scaling (nMDS) plot of fish assemblages recorded by BRUVs at sites inside (green circles) and outside (pink triangles) the Cod Grounds Marine Park across sampling periods between 2015 and 2018. Points represent centroids of assemblage composition for each sampling period.
Fishes 11 00408 g002
Figure 3. Temporal variation in marine park effects on key fish assemblage metrics. Points show log ratios of values inside relative to outside the marine park for each sampling period, and the green line indicates the overall effect. Shaded bands represent 95% confidence intervals. Positive values (dashed line at zero) indicate higher values inside the marine park.
Fishes 11 00408 g003
Figure 4. Mean abundance (MaxN) of grey nurse sharks, grey nurse shark prey species, other shark species, and rays inside (green circles) and outside (pink triangles) the Cod Grounds Marine Park. Error bars represent the standard error of the mean (SE).
Fishes 11 00408 g004
Table 1. Ten most abundant fish species recorded during BRUV sampling inside and outside the Cod Grounds Marine Park (MP), showing mean abundance (MaxN ± SE) and occurrence (%) per site. Asterisks show species targeted by recreational or commercial fishing.
Inside MPOutside MP
SpeciesAbundanceOccurrenceAbundanceOccurrence
Silver sweep (Scorpis lineolata) *18.48 ± 2.99968.47 ± 1.5986
Snapper (Chrysophrys auratus) *4.32 ± 0.281002.46 ± 0.32100
Southern maori wrasse (Ophthalmolepis lineolatus) *3.29 ± 0.161002.60 ± 0.2793
Silver trevally (Pseudocaranx dentex) *1.22 ± 0.47482.68 ± 0.9261
Half-banded seaperch (Hypoplectrodes maccullochi)1.62 ± 0.151001.42 ± 0.16100
Eastern red scorpionfish (Scorpaena cardinalis) *1.67 ± 0.081001.22 ± 0.10100
Blackspot goatfish (Parupeneus spilurus) *1.70 ± 0.161001.14 ± 0.1489
Crimsonband wrasse (Notolabrus gymnogenis) *1.50 ± 0.081001.01 ± 0.0796
Grey morwong (Nemadactylus douglasii) *0.97 ± 0.171001.48 ± 0.37100
Green moray (Gymnothorax prasinus)1.03 ± 0.13931.34 ± 0.1896
Table 2. Main PERMANOVA results testing the effects of Zone (inside and outside the marine park), Time, and their interaction on multivariate and univariate fish community metrics. Analyses were based on log(x + 1) transformed MaxN data. Significant results (p ≤ 0.05) are shown in bold.
ResponseFactorDfPseudo-Fp-Value
Multivariate
Assemblage structureTime63.340.0001
Zone11.860.02
Time × Zone61.510.011
Univariate
Species richnessTime62.090.08
Zone14.470.02
Time × Zone60.480.82
Total abundanceTime60.940.48
Zone113.070.0007
Time × Zone61.180.34
Target speciesTime60.760.60
Zone18.290.003
Time × Zone61.250.31
Non-target speciesTime62.400.05
Zone13.560.04
Time × Zone61.440.22
Elasmobranch abundance
Grey nurse sharksTime62.260.06
Zone12.320.10
Time × Zone62.260.05
PreyTime61.570.18
Zone14.090.03
Time × Zone61.680.16
Other sharksTime64.170.003
Zone10.660.66
Time × Zone60.890.50
RaysTime61.500.21
Zone10.530.78
Time × Zone66.020.0004
Table 3. Elasmobranch species observed inside and outside the Cod Grounds Marine Park (MP). Crosses (×) indicate the presence of a species and blank cells indicate that the species was not recorded.
FamilySpeciesCommon NameInside MPOutside MP
Sharks
BrachaeluridaeBrachaelurus waddiBlind shark××
CarcharhinidaeCarcharhinus tilsoniAustralian blacktip shark××
Galeocerdo cuvierTiger shark×
HeterodontidaeHeterodontus galeatusCrested hornshark××
H. portusjacksoniPort Jackson shark××
OdontaspididaeCarcharias taurusGrey nurse shark×
OrectolobidaeOrectolobus haleiBanded wobbegong××
O. maculatusSpotted wobbegong××
O. ornatusOrnate wobbegong××
ParascylliidaeParascyllium collareCollar carpetshark××
ScyliorhinidaeAsymbolus analisGrey spotted catshark××
A. rubiginosusOrange-spotted catshark××
Galeus boardmaniSawtail catshark ×
TriakidaeMustelus antarcticusGummy shark××
Rays
DasyatidaeDasyatis brevicaudataShort-tail stingray××
MyliobatidaeMyliobatis australisAustralian bull ray ×
RhinobatidaeAptychotrema rostrataEastern shovelnose ray ×
Trygonorrhina fasciataEastern fiddler ray××
RhinopteridaeRhinoptera neglectaAustralian cownose ray×
TorpedinidaeHypnos monopterygiumCoffin ray××
Table 4. Results of linear mixed-effect models (LMMs) testing the effects of Zone (inside vs. outside the marine park), Temperature, and Water clarity on fish assemblage metrics. Estimates are model coefficients (±SE), with negative values indicating lower values at fished sites relative to the marine park. Significant effects (p < 0.05) are shown in bold.
ResponsePredictorEstimate ± SEp-value
Species richnessTemperature0.002 ± 0.020.92
Clarity0.01 ± 0.010.44
Zone−0.06 ± 0.050.27
Total abundanceTemperature0.01 ± 0.020.53
Clarity0.01 ± 0.020.48
Zone−0.33 ± 0.100.003
Target speciesTemperature0.02 ± 0.030.53
Clarity0.0002 ± 0.020.99
Zone−0.36 ± 0.130.009
Non-target speciesTemperature0.002 ± 0.030.94
Clarity0.04 ± 0.020.11
Zone−0.21 ± 0.090.025
Grey nurse prey abundanceTemperature0.02 ± 0.030.48
Clarity−0.01 ± 0.020.58
Zone−0.32 ± 0.140.025
Disclaimer/Publisher’s Note: The statements, opinions and data contained in all publications are solely those of the individual author(s) and contributor(s) and not of MDPI and/or the editor(s). MDPI and/or the editor(s) disclaim responsibility for any injury to people or property resulting from any ideas, methods, instructions or products referred to in the content.