Article

Seasonal Variation in Ichthyoplankton Assemblage Structure in Yeongil Bay, Korea
1
Fisheries Resources Research Center, National Institute of Fisheries Science, Tongyeong 53064, Republic of Korea
2
Coastal Waters Fisheries Resources Research Division, National Institute of Fisheries Science, Busan 46083, Republic of Korea
*
Author to whom correspondence should be addressed.
Fishes 2026, 11(7), 405; https://doi.org/10.3390/fishes11070405
Submission received: 11 May 2026 / Revised: 1 July 2026 / Accepted: 7 July 2026 / Published: 9 July 2026
(This article belongs to the Section Biology and Ecology)

Abstract

Ichthyoplankton communities provide important information on spawning dynamics and early life-history processes of fish populations. This study investigated the species composition and seasonal occurrence of fish eggs and larvae in Yeongil Bay, in the East Sea of Korea, from January to December 2023. Samples were collected at seven stations and identified based on morphological characteristics and molecular analysis using mitochondrial DNA (COI and 16S rRNA). Thirty-six egg taxa (676 ± 739 eggs 1000 m−3) and 42 larval taxa (28 ± 35 larvae 1000 m−3) were identified. The dominant egg species were Engraulis japonicus (23.3%), Pseudopleuronectes herzensteini (11.8%), and Sardinops sagax (9.8%), while the dominant larval species were Sebastes inermis (29.7%), Sillago japonica (20.7%), and Sebastiscus marmoratus (5.5%). Egg abundance increased from spring and reached a peak in July, whereas larval abundance showed seasonal peaks in January and August. nMDS ordination showed seasonal variation in assemblage structure. Egg assemblages showed seasonal grouping patterns that corresponded with seasonal variation in surface water temperature and salinity, whereas larval assemblages showed relatively more complex seasonal patterns and were characterized by higher species richness and more extended seasonal occurrence. These results suggest that ichthyoplankton assemblages in Yeongil Bay exhibited seasonal variation in species composition during the study period, with E. japonicus eggs comprising the dominant component of the summer ichthyoplankton assemblage. Furthermore, the combined use of morphological and molecular identification improved species-level resolution and provided baseline information for understanding seasonal variation in ichthyoplankton assemblages in this coastal ecosystem.
Key Contribution: This study provides the first year-round, species-resolved characterization of ichthyoplankton assemblages in Yeongil Bay by integrating morphological identification with mitochondrial DNA analyses, revealing distinct seasonal patterns in egg and larval communities. It demonstrates that shifts in species composition and spawning phenology, rather than environmental variables alone, are the primary drivers shaping seasonal ichthyoplankton structure in the East Sea of Korea.

1. Introduction

The coastal waters of the East Sea are strongly influenced by the East Korean Warm Current and the North Korean Cold Current, resulting in pronounced seasonal variability in water temperatures, which is associated with seasonal variation in fish species composition and spawning activity. Due to the coexistence of warm- and cold-water masses, this region supports diverse fish assemblages. In contrast to the West and South Seas of Korea, the East Sea is characterized by a relatively simple coastline with limited bay development. Yeongil Bay, located in Pohang, is one of the few well-developed bays along the Korean East Sea coast and provides a representative environment for investigating seasonal variation in coastal fish assemblages under the hydrographic conditions of the East Sea.
Yeongil Bay is a semi-enclosed embayment with relatively shallow depths (<50 m), and it has been recognized as an area supporting spawning activity and early life stages of coastal fish species [1,2,3]. In particular, the southwestern part of the bay is influenced by the Hyeongsan River, which supplies freshwater and nutrients into the system. This input significantly affects the hydrographic structure of the bay, including temperature and salinity, thereby increasing environmental variability [2,4]. Such dynamic physicochemical conditions may impose physiological stress on marine organisms, especially those in early life stages [5]. These environmental conditions may be associated with the occurrence and distribution of fish eggs and larvae through seasonal changes in temperature and salinity. Indeed, numerous studies have demonstrated that embayments serve as critical spawning and nursery grounds for fish populations [6,7,8,9].
Studies on fish eggs and larvae in Yeongil Bay have been limited. The first study on species composition was conducted by Han et al. [1], who reported eight fish egg and 37 larvae taxa based on morphological identification. However, due to taxonomic limitations at the time, species-level identification was uncertain. More recently, [9] improved taxonomic resolution by combining morphological and molecular approaches and reported 28 fish egg and 13 larvae taxa based on bimonthly sampling. Although these studies improved understanding of ichthyoplankton occurrence in Yeongil Bay and limited assessment of differences between egg and larval assemblages under changing environmental conditions. Therefore, year-round surveys across seven sampling stations may provide improved understanding of seasonal occurrence patterns, assemblage variation, and environmental influences associated with seasonal changes in hydrographic conditions in Yeongil Bay.
Fish eggs and larvae represent critical early life stages that are highly sensitive to environmental changes [10]. Their distribution provides valuable information for identifying spawning and nursery grounds, as well as for understanding fluctuations in fish populations and supporting long-term resource management and conservation [11,12]. Compared with adult surveys, ichthyoplankton studies provide more direct evidence of spawning activity and early life-stage occurrence [13,14]. Furthermore, due to their limited mobility, early life stages are strongly influenced by environmental factors such as temperature, salinity, and currents, making them useful indicators of environmental conditions [15]. Accordingly, studies on fish eggs and larvae provide essential baseline information for understanding the influence of environmental variability on coastal fish assemblages.
In this study, monthly surveys of fish eggs and larvae were conducted over 1 year at seven stations in Yeongil Bay. Species identification was performed using an integrative approach combining morphological examination and DNA-based validation to achieve accurate species-level resolution. This study aimed to describe seasonal variation in ichthyoplankton assemblages and compare species composition between fish eggs and larvae under seasonal environmental conditions in Yeongil Bay, with particular attention to assemblage variation associated with seasonal hydrographic changes. The findings of this study provide fundamental data for understanding seasonal variation and seasonal hydrographic conditions on coastal fish assemblages in Yeongil Bay.

2. Materials and Methods

2.1. Sampling

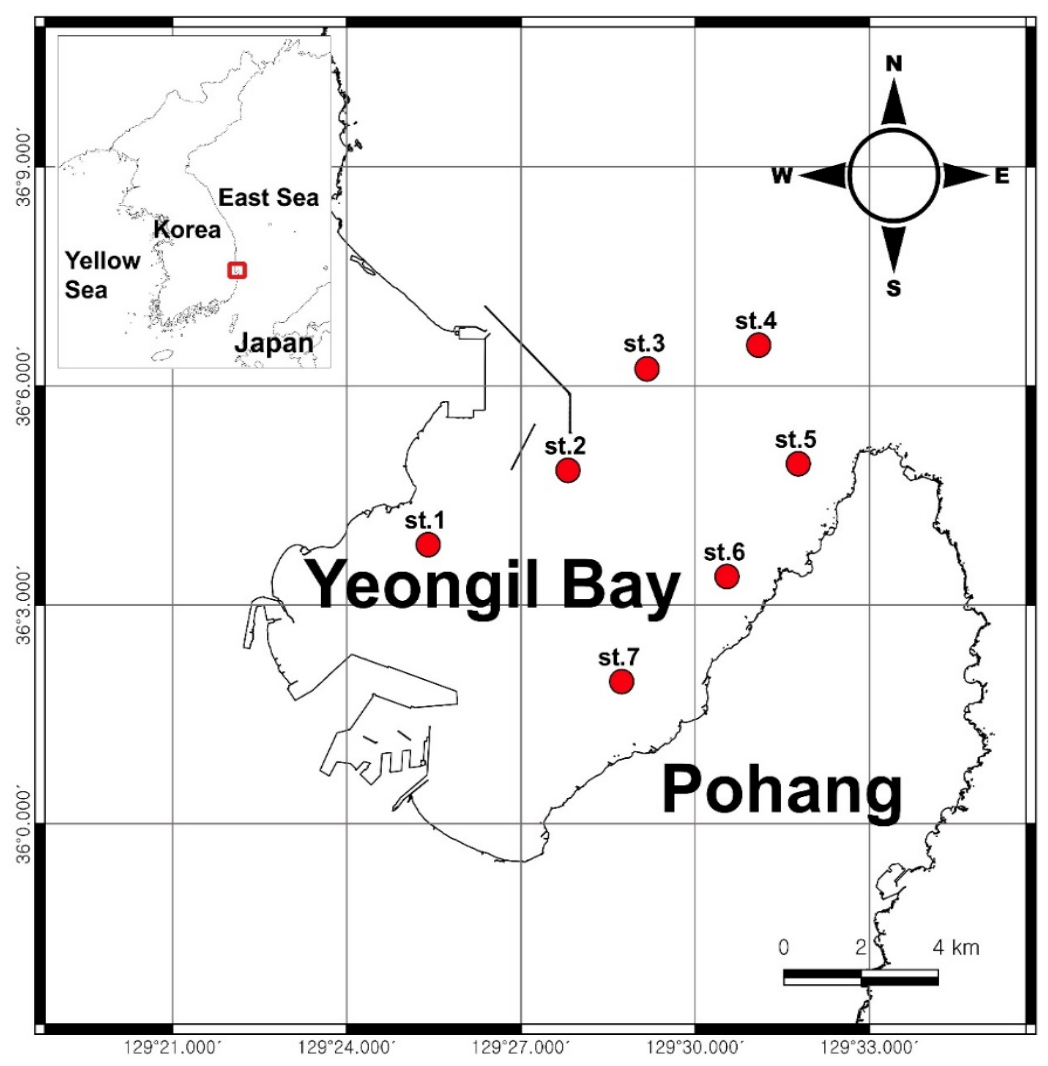
Samples were collected from seven stations in Yeongil Bay (Figure 1). Fish eggs and larvae were sampled monthly at each station from January to December 2023 using an ichthyoplankton net (mouth diameter: 80 cm; mesh size: 330 μm). At each station, oblique tows were conducted two to three times from approximately 5 m above the bottom to the surface for 10 min per tow, while maintaining a vessel speed of approximately 4 knots. Because of the shallow depth in Yeongil Bay, multiple oblique tows were conducted to maintain sufficient sampling duration and filtered water volume at each station, and water depth at the sampling stations ranged from 14 to 32 m.
A mechanical flowmeter (General Oceanics, Inc., Miami, FL, USA) was mounted at the center of the net mouth to estimate the volume of filtered water during each tow. Ichthyoplankton abundance was standardized as the number of individuals per unit volume (individuals 1000 m−3). Samples were immediately fixed in 99% ethanol and subsequently stored at the Ichthyoplankton Laboratory, Fisheries Resources Research Center, National Institute of Fisheries Science (NIFS). Temperature and salinity values presented in the study represent surface water from CTD profiles (SBE-19plus V2; Sea-Bird Scientific, Bellevue, WA, USA) at each station and subsequently averaged among stations within each month. Surface water temperature and salinity at each sampling station are presented separately to show spatial and seasonal variation.

2.2. Taxonomic Identification of Fish Eggs and Larvae

Fish eggs were initially examined under a stereomicroscope (SZX-16; Olympus, Tokyo, Japan). Eggs of anchovy and silvery lightfish (Maurolicus muelleri) were identified based on morphological characteristics, whereas the remaining eggs were categorized into several groups according to egg diameter, surface pattern, and perivitelline space.
Fish larvae were identified morphologically under a stereomicroscope based on the diagnostic characteristics described in Okiyama [16]. Scientific names and taxonomic classification followed Nelson et al. [17]. For molecular identification, three individuals were randomly selected from each egg group, photographed, and subjected to DNA analysis. This subsampling approach was applied because eggs were first classified into morphological types based on egg diameter, embryonic development stage, pigmentation, and other diagnostic characteristics, and molecular analysis was conducted on randomly selected individuals within each type to verify species identity. Species identification was determined based on agreement between molecular and morphological characteristics. Molecular identification was conducted independently for each morphotype at each sampling station. In cases where morphological and molecular identifications were inconsistent, final species identification of newly hatched and preflexion larval stages was based on molecular identification.
When multiple species were identified with a single morphotype based on molecular analyses, their relative proportions were calculated and presented according to the molecular identification results. Larvae were primarily identified morphologically; however, individuals that were newly hatched, damaged during sampling, difficult to identify morphologically, or selected as representative specimens were further analyzed using molecular methods. For these specimens, tissue samples were obtained from the right eye [18]. The molecular identification results for these larval specimens are summarized in Supplementary Table S1.
Total genomic DNA was extracted using a GeneAll Exgene™ Clinic SV DNA extraction kit (GeneAll, Seoul, Republic of Korea). To increase identification accuracy, two mitochondrial gene regions were amplified: cytochrome c oxidase subunit I (COI) and 16S rRNA. The COI region was amplified using the primers VF2 (5′-TCA ACC AAC CAC AAA GAC ATT GGC AC-3′) and FishR2 (5′-ACT TCA GGG TGA CCG AAG AAT CAG AA-3′) [19], and the 16S rRNA region was amplified using the primers 16Sar (5′-CGC CTG TTT ATC AAA AAC AT-3′) and 16Sbr (5′-CCG GTC TGA ACT CAG ATC ATG T-3′) [20].
PCR was performed in a 20-µL reaction volume containing 1 µL genomic DNA, 2 µL of 10× PCR buffer, 2 µL of 2.5 mM dNTPs, 1 µL of each primer, 0.1 µL Ex-Taq DNA polymerase, and 12.9 µL sterile distilled water using a thermal cycler (C1000™; Bio-Rad Laboratories, Hercules, CA, USA). The PCR conditions were as follows: initial denaturation at 95 °C for 3 min; 37 cycles of denaturation at 94 °C for 30 s, annealing at 52 °C for 30 s, and extension at 72 °C for 1 min; and then a final extension at 72 °C for 5 min.
PCR products were sequenced using an ABI BigDye Terminator Cycle Sequencing Ready Reaction Kit v3.1 on an ABI 3730xl DNA Analyzer (Applied Biosystems, Waltham, MA, USA). Sequence alignment was performed using ClustalW [21] implemented in BioEdit version 7 [22]. Species identification was conducted by comparing obtained sequences with reference sequences available in GenBank (National Center for Biotechnology Information, https://www.ncbi.nlm.nih.gov). Sequences showing <99% similarity or ambiguous matches were retained at the lowest reliable taxonomic level. PCR amplification and sequencing were repeated when necessary to obtain reliable sequence data for representative individuals of each morphotype. Only sequences with clear and consistent results were used for species identification.

2.3. Data Analysis

All abundance values are presented as mean ± standard deviation (SD), calculated from monthly mean abundance values across the sampling period. To evaluate seasonal variation in ichthyoplankton species composition in Yeongil Bay, abundance data collected from the seven sampling stations were integrated by month prior to community analyses. Replicate oblique tows conducted within stations were not treated as independent observations because sampling was designed to represent the vertical distribution throughout the water column. A similarity matrix was constructed using the Bray–Curtis similarity index [23]. Before analysis, abundance data were log-transformed [log10(x + 1)]. Cluster analysis was performed based on Bray–Curtis similarity. Similarity thresholds were used to facilitate visualization of seasonal assemblage patterns and were not intended for statistical inference. A similarity percentage (SIMPER) analysis was conducted to identify species contributing most to differences among groups. Differences in species composition among groups identified from similarity patterns were further explored using one-way analysis of similarities (ANOSIM). Statistical significance was assessed using 999 permutations, with significance accepted at p < 0.05. Non-metric multidimensional scaling (nMDS) ordination was used to visualize patterns in species composition. All multivariate analyses were conducted using the PRIMER v6.0 statistical package [24]. Because community analyses were conducted using monthly integrated data from the seven sampling stations, the present study primarily focused on describing temporal variation in ichthyoplankton assemblages in Yeongil Bay rather than evaluating differences among sampling stations. No eggs were collected in November; therefore, November data were excluded only from egg assemblage analyses, whereas environmental data and larval analyses included data from all sampling months.

3. Results

3.1. Environmental Variables

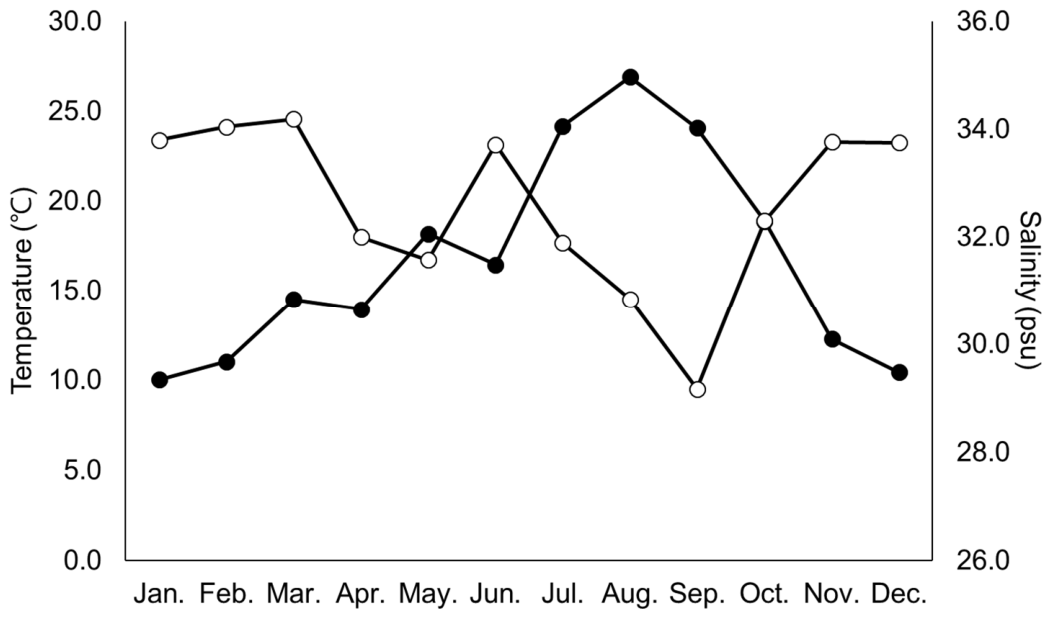
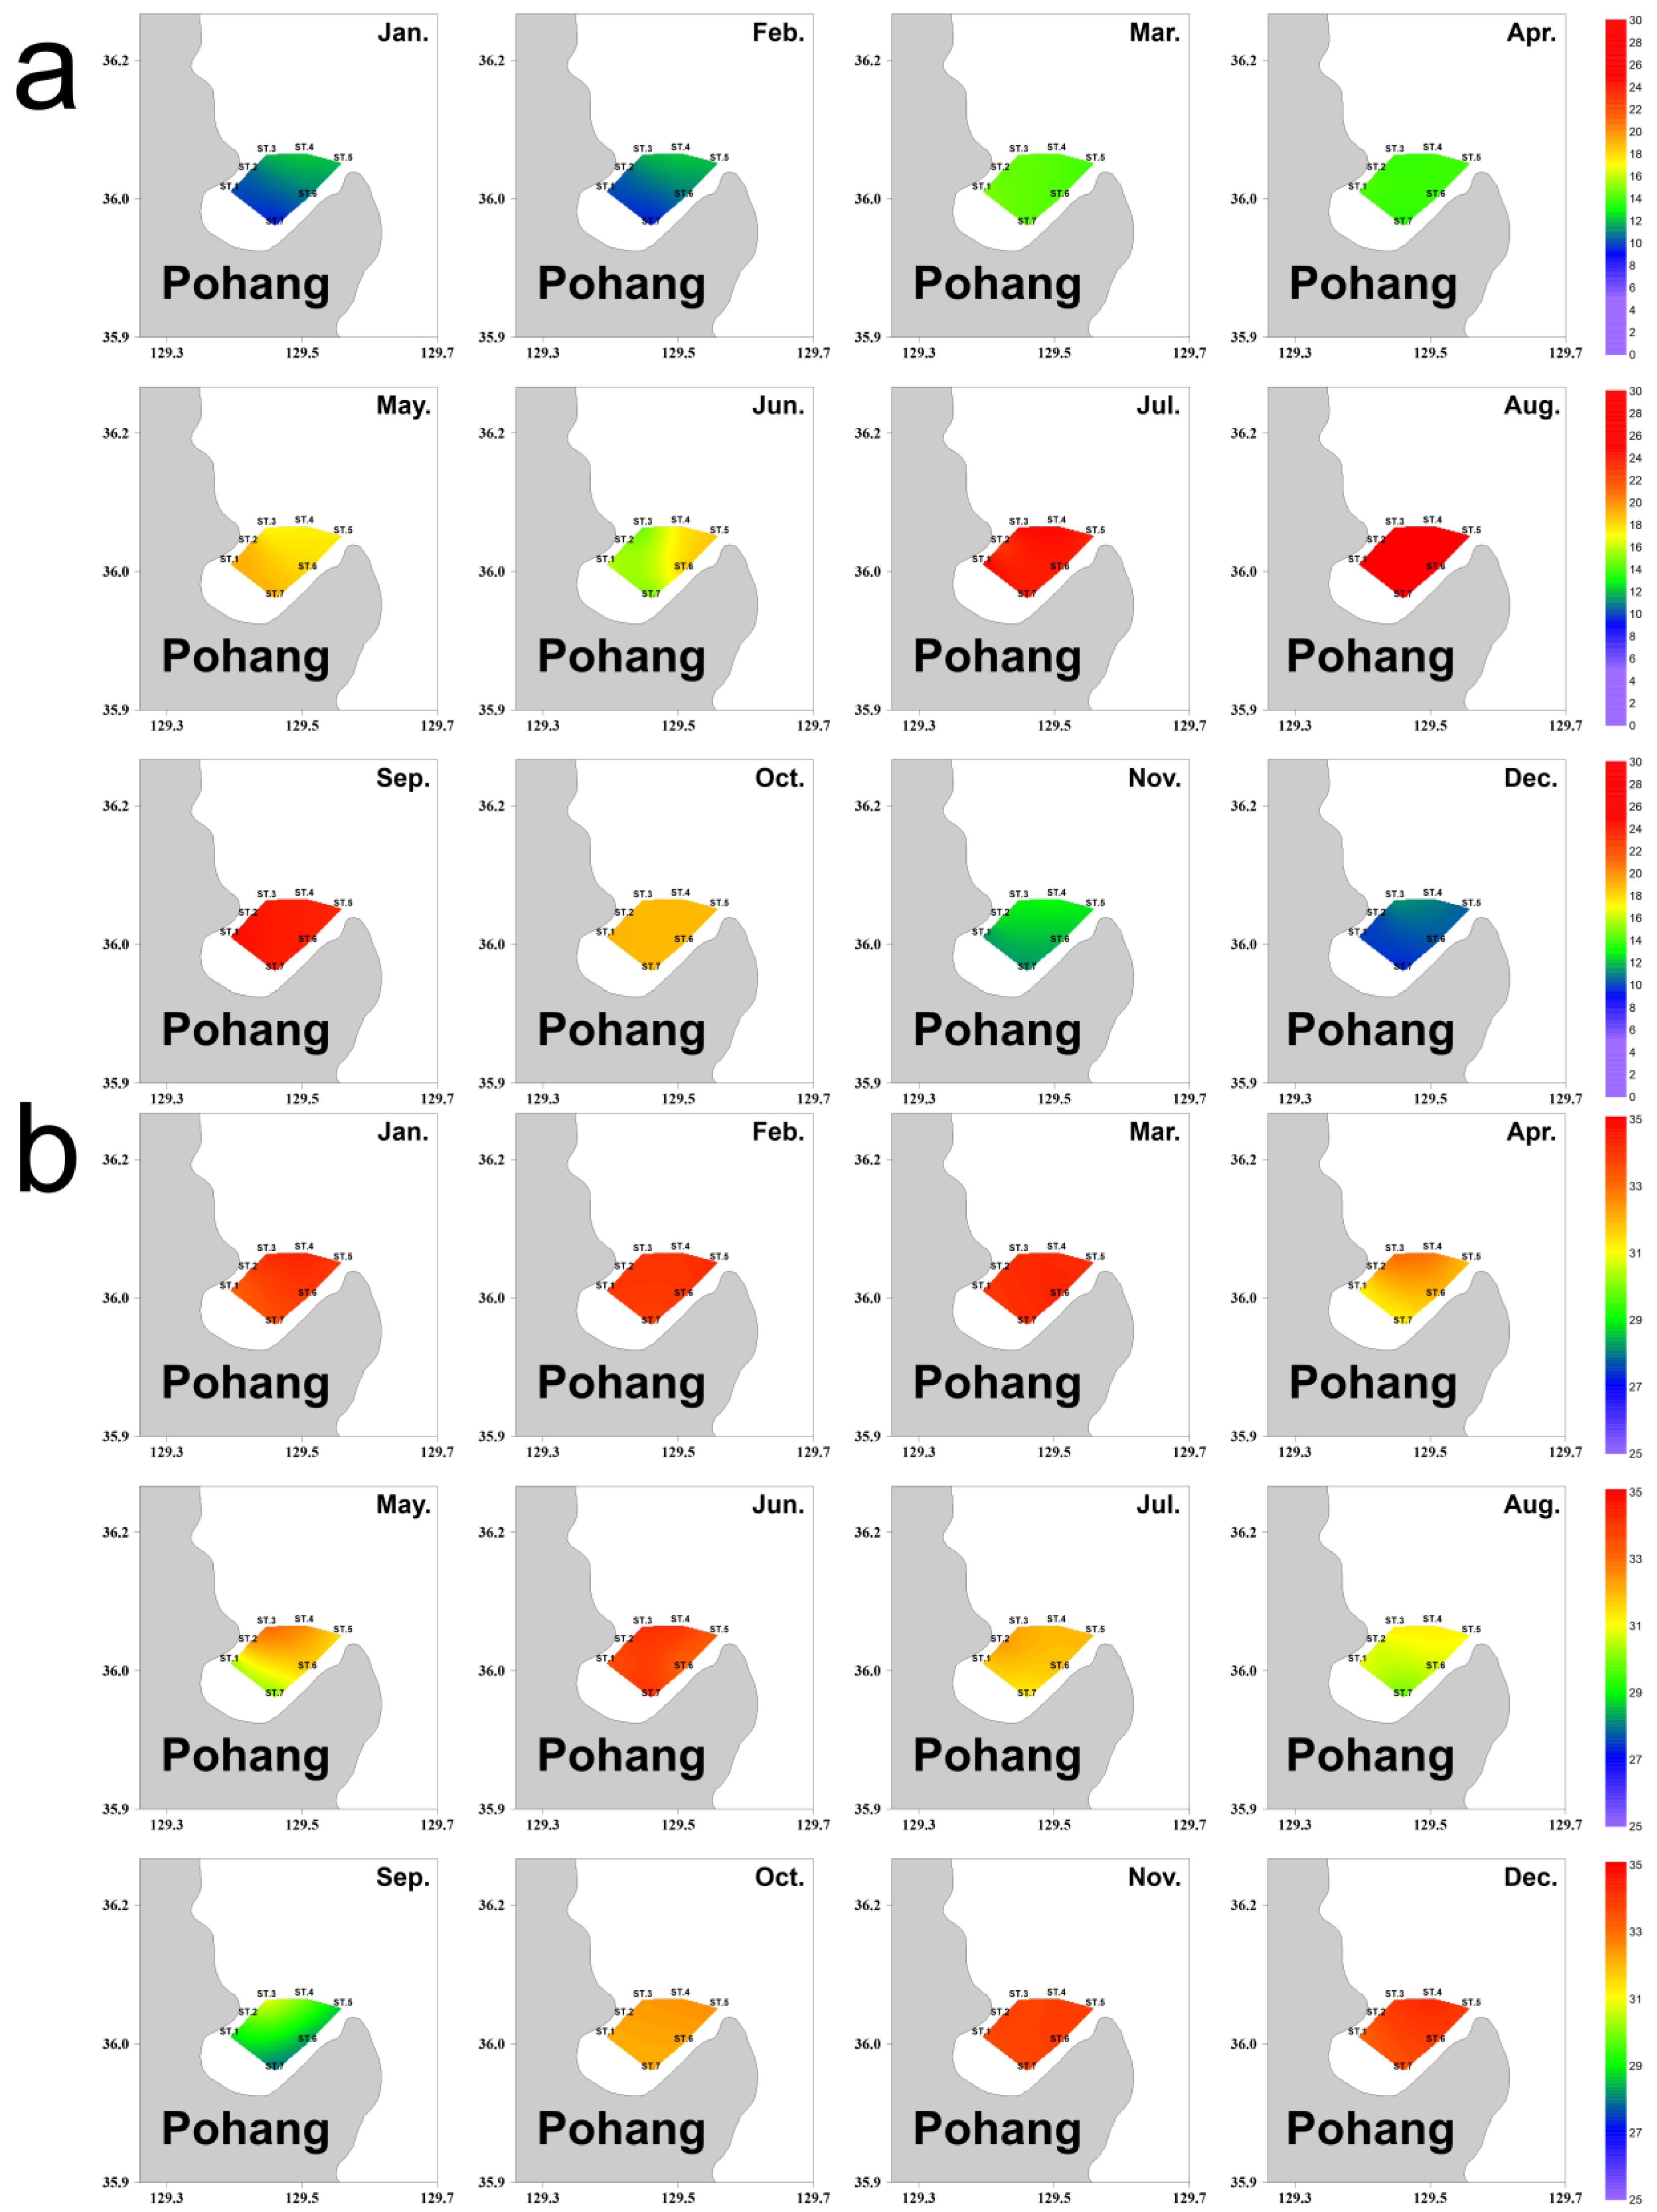
During the study period, surface water temperature ranged from 10.0 to 26.9 °C, while salinity varied between 29.2 and 34.2 (Figure 2). Figure 3 shows the monthly variations in water temperature and salinity at each sampling station. Water temperature was generally lower at the inside bay stations than at the outside bay stations. Salinity also tended to be lower in the inside bay, showing slight spatial differences among stations.
Figure 2. Monthly variations in surface water temperature (●) and surface salinity (○) in Yeongil bay, Korea, from January to December 2023.
Fishes 11 00405 g002
Figure 3. Monthly variations in surface water temperature (a) and surface salinity (b) at each sampling station in Yeongil bay, Korea, from January to December 2023.
Fishes 11 00405 g003
Water temperature exhibited a clear seasonal pattern, with the lowest values recorded in January, followed by a gradual increase through spring (March–May). Temperature peaked in August (26.9 °C) and subsequently declined during autumn. Relatively high temperatures were sustained from July to September.
Salinity generally ranged between 30 and 34; however, it began to decrease after June and remained relatively low throughout summer. The lowest salinity (29.2) was observed in September. Thereafter, salinity increased to 32.3 in October. Lower salinity values were observed during summer, particularly in the inside bay. This seasonal decrease in salinity was more clearly observed during late summer and showed greater variation among sampling periods.
During winter (January–March), low temperature and high salinity conditions prevailed, whereas summer (June–September) was characterized by high temperature and low salinity conditions. Spring and autumn represented transitional periods between these seasonal conditions.

3.2. Ichthyoplankton Species Composition

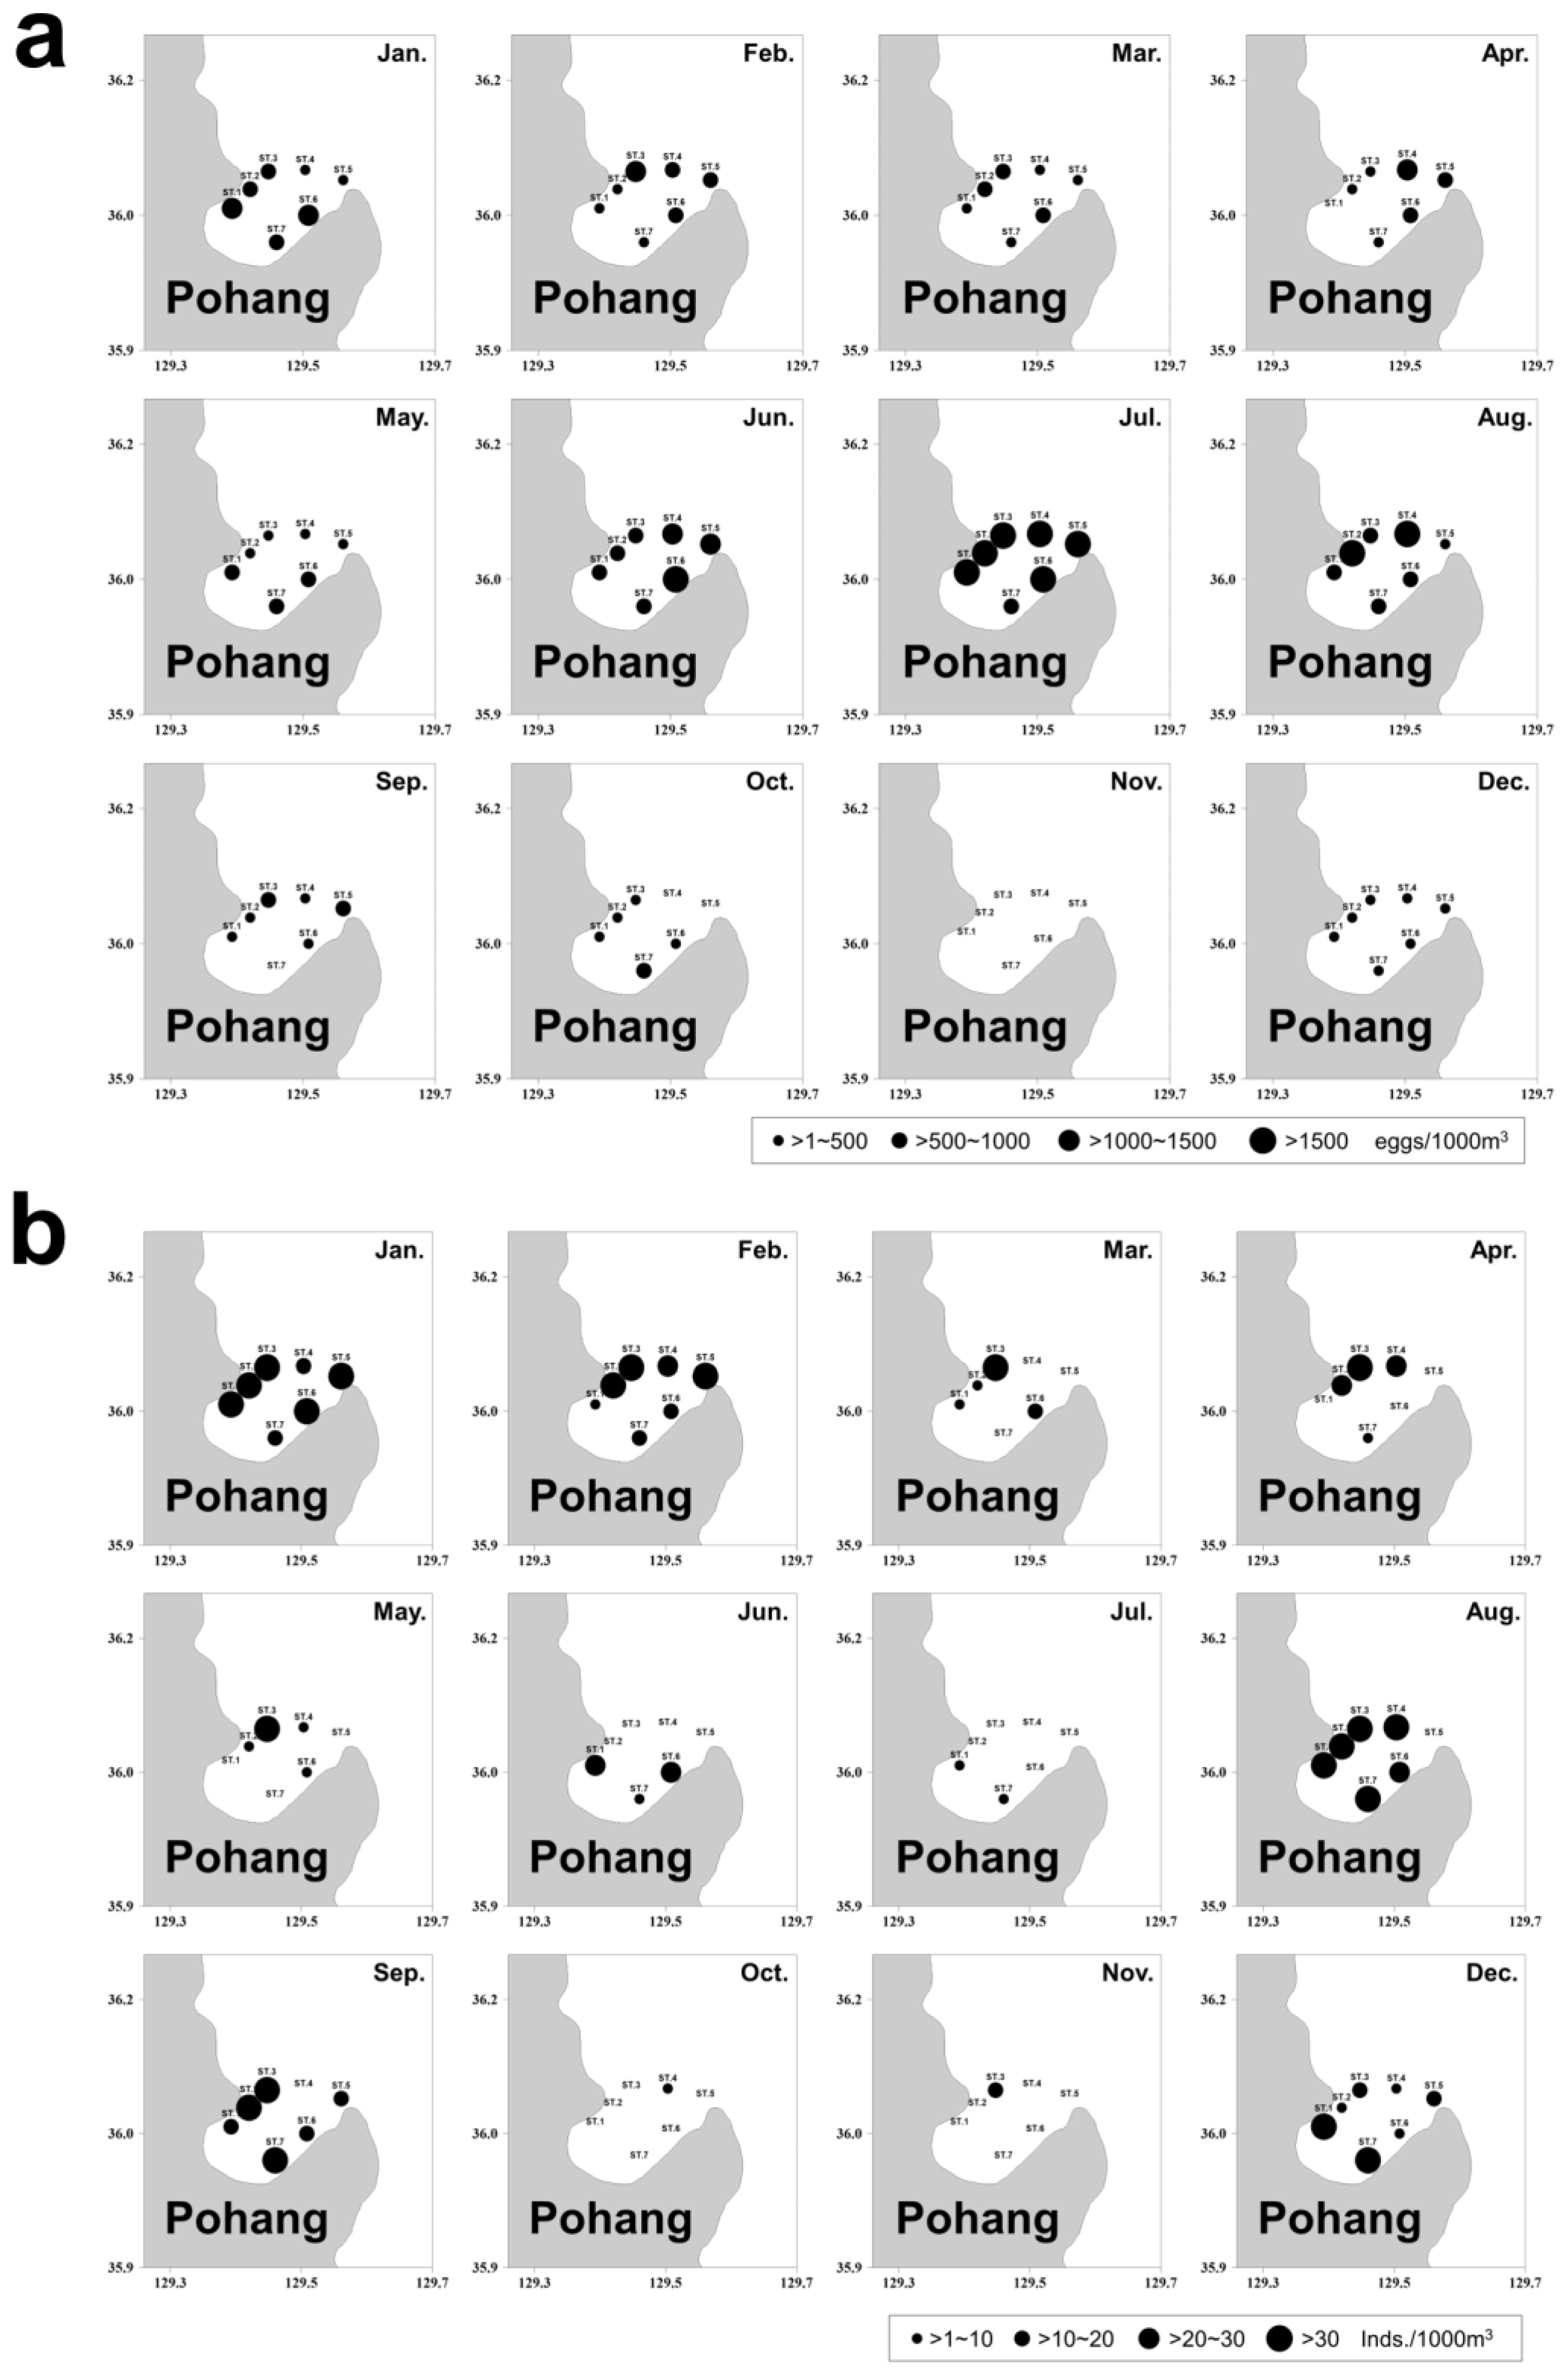
Egg density exhibited clear seasonal variation, with the highest densities observed at all sampling stations during June–August. No fish eggs were collected in November. Overall, lower egg density was observed during periods of lower water temperature (Figure 4). A total of 676 ± 739 eggs per 1000 m3 (mean ± standard deviation [SD], calculated from monthly mean abundance values) belonging to 36 species and 23 families, including one species newly recorded from Korean waters (Dinematichthys iluocoeteoides), were collected in Yeongil Bay (Table 1). In contrast, a mean of 28 ± 35 larvae per 1000 m3 (mean ± standard deviation [SD], calculated from monthly integrated abundance values) from 42 species and 22 families was collected (Table 2), indicating a higher number of taxa in larvae than in eggs. Fish egg abundance showed a clear seasonal pattern, increasing from spring and reaching the highest value in July (2881.3 eggs 1000 m−3), followed by relatively high abundance in June (1076.7 eggs 1000 m−3) and August (977.3 eggs 1000 m−3) (Table 1). Larval abundance exhibited two distinct seasonal peaks, with the highest abundance observed in January (110.4 larvae 1000 m−3) and a secondary peak in August (91.8 larvae 1000 m−3) (Table 2). Larval density was relatively high at all sampling stations during January and February, when water temperatures were low. Another peak in larval density was observed in August during the summer season (Figure 4).
Among the collected fish eggs, Engraulis japonicus was the most abundant species, accounting for 23.3% of the total egg abundance, followed by Pseudopleuronectes herzensteini (11.8%) and Sardinops sagax (9.8%). These three species together comprised a substantial proportion of the total egg assemblage. During periods of relatively high egg abundance, E. japonicus, Repomucenus valenciennei, and Scomber japonicus were dominant.
Among larvae, Sebastes inermis was the most abundant species, accounting for 29.7% of the total abundance, followed by Sillago japonica (20.7%) and Sebastiscus marmoratus (5.5%). Larval assemblages were dominated by a few abundant species. In January, S. inermis, Chirolophis japonicus, and Sebastes thompsoni were dominant, while in August, S. japonica, Parablennius yatabei, and Rudarius ercodes were dominant. This bimodal seasonal pattern reflected differences in dominant species composition among sampling periods. Overall, species richness was higher in larvae than that in eggs, and dominant species differed markedly between life stages, reflecting seasonal differences in ichthyoplankton assemblage composition in Yeongil Bay.

3.3. Seasonal Occurrence Pattern of Dominant Species

Seventy fish species occurred in Yeongil Bay during the study period. Among them, S. marmoratus larvae were collected eight times, from January to May and again from October to December, exhibiting the longest occurrence period among all species. In addition, Repomucenus curvicornis eggs were collected seven times from April to October, indicating a relatively prolonged occurrence period.
Seasonal differences were observed in the occurrence patterns of dominant species. During winter (January–March), when observed water temperatures ranged from approximately 10–11 °C, the occurrence of fish eggs was mainly associated with species belonging to the families Pleuronectidae and Sebastidae. In contrast, during summer (June–September), when observed water temperatures ranged from approximately 18–27 °C, a wider range of species, including E. japonicus, R. valenciennei, S. japonicus, Paralichthys olivaceus, Platycephalus indicus, P. yatabei, and S. japonica, showed high egg occurrence.
These results showed seasonal differences in the occurrence patterns of fish eggs and larvae under varying temperature and salinity conditions in Yeongil Bay, with relatively broader species occurrence during summer.

3.4. Assemblage Structure

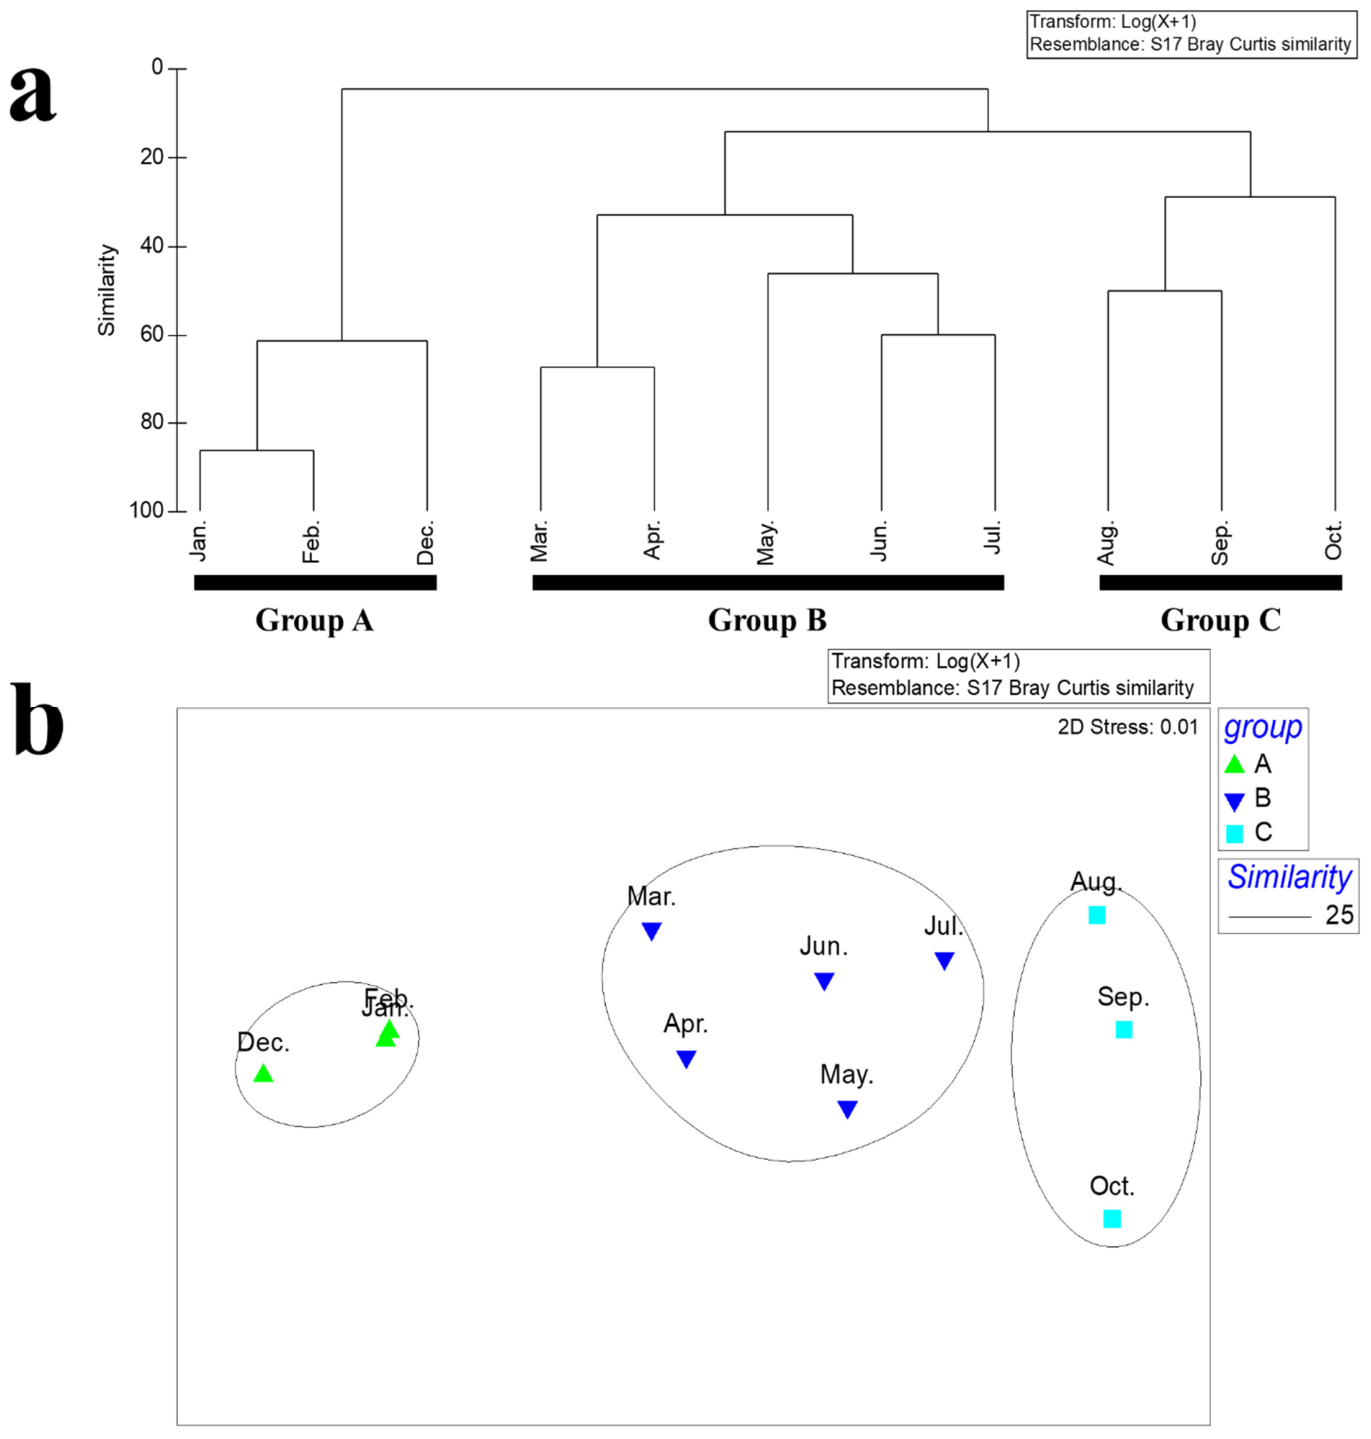
Thirty-six fish egg taxa were identified during the study period. nMDS analysis showed that egg assemblages could be divided into three groups at a Bray–Curtis similarity level of 25% (Figure 5). The similarity levels used to define egg (25%) and larval (30%) assemblage groups were selected to describe seasonal patterns in assemblage structure and were used for interpretation of temporal variation rather than statistical inference. Group A occurred mainly during the low-temperature period (January, February, and December), Group B during the increasing temperature period (March–July), and Group C during the decreasing temperature period (August–October). These groupings showed seasonal variation that broadly corresponded with seasonal hydrographic conditions.
According to SIMPER analysis, Group A exhibited an average similarity of 69.7%, with Platichthys bicoloratus (41.5%) and Platichthys stellatus (29.9%) identified as the main contributing species. Group B showed a similarity of 41.8%, with P. olivaceus, Acanthopagrus schlegelii, and S. sagax as the dominant contributors. Group C had a similarity of 35.9%, with R. curvicornis and Pseudolabrus sieboldi as the primary contributing species.
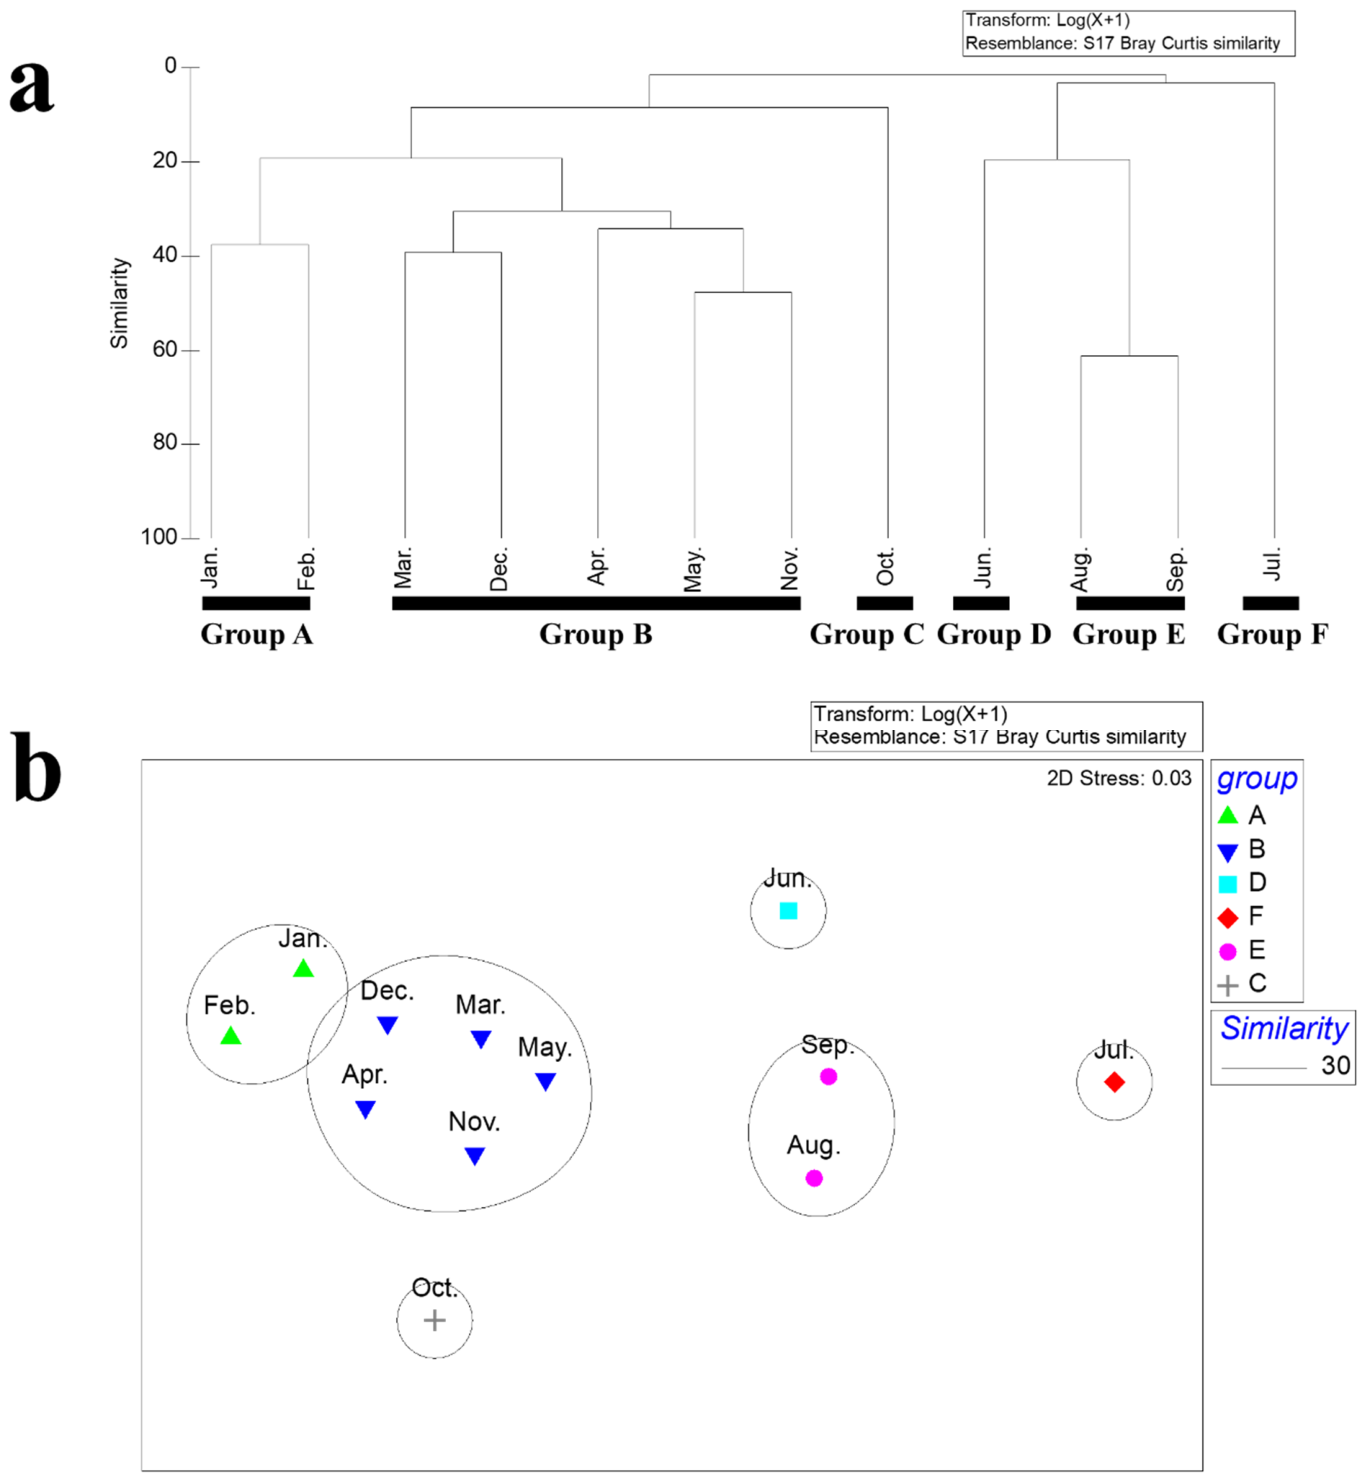
Forty-two larval fish taxa were identified. nMDS analysis showed that larval assemblages could be divided into six groups at a Bray–Curtis similarity level of 30% (Figure 6). Group A occurred mainly during the low-temperature period (January–February), Group B during spring and early winter (March–May and November–December), and Group E during the high-temperature period (August–September). In contrast, June, July, and October each formed independent assemblages, reflecting seasonal differences in community composition during transitional periods.
SIMPER analysis showed that Group A had an average similarity of 37.5%, with S. inermis and Hexagrammos otakii as major contributors. Group B exhibited a similarity of 33.8%, with S. marmoratus representing the dominant species. Group E showed the highest similarity (61.2%), with S. japonica, R. ercodes, and P. yatabei identified as the primary contributing species. ANOSIM supported the strong separation among the identified assemblage groups (egg assemblages: Global R = 0.942, p = 0.002; larval assemblages: Global R = 0.932, p = 0.001).
Overall, egg assemblages exhibited relatively simple seasonal grouping patterns, whereas larval assemblages showed more complex and subdivided structures. Larval assemblages exhibited greater separation among seasonal groups during transitional periods.

4. Discussion

In the present study, the ichthyoplankton assemblage in Yeongil Bay exhibited pronounced seasonal variability in both species composition and abundance. Fish eggs and larvae differed in dominant species and timing of occurrence, reflecting interspecific differences in spawning phenology and developmental characteristics. Seasonal variations in surface water temperature and salinity appeared to be associated with seasonal variation in assemblage patterns. Yeongil Bay is influenced by both the East Korean Warm Current and the North Korean Cold Current, resulting in substantial seasonal variability in temperature and salinity, which is associated with seasonal variation in ichthyoplankton assemblages [3]. Spatial variation in surface water temperature and salinity was observed between the inside and outside of the bay. Offshore waters generally exhibited slightly higher temperature and salinity than inside bay waters (Figure 3). The ichthyoplankton assemblage was dominated by species corresponding to their respective peak spawning seasons. For example, E. japonicus and S. japonica eggs were dominant during summer, while S. inermis was the dominant larval species. Notably, species richness was higher in larvae than that in eggs. One possible interpretation is that this pattern may reflect differences in occurrence characteristics and detectability between eggs and larvae, as well as the inclusion of species producing demersal eggs and species with diverse reproductive characteristics in the larval assemblage, whereas egg collections were dominated by pelagic eggs.
The number of species identified in this study was higher than that in previous studies conducted in Yeongil Bay. This increase may be associated with year-round sampling and the integration of morphological and molecular identification methods. In particular, DNA-based identification enabled accurate species-level resolution for morphologically indistinguishable eggs and early larvae, reducing the proportion of unidentified taxa reported in earlier studies.
Overall, egg abundance was higher than larval abundance. This pattern may be related to differences in developmental stage duration and occurrence characteristics between eggs and larvae. In semi-enclosed systems such as Yeongil Bay, egg and larva dispersion is relatively limited compared with that in open ocean environments, which may increase the likelihood of retaining early life stages within the bay [25]. Consequently, the occurrence of fish eggs and larvae during the study period suggests that Yeongil Bay may serve as a spawning area and potential nursery habitat for coastal fish species.
Previous studies in Korean coastal waters have shown that flatfishes (Pleuronectidae) dominate during low-temperature periods, whereas anchovies dominate during high-temperature periods [9,26,27]. Similarly, in the current study, winter assemblages were characterized by the predominance of Pleuronectidae and Sebastidae, while E. japonicus and S. japonica were predominant during summer assemblages (Table 1 and Table 2; Figure 6). During summer, both fish egg abundance and species diversity increased, coinciding with seasonal changes in assemblage composition and the occurrence of a greater number of species, as also reported in other bay systems [7,28,29].
Multivariate analyses showed that egg assemblages were relatively simple and formed seasonal grouping patterns, whereas larval assemblages exhibited more complex and subdivided structures. It should be noted that SIMPER analysis identifies taxa contributing to similarity patterns among groups and does not directly indicate ecological drivers. Although the assemblage groups identified in the present study were established primarily to describe seasonal variation patterns, the high ANOSIM R values (egg: R = 0.942; larvae: R = 0.932) suggest strong separation among seasonal assemblages during the study period. These differences in assemblage structure may reflect differences in occurrence characteristics and reproductive characteristics among species. Egg assemblages mainly reflect species producing pelagic eggs, which are concentrated in time and space shortly after spawning and may be influenced by hydrodynamic processes [29,30]. In contrast, larval assemblages include species with diverse reproductive strategies, including pelagic, demersal, and viviparous types, resulting in greater taxonomic diversity and more complex spatial and temporal patterns.
Differences in larval assemblage structure may also be associated with differences in occurrence and dispersal characteristics among species. Larvae originating from pelagic eggs may be dispersed over broader spatial and temporal scales by currents, resulting in relatively low densities at any given time [31]. In addition, larval occurrence patterns may vary with growth stage and vertical distribution [32,33,34]. In contrast, larvae from demersal eggs and viviparous species may exhibit more localized occurrence patterns associated with spawning habitats resulting in relatively limited overlap among species [35]. These contrasting characteristics may partly contribute to the more complex structure observed in larval assemblages.
The seasonal decrease in salinity observed during summer (August–September) coincided with the regional precipitation period and may reflect freshwater input from the Hyeongsan River. In particular, relatively low salinity values were observed at stations located inside the bay (Figure 5). In semi-enclosed systems such as Yeongil Bay, such inputs can substantially alter water mass structure and may be associated with ichthyoplankton distribution. Notably, although E. japonicus was the predominant species (23.3%) in the present study, its dominance was lower than that reported in previous studies (e.g., 83.9% in 2020) [9]. Anchovy spawning occurs optimally at temperatures of 19–24 °C and salinities of 33–34.4 [36]. In the current study, although temperature conditions were generally suitable, salinity decreased markedly during late summer (down to 29.2).
The lower dominance of E. japonicus observed in the present study coincided with seasonal variation in salinity conditions; however, the present study did not evaluate a direct relationship between salinity and anchovy.
+ occurrence, and additional studies are required to clarify this pattern.
Compared with other regions where anchovy typically dominate ichthyoplankton assemblages (often >50% [7,37,38,39]), the relatively low dominance observed in the present study may reflect seasonal environmental variation and differences in sampling design [40]. In addition, potential shifts in spawning phenology and distribution may also be considered as one possible explanation for the observed differences [41,42]; however, this interpretation remains speculative and long-term data are required to confirm such patterns, particularly given differences in sampling design (e.g., sampling period, frequency, and spatial coverage) among studies.
Among larvae, S. inermis was the predominant species (29.7%), occurring primarily from January to April and in December. This pattern may reflect the occurrence characteristics of this species in Yeongil Bay during the study period. Sebastes spp. are typically associated with rocky coastal habitats [43], and the bottom topography of Yeongil Bay, characterized by relatively shallow depths (8–35 m) and complex rocky substrates [44], may provide environmental conditions associated with the occurrence of these species. Similar patterns were observed for S. marmoratus, suggesting that benthic habitat characteristics may be associated with larval occurrence patterns.
D. iluocoeteoides is a tropical species that has not previously been reported from Korean waters. In the present study, a small number of eggs of this species were collected in January. This species is known to occur in tropical and subtropical waters (30°N–28°S), with its northern distribution limit extending to the coast of China [45]. In addition, eggs of D. iluocoeteoides have recently been reported from the East China Sea [46]. Although adults of this species have not yet been recorded in Korean waters, the occurrence of its eggs in the present study suggests the possibility that adults occur in adjacent waters or that the species may occur in Korean waters but remain undocumented. Alternatively, the observed occurrence may reflect transport of eggs from adjacent areas through oceanographic processes such as advection. Therefore, further studies are needed to clarify the distributional characteristics and spawning ecology of species for which adults have not been recorded in Korean waters but whose eggs and larvae are present.
Ichthyoplankton assemblages exhibited seasonal variability and appeared to coincide with seasonal hydrographic conditions. The present study assessed species composition and assemblage dynamics using integrative taxonomic approaches, providing baseline data for understanding seasonal variation in ichthyoplankton assemblages in Yeongil Bay.

5. Conclusions

In this study, the species composition and assemblage structure of ichthyoplankton in Yeongil Bay were assessed using the integration of morphological and molecular identification, which improved species-level resolution, particularly for morphologically similar eggs and early larvae. A total of 36 egg taxa and 42 larval taxa were recorded during the study period, and the ichthyoplankton assemblage showed seasonal variation. Fish egg abundance exhibited a peak in July, whereas larval abundance showed seasonal peaks in January and August. Engraulis japonicus was the dominant species in egg assemblages, whereas Sebastes inermis predominated in larval assemblages. Multivariate analyses showed strong seasonal separation in both egg and larval assemblages.
Fish eggs and larvae differed in dominant species and timing of occurrence, reflecting species-specific spawning strategies and developmental characteristics. Larval assemblages showed higher species diversity and more complex structures than egg assemblages. These findings suggest that Yeongil Bay may serve as an important spawning area and potential nursery habitat for coastal fish species. The ichthyoplankton data presented in this study provide baseline information for understanding temporal changes in coastal fish communities.
However, this study was based on a one-year survey and monthly sampling intervals, which may limit the resolution of short-term variability in ichthyoplankton dynamics and did not allow assessment of interannual variability, direct environmental modelling, or distinction between local spawning and advected eggs and larvae. Long-term and higher-frequency monitoring combined with quantitative environmental analyses would be necessary to better understand interannual variability and the influence of environmental variation on spawning dynamics.

Supplementary Materials

The following supporting information can be downloaded at: https://www.mdpi.com/article/10.3390/fishes11070405/s1, Table S1: Morphological features and molecular identification of fish eggs and larvae used in this study.

Author Contributions

Conceptualization, H.-S.J.; methodology, S.H.M. and H.-S.J.; software, S.H.M. and H.-S.J.; investigation, H.-J.Y. and S.H.M.; data curation, S.H.M. and H.-S.J.; writing—original draft preparation, S.H.M. and H.-S.J.; writing—review and editing, H.-S.J.; visualization, S.H.M.; supervision, J.-H.L.; project administration, S.C.Y.; funding acquisition, S.C.Y. All authors have read and agreed to the published version of the manuscript.

Funding

This research was funded by the National Institute of Fisheries Science (NIFS, R2026001).

Institutional Review Board Statement

The animal study protocol was approved by the Ethics Committee of the National Institute of Fisheries Science, Korea (protocol code: 2023-NIFS-IACUC-13; approval date: 13 April 2023).

Informed Consent Statement

Not applicable.

Data Availability Statement

The datasets generated and analyzed during this study are available from the corresponding author upon reasonable request.

Acknowledgments

We thank the researchers of the Fisheries Resources Research Center (NIFS) for their assistance with the survey.

Conflicts of Interest

The authors declare no conflicts of interest.

References

  1. Han, K.H.; Hong, J.S.; Kim, Y.S.; Jeon, K.A.; Kim, Y.S.; Hong, B.K.; Hwang, D.S. Species composition and seasonal variations of ichthyoplankton in coastal waters of Yeongil Bay, Korea. Korean J. Ichthyol. 2003, 15, 87–94. [Google Scholar]
  2. Yoon, B.B.; Jung, Y.H.; Sin, Y. Assessing nutrient limitation in Yeongsan River estuary using bioassay experiments. J. Mar. Sci. Eng. 2023, 11, 1337. [Google Scholar] [CrossRef]
  3. Lee, M.O.; Kim, J.K.; Kim, B.K. Marine Environmental Characteristics of Yeongil Bay, Korea. J. Korean Soc. Mar. Environ. Energy 2024, 26, 11–33. [Google Scholar] [CrossRef]
  4. Hong, S.E.; Bae, J.H.; Park, C.D.; Park, J.M.; Yoon, B.S.; An, H.C. Species composition and distribution property of dredge fishery in Yeongil Bay, Korea. J. Korean Soc. Fish. Ocean. Technol. 2016, 52, 48–55. [Google Scholar] [CrossRef]
  5. Faria, A.; Morais, P.; Chícharo, M.A. Ichthyoplankton dynamics in the Guadiana estuary and adjacent coastal area, South-East Portugal. Estuar. Coast. Shelf Sci. 2006, 70, 85–97. [Google Scholar] [CrossRef]
  6. Van Guelpen, L.; Goodwin, C.; Milne, R.; Pohle, G.; Courtenay, S. Distribution and structure of coastal ichthyoplankton communities of the Bay of Fundy in southern New Brunswick, Canada. Mar. Biodivers. 2021, 51, 1–17. [Google Scholar] [CrossRef]
  7. Myoung, S.H.; Kwak, S.N.; Kim, J.K.; Williamson, J.E. Effect of freshwater discharge from Namgang dam on ichthyoplankton assemblage structure in Jinju Bay, Korea. Aquat. Living Resour. 2021, 34, 18. [Google Scholar] [CrossRef]
  8. Jiang, Y.; Lin, B.A.; He, H.Y.; Ding, G.M.; Yan, L.T.; Zhang, G.; Liu, M.; Zheng, L.M.; Zheng, L. Species composition and assemblages of ichthyoplankton in Sansha Bay, Fujian Province, China. Front. Mar. Sci. 2021, 8, 758089. [Google Scholar] [CrossRef]
  9. Baek, J.I.; Ji, H.S.; Yu, H.J.; Hwang, K.S.; Kim, D.N. Distribution of eggs and larvae in coastal waters of Korea. Korean J. Fish. Aquat. Sci. 2021, 54, 467–479. [Google Scholar]
  10. Van Nynatten, A.; Gallage, K.S.; Lujan, N.K.; Mandrak, N.E.; Lovejoy, N.R. Ichthyoplankton metabarcoding: An efficient tool for early detection of invasive species establishment. Mol. Ecol. Resour. 2023, 23, 1319–1333. [Google Scholar] [CrossRef] [PubMed]
  11. Aoyama, J.; Ishikawa, S.; Otake, T.; Mochioka, N.; Suzuki, Y.; Watanabe, S.; Shinoda, A.; Inoue, J.; Lokman, P.M.; Inagaki, T.; et al. Molecular approach to species identification of eggs with respect to determination of the spawning site of the Japanese eel Anguilla japonica. Fish. Sci. 2001, 67, 761–763. [Google Scholar] [CrossRef]
  12. Sassa, C.; Konishi, Y.; Mori, K.E.N. Distribution of jack mackerel (Trachurus japonicus) larvae and juveniles in the East China sea, with special reference to the larval transport by the Kuroshio Current. Fish. Oceanogr. 2006, 15, 508–518. [Google Scholar] [CrossRef]
  13. Baumgartner, G.; Nakatani, K.; Gomes, L.C.; Bialetzki, A.; Sanches, P.V. Identification of spawning sites and natural nurseries of fishes in the upper Paraná River, Brazil. Environ. Biol. Fishes 2004, 71, 115–125. [Google Scholar] [CrossRef]
  14. Macedo-Soares, L.; Freire, A.; Muelbert, J. Small-scale spatial and temporal variability of larval fish assemblages at an isolated oceanic island. Mar. Ecol. Prog. Ser. 2012, 444, 207–222. [Google Scholar] [CrossRef]
  15. Rebstock, G.A.; Shil Kang, Y.S. A comparison of three marine ecosystems surrounding the Korean peninsula: Responses to climate change. Prog. Oceanogr. 2003, 59, 357–379. [Google Scholar] [CrossRef]
  16. Okiyama, M. An Atlas of the Early Stage Fishes in Japan, 2nd ed.; Tokai University Press: Hadano, Japan, 2014; 639p. [Google Scholar]
  17. Nelson, J.S.; Grande, T.C.; Wilson, M.V. Fishes of the World, 5th ed.; John Wiley and Sons Inc.: Hoboken, NJ, USA, 2016; p. 386. [Google Scholar]
  18. Lee, S.J.; Kim, J.K.; Ryu, J.H.; Yu, H.J.; Ji, H.S.; Im, Y.J. Molecular identification and morphological description of larvae for ten species of the family Pleuronectidae (Pleuronectiformes, PISCES) from Korea. J. Korean Soc. Fish. Technol. 2019, 55, 335–348. [Google Scholar] [CrossRef]
  19. Ward, R.D.; Zemlak, T.S.; Innes, B.H.; Last, P.R.; Hebert, P.D.N. DNA barcoding Australia’s fish species. Philos. Trans. R. Soc. Lond. B Biol. Sci. 2005, 360, 1847–1857. [Google Scholar] [CrossRef] [PubMed]
  20. Palumbi, S.R. What can molecular genetics contribute to marine biogeography? An urchin’s tale. J. Exp. Mar. Biol. Ecol. 1996, 203, 75–92. [Google Scholar] [CrossRef]
  21. Thompson, J.D.; Higgins, D.G.; Gibson, T.J.; Clustal, W. Improving the sensitivity of progressive multiple sequence alignment through sequence weighting, position-specific gap penalties and weight matrix choice. Nucleic Acids Res. 1994, 22, 4673–4680. [Google Scholar] [CrossRef] [PubMed]
  22. Hall, T.A. BioEdit: A user-friendly biological sequence alignment editor and analysis program for windows 95/98/NT. Nucleic Acids Symp. Ser. 1999, 41, 95–98. [Google Scholar]
  23. Bray, J.R.; Curtis, J.T. An ordination of the upland forest communities of southern Wisconsin. Ecol. Monogr. 1957, 27, 325–349. [Google Scholar] [CrossRef] [PubMed]
  24. Clarke, K.R.; Gorley, R.N. Primer v6.0. In User Manual/Tutorial; PRIMER-E: Plymouth, UK; Marine Laboratory: Plymouth, UK, 2006; Volume 1. [Google Scholar]
  25. Myoung, S.H.; Ji, H.S.; Yu, H.J.; Kim, H.J.; Kim, H.J.; Lee, B.R. Ichthyoplankton assemblage structure in Jinhae Bay, Korea. J. Coast. Res. 2024, 116, 583–587. [Google Scholar] [CrossRef]
  26. Choi, H.C.; Yoo, M.H.; Youn, S.H.; Oh, H.J. Distribution of fish larvae in the southern coastal waters (Yeosu, Namhae and Tongyoung) of Korea in spring and summer. J. Korean Soc. Mar. Environ. Saf. 2017, 23, 759–766. [Google Scholar] [CrossRef]
  27. Park, J.M.; Kim, J.H.; Myoung, S.H.; Jung, Y.H.; Lee, D.W.; Choi, D.M.; Lee, H.G. Seasonal variations in species composition of larval fish assemblage in the coastal waters off Uljin, East Sea. Korean J. Ichthyol. 2024, 36, 156–163. [Google Scholar] [CrossRef]
  28. Mota, E.M.T.; Garcia, T.M.; Freitas, J.E.P.; Soares, M.O. Composition and cross-shelf distribution of ichthyoplankton in the tropical southwestern Atlantic. Reg. Stud. Mar. Sci. 2017, 14, 27–33. [Google Scholar] [CrossRef]
  29. Tan, Z.; Wu, F.; Rao, Y.; Pan, C.; Hou, G.; Huang, H. Spatial and temporal distribution of fish egg communities in the adjacent waters of Daya Bay nuclear power plant and their relationship with environmental factors. Front. Mar. Sci. 2023, 10, 1182213. [Google Scholar] [CrossRef]
  30. Pacariz, S.; Björk, G.; Jonsson, P.; Börjesson, P.; Svedäng, H. A model study of the large-scale transport of fish eggs in the Kattegat in relation to egg density. ICES J. Mar. Sci. 2014, 71, 345–355. [Google Scholar] [CrossRef]
  31. Planes, S.; Jones, G.P.; Thorrold, S.R. Larval dispersal connects fish populations in a network of marine protected areas. Proc. Natl. Acad. Sci. USA 2009, 106, 5693–5697. [Google Scholar] [CrossRef] [PubMed]
  32. Isobe, A.; Ando, M.; Watanabe, T.; Senjyu, T.; Sugihara, S.; Manda, A. Freshwater and temperature transports through the Tsushima-Korea straits. J. Geophys. Res. 2002, 107, 3065. [Google Scholar] [CrossRef]
  33. Lee, S.J.; Kim, J.B.; Han, S.H. Distribution of mackerel, Scomber japonicus eggs and larvae in the coast of Jeju island, Korea in spring. J. Korean Soc. Fish. Technol. 2016, 52, 121–129. [Google Scholar] [CrossRef]
  34. Kim, S.R.; Kim, J.J.; Stockhausen, W.T.; Kim, C.S.; Kang, S.; Cha, H.K.; Ji, H.S.; Jang, S.H.; Baek, H.J. Characteristics of the eggs and larval distribution and transport process in the early life stage of the chub mackerel Scomber japonicus near Korean waters. Korean J. Fish. Aquat. Sci. 2019, 52, 666–684. [Google Scholar] [CrossRef]
  35. Lin, Y.J.; Roa-Ureta, R.H.; Pulikkoden, A.R.K.; Premlal, P.; Nazeer, Z.; Qurban, M.A.; Rabaoui, L. Essential fish habitats of demersal fish in the western Arabian gulf. Mar. Pollut. Bull. 2021, 173, 113013. [Google Scholar] [CrossRef] [PubMed]
  36. Ko, J.C.; Seo, Y.L.; Kim, H.Y.; Lee, S.K.; Cha, H.K.; Kim, J.I. Distribution characteristics of eggs and larvae of the anchovy Engraulis japonica in the Yeosu and Tongyeong coastal waters of Korea. Korean J. Ichthyol. 2010, 22, 256–266. [Google Scholar]
  37. Han, K.H.; Kim, D.Y.; Jin, D.S.; Shin, S.S.; Baik, S.R.; Oh, S.H. Seasonal variation and species composition of ichthyoplankton in Sunchon Bay, Korea. Korean J. Ichthyol. 2001, 13, 136–142. [Google Scholar]
  38. Koh, S.J.; Seo, S.H.; Lee, S.H.; Yu, T.S.; Han, K.H. Species composition of ichthyoplankton in the coastal water between Yeosu and Namhae, Korea. Korean J. Ichthyol. 2019, 31, 159–164. [Google Scholar] [CrossRef]
  39. Choi, H.C.; Jung, H.K.; Cho, J.H.; Youn, S.H.; Oh, H.J. Distribution of larval fishes off the East Sea, Korea. Korean J. Ichthyol. 2022, 34, 186–200. [Google Scholar] [CrossRef]
  40. Pepin, P.; Helbig, J.A. Sampling variability of ichthyoplankton surveys—Exploring the roles of scale and resolution on uncertainty. Fish. Res. 2012, 117, 137–145. [Google Scholar] [CrossRef]
  41. Kanamori, Y.; Takasuka, A.; Nishijima, S.; Okamura, H. Climate change shifts the spawning ground northward and extends the spawning period of chub mackerel in the western north pacific. Mar. Ecol. Prog. Ser. 2019, 624, 155–166. [Google Scholar] [CrossRef]
  42. Go, S.; Lee, J.H.; Jung, S. Projecting the shift of chub mackerel (Scomber japonicus) spawning grounds driven by climate change in the western north Pacific Ocean. Fishes 2025, 10, 20. [Google Scholar] [CrossRef]
  43. An, C.M.; Kwak, S.N.; Park, J.M.; Huh, S.H. Species composition and behavioral characteristics of released black rockfish, Sebastes inermis in the coastal waters off Namhae island, Korea. Korean J. Fish. Aquat. Sci. 2010, 43, 262–269. [Google Scholar] [CrossRef]
  44. Lee, J.M.; Han, H.S.; Han, H.C.; Kong, K.S.; Seo, Y.K. A study on topographic features of Yeongil bay using multibeam data. In Proceedings of the Korean Society of Marine Engineering Conference, Mokpo, Republic of Korea, 22–24 April 2010; pp. 379–383. [Google Scholar]
  45. FishBase. World Wide Web Electronic Publication; Froese, R., Pauly, D., Eds.; 2026; Available online: https://www.fishbase.org (accessed on 30 June 2026).
  46. Jiang, R.; Mchura, M.; Liang, Z.; Yin, R.; Zhou, Y.; Chen, Y. Identification of ichthyoplankton in the East China Sea off the Coast of Zhoushan Archipelago using an integrated strategy of morphology and DNA barcoding. Authorea Prepr. 2023. [Google Scholar] [CrossRef] [PubMed]
Figure 1. Map showing fish egg and larva sampling stations in Yeongil Bay, Korea, from January 2023 to December 2023.
Fishes 11 00405 g001
Figure 4. Monthly spatial distribution of fish egg (a) and larval (b) densities at each sampling station in Yeongil bay, Korea, from January to December 2023.
Fishes 11 00405 g004
Figure 5. Cluster analysis (a) and non-metric multidimensional scaling (nMDS) ordination (b) of monthly egg assemblages in Yeongil Bay, Korea, based on monthly mean egg abundance data from January to December 2023 (n = 11 samples; November excluded because no eggs were collected). Prior to analysis, abundance data were log(x + 1) transformed, and Bray–Curtis similarity was used as the resemblance measure. Samples were grouped according to the cluster analysis at a 25% similarity level, resulting in three groups (A–C). The nMDS ordination showed a stress value of 0.01. No all-zero samples were included in the analysis. Ellipses indicate the groups identified by cluster analysis.
Fishes 11 00405 g005
Figure 6. Cluster analysis (a) and non-metric multidimensional scaling (nMDS) ordination (b) of monthly larval assemblages in Yeongil Bay, Korea, based on monthly mean larval abundance data from January to December 2023 (n = 12 samples). Prior to analysis, abundance data were log(x + 1) transformed, and Bray–Curtis similarity was used as the resemblance measure. Samples were grouped according to the cluster analysis at a 30% similarity level, resulting in six groups (A–F). The nMDS ordination showed a stress value of 0.03. Ellipses indicate the groups identified by cluster analysis.
Fishes 11 00405 g006
Table 1. Temporal variation in the abundance of fish eggs (unit: eggs 1000 m−3) collected in Yeongil Bay, Korea, from January to December 2023.
SpeciesJanuaryFebruaryMarchAprilMayJuneJulyAugustSeptemberOctoberNovemberDecemberMean%
Konosirus punctatus0.00.00.00.061.710.50.00.00.00.00.00.06.00.9
Sardinops sagax0.00.0277.9357.70.5157.70.00.00.00.00.00.066.29.8
Engraulis japonicus0.00.00.00.00.0253.51559.247.528.80.00.00.0157.423.3
Dinematichthys iluocoeteoides1.90.00.00.00.00.00.00.00.00.00.00.00.2+
Repomucenus valenciennei0.00.00.08.00.0154.0360.317.90.00.00.00.045.06.7
Repomucenus beniteguri0.00.02.14.0119.553.40.00.00.00.00.00.014.92.2
Repomucenus curvicornis0.00.00.02.583.741.385.3121.013.5146.40.00.041.16.1
Seriola quinqueradiata0.00.00.00.00.30.00.00.00.00.00.00.00.0+
Trachurus japonicus0.00.00.00.05.020.42.50.013.00.00.00.03.40.5
Coryphaena hippurus0.00.00.00.00.00.00.00.80.00.00.00.00.1+
Parajulis poecilepterus0.00.00.00.00.00.033.90.00.80.00.00.02.90.4
Halichoeres tenuispinis0.00.00.00.00.00.00.0107.42.80.00.00.09.21.4
Pseudolabrus sieboldi0.00.00.00.00.00.00.05.8132.92.40.00.011.81.7
Semicossyphus reticulatus0.00.00.00.00.00.08.00.02.30.00.00.00.90.1
Nuchequula nuchalis0.00.00.00.014.30.00.00.71.60.00.00.01.40.2
Lateolabrax japonicus1.00.00.00.00.00.00.00.00.00.00.00.00.1+
Upeneus japonicus0.00.00.00.00.00.00.00.01.30.00.00.00.1+
Sciaenops ocellatus0.00.00.00.00.00.00.0516.60.00.00.00.043.06.4
Scomber japonicus0.00.00.02.60.554.5247.50.00.00.00.00.025.43.8
Sillago japonica0.00.00.00.00.00.039.326.952.20.00.00.09.91.5
Acanthopagrus schlegelii0.00.02.419.657.918.554.40.00.00.00.00.012.71.9
Evynnis cardinalis0.00.00.00.00.00.00.00.01.20.00.00.00.1+
Pagrus major0.00.01.70.048.80.055.90.00.00.00.00.08.91.3
Sphyraena pinguis0.00.00.00.00.03.650.10.00.00.00.00.04.50.7
Rhynchopelates oxyrhynchus0.00.00.00.00.033.60.00.00.00.00.00.02.80.4
Cynoglossus interruptus0.00.00.00.00.00.00.00.05.612.40.00.01.50.2
Paralichthys olivaceus0.00.024.044.9125.3256.2161.80.00.00.00.00.051.07.6
Pseudorhombus pentophthalmus0.00.00.00.00.016.119.60.00.00.00.00.03.00.4
Glyptocephalus stelleri0.00.03.10.00.01.41.60.00.00.00.00.00.50.1
Hippoglossoides dubius0.00.61.00.00.00.00.00.00.00.00.00.00.1+
Platichthys bicoloratus98.3144.80.00.00.00.00.00.00.00.00.029.822.73.4
Platichthys stellatus195.432.70.00.00.00.00.00.00.00.00.09.919.82.9
Pseudopleuronectes herzensteini422.1386.0115.531.60.00.00.00.00.00.00.02.979.811.8
Platycephalus indicus0.00.00.00.00.00.00.0130.44.40.00.00.011.21.7
Paracentropogon rubripinnis0.00.00.00.00.00.0197.92.53.40.00.00.017.02.5
Lepidotrigla microptera0.00.05.70.01.12.04.10.00.00.00.00.01.10.2
No. of species54981215161115303
Total718.6564.1433.5471.1518.41076.72881.3977.3263.6161.20.042.6675.7100
+: <0.1%.
Table 2. Temporal variation in the abundance of fish larvae (unit: larvae 1000 m−3) collected in Yeongil Bay, Korea, from January to December 2023.
SpeciesJanuaryFebruaryMarchAprilMayJuneJulyAugustSeptemberOctoberNovemberDecemberMean%
Engraulis japonicus0.00.00.00.00.00.01.10.00.00.00.00.00.10.3
Ammodytes japonicus0.63.70.00.00.00.00.00.00.00.00.00.00.41.3
Omobranchus elegans0.00.00.00.00.01.60.00.00.00.00.00.00.10.5
Parablennius yatabei0.00.00.00.01.40.00.011.74.50.00.00.01.55.3
Petroscirtes breviceps0.00.00.00.00.00.00.00.01.30.00.00.00.10.4
Repomucenus valenciennei0.00.00.00.00.03.70.01.38.40.00.00.01.14.0
Repomucenus beniteguri0.00.00.00.00.00.00.01.00.00.00.00.00.10.3
Coryphaena hippurus0.00.00.00.00.00.00.00.00.20.00.00.00.00.1
Acanthogobius flavimanus2.70.50.00.00.00.00.00.00.00.00.00.00.31.0
Acentrogobius pflaumii0.00.00.00.00.00.70.00.50.00.00.00.00.10.4
Parajulis poecilepterus0.00.00.00.00.00.00.02.61.20.00.00.00.31.1
Stethojulis terina0.00.00.00.00.00.00.00.80.00.00.00.00.10.2
Lateolabrax japonicus0.00.00.80.00.00.00.00.00.00.00.00.00.10.2
Chromis notata0.00.00.00.00.00.50.00.00.20.00.00.00.10.2
Pomacentrus coelestis0.00.00.00.00.00.00.00.70.00.00.00.00.10.2
Sillago japonica0.00.00.00.00.00.00.053.915.50.00.00.05.820.7
Chirolophis japonicus7.10.00.00.00.00.00.00.00.00.00.00.00.62.1
Cynoglossus joyneri0.00.00.00.00.00.00.00.01.20.00.00.00.10.3
Platichthys bicoloratus0.01.50.00.00.00.00.00.00.00.00.00.00.10.5
Pseudopleuronectes yokohamae0.08.00.00.00.00.00.00.00.00.00.00.00.72.4
Alcichthys elongatus0.70.00.00.00.00.00.00.00.00.00.00.00.10.2
Gymnocanthus intermedius1.60.00.00.00.00.00.00.00.00.00.00.00.10.5
Pseudoblennius cottoides2.40.00.00.00.00.00.00.00.00.00.00.00.20.7
Hexagrammos otakii2.01.40.00.00.00.00.00.00.00.00.010.71.24.2
Liparis chefuensis0.00.00.00.50.00.00.00.00.00.00.00.00.00.1
Sebastes hubbsi1.00.00.00.00.00.00.00.00.00.00.00.00.10.3
Sebastes inermis78.216.50.03.10.00.00.00.00.00.00.01.88.329.7
Sebastes pachycephalus1.30.40.00.80.40.00.00.00.00.00.00.00.20.9
Sebastes thompsoni6.90.04.10.00.00.00.00.00.00.00.02.11.13.9
Sebastes vulpes0.00.01.00.00.00.00.00.00.00.00.00.00.10.3
Sebastiscus marmoratus2.40.45.42.33.90.00.00.00.00.22.21.71.55.5
Rudarius ercodes0.00.00.00.00.00.00.58.95.60.00.00.01.24.5
Stephanolepis cirrhifer0.00.00.00.00.00.00.00.00.20.00.00.00.00.1
Gymnapogon sp.0.00.00.00.00.00.00.00.81.20.00.00.00.20.6
Alectrias sp.0.70.00.00.00.00.00.00.00.00.00.00.60.10.4
Chirolophis sp.2.80.00.00.00.00.00.00.00.00.00.00.00.20.8
Scorpaena sp.0.00.00.00.00.00.00.02.50.00.00.00.00.20.7
Sebastiscus sp.0.00.00.05.50.00.00.00.00.00.00.00.00.51.6
Callionymidae sp.0.00.00.00.00.00.00.06.10.20.00.00.00.51.9
Gobiidae sp.0.00.00.00.00.80.50.01.11.50.00.00.00.31.2
Opistognathidae sp.0.00.00.00.00.00.00.00.00.00.10.00.00.00.0
Unidentified fish0.00.00.00.00.40.50.00.00.00.00.00.00.10.3
No. of species148455621313215
Total110.432.511.312.26.97.61.691.841.20.32.216.927.9100
Disclaimer/Publisher’s Note: The statements, opinions and data contained in all publications are solely those of the individual author(s) and contributor(s) and not of MDPI and/or the editor(s). MDPI and/or the editor(s) disclaim responsibility for any injury to people or property resulting from any ideas, methods, instructions or products referred to in the content.