Article

Revealing Ontogenetic Vertical Migration in Deep-Sea Grenadiers (Macrouridae) from the Southwestern Atlantic Through Otolith Microchemistry


by
César Santificetur
1,2,
Rodolfo Miguel Silva
2,3,
Ana Méndez
4,
Jorge Pisonero
4 and
Alberto Teodorico Correia
2,3,*
1
Laboratory of Fish Diversity, Ecology and Evolution (DEEP Lab), Oceanographic Institute, University of São Paulo (IOUSP), Praça do Oceanográfico 191, São Paulo 05508-120, Brazil
2
Interdisciplinary Centre of Marine and Environmental Research (CIIMAR/CIMAR), Terminal de Cruzeiros do Porto de Leixões, Avenida General Norton de Matos S/N, 4450-208 Matosinhos, Portugal
3
School of Medicine and Biochemical Sciences (ICBAS), University of Porto (UP), Rua Jorge Viterbo Ferreira 228, 4050-313 Porto, Portugal
4
Scientific and Technical Services (SCTs), University of Oviedo (UNIOVI), Gonzalo Gutiérrez Quirós SN, 33600 Oviedo, Spain
*
Author to whom correspondence should be addressed.
Fishes 2026, 11(5), 288; https://doi.org/10.3390/fishes11050288
Submission received: 31 March 2026 / Revised: 30 April 2026 / Accepted: 9 May 2026 / Published: 12 May 2026
(This article belongs to the Special Issue Application of Otoliths in Fish Ecology and Fisheries)

Abstract

Understanding the life-history strategies of deep-sea fishes is essential for improving ecological knowledge and informing conservation efforts. Using otolith microchemistry, this study reconstructed the ontogenetic movement patterns of four grenadier species (Nezumia aequalis, Hymenocephalus billsam, Coelorinchus marinii, and Malacocephalus occidentalis) caught in the continental slope off southern Brazil (Southwestern Atlantic). Elemental signatures (Ba:Ca, Sr:Ca, Li:Ca, Mg:Ca, Mn:Ca, Ni:Ca, Cu:Ca, and Zn:Ca) were quantified along core-to-edge transects of sagittal otoliths using Laser Ablation Inductively Coupled Plasma Mass Spectrometry (LA-ICP-MS). Ontogenetic shifts were identified using change-point detection (PELT). A general decline in elemental incorporation with age was observed across species, consistent with ontogenetic physiological regulation. Species-specific multi-elemental patterns suggest distinct ecological strategies. Nezumia aequalis exhibited an abrupt decline in Ba:Ca, indicating an early-life environmental shift. Hymenocephalus billsam showed increasing Ba:Ca and Sr:Ca profiles, consistent with continued use of pelagic-associated water masses. Coelorinchus marinii and Malacocephalus occidentalis displayed more complex patterns, with the latter showing pronounced Ba:Ca and Zn:Ca peaks that may reflect mid-life habitat shifts or physiological events. Mn:Ca ratios differed between pelagic and demersal species. Otolith microchemistry combined with change-point analysis could provide insights into deep-sea fish ontogeny, although interpretations should consider both environmental and physiological influences.
Key Contribution: This study applies multi-elemental otolith microchemistry (Element:Ca ratios) combined with change-point analysis (PELT) to investigate ontogenetic habitat shifts in deep-sea grenadiers from the Southwestern Atlantic. By integrating environmental and physiological proxies, it reveals species-specific life-history strategies and highlights the importance of cautious interpretation when inferring ecological patterns from otolith geochemistry.

1. Introduction

Deep-sea fishes inhabit extreme environments characterized by extreme physicochemical conditions, including low temperatures, aphotic conditions, and limited trophic resources [1,2,3]. These conditions are often associated with K-selected life-history strategies, characterized by slow growth, late sexual maturation, and extended longevity [2,3,4]. However, this view has been increasingly nuanced; recent studies reveal a broader spectrum of life-history traits in deep-sea communities, reflecting diverse adaptations to environmental constraints and trophic opportunities [5,6,7]. Understanding this ecological diversity is particularly relevant for dominant benthic families such as the Macrouridae, which constitute a key component of fish assemblages on the continental slope of southern Brazil [8,9,10]. These grenadier species play important trophic roles as both predators and prey, contributing to nutrient transport and energy flow within deep-sea ecosystems and influencing the structure and dynamics of benthic communities [11,12,13]. Despite their ecological significance, the movement patterns and habitat use during the ontogenetic development of these species remain poorly understood, creating a critical knowledge gap for conservation and management purposes [14,15,16].
Otolith microchemistry has emerged as a powerful tool to reconstruct such life-history trajectories, offering a means to address this gap [17,18,19]. Otoliths, aragonitic structures located in the inner ear, grow continuously through incremental layer deposition, incorporating vestigial and trace elements from the ambient water into their crystalline matrix. Their chemical composition thus reflects a combination of environmental conditions and physiological processes, allowing otoliths to function as natural chronological tags of individual environmental history [20,21,22].
Among the suite of elements incorporated, certain element-to-calcium ratios are particularly informative for inferring depth-related habitat use. Barium-to-calcium (Ba:Ca) ratios generally increase with depth, reflecting ambient water barium concentrations [23,24,25], while strontium-to-calcium (Sr:Ca) ratios primarily correlate with salinity and temperature gradients [26,27,28]. Other elements, such as magnesium (Mg:Ca), manganese (Mn:Ca), and zinc (Zn:Ca), are more strongly influenced by physiological processes, including metabolism and reproduction [17,29]. By analyzing multiple element:Ca ratios simultaneously, it becomes possible to disentangle environmental signals from physiological influences, offering a more comprehensive view of ontogenetic movements than single-elemental approaches. Lithium has been proposed as a natural tracer of continental inputs and water mass provenance, with Li:Ca ratios in otoliths helping to discriminate between freshwater and marine environments [30,31]. Copper, in turn, is an essential micronutrient whose incorporation into otoliths is strongly regulated by physiological processes such as metabolism and reproduction, making Cu:Ca a more reliable marker of internal events than of environmental conditions [29,32]. Including these elements alongside traditional environmental proxies (Sr, Ba, Mn) thus provides a more integrated view of the factors shaping otolith chemistry.
While numerous studies have applied otolith microchemistry to shallow-water species, only a limited number of studies have investigated deep-sea fishes, particularly grenadiers [25,33,34]. Moreover, previous studies on deep-sea species have often focused on single-elemental ratios (e.g., Ba:Ca or Sr:Ca), limiting their ability to disentangle environmental signals from physiological influences [17,35,36]. This limitation is partially addressed by the multi-elemental approach described below. Recent studies in coastal and estuarine species have demonstrated that multi-elemental otolith profiles can effectively reconstruct habitat use shifts throughout life by incorporating elements with contrasting controls, some primarily reflecting environmental conditions (e.g., Ba:Ca, Sr:Ca) and others capturing physiological processes (e.g., Mg:Ca, Mn:Ca, Zn:Ca) [37,38,39]. Extending this multi-elemental framework to deep-sea fishes offers a pathway to overcome the challenges associated with interpreting vertical movements. The simultaneous analysis of multiple element:Ca ratios allows for the differentiation between depth-related environmental signals and endogenous physiological effects [17,29,36]. In this study, this approach was applied to four grenadier species, namely Coelorinchus marinii, Hymenocephalus billsam, Malacocephalus occidentalis, and Nezumia aequalis, collected on the continental slope off southern Brazil.
This study investigated: (i) whether multi-elemental otolith signatures (Ba:Ca, Sr:Ca, Li:Ca, Mg:Ca, Mn:Ca, Ni:Ca, Cu:Ca, Zn:Ca) exhibit significant changes throughout ontogeny; (ii) whether these patterns are consistent across species or reflect distinct ecological strategies; and (iii) whether ontogenetic phases associated with different depth zones or habitats can be distinguished based on these profiles. Within this context, pelagic (Hymenocephalus billsam), demersal (Malacocephalus occidentalis), and benthopelagic species (Coelorinchus marinii and Nezumia aequalis) are expected to exhibit distinct elemental signatures, reflecting their contrasting habitat use. Elements under physiological control (Mg:Ca, Mn:Ca, Zn:Ca) are expected to show common age-related patterns across species, whereas environmentally controlled elements are likely to reflect species-specific strategies.

2. Materials and Methods

2.1. Sample Collection and Biological Sampling

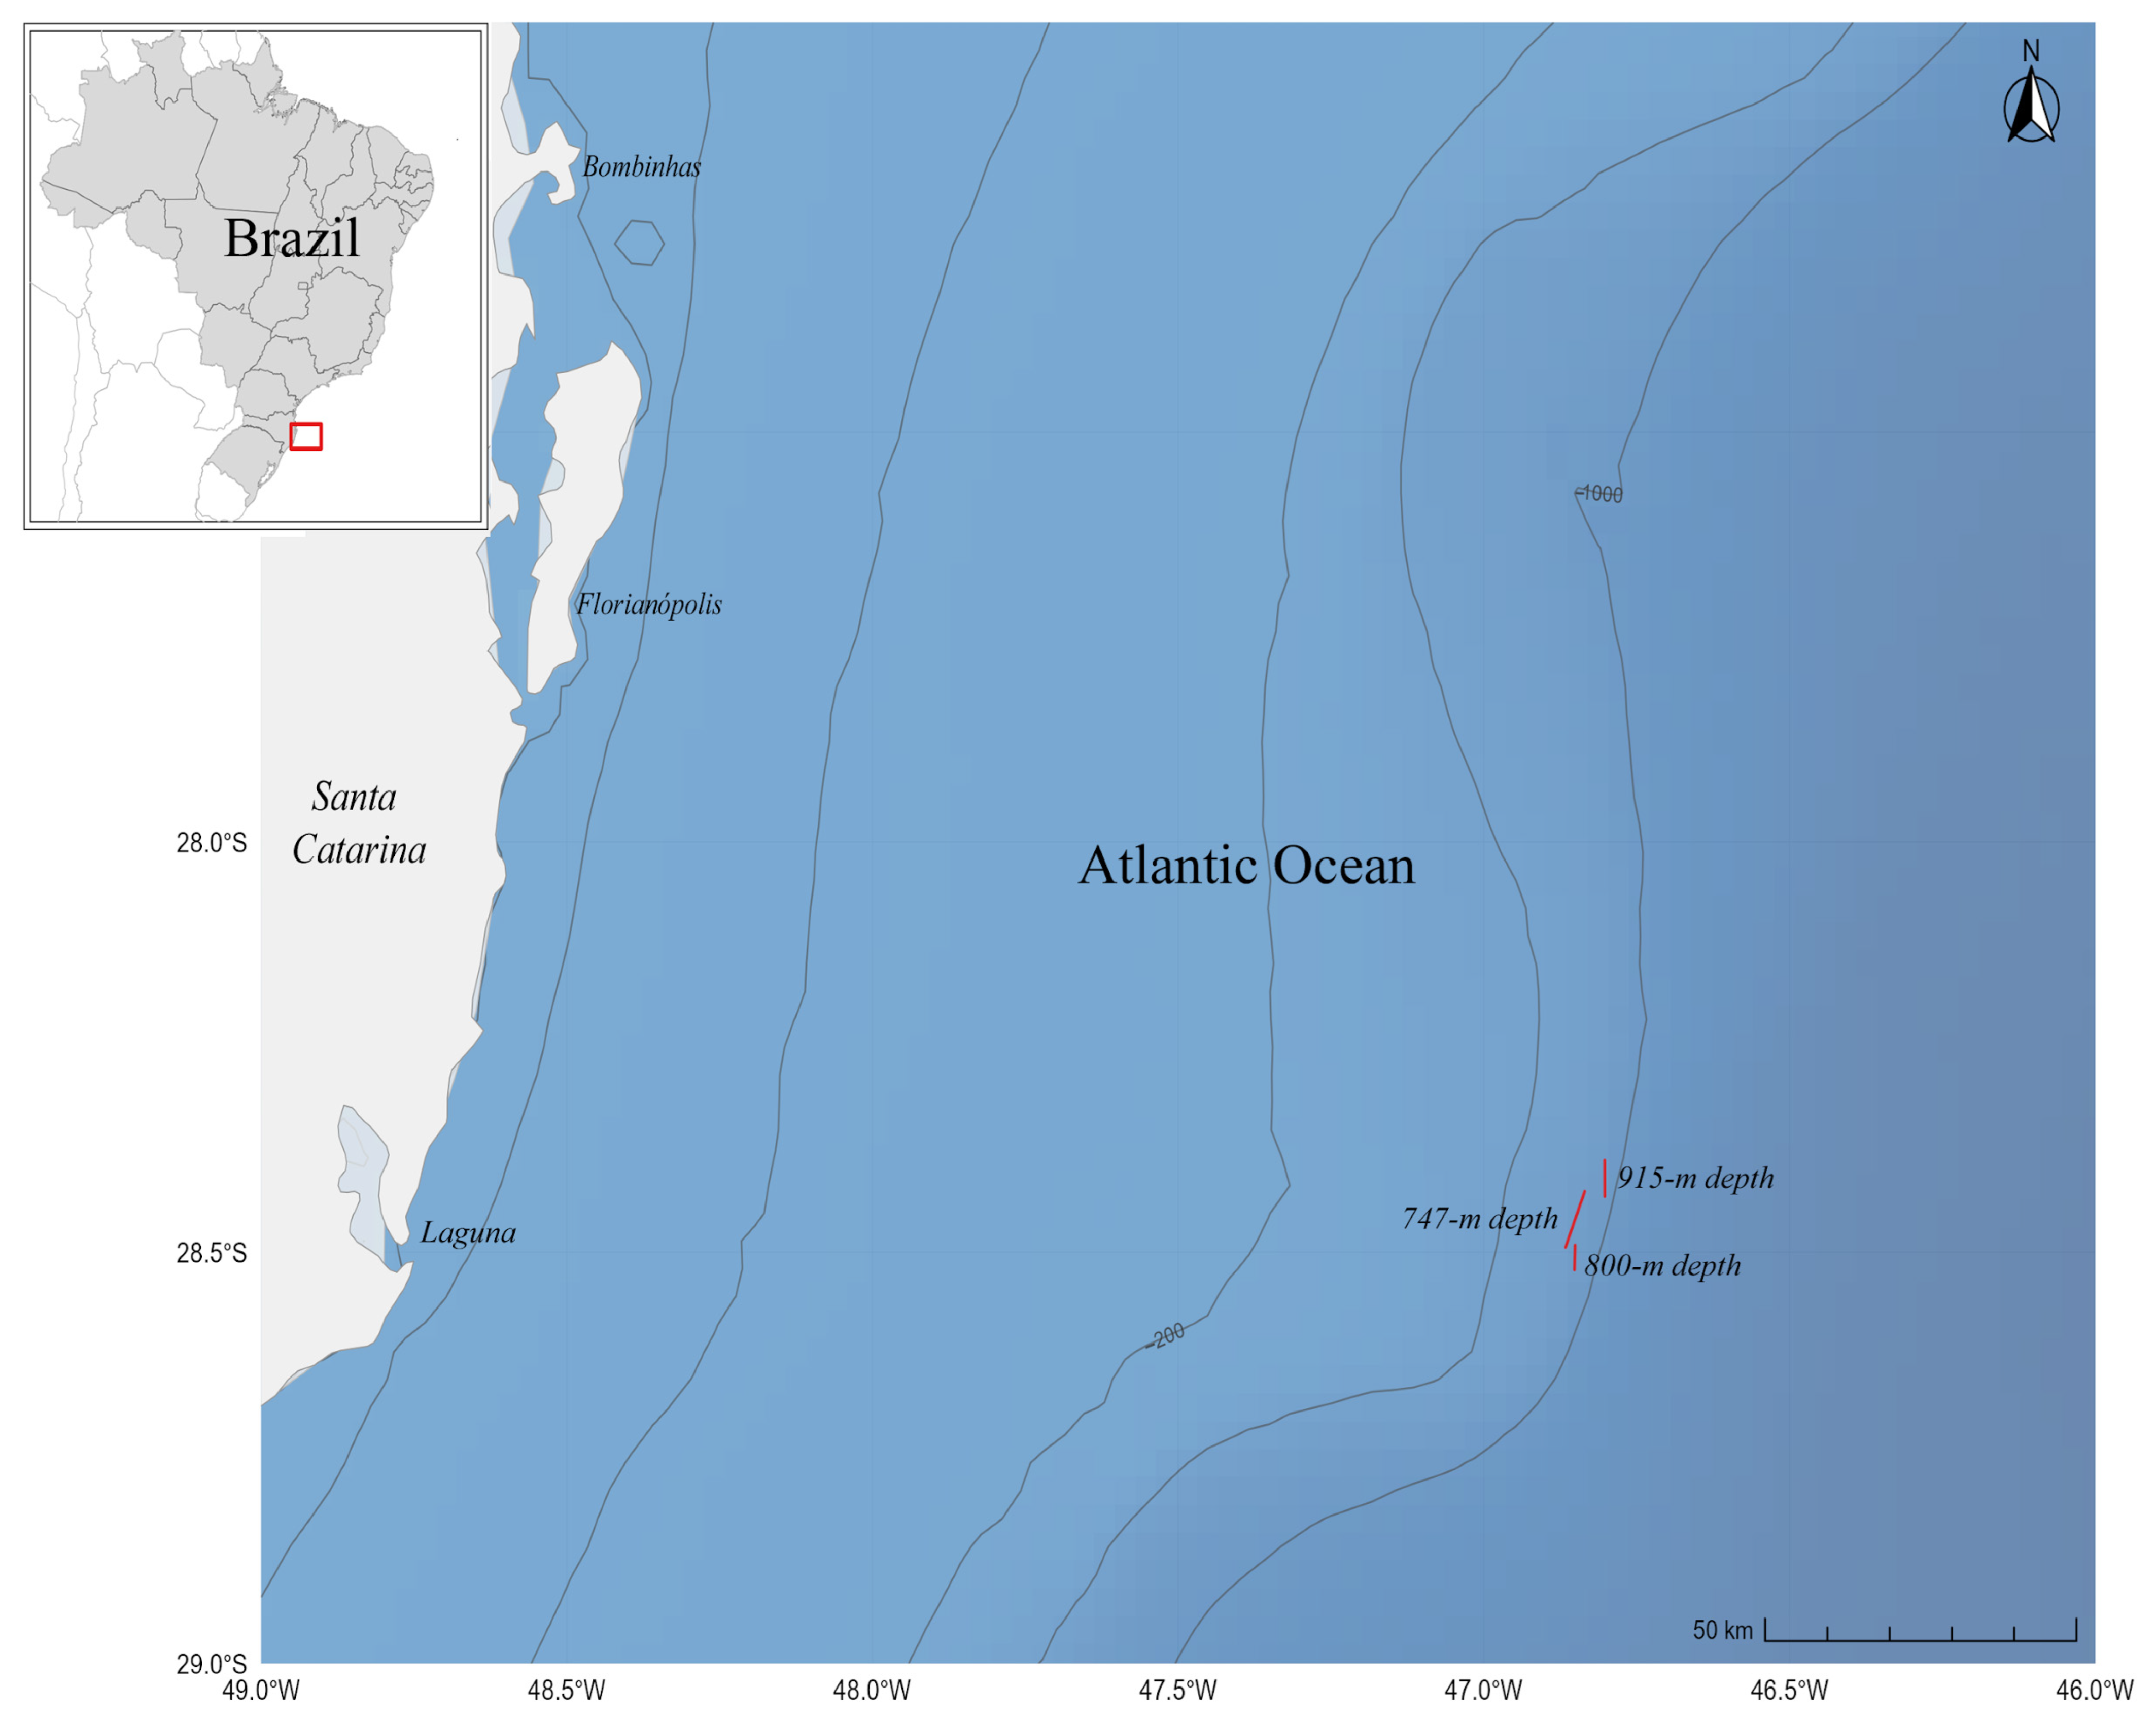
Specimens were obtained under the DEEP-OCEAN Project during an oceanographic survey conducted from 28 March to 2 April 2022, aboard the R/V Alpha Crucis. Sampling was carried out at 15 bottom trawl stations on the continental slope off Santa Catarina, Brazil, covering an area between latitudes 28°11.10′ S and 28°33.13′ S and longitudes 46°44.13′ W to 47°12.50′ W, at depths ranging from 274 to 1200 m. Two net configurations were employed: a larger net (23 m lower panel/25 m upper panel) with a cod end of 2.5 mm mesh and 100 mm mesh in wings and body, and a smaller auxiliary net (15 m lower/18 m upper panel). The specimens analyzed in this study were collected at three stations, at depths of 747 m, 800 m, and 915 m (Figure 1). The study area is influenced by the Brazil Current, with a muddy continental slope and high primary productivity associated with the upwelling of South Atlantic Central Water [40,41].
Following collection, fishes were immediately sorted and identified onboard based on morphometric and meristic characteristics [42,43]. Specimens arriving alive at the surface were euthanized using eugenol, menthol, or ice slurry immersion. Individuals identified as belonging to the target species were subsequently frozen at −20 °C for preservation until laboratory analysis. Collection permits were issued by the Instituto Chico Mendes de Conservação da Biodiversidade (SISBIO permits #28054, 82624), Secretaria da Comissão Interministerial para Recursos do Mar da Marinha do Brasil (Portaria No. 223), and the Comitê de Ética em Uso de Animais em Pesquisa e Ensino do Instituto Oceanográfico da Universidade de São Paulo (CEUA permit #16).
During laboratory processing, the selected specimens underwent standardized biometric analysis after controlled thawing. Considering the characteristic body morphology of grenadiers, pre-anal length (PAL) was recorded as the standard linear measurement, defined as the distance from the snout tip to the anal opening. Total body mass (BM) was determined using a precision balance (±0.1 g). All measurement procedures followed established standard protocols [44,45].
Sagittal otoliths were carefully extracted to avoid metallic contamination, cleaned with ultrapure water and 70% ethanol, air-dried on filter paper, and individually stored in labeled microtubes. For subsequent analyses, otoliths from adult specimens of the four target Macrouridae species were selected: C. marinii, H. billsam, M. occidentalis, and N. aequalis. Adult classification was based on published estimates of length at first maturity (L50) for C. marinii, M. occidentalis [9], and for N. aequalis [46]. For H. billsam, for which L50 values are not available, adults were identified through macroscopic examination of gonads (stage III or higher) following the standardized terminology described in a review paper [47]. Twenty adult individuals from each species were selected, as summarized in Table 1.

2.2. Otolith Preparation and Chemical Analysis

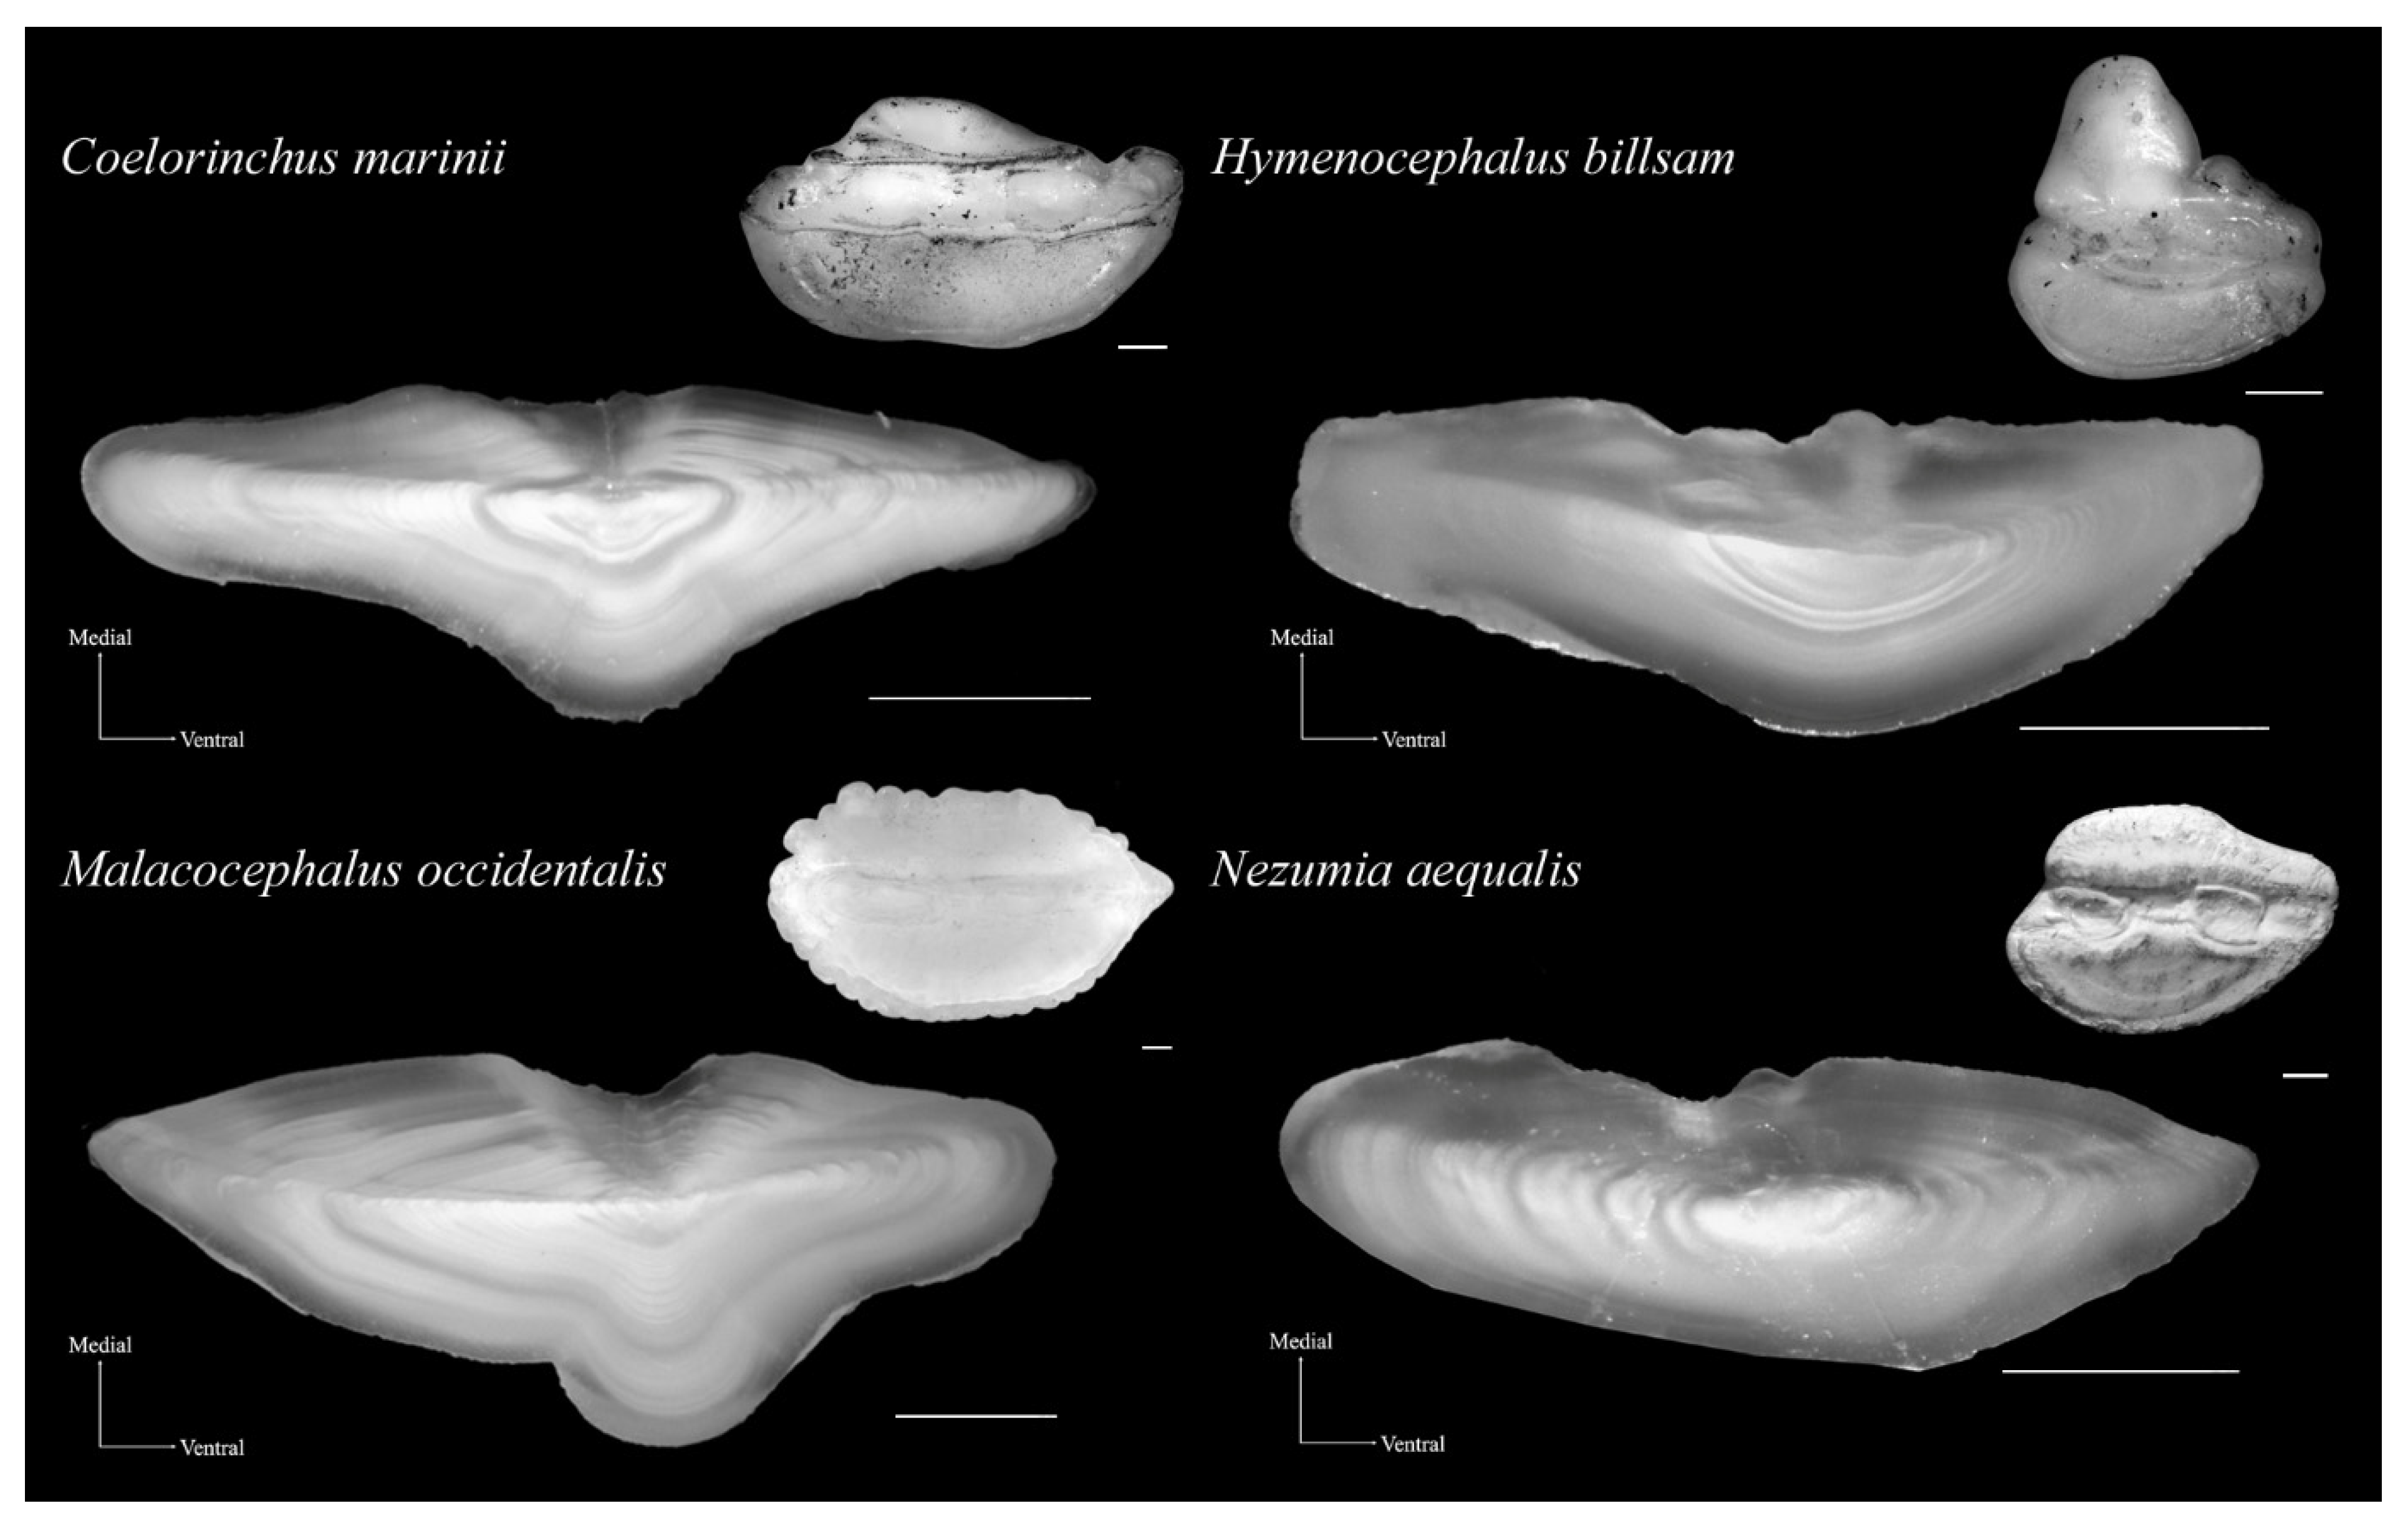
Right sagittal otoliths were embedded in transparent epoxy resin (Buehler, Epothin, Lake Bluff, IL, USA) and 0.5 mm thick transverse sections were obtained using a precision diamond saw (Buehler, Isomet Low-speed Saw), preserving the core region. The sections were ground with 800, 1200, and 2400 grit abrasive papers (Buehler, Ø 200 mm SiC Paper) and polished with 6, 3, and 1 μm diamond pastes (Buehler, Metadi II). Finally, the transversal sections (Figure 2) were mounted on glass slides, cleaned in an ultrasonic bath with ultrapure water for 5 min, and dried in a laminar flow cabinet [36,39].
Microchemical analyses were performed using Laser Ablation Inductively Coupled Plasma Mass Spectrometry (LA-ICP-MS), with a 257 nm Femtosecond laser ablation system (Elemental Scientific Lasers, Bozeman, MT, USA) coupled to an ICP-MS (7700×, Agilent Technologies, Santa Clara, CA, USA). Transects were performed in raster mode with a spatial resolution of 15 µm, following a continuous path from the core to the dorsal margin.
The ablation parameters used were: spot diameter of 50 μm, nominal fluence of 2.5 J cm−2, repetition rate of 100 Hz, and scan speed of 20 μm s−1. Helium was used as carrier gas (flow rate of 600 mL/min), with argon added before introduction into the ICP, operated at 1600 W with Ar gas plasma.
The following isotopes were monitored: 7Li, 24Mg, 43Ca, 55Mn, 60Ni, 63Cu, 66Zn, 88Sr, 111Cd, 137Ba, 202Hg, and 208Pb. External calibration was performed using NIST612 (https://tsapps.nist.gov/srmext/certificates/612.pdf, accessed on 4 November 2025), NIST610 (https://tsapps.nist.gov/srmext/certificates/610.pdf, accessed on 4 November 2025), and USGS MACS-3 (https://www.usgs.gov/, accessed on 4 November 2025) reference materials, analyzed in triplicate at the beginning and end of each sequence.
Quality control included: monitoring of the 238U/232Th ratio (<120%) for plasma robustness, 232Th16O/232Th ratio (<0.5%) for oxide rates, and blank correction with 6 s of background measurement. Using 43Ca as an internal standard, elemental ratios of interest were expressed in μmol/mol (Li:Ca, Mg:Ca, Mn:Ca, Ni:Ca, Cu:Ca, Zn:Ca, Sr:Ca, Cd:Ca, Ba:Ca, Hg:Ca, and Pb:Ca) for ecological inferences. Additional quality control parameters were determined as follows. Limits of detection (LOD) for each element were calculated as per Pettke et al. (2012) [48]. For the minor and trace elements, LOD values were between 0.002 and 0.34 ppm, and of 8.6 ppm for Ca.
Recovery rates were assessed using certified reference materials NIST612, NIST610, and USGS MACS-3, analysed in triplicate at the beginning and end of each sequence. The recovery rate for each element was calculated as (measured concentration/certified concentration) × 100%, yielding values between 85% and 135%. The averaged relative standard deviation (RSD), calculated from repeated measurements of these reference materials, was below 15% for all elements, confirming the instrumental precision and stability throughout the analytical sequence.

2.3. Data Analyses

Outlier detection was conducted using a robust distribution-based approach, applying percentile thresholds (2% and 98%) to minimize the influence of instrumental noise and analytical fluctuations without compromising natural biological variability [17,29,49]. After filtering, fewer than 1% of the original data points were excluded, and no entire individual was completely removed from any species. All statistical analyses were performed on the dataset after this filtering, ensuring that results were not biased by instrumental artifacts. Otolith transects were standardized both as absolute distance (µm from core to edge) and relative distance (% from core to edge), allowing complementary analyses of spatial and ontogenetic patterns of elemental incorporation. All graphical and statistical analyses were conducted for both distance scales when applicable.
Significant transitions along ontogenetic growth were identified using the Pruned Exact Linear Time (PELT) algorithm, implemented in the changepoint package [50]. The cpt.mean function was applied with MBIC (Modified Bayesian Information Criterion) penalization, a conservative criterion that reduces the detection of spurious breakpoints associated with analytical noise [51,52]. The analysis was restricted to individuals with at least 60 observations along the transect to ensure statistical robustness, avoiding the detection of breakpoints based on few data points [17,51,53]. Segmentation was performed independently for each element-to-calcium ratio and species, with detected change points interpreted as discrete ontogenetic transitions along the core-to-margin axis. However, statistical breakpoints may not always correspond to biologically meaningful events; some could arise from analytical noise, gradual physiological shifts, or natural variability. Therefore, only change points that were consistent across multiple elements or individuals were prioritized for ecological interpretation.
To characterize continuous patterns of elemental incorporation throughout growth, Generalized Additive Models (GAMs) were fitted using the mgcv package [54]. For each element-to-calcium ratio (Ba:Ca, Sr:Ca, Li:Ca, Mg:Ca, Mn:Ca, Ni:Ca, Cu:Ca, Zn:Ca), models were constructed using relative distance (% from core to margin) as the explanatory variable, applying penalized spline smoothers and estimated via restricted maximum likelihood (REML). This approach enabled the detection of non-linear trends across ontogeny, complementing the discrete segmentation obtained through PELT.
The multivariate structure of otolith chemical signatures was investigated using Principal Component Analysis (PCA) [55], applied to individual median values of element-to-calcium ratios after standardization by centering and scaling (z-score transformation). PCA was conducted both across species and within species (by ontogenetic segments), allowing the evaluation of global and segment-specific patterns of chemical variation. The percentage of variance explained by each principal component was calculated and reported to support interpretation. Additionally, Gaussian Mixture Models (GMMs) [56] were applied to identify potential ontogenetic clusters based on multivariate chemical signatures, providing a probabilistic framework for grouping individuals according to their chemical profiles. The optimal number of clusters was determined using the Bayesian Information Criterion (BIC) as implemented in the mclust package [56].
Prior to PERMANOVA, the assumption of homogeneity of multivariate dispersions was tested using the ‘betadisper’ function in the vegan package. A significant result (p < 0.05) would indicate heterogeneity, which was considered as a limitation in the interpretation of the PERMANOVA results. Differences in chemical signatures among species and among ontogenetic segments within each species were tested using PERMANOVA [57] with 9999 permutations and Euclidean distance matrices, implemented in the vegan package [58]. When the global PERMANOVA was significant, pairwise comparisons between all pairs of ontogenetic segments were performed using the same permutation procedure. p-values were adjusted for multiple comparisons using the false discovery rate (FDR) method [59]. Adjacent segments with adjusted p-values > 0.05 were considered not significantly different and were merged into broader intervals for the presentation of ontogenetic segments in Table 2.
Whenever the global PERMANOVA was not significant for a given species, only the overall median values are presented in Table 2, while the original segment intervals are retained for completeness. All analyses were conducted in the R environment [60] using the packages changepoint (v2.2.2), mgcv (v1.8-41), vegan (v2.6-4), ggplot2 (v3.4.2), dplyr (v1.1.0), openxlsx (v4.2.5), and mclust (v6.0.0). Additional exploratory analyses were performed using PAST software v4.03 [61].

3. Results

A total of 80 core-to-edge sagittal otolith transects were analysed, revealing distinct ontogenetic patterns in element-to-calcium ratios among the four Macrouridae species. The main differences among species were primarily driven by Ba:Ca, Sr:Ca, and Mn:Ca, whereas age-related declines were mostly observed for Mg:Ca, Zn:Ca, Cu:Ca, and Ni:Ca. The average relative standard deviation for NIST612 transects was below 5%, indicating good instrumental precision. Overall, the chemical profiles exhibited both monotonic trends and fluctuating patterns along the fish growth, with marked interspecific variation.
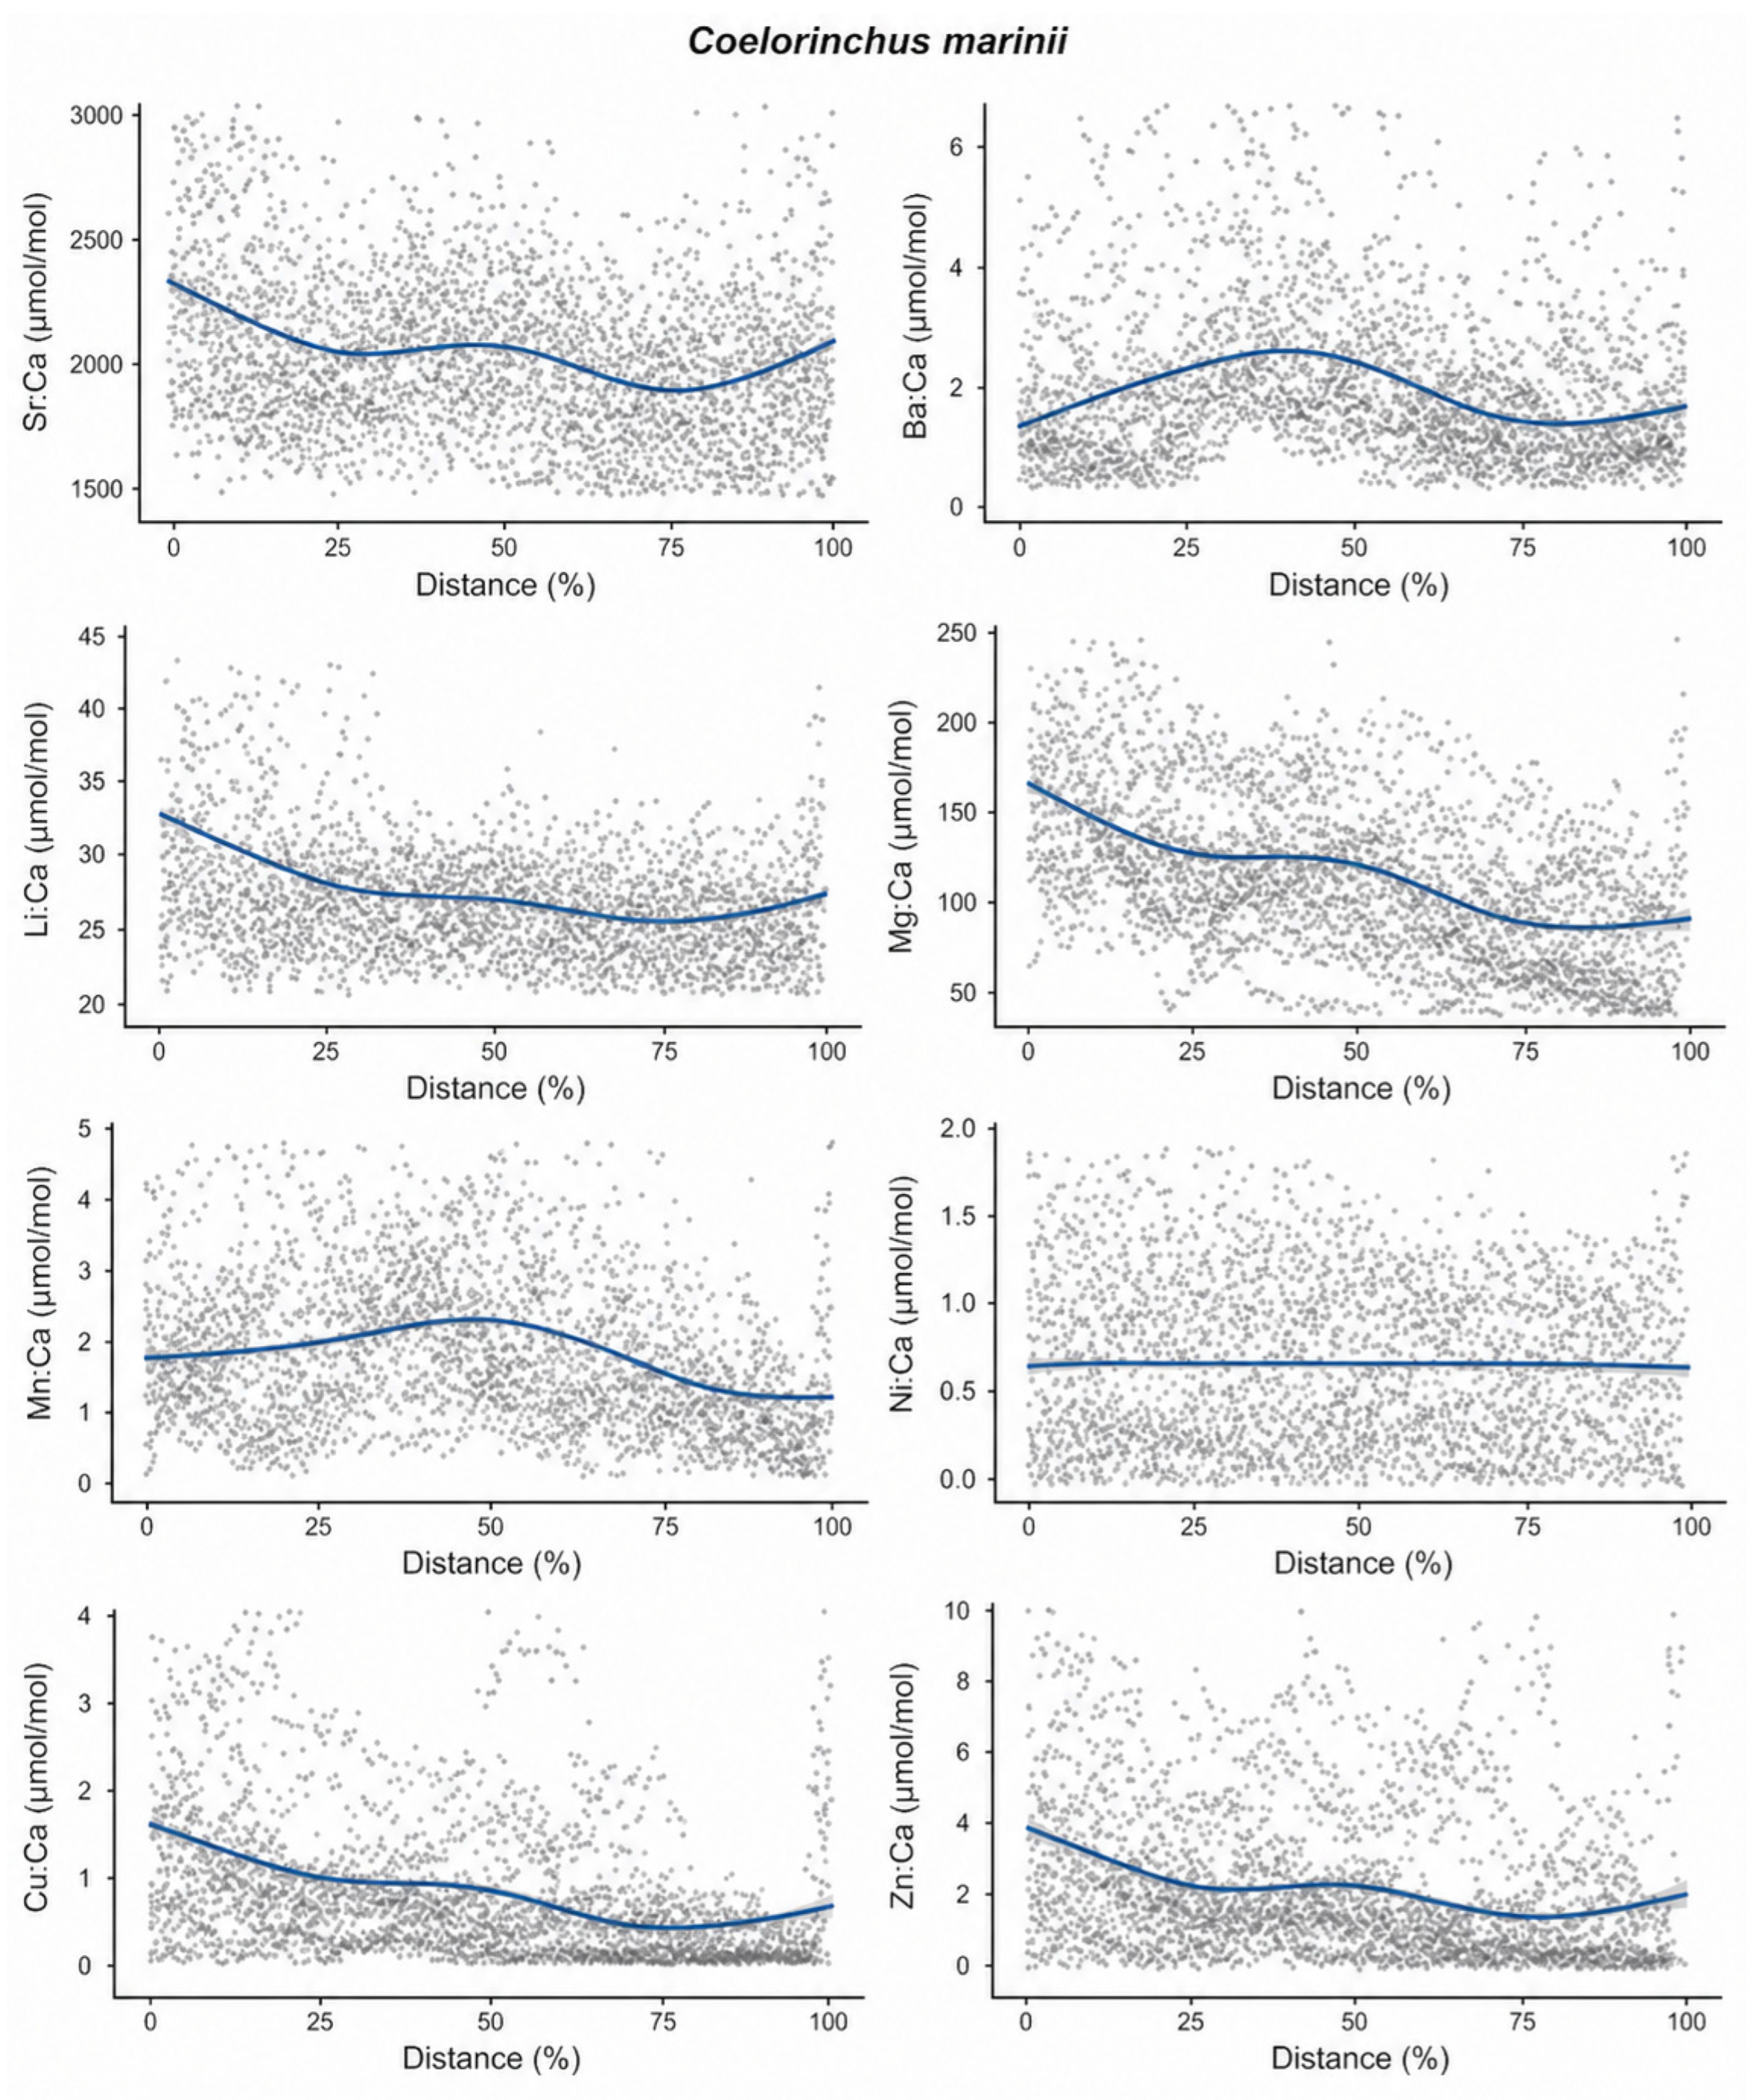
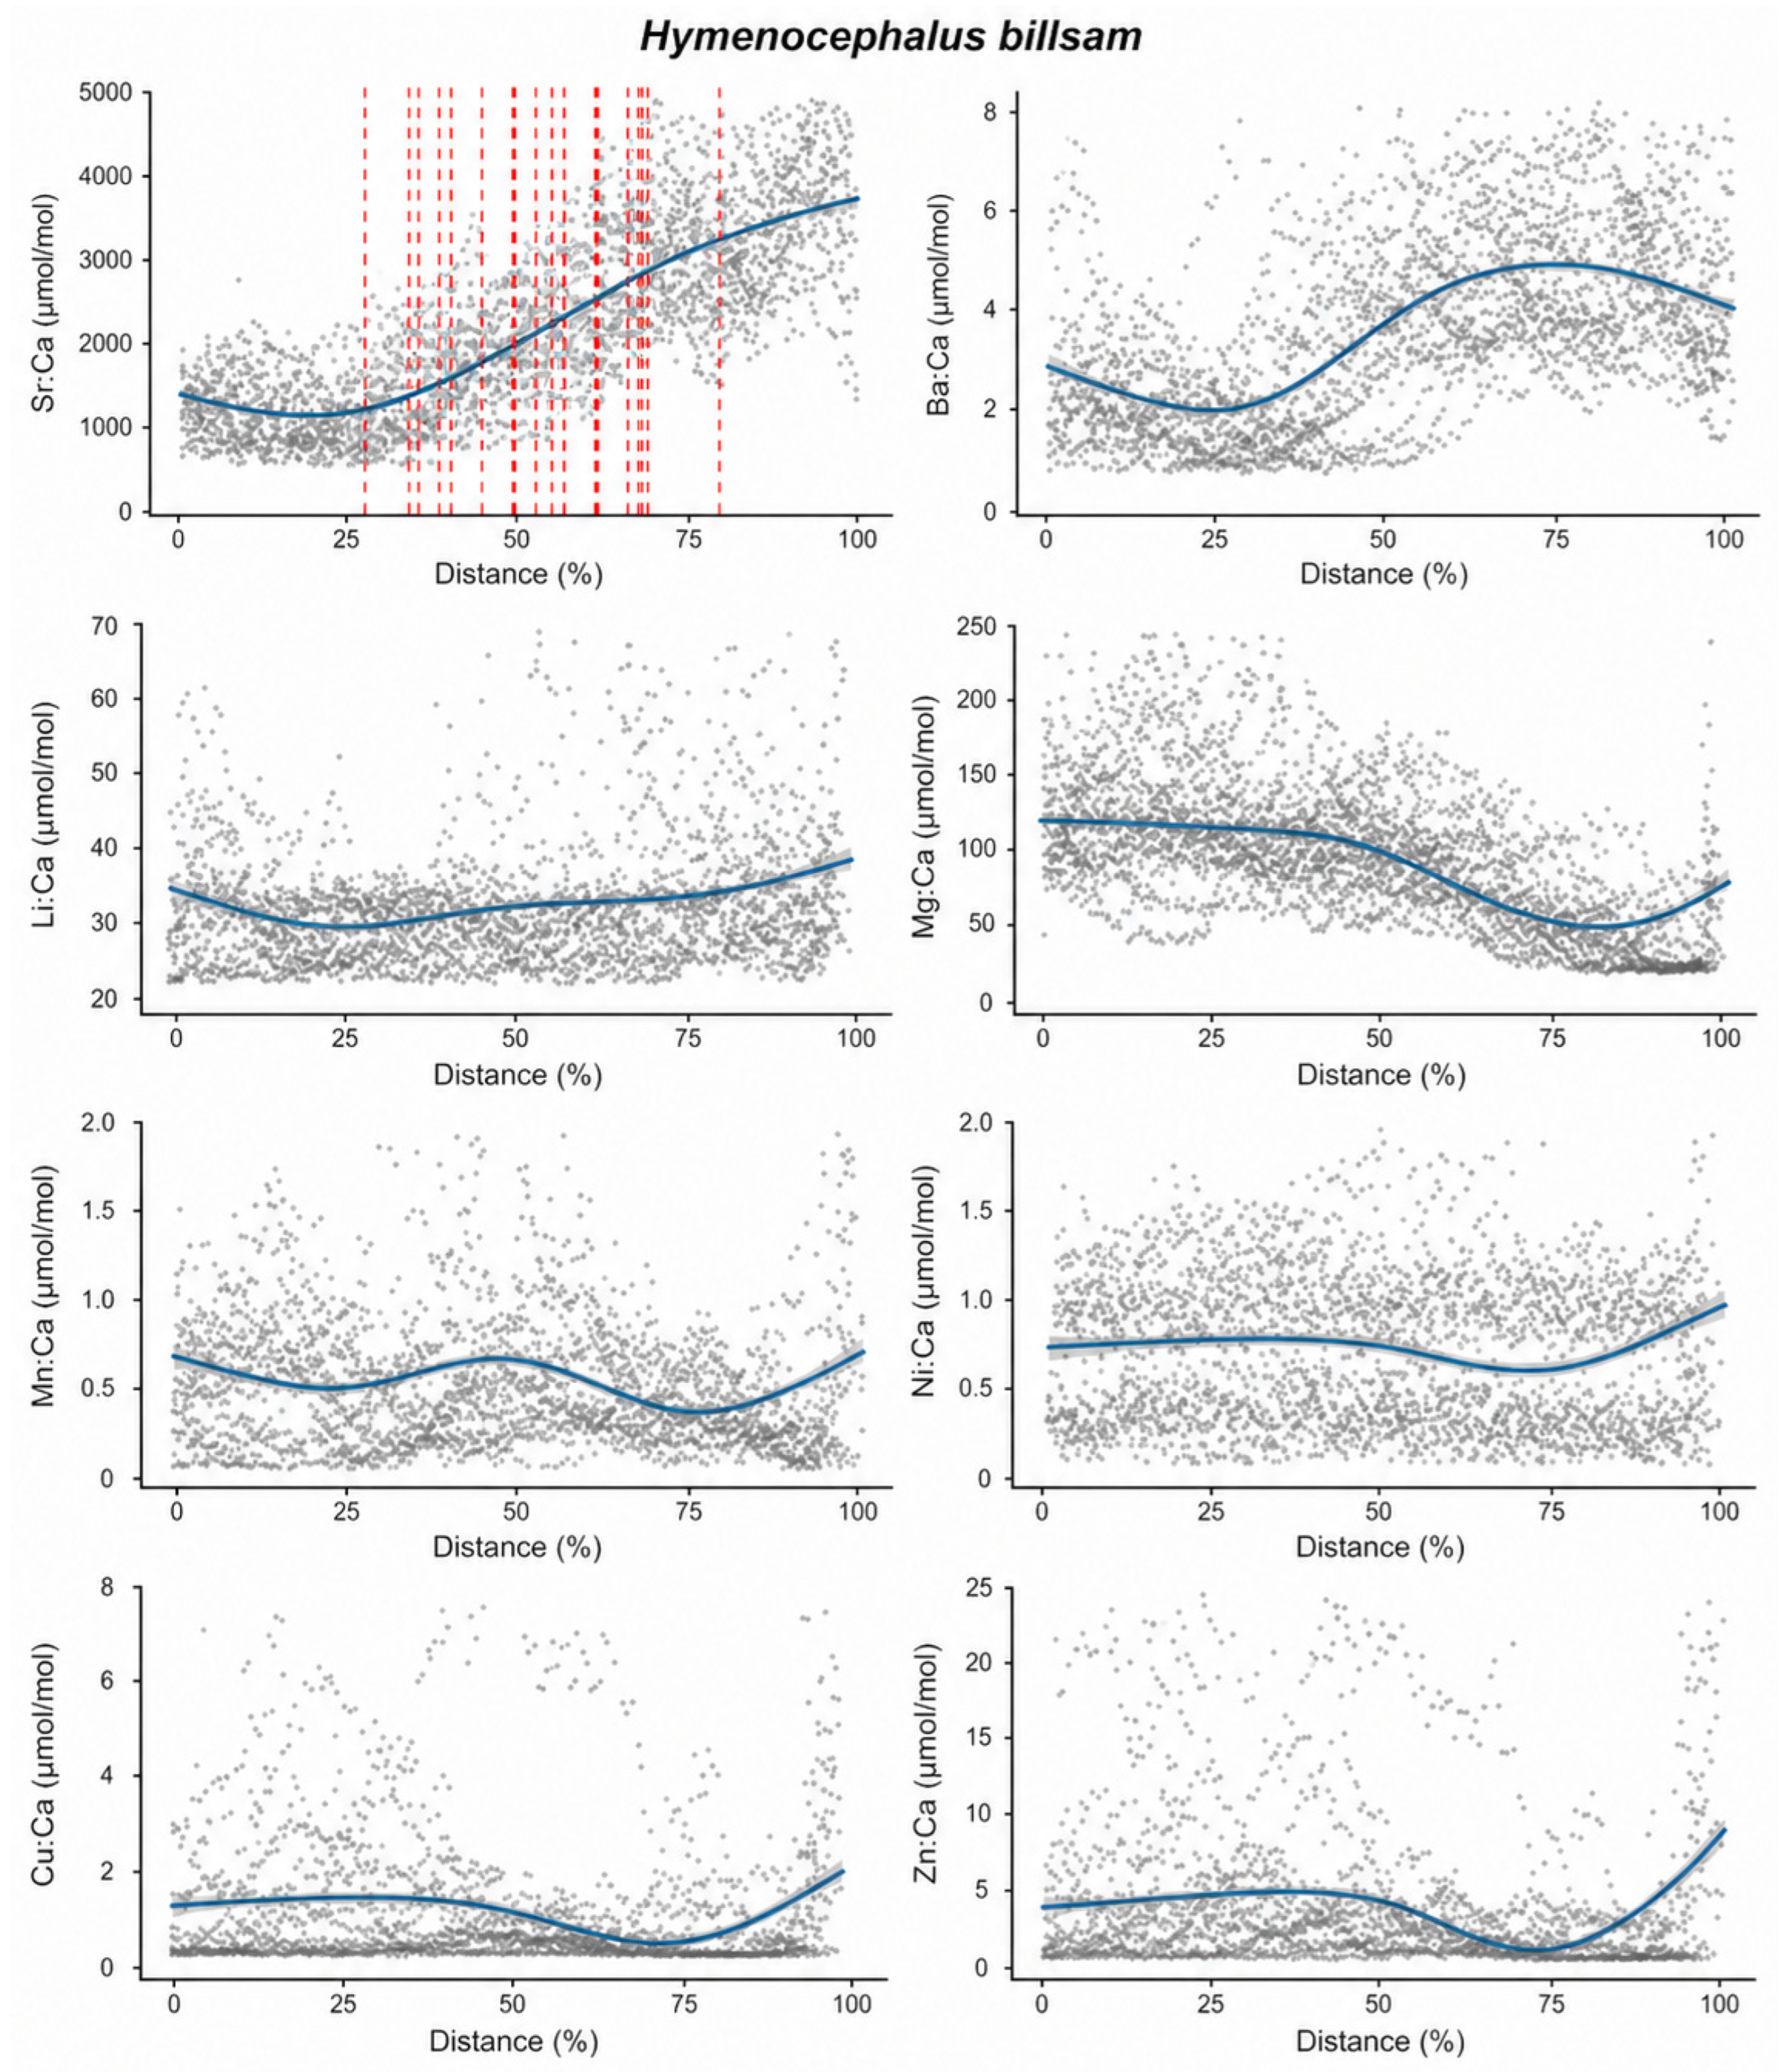
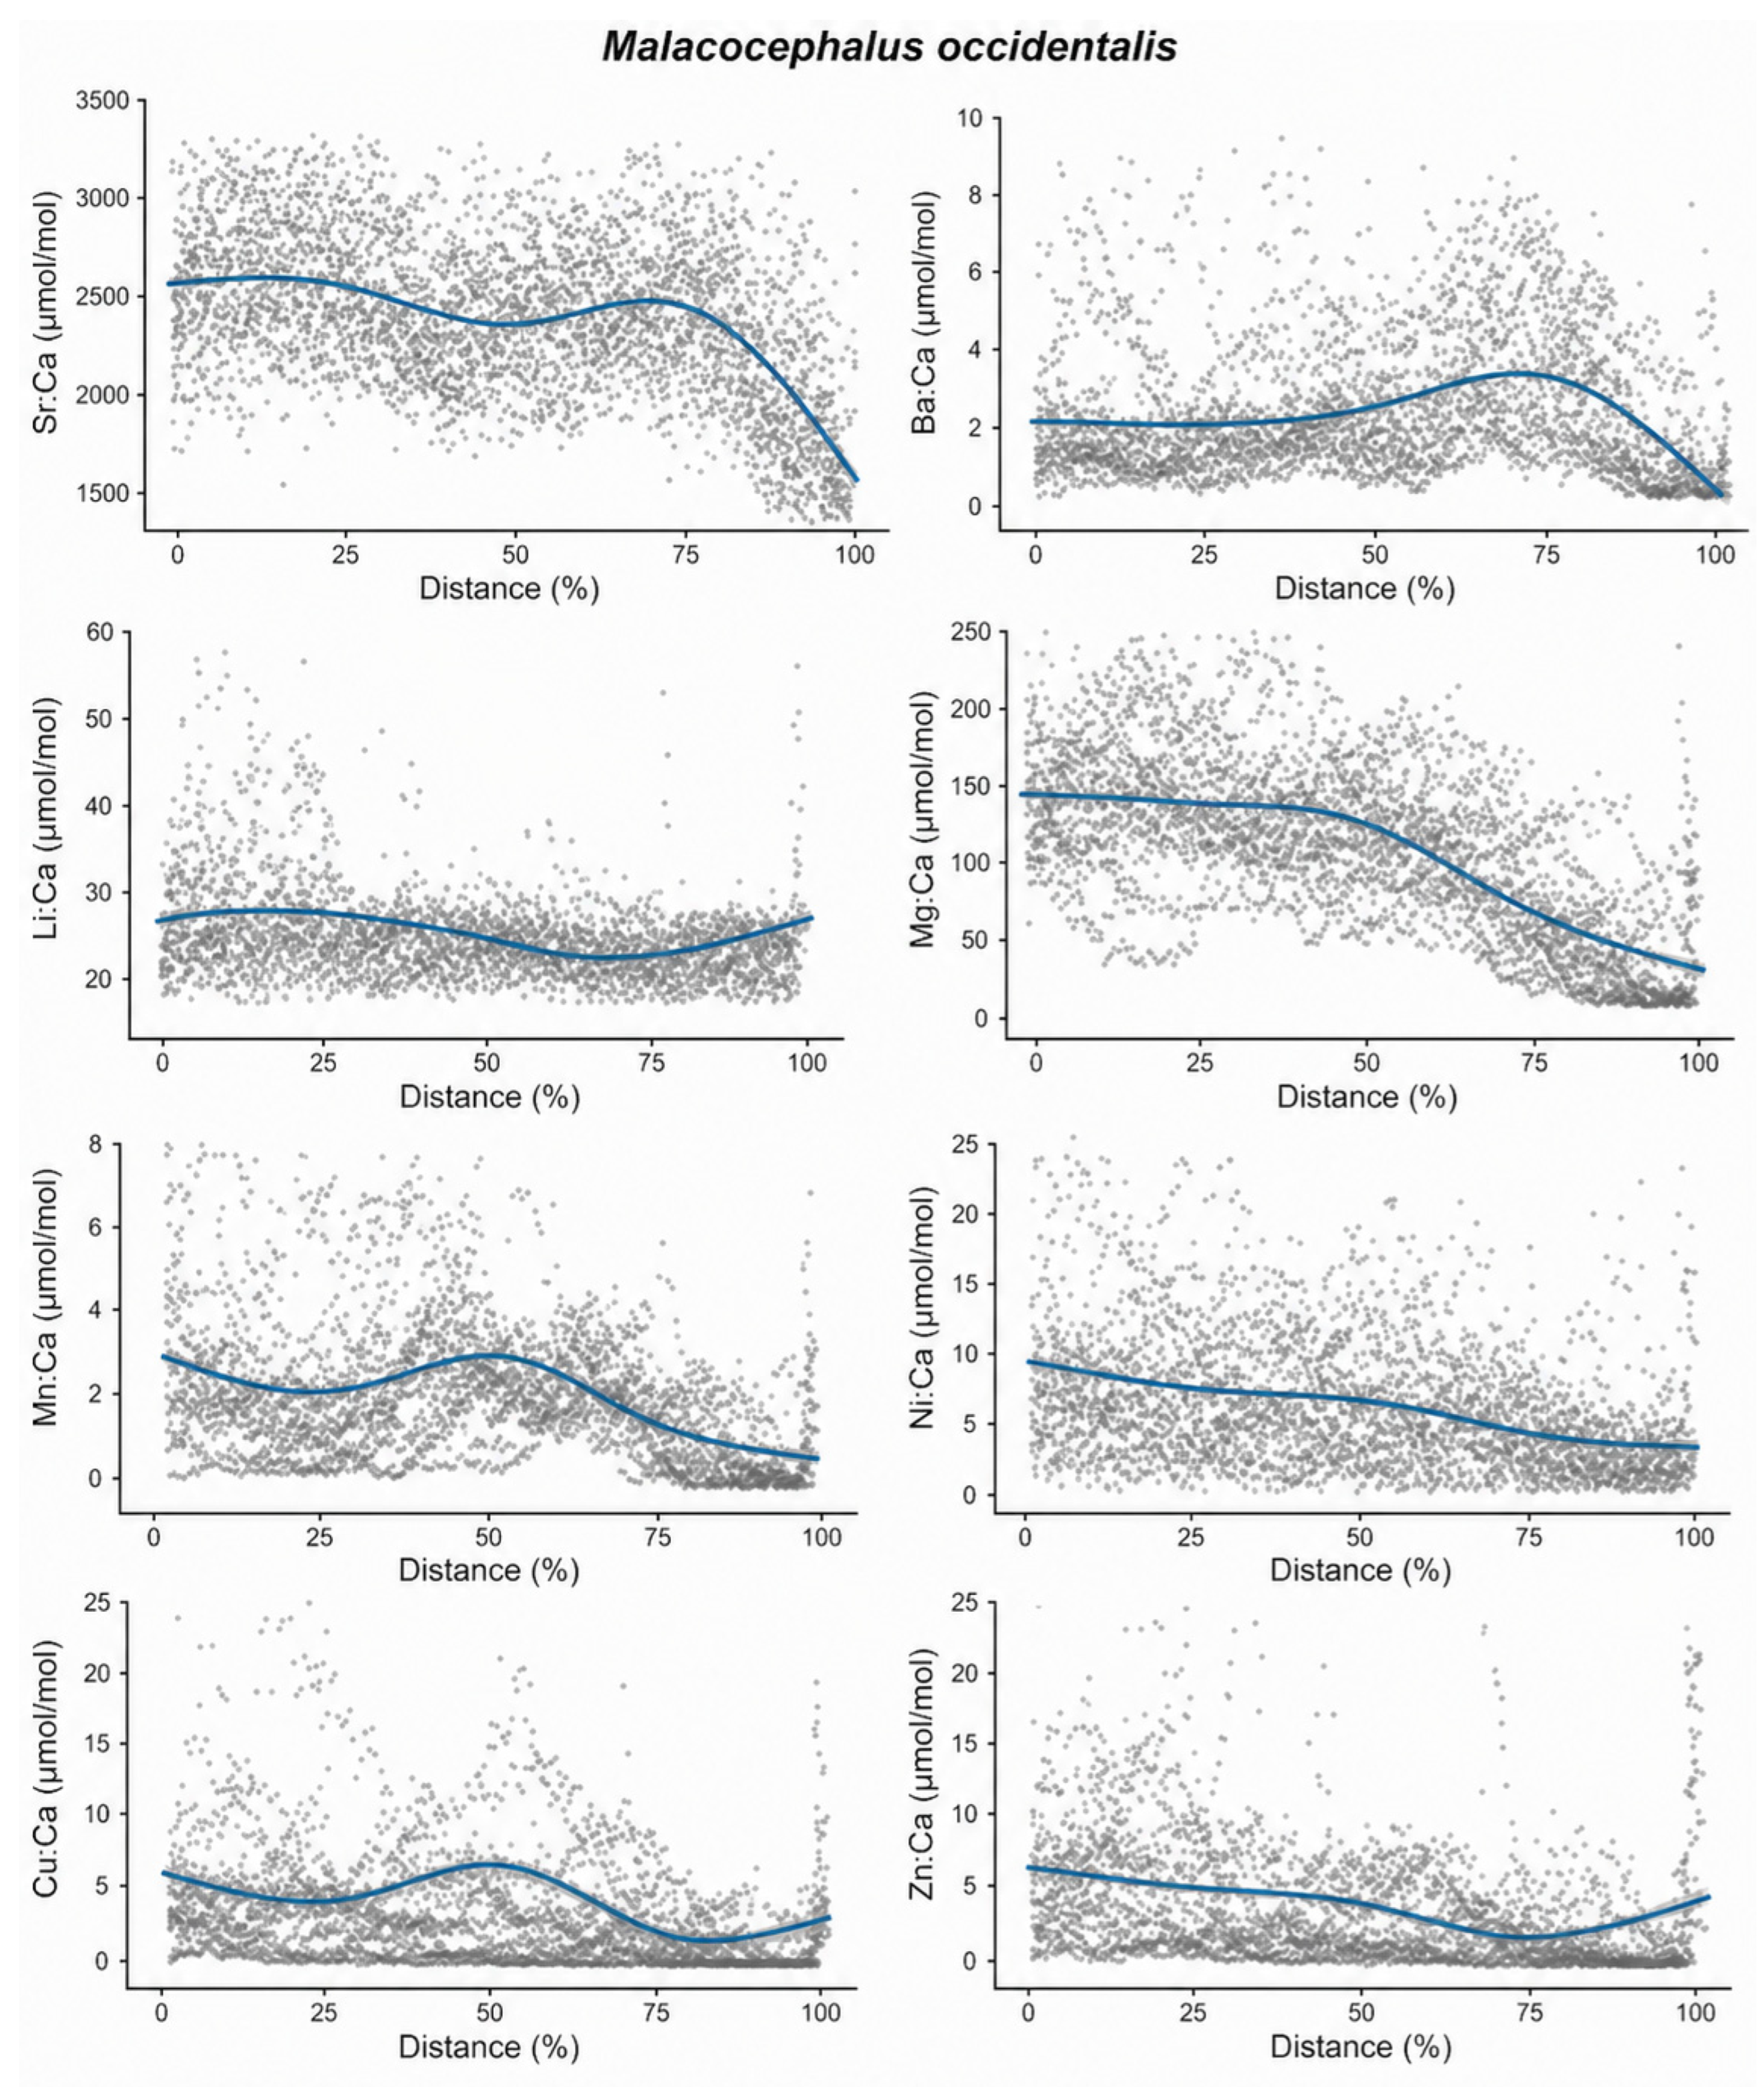
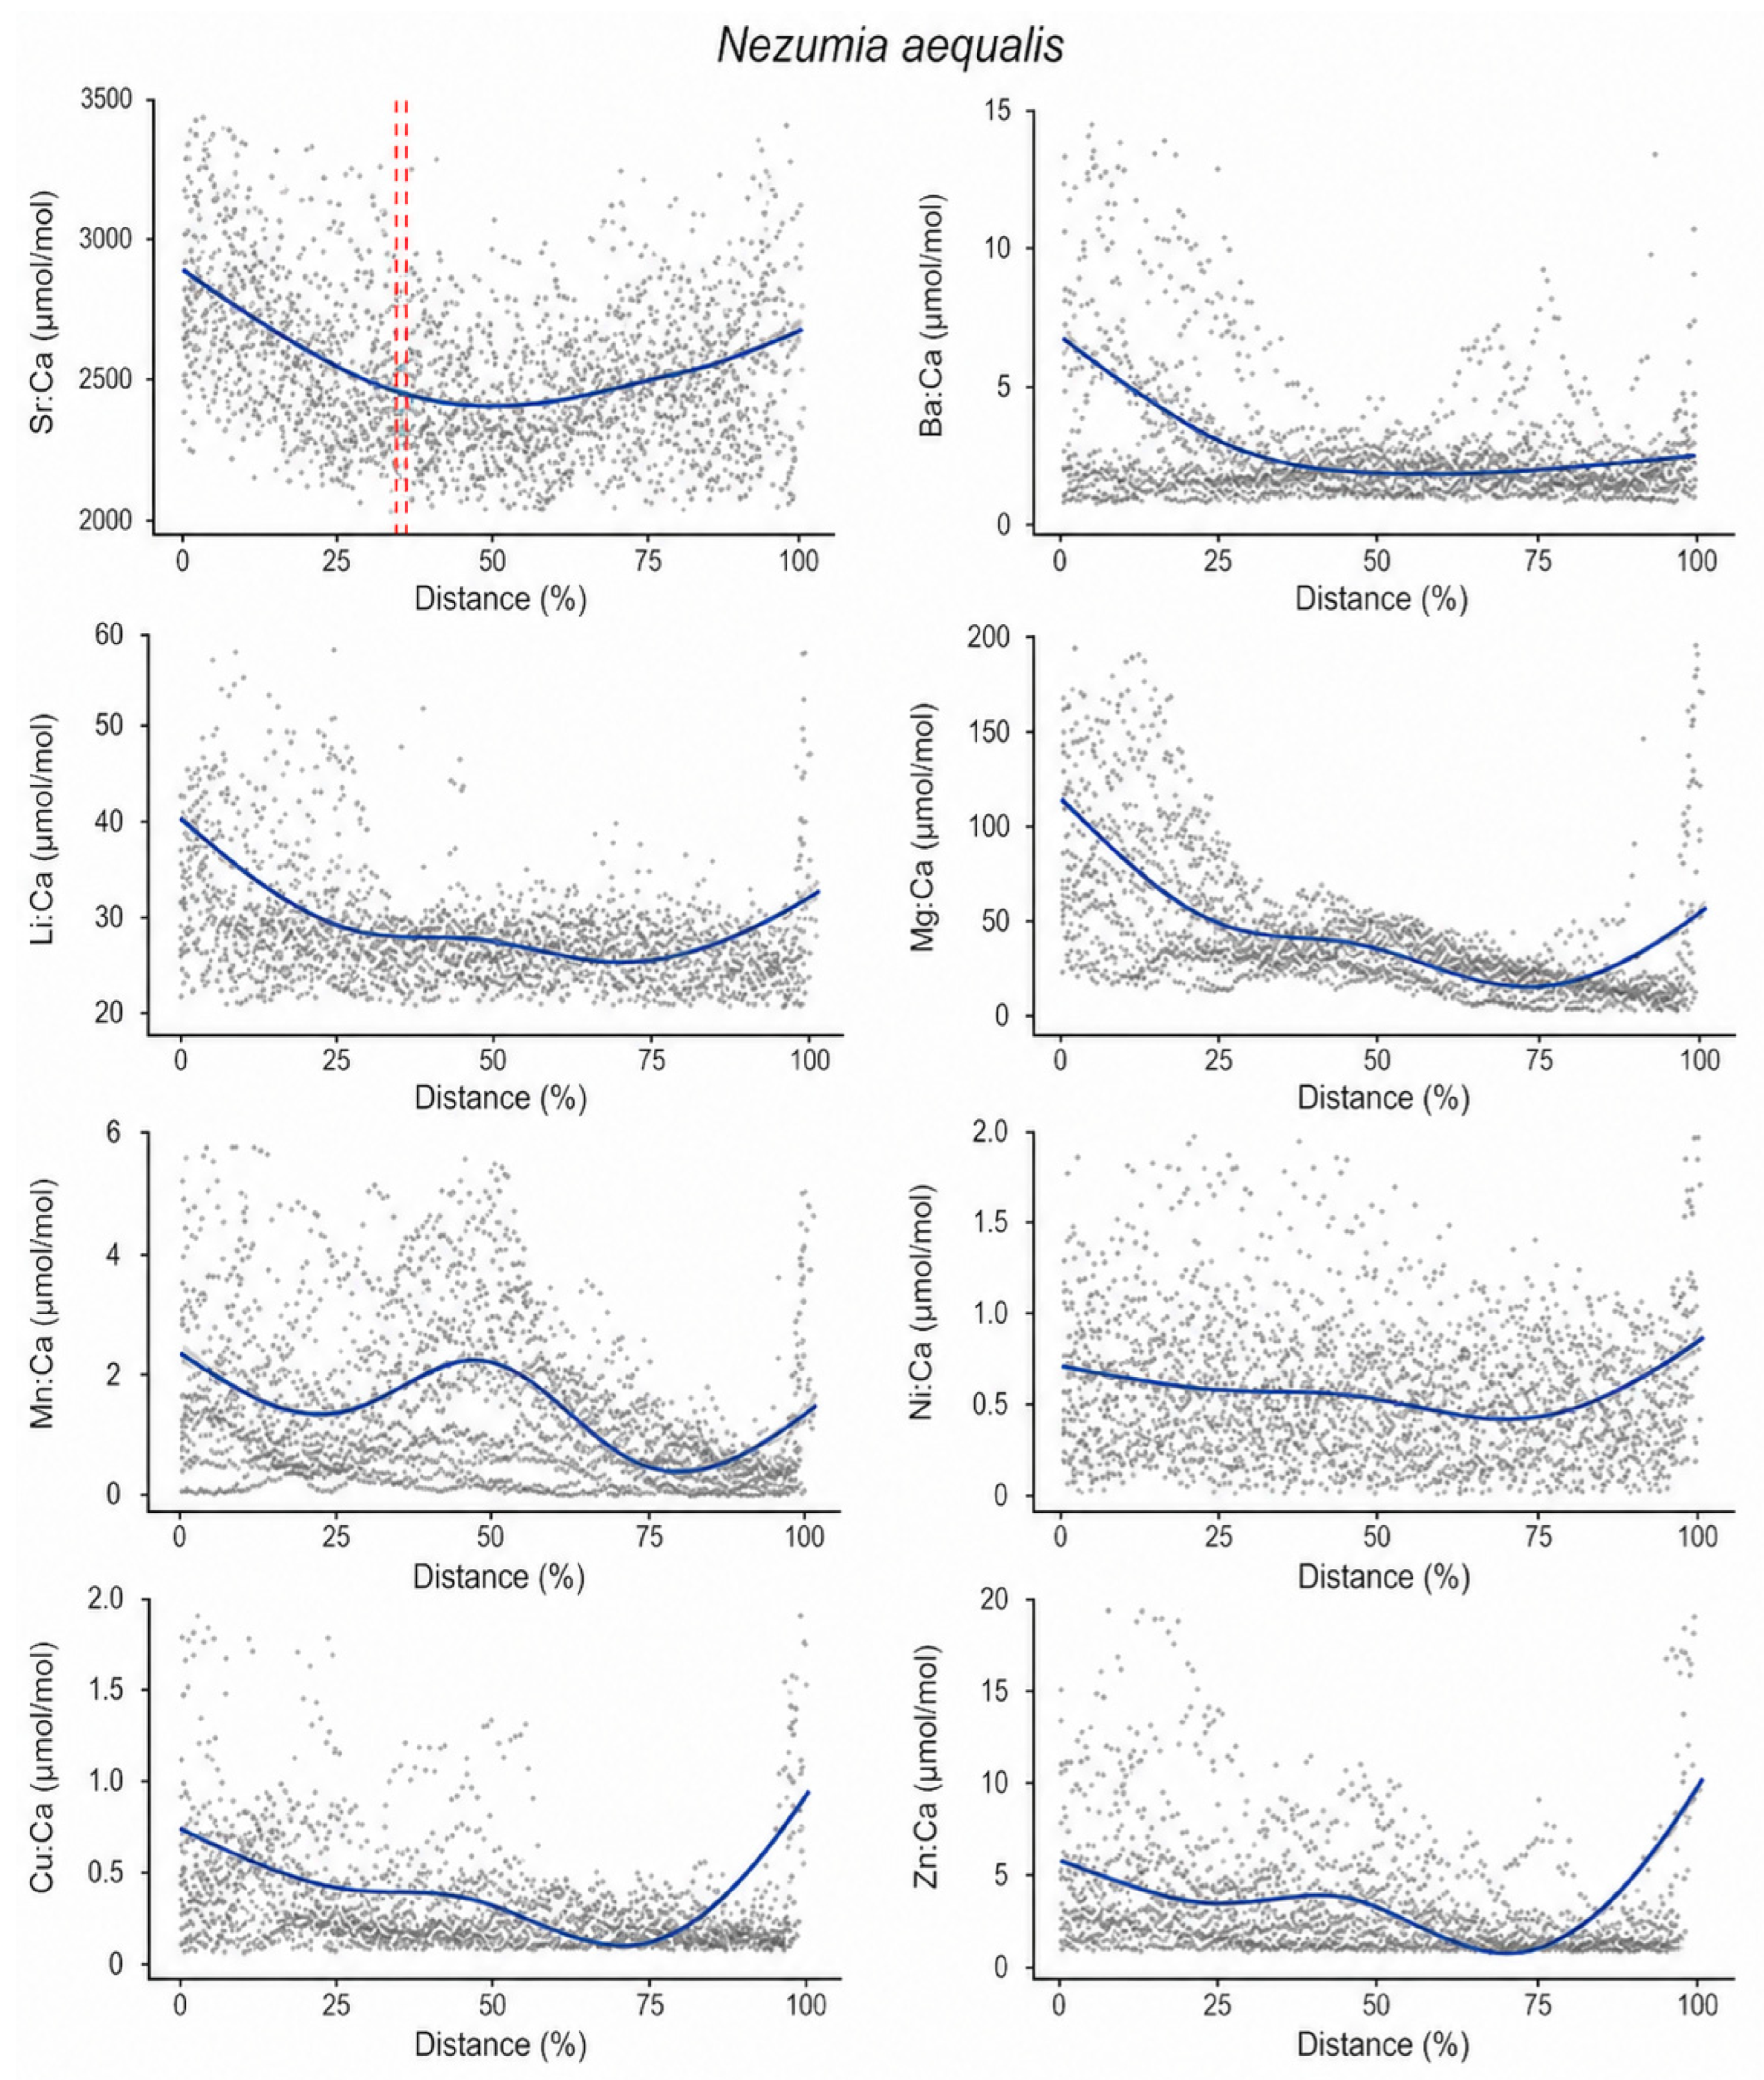
The Ba:Ca and Sr:Ca ratios showed contrasting behaviours among species. In Coelorinchus marinii, Ba:Ca increased from the core (median 1.70 μmol/mol) to the mid-region (1.99 μmol/mol), with an overall median of 2.28 μmol/mol (Figure 3). Hymenocephalus billsam displayed a continuous increase throughout growth, with core values of 2.59 μmol/mol, mid-region values of 4.33 μmol/mol, and final values of 3.83 μmol/mol (overall median 3.42 μmol/mol) (Figure 4). Malacocephalus occidentalis exhibited core values of 2.67 μmol/mol, which increased to a peak in the mid-region (3.61 μmol/mol), followed by a sharp decrease in the final stage (1.53 μmol/mol), resulting in an overall median of 3.26 μmol/mol (Figure 5). Nezumia aequalis showed a complex pattern, with low initial values (1.73 μmol/mol) and an increase in the final segments (2.88 μmol/mol), and an overall median of 2.43 μmol/mol (Figure 6). For Sr:Ca, H. billsam showed a progressive increase along growth, from initial values (2.07 μmol/mol) to final values (3.55 μmol/mol), contrasting with the decline observed in M. occidentalis (3.03 μmol/mol in the initial portion and 1.80 μmol/mol in the final) and with moderate fluctuations in C. marinii and N. aequalis (overall medians of 2.10 and 2.45 μmol/mol, respectively).
Mn:Ca displayed greater variability among species; H. billsam showed substantially lower concentrations (overall median 0.35 μmol/mol) compared to the other species, whereas C. marinii, M. occidentalis and N. aequalis exhibited moderate fluctuations with a general decreasing trend after the early stages, with overall medians of 2.36, 1.93 and 1.16 μmol/mol, respectively (Figure 3, Figure 4, Figure 5 and Figure 6).
The Li:Ca and Mg:Ca ratios showed a progressive decline in most species. Li:Ca decreased in C. marinii (47.98 μmol/mol in the core to 30.12 μmol/mol in the final region) and M. occidentalis (27.74 μmol/mol in the initial portion to 24.40 μmol/mol in the final); H. billsam showed modest fluctuations among segments, with slightly higher values in the core and final stages compared to the mid-region; and N. aequalis exhibited an initial decrease followed by relatively stable values in the later segments. Mg:Ca consistently declined throughout growth in all species, being most pronounced in M. occidentalis (229.50 μmol/mol in the initial region to 61.70 μmol/mol in the final). In C. marinii, the reduction was from 0.1881 to 0.0988 μmol/mol, and in H. billsam from 198.20 to 50.30 μmol/mol. In N. aequalis, there was a pronounced initial decrease (134.5 μmol/mol) followed by moderate oscillations in the later stages (43.0 μmol/mol) (Figure 3, Figure 4, Figure 5 and Figure 6).
The Cu:Ca and Ni:Ca ratios exhibited variable ontogenetic patterns among species. Cu:Ca showed a declining trend in C. marinii (1.93 μmol/mol in the early portion to 0.29 μmol/mol in the final), M. occidentalis (4.39 to 2.40 μmol/mol) and N. aequalis (3.59 to 0.67 μmol/mol). In H. billsam, values varied among segments, with lower values in the core (0.00042 μmol/mol) and mid region (0.00041 μmol/mol) and slightly higher values in the final stage (0.75 μmol/mol). For Ni:Ca, a decline was observed in C. marinii (0.70 to 0.40 μmol/mol), M. occidentalis (1.27 to 0.92 μmol/mol) and N. aequalis (1.63 to 1.00 μmol/mol). In H. billsam, values remained low and stable, with an overall median of 0.38 μmol/mol (Figure 3, Figure 4, Figure 5 and Figure 6).
Zn:Ca showed a predominantly decreasing trend in all species, with a notable peak in M. occidentalis in the early region (11.05 μmol/mol) followed by a sharp decline (3.70 μmol/mol). In C. marinii and N. aequalis, values decreased from 3.22 and 20.61 μmol/mol in the early stages to 1.52 and 2.48 μmol/mol in the final stages, respectively. H. billsam displayed fluctuations, with an overall median of 2.99 μmol/mol (Figure 3, Figure 4, Figure 5 and Figure 6). The same ontogenetic patterns, expressed as absolute distance (µm), are provided in the Supplementary Material, Figures S1–S4.
The PELT segmentation algorithm allowed the identification of discrete ontogenetic transitions along the elemental profiles, with change points detected for Li:Ca, Mg:Ca and Sr:Ca in all species. The resulting intervals (Table 2) were used to define ontogenetic segments. For H. billsam, pairwise PERMANOVA indicated that adjacent segments were not significantly different (adjusted p > 0.05), allowing them to be merged into three broader phases: 0–38%, 38–55%, and 55–100% (Table 2). N. aequalis showed the highest complexity, with multiple segments for Sr:Ca, indicating more frequent ontogenetic transitions throughout growth. Median values and standard errors for each segment are detailed in Table 2. Generalized Additive Models confirmed that relative distance along growth was a significant predictor of elemental variation in all cases (p < 0.001), highlighting predominantly non-linear patterns. The deviance explained by the GAMs ranged from 0.2% (Ni:Ca in N. aequalis) to 66.1% (Sr:Ca in H. billsam), with adjusted R2 values between 0.001 and 0.660. The estimated smooth functions for all element-species combinations are shown in Supplementary Material, Table S1. These plots illustrate the ontogenetic trajectories of each element-to-calcium ratio relative to growth. Overall, the GAMs corroborated the patterns detected by PELT segmentation, reinforcing the existence of structured ontogenetic shifts, especially for Sr:Ca and Ba:Ca.
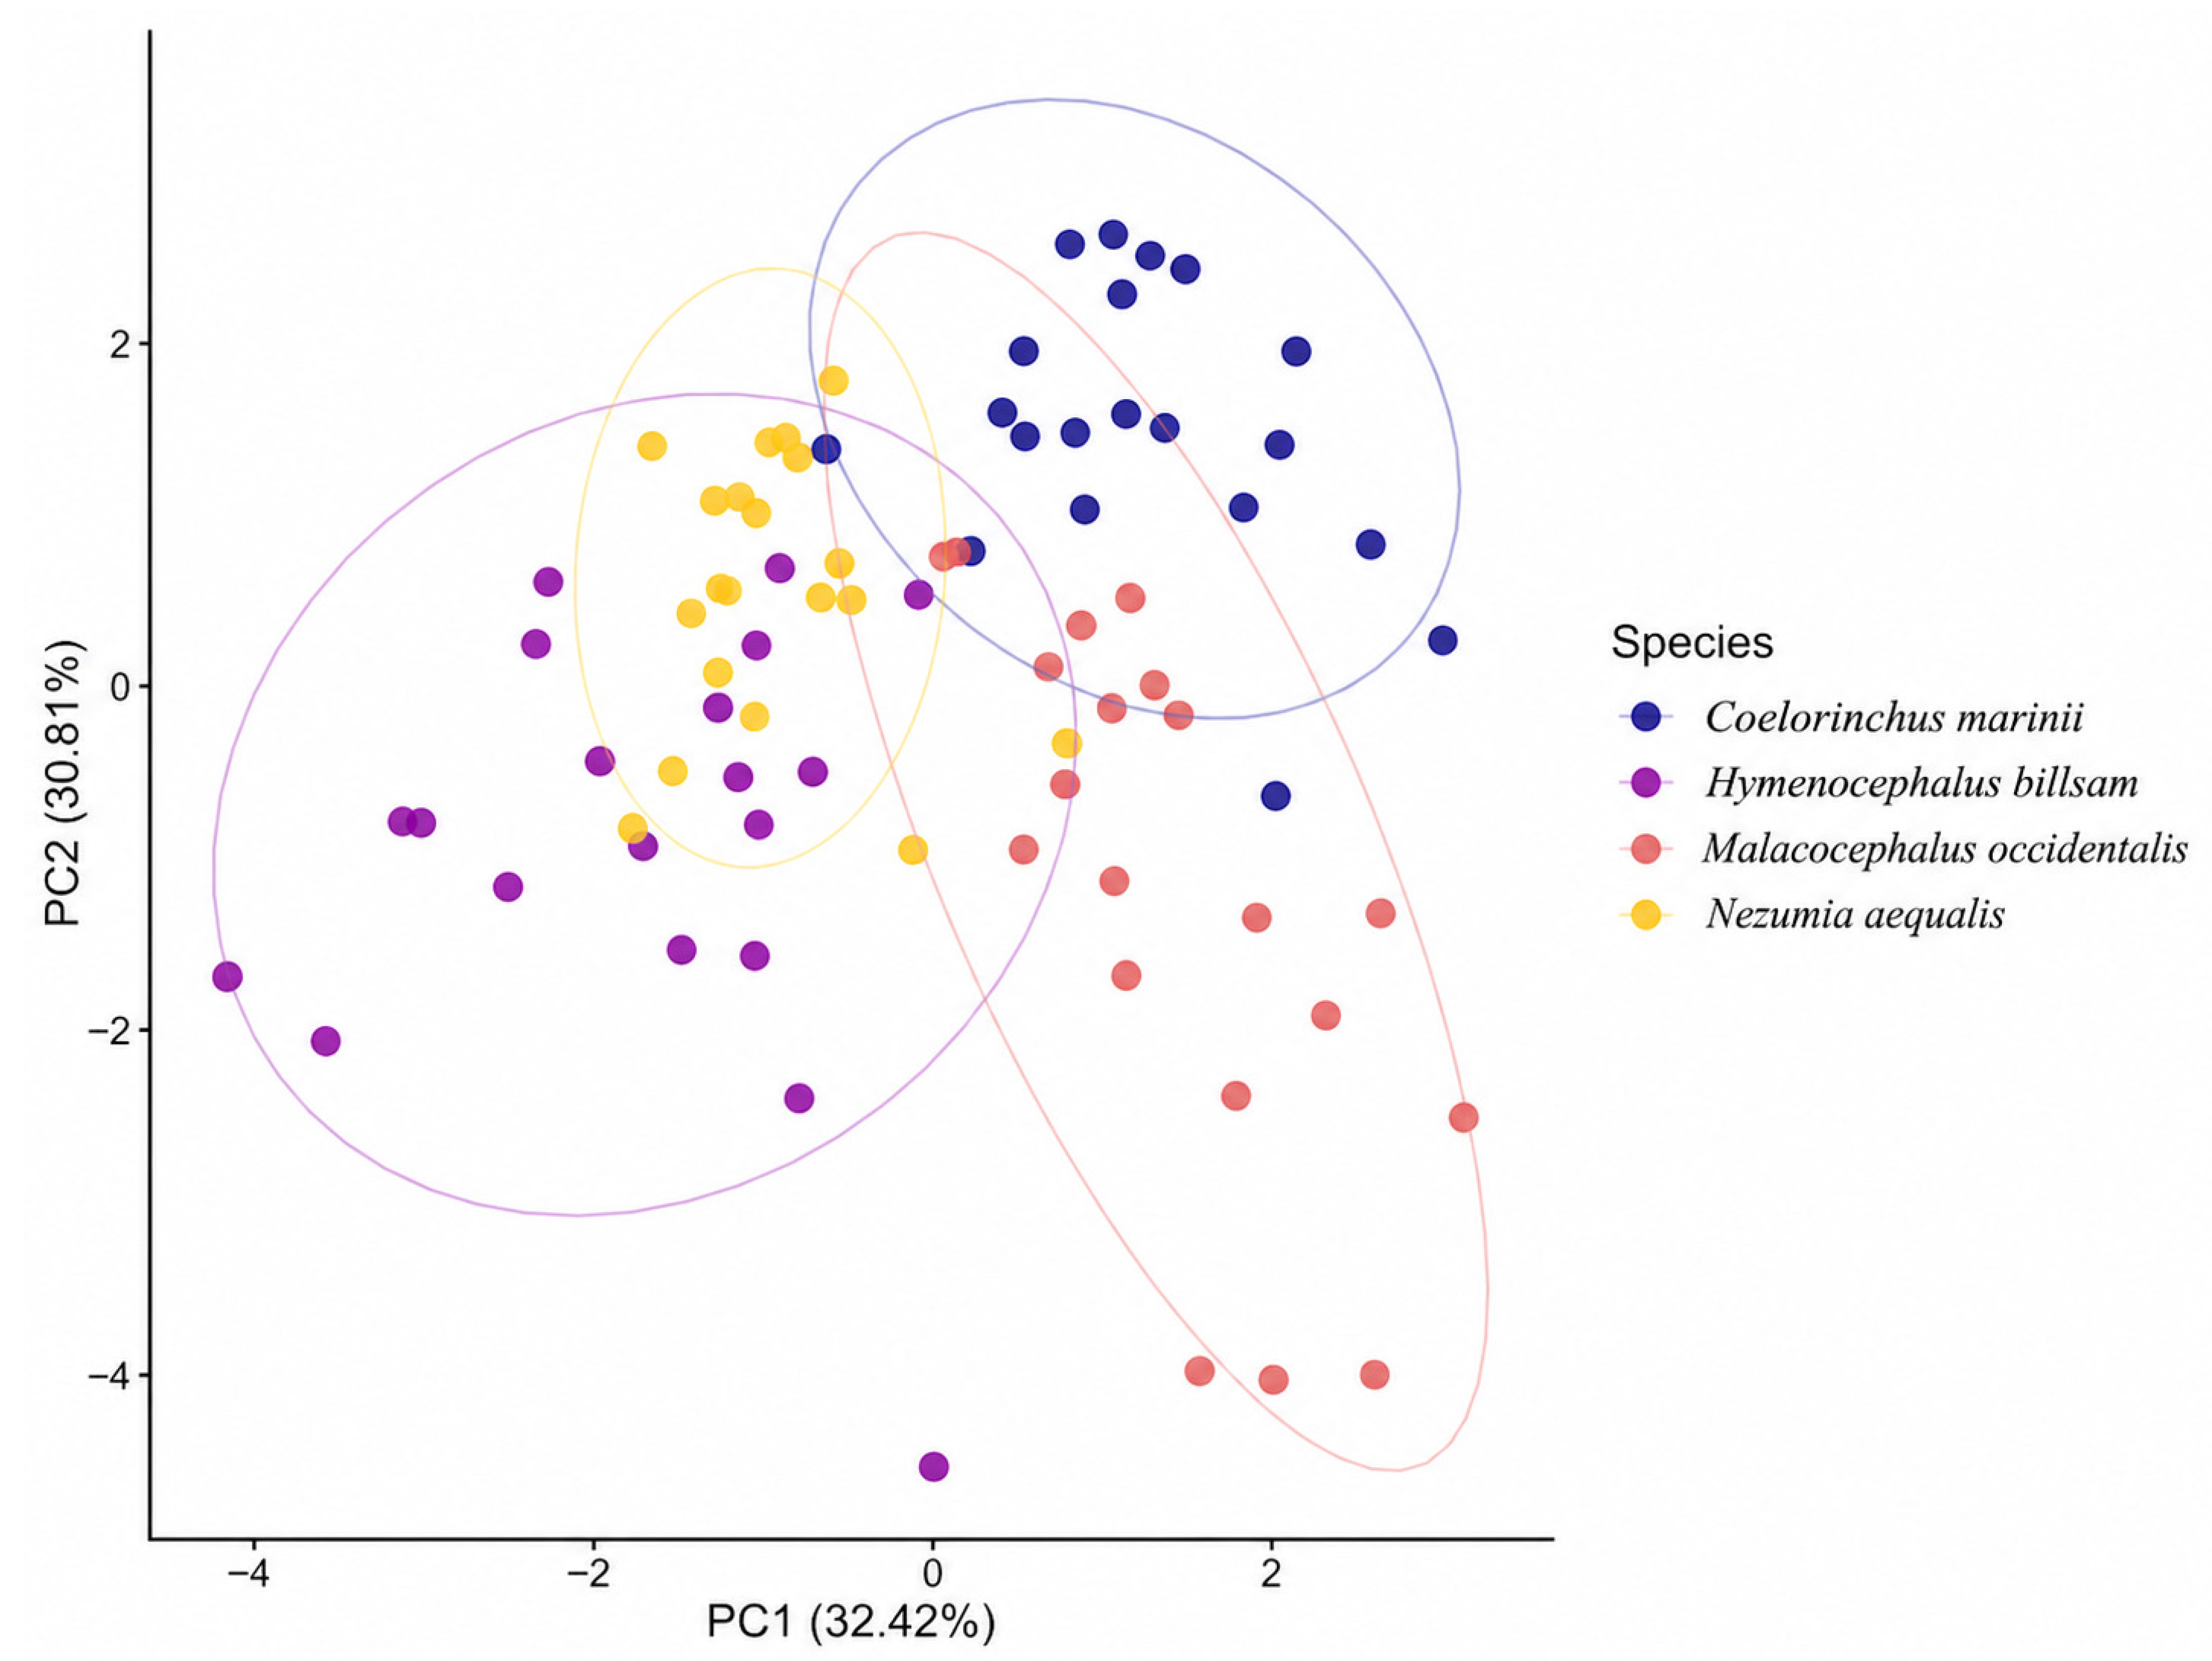
Principal component analysis (PCA) revealed a multidimensional chemical structure among the four species (Figure 7). The first two principal components explained 32.42% and 30.81% of the total variance, respectively, accounting for 63.23% of the variation. The loadings for PC1 were dominated by Mg:Ca (0.474), Mn:Ca (0.466), Sr:Ca (−0.421), Li:Ca (−0.372), and Cu:Ca (0.340). For PC2, the highest loadings were Ba:Ca (−0.464), Cu:Ca (−0.464), Ni:Ca (−0.423), Zn:Ca (−0.387), and Sr:Ca (−0.354). These values indicate that both environmentally (Sr:Ca, Ba:Ca) and physiologically (Mn:Ca, Mg:Ca, Zn:Ca, Cu:Ca) controlled elements contributed to the chemical segregation among species. The species-level PERMANOVA indicated highly significant differences in chemical signatures among the four species (p = 0.0001; F = 57.18; R2 = 0.693), confirming that otolith elemental composition differs consistently among the ecological groups analysed. However, the test for homogeneity of multivariate dispersions (betadisper) was significant (p = 0.008), indicating that the groups differ not only in centroids but also in multivariate spread. Therefore, the PERMANOVA results should be interpreted with caution, as part of the observed variation may reflect differences in dispersion rather than shifts in mean composition. When applied within each species to test differences among the ontogenetic segments identified by PELT, PERMANOVA revealed significant differences for all species (p = 0.001 for C. marinii, H. billsam, M. occidentalis and N. aequalis), indicating that chemical composition varies substantially along ontogeny in each species.

4. Discussion

This study used otolith chemistry to investigate the life-history traits of four grenadier species, tracking the changes in their elemental composition from birth to adulthood. A common pattern of decreasing concentrations of elements such as Mg, Cu, Ni and Zn with growth was observed, suggesting a strong physiological control over the incorporation of these elements into the otolith calcium carbonate matrix [17,29]. In contrast, species-specific patterns were identified for the main environmental tracers, particularly Ba, Sr and Mn, revealing different habitat-use strategies and life-history characteristics. These chemical changes, recorded from the otolith core (embryonic and larval stages) to the edge (adult stage at capture), are consistent with the ecological shift from free-swimming larvae to demersal or pelagic adults, as evidenced by the ontogenetic segmentation detected by PELT and GAMs [50,51,54]. The statistical breakpoints identified by the PELT algorithm represent discrete changes in the mean of elemental time series; however, these may not always correspond to biologically meaningful ontogenetic events. Some change points could arise from gradual physiological shifts, analytical noise, or natural variability in element incorporation. Therefore, we focus our ecological interpretation on consistent, multi element patterns and on change points that appear across multiple individuals.
Otolith chemical composition in fish is influenced by a combination of environmental conditions and physiological influences. External factors affecting this process include temperature, salinity, diet and the chemistry of the surrounding water [17,62,63]. Among internal factors, the proteins that regulate otolith formation play a central role [29,64,65]. Some elements, such as Sr, Ba and Mn, are particularly useful as environmental tracers because they dissolve directly from the water into the endolymph and, since they do not undergo intensive metabolic processing, are thought to more directly reflect the environmental conditions to which the fish were exposed [21,29,65]. Other elements, such as Mg, Li, Cu, Ni and Zn, although also capable of reflecting environmental variations, are strongly modulated by physiological processes such as metabolism and reproduction [17,29], which is consistent with the ontogenetic decline patterns observed in the present study.
The Ba:Ca and Sr:Ca ratios in otoliths evidenced different early-life strategies. Increases in Ba:Ca ratios are typical of low-salinity environments in estuarine and coastal systems [66,67]. However, in the deep-sea context, higher Ba:Ca values are primarily associated with depth-related increases in water-column barium concentrations, mainly due to barite dissolution and remineralisation processes [23,24,25]. However, this relationship can vary depending on watershed characteristics, especially in areas of volcanic origin, where natural Ba concentrations tend to be higher [62,63,64]. The high Ba:Ca values observed in the core of otoliths from all four species suggest that larvae developed in highly productive waters, since barium incorporation predominantly reflects its environmental availability. This pattern is consistent with a planktonic lifestyle in the open ocean [38,68,69].
In contrast, Sr:Ca ratios tend to be influenced by environmental salinity, increasing in saltier waters and being relatively stable with respect to physiological changes [68,70,71]. Thus, variations in Sr:Ca profiles can indicate migrations between water masses with different salinity signatures or residence in specific water columns, offering a complementary line of evidence about the ecology and early movements of the fish [49,72,73]. Multivariate analysis (GMM and PCA) corroborates the central importance of this element, with Sr:Ca being the main contributor to chemical variation in the first components and acting as one of the main axes of ontogenetic segregation (Figure 7) [55,56,57].
The ontogenetic trajectories revealed species-specific strategies. In M. occidentalis, Ba:Ca increased continuously throughout growth, suggesting residence in water masses with increasing barium availability, possibly associated with vertical displacements or occupation of upwelling areas. In C. marinii, Ba:Ca also showed a general increasing trend, although with oscillations that may reflect discrete ontogenetic transitions, as detected by PELT segmentation [50,51]. In contrast, H. billsam exhibited a progressive decline in Ba:Ca accompanied by a marked increase in Sr:Ca, a pattern indicating prolonged residence in the water column, typical of a pelagic species, but with a change in the chemical composition of the water throughout life. N. aequalis showed a sharp decline in Ba:Ca after the initial stages, with multiple change points detected by PELT, suggesting a succession of ontogenetic transitions between different depths or water masses. For Sr:Ca, H. billsam showed a progressive increase, M. occidentalis a sharp decline, while C. marinii and N. aequalis exhibited more moderate declining trends, reflecting different histories of exposure to water masses with distinct salinities.
In N. aequalis, the sharp decline in Ba:Ca suggests a relatively rapid migration to a habitat with lower barium availability, possibly linked to a move to deeper or less barium-enriched waters, although physiological regulation cannot be completely excluded. In deep-sea species, evidence indicates that Ba:Ca tends to decrease after the transition from surface to deeper habitats, reflecting lower environmental barium availability [25,28,74]. Furthermore, in demersal species, the settlement process is marked by clear changes in otolith Ba:Ca ratios, with higher values during the pelagic phase and subsequent reduction after establishment on the bottom, a pattern observed in different ecological contexts [75,76]. In N. aequalis, the GMM analysis identified only three chemical clusters [56], which may reflect a more abrupt or less segmented ontogenetic transition compared to the other species, consistent with this interpretation.
In contrast, in H. billsam, the progressive increase in Sr:Ca throughout growth associated with the decline in Ba:Ca indicates prolonged residence in the water column during juvenile and adult stages, consistent with its classification as a pelagic species [43]. This joint pattern, initially paradoxical because Ba and Sr typically respond antagonistically to salinity gradients, can be explained by continuous exposure to productive oceanic water masses, such as upwelling zones, which combine high productivity (elevating Ba) with high salinity (elevating Sr). Recent evidence shows that Ba:Ca and Sr:Ca ratios faithfully reflect the chemical signature of water masses and can be used to track the occupation of pelagic or demersal habitats [77], reinforcing the interpretation that H. billsam maintains a predominantly pelagic mode of life throughout its development.
Differences in habitat use among the genera became even clearer when manganese (Mn:Ca) was analysed. Manganese has been proposed as a potential indicator for tracing fish contact with the seabed [21,78,79]. This geochemical proxy is based on a well-established mechanism: under hypoxic conditions at the water–sediment interface, manganese oxides (Mn4+) are reduced to soluble Mn2+, which is released from the sediments into the pore water and then into the water column [80,81,82]. This local enrichment creates a pronounced chemical gradient, with Mn2+ concentrations much higher in near-bottom waters than in the open water column [83,84,85]. Thus, when a fish traverses this enriched environment, Mn2+ is incorporated into the calcium carbonate matrix of the otolith during biomineralisation. The reliability of this tracer is supported by studies showing direct correlations between estimated hypoxia exposure and Mn:Ca values in otoliths [78,86,87], as well as by evidence that Mn incorporation in the otolith primarily reflects dissolved environmental availability rather than variables such as temperature or salinity [21,88].
Besides its environmental role, manganese has intrinsic physiological relevance, acting as an essential cofactor for various metalloenzymes involved in oxidative metabolism and skeletal development [29]. These functions may influence its incorporation into the otolith core during early development stages, reflecting both environmental bioavailability and physiological regulation of the element [89,90]. However, crystalline anomalies in otoliths, such as the substitution of aragonite by vaterite, can alter microchemistry and generate anomalous Mn:Ca values that do not reflect the environment but rather irregular biomineralisation processes [88,91]. Applying this principle, the Mn:Ca signature clearly differentiated the studied genera: persistently low values in H. billsam suggest that this species lived predominantly in the water column, while higher but decreasing values throughout life in C. marinii, M. occidentalis and N. aequalis indicate a trajectory from planktonic larvae to benthic adults, marking their settlement migration to the bottom.
Beyond these environmental signals, some minor and trace elements revealed important physiological differences. Magnesium (Mg:Ca) decreased with age in all species. Interpreting Mg is particularly complex because its incorporation into otoliths is regulated by multiple physiological and environmental processes. During rapid growth phases, fish tend to show higher Mg values, reflecting both an accelerated metabolism and the active deposition of organic matrix during biomineralisation [17,92,93]. Additionally, Mg incorporation appears to respond to water temperature, with values tending to be higher in warmer environments and lower in cold waters [94,95]. Finally, the consistent reduction in Mg:Ca observed throughout ontogeny may reflect growth deceleration, migration to progressively colder and deeper waters, or a combination of these factors [17,29,93].
Copper (Cu:Ca) and nickel (Ni:Ca) also showed variable ontogenetic patterns among species, differing from the consistent decline observed for other physiological elements. In C. marinii, M. occidentalis and N. aequalis, Cu:Ca exhibited a progressive decline throughout growth, whereas in H. billsam values varied among segments, with a low overall median. For Ni:Ca, a decline was observed in C. marinii, M. occidentalis and N. aequalis, while in H. billsam values remained stable. The incorporation of these metals into otoliths is influenced by physiological processes, such as metabolic rate and organic matrix deposition [96], as well as by environmental availability, including possible anthropogenic sources [97]. In the case of M. occidentalis, Cu:Ca was among the elements that contributed most to the variance in PC1, reinforcing its relevance in intraspecific chemical segregation.
A pattern of ontogenetic decline in the Zn:Ca ratio was observed in all four species, interrupted by a consistent peak at the otolith edge. Furthermore, M. occidentalis demonstrated a distinctive signature, with a second Zn:Ca peak recorded in the medial portion of the otolith, suggesting a unique exposure or physiological regulation event in this species. Notably, the position of this medial peak coincides with the pronounced Cu:Ca peak in the same species, and the covariance of Cu and Zn may be a strong indicator of common physiological events, such as gonadal maturation, since both elements are crucial components of vitellogenin and enzymes involved in sex hormone synthesis [98,99]. The strong homeostatic regulation of zinc in fish often attenuates its environmental signal, making it a more reliable marker of internal processes than variations in water mass [17,65]. The interpretation of this peak as an ontogenetic transition is reinforced by studies showing that discrete peaks function as reliable markers of life-history events [100]. Although no study has quantified Zn dynamics in the otoliths of these specific species, elevated Zn concentrations in other marine fishes, including macrourids, have previously been associated with physiological or metabolic processes [101,102]. Therefore, the distinct Zn peak reflects a period of high metabolic demand, possibly representing an important life-history event, such as the onset of maturation, or potentially related to its known aggregation behaviour for spawning.
Together, the integration of multiple trace elements in the otoliths revealed a complex yet coherent picture of the life histories and ecological strategies of these Macrouridae species. The analysis demonstrated that environmental proxies (Ba:Ca, Sr:Ca and Mn:Ca) were decisive in discriminating pelagic and demersal life modes and their ontogenetic transitions, validating and refining traditional ecological classification. In parallel, physiologically influenced elements (Mg:Ca, Cu:Ca, Ni:Ca, Zn:Ca) offered crucial insights into internal metabolic processes and key developmental events. This multidimensional chemical characterisation thus provides a robust framework that supports the key ecological and physiological inferences drawn about the life history of these deep-sea fishes.
A key limitation of this study relates to both sample size and the absence of independent environmental measurements. Although the use of 20 individuals per species is acceptable for microchemical analyses and allowed robust statistical comparisons, it may limit the generalization of the observed ecological patterns to broader spatial or temporal scales. Future studies with larger sample sizes and replicated sampling across seasons or regions would help confirm the ontogenetic trajectories inferred here. In addition, no independent environmental data (e.g., water column profiles of Ba, Sr, Mn, temperature, salinity, or dissolved oxygen) were available from the sampling sites. While the observed otolith patterns are consistent with known bathymetric and geochemical gradients in the Southwestern Atlantic, direct validation of the inferred depth or water mass shifts requires future studies that couple otolith microchemistry with in situ environmental data or archival tags.

5. Conclusions

This study demonstrated the potential of otolith microchemistry integrated with multivariate analyses to reconstruct the life histories of four Macrouridae species in the deep-sea environment. The approach revealed a common physiological pattern, a decline in trace element incorporation with age, while also evidencing distinct ecological strategies among species.
The environmental tracers Ba:Ca, Sr:Ca and Mn:Ca contributed to the discrimination of pelagic and demersal life modes. The data confirmed that Hymenocephalus billsam maintains a strictly pelagic habit, whereas Coelorinchus marinii, Malacocephalus occidentalis and Nezumia aequalis undergo an ontogenetic transition from planktonic larvae to demersal adults, with Mn:Ca acting as a robust tracer of settlement on the bottom.
Elements under physiological control (Mg:Ca, Cu:Ca, Ni:Ca, Zn:Ca) provided insights into internal processes. The ontogenetic decline of these ratios suggests greater homeostasis in adult stages. The coincidence of the median peaks of Cu:Ca and Zn:Ca in M. occidentalis points to a discrete physiological event, possibly related to gonadal maturation or pre-reproductive aggregations.
Future integration with stable isotopes (δ18O and δ13C) will allow these reconstructions to be refined, adding thermometric and trophic dimensions, and consolidating a powerful analytical framework for the study of deep-sea fish ecology.

Supplementary Materials

The following supporting information can be downloaded at: https://www.mdpi.com/article/10.3390/fishes11050288/s1, Figure S1: Ontogenetic profiles of element-to-calcium ratios for Coelorinchus marinii expressed as absolute distance (µm) from the core to the margin. Points are individual measurements (grey). The solid blue line is the fitted GAM smoother, and the grey ribbon indicates the 95% confidence interval. The eight panels are arranged in a 2 × 4 grid; from left to right and top to bottom, they correspond to Sr:Ca, Ba:Ca, Li:Ca, Mg:Ca, Mn:Ca, Ni:Ca, Cu:Ca, and Zn:Ca. (Change points detected by the PELT algorithm are not shown because they were defined on the relative distance scale), Figure S2: Ontogenetic profiles of element-to-calcium ratios for Hymenocephalus billsam expressed as absolute distance (µm) from the core to the margin. Points are individual measurements (grey). The solid blue line is the fitted GAM smoother, and the grey ribbon indicates the 95% confidence interval. The eight panels are arranged in a 2 × 4 grid; from left to right and top to bottom, they correspond to Sr:Ca, Ba:Ca, Li:Ca, Mg:Ca, Mn:Ca, Ni:Ca, Cu:Ca, and Zn:Ca. (Change points detected by the PELT algorithm are not shown because they were defined on the relative distance scale), Figure S3. Ontogenetic profiles of element-to-calcium ratios for Malacocephalus occidentalis expressed as absolute distance (µm) from the core to the margin. Points are individual measurements (grey). The solid blue line is the fitted GAM smoother, and the grey ribbon indicates the 95% confidence interval. The eight panels are arranged in a 2 × 4 grid; from left to right and top to bottom, they correspond to Sr:Ca, Ba:Ca, Li:Ca, Mg:Ca, Mn:Ca, Ni:Ca, Cu:Ca, and Zn:Ca. (Change points detected by the PELT algorithm are not shown because they were defined on the relative distance scale); Figure S4. Ontogenetic profiles of element-to-calcium ratios for Nezumia aequalis expressed as absolute distance (µm) from the core to the margin. Points are individual measurements (grey). The solid blue line is the fitted GAM smoother, and the grey ribbon indicates the 95% confidence interval. The eight panels are arranged in a 2 × 4 grid; from left to right and top to bottom, they correspond to Sr:Ca, Ba:Ca, Li:Ca, Mg:Ca, Mn:Ca, Ni:Ca, Cu:Ca, and Zn:Ca. (Change points detected by the PELT algorithm are not shown because they were defined on the relative distance scale); Table S1. Generalized Additive Model (GAM) statistics for element:Ca ratios (μmol/mol) along the core-to-edge relative distance (0–100%). For each species and element: deviance explained (%), adjusted R2;, estimated degrees of freedom (edf), F, and p-value. Models were fitted with penalized splines and REML. p < 0.05 indicates a significant ontogenetic trend; p = 0 corresponds to p < 0.001.

Author Contributions

C.S.: Conceptualization, Data collection, Formal analysis, Investigation, Methodology, Writing—original draft. R.M.S.: Methodology. A.M.: Formal analysis, Methodology, Writing—Review and Editing. J.P.: Resources, Writing—Review and Editing. A.T.C.: Conceptualization, Funding Acquisition, Investigation, Methodology, Resources, Supervision, Writing—Review and Editing. All authors have read and agreed to the published version of the manuscript.

Funding

The authors received financial support from the Brazilian agencies Coordenação de Aperfeiçoamento de Pessoal de Nível Superior (CAPES; doctoral fellowship no. 88887.639482/2021-00 and Sandwich Doctorate Abroad scholarship PDSE-CAPES no. 88881.982432/2024-01 to CS) and Fundação de Amparo à Pesquisa do Estado de São Paulo through the project “Diversidade e evolução de peixes de oceano profundo: DEEP-OCEAN” (FAPESP grant 2017/12909-4 to CS). This work was also funded by Portuguese funds through FCT—Fundação para a Ciência e a Tecnologia, I.P., and by the European Commission’s Recovery and Resilience Facility, within the scope of UID/04423/2025 (https://doi.org/10.54499/UID/04423/2025, accessed on 4 November 2025), UID/PRR/04423/2025 (https://doi.org/10.54499/UID/PRR/04423/2025, accessed on 4 November 2025), and LA/P/0101/2020 (https://doi.org/10.54499/LA/P/0101/2020, accessed on 4 November 2025).

Institutional Review Board Statement

The animal study protocol was approved by Comitê de Ética em Uso de Animais em Pesquisa e Ensino do Instituto Oceanográfico da Universidade de São Paulo (protocol code CIAEP No. 01.0558.2019/CEUA No. 16 pesq; Approval Date: 9 February 2022).

Data Availability Statement

The data presented in this study are available on request from the corresponding author.

Acknowledgments

We thank the crew of the R/V Alpha Crucis for collecting specimens during two oceanographic cruises, and our colleagues from the Laboratório de Diversidade, Ecologia and Evolução de Peixes (DEEP Lab, IO-USP) for their assistance during fieldwork and laboratory activities. CS is also indebted to Marcelo Roberto Souto de Melo (IO-USP) for his assistance.

Conflicts of Interest

The authors declare no conflicts of interest.

References

  1. Haddock, S.H.D.; Dunn, C.W.; Pugh, P.R. Bioluminescence in the Sea. Annu. Rev. Mar. Sci. 2010, 2, 443–493. [Google Scholar] [CrossRef]
  2. Priede, I.G. Deep-Sea Fishes: Biology, Diversity, Ecology and Fisheries; Cambridge University Press: Cambridge, UK, 2017. [Google Scholar]
  3. Haddock, S.H.D.; Choy, C.A. Life in the Midwater: The Ecology of Deep Pelagic Animals. Annu. Rev. Mar. Sci. 2024, 16, 383–413. [Google Scholar] [CrossRef]
  4. Drazen, J.C.; Haedrich, R.L. A continuum of life histories in deep-sea demersal fishes. Deep-Sea Res. I 2012, 61, 34–42. [Google Scholar] [CrossRef]
  5. Koslow, J.A. Energetic and life-history patterns of deep-sea benthic, benthopelagic and seamount-associated fish. J. Fish Biol. 1996, 49, 54–74. [Google Scholar] [CrossRef]
  6. Merrett, N.R.; Haedrich, R.L. Deep-Sea Demersal Fish and Fisheries; Chapman & Hall: London, UK, 1997. [Google Scholar]
  7. Mariño-Briceño, G.; Medeiros-Leal, W.; Peixoto, U.I.; Pinho, M.; Santos, R. Life History and Fishing Aspects of the Deep-Sea Silver Scabbardfish Lepidopus caudatus in the Azores. Biology 2022, 11, 1619. [Google Scholar] [CrossRef]
  8. Haimovici, M.; Rossi-Wongtschowski, C.L.D.B.; Bernardes, R.Á.; Fischer, L.G.; Vooren, C.M.; Santos, R.A.D.; Rodrigues, A.R.; Santos, S.D. Prospecção Pesqueira de Espécies Demersais com Rede de Arrasto-de-Fundo na Região Sudeste-Sul do Brasil; Série Documentos Revizee: São Paulo, Brazil, 2008. [Google Scholar]
  9. Fischer, L.G. Distribuição, Biomassas e Ecologia de Macrouridae (Teleostei, Gadiformes) no Talude Continental do sul do Brasil, com ênfase em Coelorinchus marinii Hubbs 1934 e Malacocephalus occidentalis Goode & Bean 1885. Ph.D. Thesis, Universidade Federal do Rio Grande, Rio Grande, Brazil, 2012. [Google Scholar]
  10. Nóbrega, M.F.; Garcia Junior, J.; Oliveira, M.A.; Lins Oliveira, J.E. Continental slope fishes of the Potiguar Basin off Northeast Brazil in the Equatorial Atlantic ocean. Deep-Sea Res. I 2022, 190, 103937. [Google Scholar] [CrossRef]
  11. Anderson, M.E. Food habits of some deep-sea fish off South Africa’s west coast and Agulhas Bank. 1. The grenadiers (Teleostei: Macrouridae). Afr. J. Mar. Sci. 2005, 27, 409–425. [Google Scholar] [CrossRef]
  12. Stowasser, G.; McAllen, R.; Pierce, G.J.; Collins, M.A.; Moffat, C.F.; Priede, I.G.; Pond, D.W. Trophic position of deep-sea fish: Assessment through fatty acid and stable isotope analyses. Deep-Sea Res. I 2009, 56, 812–826. [Google Scholar] [CrossRef]
  13. Stevens, D.W.; Dunn, M.R. Diet of six deep-sea grenadiers (Macrouridae). J. Fish Biol. 2019, 96, 217–229. [Google Scholar] [CrossRef] [PubMed]
  14. Botsford, L.W.; Brumbaugh, D.R.; Grimes, C. Connectivity, sustainability, and yield: Bridging the gap between conventional fisheries management and marine protected areas. Rev. Fish Biol. Fish. 2009, 19, 69–95. [Google Scholar] [CrossRef]
  15. Cooke, S.J.; Bergman, J.N.; Twardek, W.M.; Piczak, M.L.; Casselberry, G.A.; Lutek, K.; Dahlmo, L.S.; Birnie-Gauvin, K.; Griffin, L.P.; Brownscombe, J.W.; et al. The movement ecology of fishes. J. Fish Biol. 2022, 101, 756–777. [Google Scholar] [CrossRef] [PubMed]
  16. Lee, B.; Skeljo, F.; Randhawa, H.S.; Arkhipkin, A. Deep-sea movement patterns of the Patagonian toothfish Dissostichus eleginoides Smitt in the Southwest Atlantic. Mar. Freshw. Res. 2022, 73, 833–845. [Google Scholar] [CrossRef]
  17. Sturrock, A.M.; Hunter, E.; Milton, J.A.; Johnson, R.C.; Waring, C.P.; Trueman, C.N. Quantifying physiological influences on otolith microchemistry. Methods Ecol. Evol. 2015, 6, 806–816. [Google Scholar] [CrossRef]
  18. Adelir-Alves, J.; Daros, F.A.; Spach, H.L.; Soeth, M.; Correia, A.T. Otoliths as a tool to study reef fish population structure from coastal islands of South Brazil. Mar. Biol. Res. 2018, 14, 973–988. [Google Scholar] [CrossRef]
  19. Correia, A.T.; Moura, A.; Triay-Portella, R.; Santos, P.T.; Pinto, E.; Almeida, A.A.; Sial, A.; Muniz, A.A. Population structure of the chub mackerel (Scomber colias) in the NE Atlantic inferred from otolith elemental and isotopic signatures. Fish. Res. 2021, 234, 105785. [Google Scholar] [CrossRef]
  20. Campana, S.E. Chemistry and composition of fish otoliths: Pathways, mechanisms and applications. Mar. Ecol. Prog. Ser. 1999, 188, 263–297. [Google Scholar] [CrossRef]
  21. Elsdon, T.S.; Wells, B.K.; Campana, S.E.; Gillanders, B.M.; Jones, C.M.; Limburg, K.E.; Secor, D.H.; Thorrold, S.R.; Walther, B.D. Otolith chemistry to describe movements and life-history parameters of fishes: Hypotheses, assumptions, limitations and inferences. In Oceanography and Marine Biology: An Annual Review; Gibson, R.N., Atkinson, R.J.A., Gordon, J.D.M., Eds.; CRC Press: Boca Raton, FL, USA, 2008; Volume 46, pp. 297–330. [Google Scholar]
  22. Belay, T.H.; Mengist, A.B. The application of otolith chemistry in fish life history assessment: Review. Fish. Aquat. Sci. 2025, 28, 583–595. [Google Scholar] [CrossRef]
  23. Bath, G.E.; Thorrold, S.R.; Jones, C.M.; Campana, S.E.; McLaren, J.W.; Lam, J.W.H. Strontium and barium uptake in aragonitic otoliths of marine fish. Geochim. Cosmochim. Acta 2000, 64, 1701–1712. [Google Scholar] [CrossRef]
  24. Lin, Y.-T.; Wang, C.-H.; You, C.-F.; Tzeng, W.-N. Ba/Ca ratios in otoliths of southern bluefin tuna (Thunnus maccoyii) as a biological tracer of upwelling in the Great Australian Bight. J. Mar. Sci. Technol. 2013, 21, 752–758. [Google Scholar] [CrossRef]
  25. Widdrington, J.B.; Reis-Santos, P.; Macdonald, J.I.; Nicol, S.J.; Gillanders, B.M. Otolith-derived chemical chronologies reveal distinct patterns in physiology and environmental life histories of deep-sea snappers. Mar. Environ. Res. 2025, 212, 107493. [Google Scholar] [CrossRef]
  26. Hicks, A.S.; Closs, G.P.; Swearer, S.E. Otolith microchemistry of two amphidromous galaxiids across an experimental salinity gradient: A multi-element approach for tracking diadromous migrations. J. Exp. Mar. Biol. Ecol. 2010, 394, 86–97. [Google Scholar] [CrossRef]
  27. Reis-Santos, P.; Tanner, S.E.; Elsdon, T.S.; Cabral, H.N.; Gillanders, B.M. Effects of temperature, salinity and water composition on otolith elemental incorporation of Dicentrarchus labrax. J. Exp. Mar. Biol. Ecol. 2013, 445, 38–48. [Google Scholar] [CrossRef]
  28. Hüssy, K.; Haase, S.; Mion, M.; Hilvarsson, A.; Radtke, K.; Thomsen, T.B.; Krüger-Johnsen, M.; Casini, M.; Sturrock, A.M. Into the wild: Coupling otolith and archival tag records to test assumptions underpinning otolith chemistry applications in wild fish. Front. Mar. Sci. 2024, 11, 1365023. [Google Scholar] [CrossRef]
  29. Hüssy, K.; Limburg, K.E.; de Pontual, H.; Thomas, O.R.B.; Cook, P.K.; Heimbrand, Y.; Blass, M.; Sturrock, A.M. Trace element patterns in otoliths: The role of biomineralization. Rev. Fish. Sci. Aquac. 2021, 29, 445–477. [Google Scholar] [CrossRef]
  30. Huh, Y.; Chan, L.H.; Zhang, L.; Edmond, J.M. Lithium and its isotopes in major world rivers: Implications for weathering and the oceanic budget. Geochim. Cosmochim. Acta 1998, 62, 2039–2051. [Google Scholar] [CrossRef]
  31. Halden, N.M.; Friedrich, L.A. Trace-element distributions in fish otoliths: Natural markers of life histories, environmental conditions and exposure to tailings effluence. Mineral. Mag. 2008, 72, 593–605. [Google Scholar] [CrossRef]
  32. Sturrock, A.M.; Trueman, C.N.; Milton, J.A.; Waring, C.P.; Cooper, M.J.; Hunter, E. Physiological influences can outweigh environmental signals in otolith microchemistry research. Mar. Ecol. Prog. Ser. 2014, 500, 245–264. [Google Scholar] [CrossRef]
  33. Longmore, C.; Fogarty, K.; Neat, F.; Brophy, D.; Trueman, C.N.; Milton, A.; Mariani, S. A comparison of otolith microchemistry and otolith shape analysis for the study of spatial variation in a deep-sea teleost, Coryphaenoides rupestris. Environ. Biol. Fishes 2010, 89, 591–605. [Google Scholar] [CrossRef]
  34. Higgins, R.M.; Isidro, E.J.; Menezes, G.M.; Correia, A.T. Otolith elemental signatures indicate population separation in deep-sea rockfish, Helicolenus dactylopterus and Pontinus kuhlii, from the Azores. J. Sea Res. 2013, 83, 202–208. [Google Scholar] [CrossRef]
  35. Daros, F.A.; Spach, H.L.; Correia, A.T. Habitat residency and movement patterns of Centropomus parallelus juveniles in a subtropical estuarine complex. J. Fish Biol. 2016, 88, 1796–1810. [Google Scholar] [CrossRef]
  36. de Pontual, H.; MacKenzie, K.M.; Tabouret, H.; Daverat, F.; Mahé, K.; Pecheyran, C.; Hüssy, K. Heterogeneity of otolith chemical composition from two-dimensional mapping: Relationship with biomineralization mechanisms and implications for microchemistry analyses. J. Fish Biol. 2023, 103, 1049–1066. [Google Scholar] [CrossRef]
  37. Soeth, M.; Spach, H.L.; Daros, F.A.; Pisonero, J.; Correia, A.T. Use of otolith elemental signatures to unravel lifetime movement patterns of Atlantic spadefish, Chaetodipterus faber, in the Southwest Atlantic Ocean. J. Sea Res. 2020, 158, 101873. [Google Scholar] [CrossRef]
  38. Xuan, Z.; Wang, X.; Hajisamae, S.; Tsim, K.W.K.; Yang, J.; Wang, W.-X. Otolith microchemistry reveals different environmental histories for two endangered fourfinger threadfin species. Mar. Ecol. Prog. Ser. 2022, 700, 161–178. [Google Scholar] [CrossRef]
  39. Ferreira, I.; Daros, F.A.; Moreira, C.; Feijó, D.; Rocha, A.; Mendez-Vicente, A.; Pisonero, J.; Correia, A.T. Is Chelidonichthys lucerna (Linnaeus, 1758) a Marine Estuarine-Dependent Fish? Insights from Saccular Otolith Microchemistry. Fishes 2023, 8, 383. [Google Scholar] [CrossRef]
  40. Campos, E.J.D.; Velhote, D.; da Silveira, I.C.A. Shelf break upwelling driven by Brazil Current Cyclonic Meanders. Geophys. Res. Lett. 2000, 27, 751–754. [Google Scholar] [CrossRef]
  41. Alvarenga, A.; Paladino, I.M.; Gerotto, A.; DeMenocal, P.; Iwai, F.S.; Sousa, S.H.M.; Figueira, R.C.L.; Mahiques, M.M.; Nagai, R.H. S/SE Brazilian continental margin sea surface temperature and productivity changes over the last 50 kyr. Palaeogeogr. Palaeoclimatol. Palaeoecol. 2022, 601, 111144. [Google Scholar] [CrossRef]
  42. Cohen, D.M.; Inada, T.; Iwamoto, T.; Scialabba, N. FAO Species Catalogue. Vol. 10. Gadiform Fishes of the World (Order Gadiformes). An Annotated and Illustrated Catalogue of Cods, Hakes, Grenadiers and Other Gadiform Fishes Known to Date; FAO: Rome, Italy, 1990.
  43. Iwamoto, T.; Anderson, M.E. Review of the grenadiers (Teleostei: Gadiformes) of southern Africa, with descriptions of four new species. Ichthyol. Bull. J.L.B. Smith Inst. Ichthyol. 1994, 61, 1–28. [Google Scholar]
  44. Strauss, R.E.; Bond, C.E. Taxonomic methods: Morphology. In Methods for Fish Biology; Schreck, C.B., Moyle, P.B., Eds.; American Fisheries Society: Bethesda, MD, USA, 1990; pp. 109–140. [Google Scholar]
  45. Bergstad, O.A.; Hunter, R.H.; Cousins, N.J.; Bailey, D.M.; Jørgensen, T. Notes on age determination, size and age structure, longevity and growth of co-occurring macrourid fishes. J. Fish Biol. 2021, 99, 1032–1043. [Google Scholar] [CrossRef] [PubMed]
  46. Fernandez-Arcaya, U.; Ramirez-Llodra, E.; Rotllant, G.; Recasens, L.; Murua, H.; Quaggio-Grassiotto, I.; Company, J.B. Reproductive biology of two macrourid fish, Nezumia aequalis and Coelorinchus mediterraneus, inhabiting the NW Mediterranean continental margin (400–2000 m). Deep-Sea Res. II 2013, 92, 63–72. [Google Scholar] [CrossRef]
  47. Brown-Peterson, N.J.; Wyanski, D.M.; Saborido-Rey, F.; Macewicz, B.J.; Lowerre-Barbieri, S.K. A standardized terminology for describing reproductive development in fishes. Mar. Coast. Fish. 2011, 3, 52–70. [Google Scholar] [CrossRef]
  48. Pettke, T.; Oberli, F.; Audétat, A.; Guillong, M.; Simon, A.C.; Hanley, J.J.; Klemm, L.M. Recent developments in element concentration and isotope ratio analysis of individual fluid inclusions by laser ablation single and multiple collector 884 ICP-MS. Ore Geol. Rev. 2012, 44, 10–38. [Google Scholar] [CrossRef]
  49. Reis-Santos, P.; Gillanders, B.M.; Sturrock, A.M.; Izzo, C.; Oxman, D.S.; Lueders-Dumont, J.A.; Hüssy, K.; Tanner, S.E.; Rogers, T.; Doubleday, Z.A.; et al. Reading the biomineralized book of life: Expanding otolith biogeochemical research and applications for fisheries and ecosystem-based management. Rev. Fish Biol. Fish. 2023, 33, 411–449. [Google Scholar] [CrossRef]
  50. Killick, R.; Eckley, I.A. changepoint: An R package for changepoint analysis. J. Stat. Softw. 2014, 58, 1–19. [Google Scholar] [CrossRef]
  51. Killick, R.; Fearnhead, P.; Eckley, I.A. Optimal detection of changepoints with a linear computational cost. J. Am. Stat. Assoc. 2012, 107, 1590–1598. [Google Scholar] [CrossRef]
  52. Zhang, N.R.; Siegmund, D.O. A modified Bayes information criterion with applications to the analysis of comparative genomic hybridization data. Biometrics 2007, 63, 22–32. [Google Scholar] [CrossRef] [PubMed]
  53. Basseville, M.; Nikiforov, I.V. Detection of Abrupt Changes: Theory and Application; Prentice Hall: Englewood Cliffs, NJ, USA, 1993. [Google Scholar]
  54. Wood, S.N. Generalized Additive Models: An Introduction with R, 2nd ed.; Chapman and Hall/CRC: Boca Raton, FL, USA, 2017. [Google Scholar] [CrossRef]
  55. Legendre, P.; Legendre, L. Numerical Ecology, 3rd English ed.; Elsevier: Amsterdam, The Netherlands, 2012. [Google Scholar]
  56. Fraley, C.; Raftery, A.E. Model-based clustering, discriminant analysis, and density estimation. J. Am. Stat. Assoc. 2002, 97, 611–631. [Google Scholar] [CrossRef]
  57. Anderson, M.J. A new method for non-parametric multivariate analysis of variance. Austral Ecol. 2001, 26, 32–46. [Google Scholar] [CrossRef]
  58. Oksanen, J.; Simpson, G.L.; Blanchet, F.G.; Kindt, R.; Legendre, P.; Minchin, P.R.; O’Hara, R.B.; Solymos, P.; Stevens, M.H.H.; Szoecs, E.; et al. vegan: Community Ecology Package. R Package Version 2.6-4. 2022. Available online: https://cran.r-project.org/web/packages/vegan/index.html (accessed on 26 February 2026).
  59. Benjamini, Y.; Hochberg, Y. Controlling the false discovery rate: A practical and powerful approach to multiple testing. J. R. Stat. Soc. B 1995, 57, 289–300. [Google Scholar] [CrossRef]
  60. R Core Team. R: A Language and Environment for Statistical Computing; R Foundation for Statistical Computing: Vienna, Austria, 2023. [Google Scholar]
  61. Hammer, Ø.; Harper, D.A.T.; Ryan, P.D. PAST: Paleontological Statistics Software Package for Education and Data Analysis. Palaeontol. Electron. 2001, 4, 1–9. [Google Scholar]
  62. Albuquerque, C.Q. Los otolitos como indicadores del ciclo de vida, de patrones poblacionales, y del uso y características ambientales de los ecosistemas. In Métodos de Estudios con Otolitos: Principios y Aplicaciones; Volpedo, A.V., Vaz-dos-Santos, A.M., Eds.; CAFP-PIESCI: Buenos Aires, Argentina, 2015; pp. 139–166. [Google Scholar]
  63. Vaz-dos-Santos, A.M.; Rautenberg, K.A.; Augusto, C.G.; Ballester, E.L.C.; Schwingel, P.R.; Pinto, E.; Almeida, A.; Correia, A.T. Geographic Variation in Opisthonema oglinum (Lesueur, 1818) in the Southeastern Brazilian Bight Inferred from Otolith Shape and Chemical Signatures. Fishes 2023, 8, 234. [Google Scholar] [CrossRef]
  64. Miller, M.B.; Clough, A.M.; Batstone, J.N.; Visscher, P.T. Proteins in fish otoliths: A review of their role in biomineralization. Comp. Biochem. Physiol. B 2006, 144, 247–255. [Google Scholar] [CrossRef]
  65. Thomas, O.R.B.; Swearer, S.E. Otolith biochemistry: A review. Rev. Fish. Sci. Aquac. 2019, 27, 508–522. [Google Scholar] [CrossRef]
  66. He, S.; Xu, Y.J. Spatiotemporal distributions of Sr and Ba along an estuarine river with a large salinity gradient to the Gulf of Mexico. Water 2016, 8, 323. [Google Scholar] [CrossRef]
  67. Almeida, P.; Costa, M.R.; Coutinho, R.D.S.; Santana, F.M.; Lessa, R.P.; Tchaicka, O.; Correia, A.T.; Lemos, L.S. Use of otolith microchemistry signatures to assess the habitat use of Centropomus undecimalis in lagoon systems of the southwest Atlantic. Reg. Stud. Mar. Sci. 2024, 73, 103470. [Google Scholar] [CrossRef]
  68. Walther, B.D.; Thorrold, S.R. Water, not food, contributes the majority of strontium and barium deposited in the otoliths of a marine fish. Mar. Ecol. Prog. Ser. 2006, 311, 125–130. [Google Scholar] [CrossRef]
  69. Izzo, C.; Doubleday, Z.A.; Gillanders, B.M. Otolith chemistry does not just reflect environmental conditions: A meta-analytic evaluation. Fish Fish. 2018, 19, 441–454. [Google Scholar] [CrossRef]
  70. Elsdon, T.S.; Gillanders, B.M. Interactive effects of temperature and salinity on otolith chemistry: Challenges for determining environmental histories of fish. Can. J. Fish. Aquat. Sci. 2002, 59, 1796–1808. [Google Scholar] [CrossRef]
  71. Tanner, S.E.; Reis-Santos, P.; Cabral, H.N. Otolith chemistry in stock delineation: A brief overview, current challenges and future prospects. Fish. Res. 2016, 173, 206–213. [Google Scholar] [CrossRef]
  72. Arslan, Z.; Secor, D.H. Analysis of trace transition elements and heavy metals in fish otoliths as tracers of habitat use by American eels in the Hudson River estuary. Estuaries 2005, 28, 382–393. [Google Scholar] [CrossRef]
  73. Gillanders, B.M. Otolith chemistry to determine movements of diadromous and freshwater fish. Aquat. Living Resour. 2005, 18, 291–300. [Google Scholar] [CrossRef]
  74. Gauthier, C.; Fisher, J.A.D.; Robert, D.; Sirois, P. Otoliths as chemical archives through ontogeny reveal distinct migratory strategies of Atlantic halibut within the Gulf of St. Lawrence. ICES J. Mar. Sci. 2024, 81, 1221–1233. [Google Scholar] [CrossRef]
  75. Patterson, H.M.; Kingsford, M.J.; McCulloch, M.T. Elemental signatures of Acanthochromis polyacanthus otoliths as a record of settlement. J. Exp. Mar. Biol. Ecol. 2005, 324, 176–191. [Google Scholar] [CrossRef]
  76. Dorval, E.; Jones, C.M.; Hannigan, R. Barium in otoliths as a tracer of settlement in demersal fishes. Trans. Am. Fish. Soc. 2022, 151, 312–328. [Google Scholar] [CrossRef]
  77. Arai, T.; Kotake, A.; Kayama, S.; Ogura, M.; Watanabe, Y. Movements and life history patterns of the skipjack tuna Katsuwonus pelamis in the western Pacific, as revealed by otolith Sr ratios. J. Mar. Biol. Assoc. UK 2005, 85, 1211–1216. [Google Scholar] [CrossRef]
  78. Limburg, K.E.; Casini, M. Otolith manganese as a proxy for hypoxia exposure in Baltic Sea fishes. J. Fish Biol. 2019, 95, 89–101. [Google Scholar] [CrossRef]
  79. Mohan, J.A.; Walther, B.D.; Saborido-Rey, F. Out of breath and hungry: Natural tags reveal trophic resilience of Atlantic croaker to hypoxia exposure. Mar. Ecol. Prog. Ser. 2016, 560, 207–221. [Google Scholar] [CrossRef]
  80. Burdige, D.J. The biogeochemistry of manganese and iron in marine sediments. Earth-Sci. Rev. 1993, 35, 249–284. [Google Scholar] [CrossRef]
  81. Kalnejais, L.H.; Martin, W.R.; Signell, R.P.; Bothner, M.H. Role of sediment resuspension in the remobilization of particulate-phase metals from a contaminated sediment. Mar. Chem. 2007, 104, 27–45. [Google Scholar] [CrossRef]
  82. Davis, J.E.; Robinson, R.S.; Estes, E.R.; Oldham, V.E.; Solomon, E.A.; Kelly, R.P.; Bell, K.E.; Resing, J.A.; Bundy, R.M. Dynamic manganese cycling in the northern Gulf of Mexico. Mar. Chem. 2024, 267, 104466. [Google Scholar] [CrossRef]
  83. Limburg, K.E.; Olson, C.; Walther, Y.; Dale, D.; Slomp, C.P.; Høie, H. Tracking Baltic hypoxia and cod migration over millennia with natural tags. Proc. Natl. Acad. Sci. USA 2011, 108, E177–E182. [Google Scholar] [CrossRef]
  84. Ní Fhlaithearta, S.; Fontanier, C.; Jorissen, F.; Mouret, A.; Dueñas-Bohórquez, A.; Anschutz, P.; Fricker, M.B.; Günther, D.; Lange, G.J.; Reichart, G.J. Manganese incorporation in living (stained) benthic foraminiferal shells: A bathymetric and in-sediment study in the Gulf of Lions (NW Mediterranean). Biogeosciences 2018, 15, 6315–6328. [Google Scholar] [CrossRef]
  85. Middag, R.; Baar, H.J.W.; Laan, P.; Cai, P.H.; Ooijen, J.C. Dissolved manganese in the Atlantic sector of the Southern Ocean. Deep-Sea Res. II 2011, 58, 2661–2677. [Google Scholar] [CrossRef]
  86. Jiang, S.; Hong, P.; Katayama, S. What is the relationship between hypoxia, water chemistry and otolith manganese content? J. Fish Biol. 2022, 100, 1138–1149. [Google Scholar] [CrossRef]
  87. Cavole, L.M.; Miller, J.A.; Miller, R.A.; Salinas-de-León, P.; Aburto-Oropeza, O.; Marin Jarrin, J.R.; Johnson, A.F. The role of extrinsic variation—cohabiting juvenile fish species exhibit similar otolith elemental signatures. Mar. Ecol. Prog. Ser. 2020, 646, 109–125. [Google Scholar] [CrossRef]
  88. Elsdon, T.S.; Gillanders, B.M. Fish otolith chemistry influenced by exposure to multiple environmental variables. J. Exp. Mar. Biol. Ecol. 2004, 313, 269–284. [Google Scholar] [CrossRef]
  89. Elsdon, T.S.; Gillanders, B.M. Reconstructing migratory patterns of fish based on environmental influences on otolith chemistry. Rev. Fish Biol. Fish. 2003, 13, 219–235. [Google Scholar] [CrossRef]
  90. Middag, R.; de Baar, H.J.W.; Klunder, M.B.; Laan, P. Manganese in the West Atlantic Ocean. Deep-Sea Res. I 2013, 72, 1–12. [Google Scholar] [CrossRef]
  91. Lewis, L.S.; Willmes, M.; Denney, C.; Cavole, L.; Xieu, W.; Fichman, R.A.; Ellison, L.; Stevenson, T.; Schultz, A.A.; Hammock, B.G.; et al. Validating estuarine movements from otoliths for an imperiled fish. Aquat. Biol. 2025, 34, 1–13. [Google Scholar] [CrossRef]
  92. Martin, G.B.; Thorrold, S.R. Temperature and salinity effects on magnesium, manganese, and barium incorporation in otoliths of larval and early juvenile spot Leiostomus xanthurus. Mar. Ecol. Prog. Ser. 2005, 293, 223–232. [Google Scholar] [CrossRef]
  93. Miller, J.A.; Hurst, T.P. Growth and otolith chemistry of juvenile fish: Implications for physiological ecology. Mar. Ecol. Prog. Ser. 2020, 643, 167–182. [Google Scholar] [CrossRef]
  94. Limburg, K.E.; Walther, B.D.; Lu, Z.; Jackman, G.; Mohan, J.; Walther, Y.; Nissling, A.; Weber, P.K.; Schmitt, A.K. In search of the dead zone: Use of otoliths for tracking fish exposure to hypoxia. J. Mar. Syst. 2015, 141, 3–10. [Google Scholar] [CrossRef]
  95. Martin, G.B.; Wuenschel, M.J.; Jones, C.M. Effects of temperature and salinity on otolith element incorporation in juvenile gray snapper Lutjanus griseus. Mar. Ecol. Prog. Ser. 2013, 486, 249–264. J. Exp. Mar. Biol. Ecol. 2013, 486, 249–264. [Google Scholar] [CrossRef]
  96. Heimbrand, Y.; Limburg, K.E.; Hüssy, K.; Casini, M.; Sjöberg, R.; Palmén Bratt, A.-M.; Levinsky, S.-E.; Karpushevskaia, A.; Radtke, K.; Öhlund, J. Seeking the true time: Exploring otolith chemistry as an age-determination tool. J. Fish Biol. 2020, 97, 966–983. [Google Scholar] [CrossRef]
  97. Mallik, A.; Prusty, S.; Chakraborty, P.; Das, S.C.S.; Bhushan, S. Fish Otolith Microchemistry as a Biomarker of Metal Pollution in the Estuarine Ecosystem. In Biomarkers in Environmental Contamination; IntechOpen: London, UK, 2023. [Google Scholar] [CrossRef]
  98. Brophy, D.; Hüssy, K.; Sturrock, A.M.; Preez, M.; Gaffney, J.; Waring, C.P. Trace element patterns in otoliths as indicators of reproductive events in marine fishes. J. Fish Biol. 2020, 96, 1121–1132. [Google Scholar] [CrossRef]
  99. Watanabe, T.; Kiron, V.; Satoh, S. Trace minerals in fish nutrition. Aquaculture 1997, 151, 185–207. [Google Scholar] [CrossRef]
  100. Lord, C.; Berland, S.; Haÿ, V.; Medjoubi, K.; Keith, P. Twin Peaks: Interrogating Otolith Pairs to See Whether They Keep Their Stories Straight. Crystals 2024, 14, 705. [Google Scholar] [CrossRef]
  101. Swan, S.C.; Gordon, J.D.M.; Morales-Nin, B.; Shimmield, T.; Sawyer, T.; Geffen, A.J. Otolith microchemistry of Nezumia aequalis (Pisces: Macrouridae) from widely different habitats in the Atlantic and Mediterranean. J. Mar. Biol. Assoc. UK 2003, 83, 71–75. [Google Scholar] [CrossRef]
  102. Ranaldi, M.M.; Gagnon, M.M. Zinc incorporation in the otoliths of juvenile pink snapper (Pagrus auratus Forster): The influence of dietary versus waterborne sources. J. Exp. Mar. Biol. Ecol. 2008, 363, 74–81. [Google Scholar] [CrossRef]
Figure 1. Sampling locations of the specimens analyzed along the continental slope off Santa Catarina, Brazil. Depths of the three stations where specimens were collected are indicated using red lines (747 m, 800 m, and 915 m). Inset shows the study area (red box) within Brazil.
Fishes 11 00288 g001
Figure 2. Right sagittal otoliths of four Macrouridae species. For each species, the whole otolith (sulcus acusticus view) and the transverse section after cutting, grinding, and polishing showing the core region are presented (small and large images, respectively).
Fishes 11 00288 g002
Figure 3. Ontogenetic profiles of element-to-calcium ratios for Coelorinchus marinii. The x-axis represents relative distance from the core (0%) to the edge (100%). Points are individual measurements (grey). The solid blue line is the fitted GAM smoother, and the grey ribbon indicates the 95% confidence interval. The eight panels are arranged in a 2 × 4 grid; from left to right and top to bottom, they correspond to Sr:Ca, Ba:Ca, Li:Ca, Mg:Ca, Mn:Ca, Ni:Ca, Cu:Ca, and Zn:Ca.
Fishes 11 00288 g003
Figure 4. Ontogenetic profiles of element-to-calcium ratios for Hymenocephalus billsam. The x-axis represents relative distance from the core (0%) to the edge (100%). Points are individual measurements (grey). The solid blue line is the fitted GAM smoother, and the grey ribbon indicates the 95% confidence interval. Vertical red dashed lines mark change points detected by the PELT algorithm (only for Sr:Ca, Li:Ca, and Mg:Ca). The eight panels are arranged in a 2 × 4 grid; from left to right and top to bottom, they correspond to Sr:Ca, Ba:Ca, Li:Ca, Mg:Ca, Mn:Ca, Ni:Ca, Cu:Ca, and Zn:Ca.
Fishes 11 00288 g004
Figure 5. Ontogenetic profiles of element-to-calcium ratios for Malacocephalus occidentalis. The x-axis represents relative distance from the core (0%) to the edge (100%). Points are individual measurements (grey). The solid blue line is the fitted GAM smoother, and the grey ribbon indicates the 95% confidence interval. The eight panels are arranged in a 2 × 4 grid; from left to right and top to bottom, they correspond to Sr:Ca, Ba:Ca, Li:Ca, Mg:Ca, Mn:Ca, Ni:Ca, Cu:Ca, and Zn:Ca.
Fishes 11 00288 g005
Figure 6. Ontogenetic profiles of element-to-calcium ratios for Nezumia aequalis. The x-axis represents relative distance from the core (0%) to the edge (100%). Points are individual measurements (grey). The solid blue line is the fitted GAM smoother, and the grey ribbon indicates the 95% confidence interval. Vertical red dashed lines mark change points detected by the PELT algorithm (only for Sr:Ca). The eight panels are arranged in a 2 × 4 grid; from left to right and top to bottom, they correspond to Sr:Ca, Ba:Ca, Li:Ca, Mg:Ca, Mn:Ca, Ni:Ca, Cu:Ca, and Zn:Ca.
Fishes 11 00288 g006
Figure 7. Principal component analysis (PCA) of otolith element-to-calcium ratios for the four Macrouridae species. Points represent individual median values, and ellipses indicate 95% confidence intervals. The first two principal components explain 32.42% and 30.81% of the total variance, respectively.
Fishes 11 00288 g007
Table 1. Morphometric, biometric and sampling data of the four Macrouridae species studied. n: number of specimens; PAL: pre-anal length (mm) ± standard deviation; BM: body mass (g) ± standard deviation; OL: otolith length (mm) ± standard deviation; OM: otolith mass (g) ± standard deviation; Date: sampling date; Deep: sampling depth range (m); Habitat: ecological category of the species.
SpeciesCoelorinchus mariniiHymenocephalus billsamMalacocephalus occidentalisNezumia aequalis
 N 20202020
Date28 March 202228 March 2022
2 April 2022
28 March 202229 March 2022
2 April 2022
Latitude28°25.56′ S28°25.56′ S 
28°31.30′ S
28°25.56′ S28°25.93′ S
28°31.30′ S
Longitude46°50.10′ W46°50.10′ W
46°51.10′ W
46°50.10′ W46°48.13′ W
46°51.10′ W
Deep747747–800747800–915
Habitatbenthopelagicpelagicdemersalbenthopelagic
PAL73.65 ± 5.1943.12 ± 3.4181.95 ± 15.7355.95 ± 7.34
BM61.04 ± 9.834.87 ± 0.55170.78 ± 59.4235.72 ± 17.91
OL4.15 ± 0.224.08 ± 0.2112.17 ± 0.955.93 ± 0.67
OM0.0225 ± 0.00260.0228 ± 0.00420.1809 ± 0.03670.0364 ± 0.0149
Table 2. Median values (μmol/mol) of element-to-calcium ratios for each ontogenetic segment. Intervals indicate relative distance (%) from the core (0%) to the margin (100%). Segment limits were derived by rounding to the nearest integer the change points detected by the PELT algorithm (Li:Ca, Mg:Ca, Sr:Ca). For H. billsam, adjacent segments that did not differ significantly (pairwise PERMANOVA, p.adj > 0.05) were merged into three broader phases: 0–38%, 38–55%, and 55–100%. For C. marinii and N. aequalis, global PERMANOVA was not significant (p > 0.05), so the intervals are presented for completeness but interpretation should focus on the total values. For M. occidentalis, all four segments were retained because the global test was significant (p < 0.001) and the number of segments is small. n: number of observations (points) per segment.
SpeciesInterval (%)nLi:CaMg:CaMn:CaNi:CaCu:CaZn:CaSr:CaBa:Ca
Coelorinchus marinii0–121948.0147.92.30.70.30.934711.7
12–132025.6188.12.80.21.32.632681.8
13–152639.7175.22.40.71.93.232421.6
15–10013028.466.82.70.40.32.521692.2
total19527.5111.32.40.50.81.821022.3
Hymenocephalus billsam0–3832228.5112.50.40.71.53.023272.0
38–5539132.5140.00.61.02.55.022502.5
55–10027930.095.00.30.80.51.527503.0
total99228.177.80.40.41.53.026233.4
Malacocephalus occidentalis0–314727.7229.51.81.34.411.030312.3
31–8110326.9168.42.31.25.73.027405.7
81–8418630.4176.21.50.63.72.727152.5
84–1002725.061.70.60.50.30.318011.4
total36225.1144.11.90.81.42.424563.3
Nezumia aequalis0–192535.5134.52.11.63.620.631561.7
19–352730.683.31.40.90.72.827598.4
35–404632.6115.12.20.80.65.033822.7
40–8813132.562.12.11.20.30.824294.1
88–1001430.643.00.91.10.30.536562.9
total24330.961.91.20.80.31.724502.4
Disclaimer/Publisher’s Note: The statements, opinions and data contained in all publications are solely those of the individual author(s) and contributor(s) and not of MDPI and/or the editor(s). MDPI and/or the editor(s) disclaim responsibility for any injury to people or property resulting from any ideas, methods, instructions or products referred to in the content.