Article

Metabolomic Profiling of Intestinal Contents in Rice Paddy-Cultured Eriocheir sinensis: Linking Gut Microbiota Composition with Metabolic Pathway Dynamics


1
College of Animal Science and Technology, Northeast Agricultural University, Harbin 150030, China
2
Huzhou Key Laboratory of Innovation and Application of Agricultural Germplasm Resources, Huzhou Academy of Agricultural Sciences, Huzhou 313000, China
3
Deqing Zhongguan Xu Wohu Aquaculture Farm, Huzhou 313000, China
*
Authors to whom correspondence should be addressed.
Fishes 2026, 11(4), 228; https://doi.org/10.3390/fishes11040228
Submission received: 5 March 2026 / Revised: 5 April 2026 / Accepted: 10 April 2026 / Published: 14 April 2026
(This article belongs to the Section Aquatic Invertebrates)

Abstract

Rice–crab coculture, as China’s third-largest integrated farming model, is pivotal for sustainable Chinese mitten crab aquaculture. This study conducted untargeted metabolomics and 16S rRNA gene sequencing on gut contents of crabs from rice fields and ponds, integrating metabolic and microbial profiles. We aimed to reveal the chemical traits of rice-field Chinese mitten crab linked to gut microbiota, providing scientific guidance for optimizing culture practices and developing microbial additives. Both groups were dominated by the phyla Firmicutes, Proteobacteria, and Bacteroidota, but the phylum Bdellovibrionota was not detected in group R. A total of 1271 distinct amplicon sequence variants (ASVs) were identified, which were annotated to 649 genera. At the ASV level, the Chao1 index for the R group (197.12 ± 17.88) was notably lower compared to the P group (288.75 ± 30.59) (p < 0.01). In contrast, the Shannon index for the R group (3.90 ± 0.06) was significantly greater than that of the P group (3.70 ± 0.06) (p < 0.01). The PCA plot demonstrated a distinct discrimination between the groups. The P group had more microbial species but was dominated by Candidatus_Bacilloplasma, resulting in uneven distribution. In contrast, the R group had fewer species but a more balanced distribution. Among 3531 metabolites identified in both groups, 865 differed significantly. Compared to P, 736 metabolites were significantly upregulated and 129 were significantly downregulated in R. Key metabolic pathways included amino acid, carbohydrate, cofactor and vitamin metabolism, signaling, and xenobiotics biodegradation. Group R had higher levels of L-leucine, L-phenylalanine, L-tyrosine, 2-amino-1-phenylethanol, choline, and pyrophaeophorbide a, which correlated with genera like Candidatus_Hepatoplasma and Aeromonas (p < 0.05), suggesting better nutritional value, flavor, and metabolic health in rice-field crabs.
Key Contribution: Rice–crab coculture fosters a more balanced gut microbiota in the Chinese mitten crab through diverse natural diets, significantly enhancing its nutritional value, flavor, and metabolic health.

1. Introduction

The Chinese mitten crab (Eriocheir sinensis), a freshwater species indigenous to China, holds substantial economic significance and profound cultural importance. Celebrated for its tender meat and unique flavor, it has long been a preferred choice among consumers both domestically and internationally, maintaining a crucial role in the aquatic product market. The life cycle of the Chinese mitten crab generally extends over a two-year period, predominantly within freshwater environments [1]. During the reproductive phase, mature crabs undertake a migration to estuarine or marine habitats for the purposes of spawning and mating. The fertilized eggs hatch in these saline waters, and the resultant larvae progress to the megalopal stage, characterized by large eyes, before commencing their return migration to freshwater systems. Following a single molting event, the megalopae metamorphose into juvenile crabs, which then undergo a growth period of approximately 5–6 months to develop into button crabs, the juvenile stage prepared for overwintering. After the overwintering period, button crabs continue their maturation process into adult crabs. In China, aquaculture efforts predominantly concentrate on two developmental stages: the cultivation of juvenile crabs into button crabs and the subsequent rearing of button crabs to adult crabs of marketable size [2]. However, the Chinese government’s initiatives to convert aquaculture ponds back to farmland and the implementation of a 10-year fishing ban in the Yangtze River have posed unprecedented challenges to the traditional crab farming model, necessitating transformative approaches. This is particularly urgent in the middle and lower reaches of the Yangtze River, the primary region for Chinese mitten crab cultivation. Against this backdrop, the rice–fish integrated farming model of raising crabs in paddy fields—China’s third-largest integrated rice–aquaculture model—has become a critical choice to drive the sustainable and healthy development of the local crab farming industry.
In recent years, research on gut microbiota has garnered significant attention, with some scholars referring to it as the “second brain” or “third brain” of humans. In various animal models, gut microbiota not only exhibit numerical dominance but also fulfill a wide array of essential functions [3]. For example, they generate short-chain fatty acids (SCFAs) through the fermentation of undigested food components. These SCFAs serve not only as an energy source for the host but also play a critical role in maintaining immune and metabolic homeostasis through multiple mechanisms, including modulation of host epigenetics, activation of G-protein coupled receptors, and inhibition of pathogenic microbial infections [4]. Furthermore, gut microbiota are involved in the synthesis of vitamins, particularly B vitamins and fat-soluble vitamins, which are vital for host energy metabolism and immune function [5,6]. Additionally, gut microbiota contribute to amino acid metabolism, synthesizing and degrading amino acids to provide essential nutrients for the host while influencing health outcomes by regulating immune responses and preserving intestinal barrier integrity [7]. Also, the gut microbiota interacts with the host immune system to inhibit the invasion of pathogenic microbes, modulate host immune responses, and prevent excessive inflammatory reactions [6,8]. In essence, the gut microbiota supplies essential nutrients to the host through various mechanisms and collaborates with the host immune system to suppress pathogenic invasions, thereby playing a crucial role in maintaining normal physiological processes and overall host health [9,10]. The gut microbiota community of Chinese mitten crab demonstrates significant phenotypic plasticity and is influenced by a range of factors, including environmental conditions, feed types, and crab varieties [11,12]. This plasticity enables adaptation to fluctuating environmental conditions [13]. Research indicates that different feed types can substantially alter the gut microbiota community and metabolic characteristics of the Chinese mitten crab. For instance, mixed feeds comprising aquatic plants and freshwater snails have been shown to promote the development of a healthy gut microbiota community, thereby enhancing the growth performance of Chinese mitten crab [14]. Feed additives such as the nutrient L-tryptophan (L-TRP) can significantly enhance the immunity and antioxidant capacity of mitten crabs while exerting positive effects on their intestinal health [15]. Garlic powder has been demonstrated to enhance the intestinal microbiota structure of mitten crabs, thereby improving their immunity and antioxidant capacity [16]. Additionally, farming practices exert a significant influence on the gut microbiota community. Research conducted by Guan [17] revealed that, in contrast to traditional pond farming, the rice–crab coculture model did not substantially alter the gut bacterial community of mitten crabs. However, notable differences were observed between crab varieties and genders [17]. Furthermore, prolonged farming activities modify the nutrient enrichment of sediments, subsequently affecting the composition of microbial communities and potentially influencing farming efficiency [16].
Notably, while environmental factors can induce alterations in intestinal microorganisms, subsequently influencing the growth and health of the Chinese mitten crab, it is primarily the gut microbial metabolites, rather than the microbiota itself, that exert direct effects [18]. Compared to pond aquaculture environments, rice-field environments exhibit variations in water temperature, light availability, and food abundance, which inevitably lead to changes in the gut microbial metabolic characteristics of Chinese mitten crab [19,20,21]. However, existing studies have not adequately addressed the metabolomics of intestinal contents. In response to this gap, we conducted an investigation into the intestinal microbiota and metabolome profiles of intestinal contents in Chinese mitten crab cultured in rice fields, employing integrated analyses of metabolomics and microbial communities. This study seeks to elucidate the characteristics of the intestinal microbiota and contents of Chinese mitten crab reared in rice fields. By comparing these findings with those from pond-cultured crabs, we aim to provide a scientific foundation for optimizing the aquaculture practices of the Chinese mitten crab.

2. Materials and Methods

2.1. Sample Origin and Collection

The aquaculture experiment was conducted at Liangwei Family Farm, located in Nanxun District, Huzhou City, Zhejiang Province, China, and included both pond and paddy field systems. On 4 February 2024, juvenile button crabs (sourced from the Wuxing Hengxin Cooperative, located in Wuxing District, Huzhou, Zhejiang, China), with an average weight of 6.2 g, were introduced at a stocking density of 800 individuals per 667 m2 in each system. The formulated feed utilized in the study was procured from Changshu Quanxing Nutritional Additives Co., Ltd., situated in Suzhou City, Jiangsu Province, China. Sampling was carried out on 19 November 2024, after the fifth molting and sexual maturation. The Chinese mitten crabs reared in rice paddies were designated as the experimental group (group R), whereas those reared in ponds constituted the control group (group P). A total of 18 crabs with comparable body weights were randomly selected from each rearing system, with the average body weight recorded at 135.6 g for rice paddy-reared crabs and 143.1 g for pond-reared crabs. Intestinal contents were sampled from the entire intestinal tract of each crab, with the contents from every three crabs being combined into a single sample. These samples were promptly snap-frozen in liquid nitrogen and stored at −80 °C for subsequent analyses of gut microbiota and metabolomics.

2.2. Microbial Sample Analysis

2.2.1. DNA Extraction and PCR Amplification

The DNA was isolated from the 12 collected samples using MagPure Soil DNA LQ Kit (Magen, Shanghai, China). A NanoDrop 2000 spectrophotometer (Thermo Fisher Scientific, Waltham, MA, USA)and 1% agarose gel electrophoresis were employed to quantify the concentration and verify the purity of the extracted DNA. The qualified DNA samples were preserved at −20 °C for subsequent experiments.
Using the purified total DNA as a template, the V3–V4 regions of the 16S rRNA gene were amplified with barcode-tagged specific primers and Takara Ex Taq high-fidelity DNA polymerase (Takara, Dalian, China). The universal primer pair 343F (5′-TACGGRAGGCAGCAG-3′) and 798R (5′-AGGGTATCTAATCCT-3′) [22] was used for PCR amplification to assess bacterial diversity in the samples.

2.2.2. Library Construction and Sequencing

PCR products were preliminarily validated by 1% agarose gel, then purified using Agencourt AMPure XP magnetic beads (Beckman Coulter, Inc., Brea, CA, USA). The purified amplicons were used as templates for the second-round PCR amplification. After the second purification with magnetic beads, the final products were quantified using Qubit dsDNA Assay Kit (Thermo Fisher Scientific, Waltham, MA, USA), normalized to a uniform concentration, and subjected to sequencing on the Illumina NovaSeq 6000 platform (Illumina Inc., San Diego, CA, USA)to generate 250 bp paired-end reads. The high-throughput sequencing service was provided by OE Biotech Company (Shanghai, China).

2.2.3. Bioinformatics Analysis

After sequencing, the raw sequences were first trimmed to remove primer sequences using the Cutadapt software (version 4.1). Subsequently, the high-quality paired-end raw data from the previous step were subjected to quality control analyses—including quality filtering, denoising, merging, and chimera removal—using DADA2 (version 2020.11) [23] under the default parameters of QIIME 2 (version 2020.11) [24], yielding representative sequences and an ASV abundance table. Representative sequences for each ASV were then extracted using the QIIME 2 (version 2020.11) and annotated by alignment against the Silva (version 138) database. Taxonomic annotation was performed using the default parameters of the q2-feature-classifier plugin (version 2020.11). Alpha and beta diversity analyses were conducted using the QIIME 2 (version 2020.11). Alpha diversity of the samples was assessed using the Chao1 [25] and Shannon [26] indices. Beta diversity was evaluated via principal coordinate analysis (PCoA) based on the unweighted Unifrac distance matrix calculated using the R (version 4.3.1). Differential abundance analysis was performed using the Wilcoxon rank-sum test algorithm in R (version 4.3.1). Additionally, LEfSe (version 1.0) was employed to analyze the differentially abundant features across the taxonomic profiles.

2.3. Metabolomic Sample Analysis

2.3.1. LC-MS Processing

Untargeted metabolomics profiling of the intestinal contents through Waters ACQUITY UPLC I-Class plus/Thermo QE platform was performed by the OE Biotech Company (Shanghai, China). The procedure was as follows: Samples (60 mg) were weighed using an FA2104B electronic analytical balance (Shanghai Yueping Scientific Instrument Co., Ltd., Shanghai, China), with a sensitivity of 0.1 mg. To guarantee volumetric precision and reduce measurement uncertainty, all liquid transfers were conducted using calibrated Eppendorf Research plus micropipettes (Eppendorf [Shanghai] International Trade Co., Ltd., Shanghai, China), with a volume ratio of 4:1, incorporating a mixed internal standard at a concentration of 4 μg/mL. After pre-cooling in a −40 °C freezer for 2 min, the samples were homogenized using a tissue grinder (Wonbio-E, Shanghai Wonbio Biotech Co., Ltd., Shanghai, China) at 45 Hz for 2 min. Subsequently, the samples were subjected to ultrasonic extraction in an ice-water bath for 10 min using an F-060SD ultrasonic cleaner (Shenzhen Fuyang Technology Group Co., Ltd., Shenzhen China), followed by overnight incubation at −40 °C. After centrifugation at 12,000 rpm and 4 °C for 20 min (TGL-16MS, Shanghai Lu Xiangyi Centrifuge Instrument Co., Ltd., Shanghai, China), 150 μL of the supernatant was transferred into LC-MS vials with glass inserts for analysis. Quality control (QC) samples were prepared by pooling equal volumes of extracts from all experimental samples. To monitor the stability of the LC-MS platform and the reliability of the data, one QC sample was injected every 6–8 experimental samples throughout the analytical run. This ensures the technical consistency of the entire analytical batch.

2.3.2. Data Analysis

Raw data were processed using the metabolomics software XCMS v4.5.1 for baseline filtering, peak identification, integration, and retention time correction. Identification analysis was performed using the Human Metabolome Database (HMDB), Lipidmaps (v2.3), METLIN, and the LuMet-Animal3.0 local database (OE Biotech Company, Shanghai, China).
Unsupervised Principal Component Analysis (PCA) was employed to observe the overall distribution of samples and the stability of the entire analytical process. This was followed by supervised Partial Least Squares Discriminant Analysis (PLS-DA) and Orthogonal Partial Least Squares Discriminant Analysis (OPLS-DA) to distinguish the overall differences in metabolic profiles between the two groups and to identify differentially expressed metabolites. All multivariate statistical analyses, including PCA, PLS-DA, and OPLS-DA, were performed using the R package ‘ropls’ (v1.22.0) within the R statistical environment. p-values, Fold Change (FC), and VIP parameters for all metabolites in the two groups were calculated based on the data matrix. The screening criteria for differentially expressed metabolites were defined as p-value < 0.05, FC ≥ 8.0, or FC ≤ 1/8.0. KEGG pathway analysis was performed on all differentially expressed metabolites (Total), upregulated differentially expressed metabolites (Up), and downregulated differentially expressed metabolites (Down). Spearman correlation analysis was utilized.

2.4. Microbiome–Metabolite Correlation Analysis

Correlations between the relative abundance of microbiota at the genus level and the response intensity data of corresponding metabolites were assessed based on paired sample relationships. Prior to conducting statistical analyses, both metabolic and microbial genus-level data underwent log transformation to approximate a normal distribution. To evaluate the associations between gut microbial taxa and metabolites, Spearman’s rank correlation analysis was employed. Correlations with a p-value of less than 0.05 were deemed statistically significant. Bioinformatic analyses were conducted utilizing the OECloud tools available at https://cloud.oebiotech.com (accessed on 12 March 2025).

3. Results

3.1. Characteristics of Intestinal Microorganisms

3.1.1. Sequencing Results and Diversity Estimation

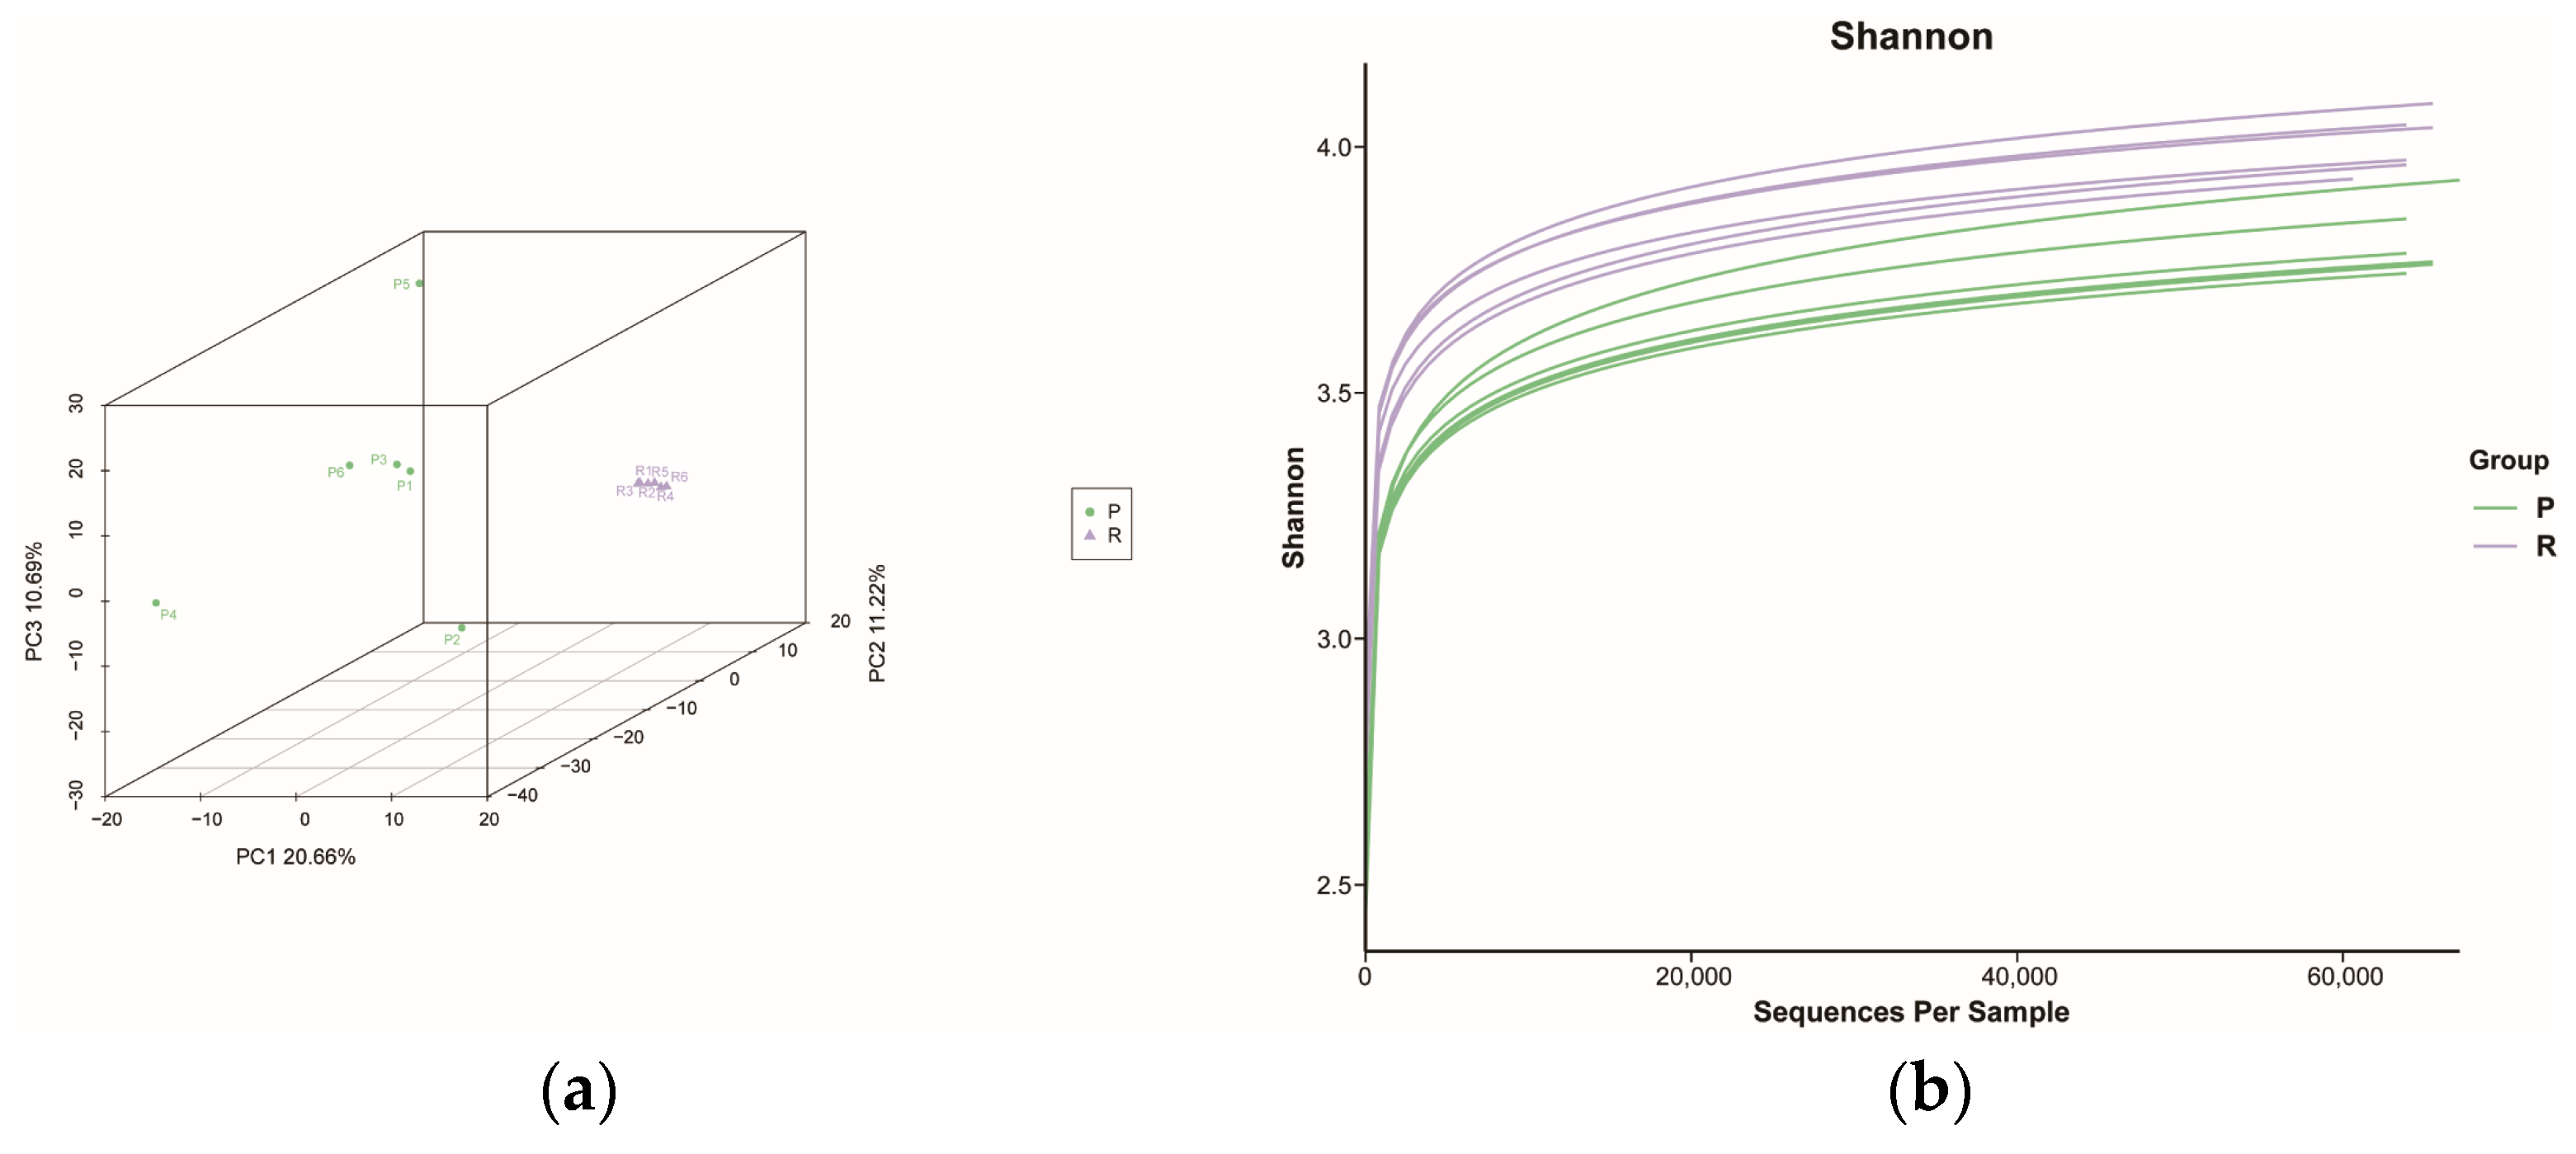
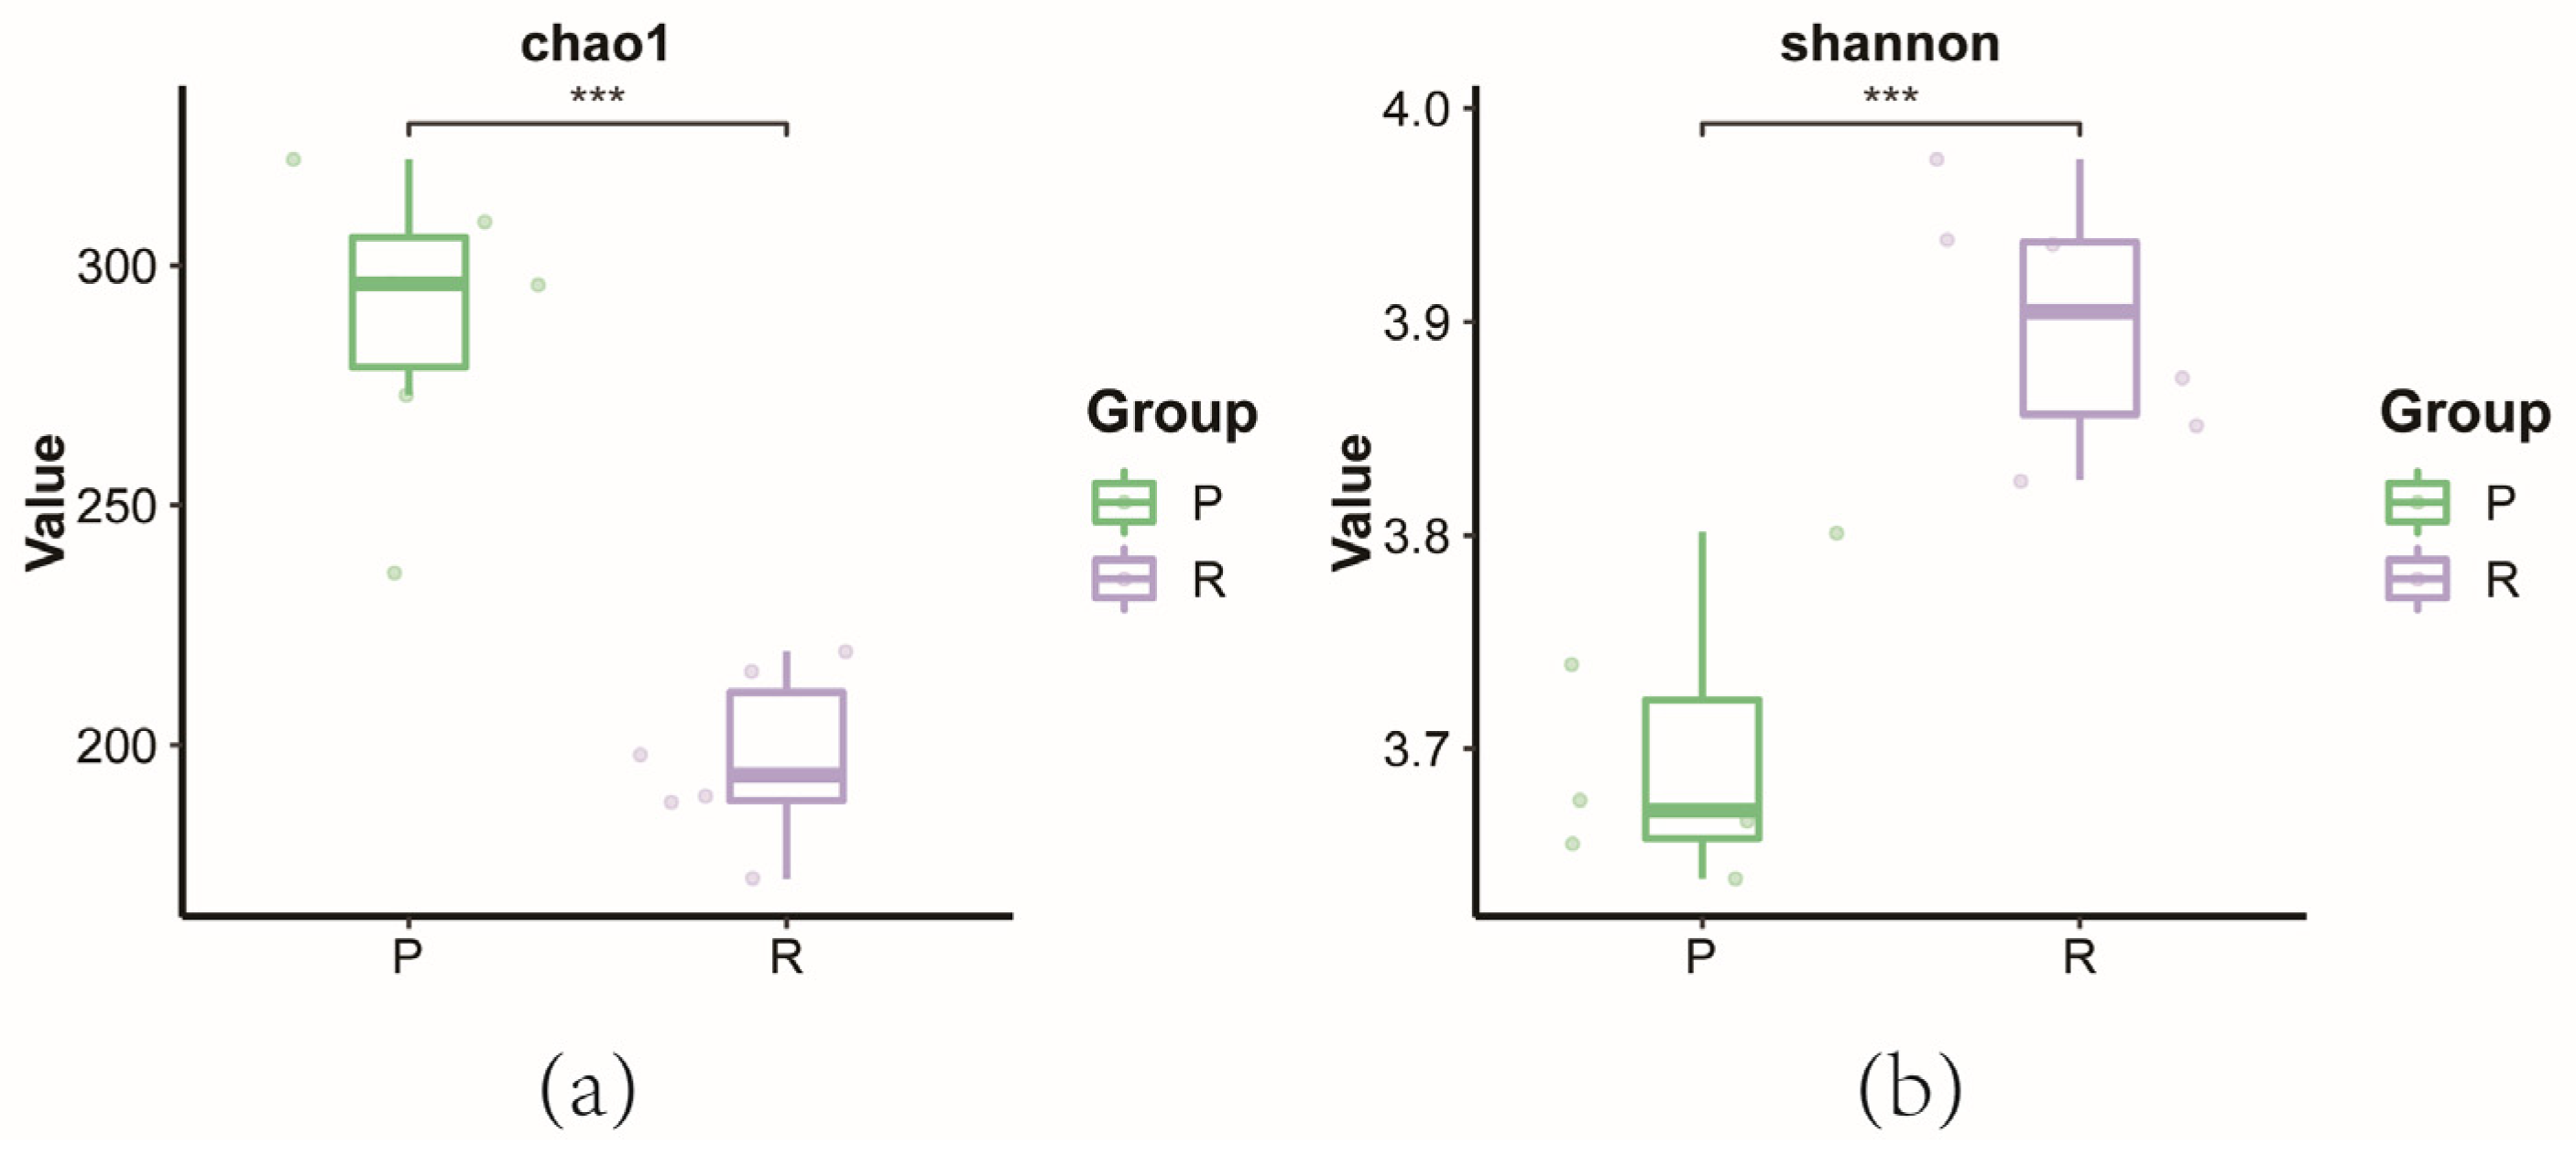
Six samples from each group (group P and group R) were sequenced, totaling 12 samples, generating 783,416 sequences. A total of 1271 distinct amplicon sequence variants (ASVs) were identified, which were annotated to 649 genera. A total of 52 core ASVs were shared among the 12 samples. Principal Component Analysis (PCA) revealed a clear separation in ASV sequences between the Chinese mitten crabs cultured in rice paddies and those cultured in ponds (Figure 1a). At the ASV level, the Shannon rarefaction curves showed a saturation trend in each group, indicating that the sequencing depth was sufficient to cover all microbial taxa (Figure 1b). Furthermore, the results indirectly reflect that the species richness in group P was greater than that in group R. Significant variations in α-diversity at the ASV level were detected between the groups (p < 0.01) (Figure 2). Specifically, the Chao index, which serves as a measure of species richness [27], was notably higher in group P compared to group R (Figure 2a). This finding suggests that the distinctive pond ecosystem promotes a greater overall number of gut species [28]. In contrast, the Shannon index was significantly elevated in group R (Figure 2b), indicating that the gut microbiota in group P demonstrated decreased evenness relative to group R. Beta diversity analysis via principal coordinate analysis (PCoA) demonstrated significant differences between the two groups, with small distances among samples within each group.

3.1.2. Composition of Intestinal Microorganisms and Multivariate Statistical Analysis of Microorganisms

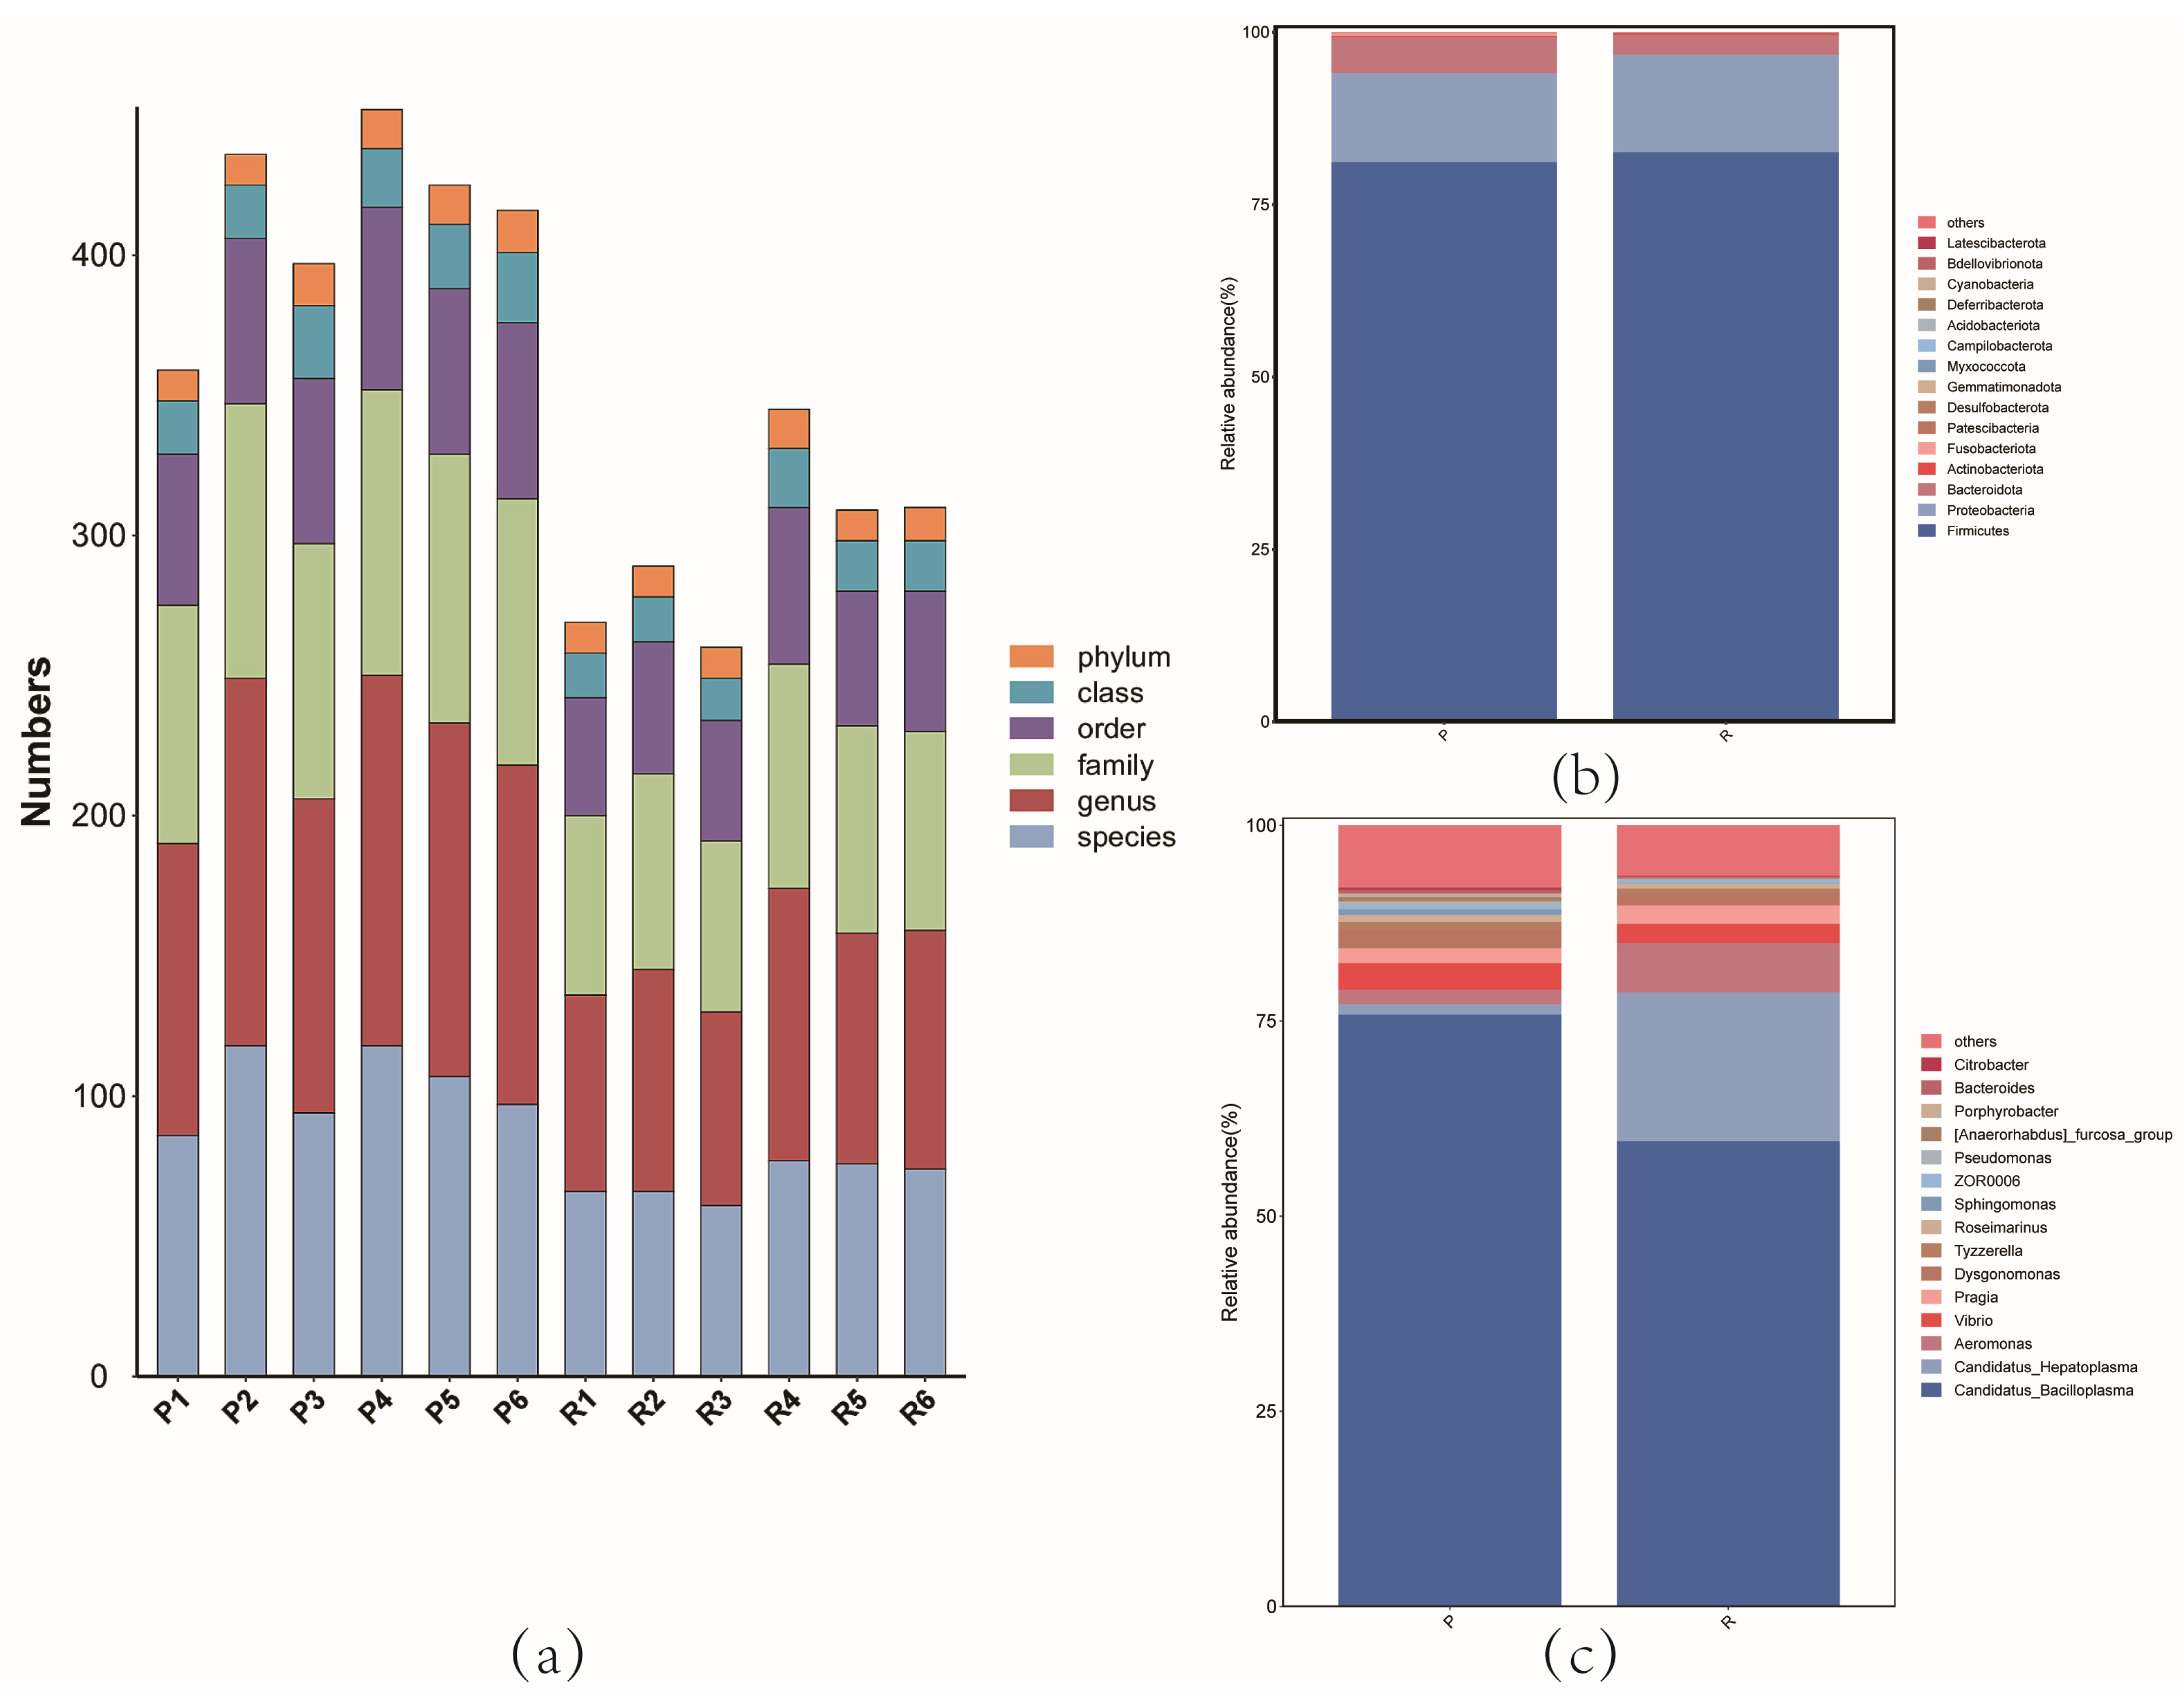
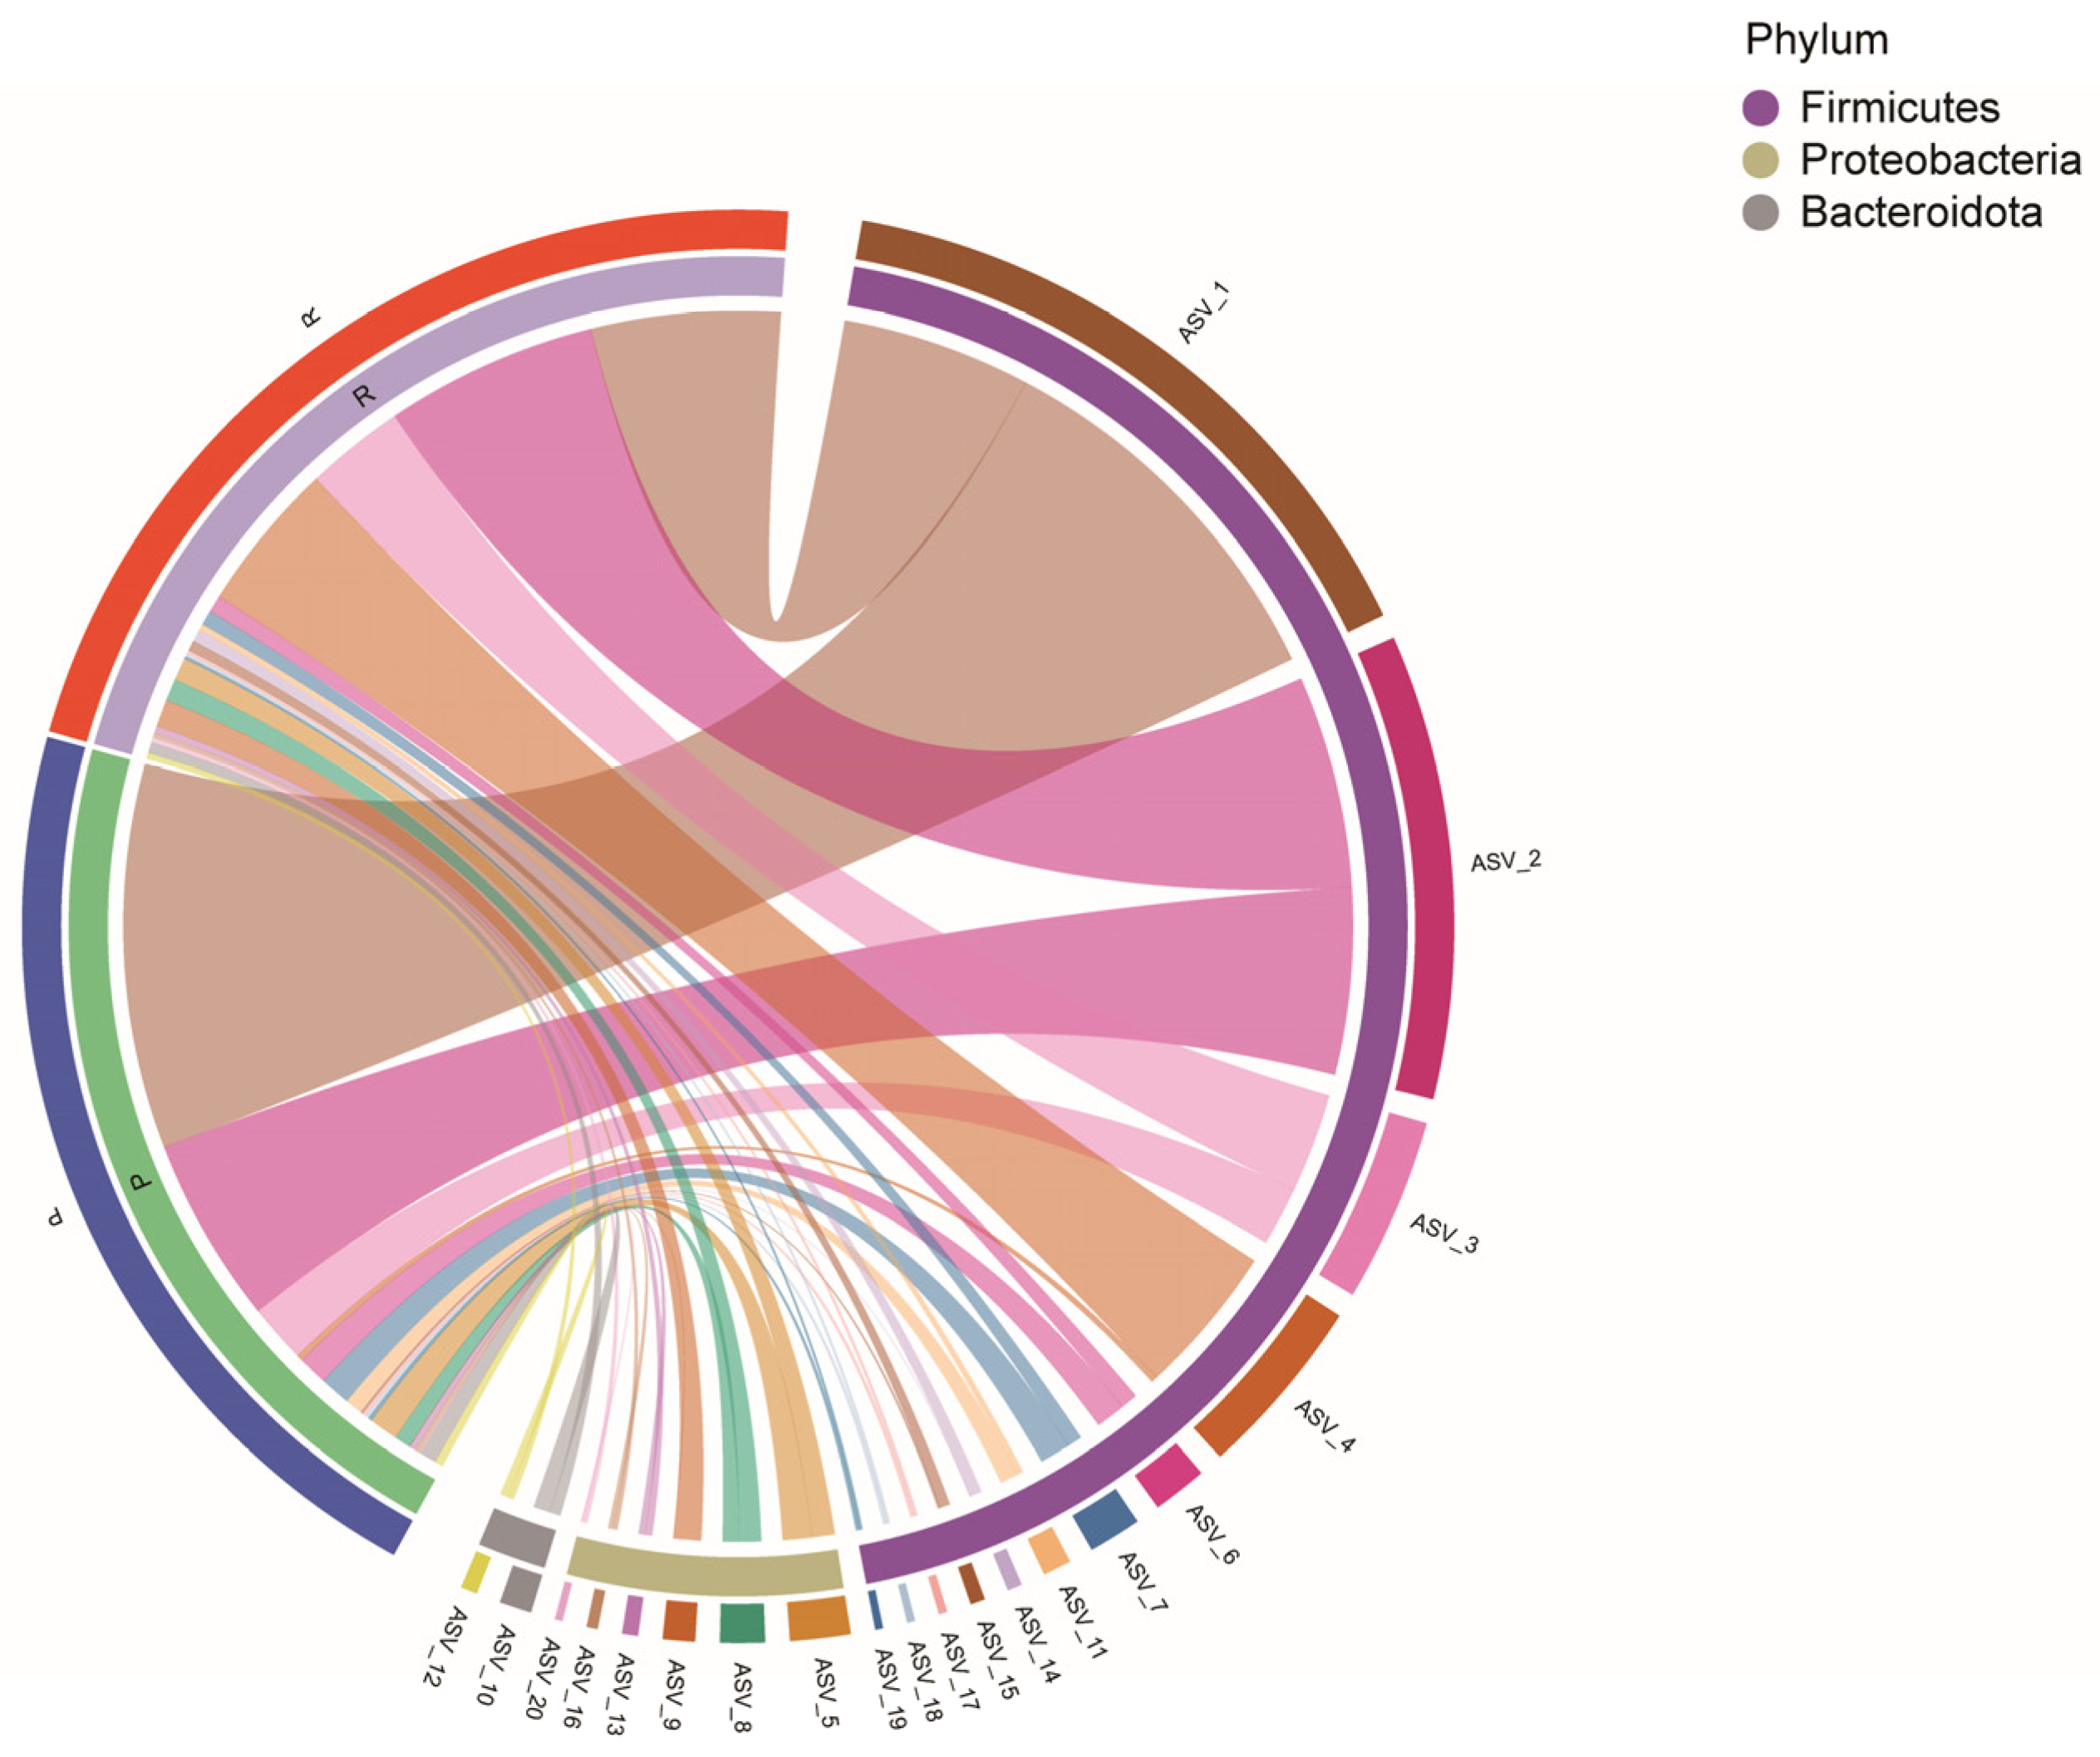
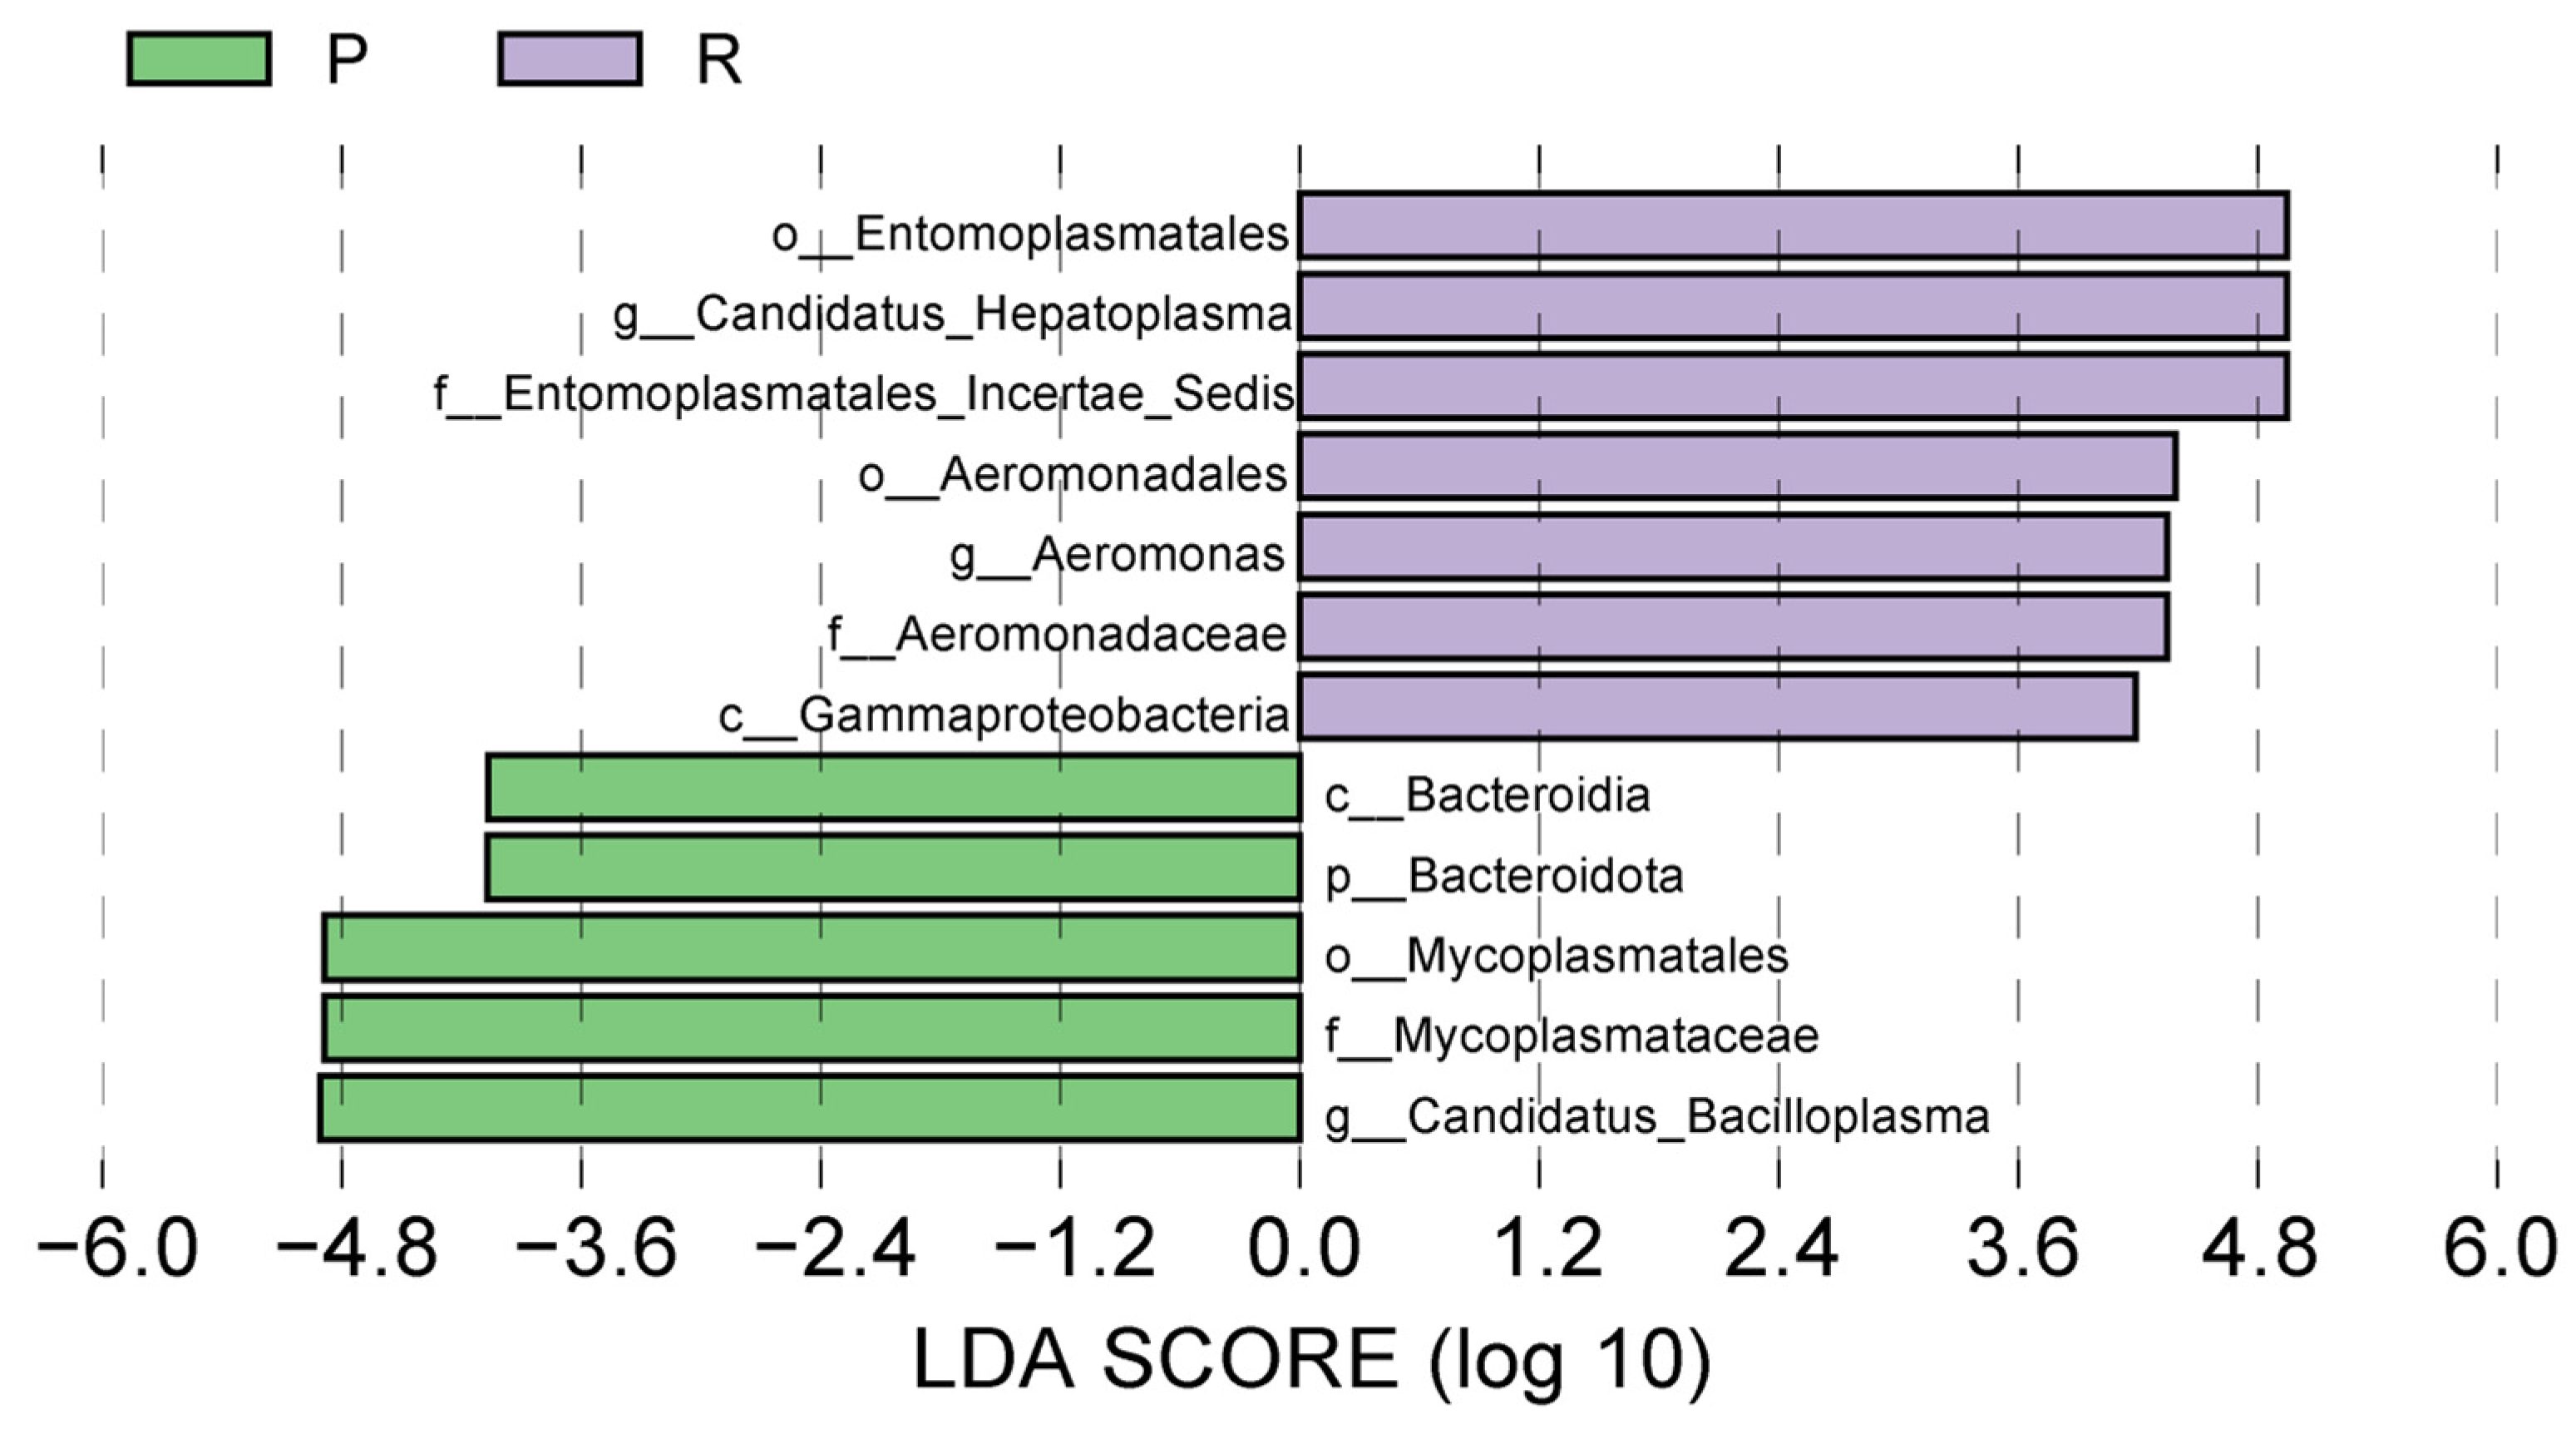
In summary, the composition of intestinal microbiota in crabs exhibited significant differences between the two rearing environments. Both groups were predominantly composed of the phyla Firmicutes, Proteobacteria, and Bacteroidota, aligning with findings from previous research [13,29]. The principal genera in group R included Candidatus Bacilloplasma (59.6%), Candidatus Hepatoplasma (19.1%), and Aeromonas (6.3%), whereas group P was dominated by Candidatus Bacilloplasma (75.6%), Vibrio (3.3%), and Dysgonomonas (2.4%). The specific proportions and community structures varied substantially (Figure 3). Notably, the phylum Bdellovibrionota was present in group P but absent in group R, highlighting the impact of the rearing environment on microbiota composition. Distinct diversity patterns were evident between the groups. The pond culture system (group P) demonstrated higher species richness but lower evenness, primarily due to the predominance of Candidatus Bacilloplasma, which accounted for up to 75.6% of the community. Conversely, the rice–crab coculture system (group R) exhibited a more evenly distributed community, characterized by a higher relative abundance of Candidatus Hepatoplasma. At the ASV level, as illustrated in Figure 4, ASV_4, which ranks fourth in abundance, was found to be 24.3 times more prevalent in group R compared to group P. This ASV is classified under the genus Candidatus Hepatoplasma. These systematic differences were corroborated through the application of Wilcoxon analysis and Linear Discriminant Analysis Effect Size (LEfSe) measurements (Figure 5), which identified 12 specific taxa exhibiting significant differences in abundance. Notably, taxa such as Entomoplasmatales, Candidatus Hepatoplasma, and Aeromonas were significantly more prevalent in group R, whereas Bacteroidia, Mycoplasmatales, and Candidatus Bacilloplasma were more enriched in group P.

3.2. Metabolomic Signatures of Intestinal Contents

3.2.1. Multivariate Statistical Analysis

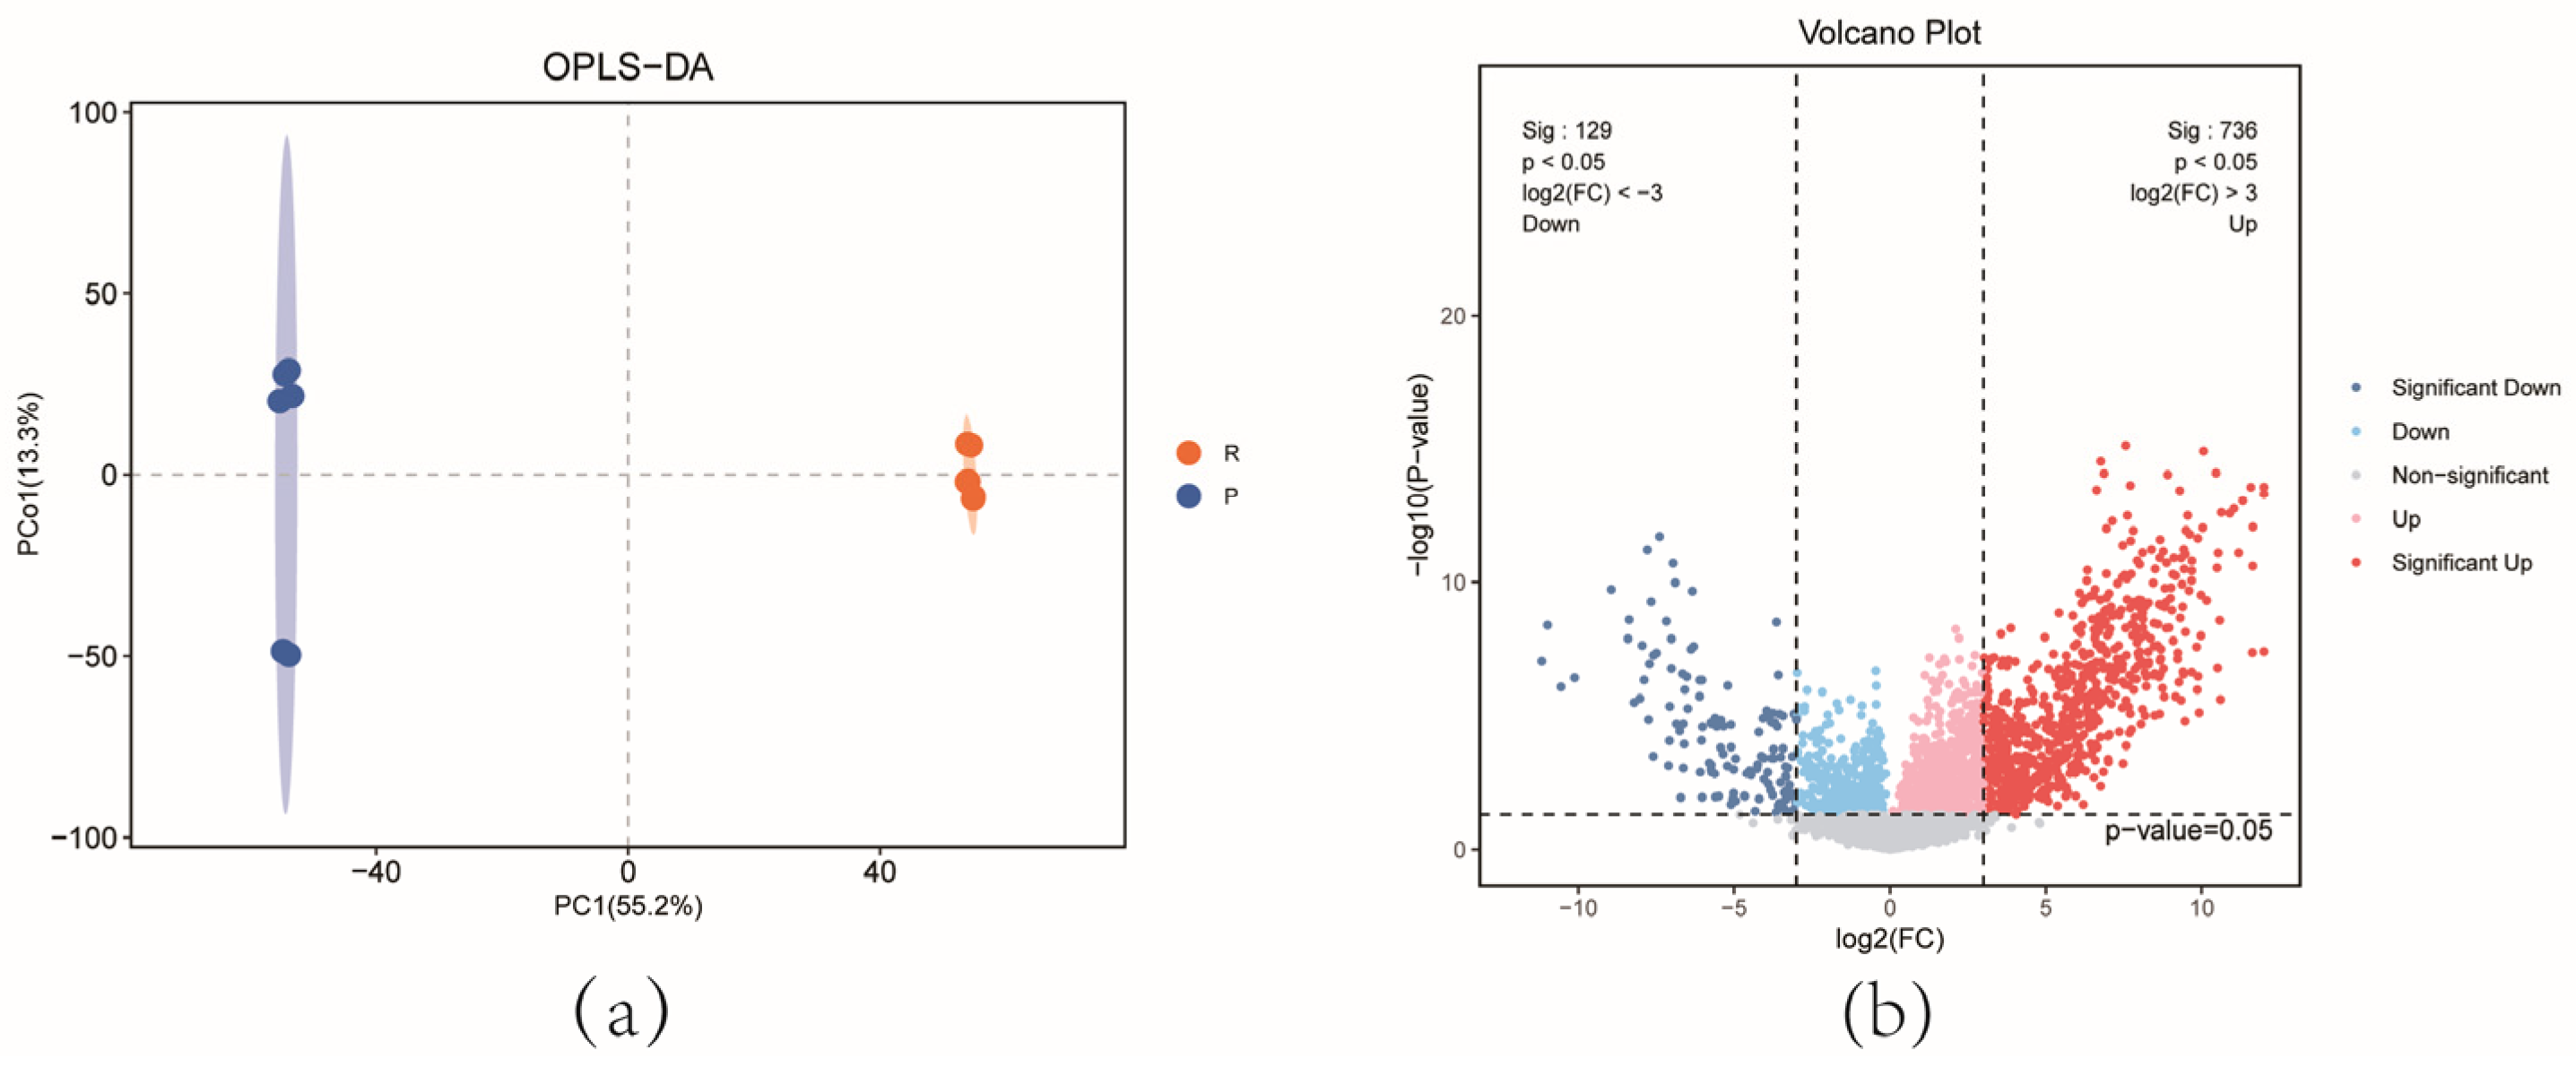
PCA showed a clear separation in the metabolites of intestinal contents between groups P and R. The score scatter plot of the orthogonal Partial Least Squares Discriminant Analysis (OPLS-DA) model, with cumulative R2X = 0.759, cumulative R2Y = 1, and cumulative Q2 = 0.998, also demonstrated a distinct separation between the two groups (Figure 6a).

3.2.2. Analysis of Differential Metabolites

A total of 3531 metabolites were annotated in the experimental and control groups, of which 865 were significantly different. Compared with group P, 736 metabolites were significantly upregulated and 129 were significantly downregulated in group R. The screened differential metabolites were visualized as a volcano plot in all ion modes (Figure 6b). The top 10 upregulated metabolites were 16beta-hydroxy-melianthugenin, 6-O-Desmethyldonepezil, antiarone C, 1,4-Bis(4-methoxyphenyl)-3-(3-phenylpropyl)-2-azetidinone, dehydropipernonaline, acetamide, N-[4-[[(aminothioxomethyl)hydrazono]methyl]phenyl]-, armillarivin, garbanzol, and (4-Methoxynaphthalen-1-yl)(1-pentyl-1H-indol-3-yl)methanone. The top 10 downregulated metabolites were 2,3-Epoxymenaquinone, 1-(O-alpha-D-glucopyranosyl)-3-keto-(1,27R)-octacosanediol, pratensein 7-O-(6″-malonylglucoside), PE-Cer(d14:1/16:0), DG(16:1n7/0:0/20:5n3), 5,7,2′,5′-Tetrahydroxy-6-methoxyflavanone, 2-(3-(Diallylamino)propionyl)benzothiophene, luteolin, orobol, and tetraphenylporphyrin.
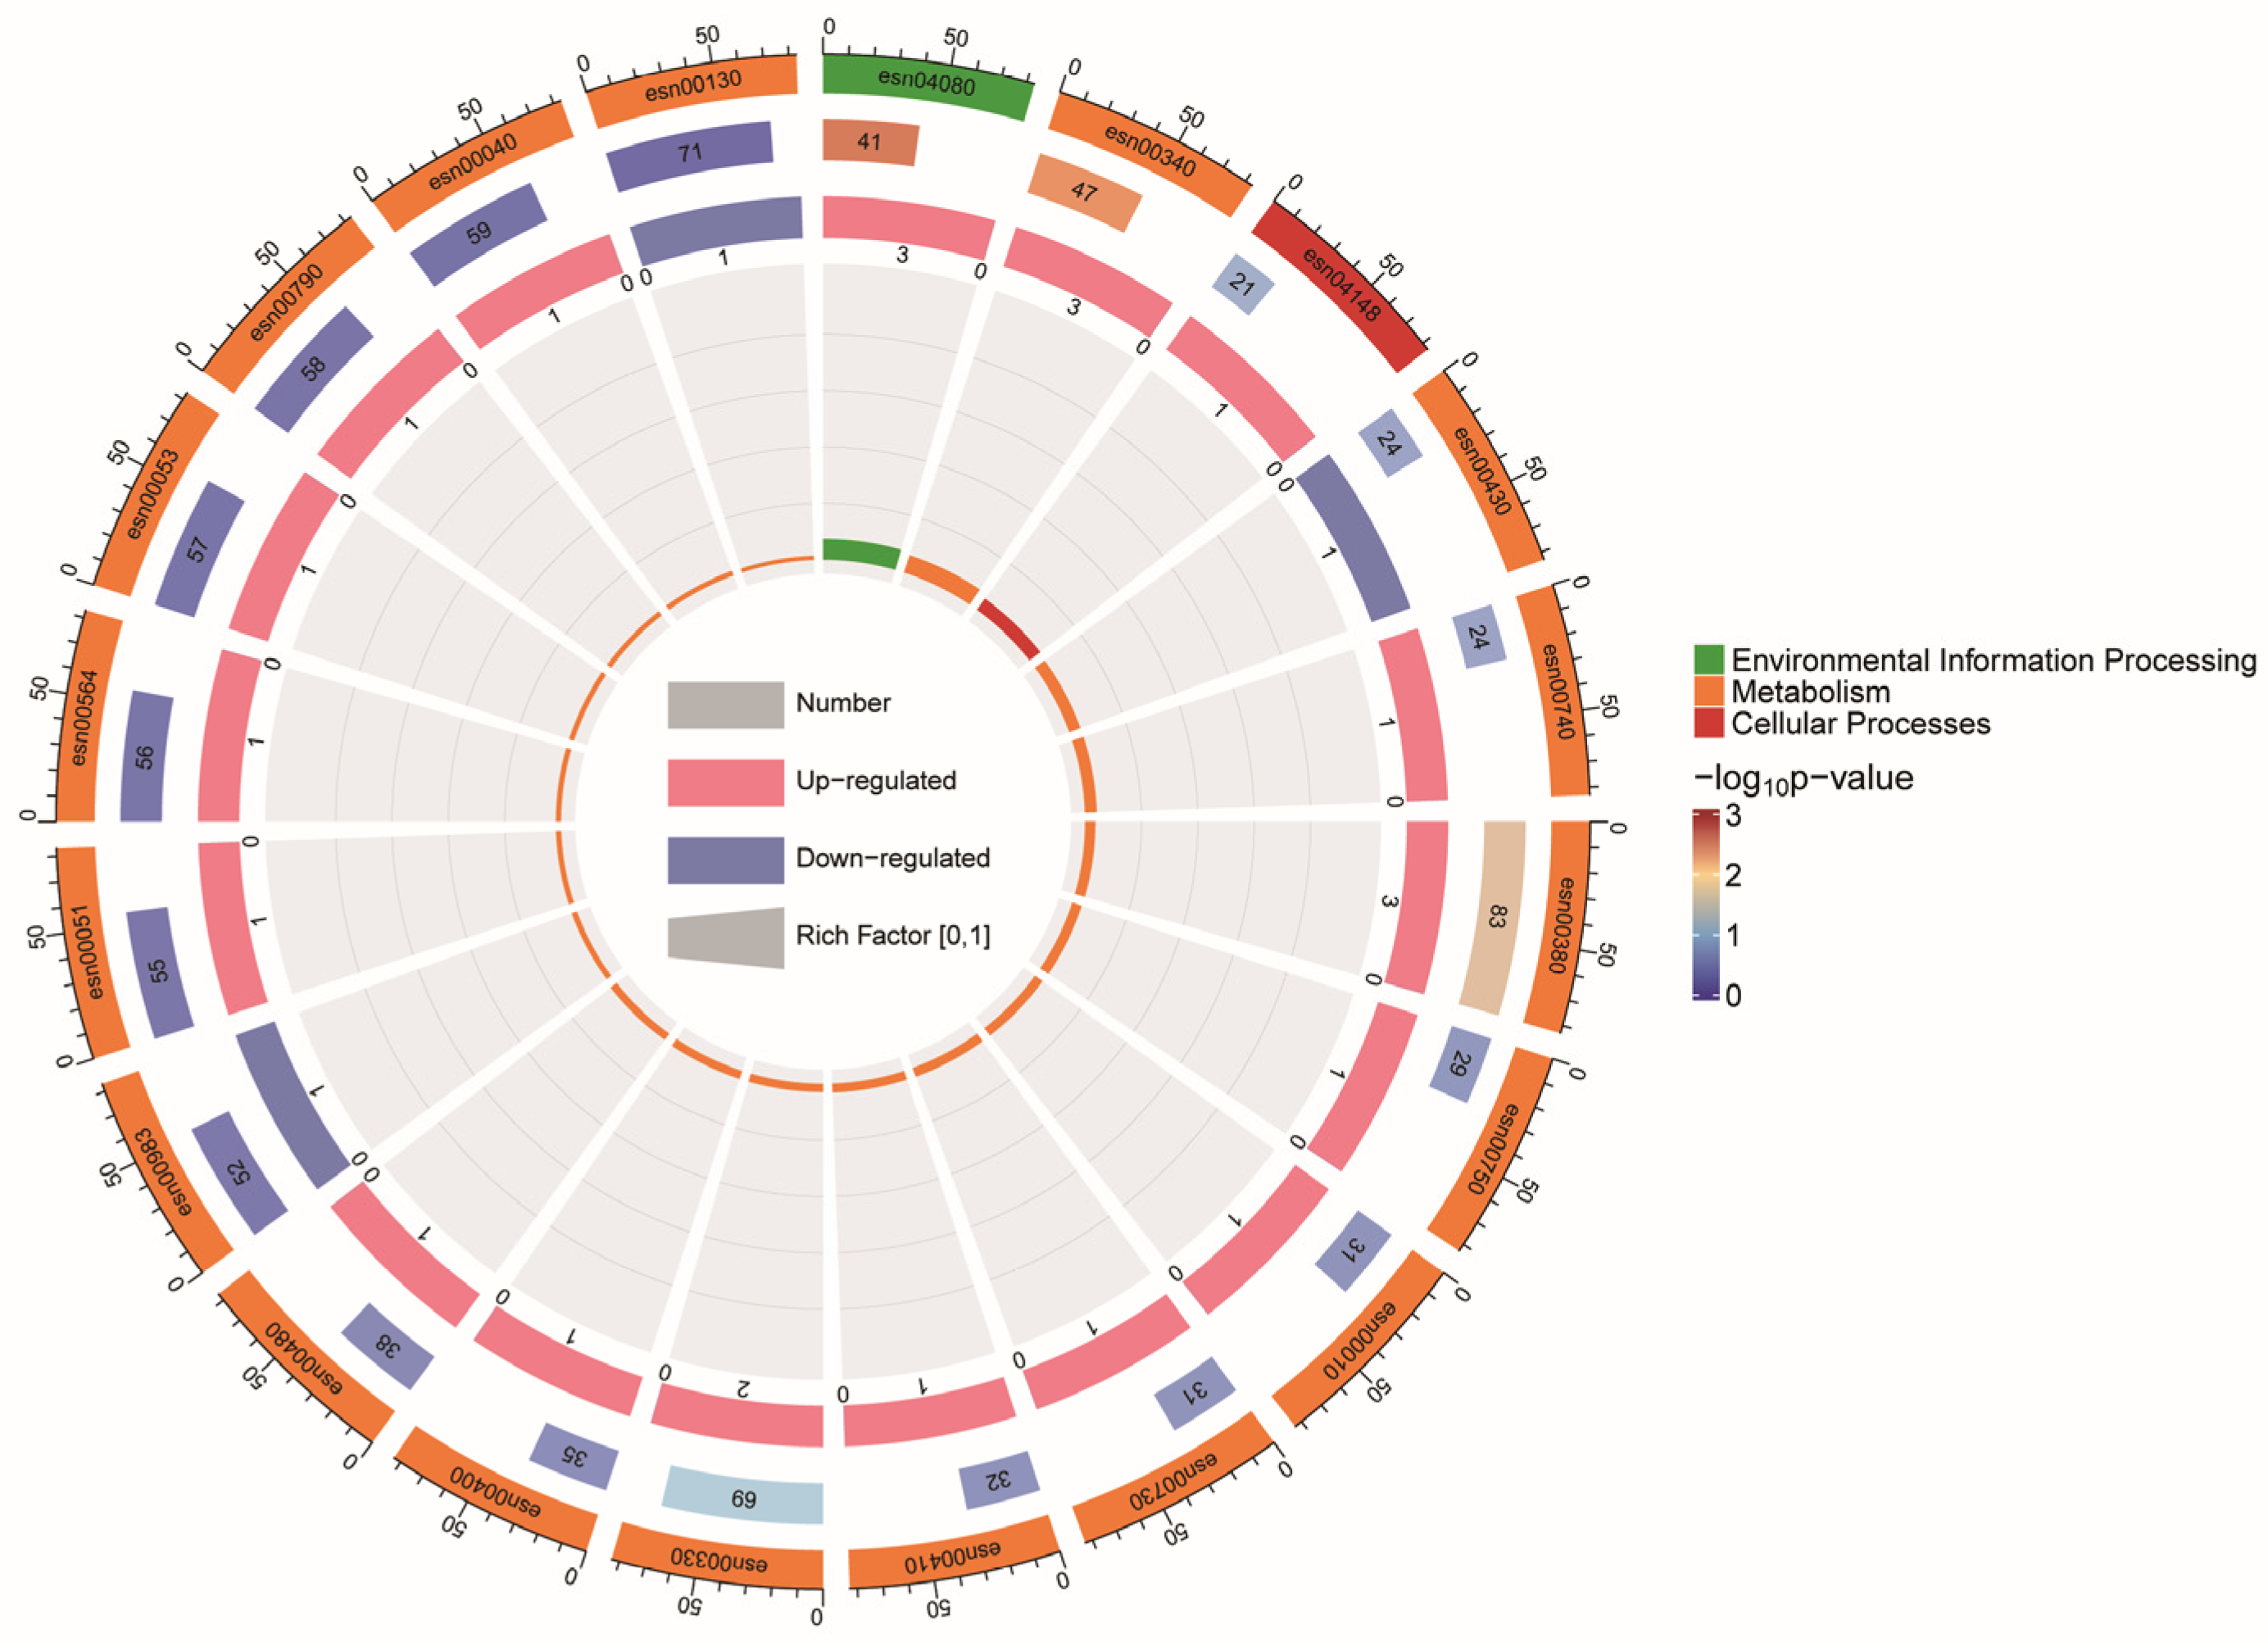
A total of 529 differential metabolites were annotated in the Kyoto Encyclopedia of Genes and Genomes (KEGG) database. Metabolic pathway analysis was performed on all differential metabolites, upregulated metabolites, and downregulated metabolites based on the KEGG database. The top four pathways for upregulated metabolites were amino acid metabolism, carbohydrate metabolism, metabolism of cofactors and vitamins, and signaling molecules and interactions. The downregulated metabolites were distributed across three KEGG level 2 pathways: metabolism of cofactors and vitamins, metabolism of other amino acids, and xenobiotics biodegradation and metabolism. KEGG enrichment analysis (Figure 7) showed that three pathways had p-values < 0.05: neuroactive ligand–receptor interaction (esn04080), histidine metabolism (esn00340), and tryptophan metabolism (esn00380).

3.3. Combined Metabolomic and Microbiome Analyses

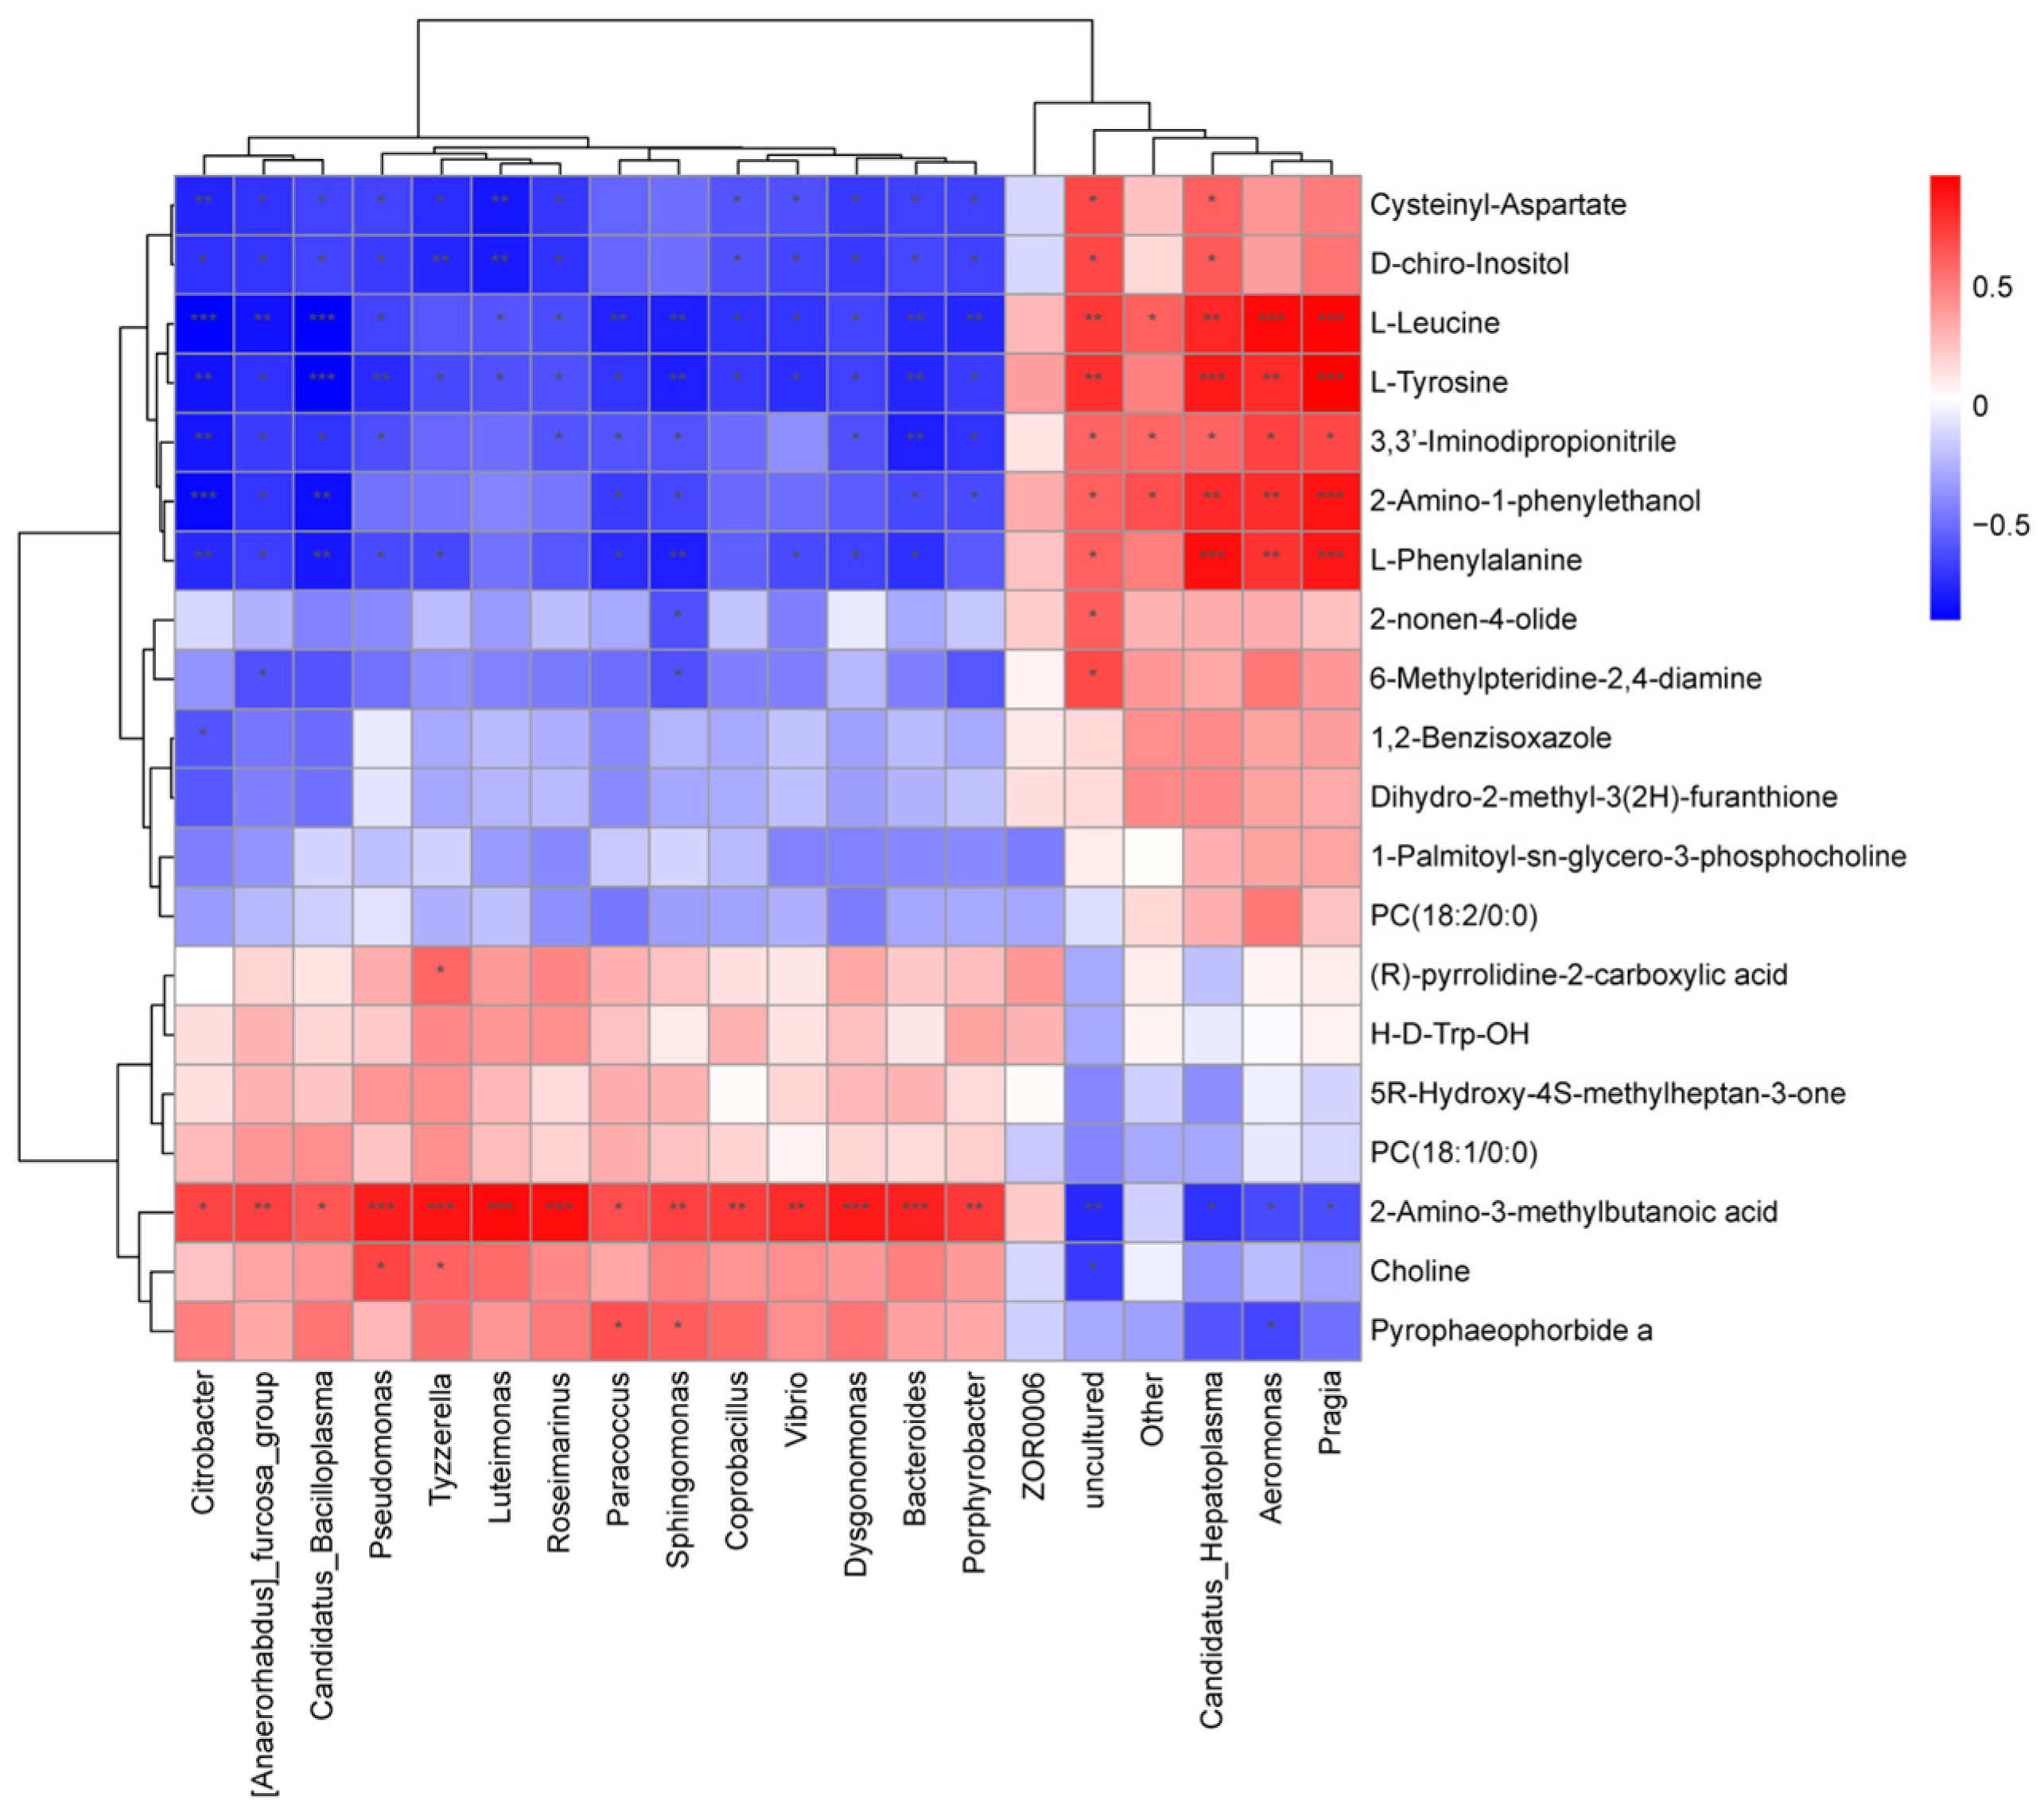
Integrated metabolomic and microbiomic analyses were conducted to gain comprehensive insights into changes in metabolites (Figure 8). The genera Candidatus Hepatoplasma, Aeromonas, and Pragia showed significant positive correlations with L-Leucine, L-Tyrosine, 3,3′-Iminodipropionitrile, 2-Amino-1-phenylethanol, and L-Phenylalanine, but were significantly negatively correlated with 2-Amino-3-methylbutanoic acid (p < 0.05). Conversely, the metabolites 2-Amino-3-methylbutanoic acid, Choline, and Pyrophaeophorbide a were positively associated with a distinct cluster of bacteria, including Citrobacter, [Anaerorhabdus] furcosa group, Candidatus Bacilloplasma, Pseudomonas, Tyzzerella, Luteimonas, Roseimarinus, Paracoccus, Sphingomonas, Coprobacillus, Vibrio, Dysgonomonas, Bacteroides, and Porphyrobacter.

4. Discussion

We found that Bdellovibrionota was present in group P but absent in group R. Bdellovibrionota, a group of predatory bacteria with crucial ecological and biological roles, is known for its ability to effectively reduce pathogen loads in aquaculture [30,31]. Its presence in group P suggests two potential scenarios: firstly, it may be actively suppressing intestinal pathogens, indicating that pond-cultured crabs could be experiencing pathogenic pressure; secondly, by preying on dominant bacterial populations, it may indirectly enhance community diversity by creating ecological niches for other microbes. This phenomenon accounts for the higher species richness and abundance observed at the ASV level in group P. As depicted in Figure 4, ASV_4, which is the fourth most abundant ASV, was found to be 24.3 times more prevalent in group R compared to group P. This ASV is classified under the genus Candidatus Hepatoplasma, a genus widely distributed among crustaceans [32,33,34], and is hypothesized to assist crabs in digesting terrestrial plant materials, such as weeds [35,36,37]. In the context of the uneven artificial feeding conditions characteristic of rice fields, this functional adaptation allows crabs to effectively exploit natural food sources like weeds [38], thereby ensuring sufficient nutrient intake for their growth and development. The rice–crab system induces specific microbial adaptations driven by the complexity of food sources. Additionally, the configuration of microbial communities influenced by different farming models also impacts crab health. Ecological systems such as rice–crab coculture have been demonstrated to enhance the proportion of beneficial Firmicutes, inhibit harmful microorganisms, and optimize immune function [25].
Environmental factors can induce changes in the structure of gut microbial communities, which in turn may indirectly influence the growth and health status of the host organism [39,40]. Within the intestinal environment, the diverse metabolic activities of gut microbiota and their metabolic products play a pivotal regulatory role. Microbial metabolites, such as short-chain fatty acids and bile acids, have a direct impact on host metabolic processes and health outcomes [40,41]. In an analysis of differential metabolites present in the gut contents of Eriocheir sinensis under two different culture models, lipids and lipid-like molecules constituted 37.6% (1328 metabolites), organic acids and derivatives accounted for 21.2% (746 metabolites), and organoheterocyclic compounds comprised 13.3% (469 metabolites). Among the metabolites that exhibited significant differences (p < 0.05), organic acids and derivatives represented 30.1%, and lipids and lipid-like molecules accounted for 29.9%, collectively making up 60% of the total. Furthermore, the group of crabs cultured in rice fields demonstrated significantly higher expression levels of organic acids and their derivatives, as well as lipids and lipid-like molecules, in comparison to the group cultured in ponds. This observation suggests substantial differences in the nutritional composition and accumulation of flavor compounds between crabs from rice-field and pond environments. The rice–crab coculture system offers crabs a more diverse array of natural feeds, including zooplankton, benthic organisms, and rice-associated symbionts. This varied diet directly affects the crabs’ metabolic pathways, facilitating the accumulation of specific organic acids and lipids, which may positively impact growth, development, and the flavor profile. Organic acids are crucial precursors for umami and flavor enhancement. Research indicates that organic acids and their derivatives play a significant role in determining food taste, with their content and composition having a profound influence on flavor profiles [40,42]. In crustaceans, these compounds—produced through microbial fermentation of dietary fiber—are essential for regulating inflammatory responses, maintaining gut barrier integrity, and reducing oxidative stress [43,44]. A high concentration of lipid and lipid-like metabolites is generally correlated with enhanced nutritional value, exemplified by the accumulation of unsaturated fatty acids. These compounds not only affect flavor by generating specific aromas but also serve as important nutritional markers. Studies have shown that crab species such as Eriocheir japonica and Paralithodes camtschaticus are abundant in n-3 polyunsaturated fatty acids (PUFAs), which contribute to both nutritional quality and flavor enhancement [45]. The Chinese mitten crabs cultivated in lakes, ponds, and rice fields display notable variations in the flavor characteristics of their hepatopancreas and gonads, with rice-field crabs exhibiting a distinctive fresh, clean aroma [46]. In conclusion, rice-field crabs exhibit a pronounced advantage in the expression of organic acids and derivatives, as well as lipid-related metabolites. This metabolic profile indicates that the rice-culture model, by providing a more diverse array of natural feeds and a more authentic ecological environment, influences the metabolic processes of the Chinese mitten crab, resulting in unique patterns of flavor precursor and lipid nutrient accumulation. This may be beneficial for enhancing both nutritional quality and unique flavor characteristics.
Utilizing one-to-one paired sample relationships, we computed the correlations between the relative abundance of microbial genera and the response intensity of corresponding metabolites, as depicted in Figure 7. The findings indicate that the expression levels of L-Leucine, L-Phenylalanine, L-Tyrosine, 2-Amino-1-phenylethanol, Choline, and Pyrophaeophorbide a were significantly elevated in the rice-field group compared to the pond group. Notably, Pyrophaeophorbide a, a degradation product of chlorophyll [47], directly suggests that crabs consumed chlorophyll-rich plants, such as aquatic weeds in rice fields. L-Leucine, an essential amino acid for Eriocheir sinensis, plays a vital role in protein synthesis and the regulation of energy metabolism. The increased abundance of this amino acid in the rice-field group is attributed to the rice-culture model, which provides ample plant-based feeds and modifies gut microbiota structure, thereby fostering optimal conditions for nutrient absorption and protein synthesis [16,48]. L-Phenylalanine and L-Tyrosine serve dual roles as umami amino acids and as precursors in the biosynthesis of melanin, which is a determinant of carapace coloration [49]. Concurrently, 2-Amino-1-phenylethanol, a metabolic derivative of phenylalanine, is commonly linked to microbial decarboxylase activity [50,51]. The simultaneous presence of L-Phenylalanine and 2-Amino-1-phenylethanol has been documented, with aromatic alcohols such as 2-Amino-1-phenylethanol frequently arising from the gut microbial metabolism of phenylalanine [52]. The detection of these microbial metabolites implies an active role of gut microbiota in the secondary metabolism of amino acids [53,54,55,56]. The variation in their abundance across different groups suggests that the rice-field environment fosters the accumulation and utilization of high-quality proteins and that the microbial community within this habitat may be more actively engaged in the metabolism of aromatic amino acids. This metabolic activity not only impacts the umami flavor profile of crabs but may also influence carapace pigmentation, as crabs from rice fields tend to exhibit darker coloration compared to those from pond environments. Further examination of the relationships between metabolites and microbial taxa, as illustrated in Figure 8, indicated that the aforementioned metabolites exhibited significant positive correlations with the genera Candidatus_Hepatoplasma, Aeromonas, and Pragia. The relative abundances of these three genera were substantially higher in the rice-field group compared to the pond group. This finding underscores the impact of the rice-field farming environment on the gut microbiota composition of crabs, facilitating specific microbial fermentation and amino acid metabolism, which is likely a crucial factor contributing to the distinctive flavor of rice-field crabs, such as the production of specific volatile compounds. Moreover, choline, which functions as an essential methyl donor, plays a role in lipid metabolism. The elevated levels of choline observed in rice-field crabs imply more efficient lipid metabolism and a decreased accumulation of triglycerides [57,58,59].

5. Conclusions

The rice–crab model creates a more balanced and functionally adapted gut microbiota by offering a natural environment and diverse feeds, unlike pond culture, which, despite high species diversity, is dominated by a few bacteria, leading to lower evenness and potential health risks. Rice-field farming improves nutritional and flavor quality through higher levels of organic acids, lipids, essential amino acids, and choline. The unique flavor of rice-field crabs is largely due to microbial-mediated amino acid metabolism. Future research should explore the roles of key microbes (e.g., Candidatus_Hepatoplasma, Aeromonas, and Pragia) to develop strategies like probiotics or functional feeds that replicate rice-field benefits. These insights can optimize Chinese mitten crab farming and enhance nutritional value.

Author Contributions

Conceptualization, Y.Y. (Yuhong Yang) and D.H.; methodology and resources, J.Z., Y.W., Y.Y. (Yunxiao Yang) and H.L.; formal analysis, investigation, data curation, writing—original draft preparation and editing, J.Z. All authors have read and agreed to the published version of the manuscript.

Funding

This research was funded by Huzhou Municipal Bureau of Science and Technology. The APC was funded by Huzhou Municipal Bureau of Science and Technology.

Institutional Review Board Statement

The animal study protocol was approved by the Ethics Committee of Laboratory Animals, Northeast Agricultural University (Protocol code: NEAUEC20230262; Approval date: 12 March 2026).

Data Availability Statement

The raw metabolomics data have been deposited in the NGDC OMIX database (Accession Number: OMIX016204) and are available at: https://ngdc.cncb.ac.cn/omix/release/OMIX016204 (accessed on 9 April 2026). The 16S rRNA gene sequencing data have been archived in the NCBI database (Accession Number: PRJNA1429029) and can be accessed at: https://www.ncbi.nlm.nih.gov/ (accessed on 27 February 2026).

Acknowledgments

We extend our special thanks to Liangwei Family Farm in Shuanglin, Nanxun for their assistance in sample collection and provision.

Conflicts of Interest

Author Hong Lin was employed by the company Deqing Zhongguan Xu Wohu Aquaculture Farm. The remaining authors declare that the research was conducted in the absence of any commercial or financial relationships that could be construed as a potential conflict of interest.

References

  1. Keirsebelik, H.; Verhelst, P.; D’hondt, B.; Schoelynck, J. From non-tidal to tidal environments: Movement behaviour of Chinese mitten crab on downstream spawning migration. Mov. Ecol. 2025, 13, 25. [Google Scholar] [CrossRef] [Scilit]
  2. Wang, Q.; Liu, J.; Zhang, S.; Lian, Y.; Ding, H.; Du, X.; Li, Z.; Sena, S.S. Sustainable farming practices of the Chinese mitten crab (Eriocheir sinensis) around Hongze Lake, lower Yangtze River Basin, China. Ambio 2016, 45, 361–373. [Google Scholar] [CrossRef] [Scilit]
  3. Gao, Q.; Liu, P.; Li, Y.; Song, D.; Long, W.; Wang, Z.; Yi, S.; Jiang, L. Gut microbiota, host genetics and phenotypes in aquatic animals: A review. Aquac. Rep. 2023, 31, 101648. [Google Scholar] [CrossRef] [Scilit]
  4. Liu, M.; Lu, Y.; Xue, G.; Han, L.; Jia, H.; Wang, Z.; Zhang, J.; Liu, P.; Yang, C.; Zhou, Y. Role of short-chain fatty acids in host physiology. Anim. Models Exp. Med. 2024, 7, 641–652. [Google Scholar] [CrossRef] [Scilit] [PubMed]
  5. Stacchiotti, V.; Rezzi, S.; Eggersdorfer, M.; Galli, F. Metabolic and functional interplay between gut microbiota and fat-soluble vitamins. Crit. Rev. Food Sci. Nutr. 2020, 61, 3211–3232. [Google Scholar] [CrossRef] [Scilit] [PubMed]
  6. Abdalkareem Jasim, S.; Opulencia, J.C.; Alexis Ramírez-Coronel, A.; Kamal Abdelbasset, W.; Hasan Abed, M.; Markov, A.; Raheem Lateef Al-Awsi, G.; Azamatovich Shamsiev, J.; Thaeer Hammid, A.; Nader Shalaby, M.; et al. The emerging role of microbiota-derived short-chain fatty acids in immunometabolism. Int. Immunopharmacol. 2022, 110, 108983. [Google Scholar] [CrossRef] [Scilit]
  7. Davila, A.-M.; Blachier, F.; Gotteland, M.; Andriamihaja, M.; Benetti, P.-H.; Sanz, Y.; Tomé, D. Re-print of “Intestinal luminal nitrogen metabolism: Role of the gut microbiota and consequences for the host”. Pharmacol. Res. 2013, 69, 114–126. [Google Scholar] [CrossRef] [Scilit]
  8. Eberl, G. The microbiota, a necessary element of immunity. Comptes Rendus Biol. 2018, 341, 281–283. [Google Scholar] [CrossRef] [Scilit]
  9. Yousefi, B.; Eslami, M.; Ghasemian, A.; Kokhaei, P.; Salek Farrokhi, A.; Darabi, N. Probiotics importance and their immunomodulatory properties. J. Cell. Physiol. 2019, 234, 8008–8018. [Google Scholar] [CrossRef] [Scilit]
  10. Kau, A.L.; Ahern, P.P.; Griffin, N.W.; Goodman, A.L.; Gordon, J.I. Human nutrition, the gut microbiome and the immune system. Nature 2011, 474, 327–336. [Google Scholar] [CrossRef] [Scilit]
  11. Yang, J.; Zhang, Q.; Zhang, T.; Wang, S.; Hao, J.; Wu, Z.; Li, A. Comparative Analysis of the Symbiotic Microbiota in the Chinese Mitten Crab (Eriocheir sinensis): Microbial Structure, Co-Occurrence Patterns, and Predictive Functions. Microorganisms 2023, 11, 544. [Google Scholar] [CrossRef] [Scilit]
  12. Hou, M.; Pang, Y.; Niu, C.; Zhang, D.; Zhang, Y.; Liu, Z.; Song, Y.; Shi, A.; Chen, Q.; Zhang, J.; et al. Effects of Dietary L-TRP on Immunity, Antioxidant Capacity and Intestinal Microbiota of the Chinese Mitten Crab (Eriocheir sinensis) in Pond Culture. Metabolites 2022, 13, 1. [Google Scholar] [CrossRef] [Scilit] [PubMed]
  13. Chen, X.; Chen, H.; Liu, Q.; Ni, K.; Ding, R.; Wang, J.; Wang, C. High Plasticity of the Gut Microbiome and Muscle Metabolome of Chinese Mitten Crab (Eriocheir sinensis) in Diverse Environments. J. Microbiol. Biotechnol. 2021, 31, 240–249. [Google Scholar] [CrossRef] [Scilit] [PubMed]
  14. Chen, X.; Lu, D.; Li, Z.; Yue, W.; Wang, J.; Jiang, X.; Han, H.; Wang, C. Plant and Animal-Type Feedstuff Shape the Gut Microbiota and Metabolic Processes of the Chinese Mitten Crab Eriocheir sinensis. Front. Vet. Sci. 2026, 8, 589624. [Google Scholar] [CrossRef] [Scilit] [PubMed]
  15. Zhou, R.; Liu, J.; Shi, X.; Fu, C.; Jiang, Y.; Zhang, R.; Wu, Y.; Yang, C. Garlic Powder Supplementation Improves Growth, Nonspecific Immunity, Antioxidant Capacity, and Intestinal Flora of Chinese mitten crab (Eriocheir sinensis). Aquac. Nutr. 2022, 2022, 6531865. [Google Scholar] [CrossRef] [Scilit]
  16. Guan, W.; Li, K.; Zhao, S.; Li, K. A high abundance of Firmicutes in the intestine of Chinese mitten crab (Eriocheir sinensis) cultured in an alkaline region. AMB Express 2021, 11, 141. [Google Scholar] [CrossRef] [Scilit]
  17. Jia, B.; Li, Y.; Zi, X.; Gu, X.; Yuan, H.; Jeppesen, E.; Zeng, Q. Nutrient enrichment drives the sediment microbial communities in Chinese mitten crab Eriocheir sinensis culture. Environ. Res. 2023, 223, 115281. [Google Scholar] [CrossRef] [Scilit]
  18. Kim, M.; Vogtmann, E.; Ahlquist, D.A.; Devens, M.E.; Kisiel, J.B.; Taylor, W.R.; White, B.A.; Hale, V.L.; Sung, J.; Chia, N.; et al. Fecal Metabolomic Signatures in Colorectal Adenoma Patients Are Associated with Gut Microbiota and Early Events of Colorectal Cancer Pathogenesis. mBio 2020, 11, e03186-19. [Google Scholar] [CrossRef] [Scilit]
  19. Ortega, P.; Vitorino, H.A.; Moreira, R.G.; Pinheiro, M.A.; Almeida, A.A.; Custódio, M.R.; Zanotto, F.P. Physiological differences in the crab Ucides cordatus from two populations inhabiting mangroves with different levels of cadmium contamination. Environ. Toxicol. Chem. 2017, 36, 361–371. [Google Scholar] [CrossRef] [Scilit]
  20. Wang, Z.; Zeng, L.; Luo, Z.; Wang, Y.; Hao, C. Promoting effects of ferric ions on Microcystis aeruginosa growth and arsenate accumulation and reduction at different phosphorus environments. Environ. Pollut. 2024, 362, 124977. [Google Scholar] [CrossRef] [Scilit]
  21. Liu, M.; Hua, W.; Liu, M.; Hua, W.; Yu, C.; Zhang, S.; Li, W.; Li, C.; Peng, J.; Liu, R.; et al. Toxicity mechanism of microplastics on the growth traits and metabolic pathways of Vallisneria natans under different light environments. Ecotoxicol. Environ. Saf. 2025, 291, 117772. [Google Scholar] [CrossRef] [Scilit] [PubMed]
  22. Nossa, C.W.; Oberdorf, W.E.; Yang, L.; Aas, J.A.; Paster, B.J.; Desantis, T.Z.; Brodie, E.L.; Malamud, D.; Poles, M.A.; Pei, Z. Design of 16S rRNA gene primers for 454 pyrosequencing of the human foregut microbiome. World J. Gastroenterol. 2010, 16, 4135–4144. [Google Scholar] [CrossRef] [Scilit] [PubMed]
  23. Callahan, B.J.; McMurdie, P.J.; Rosen, M.J.; Han, A.W.; Johnson, A.J.; Holmes, S.P. DADA2: High-resolution sample inference from Illumina amplicon data. Nat. Methods 2016, 13, 581–583. [Google Scholar] [CrossRef] [Scilit] [PubMed]
  24. Bolyen, E.; Rideout, J.R.; Dillon, M.R.; Bokulich, N.A.; Abnet, C.C.; Al-Ghalith, G.A.; Alexander, H.; Alm, E.J.; Arumugam, M.; Asnicar, F.; et al. Author Correction: Reproducible, interactive, scalable and extensible microbiome data science using QIIME 2. Nat. Biotechnol. 2019, 37, 1091. [Google Scholar] [CrossRef] [Scilit]
  25. Chao, A.; Bunge, J. Estimating the number of species in a stochastic abundance model. Biometrics 2002, 58, 531–539. [Google Scholar] [CrossRef] [Scilit]
  26. Hill, T.C.; Walsh, K.A.; Harris, J.A.; Moffett, B.F. Using ecological diversity measures with bacterial communities. FEMS Microbiol. Ecol. 2003, 43, 1–11. [Google Scholar] [CrossRef]
  27. Chao, A. Non-parametric estimation of the classes in a population. Scand. J. Stat. 1984, 11, 265–270. Available online: http://www.jstor.org/stable/4615964 (accessed on 27 February 2026).
  28. Zhang, Z.; Deng, Q.; Wan, L.; Cao, X.; Zhou, Y.; Song, C. Bacterial Communities and Enzymatic Activities in Sediments of Long-Term Fish and Crab Aquaculture Ponds. Microorganisms 2021, 9, 501. [Google Scholar] [CrossRef] [Scilit]
  29. Zhu, X.; Nie, M.; Sun, N.; Zhang, Y.; Sun, M.; Li, C.; Jiang, Q.; Wei, H.; Li, Y.; Hu, Q.; et al. Comparative analysis of crab growth performance, enzyme activity, and microbiota between rice-crab coculture and pond farming systems. Front. Vet. Sci. 2025, 12, 1571454. [Google Scholar] [CrossRef] [Scilit]
  30. Yang, M.; Ling, J.; Li, T.; Yu, C.; Jiang, H.; Pan, T. Effects of the Wheat Crab Model and the Pond Culture Model on the Growth, Metabolism and Intestinal Microbiota of the Chinese Mitten Crab (Eriocheir sinensis). Microorganisms 2025, 13, 2396. [Google Scholar] [CrossRef] [Scilit]
  31. Yu, Q.; Wang, F.-Q.; Zhou, Z.-Y.; Ye, Y.-Q.; Xu, Z.; Lu, D.-C.; Du, Z.-J. Enrichment isolation and metabolic characteristics of Halobacteriovorax, cosmopolitan obligate predators in marine conditions. Appl. Environ. Microbiol. 2025, 91, e0193525. [Google Scholar] [CrossRef] [Scilit] [PubMed]
  32. Holt, C.C.; van der Giezen, M.; Daniels, C.L.; Stentiford, G.D.; Bass, D. Spatial and temporal axes impact ecology of the gut microbiome in juvenile European lobster (Homarus gammarus). ISME J. 2020, 14, 531–543. [Google Scholar] [CrossRef] [Scilit] [PubMed]
  33. Nakagawa, S.; Saito, H.; Tame, A.; Hirai, M.; Yamaguchi, H.; Sunata, T.; Aida, M.; Muto, H.; Sawayama, S.; Takaki, Y. Microbiota in the coelomic fluid of two common coastal starfish species and characterization of an abundant Helicobacter-related taxon. Sci. Rep. 2017, 7, 8764. [Google Scholar] [CrossRef] [Scilit] [PubMed]
  34. Foysal, M.J.; Fotedar, R.; Siddik, M.A.B.; Tay, A. Lactobacillus acidophilus and L. plantarum improve health status, modulate gut microbiota and innate immune response of marron (Cherax cainii). Sci. Rep. 2020, 10, 5916. [Google Scholar] [CrossRef] [Scilit]
  35. Zimmer, M. The Fate and Effects of Ingested Hydrolyzable Tannins in Porcellio scaber. J. Chem. Ecol. 1999, 25, 611–628. [Google Scholar] [CrossRef] [Scilit]
  36. Zimmer, M.; Topp, W. Microorganisms and Cellulose Digestion in the Gut of the Woodlouse Porcellio scaber. J. Chem. Ecol. 1998, 24, 1397–1408. [Google Scholar] [CrossRef] [Scilit]
  37. Wang, Y.; Stingl, U.; Anton-Erxleben, F.; Geisler, S.; Brune, A.; Zimmer, M. “Candidatus hepatoplasma crinochetorum,” a new, stalk-forming lineage of Mollicutes colonizing the midgut glands of a terrestrial isopod. Appl. Environ. Microbiol. 2004, 70, 6166–6172. [Google Scholar] [CrossRef] [Scilit]
  38. Li, W.; Wang, H.; Xu, Y.; Li, H.; Zhai, L.; Liu, H. Effect of rice-crab symbiosis on disease and weeds in paddy field and rice yield. Hubei Agric. Sci. 2023, 62, 64–69. [Google Scholar] [CrossRef]
  39. Li, X.; Brejnrod, A.D.; Ernst, M.; Rykær, M.; Herschend, J.; Olsen, N.M.C.; Dorrestein, P.C.; Rensing, C.; Sørensen, S.J. Heavy metal exposure causes changes in the metabolic health-associated gut microbiome and metabolites. Environ. Int. 2019, 126, 454–467. [Google Scholar] [CrossRef] [Scilit]
  40. Tanase, R.; Senda, R.; Matsunaga, Y.; Narukawa, M. Taste Characteristics of Various Amino Acid Derivatives. J. Nutr. Sci. Vitaminol. 2022, 68, 475–480. [Google Scholar] [CrossRef] [Scilit]
  41. Zarrinpar, A.; Chaix, A.; Xu, Z.Z.; Chang, M.W.; Marotz, C.A.; Saghatelian, A.; Knight, R.; Panda, S. Antibiotic-induced microbiome depletion alters metabolic homeostasis by affecting gut signaling and colonic metabolism. Nat. Commun. 2018, 9, 2872. [Google Scholar] [CrossRef] [Scilit] [PubMed]
  42. Duan, W.; Huang, Y.; Xiao, J.; Zhang, Y.; Tang, Y. Determination of free amino acids, organic acids, and nucleotides in 29 elegant spices. Food Sci. Nutr. 2020, 8, 3777–3792. [Google Scholar] [CrossRef] [Scilit] [PubMed]
  43. Liu, P.; Wang, Y.; Yang, G.; Zhang, Q.; Meng, L.; Xin, Y.; Jiang, X. The role of short-chain fatty acids in intestinal barrier function, inflammation, oxidative stress, and colonic carcinogenesis. Pharmacol. Res. 2021, 165, 105420. [Google Scholar] [CrossRef] [Scilit] [PubMed]
  44. Mukhopadhya, I.; Louis, P. Gut microbiota-derived short-chain fatty acids and their role in human health and disease. Nat. Rev. Microbiol. 2025, 23, 635–651. [Google Scholar] [CrossRef] [Scilit]
  45. Ermolenko, E.V.; Sikorskaya, T.V.; Grigorchuk, V.P. Crabs Eriocheir japonica and Paralithodes camtschaticus Are a Rich Source of Lipid Molecular Species with High Nutritional Value. Foods 2023, 12, 3359. [Google Scholar] [CrossRef] [Scilit]
  46. Han, F.; Zhou, L.; Jin, L.; Zhao, Y.; Zhang, Q.; Liu, W.; Han, J. Comparison of Flavor Compounds in Crab Roe and Paste From Chinese Mitten Crab Raised in Lake, Pond, and Rice-Field Environments. Aquac. Nutr. 2025, 2025, 4899168. [Google Scholar] [CrossRef] [Scilit]
  47. Das, A.; Christ, B.; Hörtensteiner, S. Characterization of the pheophorbide a oxygenase/phyllobilin pathway of chlorophyll breakdown in grasses. Planta 2018, 248, 875–892. [Google Scholar] [CrossRef] [Scilit]
  48. Tang, H.; Liu, Y.; Yang, X.; Huang, G.; Liang, X.; Shah, A.N.; Nawaz, M.; Hassan, M.U.; Qumsani, A.T.; Qari, S.H. Multiple cropping effectively increases soil bacterial diversity, community abundance and soil fertility of paddy fields. BMC Plant Biol. 2024, 24, 715. [Google Scholar] [CrossRef] [Scilit]
  49. Srivastava, J.; Young, M.M.; Yadav, V.K.; Phadatare, P.R.; Meyer, T.A.; Chaudhuri, R.K.; Premi, S. The Role of Acetyl Zingerone and Its Derivatives in Inhibiting UV-Induced, Incident, and Delayed Cyclobutane Pyrimidine Dimers. Antioxidants 2023, 12, 278. [Google Scholar] [CrossRef] [Scilit]
  50. Wang, X.; Huang, Y.; Su, H.; Lyu, Y.; Chen, H.; Chen, W.; Zhong, Q.; Zhang, M.; Pei, J.; He, R.; et al. Dynamic comparative analysis of moisture and flavour characteristics in green peppers (Piper nigrum L.) during thermal and non-thermal drying processes. Food Chem. 2025, 488, 144926. [Google Scholar] [CrossRef] [Scilit]
  51. Liu, Q.; He, M.; Zeng, Z.; Huang, X.; Fang, S.; Zhao, Y.; Ke, S.; Wu, J.; Zhou, Y.; Xiong, X.; et al. Extensive identification of serum metabolites related to microbes in different gut locations and evaluating their associations with porcine fatness. Microb. Biotechnol. 2023, 16, 1293–1311. [Google Scholar] [CrossRef] [Scilit]
  52. Chen, K.; Wen, J.; Ma, L.; Wen, H.; Li, J. Dynamic changes in norisoprenoids and phenylalanine-derived volatiles in off-vine Vidal blanc grape during late harvest. Food Chem. 2019, 289, 645–656. [Google Scholar] [CrossRef] [Scilit]
  53. Dodd, D.; Spitzer, M.H.; Treuren, W.; Merrill, B.D.; Hryckowian, A.J.; Higginbottom, S.K.; Le, A.; Cowan, T.M.; Nolan, G.P.; Fischbach, M.A.; et al. A gut bacterial pathway metabolizes aromatic amino acids into nine circulating metabolites. Nature 2017, 551, 648–652. [Google Scholar] [CrossRef] [Scilit]
  54. Wang, H.; Feng, L.; Pei, Z.; Zhao, J.; Lu, S.; Lu, W. Gut microbiota metabolism of branched-chain amino acids and their metabolites can improve the physiological function of aging mice. Aging Cell 2025, 24, e14434. [Google Scholar] [CrossRef] [Scilit] [PubMed]
  55. Han, Z.; Zhao, L.; Hu, Q.; Hung, I.; Liu, C.; Liu, S.; Mei, X.; Zeng, X.; Bin, P.; Wang, J. Gut microbiota-mediated modulation of host amino acid availability and metabolism. Gut Microbes 2025, 17, 2552345. [Google Scholar] [CrossRef] [Scilit] [PubMed]
  56. Agus, A.; Clément, K.; Sokol, H. Gut microbiota-derived metabolites as central regulators in metabolic disorders. Gut 2021, 70, 1174–1182. [Google Scholar] [CrossRef] [Scilit] [PubMed]
  57. Kitagawa, E.; Yamamoto, T.; Fujishita, M.; Ota, Y.; Yamamoto, K.; Nakagawa, T.; Hayakawa, T. Choline and betaine ameliorate liver lipid accumulation induced by vitamin B6 deficiency in rats. Biosci. Biotechnol. Biochem. 2017, 81, 316–322. [Google Scholar] [CrossRef] [Scilit]
  58. Shen, J.; Sun, B.; Yu, C.; Cao, Y.; Cai, C.; Yao, J. Choline and methionine regulate lipid metabolism via the AMPK signaling pathway in hepatocytes exposed to high concentrations of nonesterified fatty acids. J. Cell. Biochem. 2020, 121, 3667–3678. [Google Scholar] [CrossRef] [Scilit]
  59. Michel, V.; Singh, R.K.; Bakovic, M. The impact of choline availability on muscle lipid metabolism. Food Funct. 2011, 2, 53–62. [Google Scholar] [CrossRef] [Scilit]
Figure 1. (a) PCA (3D): In Principal Component Analysis (PCA), samples with more similar compositions are plotted closer together in the PCA space; (b) ASV Diversity Index Rarefaction Curves: Each curve in the plot represents one sample. The x-axis indicates the sampling depth (i.e., the number of sequences sampled), and the y-axis indicates the index value, with the legend showing the group names. If a curve tends to level off as the number of sampled sequences increases, it indicates that the sequencing depth is sufficient for the sample; further sequencing would yield only a small number of new ASVs. Conversely, if the curve does not level off, it suggests that additional sequencing would likely identify a substantial number of novel ASVs.
Fishes 11 00228 g001
Figure 2. Alpha diversity analysis. (a) Boxplot comparing the ASV Chao1 index between groups. (b) Boxplot comparing the ASV Shannon index between groups. Significance: *** p < 0.001.
Fishes 11 00228 g002
Figure 3. (a) Bar plot of community structure distribution. (b) At the phylum level, the bar plot displays the top 15 most abundant taxa. (c) At the genus level, the bar plot displays the top 15 most abundant taxa.
Fishes 11 00228 g003
Figure 4. Circos plot of sample-ASV associations. From the outside in: 1. ASV and sample names. 2. Phylum-level classification of ASVs and group information of samples (colored by category). 3. Connecting lines indicating the abundance/proportion of ASVs in each sample.
Fishes 11 00228 g004
Figure 5. Score plot of differentially abundant features. Different colors represent taxa that are relatively more abundant in the respective groups.
Fishes 11 00228 g005
Figure 6. (a) OPLS-DA. (b) Volcano plot of differentially expressed metabolites. The x-axis represents the log2(Fold Change), and the y-axis represents the −log10(p-value). Red dots indicate up-regulated metabolites (p < 0.05, log2(FC) > 0), while blue dots represent down-regulated metabolites (p < 0.05, log2(FC) < 0). Gray dots denote non-significant metabolites (p > 0.05). The vertical dashed lines mark the 8-fold change thresholds (log2(FC) = ±3), and the horizontal dashed line indicates the significance level (p = 0.05). Metabolites located outside the vertical lines and above the horizontal line are considered significantly differentially expressed.
Fishes 11 00228 g006
Figure 7. KEGG enrichment analysis. From the outside in: Enriched classifications (peripheral scale indicates metabolite count). Background metabolite count and p-value (bar length indicates count; color gradient from blue to red indicates increasing significance). Proportion of upregulated (light red) and downregulated (light blue) metabolites. Rich factor values (background grid units = 0.2).
Fishes 11 00228 g007
Figure 8. Heatmap of microbe–metabolite correlations. Columns: microbial species. Rows: metabolites. Color intensity indicates correlation strength (orange-red: positive; blue: negative). White indicates near-zero correlation. Significance: *** p < 0.001, ** p < 0.01, * p < 0.05.
Fishes 11 00228 g008
Disclaimer/Publisher’s Note: The statements, opinions and data contained in all publications are solely those of the individual author(s) and contributor(s) and not of MDPI and/or the editor(s). MDPI and/or the editor(s) disclaim responsibility for any injury to people or property resulting from any ideas, methods, instructions or products referred to in the content.