Article

A Preliminary Study of the Mitochondrial Genome of Leptobotia rotundilobus: Structural Characteristics and Insights into the Phylogeny of Leptobotinae

1
Fishery Institute of Anhui Academy of Agricultural Sciences, Hefei 230031, China
2
Anhui Province Key Laboratory of Aquaculture & Stock Enhancement, Hefei 230031, China
3
Agricultural Germplasm Resources Bank of Anhui Province, Hefei 230031, China
*
Author to whom correspondence should be addressed.
Fishes 2026, 11(3), 162; https://doi.org/10.3390/fishes11030162
Submission received: 5 February 2026 / Revised: 2 March 2026 / Accepted: 10 March 2026 / Published: 12 March 2026
(This article belongs to the Special Issue Molecular Phylogeny and Taxonomy of Aquatic Animals)

Abstract

Leptobotia rotundilobus is a newly described species in the subfamily Leptobotinae (Teleostei: Cypriniformes), which is endemic to China. Research on this recently discovered species is preliminary, characterized by limited baseline data and the absence of a fully sequenced mitochondrial genome. To elucidate the structural features of the mitochondrial genome of L. rotundilobus, we performed whole-genome sequencing using next-generation sequencing technology and analyzed its genomic composition, gene content, and structural variation through genome assembly and bioinformatics. The complete circular sequence, spanning 16,593 bp, comprises 13 protein-coding genes (PCGs), two ribosomal RNA (rRNA) genes, 22 transfer RNA (tRNA) genes, and a typical control region (D-loop), all arranged in the canonical order. The overall base composition of the genome was determined to be 30.8% adenine (A), 24.4% thymine (T), 28.6% cytosine (C), and 16.2% guanine (G). This A+T bias (55.2%) is consistent with the mitochondrial genomes of other Leptobotia, which may affect secondary structure. The ratio of non-synonymous (Ka) to synonymous substitutions (Ks) of 13 PCGs of 16 Leptobotinae species is far less than 1 (0.012–0.063), indicating strong negative or purifying selection on the mitogenome in these species. Moreover, to investigate the phylogenetic relationships within the subfamily Leptobotinae, particularly within the genus Leptobotia, we constructed multiple phylogenetic trees of the mitogenome and concatenated 13 PCGs of 39 sequences with Sinibotia superciliaris as an outgroup. The phylogentic trees using the maximum likelihood (ML) and Bayesian inference (BI) methods consistently indicate that: (1) after correcting the species identification error, L. rotundilobus is closely related to L. micra; and (2) the species of Leptobotia and Parabotia each form a monophyletic group. This study provides new insights into the taxonomy and phylogenetic relationships of Leptobotinae, with a particular focus on the genus Leptobotia, thereby contributing to the clarification of the systematics, origin, and evolution of Botiidae.
Key Contribution: This study presents the complete mitochondrial genome of L. rotundilobus and confirms structural characteristics while providing insights into the phylogeny of Leptobotinae.

1. Introduction

The genus Leptobotia Bleeker, 1870, comprising a group of small- to medium-sized benthic fishes adapted to hillstreams or major rivers, belongs to the subfamily Leptobotinae of the family Botiidae [1,2,3]. Loaches of this genus primarily feed on aquatic invertebrates, while also consuming plant debris and algae. Currently, there are a total of 19 recognized species in this genus [4,5,6,7,8] (Fishbase: https://www.fishbase.org), most of which are distributed in southern China, mainly in the Yangtze and Pearl Rivers as well as other, smaller river systems in southeastern China [3,4,5,6,7,8]. Only two species are found in northern China: Leptobotia flavolineata Wang, 1981 and Leptobotia orientalis Xu, Fang & Wang, 1981 [9,10]. Due to the relatively small size and limited economic or practical value of most species within the genus Leptobotia, they have attracted little attention, resulting in limited scientific research. Despite this, the genus exhibits relatively high species diversity, with multiple new species having been discovered successively over the past decade (Leptobotia bellacauda Bohlen & Slechtová, 2016; Leptobotia micra Bohlen & Slechtová, 2017; Leptobotia brachycephala Guo & Zhang, 2021; Leptobotia rotundilobus Guo, Cao & Zhang, 2023 and Leptobotia paucipinna Guo, Cao & Zhang, 2023) [5,6,7,8]. It is worth noting that these newly discovered species are strictly dependent on mountain stream ecosystems. Owing to a combination of factors—including naturally small populations and habitats in topographically complex, inaccessible areas—these species remained undiscovered or undocumented until recently. Even after their discovery, fundamental biological research on them remains scarce, with a general lack of key data regarding life history, population size, genetic structure, and other critical aspects. This scarcity of data severely hampers scientific understanding of their ecological roles, evolutionary history, and conservation needs.
Generally, the key characteristic differentiating the genus Leptobotia from the genus Parabotia (both in the subfamily Leptobotinae) is the condition of the subocular spine. Species in Leptobotia lack a forked subocular spine, while those in Parabotia possess a forked one. Previously, the genus Leptobotia was considered to be monophyletic [3]. However, the genus-level reclassification of Leptobotia zebra suggests that Leptobotia is not monophyletic [11]. Relying solely on the presence of a simple, unbranched suborbital spine as a diagnostic character for the genus Leptobotia is not reliable. Both the delimitation of the genus and the classification of its constituent species remain contentious.
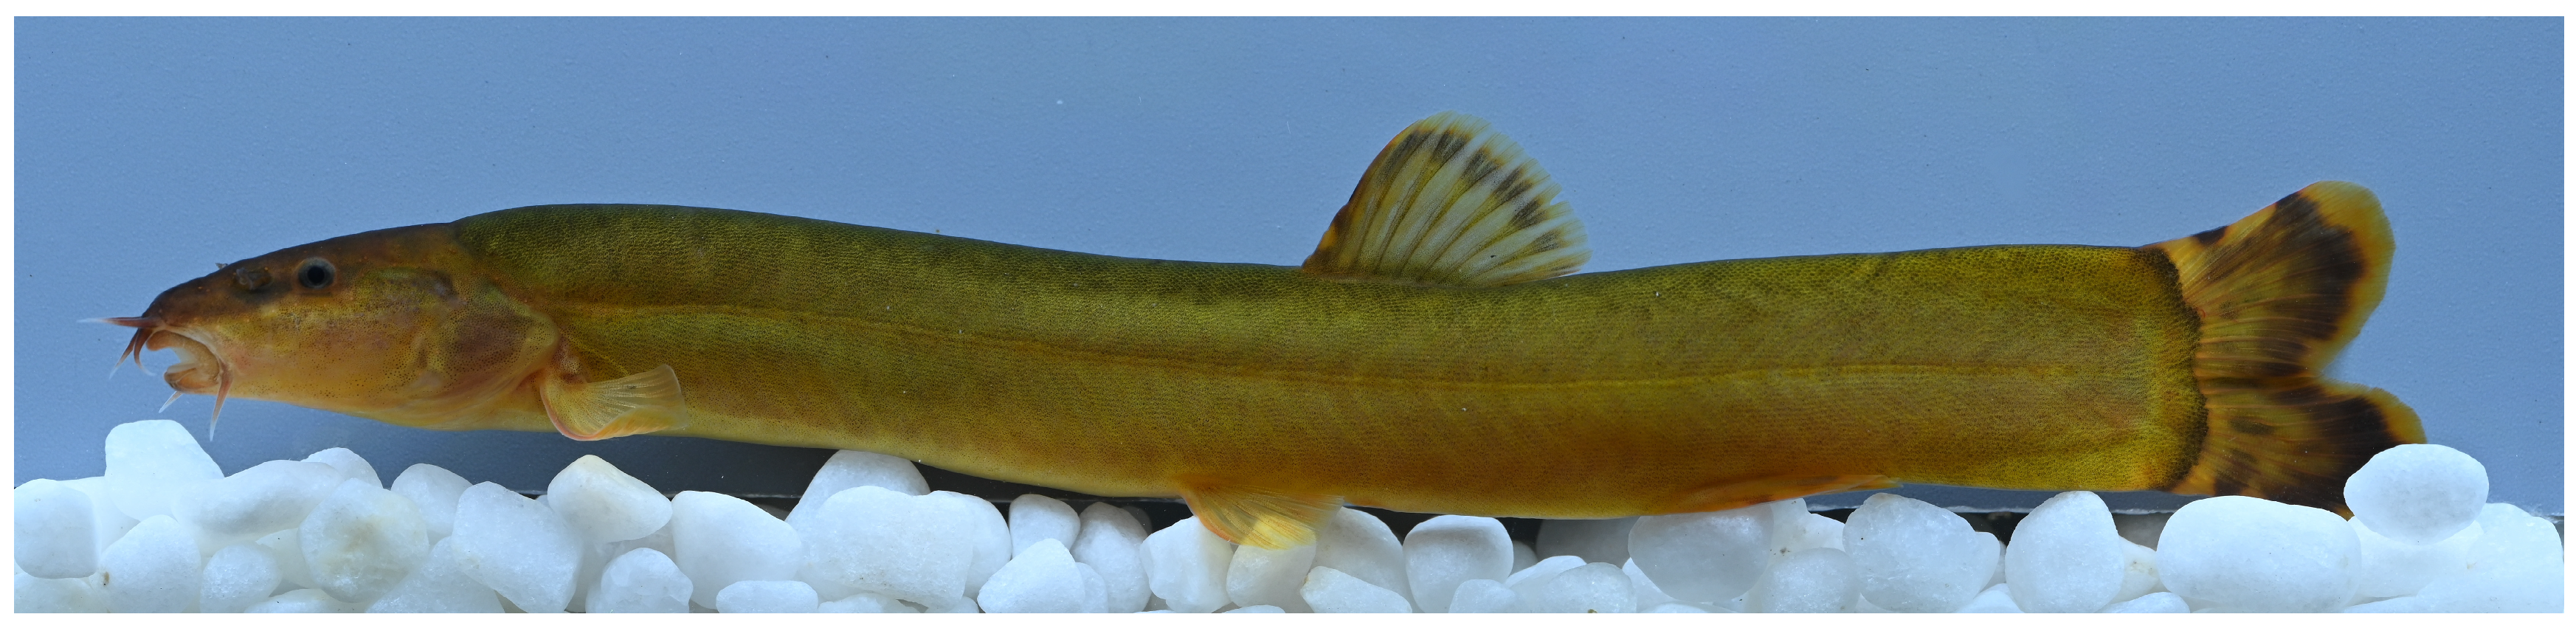
Leptobotia rotundilobus was formally described and recognized as a new species in 2023 [8] (Figure 1). Its distribution is documented in the southern Chinese provinces of Anhui and Zhejiang, specifically in the Xin’an River (a tributary in the upper Qiantang River basin) and the Cao’e River in Zhejiang, which are also the type localities of the species. Due to morphological similarities, this species was once considered to be L. compressicauda [12]. As a typical high-elevation stream fish, it has extremely stringent water quality requirements, inhabiting only clear and pristine headwater areas of streams. Consequently, its natural population is sparse.
However, little is known about the species at present, and the complete mitochondrial genomes of Leptobotia rotundilobus have not been reported. The purpose of this study was to provide complete mtDNA sequence data for L. rotundilobus and combine the existing relevant data to explore phylogenetic relationships within Leptobotinae, including Leptobotia and Parabotia.

2. Materials and Methods

2.1. Sample Collection and Species Identification

Four specimens of L. rotundilobus were collected using a hand net in August 2025 from three tributaries of the Xin’an River in Xiuning County, Anhui Province, China, near its type locality (28°54′28″ N, 118°5′43″ E) [8]. After collection, in situ photographs of these fishes were taken in a small photo tank to record their live coloration before any fading occurred. Subsequently, morphometric and meristic data were collected following standard ichthyological methods. Tissue samples (muscle) were taken and stored in absolute ethanol for molecular studies. The specimens were then fixed in 10% buffered formalin (Sinopharm Chemical Reagent Co., Ltd., Shanghai, China) for 48 h before final transfer to 75% ethanol for long-term preservation. Species identification was confirmed by a combination of morphological examination (following the original description) and molecular phylogenetic analysis using mitochondrial cytochrome b (CYTB) gene sequences. The voucher specimens were deposited in the Fishery Institute of Anhui Academy of Agricultural Sciences.

2.2. DNA Extraction and Library Construction

High-quality genomic DNA was simultaneously extracted and purified from muscle tissue using a commercial kit (Dneasy Blood & Tissue Kit, Qiagen, Dusseldorf, Germany), following the manufacturer’s protocol. Based on the DNBSEQ-T7 platform (BGI, Shenzhen, China), a paired-end sequencing library was constructed as follows: DNA was randomly fragmented into 200–400 bp pieces, followed by end repair, A-tailing, and adapter ligation. The fragments were then amplified via polymerase chain reaction (PCR) and purified to obtain a double-stranded linear DNA library. Subsequently, this double-stranded linear library was circularized into double-stranded circular DNA, which was then denatured to produce single-stranded circular DNA.

2.3. Next-Generation Sequencing (NGS) and Data Quality Control

Using single-stranded circular DNA as a template, DNA nanoballs (DNBs) were generated through rolling circle replication for sequencing. Paired-end sequencing (typically 150 bp read length) was performed on the DNBseq-T7 platform. Prior to assembly, raw sequencing reads were filtered to remove adapters and low-quality bases using fastp 0.36 [13] with default parameters. After that, cleaned reads were obtained.

2.4. Mitochondrial Genome Assembly

To isolate mitochondrial reads, all cleaned reads were mapped to the reference mitogenome of Leptobotia punctata (GenBank accession number: MH644033) using BLASTn (https://blast.ncbi.nlm.nih.gov, accessed on 20 December 2025), and sequence similarity information and sequencing depth coverage data for each scaffold were calculated. These mitochondrial reads were then extracted and assembled using SPAdes 3.15.0 [14] in isolate mode. The resultant assembly graph was visualized and inspected for ambiguities using Bandage 0.9.0 [15] software to confirm a circular conformation. To fill any remaining gaps in the assembly, GapFiller 1.11 [16] was employed. Subsequently, the draft genome was polished using Pilon 1.24 [17] with three rounds of iteration, using the originally mapped reads to correct base-calling errors and small insertions/deletions (indels). The final complete circular mitogenome was rotated to start at the tRNA-Phe gene, following the convention of the reference species.

2.5. Assembly Validation, Annotation and Analysis

To validate the accuracy of the assembled mitogenome, we performed conventional PCR amplification followed by Sanger sequencing of two key regions: the CYTB gene and the non-coding control region (D-loop). The primers used were universal Cypriniformes primers (Table S1) as described in references [18,19,20]. The obtained Sanger sequences were aligned with the SPAdes assembly results using MEGA 12.09 [21]. A comparative analysis showed 100% identity between the Sanger sequences and the NGS assembly, with zero mismatches or indels detected, thereby confirming the accuracy of the assembly.
After validation, the mitogenome was annotated and visualized by MitoFish v 2025. 06 (online tool: https://mitofish.aori.u-tokyo.ac.jp/, accessed on 15 January 2026) [22]. The base composition, AT- and GC-skew, amino acid usage frequency of protein-coding genes (PCGs), and relative synonymous codon usage (RSCU) were calculated using PhyloSuite v2 [23]. The structure of the D-loop was analyzed by comparing that of other Botiidae species [24]. Additionally, the synonymous (Ks) and non-synonymous (Ka) substitution rates were determined using DnaSP v6 [25]. The results were then visualized using a clustered column chart generated in Microsoft Excel.
The number of variable sites and haplotypes of four L. rotundilobus sequences were analyzed using DnaSP v6 [25]. Subsequently, a neighbor-joining tree (NJ-tree) was reconstructed by MEGA 12.09 [25] under the Kimura 2-parameter (K2P) genetic distance model.

2.6. Phylogenetic Tree Construction

We retrieved and downloaded all currently available complete mitochondrial genomes of Leptobotinae species and Sinibotia superciliaris from GenBank. Redundant identical DNA sequences were removed using PhyloSuite v2 [22], retaining only one copy per unique sequence, with priority given to those with NC accession numbers. A total of 40 sequences were retained and subsequently aligned using MAFFT 7.505 [26] with default settings. In cases where we identified likely misidentifications supported by convincing evidence, we adopted what we consider to be the correct species names, such as Leptobotia micra and Sinibotia sp. We eventually successfully extracted nucleotide and amino acid sequences of 40 mitochondrial genomes covering about 17 species, including 8 Leptobotia species, 7 Parabotia species, S. superciliaris and Sinibotia sp. (Table 1). A phylogenetic tree of these species was constructed based on the mitogenome sequence and the concatenated sequence of 13 PCGs using maximum likelihood (ML) and Bayesian (BI) methods with S. superciliaris and Sinibotia sp. as the outgroups.
The best substitution model TIM2+F+I+G4 (mitogenome) or the edge-linked partition model (PCGs) was chosen based on the Bayesian information criterion (BIC) using the smart model selection algorithm [27,28], and the ML trees were constructed using IQ-TREE 2.4.0 software with a standard bootstrap test inferred from 1000 replicates [29]. In the partition model analysis, the other selection parameters were: Threads = 4; merge, rcluster = 10. This approach accounts for the different evolutionary constraints acting on each codon position. Bayesian inference phylogenies (BI tree) were inferred using MrBayes v3.2.7 [30] under the GTR model (mitogenome) or partition model (2 parallel runs, 5,000,000 generations) (PCGs) [26], in which the initial 25% of sampled data were discarded as burn-in. For the MrBayes analyses, the partition model settings are the same as mentioned before, and when the average standard deviation of split frequencies (ASDSF) was below 0.01 at the end of the runs, it was considered convergence.
The phylogenetic trees were edited by the online tool Interactive Tree Of Life (iTOL) (https://itol.embl.de/, accessed on 23 January 2026). The genetic distance between these sequences was calculated using MEGA 12.09 based on the K2P model [21].

3. Results

3.1. Mitochondrial Genomic Structure and Composition

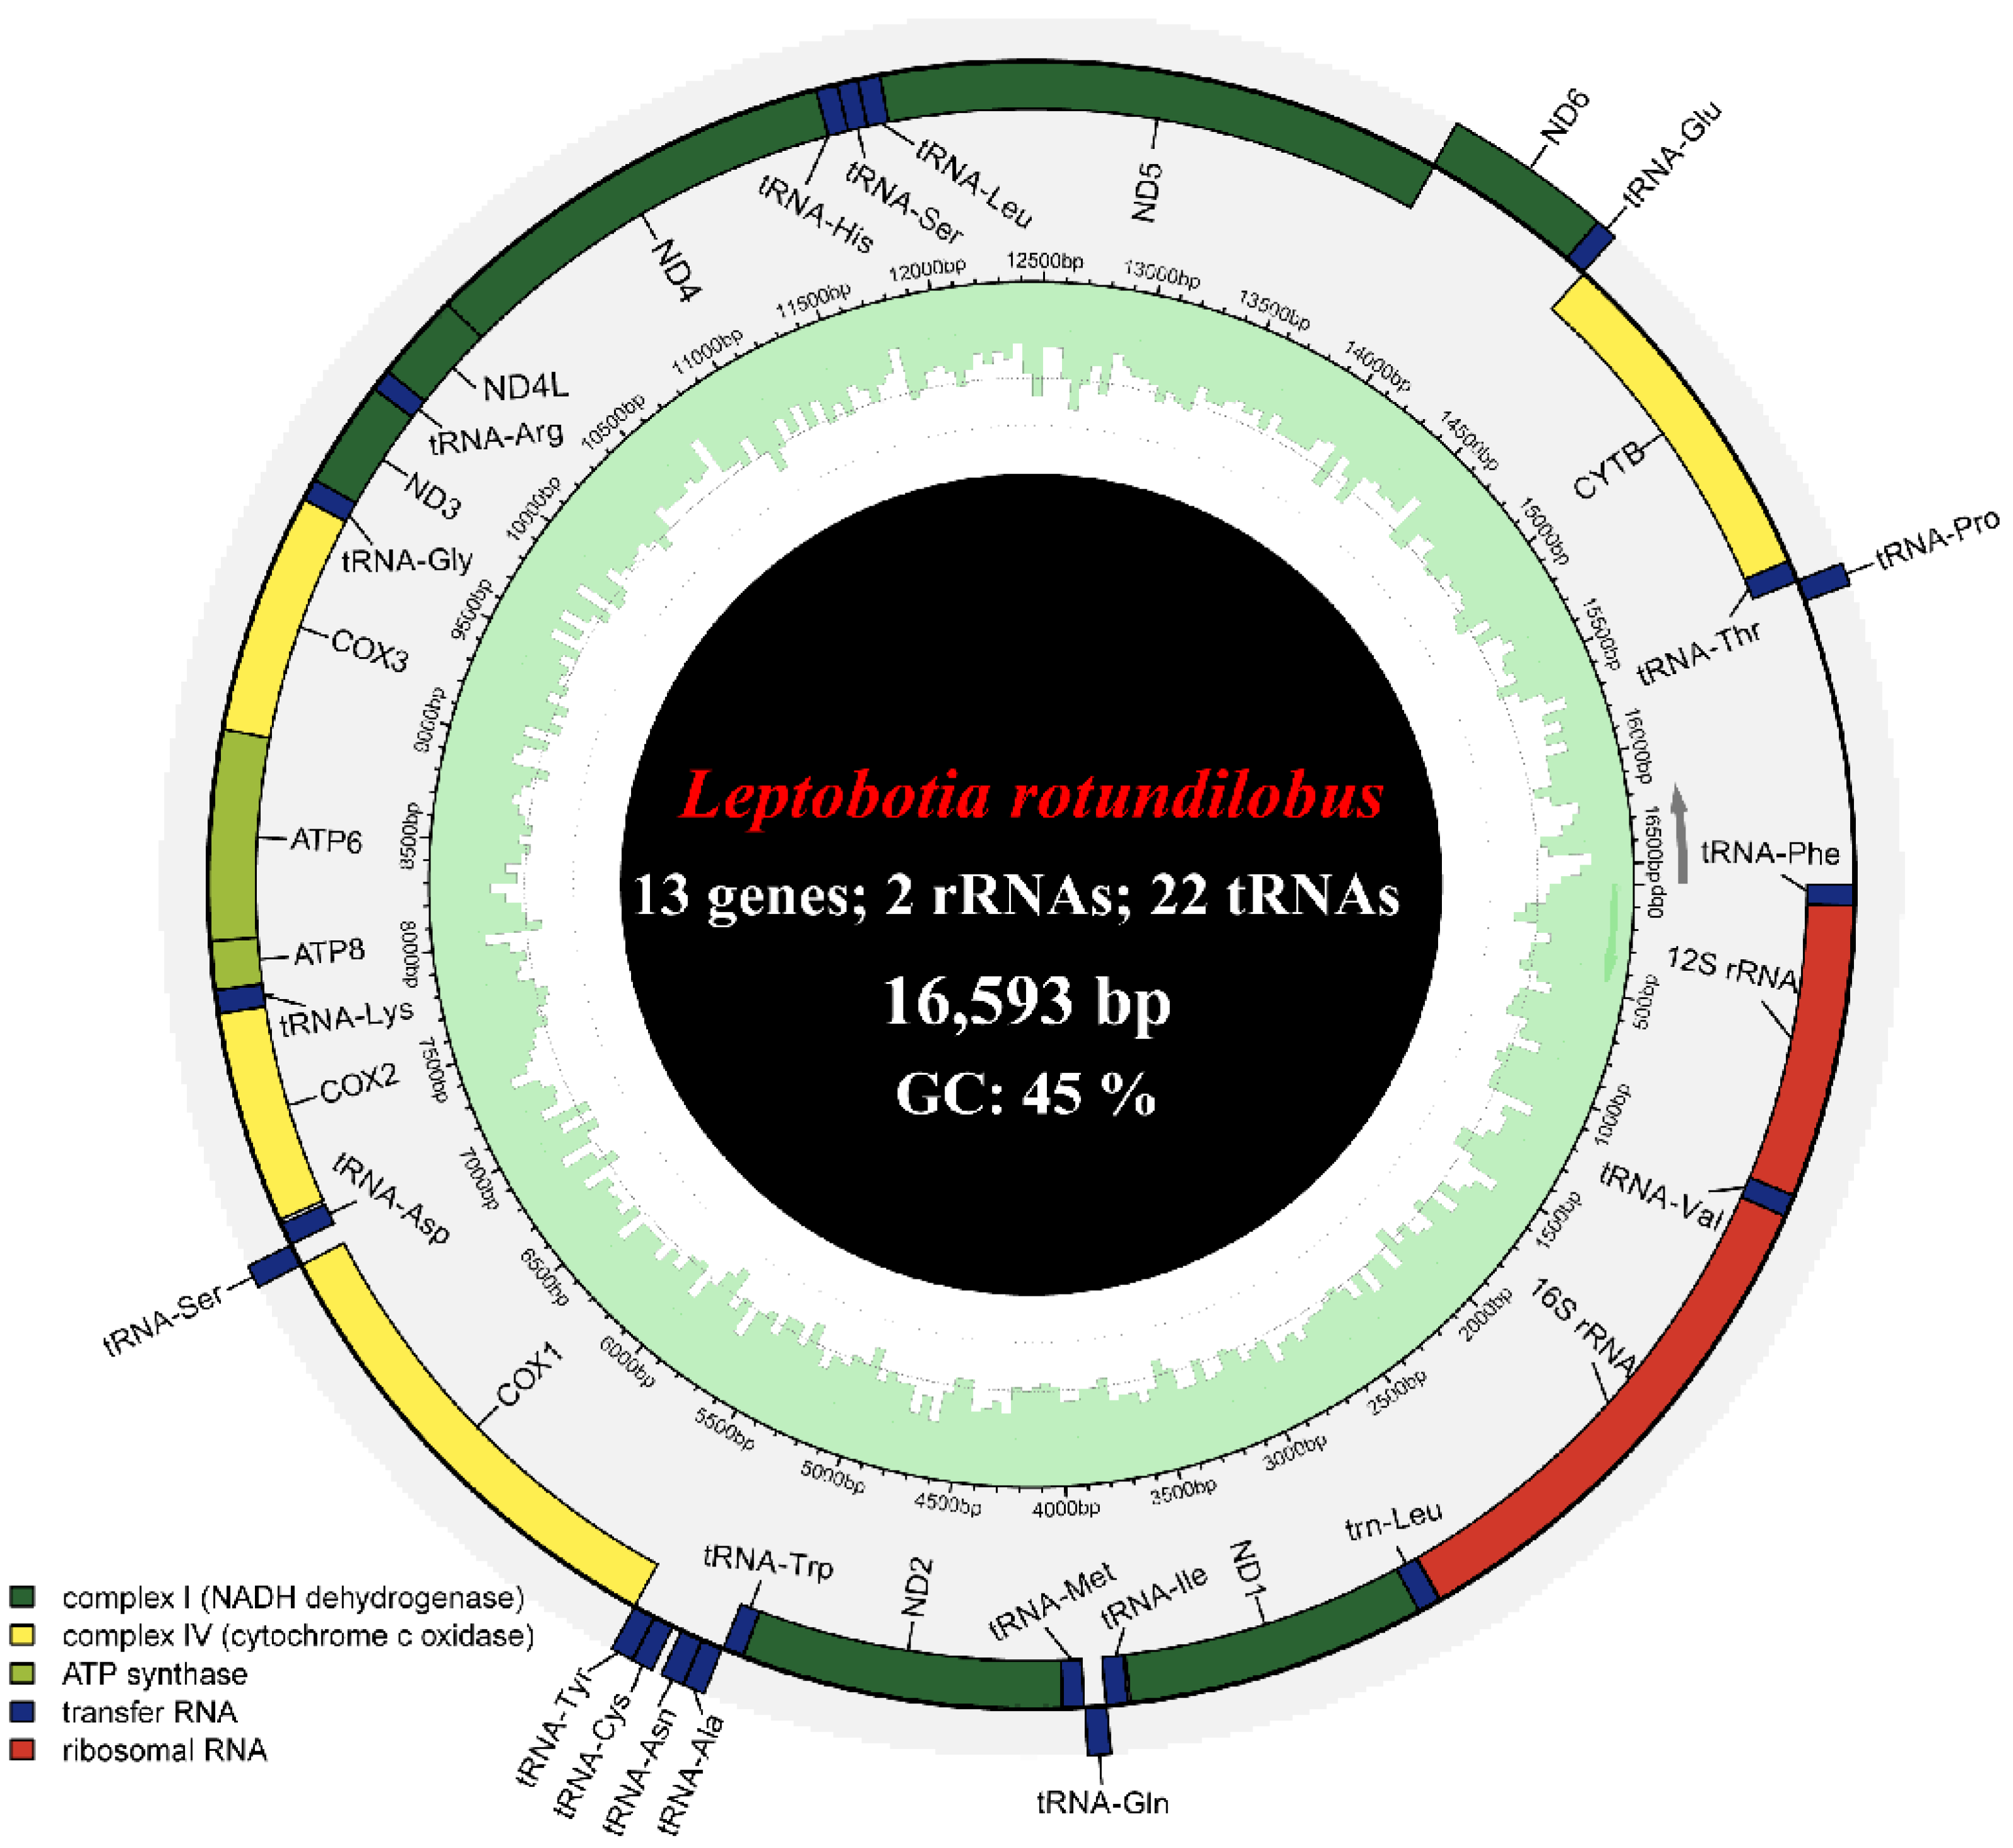
We obtained high-quality second-generation sequencing data (Tables S2 and S3) and successfully assembled four mitochondrial genomes of L. rotundilobus. The complete mitochondrial genome of L. rotundilobus is a closed circular double-stranded DNA molecule of 16,593 bp in size and was deposited in GenBank (accession numbers: PX857782-PX857785) (Figure 2). The mitogenome typically contains 37 genes with 13 protein-coding genes (PCGs), two ribosomal RNA (rRNA) genes, 22 transfer RNA (tRNA) genes, and a control region (D-loop) (Figure 2, Table 2). Most of the 37 genes were encoded on the H-strand, but NADH dehydrogenase 6 (ND6) and 8 tRNA genes (tRNA-Gln, tRNA-Ala, tRNA-Asn, tRNA-Cys, tRNA-Tyr, tRNA-Ser(UCN), tRNA-Glu and tRNA-Pro) were encoded on the L-strand. In total, 12 of the 13 PCGs of the mitogenome start with a typical ATG codon, except for cytochrome c oxidase subunit 1 (COX1) gene (GTG codon). Seven PCGs—NADH dehydrogenase 1 (ND1), COX1, ATP synthase F0 subunit 6 (ATP6), ATP synthase F0 subunit 8 (ATP8), NADH dehydrogenase 4L (ND4L), NADH dehydrogenase 5 (ND5), and ND6—terminate with the canonical TAA stop codon. The remaining six genes exhibit incomplete stop codons: three—NADH dehydrogenase 2 (ND2), NADH dehydrogenase 4 (ND4), and cytochrome c oxidase subunit 3 (COX3)—end with a single TA, and the other three—cytochrome c oxidase subunit 2 (COX2), NADH dehydrogenase 3 (ND3), and CYTB—conclude with a lone T. The 22 tRNA genes ranged in size from 66 to 76 bp, and tRNA-Cys gene (66 bp) was the shortest in size, whereas the longest was tRNA-Leu(UUR). Among the two rRNA genes, 12S rRNA is located between tRNA-Phe and tRNA-Val with 954 bp length, and 16S rRNA is located between tRNA-Val and tRNA-Leu(UUR) with 1683 bp length. The non-coding control region (D-loop) is located between tRNA-Pro and tRNA-Phe with 927 bp in length, in which an extended terminal associated sequence (ETAS), central conserved domain (CD) including three conserved sequence blocks (CSB-F, CSB-E, and CSB-D), and conserved sequence block (CSB) consisting of three conserved sequence blocks (CSB-1, CSB-2, and CSB-3) are identified (Figure S1). In addition, there are 13 small gene spacers (from 1 to 30 bp in size) in the mitogenome with the longest gap being 30 bp locating between tRNA-Asn and tRNA-Cys and six overlapping regions (from 1 to 10 bp in size) with the longest overlapping region (10 bp) existing between ATP8 and ATP6. A sequence capable of initiating L-chain replication (OL) was identified in the longest gap region, which consists of 10 bases forming a conserved stem-ring structure (Figure S2).
The complete mitochondrial genome exhibits a distinct base composition bias, with adenine (A) at 30.8%, thymine (T) at 24.4%, cytosine (C) at 28.6%, and guanine (G) at 16.2% (Table 3). This results in a notable A+T bias of 55.2%, a characteristic feature consistently observed in the mitochondrial genomes of other Leptobotia species [31,32,33]. Such a bias significantly influences key biophysical properties of the DNA, including secondary structure stability, melting temperature, and replication efficiency. Additionally, the D-loop region shows a significant A+T bias (66.2%), consistent with its reduced evolutionary constraints and faster mutation rate. Furthermore, the A+T content varies considerably across codon positions in the PCGs: 47.5% at the first, 58.5% at the second, and 58.2% at the third position. With the exception of ND6, all PCGs exhibit a strong anti-G bias (ranging from 12.0% to 18.4%), which is particularly pronounced at the second (13.6%) and third (7.2%) codon positions (Table 3).
The AT-skew of four PCGs (COX1, ND3, ND4L, ND6) is negative, while the AT-skew of the mitogenome, rRNAs, tRNAs, the D-loop region, the concatenated PCGs and the other nine PCGs is positive. When considering codon positions, the AT-skew of the second codon position of all PCGs is also negative, whereas the first and third codon positions of all PCGs are positive. Conversely, the GC-skew of only ND6 and tRNAs is positive, while all others are negative.

3.2. Characteristics of Codon Usage and Selection Pressure

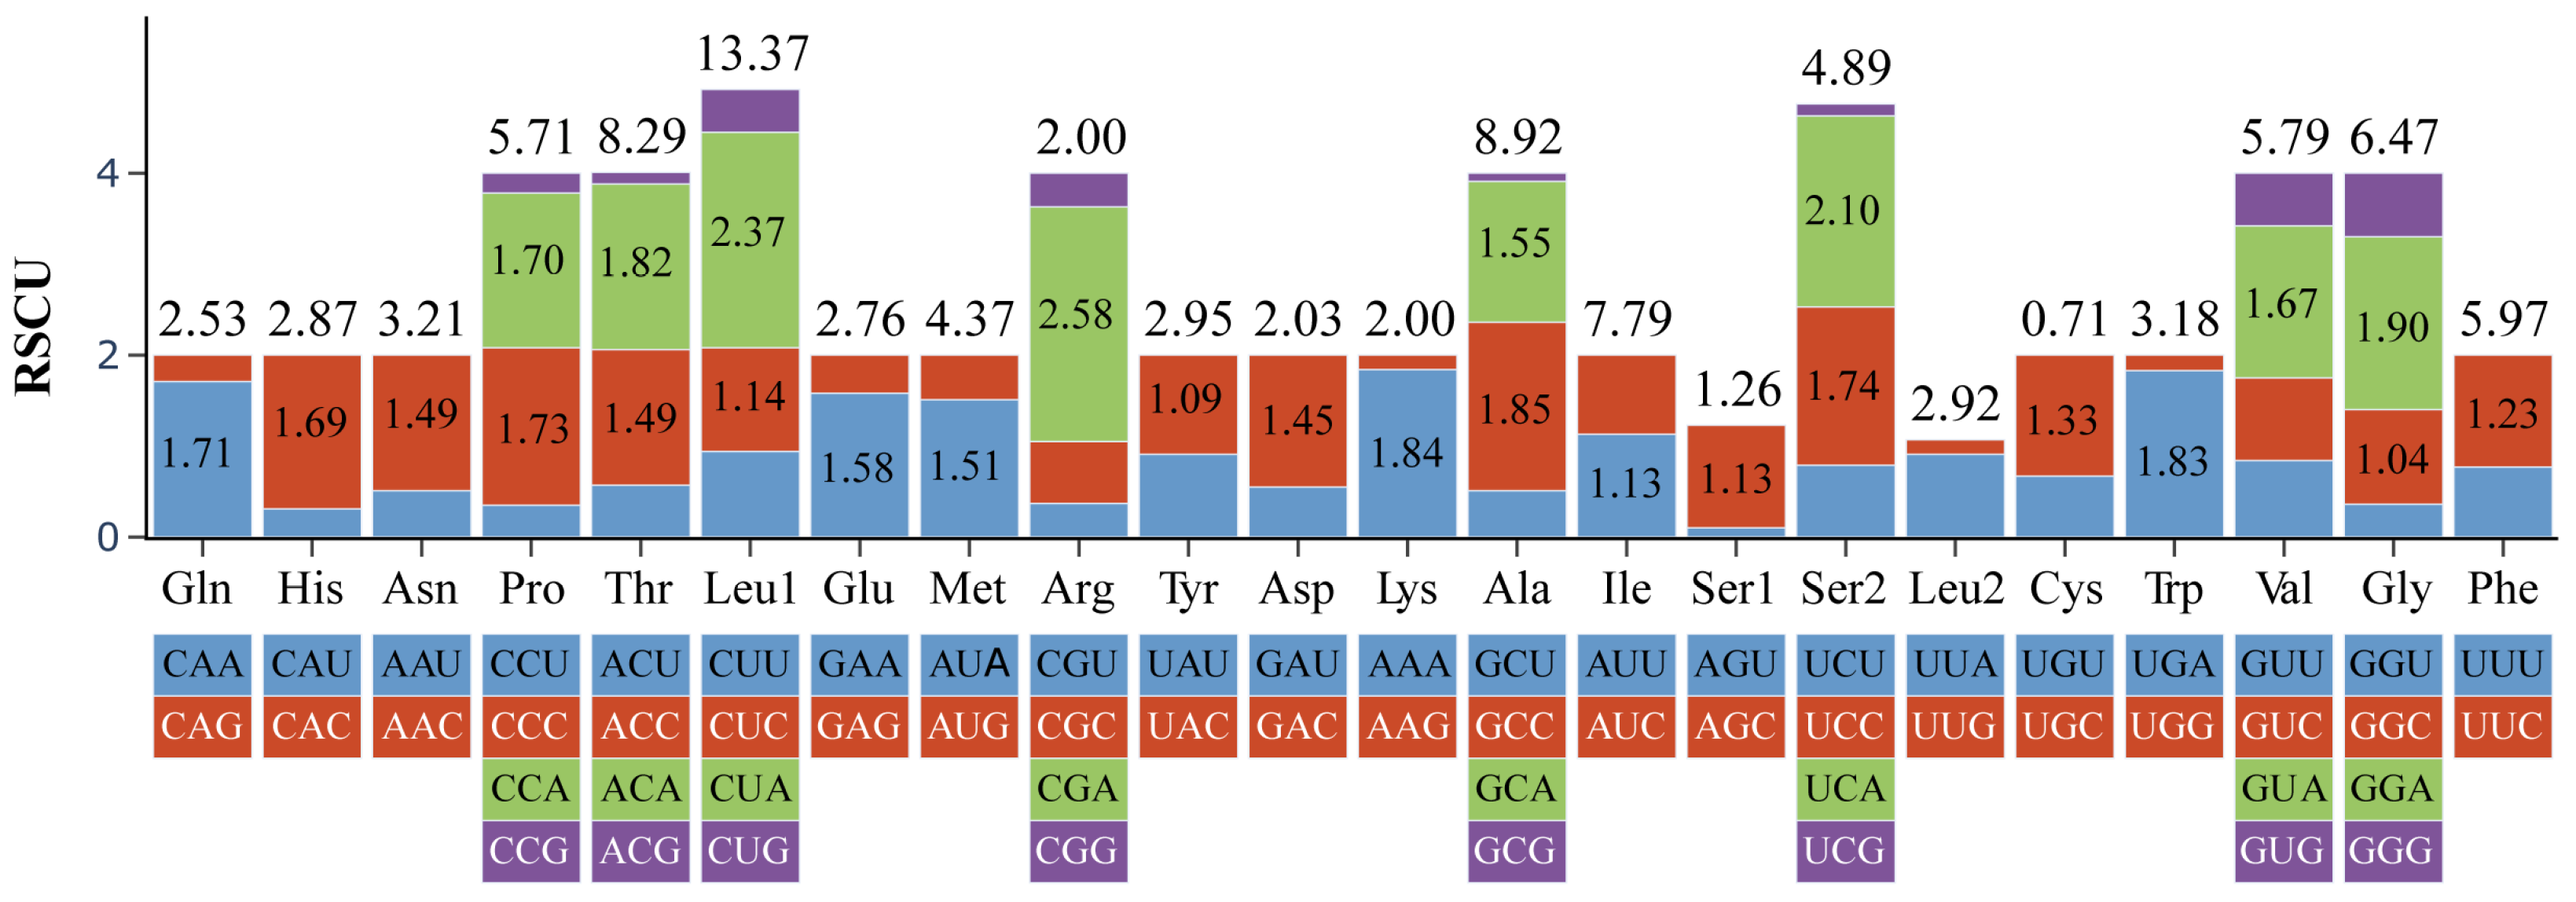
The 13 PCGs encode a total of 3800 amino acids (except for stop codons) with the highest content being 619 leucine (16.29%) and the lowest content being 27 cysteine (0.71%) (Figure 3). The relative synonymous codon usage (RSCU) statistics show that there are 27 preferred codons (RSCU > 1) in total, with the highest 2.58. There are three codons with RSCU values greater than 2: CUA, UCA and CGA, all of which end in A (Figure 3).
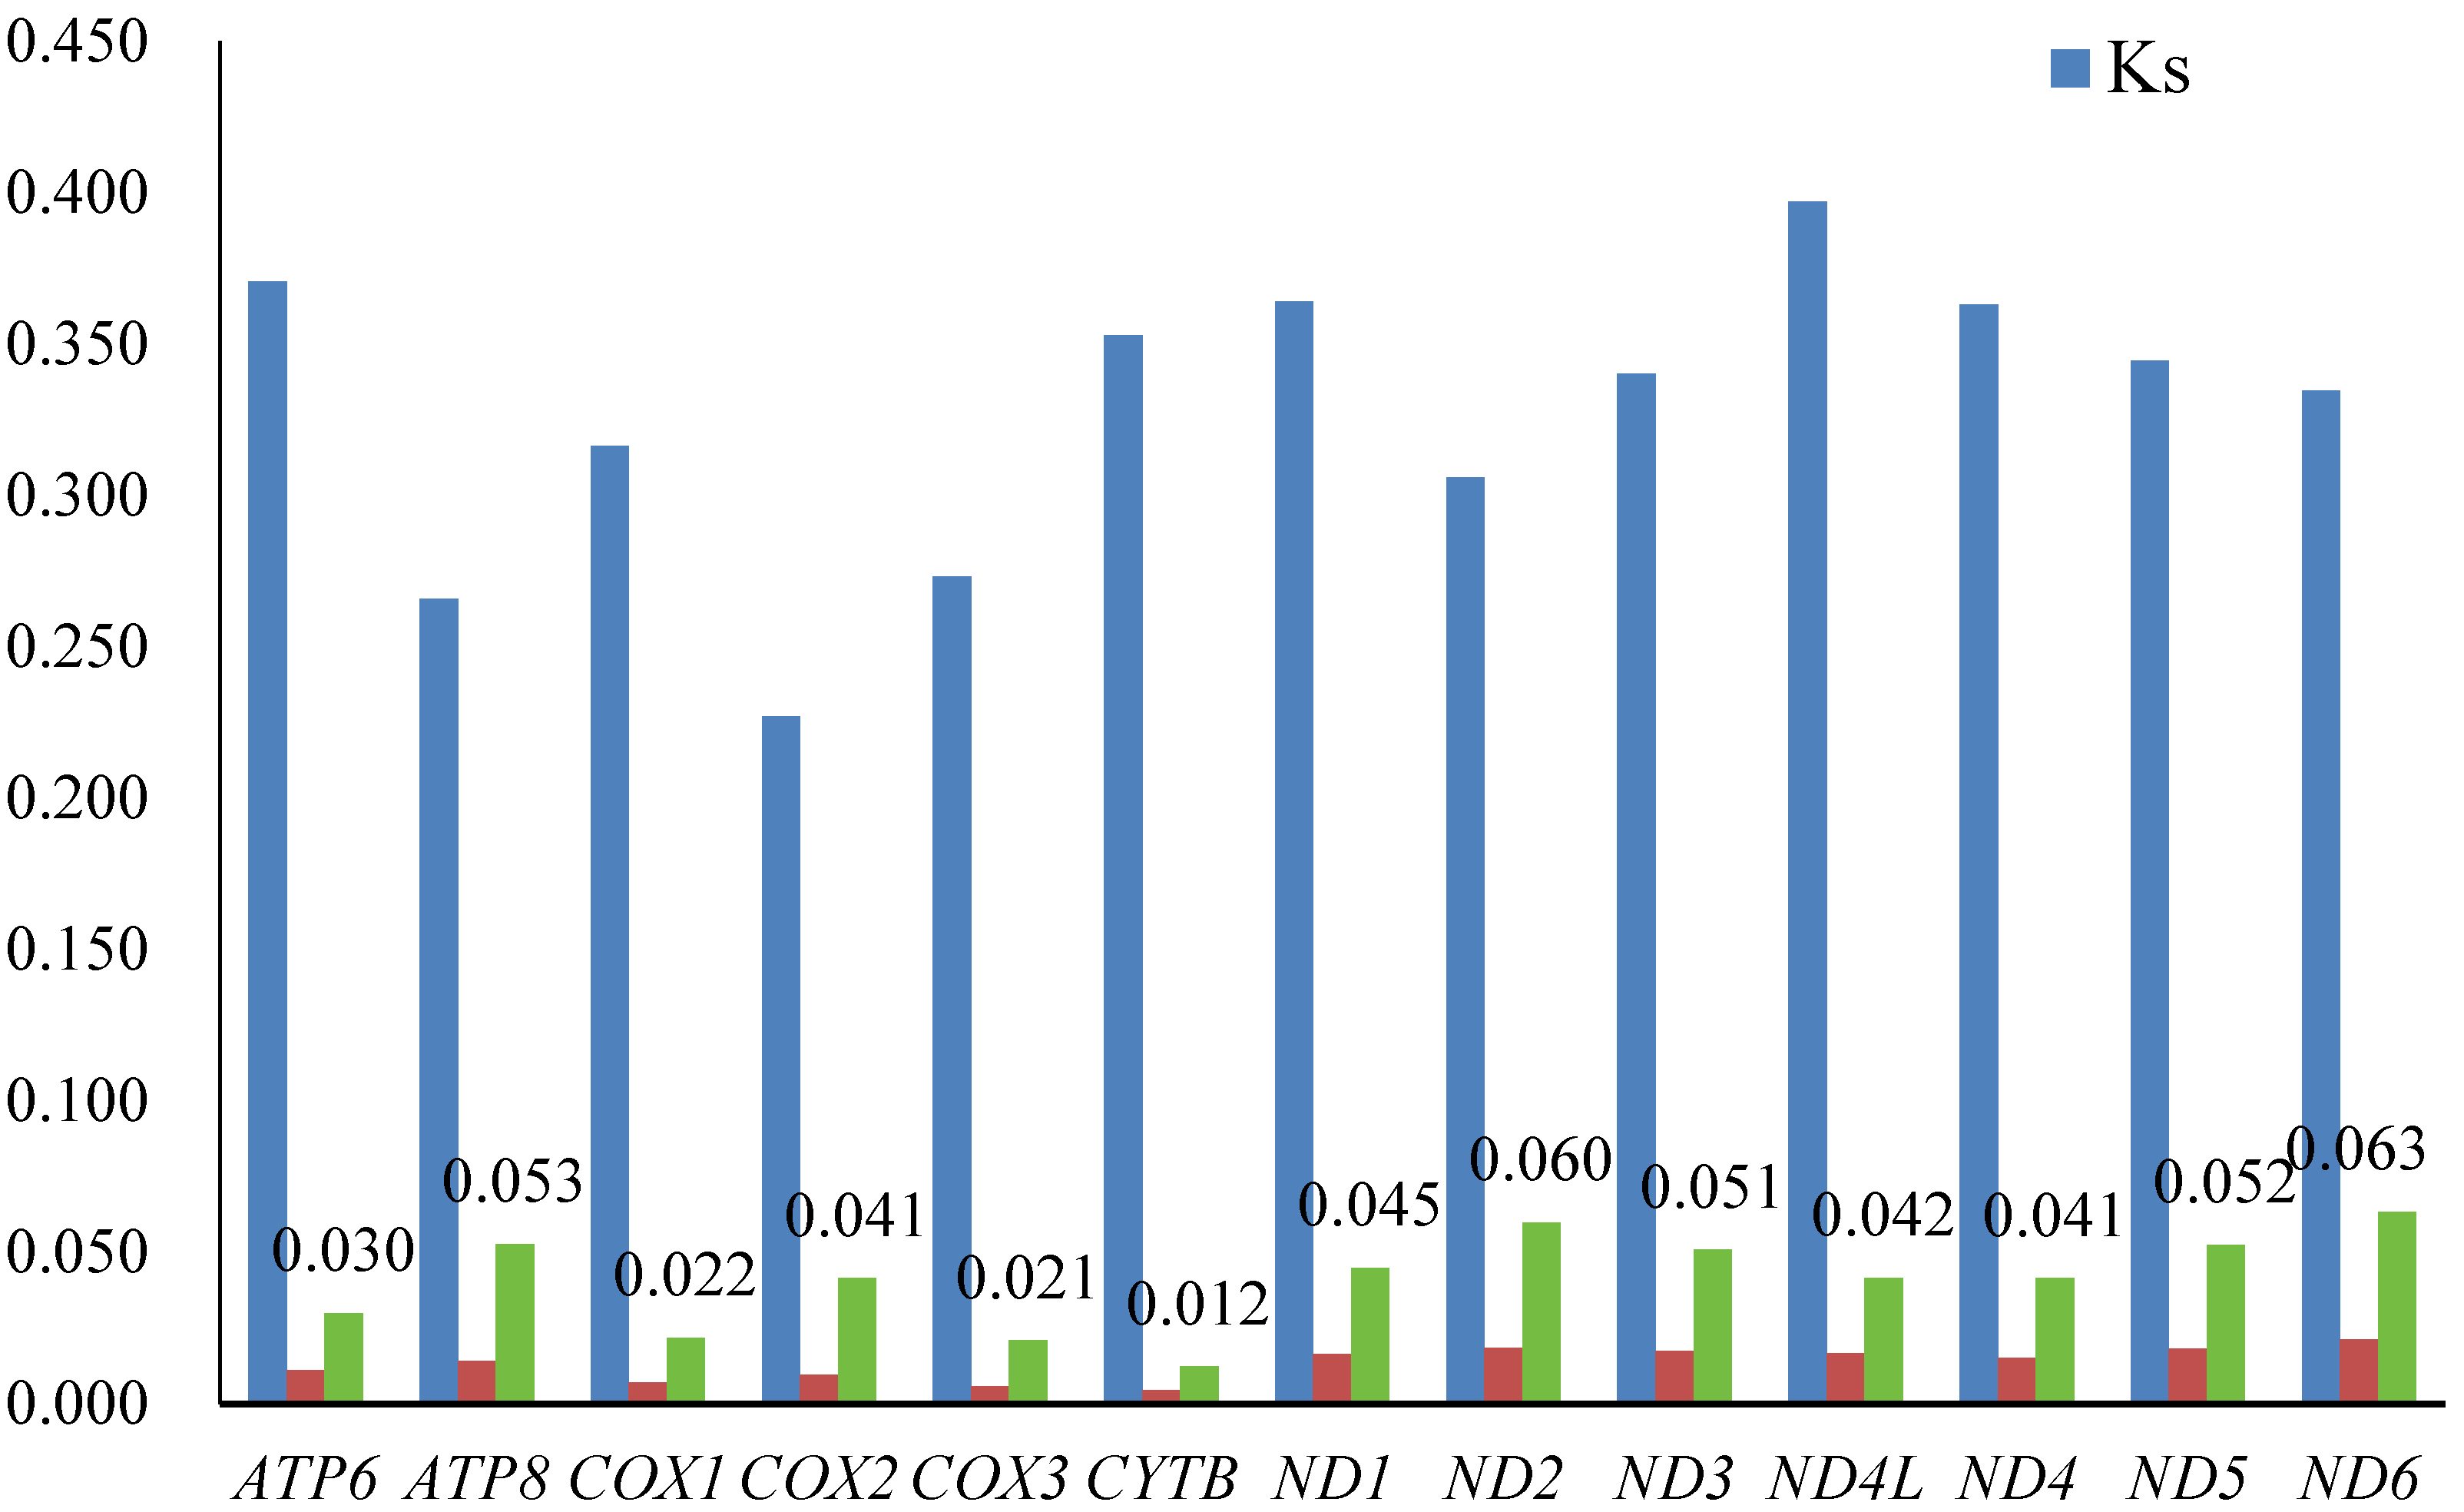
Obviously, the Ka values (0.004–0.021) are much smaller than the Ks values (0.227–0.397) of all PCGs in Leptobotinae species (excluding sequence NC061212). Therefore, the Ka/Ks ratio of each PCG is far less than 1, with the highest Ka/Ks ratio (0.063) in ND6, whereas the lowest ratio (0.012) is in CYTB (Figure 4).

3.3. Intraspecific Variation in L. rotundilobus

Analysis of the four sequences (PX857782–PX857785) in L. rotundilobus revealed 38 variable sites, which defined four distinct haplotypes. The genetic distance among the sequences is less than 0.14% (Table 3). The NJ-tree showed that PX857782 and PX857785 clustered together first and subsequently clustered with PX857784 and PX857783, in that order (Table 3).

3.4. Phylogenetic Relationship

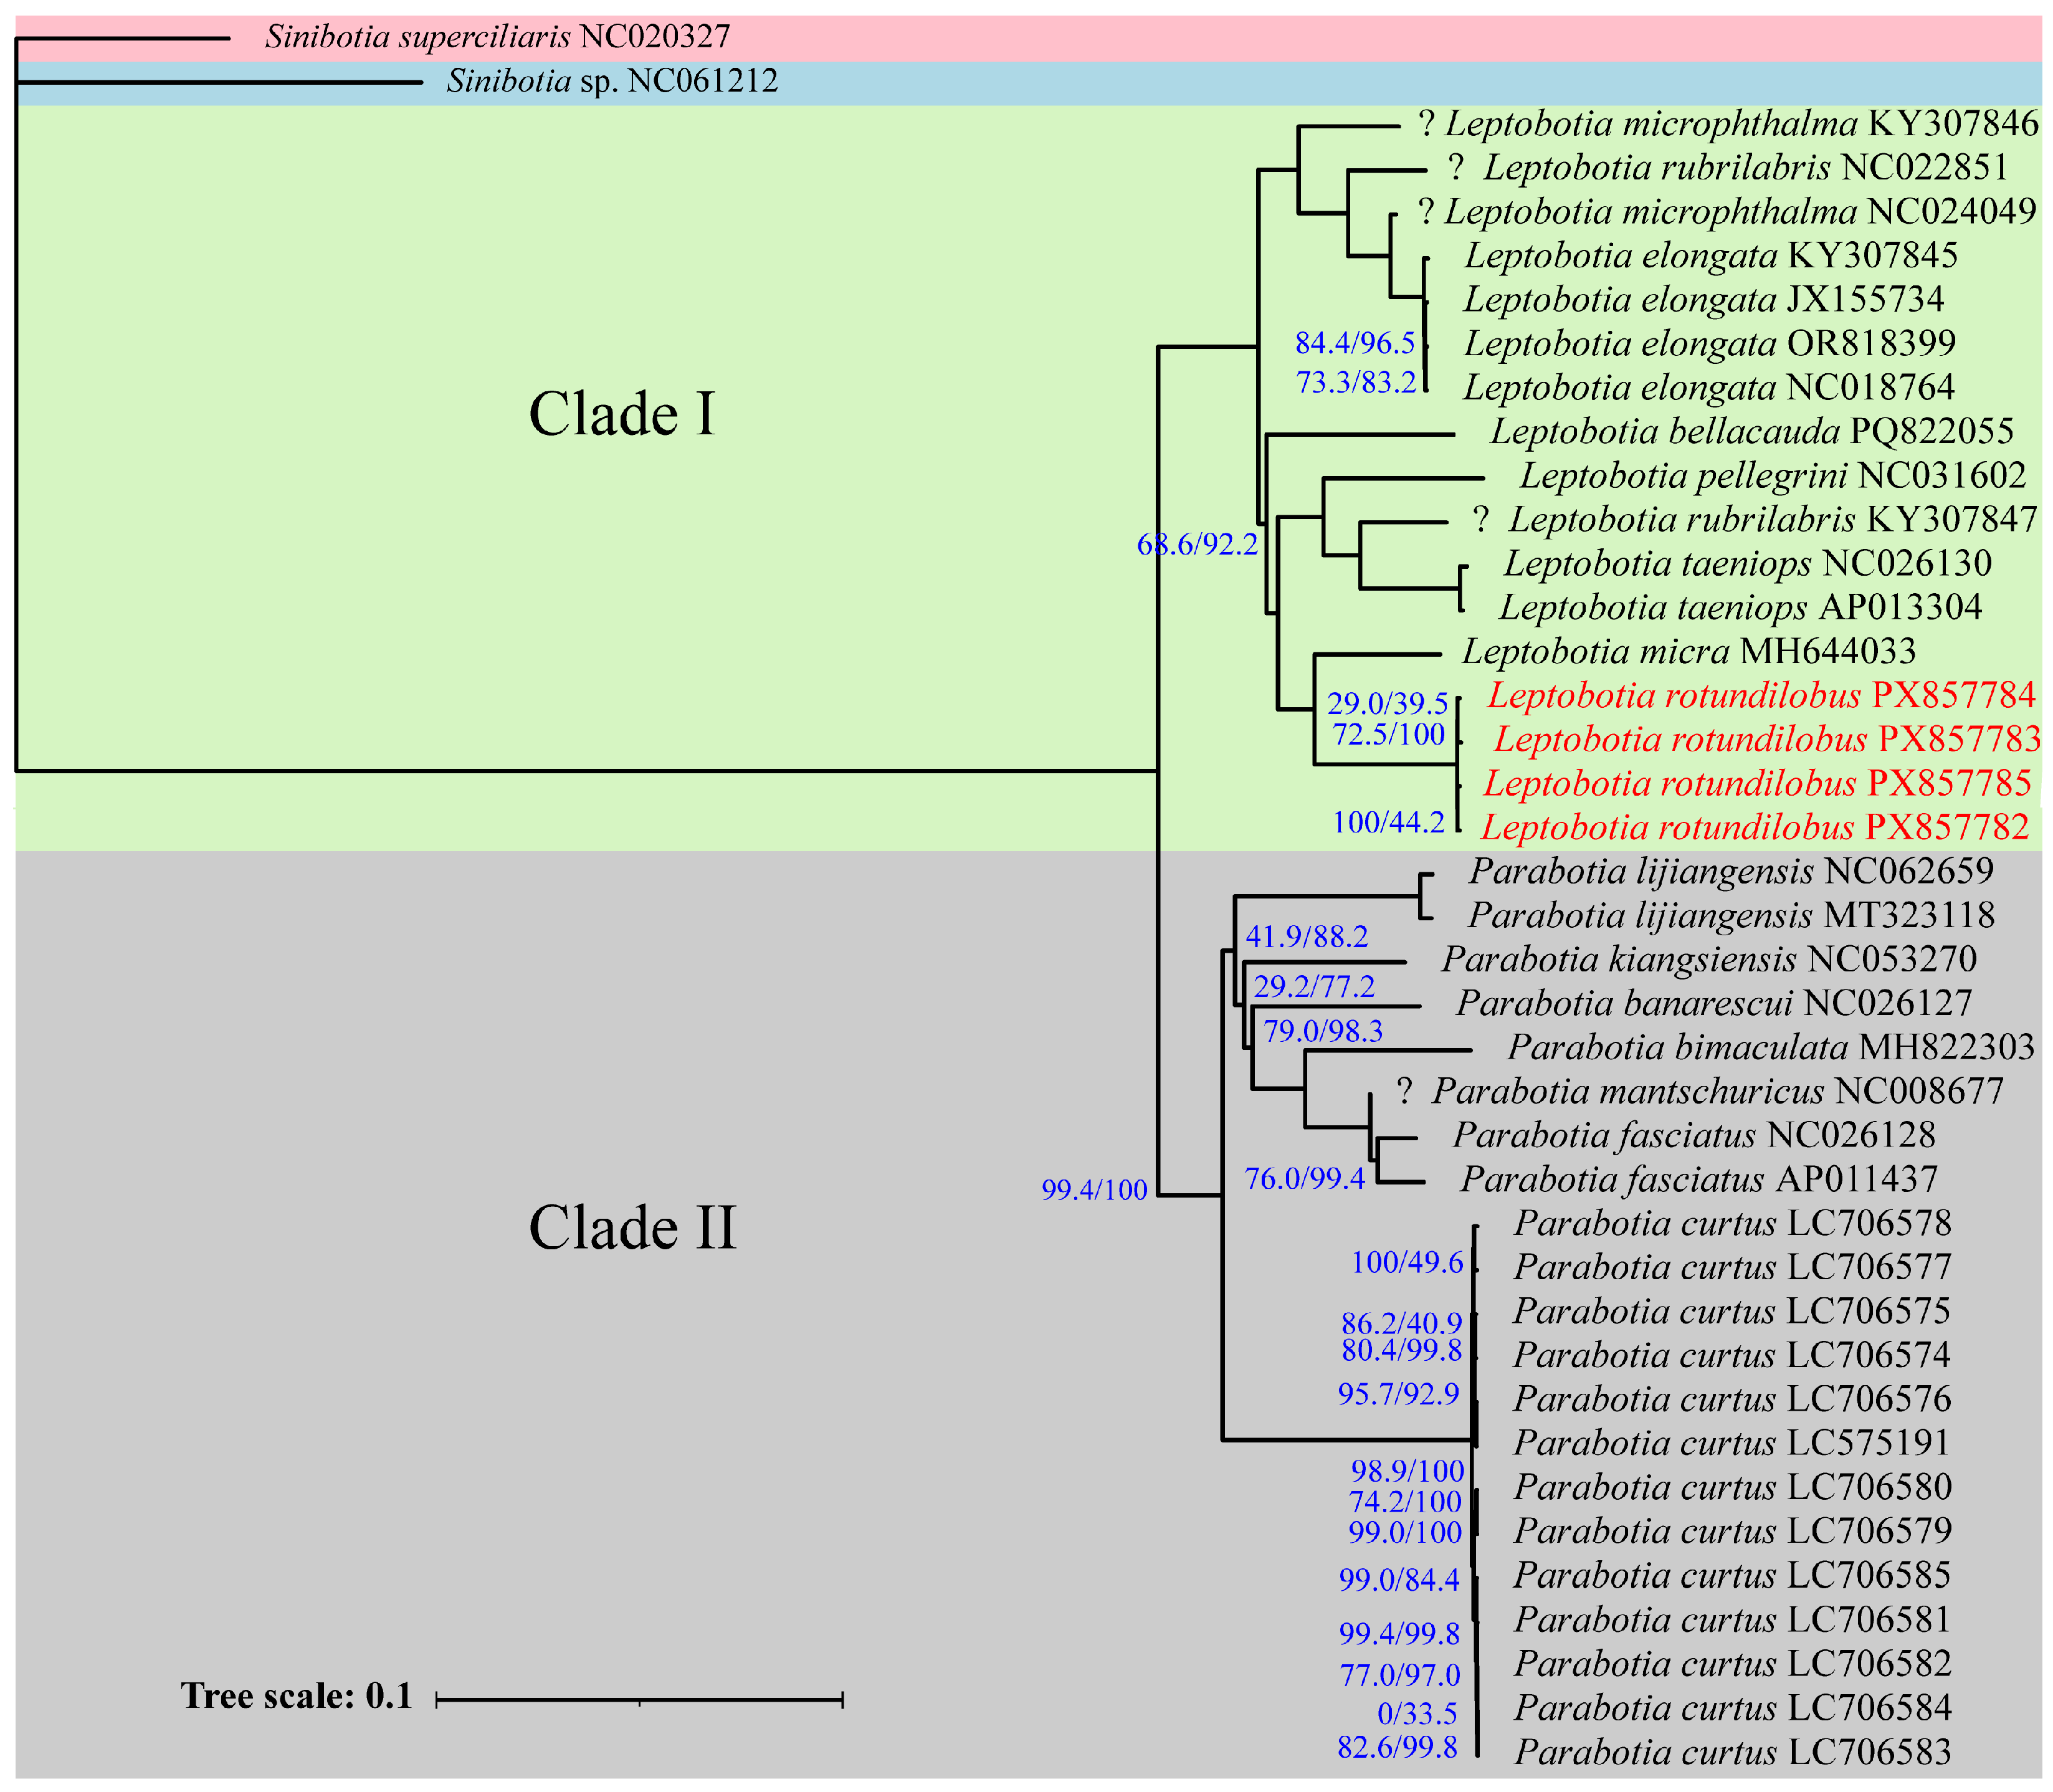
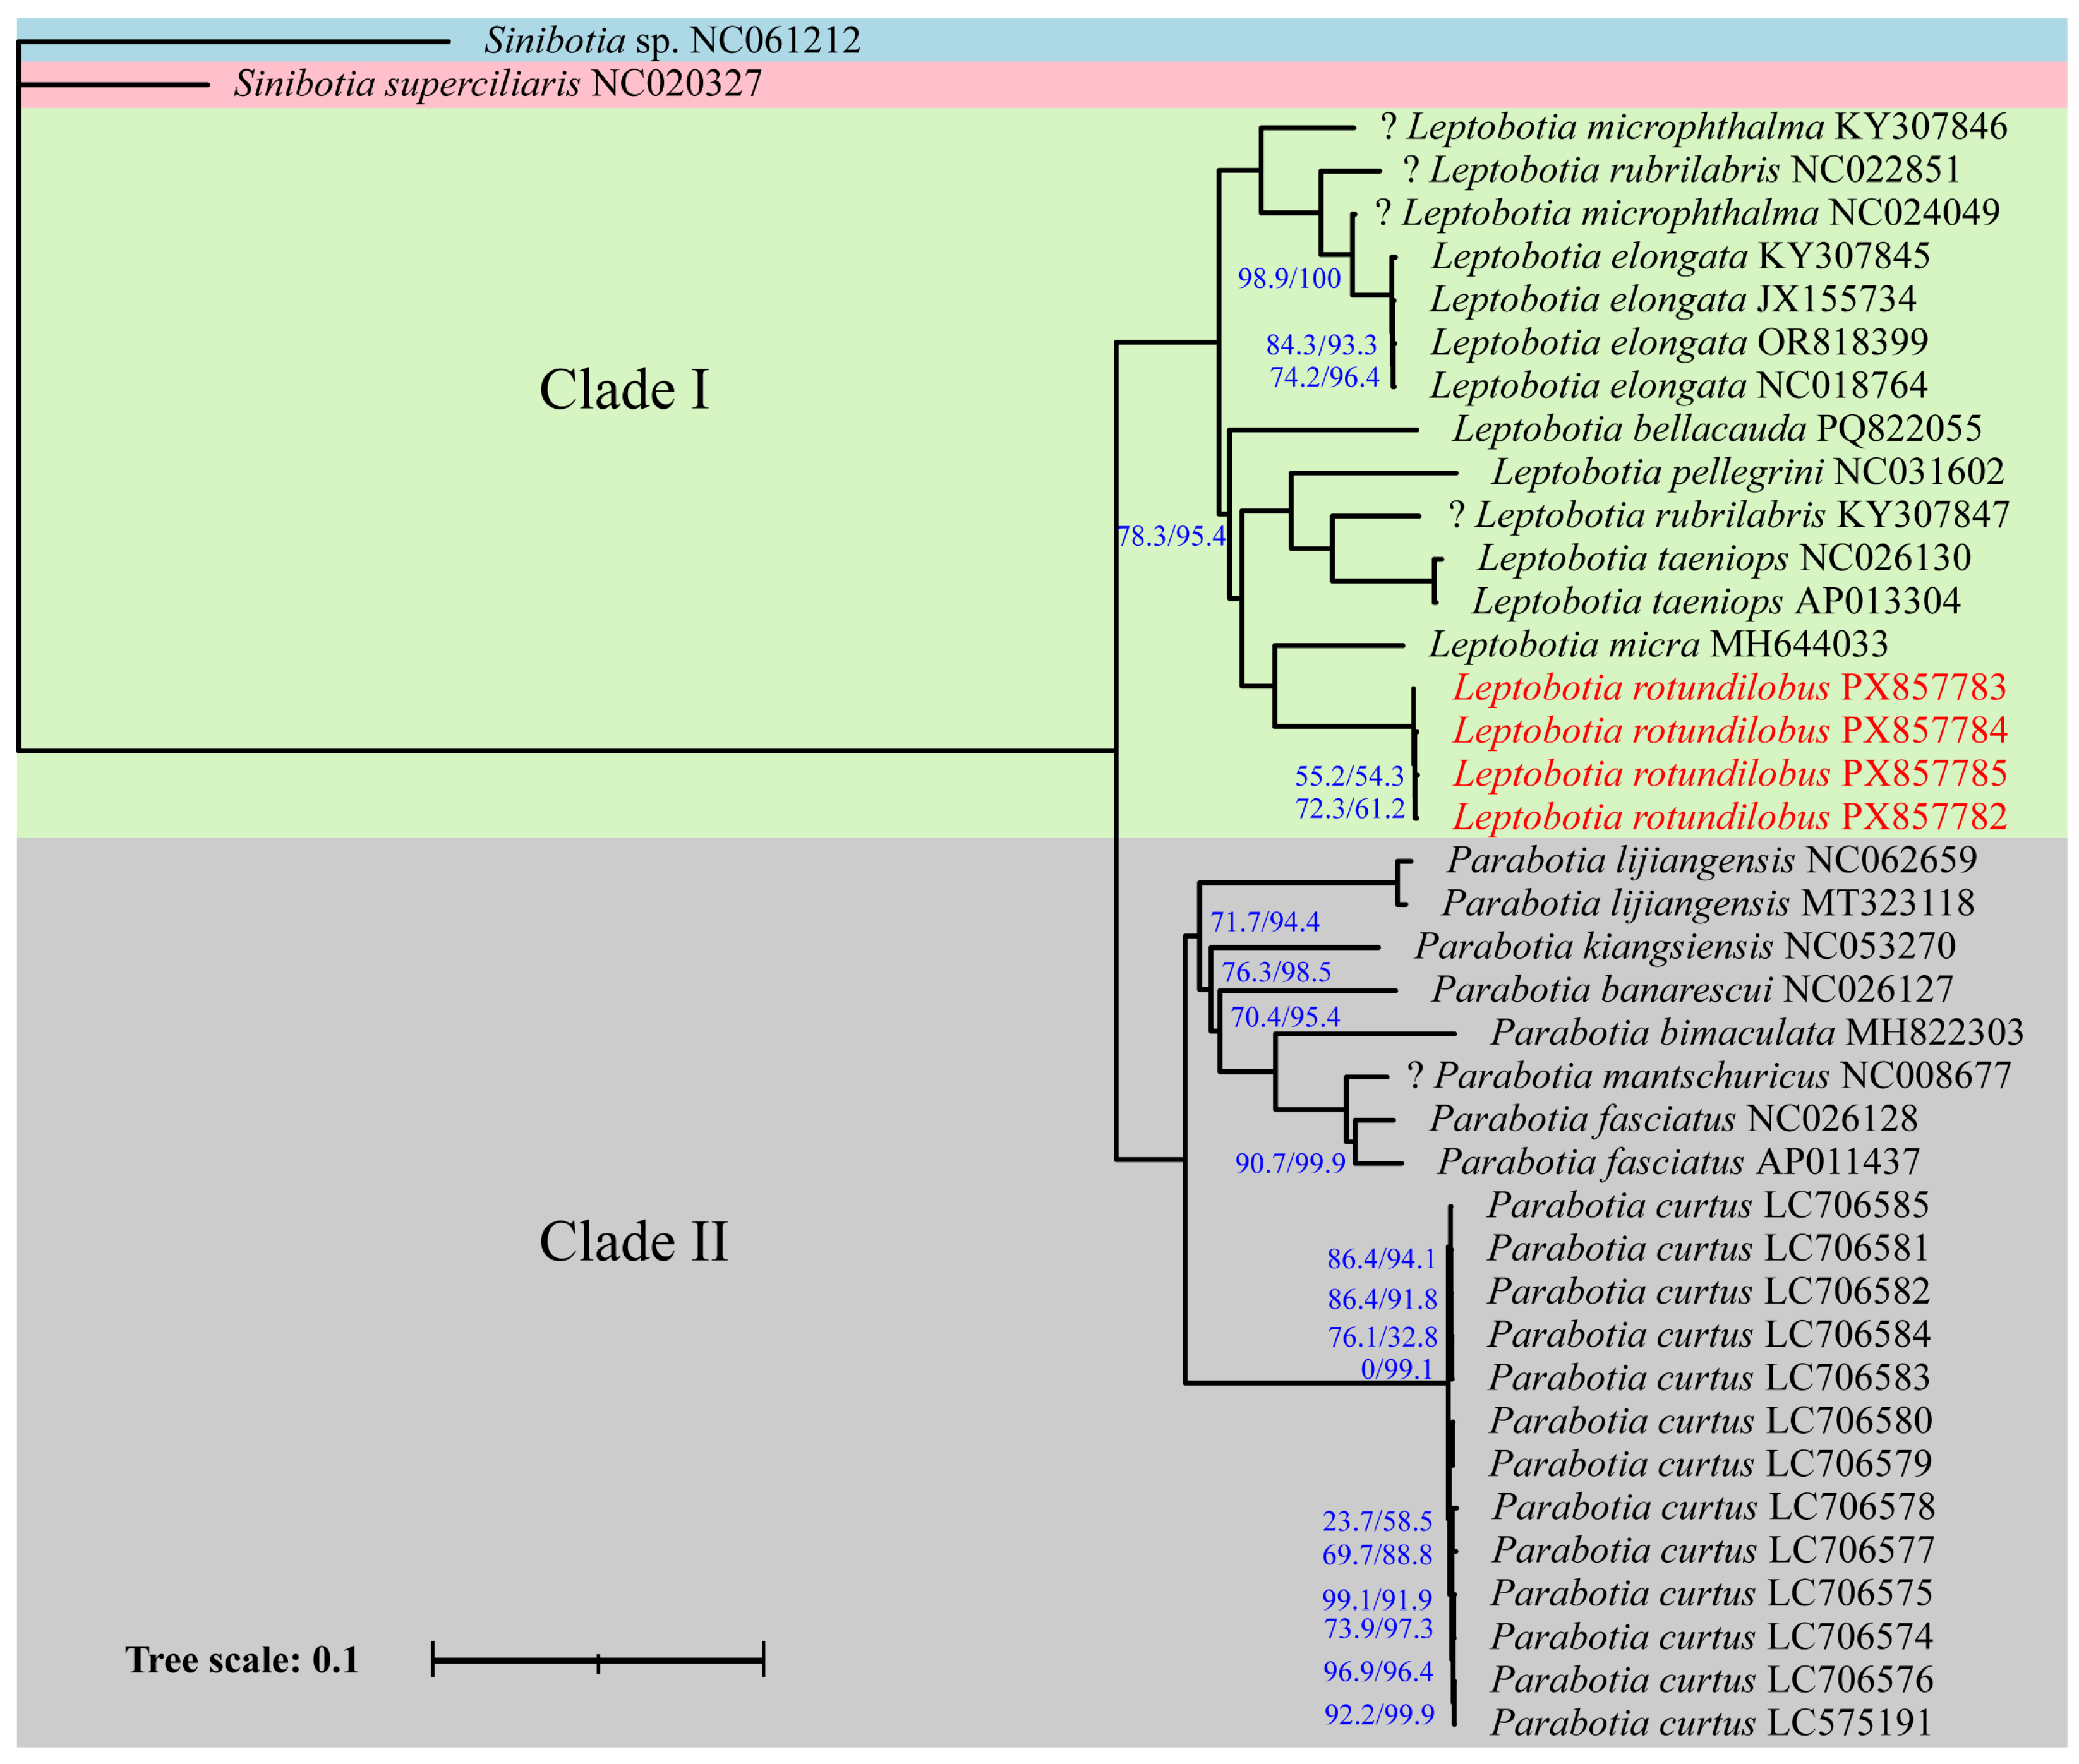
The phylogenetic trees reconstructed through both ML and BI analyses were congruent, exhibiting identical topologies (Figure 5 and Figure 6). In these trees, (1) the sequence previously identified as L. hengyangensis (NC061212)—now revised to Sinibotia sp.—clustered with the outgroup S. sinibotia; (2) all other Leptobotinae species, with the exception of Sinibotia sp. (NC061212), were consistently clustered into two major, well-supported clades (Clade I and Clade II), each receiving 100% nodal support. These clades correspond to distinct genera: Clade I comprises all Leptobotia sequences, while Clade II includes all Parabotia sequences, with Clade I being sister to Clade II. Furthermore, within Clade I, the four sequences of L. rotundilobus formed a single branch (100% node support) together with L. micra (MH644033)—a sequence previously misidentified as L. punctata—further reinforcing the revised taxonomic assignments.
It is worth noting that these phylogenetic trees consistently show several unreasonable aspects (Figure 5 and Figure 6): (1) the sequence-group L. elongata and the L. microphthalma (NC024049) sequence are clustered into a single branch with an abnormally close relationship and a smaller genetic distance between them (<0.01), but another sequence (KY307846) identified as L. microphthalma is clustered alone; (2) similarly, the sequence identified as L. rubrilabris (KY307847) and sequence-group L. taeniops sequences are clustered into a single branch with a genetic distance of approximately 0.038 between the two species, while L. rubrilabris (NC022851) clusters alone. In addition, the only P. mantschuricus sequence (NC008677) clusters first with two P. fasciatus sequences, but the genetic distance between the two species is approximately 0.02. The above results all show strong statistical support (100% bootstrap value).

4. Discussion

4.1. Mitogenome Characteristics and Analysis

The mitochondrial genome of L. rotundilobus exhibits a highly conserved architecture typical of vertebrate mitogenomes yet reveals nuanced features that contribute to our understanding of molecular evolution and adaptation in this fish genus. The closed circular 16,593 bp genome conforms to the standard gene complement of 37 genes. The pronounced A+T bias (55.2%), particularly elevated in the non-coding D-loop (66.2%), aligns perfectly with patterns reported in Leptobotinae species [31,32,33]. This A+T richness, a hallmark of teleost mitogenomes, likely influences DNA strand separation and replication efficiency. The strong anti-G bias, especially at the second and third codon positions, further underscores a distinct mutational pressure or selective constraint shaping nucleotide composition.
Codon usage analysis reveals a preference for A-ending synonymous codons, exemplified by the high RSCU values for CUA, UCA, and CGA. This bias is a direct consequence of the overall A+T compositional skew and highlights the role of mutational pressure over translational selection in shaping the mitochondrial genetic code. The amino acid profile, dominated by Leucine and depleted in Cysteine, reflects the hydrophobic nature of proteins embedded in the inner mitochondrial membrane. The extreme disparity in amino acid content—Leucine at over 16% and Cysteine below 1%—reflects deep selective constraints at the protein level. Leucine is a common, hydrophobic amino acid critical for protein folding and core stability. Its high frequency may relate to the proteins’ structural demands. Conversely, Cysteine is the least abundant due to its reactive thiol group, which can cause oxidative damage or require precise positioning (e.g., in disulfide bonds). Its rarity is often a signature of strong purifying selection to avoid detrimental structural or chemical consequences. This amino acid-level selection directly shapes which synonymous codons are available for use.
As a newly described species with a limited distribution, small population size, and high dissolved oxygen requirements, it remains understudied beyond its initial taxonomic description. Consequently, sequencing and characterizing its mitochondrial genome are of significant value, as such data can provide crucial insights for strengthening conservation strategies and informing management efforts for this vulnerable species.
Analysis of all 13 PCGs revealed that the Ka/Ks ratios in Leptobotinae are universally much lower than 1 (0.012–0.063). This demonstrates the dominant role of strong purifying selection (negative selection) in maintaining the functional integrity of these genes [34]. Purifying selection effectively removes deleterious non-synonymous mutations, ensuring the functional stability of core mitochondrial respiratory chain complexes, such as CYTB. Purifying selection is a typical evolutionary feature of functionally conserved regions. Its intensity varies among different genes. For example, CYTB exhibits a low ratio of non-synonymous to synonymous substitutions (dN/dS), which aligns with its known central role in the electron transport chain. As a key component of the mitochondrial respiratory chain (Complex III, Ubiquinol–cytochrome c reductase), CYTB is encoded by the mitochondrial genome and is central to the electron transport chain. Variation within its functional transmembrane domains, which are essential for proton pumping and electron transfer, can have severe impacts on an organism’s aerobic energy metabolism. Consequently, CYTB is under exceptionally strong evolutionary constraints to preserve its vital function [35,36].
Among all mitochondrial genes, ND6 shows a relatively higher Ka/Ks ratio (0.063), and the phenomenon is very common among fish mitochondrial genomes, such as the subfamily Acrossocheilinae [6,20,37,38]. As the only PCG encoded by the mitochondrial light strand (L-strand), its elevated evolutionary rate may stem from mutation patterns unique to this strand or relatively relaxed functional constraints. Nonetheless, its ratio remains significantly below 1, indicating that purifying selection pressure is still present. Future research needs to conduct a site-specific analysis to explore whether it has experienced relaxed or positive selection in particular regions.

4.2. Genetic Diversity Within L. rotundilobus

In this study, the four mitogenome sequences of L. rotundilobus from three small tributaries of the Xin’an River revealed four haplotypes. The genetic distance between haplotypes was less than 0.014%, which is substantially lower than typical interspecific distances. A phylogenetic tree showed that the two samples collected from the same tributary (the upper Shuaishui River), with a relatively close geographic distance (less than 20 km), shared the closest genetic relationship. The other two samples, collected from two nearby streams located farther from the upper Shuaishui River, were more distantly related. This pattern suggests a potential correlation with their geographic origins (sampling tributaries). Further sampling is required to confirm this geographic differentiation of the species.

4.3. Phylogenetic Analysis

Phylogenetic analysis not only facilitates the taxonomic placement of newly discovered specimens (e.g., genus or species) but, more fundamentally, elucidates evolutionary relationships, divergence histories, and patterns of common descent among broader lineages within more inclusive clades. In this study, the phylogenetic trees consistently indicate that L. rotundilobus is most closely related to L. micra (MH644033) with high node support. It must be clarified that MH644033 was previously misidentified as L. punctata. When we conducted phylogenetic analysis based on this, we found that the results contradicted those reported in the original literature describing L. rotundilobus [8]. In that study [8], a Bayesian inference tree inferred from concatenated COI + CYTB genes for 18 analyzed species of Leptobotia reveals that L. rotundilobus is most closely related to L. micra. The tree also shows that L. punctata occupies the most basal position, indicating that L. rotundilobus and L. punctata are not sister taxa among the species examined [8]. To resolve this phylogenetic discordance, we employed a multi-faceted approach integrating evidence from morphology, genetics, and geographic distribution as follows: (1) The collection locations of these L. punctata specimens [8] are within the same water system as the type locality [38] (Table S5). In contrast, sequence MH644033 lacks supporting collection or morphological data in GenBank. Particularly noteworthy is that L. punctata possesses a distinctive body coloration and is the only species within the genus Leptobotia that exhibits irregularly scattered white spots across its body surface [38]. We asked the authors of the two studies [7,8], and they provided original color images of the specimens used in L. punctata, which are consistent with those in the original description of L. punctata [38]. Therefore, we believe that MH644033 is not L. punctata. (2) Similarly, the collection location of the L. micra specimen reported in [8] is within the same water system near the type locality [6] (Table S5). By contacting the authors [8], we examined the morphology of this voucher specimen. A combination of its characteristics distinguishes it from all other species of Leptobotia, which is consistent with the original description [6]. Therefore, the species identification of this specimen is correct. (3) Subsequently, we downloaded the mitochondrial data (COI + CYTB genes) for L. micra and L. punctata from the paper [8] (Table S5) and constructed a Neighbor-joining tree (NJ-tree) based on the K2P model using MEGA 12.09 [21] (Figure S3). The NJ-tree shows that MH64403 forms a well-supported clade with the authenticated L. micra sequences (100% support), separate from the L. punctata clade. The K2P genetic distance between MH64403 and L. micra is 0.475%, while that between MH64403 and L. punctata is about 11.9% (Table S6). (4) Moreover, the two species (L. rotundilobus and L. punctata) are distributed in geographically distant regions: the Xin’an River and Cao’e River in eastern China, and the Pearl River basin in southwestern China [8,38]. Leptobotia micra is found in the upper reaches of the Lijiang, Xiangjiang, and Ganjiang rivers [6], with its distribution range situated between those of L. rotundilobus and L. punctata. That is to say, the distribution of the three species also supports that MH64403, which is closely related to L. rotundilobus in our study, is more likely to be L. micra rather than L. punctata. In summary, we believe that the voucher specimen of the sequence MH644033 has been misidentified, and the correct species should be L. micra.
Similarly, the sequence NC061212, which clustered with the outgroup S. sinibotia, was found to be labeled in GenBank as L. hengyangensis, an identification unsupported by any associated collection or morphological data. The anomalous phylogenetic results prompted us to conduct further analysis. We conducted an online BLASTn (https://blast.ncbi.nlm.nih.gov, accessed on 1 February 2026) search in GenBank, and the sequence NC061212 showed 98.41% similarity to Sinibotia pulchra (NC033950). This indicates that there is likely a species identification error for NC061212. We also found that all other DNA sequences (involving COI and CYTB genes) in GenBank labeled as L. hengyangensis come from the aforementioned two studies [7,8]. By contacting the authors of the relevant studies [7,8], we examined two specimens from the type locality that had been identified as L. hengyangensis in those papers (Table S5) and confirmed that their morphology is consistent with the original description [39]. This indicates that the two specimens are precisely L. hengyangensis. The genetic distance between NC061212 and the two specimens based on the mitochondrial data from GenBank is 19.98% and 20.41% (Table S6), respectively. The above analyses confirm misidentification of NC061212, which is likely Sinibotia pulchra.
Additionally, the phylogenetic trees in this study also revealed another problematic aspect: based on common sense, at least one sequence from each species—L. microphthalma and L. rubrilabris—has been misidentified, as sequences labeled as the same species clustered into different phylogenetic branches. Notably, all four species in question are distributed in the upper Yangtze River basin. Among them, three species—L. elongata, L. rubrilabris, and L. microphthalma—are primarily found in the upper Yangtze, while L. taeniops is widely distributed in both the Yangtze River and Huai River basins. Given their close genetic relationship, this raises the question of whether they might be recently diverged species. Addressing this question requires a more in-depth analysis that integrates comprehensive information, such as phylogenetic history, geographical distribution patterns, and morphological differentiation within the genus Leptobotia. Such an approach would help clarify their divergence time, driving forces, and speciation mechanisms, thereby providing more substantial evidence for understanding the evolutionary history and biodiversity formation within this group. In conclusion, aside from NC061212, which was misidentified as L. hengyangensis, all Leptobotia species form a monophyletic group within Clade I, consistent with several previous studies [3,40].
In Clade II, we note that the only available P. mantschuricus sequence (NC008677) exhibited high genetic similarity to the two P. fasciatus sequences, with a K2P distance of approximately 0.02. This value is below the typical interspecific threshold for fish. This outcome could be attributed to several reasons: (1) they may be recently diverged species, which is the most likely scenario; (2) there may be an error in the species identification of this sequence; (3) the validity of the related species itself might be questionable, although this possibility is very small. Nevertheless, the seven Parabotia species form a monophyletic group within Clade II, consistent with several previous studies [3,40,41].
Current knowledge of mitochondrial genomes within Leptobotinae remains limited, with only a few species characterized to date. To clarify the phylogenetic relationships among genera such as Leptobotia and Parabotia, further studies with more comprehensive taxon sampling are essential. Based on the species misidentification issues revealed in the phylogenetic analysis, we recommend that species identification relying on sequences uploaded to public databases should be supported by clear specimen images along with key measurable and countable morphological traits.

5. Conclusions

This study first presents the complete mitochondrial genome of L. rotundilobus, confirming its typical vertebrate structure and a strong A+T bias. Phylogenetic analyses robustly place L. rotundilobus as most closely related to L. micra and support the monophyly of the genera Leptobotia and Parabotia. The findings clarify the species’ phylogenetic position but also reveal potential misidentifications in public databases, underscoring the need for integrated taxonomic approaches. Future studies with broader sampling are required to fully resolve the evolutionary history of Leptobotinae.

Supplementary Materials

The following supporting information can be downloaded at: https://www.mdpi.com/article/10.3390/fishes11030162/s1. Figure S1: The structure and sequence of the control region of the Leptobotia rotundilobus mitochondrial genome; Figure S2: Stem-loop structure of L-strand replication initiation region of Leptobotia rotundilobus; Figure S3: Neighbor-joining tree based on mitochondrial COI + CYTB genes (Nodal numbers represent support values); Table S1: Sequences of primers used in amplification of mitochondrial CYTB and D-loop in Leptobotia rotundilobus. Table S2: The obtained next-generation sequencing data of Leptobotia rotundilobus in the study; Table S3: The Scaffold1 information for assembling the Leptobotia rotundilobus mitogenome in the study; Table S4: The pairwise Kimura 2-parameter genetic distance (%) of four Leptobotia rotundilobus sequences in the study; Table S5: Detailed information of specimens used in the study from the original description of Leptobotia rotundilobus; Table S6: The pairwise Kimura 2-parameter genetic distance (%) of 8 concatenated sequences.

Author Contributions

Conceptualization, Y.H.; Methodology, Y.H. and H.Z.; Funding acquisition, G.D.; Investigation, G.D. and H.Z.; Methodology, Y.H.; Resources, G.D.; Software, Y.H., H.W. and A.L.; Validation, Y.H.; Writing—original draft, Y.H. All authors have read and agreed to the published version of the manuscript.

Funding

This research was funded by Anhui Aquatic Industry Technology System (approved by the Department of Agriculture and Rural Affairs of Anhui Province [2021] No. 711); Monitoring of aquatic resources in key waters of Anhui province (No. 2024BFAFZ02936).

Institutional Review Board Statement

The animal study protocol was approved by the Institutional Review Board (Ethics Committee) of Anhui Academy of Agricultural Sciences (protocol code AAAS 2025-21 and date of approval 15 August 2025).

Data Availability Statement

The four mitogenome sequences of L. rotundilobus generated in this study have been deposited in GenBank (accession number: PX857782–PX857785).

Acknowledgments

We sincerely thank all those who contributed to this research. I am particularly grateful to Lin Y. for their invaluable assistance in specimen collection and for providing essential fish photographs, which greatly supported this study.

Conflicts of Interest

The authors declare no conflicts of interest.

References

  1. Kottelat, M.; Chu, X.L. The Botiinae loaches (Osteichthyes: Cobitidae) of the Lancangjiang (upper Mekong) with description of a new species. Zool. Res. 1987, 8, 393–400. [Google Scholar]
  2. Slechtova, V.; Bohlen, J.; Freyhof, J.; Rab, P. Molecular phylogeny of the southeast Asian freshwater fish family Botiidae (Teleostei: Cobitoidea) and the origin of polyploidy in their evolution. Mol. Phylogenet. Evol. 2006, 39, 529–541. [Google Scholar] [CrossRef]
  3. Tang, Q.Y.; Xiong, B.X.; Yang, X.P.; Liu, H.Z. Phylogeny of the east Asian Botiine loaches (Cypriniformes, Botiidae) inferred from mitochondrial cytochrome b gene sequences. Hydrobiologia 2005, 544, 249–258. [Google Scholar] [CrossRef]
  4. Kottelat, M. Conspectus Cobitinum: An inventory of the loaches of the world (Teleostei: Cypriniformes: Cobitoidei). Raffles Bull. Zool. 2012, 26, 1–199. [Google Scholar]
  5. Bohlen, J.; Šlechtová, V. Leptobotia bellacauda, a new species of loach from the lower Yangtze basin in China (Teleostei: Cypriniformes: Botiidae). Zootaxa 2016, 4205, 65–72. [Google Scholar] [CrossRef] [PubMed]
  6. Bohlen, J.; Šlechtová, V. Leptobotia micra, a new species of loach (Teleostei: Botiidae) from Guilin, southern China. Zootaxa 2017, 4250, 90–100. [Google Scholar] [CrossRef] [PubMed]
  7. Guo, D.M.; Zhang, E. Re-description of the loach species Leptobotia citrauratea (Teleostei, Botiidae), with the description of L. brachycephala from southern Zhejiang Province, China. ZooKeys 2021, 1017, 89–109. [Google Scholar] [CrossRef]
  8. Guo, D.M.; Cao, L.; Zhang, E. Descriptions of two new species of the Botiid genus Leptobotia Bleeker, 1870 (Teleostei: Cypriniformes) from South China. J. Fish Biol. 2023, 104, 433–449. [Google Scholar] [CrossRef]
  9. Wang, H.Y. On a new Cobitid fish of the genus Leptobotia from Beijing. Mem. Beijing Nat. Hist. Mus. 1981, 12, 1–3. [Google Scholar]
  10. Xu, T.Q.; Fang, S.M.; Wang, H.Y. A new species of fishes of the genus Leptobotia (family Cobitidae) from China. Zool. Res. 1981, 2, 379–381. [Google Scholar]
  11. Tang, Q.Y.; Yu, D.; Liu, H.Z. Leptobotia zebra should be revised as Sinibotia zebra (Cypriniformes: Botiidae). Zool. Res. 2008, 29, 1–9. [Google Scholar] [CrossRef]
  12. Mao, J.R.; Xu, S.S. Fauna of Zhejiang: Freshwater Fishes; Zhejiang Science and Technology Publishing House: Hangzhou, China, 1991; p. 151. [Google Scholar]
  13. Chen, S.F.; Zhou, Y.Q.; Chen, Y.R.; Gu, J. Fastp: An ultra-fast all-in-one FASTQ preprocessor. Bioinformatics 2018, 34, i884–i890. [Google Scholar] [CrossRef]
  14. Bankevich, A.; Nurk, S.; Antipov, D.; Gurevich, A.A.; Dvorkin, M.; Kulikov, A.S.; Lesin, V.M.; Nikolenko, S.I.; Pham, S.; Prjibelski, A.D. SPAdes: A new genome assembly algorithm and its applications to single-cell sequencing. J. Comput. Biol. 2012, 19, 455–477. [Google Scholar] [CrossRef]
  15. Wick, R.R.; Schultz, M.B.; Zobel, J.; Holt, K.E. Bandage: Interactive visualization of de novo genome assemblies. Bioinformatics 2015, 31, 3350–3352. [Google Scholar] [CrossRef]
  16. Boetzer, M.; Pirovano, W. Toward almost closed genomes with GapFiller. Genome Biol. 2012, 13, R56. [Google Scholar] [CrossRef] [PubMed]
  17. Walker, B.J.; Abeel, T.; Shea, T.; Priest, M.; Earl, A.M. Pilon: An Integrated Tool for Comprehensive Microbial Variant Detection and Genome Assembly Improvement. PLoS ONE 2014, 9, e112963. [Google Scholar] [CrossRef] [PubMed]
  18. Xiao, W.H.; Zhang, Y.P.; Liu, H.Z. Molecular systematics of Xenocyprinae (teleostei: Cyprinidae): Taxonomy, biogeography, and coevolution of a special group restricted in East Asia. Mol. Phylogenet. Evol. 2001, 18, 163–173. [Google Scholar] [CrossRef]
  19. Liu, H.Z.; Tzeng, C.S.; Teng, H.Y. Sequence variations in the mitochondrial DNA control region and their implications for the phylogeny of the Cypriniformes. Can. J. Zool. 2002, 80, 569–581. [Google Scholar] [CrossRef]
  20. Hu, Y.T.; Duan, G.Q.; Zhou, H.X.; Wang, H.; Liu, A.M. Unraveling the mitochondrial blueprint genome characterization and phylogenetic insights of the endemic Fish Onychostoma virgulatum (Teleostei Cyprinidae). Genes 2025, 16, 541. [Google Scholar] [CrossRef]
  21. Kumar, S.; Stecher, G.; Sanderford, M.; Sanderford, M.; Sharma, S.; Tamura, K. MEGA 12: Molecular evolutionary genetic analysis version 12 for adaptive and green computing. Mol. Biol. Evol. 2024, 41, msae263. [Google Scholar] [CrossRef]
  22. Iwasaki, W.; Fukunaga, T.; Isagozawa, R.; Yamada, K.; Maeda, Y.; Satoh, T.P.; Sado, T.; Mabuchi, K.; Takeshima, H.; Miya, M.; et al. MitoFish and MitoAnnotator: A mitochondrial genome database of fish with an accurate and automatic annotation pipeline. Mol. Biol. Evol. 2013, 30, 2531–2540. [Google Scholar] [CrossRef]
  23. Zhao, D.; Ye, T.; Gao, F.L.; Jakovlić, I.; La, Q.; Tong, Y.D.; Liu, X.; Song, R.; Liu, F.; Lian, Z.M.; et al. PhyloSuite v2: The Development of an All-in-One, Efficient and Visualization-Oriented Suite for Molecular Dating Analysis and Other Advanced Features. iMeta 2025, 4, e70095. [Google Scholar] [CrossRef]
  24. Tang, Q.Y.; Liu, H.Z.; Yang, X.P.; Xiong, B.X. Studies on the structure of the mitochondrial DNA control region and phylogenetic relationships of the subfamily Botiinae. Acta Hydrobiol. Sin. 2005, 29, 645–653. [Google Scholar] [CrossRef]
  25. Rozas, J.; Ferrer-Mata, A.; Sánchez-DelBarrio, J.C.; Guirao-Rico, S.; Librado, P.; Ramos-Onsins, S.E.; Sánchez-Gracia, A. DnaSP 6: DNA Sequence Polymorphism Analysis of Large Data Sets. Mol. Biol. Evol. 2017, 34, 3299–3302. [Google Scholar] [CrossRef]
  26. Katoh, K.; Misawa, K.; Kuma, K.I.; Miyata, T. MAFFT: A novel method for rapid multiple sequence alignment based on fast Fourier transform. Nucleic Acids Res. 2002, 30, 3059–3066. [Google Scholar] [CrossRef]
  27. Vincent, L.; Jean-Emmanuel, L.; Olivier, G. SMS: Smart model selection in PhyML. Mol. Biol. Evol. 2017, 34, 2422–2424. [Google Scholar] [CrossRef]
  28. Kalyaanamoorthy, S.; Minh, B.Q.; Wong, T.K.F.; Haeseler, A.V.; Jermiin, L.S. ModelFinder: Fast model selection for accurate phylogenetic estimates. Nat. Methods 2017, 14, 587–589. [Google Scholar] [CrossRef]
  29. Nguyen, L.T.; Schmidt, H.A.; von Haeseler, A.; Minh, B.Q. IQ-TREE: A fast and effective stochastic algorithm for estimating maximum-likelihood phylogenies. Mol. Biol. Evol. 2015, 32, 268–274. [Google Scholar] [CrossRef]
  30. Ronquist, F.; Teslenko, M.; van der Mark, P.; Ayres, D.L.; Darling, A.; Höhna, S.; Larget, B.; Liu, L.; Suchard, M.A.; Huelsenbeck, J.P. MrBayes 3.2: Efficient Bayesian phylogenetic inference and model choice across a large model space. Syst. Biol. 2012, 61, 539–542. [Google Scholar] [CrossRef]
  31. Ke, Z.; Zhou, K.; Hou, M.; Luo, H.; Li, Z.; Pan, X.; Zhou, J.; Jing, T.; Ye, H. Characterization of the complete mitochondrial genome of the elongate Loach and its phylogenetic implications in Cobitidae. Animals 2023, 13, 3841. [Google Scholar] [CrossRef]
  32. Tian, H.W.; Wang, D.Q.; Jia, X.Y.; Duan, X.B.; Chen, D.Q. The mitogenome of Leptobotia microphthalma (Teleostei, Cypriniformes: Cobitidae). Mitochondrial DNA 2014, 25, 261–262. [Google Scholar] [CrossRef]
  33. Wei, M.; Yu, P.; Yang, Y.Y. The complete mitochondrial genome of Leptobotia taeniaps (Cypriniformes: Cobitidae). Mitochondrial DNA Part A 2016, 27, 1707–1708. [Google Scholar] [CrossRef]
  34. Pond, S.L.K.; Poon, A.F.Y.; Frost, S.D.W. Estimating selection pressures on alignments of coding sequences. In The Phylogenetic Handbook: A Practical Approach to Phylogenetic Analysis and Hypothesis Testing, 2nd ed.; Lemey, P., Salemi, M., Vandamme, A.M., Eds.; Cambridge University Press: Cambridge, UK, 2009; pp. 419–490. [Google Scholar]
  35. Liang, C.; Zhang, S.; Robinson, D.; Ploeg, M.V.; Wilson, R.; Nah, J.; Taylor, D.; Beh, S.; Lim, R.; Sun, L.; et al. Mitochondrial microproteins link metabolic cues to respiratory chain biogenesis. Cell Rep. 2022, 40, 111204. [Google Scholar] [CrossRef]
  36. Gissi, C.; Iannelli, F.; Pesole, G. Evolution of the mitochondrial genome of Metazoa as exemplified by comparison of congeneric species. Heredity 2008, 101, 301–320. [Google Scholar] [CrossRef] [PubMed]
  37. Zhao, D.; Guo, Y.; Gao, Y. Natural selection drives the evolution of mitogenomes in Acrossocheilus. PLoS ONE 2022, 17, e0276056. [Google Scholar] [CrossRef] [PubMed]
  38. Li, J.; Li, X.H.; Chen, X.L. A new species of the genus Leptobotia from Guangxi, China (Cypriniformes Cobitidae). Acta Zootaxon. Sin. 2008, 33, 630–633. [Google Scholar]
  39. Huang, H.J.; Zhang, W. Description on three new species of fishes from the Changjiang River, China. Acta Hydrobiol. Sin. 1986, 10, 99–100. [Google Scholar]
  40. Xu, R.R.; Liu, S.Y.; Wang, Y.M.; Li, Y.P.; Xie, B.W.; Peng, Z.G. Origin and evolution of botiid loaches (Teleostei: Cypriniformes: Botiidae). J. Fish. China 2025, 49, 029116. [Google Scholar] [CrossRef]
  41. Shen, Y.; Wang, J.; Zhang, F. Complete mitochondrial genome of Parabotia bimaculata (Cypriniformes: Cobitidae: Botiinae), an endemic riverine loach in China and phylogenetic analysis for Botiinae. Thalassas 2020, 36, 387–393. [Google Scholar] [CrossRef]
Figure 1. The appearance of Leptobotia rotundilobus.
Fishes 11 00162 g001
Figure 2. Circular map of the mitochondrial genome of L. rotundilobus. It shows three tracks (from inside out): GC content, sequencing depth, and genes. In the outermost gene track, inner arcs indicate genes on the Light strand, and outer arcs indicate genes on the Heavy strand. Arrow represents the replication direction of the light chain.
Fishes 11 00162 g002
Figure 3. Amino acid content (top number, %) and RSCU (internal numbers) of L. rotundilobus mitochondrial PCGs. Only RSCU values greater than 1 are displayed.
Fishes 11 00162 g003
Figure 4. The mean nonsynonymous (Ka) (red bar), synonymous substitutions (Ks), and Ka/Ks values (green bar) in the 13 PCGs of 16 Leptobotinae species.
Fishes 11 00162 g004
Figure 5. Phylogenetic tree of Leptobotinae based on 13 PCGs using maximum likelihood (ML) and Bayesian (BI) analysis. GenBank accession numbers follows the species name. The blue numbers at the nodes represent ML (left) and BI (right) support values and nodes without numbers indicate 100% support. ? preceding taxon names indicate sequences whose species identification is inconsistent with their phylogenetic position, suggesting potential misidentification. The assembled mitogenome of L. rotundilobus in the study was highlighted in red. The green and gray areas of phylogenetic tree represent Clade I and Clade II, respectively.
Fishes 11 00162 g005
Figure 6. Phylogenetic tree of Leptobotinae based on the mitogenome using maximum likelihood (ML) and Bayesian (BI) analysis. GenBank accession numbers follows the species name. The blue numbers at the nodes represent ML (left) and BI (right) support values, and nodes without numbers indicate 100% support. ? preceding taxon names indicate sequences whose species identification is inconsistent with their phylogenetic position, suggesting potential misidentification. The assembled mitogenome of L. rotundilobus in the study was highlighted in red. The green and gray areas of phylogenetic tree represent Clade I and Clade II, respectively.
Fishes 11 00162 g006
Table 1. Information on the 40 mitogenome sequences of Leptobotinae used in this study.
NO.SpeciesAuthorAccession NO.Size (bp)AT%AT-SkewGC-Skew
1Leptobotia bellacaudaBohlen & Slechtová, 2016PQ82205516,59155.00.113−0.272
2Leptobotia elongata(Bleeker, 1870)JX15573416,58955.60.109−0.272
KY30784516,59155.50.109−0.272
NC01876416,59155.60.108−0.272
OR81839916,59155.60.108−0.272
3Leptobotia microphthalmaFu & Ye, 1983KY30784616,59455.50.111−0.275
NC02404916,51255.60.109−0.274
4Leptobotia pellegriniFang, 1936NC03160216,59555.50.117−0.281
5Leptobotia micraBohlen & Šlechtová, 2017MH64403316,59355.80.107−0.271
6Leptobotia rotundilobusGuo, Cao & Zhang, 2023PX857782 *16,59355.20.115−0.276
PX857783 *16,59355.20.115−0.276
PX857784 *16,59355.20.115−0.277
PX857785 *16,59355.20.115−0.276
7Leptobotia rubrilabris(Dabry de Thiersant, 1872)KY30784716,59455.60.111−0.274
NC02285116,58555.90.109−0.272
8Leptobotia taeniops(Sauvage, 1878)AP01330416,59256.10.109−0.274
NC02613016,59256.10.109−0.274
9Parabotia banarescui(Nalbant, 1965)NC02612716,59056.40.100−0.266
10Parabotia bimaculataChen, 1980MH82230316,58856.10.099−0.267
11Parabotia curtus(Temminck & Schlegel, 1846)LC57519116,58957.20.100−0.272
LC70657416,58957.20.100−0.272
LC70657516,58957.30.100−0.272
LC70657616,58957.20.100−0.272
LC70657716,59057.30.100−0.273
LC70657816,58957.30.100−0.271
LC70657916,58957.20.099−0.271
LC70658016,58957.20.099−0.271
LC70658116,58957.10.100−0.272
LC70658216,58957.10.100−0.271
LC70658316,58957.10.100−0.271
LC70658416,58957.10.100−0.271
LC70658516,58957.20.099−0.271
12Parabotia fasciatusDabry de Thiersant, 1872AP01143716,58656.90.093−0.263
NC02612816,59057.10.095−0.267
13Parabotia kiangsiensisLiu & Guo, 1986NC05327016,59255.80.099−0.263
14Parabotia lijiangensisChen, 1980MT32311816,59556.00.099−0.267
NC06265916,59556.10.098−0.266
15Parabotia mantschuricus
(Leptobotia mantschurica)
(Berg, 1907)NC00867716,58857.10.094−0.266
16Sinibotia sp.
(Leptobotia hengyangensis)
NC06121216,56857.30.085−0.264
17Sinibotia superciliarisGünther, 1892NC02032716,57257.10.106−0.267
Note: * the sequence obtained in this study; ( ) junior synonym.
Table 2. Composition and structure of L. rotundilobus mitochondrial genome.
NO.GenesLocation (bp)Size (bp)Intergenic Spacer (bp)Coding StrandCondon
StartEnd
1tRNA-Phe1–69690H
212S rRNA70–10239540H
3tRNA-Val1024–1095720H
416S rRNA1096–277816830H
5tRNA-Leu2779–2853750H
6ND12854–38289758HATGTAA
7tRNA-Ile3837–390872−2H
8tRNA-Gln3977–3907711L
9tRNA-Met3979–4047690H
10ND24048–509310450HATGTA-
11tRNA-Trp5094–5162692H
12tRNA-Ala5233–5165691L
13tRNA-Asn5307–52357330L
14tRNA-Cys5403–5338661L
15tRNA-Tyr5475–5405711L
16COX15477–702715511HGTGTAA
17tRNA-Ser7099–7029712L
18tRNA-Asp7102–71747313H
19COX27188–78786910HATGT--
20tRNA-Lys7879–7954761H
21ATP87956–8123168−10HATGTAA
22ATP68114–8797684−1HATGTAA
23COX38797–95817850HATGTA-
24tRNA-Gly9582–9653720H
25ND39654–10,0023490HATGT--
26tRNA-Arg10,003–10,072700H
27ND4L10,073–10,369297−7HATGTAA
28ND410,363–11,74413820HATGTA-
29tRNA-His11,745–11,814700H
30tRNA-Ser11,815–11,881671H
31tRNA-Leu11,883–11,955730H
32ND511,956–13,7941839−4HATGTAA
33ND614,312–13,7915220LATGTAA
34tRNA-Glu14,381–14,313694L
35CYTB14,386–15,52611410HATGT--
36tRNA-Thr15,527–15,59872−2H
37tRNA-Pro15,666–15,597700L
38D-loop15,667–16,5939270H
Note: H is Heavy strand and L is Light strand; incomplete stop codons are denoted by a hyphen and are completed via mRNA polyadenylation.
Table 3. Nucleotide composition of different regions of L. rotundilobus.
RegionsSize (bp)T (U)CAGAT (%)AT-SkewGC-Skew
PCGs11,42126.429.628.415.654.80.037−0.309
PCGs-1st380720.726.526.925.947.60.129−0.011
PCGs-2nd380740.227.718.513.658.7−0.37−0.341
PCGs-3rd380718.334.4407.258.30.371−0.652
ATP668427.330.627.614.554.90.005−0.357
ATP816825.030.432.112.557.10.125−0.417
COX1155128.527.125.918.454.4−0.047−0.191
COX269126.828.129.215.956.00.044−0.276
COX378525.930.226.917.152.80.019−0.278
CYTB114126.830.128.314.755.10.027−0.344
ND197524.931.129.614.454.50.086−0.368
ND2104620.634.333.112.053.70.234−0.480
ND334928.430.926.614.055.0−0.031−0.376
ND4138225.330.031.313.456.60.105−0.383
ND4L29727.930.023.918.251.8−0.078−0.245
ND5183924.331.631.013.155.30.123−0.414
ND652242.312.313.032.455.3−0.5290.451
16S rRNA168319.724.435.920.055.60.293−0.098
12S rRNA95418.727.530.723.249.40.244−0.085
tRNAs155925.622.628.423.454.00.0520.017
D-loop92731.119.635.114.266.20.060−0.160
Full genome16,59324.428.630.816.255.20.115−0.276
Disclaimer/Publisher’s Note: The statements, opinions and data contained in all publications are solely those of the individual author(s) and contributor(s) and not of MDPI and/or the editor(s). MDPI and/or the editor(s) disclaim responsibility for any injury to people or property resulting from any ideas, methods, instructions or products referred to in the content.