Article

Evaluation of Active and Passive Sampling Methods for Detecting eDNA of Atlantic Salmon (Salmo salar) and Its Lethal Ectoparasite (Gyrodactylus salaris) in the Sande River, Norway

Department of Microsystems, University of South-Eastern Norway, Raveien 215, 3184 Borre, Norway
*
Authors to whom correspondence should be addressed.
Fishes 2026, 11(2), 101; https://doi.org/10.3390/fishes11020101
Submission received: 23 December 2025 / Revised: 30 January 2026 / Accepted: 2 February 2026 / Published: 7 February 2026

Abstract

Early detection and effective monitoring of aquatic environments are essential for detecting and mitigating potential ecological threats to aquatic organisms and for ensuring the sustainable management of freshwater ecosystems. Passive sampling is an emerging approach for environmental DNA (eDNA) collection in aquatic systems while active sampling involves controlled collection and filtration of water. This study evaluates active and passive sampling methods in a riverine system for detecting eDNA from Atlantic salmon (Salmo salar) and its lethal ectoparasite Gyrodactylus salaris. Sampling was conducted in the Sande River, Vestfold County, Norway. The loop-mediated isothermal amplification (LAMP) method was employed due to its high efficiency and specificity for amplifying target genes. The selected genetic markers were mitochondrial cytochrome B (Cyt B) DNA for S. salar and cytochrome c oxidase 1 (COX1) for G. salaris. The results indicate that host eDNA was readily detected using both sampling methods, whereas detection of G. salaris was more effective using active sampling. These findings provide valuable insight into optimizing eDNA detection protocols for both host and parasite, demonstrating specificity and sensitivity of LAMP in detecting the target organisms. This case study contributes to the development of conservation strategies aimed at preserving Atlantic salmon populations and freshwater biodiversity.
Key Contribution: This study presents the first real-world comparison of active and passive eDNA sampling methods for detecting Atlantic salmon (Salmo salar) and its lethal ectoparasite (Gyrodactylus salaris) in a natural river system. By integrating these approaches with a rapid, highly specific LAMP-based assay, it establishes practical workflows for on-site detection and provides a foundation for future strategies to enhance freshwater monitoring and conservation.

1. Introduction

The pathogenic ectoparasite Gyrodactylus salaris [1], which primarily infects Atlantic salmon (Salmo salar), Rainbow trout (Oncorhynchus mykiss), and Arctic char (Salvelinus alpinus), has posed persistent challenges to Norway’s aquatic ecosystems for several decades [2]. Since its initial detection in Norway in 1975 [3], this parasite has been reported in numerous water bodies across the country, including rivers, hatcheries, and facilities housing susceptible fish species [2,4,5,6].
Atlantic salmon (Salmo salar) is of enormous economic and ecological importance in Norway. Meanwhile, infestation by G. salaris poses a significant threat to salmon populations, leading to devastating consequences for both the environment and the local economy. Therefore, the occurrence of G. salaris has been designated as a nationally listed notifiable disease in Norway, prompting continuous efforts to monitor its occurrence, control its spread, and, ultimately eradicate it [6,7]. As of 2022, significant progress has been made in combating G. salaris, with successful elimination recorded in 39 rivers, as well as all hatcheries and fish farms where it was once present. Despite these achievements, isolated pockets of infestation persist, with eight Norwegian waterways still confirmed positive for the parasite [6].
To realize the ultimate goal of complete eradication, it is crucial to maintain rigorous annual monitoring programmes. These programmes serve as crucial components in ongoing efforts to monitor, detect, and respond to any resurgence or spread of G. salaris. The standard approach for detecting and identifying G. salaris combines DNA barcoding with morphological and morphometric analyses. Central to molecular methodologies is the use of DNA barcoding targeting two distinct genetic regions: the ribosomal internal transcribed spacer region (ITS1 and ITS2) and the mitochondrial cytochrome c oxidase subunit 1 (COX1) gene [2,8,9]. These regions, known for their high interspecific variability, serve as reliable molecular markers. Conventional approaches for assessing biodiversity in aquatic environments often entail invasive, resource-intensive, or time-consuming procedures. However, environmental DNA (eDNA) analysis has emerged as a powerful tool in ecological research, enabling detection of genetic material shed by various organisms into their environment [10,11,12,13,14]. It offers a non-invasive and efficient alternative to conventional methods, promoting animal welfare and facilitating the development of cost-effective automated on-site detection devices.
The evolution of eDNA analysis has evolved from conventional Polymerase Chain Reaction (PCR) techniques to next generation sequencing methodologies, broadening the spectrum of detectable species and providing invaluable insights into community composition and ecosystem dynamics. A comparative study of Quantitative Polymerase Chain Reaction (qPCR) and Droplet Digital Polymerase Chain Reaction (ddPCR) assays for detecting G. salaris, rainbow trout, and Atlantic salmon eDNA in Norway demonstrated high performance in both methods [5]. Although these molecular methods have shown efficiency in eDNA analysis for understanding the dynamics of host–parasite interaction, they suffer from limitations, including complexity in assay design, costs, and reliance on specialized equipment. Hence, loop-mediated isothermal amplification (LAMP) techniques provide advantages, including simplicity, rapidity, cost-effectiveness, and robustness for field applications. The LAMP method provides efficient and specific amplification of the target DNA at an isothermal temperature of 60 to 65 °C. Unlike PCR, LAMP does not require thermal cycling. Moreover, LAMP is different from other amplification methods in that it uses strand-displacing DNA polymerase and four to six primers that target distinct regions on the target sequence [15,16,17]. This property is advantageous when working with eDNA, in which the target DNA may be found in smaller quantities.
Considering the advantages of the LAMP technique, we developed a LAMP assay to evaluate the presence or absence of S. salar and G. salaris using eDNA from river water. Annual monitoring using conventional methods, such as fish capture followed by morphological identification, and molecular techniques such as PCR, has consistently confirmed the coexistence of both S. salar and its ectoparasite G. salaris within the Sande River in Norway [6,18]. Therefore, the Sande River presents an ideal system for investigating eDNA dynamics in a riverine environment and assessing the applicability of the LAMP- based detection method.
A primary method for eDNA sampling is active sampling which involves filtration of water through membranes using pumps, syringes, or integrated sampling equipment such as Smith-Root eDNA Sampler [5,13,19]. Filtration strategies and optimal sample volumes play crucial roles in maximizing eDNA recovery [14,19,20]. While active sampling is the most commonly used approach in aquatic systems, it can be time-consuming and requires specialized equipment.
Recently, passive sampling approaches for eDNA analysis in marine ecosystems have gained significant attention [21,22,23]. Compared to active filtration, passive collection may yield similar or greater species richness suggesting its potential alternative or complementary approach for eDNA analysis [21,23]. Passive sampling methods offer potential advantages in terms of ease of deployment, scalability of sampling, reduced equipment requirements and cost. However, a notable gap persists in understanding the applicability and effectiveness of passive sampling compared to active sampling in river systems, emphasizing the need for systematic comparisons to reliably assess species presence. River flow dynamics have a significant impact on eDNA transport and persistence, potentially affecting detection of host–parasite complexes; yet, the previous study has examined this in lotic environments [14]. Therefore, there is a clear need for a systematic evaluation to determine relative effectiveness of passive and active sampling strategies.
In this study, we performed a comparative assessment of passive and active eDNA sampling methods for detecting host–parasite complexes in freshwater systems. Further, we evaluated the performance of different filter materials with varying pore sizes for both sampling strategies and applied newly designed amplification primers for G. salaris detection. Overall, our results will contribute to the design and optimization of eDNA sampling protocols for future research and monitoring programmes in rivers.

2. Materials and Methods

2.1. Selection of Sampling Sites

Sampling was done at six representative study sites along the length of the Sande River in late May 2023. S3 and S4 were selected as positive sites, since the presence of host and parasite was confirmed earlier by authorities using electrofishing and morphological identification of both fish and parasite. Sites S1 and S2 were chosen above positive locations with dams separating each site. Sites S5 and S6 were located downstream of the positive sites, where the water velocity was low and largely stagnant. At each site, environmental parameters, including water temperature, pH, flow velocity, turbidity, and vegetation, were recorded. Ambient parameters documented during sampling, showed minor variation between sites (Table 1). Six study sites: S6, S5, S3, S2, S4, and S1, were assigned turbidity ratings ranging from high, moderate, and clean. Due to high turbidity and uncertainties associated with sample processing, an additional sampling point S6 (59.587583,10.209552) was positioned near S5.
The same case study methods were repeated again in August 2025, three weeks after the Sande River was treated with rotenone [24].

2.2. Sample Collection—Active Method

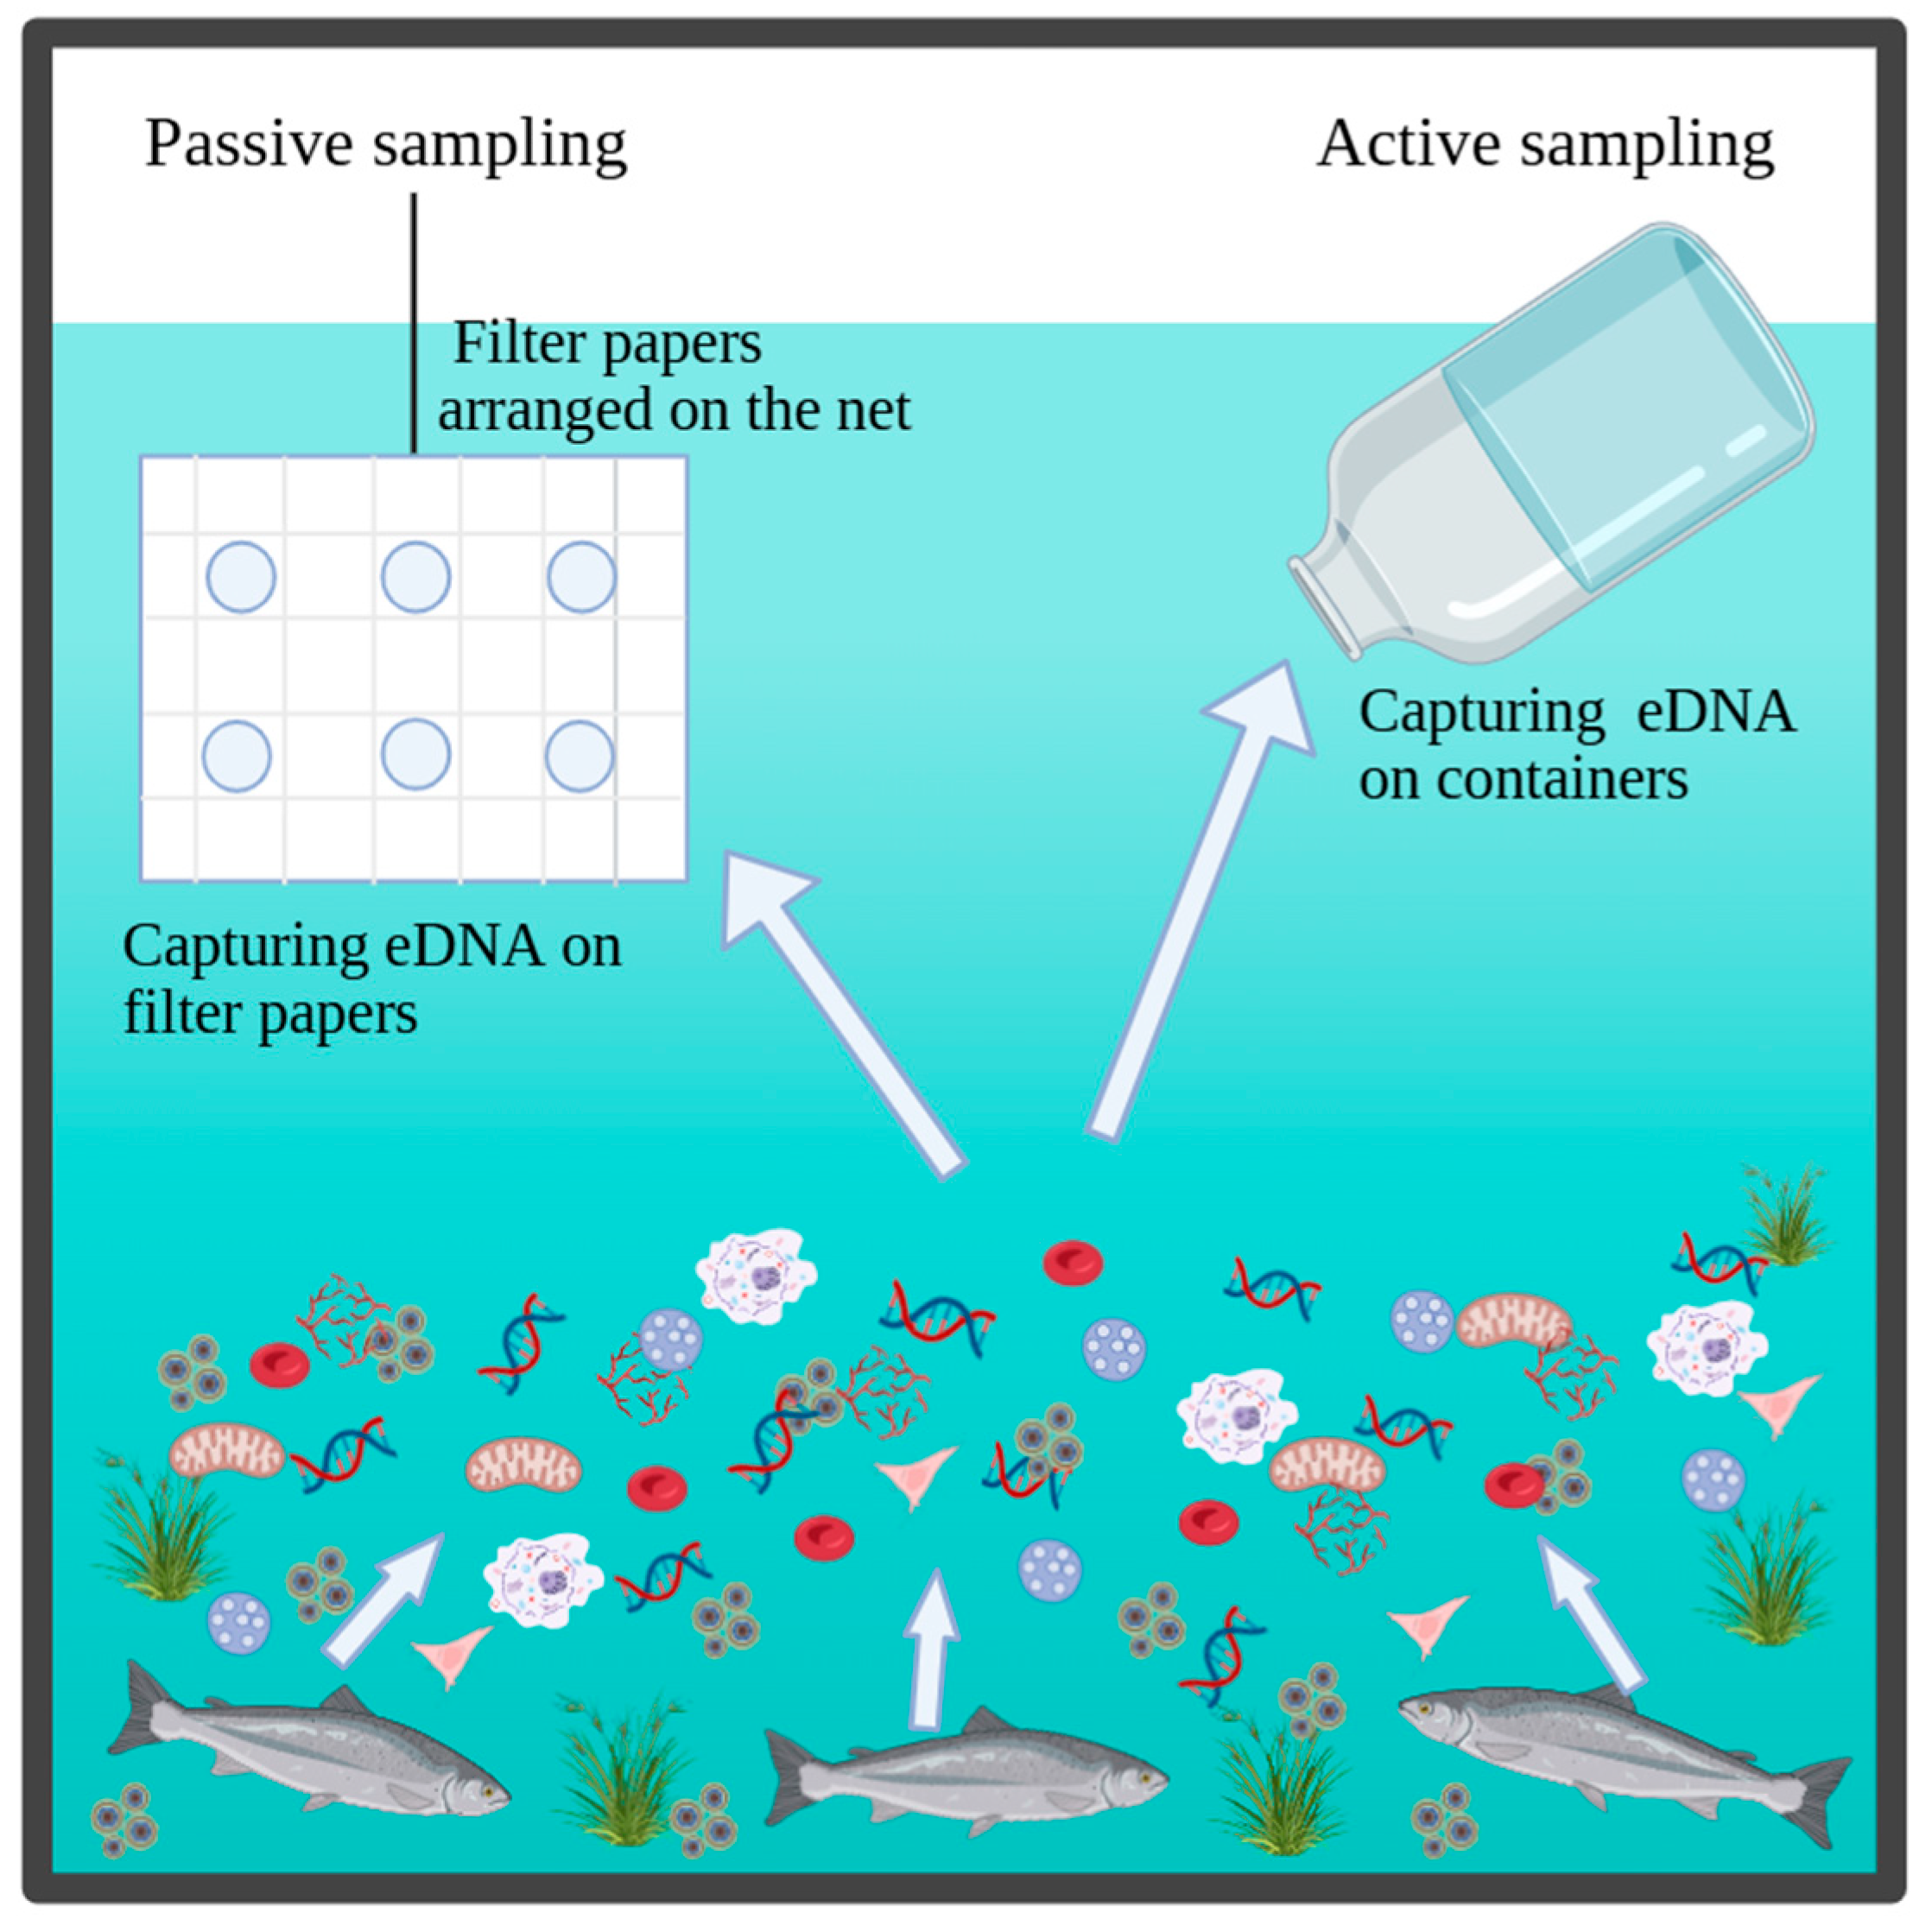
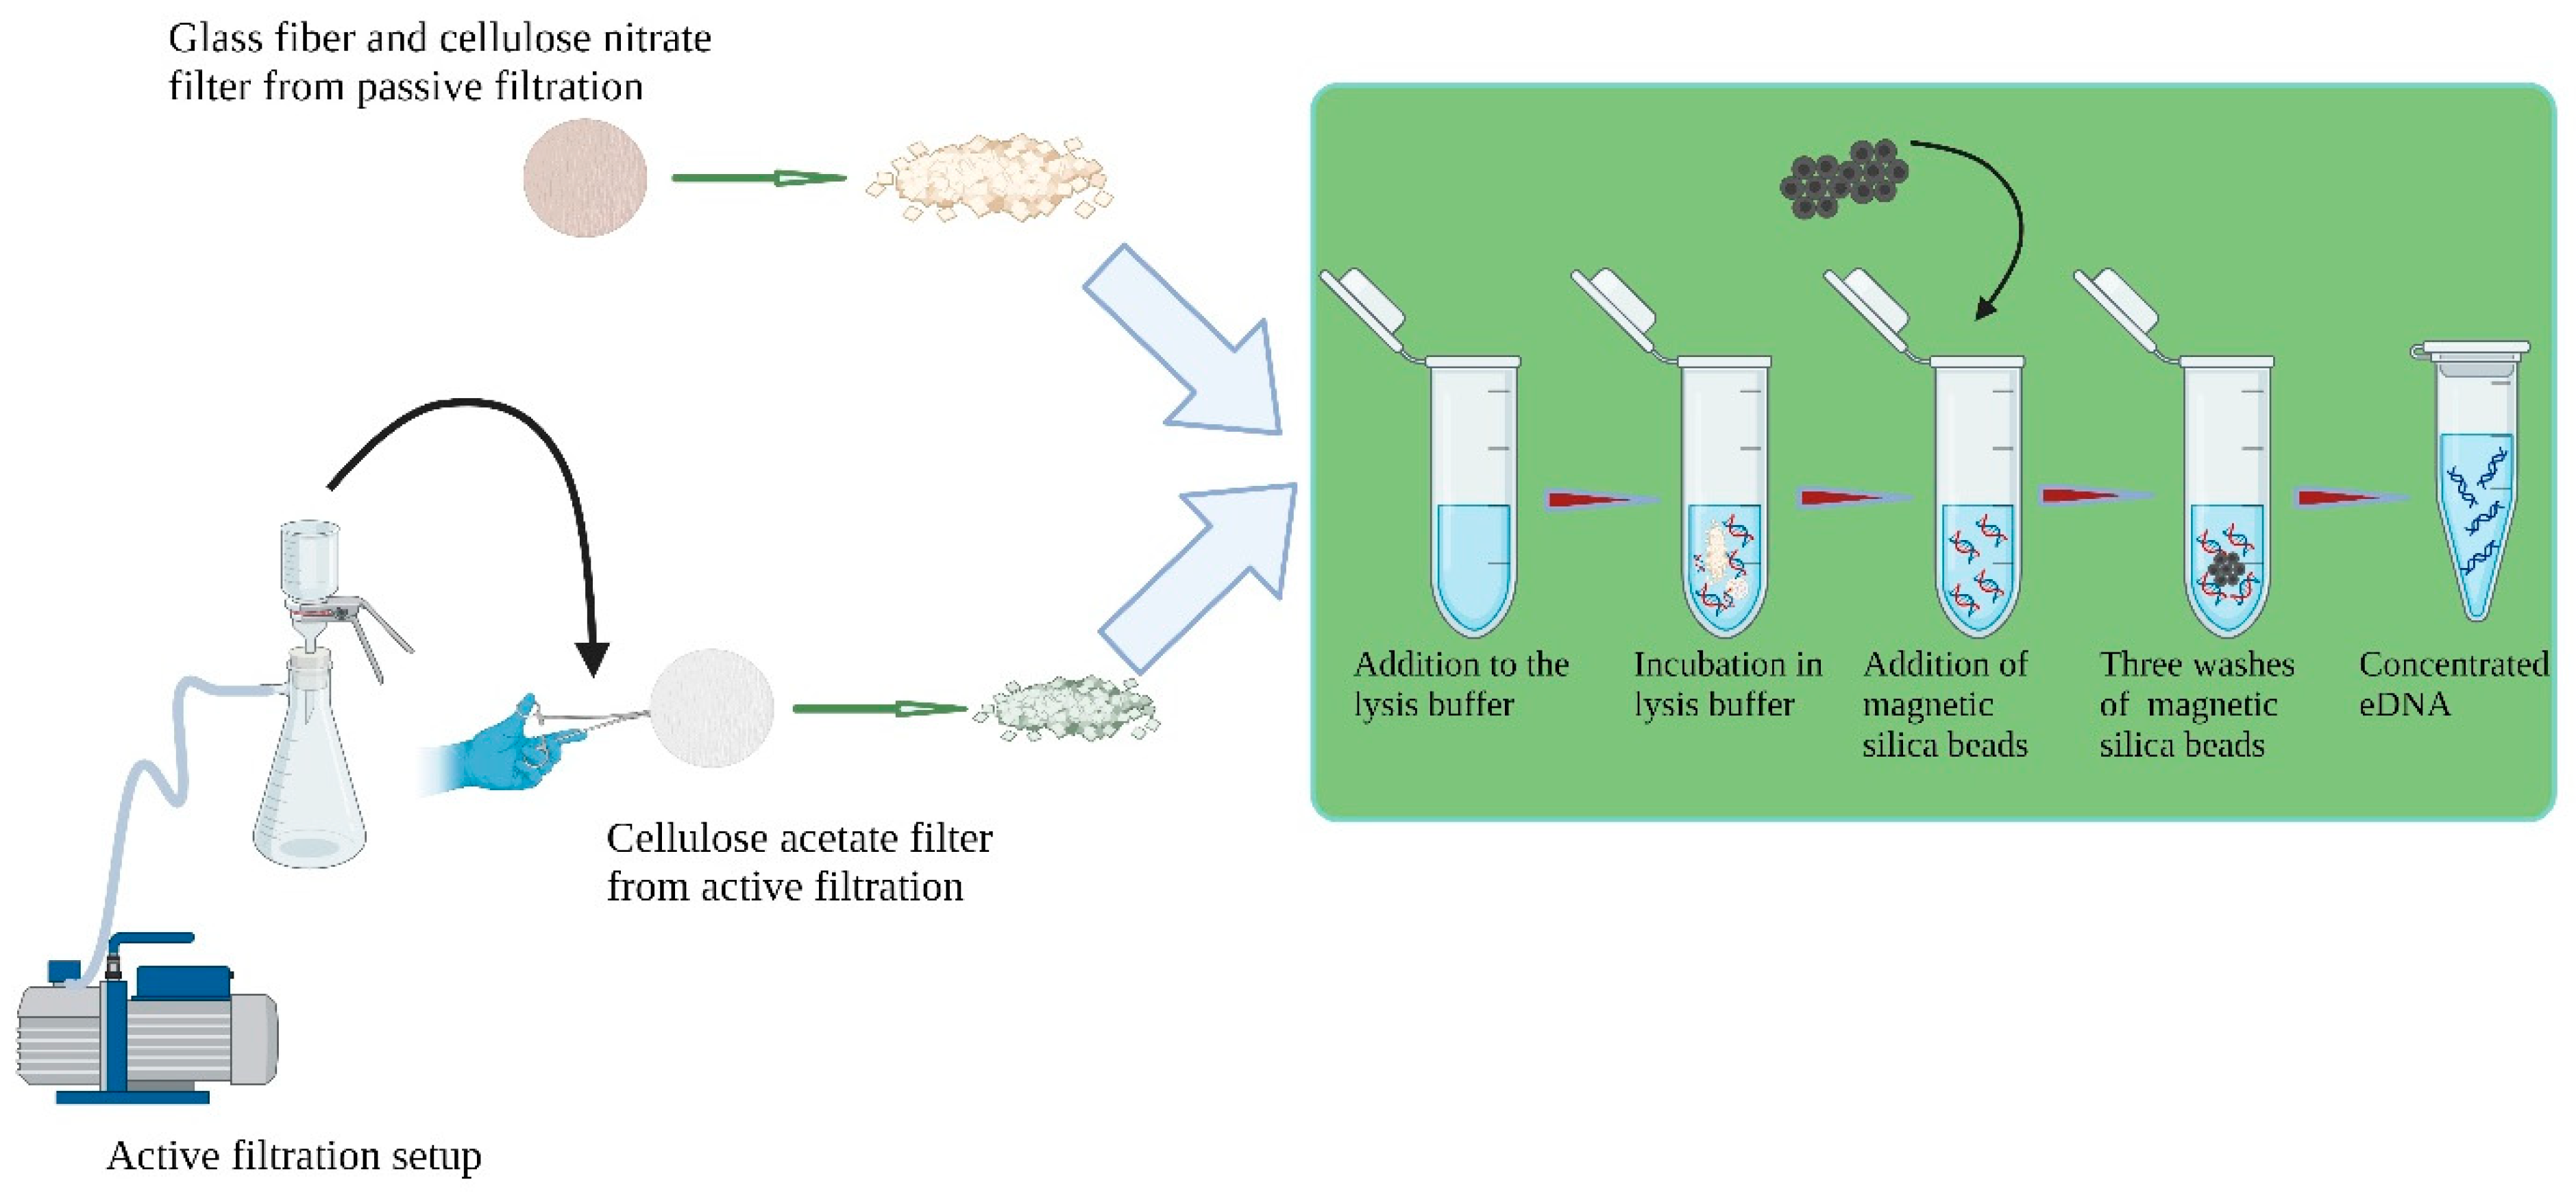
For active sampling, a total of three replicate water samples (5 L per replicate) [14] were collected at each site by submerging the sampling containers directly into the river stream to ensure representative coverage (Figure 1). Prior to the sample collection, all the fresh containers were washed and decontaminated with 50% bleach solution, followed by thorough rinsing with distilled water for approximately five minutes. A cold chain was maintained throughout sample transportation until samples were processed. In the laboratory (Bio Lab, Department of Microsystems, University of South-Eastern Norway, Vestfold, Norway), each 5 L water sample was subjected to a two-step filtration process. First, samples were passed through a 50 µm nylon membrane filter (Millipore, Burlington, MA, USA. Product code-NY600900) to remove large debris of any intact G. salaris parasite. The filtrate was subsequently passed through 0.2 µm membrane filter (Nalgene Rapid Flow sterile filters, Thermo Scientific, Waltham, MA, USA. Product code-10139130). All filter membranes were stored at −20 °C, until further processing. Subsequently, eDNA extraction was carried out separately for each 50 µm coarse filters and the 0.2 µm eDNA capture filters (Figure 2).

2.3. Sample Collection—Passive Method

For passive sampling, filter membranes mounted in steel mesh holders were deployed at each study site in the Sande River (Vestfold, Norway) at a depth of approximately 50 cm below the water surface for 24 h (Figure 1). At each site, three replicate filters of each membrane type were used to ensure detection reliability.
Two types of filter membranes were used, (i) cellulose acetate (CA) (Cytiva, Marlborough, USA. Product code-WHA10404131), and (ii) glass fibre (GF) membrane (Millipore, Burlington, MA, USA. Product code-AP1509000) with a pore size of 0.2 and 1 µm, respectively. All the filter membranes were certified sterile upon procurement from Merck Millipore. The mesh holders and sampling tools were thoroughly decontaminated using 50% bleach solution prior to assembly. After 24 h of submersion, the filter membranes were retrieved from the study sites and placed in sterile tubes containing 99.8% ethanol for transport. Samples were stored at 4 °C, until eDNA extraction.
For both active and passive sampling methods, contamination was minimized by wearing new disposable gloves at each site, and decontaminating tweezers with bleach between handling of individual filter membranes.

2.4. eDNA Extraction

The eDNA was extracted from each filter paper using the Boom’s extraction method (NUCLISENS MINIMAG, BioMerieux, Lyon, France) as per manufacturer’s instructions and with slight modification to the elution buffer volume, which was reduced from 100 µL to 80 µL. Each filter paper was cut into small pieces in a sterile Petri dish using a sterile scalpel and incubated in 3 mL of lysis buffer for 10 min at 90 °C. Subsequently, the lysate was transferred into a sterile 1.5 mL microcentrifuge tube. In total, 50 µL of magnetic silica beads was added, followed by incubation at room temperature for 5 min without agitation. The supernatant was removed, and the magnetic silica beads were subjected to three washes. Finally, eDNA was eluted in 80 µL of elution buffer and stored at −20 °C (Figure 2). The standard laboratory protocols were strictly followed to prevent sample-to-sample contamination. All work surfaces were decontaminated with a 50% bleach solution before and after each extraction.

2.5. Detection by LAMP

Detection of the target species, S. salar and G. salaris was performed using real-time loop-mediated isothermal amplification (LAMP). Species-specific LAMP assays were developed targeting the mitochondrial cytochrome B (Cyt B) for S. salar (GeneID: AF053591.1) and cytochrome c oxidase subunit I (COX1) for G. salaris (GeneID: 4712271); the reference gene sequences were retrieved from the National Center for Biotechnology Information (NCBI).
LAMP primers were designed using LAMP designer software 1.01 (PREMIER Biosoft, San Francisco, CA, USA) for the selected target genes, (S. salarCyt B and G. salarisCOX1), as listed in Table 2. The G. salaris LAMP primers were newly developed in this study, whereas the S. salar LAMP primers were previously developed, validated, and described in our previous study [25]. All the primers used in this study were procured from Eurofins Genomics, Galten, Denmark.
The total volume of each LAMP reaction was 25 µL, consisting of 2.5 µL of 10× primer mix for the respective target gene, 12.5 µL of 2× WarmStart® LAMP Master mix, 0.5 µL of 50× fluorescent dye (New England Biolabs, Ipswich, USA), 8.5 µL of RNAse free water, and 1 µL eDNA template. The Master mix contained dNTPs, Bst DNA polymerase, Tris–HCl (pH 8.8), KCl, Tween, (NH4)2SO4, betaine, and MgSO4. The amplification of target sequences, along with positive and negative control was carried out at 65 °C for 100 cycles using a StepOnePlus™ Real-Time PCR System (Applied Biosystems, Waltham, MA, USA), with real-time fluorescence monitoring.

2.6. Specificity Test

The specificity of LAMP assay was evaluated using genomic DNA from ten non-target species: (1) Perca fluviatilis, (2) Rutilus rutilus, (3) Anguilla anguilla, (4) Bacillus cereus, (5) Escherichia coli, (6) Listeria monocytogenes, (7) Oncorhynchus mykiss, (8) Esox lucius, (9) Salmo trutta, and (10) Abramis brama. These species were selected based on their phylogenetic relatedness to the target species (S. salar and G. salaris) and/or their likelihood of co-occurrence within the sampled aquatic ecosystems.

2.7. Sensitivity Test

The analytical sensitivity and detection limit of the LAMP assay were assessed using synthetic positive oligonucleotides targeting the Cyt B gene of S. salar and the COX1 gene of G. salaris (Eurofins Genomics, Galten, Denmark). Stock solutions containing 100 ng of each oligonucleotide were prepared in 1000 µL of RNase-free water and subjected to a series of tenfold serial dilutions (up to 1010-fold). Each dilution was tested in the LAMP assay using the corresponding primer sets to determine the lowest detectable DNA concentration.

3. Results

3.1. S. salar Detection on Active and Passive Sampling Filters

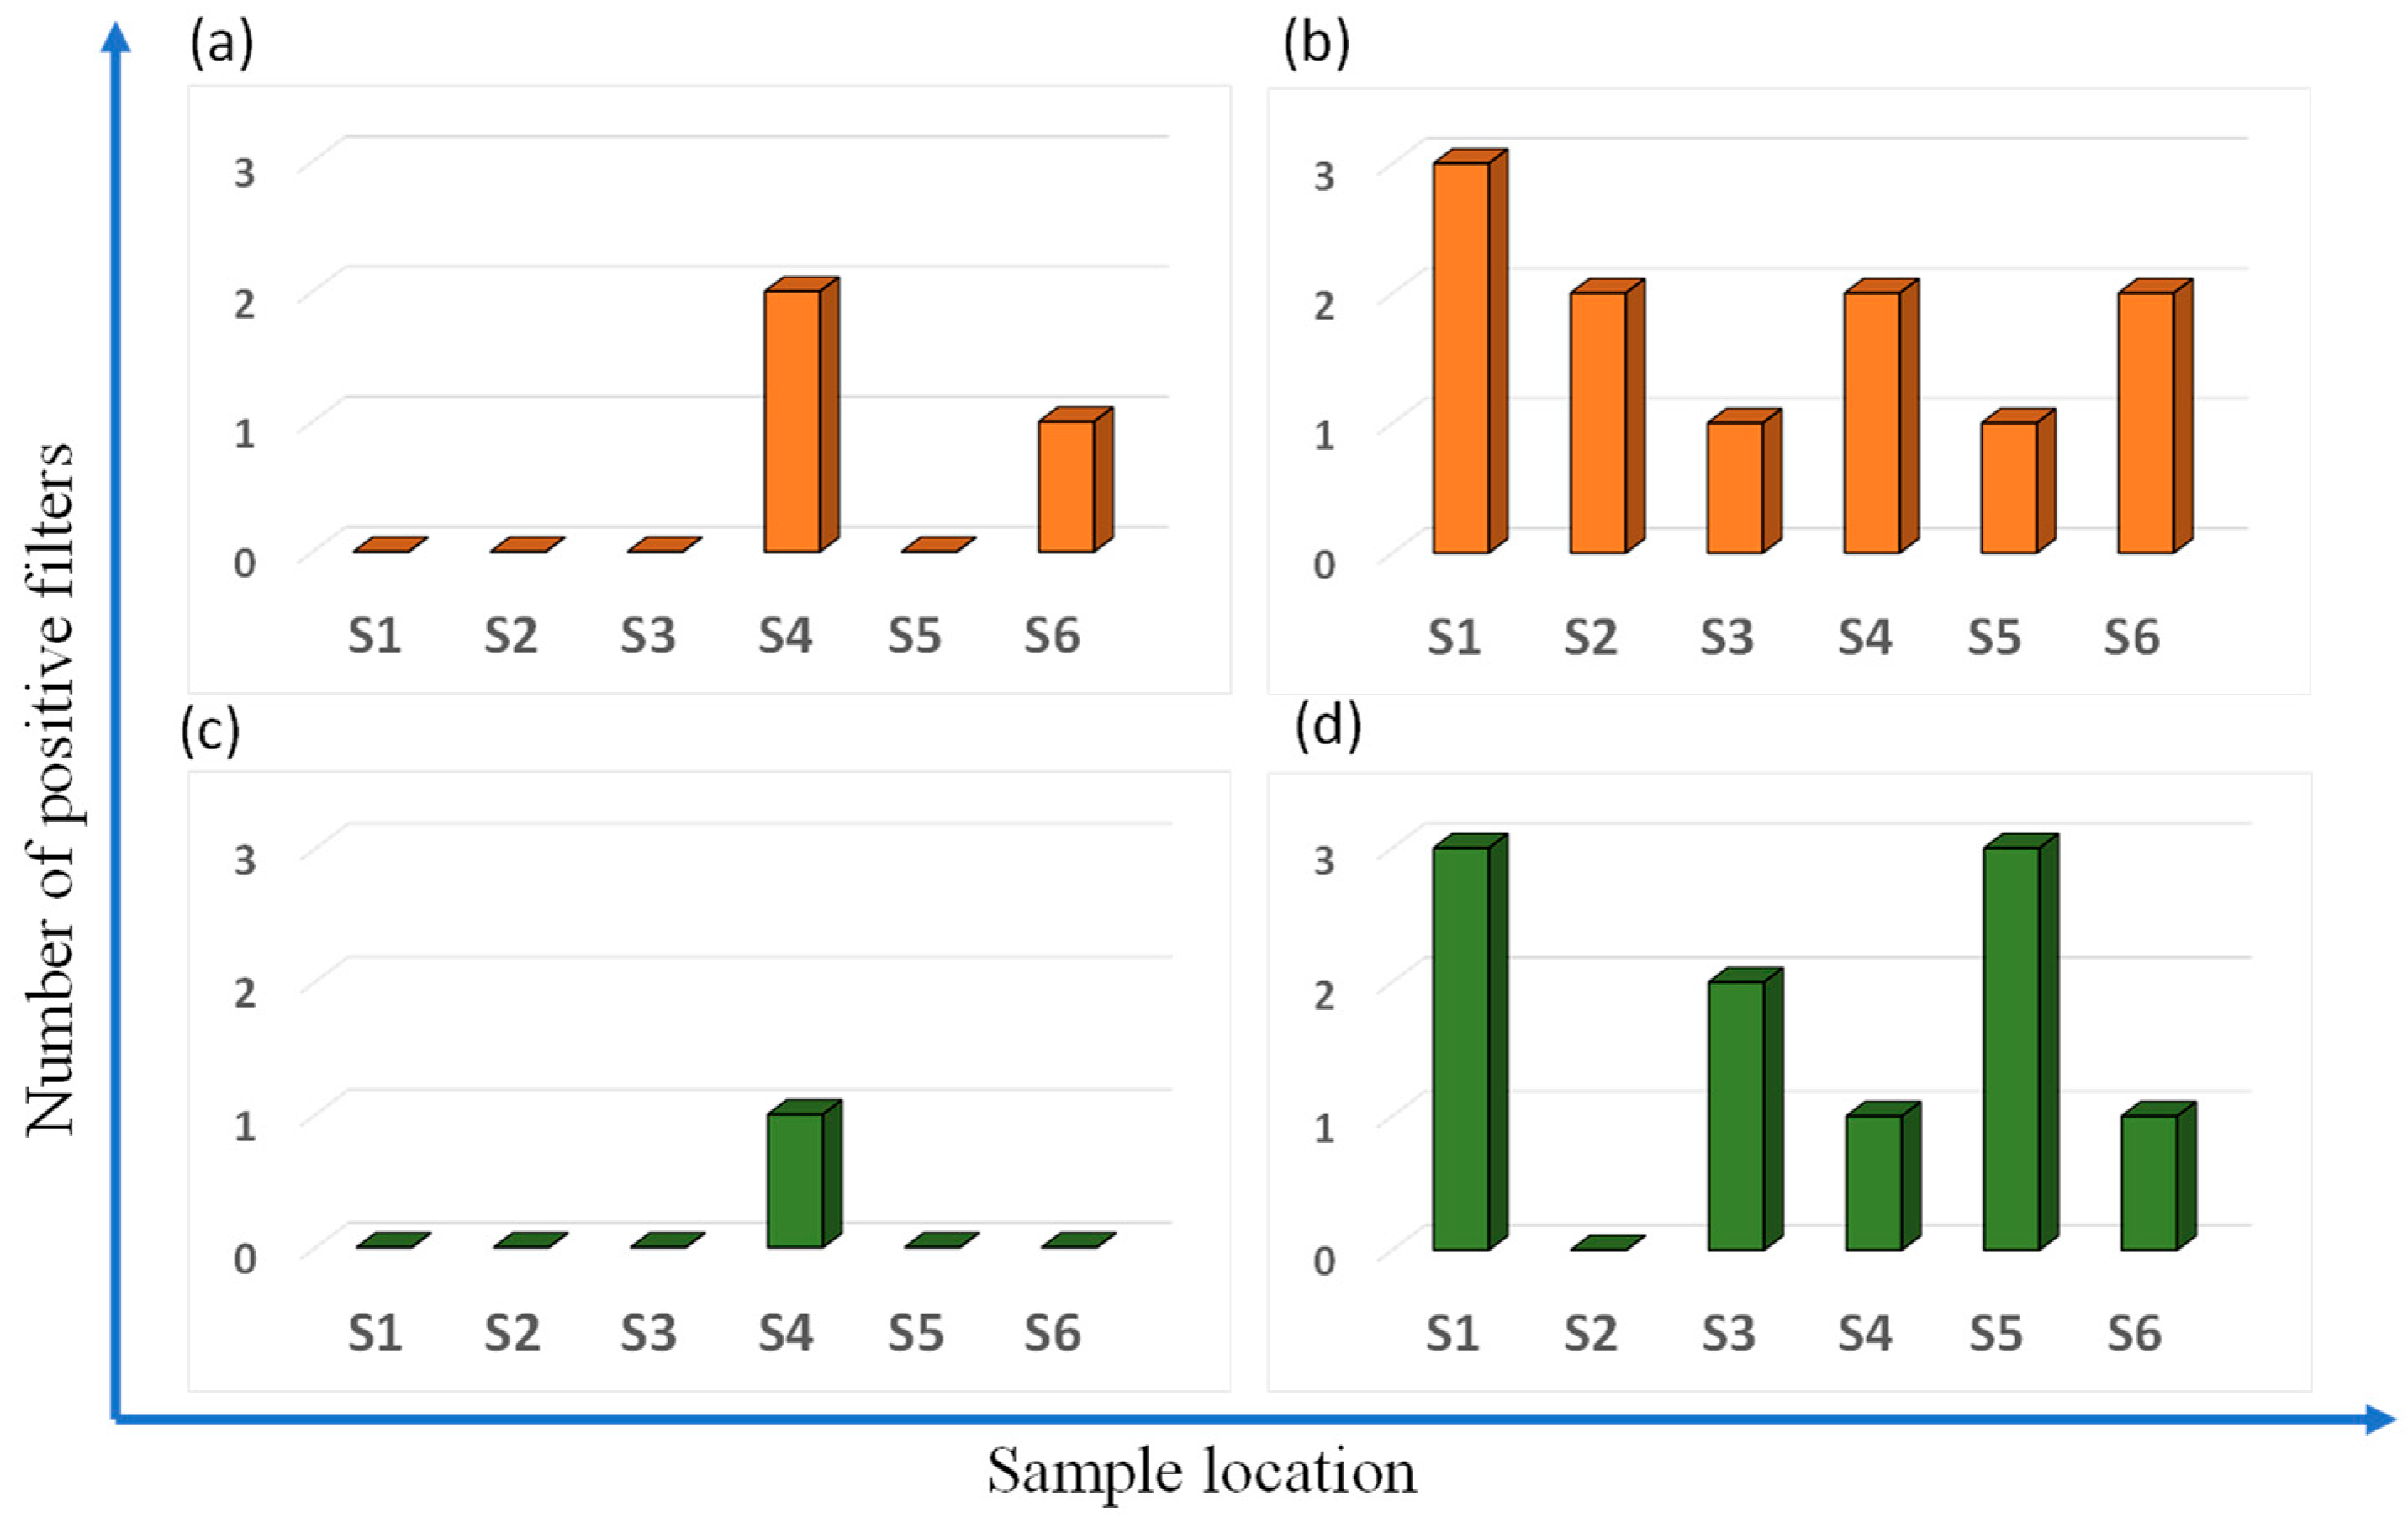
Clear differences were observed in S. salar eDNA detection depending on the sampling approach (active vs. passive), filter type, and site (Figure 3), with three replicate filters analyzed per site for each method.
Using the 50 µm prefilter (Figure 3a), the presence of S. salar DNA was confirmed at S4 (3/3 replicates) and S6 (1/3), while the remaining samples showed no detectable amplification signal. In contrast, S. salar eDNA was consistently detected in the 0.2 μm filters from active sampling (Figure 3b) with positives at all sites: S1 (3/3), S2 (2/3), S3 (1/3), S4 (2/3), S5 (1/3), and S6 (2/3).
For the passive sampling method, overall detection strongly depended on the filter material. The cellulose acetate filter paper (Figure 3c) showed very limited detection frequency, with S. salar eDNA detected only in sample S4 and at a relatively low level (1/3). Conversely, the glass fibre filter membrane (Figure 3d) demonstrated substantially higher detection rates for most samples, particularly S1 (3/3), S3 (2/3), S4 (1/3), S5 (3/3), and S6 (1/3).

3.2. G. salaris Detection on Active and Passive Sampling Filters

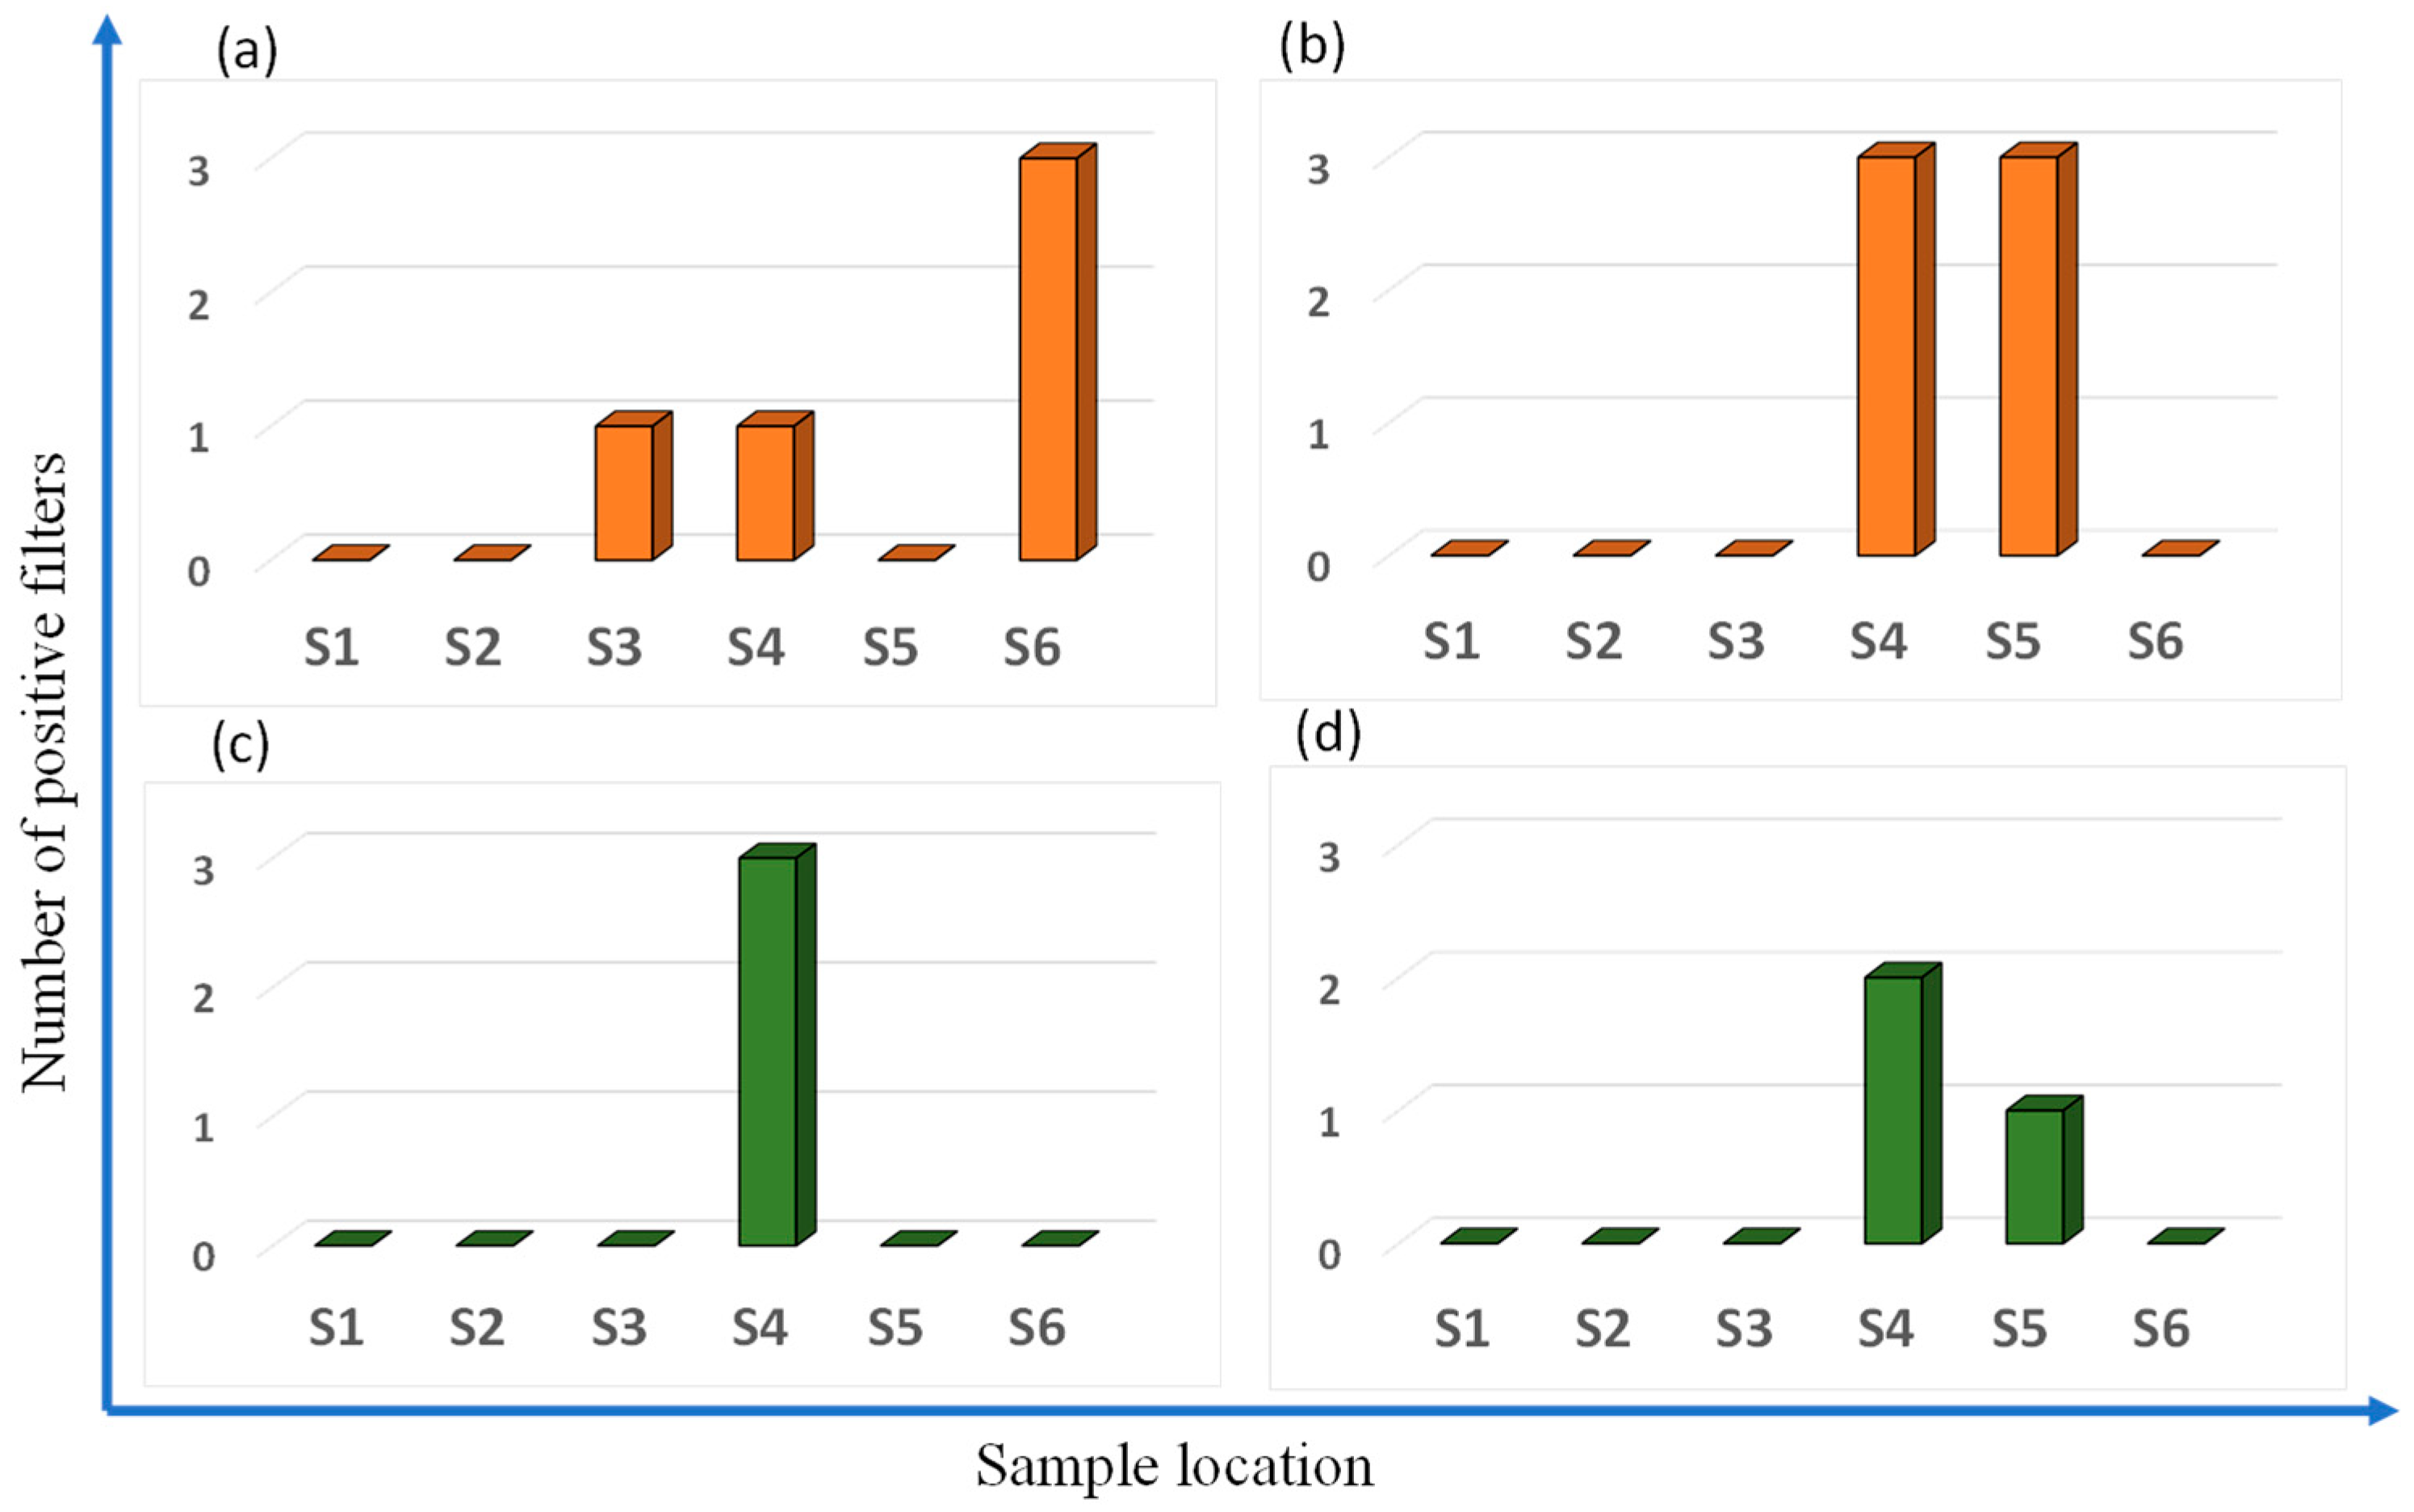
Detection of G. salaris eDNA varied across sampling sites and methods (Figure 4). Using the active sampling approach, sequential filtration revealed differences between the two filter pore sizes. The 50 µm prefilter (Figure 4a) yielded positive detections at sites S3, S4, and S6, with the highest number of positive replicates at S6 (3/3), followed by S3 and S4 (1/3 each). In contrast, eDNA was detected in the 0.2 µm filter (Figure 4b) only at S4 (3/3) and S5 (3/3), with all replicates positive at both sites, indicating strong signals in the fine particle fraction.
For the passive sampling approach, detection of G. salaris eDNA was more limited and filter type influenced performance. In cellulose acetate filters (Figure 4c), G. salaris eDNA was exclusively detected at S4, with all three replicates positive. The glass fibre filters (Figure 4d) yielded positive detection of eDNA at S4 (2/3 replicates) and S5 (1/3 replicates), showing partial agreement with the fine filtration results from active sampling.
No eDNA of G. salaris was detected at sites S1 and S2 by any method. Overall, S4 consistently showed positive detections across all sampling methods and filter types, suggesting a strong local source of eDNA. S5 was positive only in fine fraction (0.2 µm filter) and glass fibre filters, while S3 and S6 were positive only in the coarse fraction (0.5 µm filter). These results demonstrated that eDNA presence and particle size varied between sites. Coarse filters may capture all parasites or larger eDNA aggregates, while fine filters target free-floating or small eDNA fragments.
After rotenone treatment in August 2025, S. salar and G. salaris eDNA were not detected by either sampling methods.

3.3. Specificity by LAMP

The molecular LAMP assay was performed to evaluate species-specificity of primers for the respective genes. DNA was extracted from target species (S. salar and G. salaris) and ten non-target species including fish (P. fluviatilis, R. rutilus, A. anguilla, S. trutta, E. lucius, A. brama, O. mykiss) and bacteria (E. coli, L. monocytogenes, B. cereus).
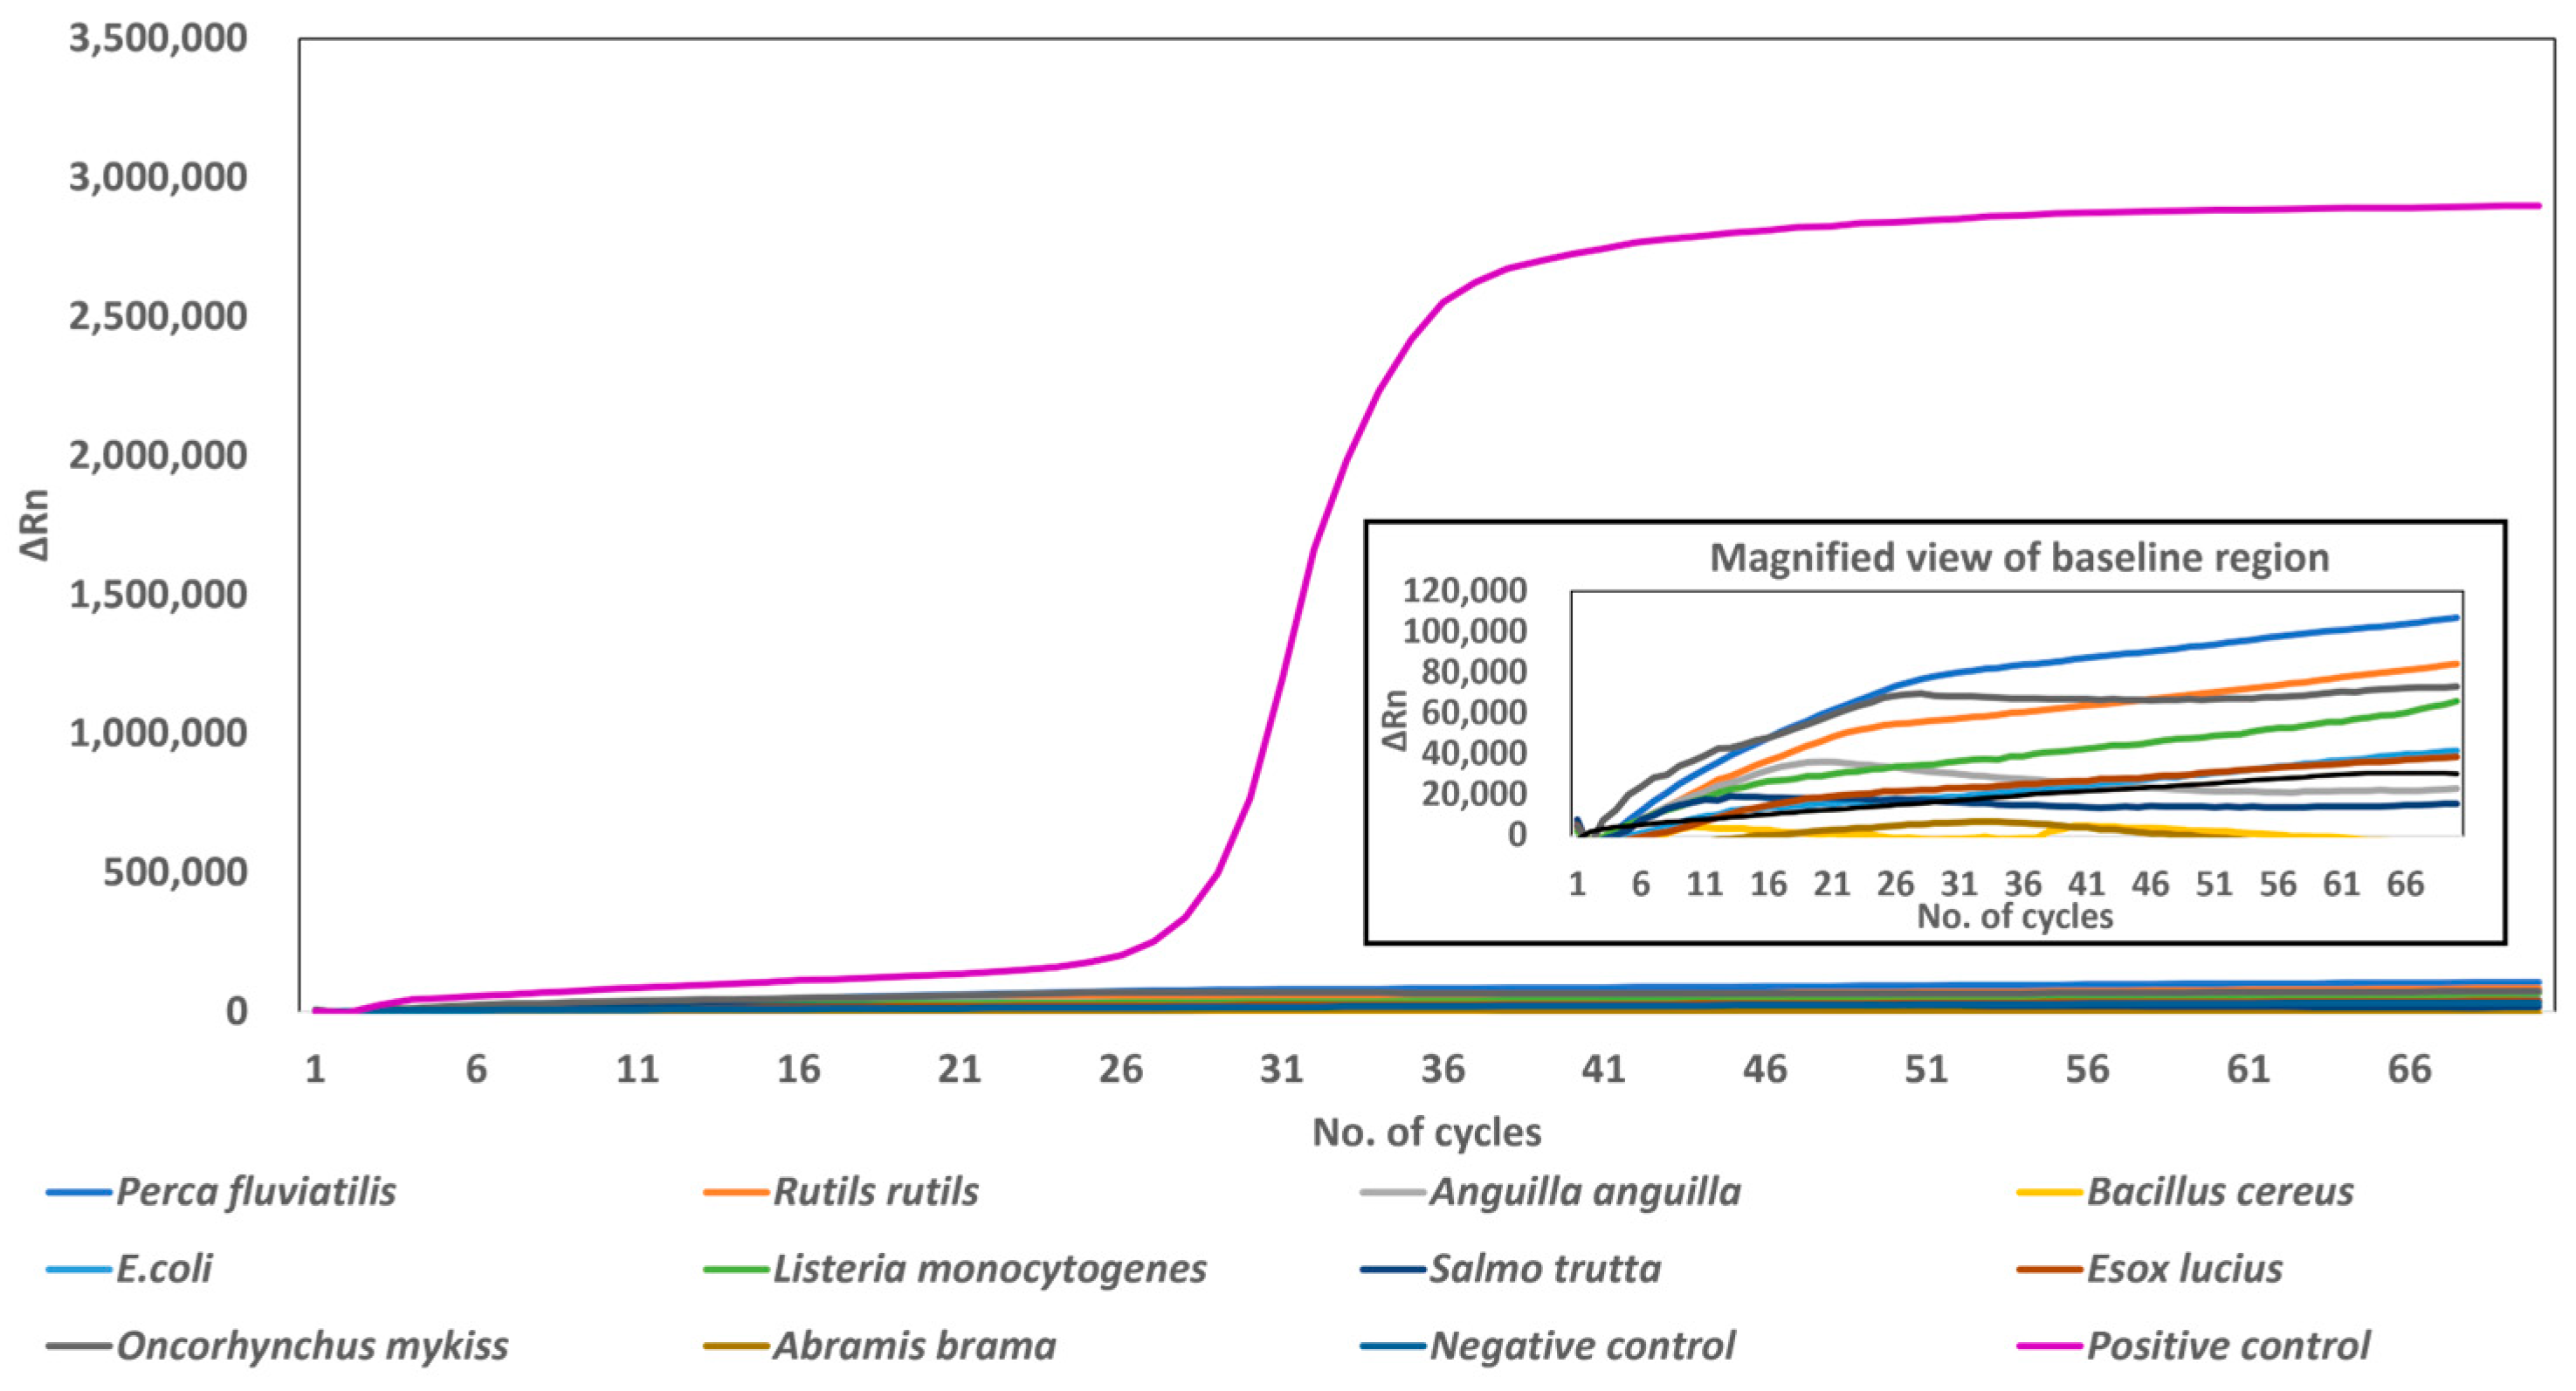
The LAMP assay for S. salar Cyt B gene demonstrated high specificity, with amplification observed only for the target species (Figure 5). The positive control curve for S. salar showed a rapid increase in fluorescence after approximately 28 cycles, reaching a plateau above ΔRn 3,000,000, while all ten non-target species remained flat at baseline. ΔRn is referred to as the magnitude of the normalized fluorescence signal that is emitted by the reporter during the amplification cycle and given by the expression: ΔRn = Rn − baseline fluorescence. The negative control also showed no amplification. These results confirm that the LAMP primers are highly specific to the S. salar Cyt B gene and suitable for accurate eDNA detection without cross-reactivity.
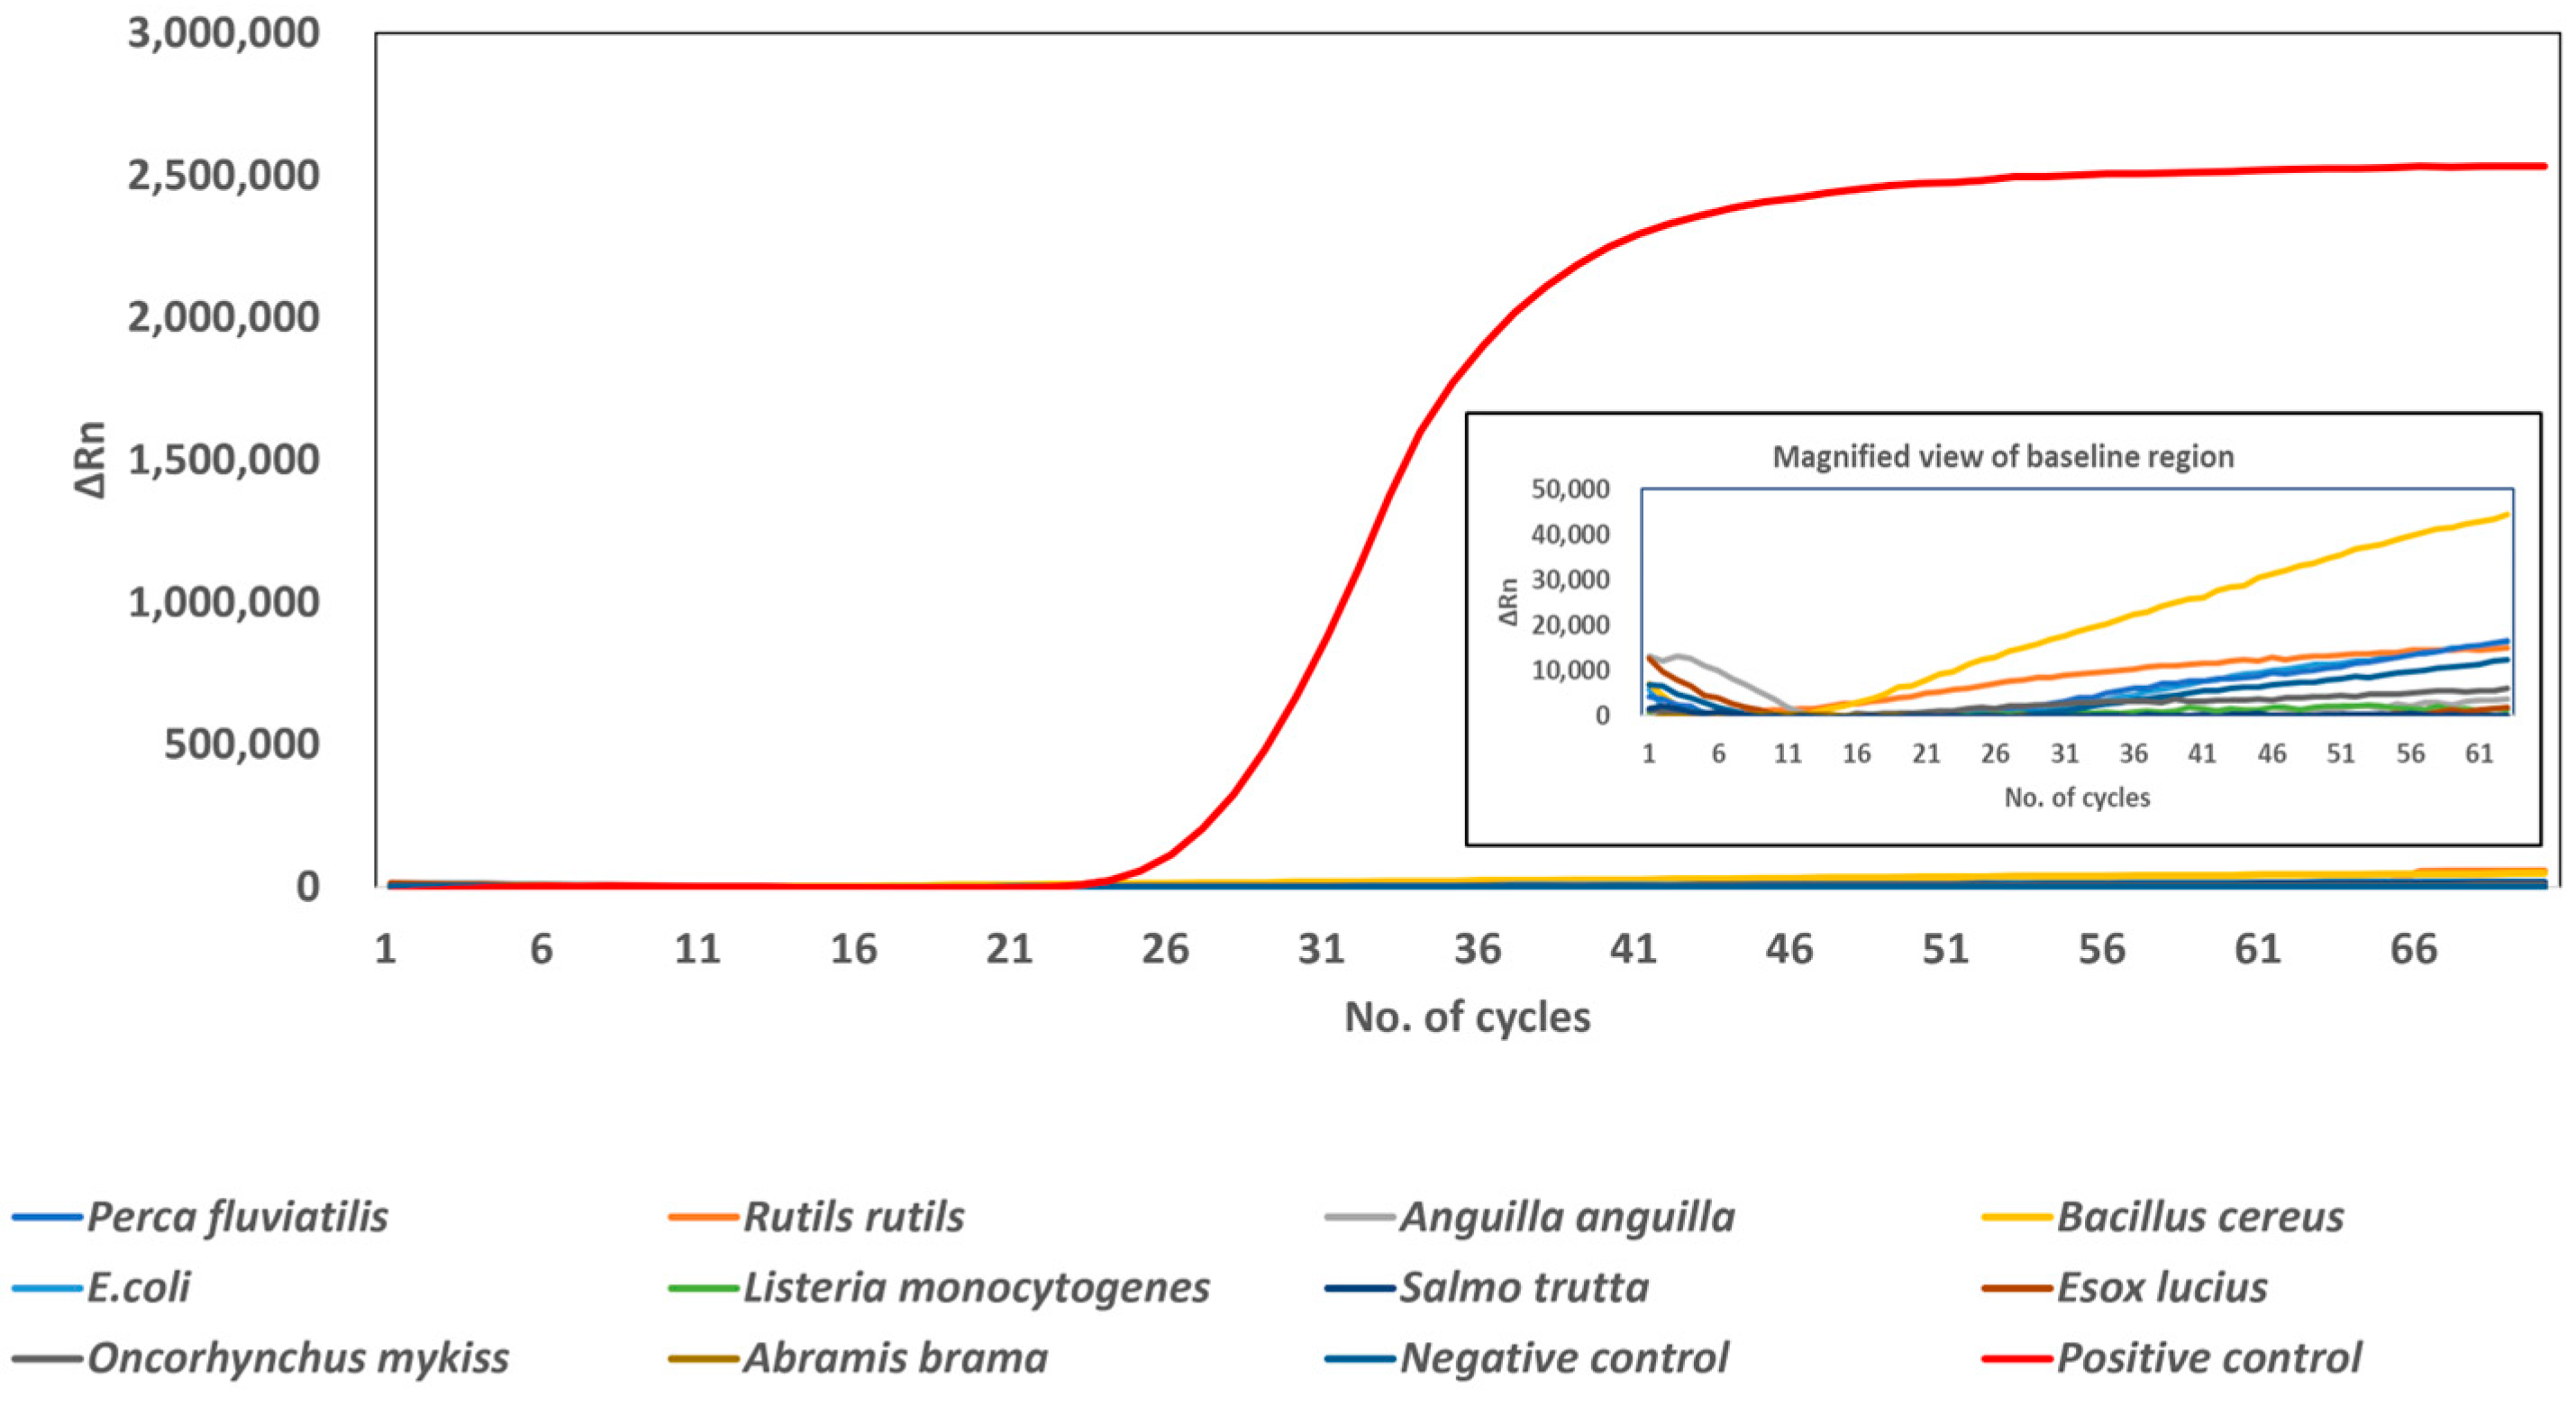
Similarly, the LAMP primers targeting the COX1 gene in G. salaris produced a strong amplification signal, while no amplification was observed for any of the ten non-target species or the negative control (Figure 6). The amplification curve for the target species showed a rapid increase after approximately 26 cycles, reaching a high ΔRn value (>2,500,000), whereas all non-target species remained flat at baseline levels throughout the reaction. This confirmed that the assay is highly specific to G. salaris, as the primers did not cross-react with closely related fish hosts or common environmental bacteria. The positive control curve reached a plateau after approximately 40 reaction cycles, while all other curves remained near zero, further validating the assay’s specificity.
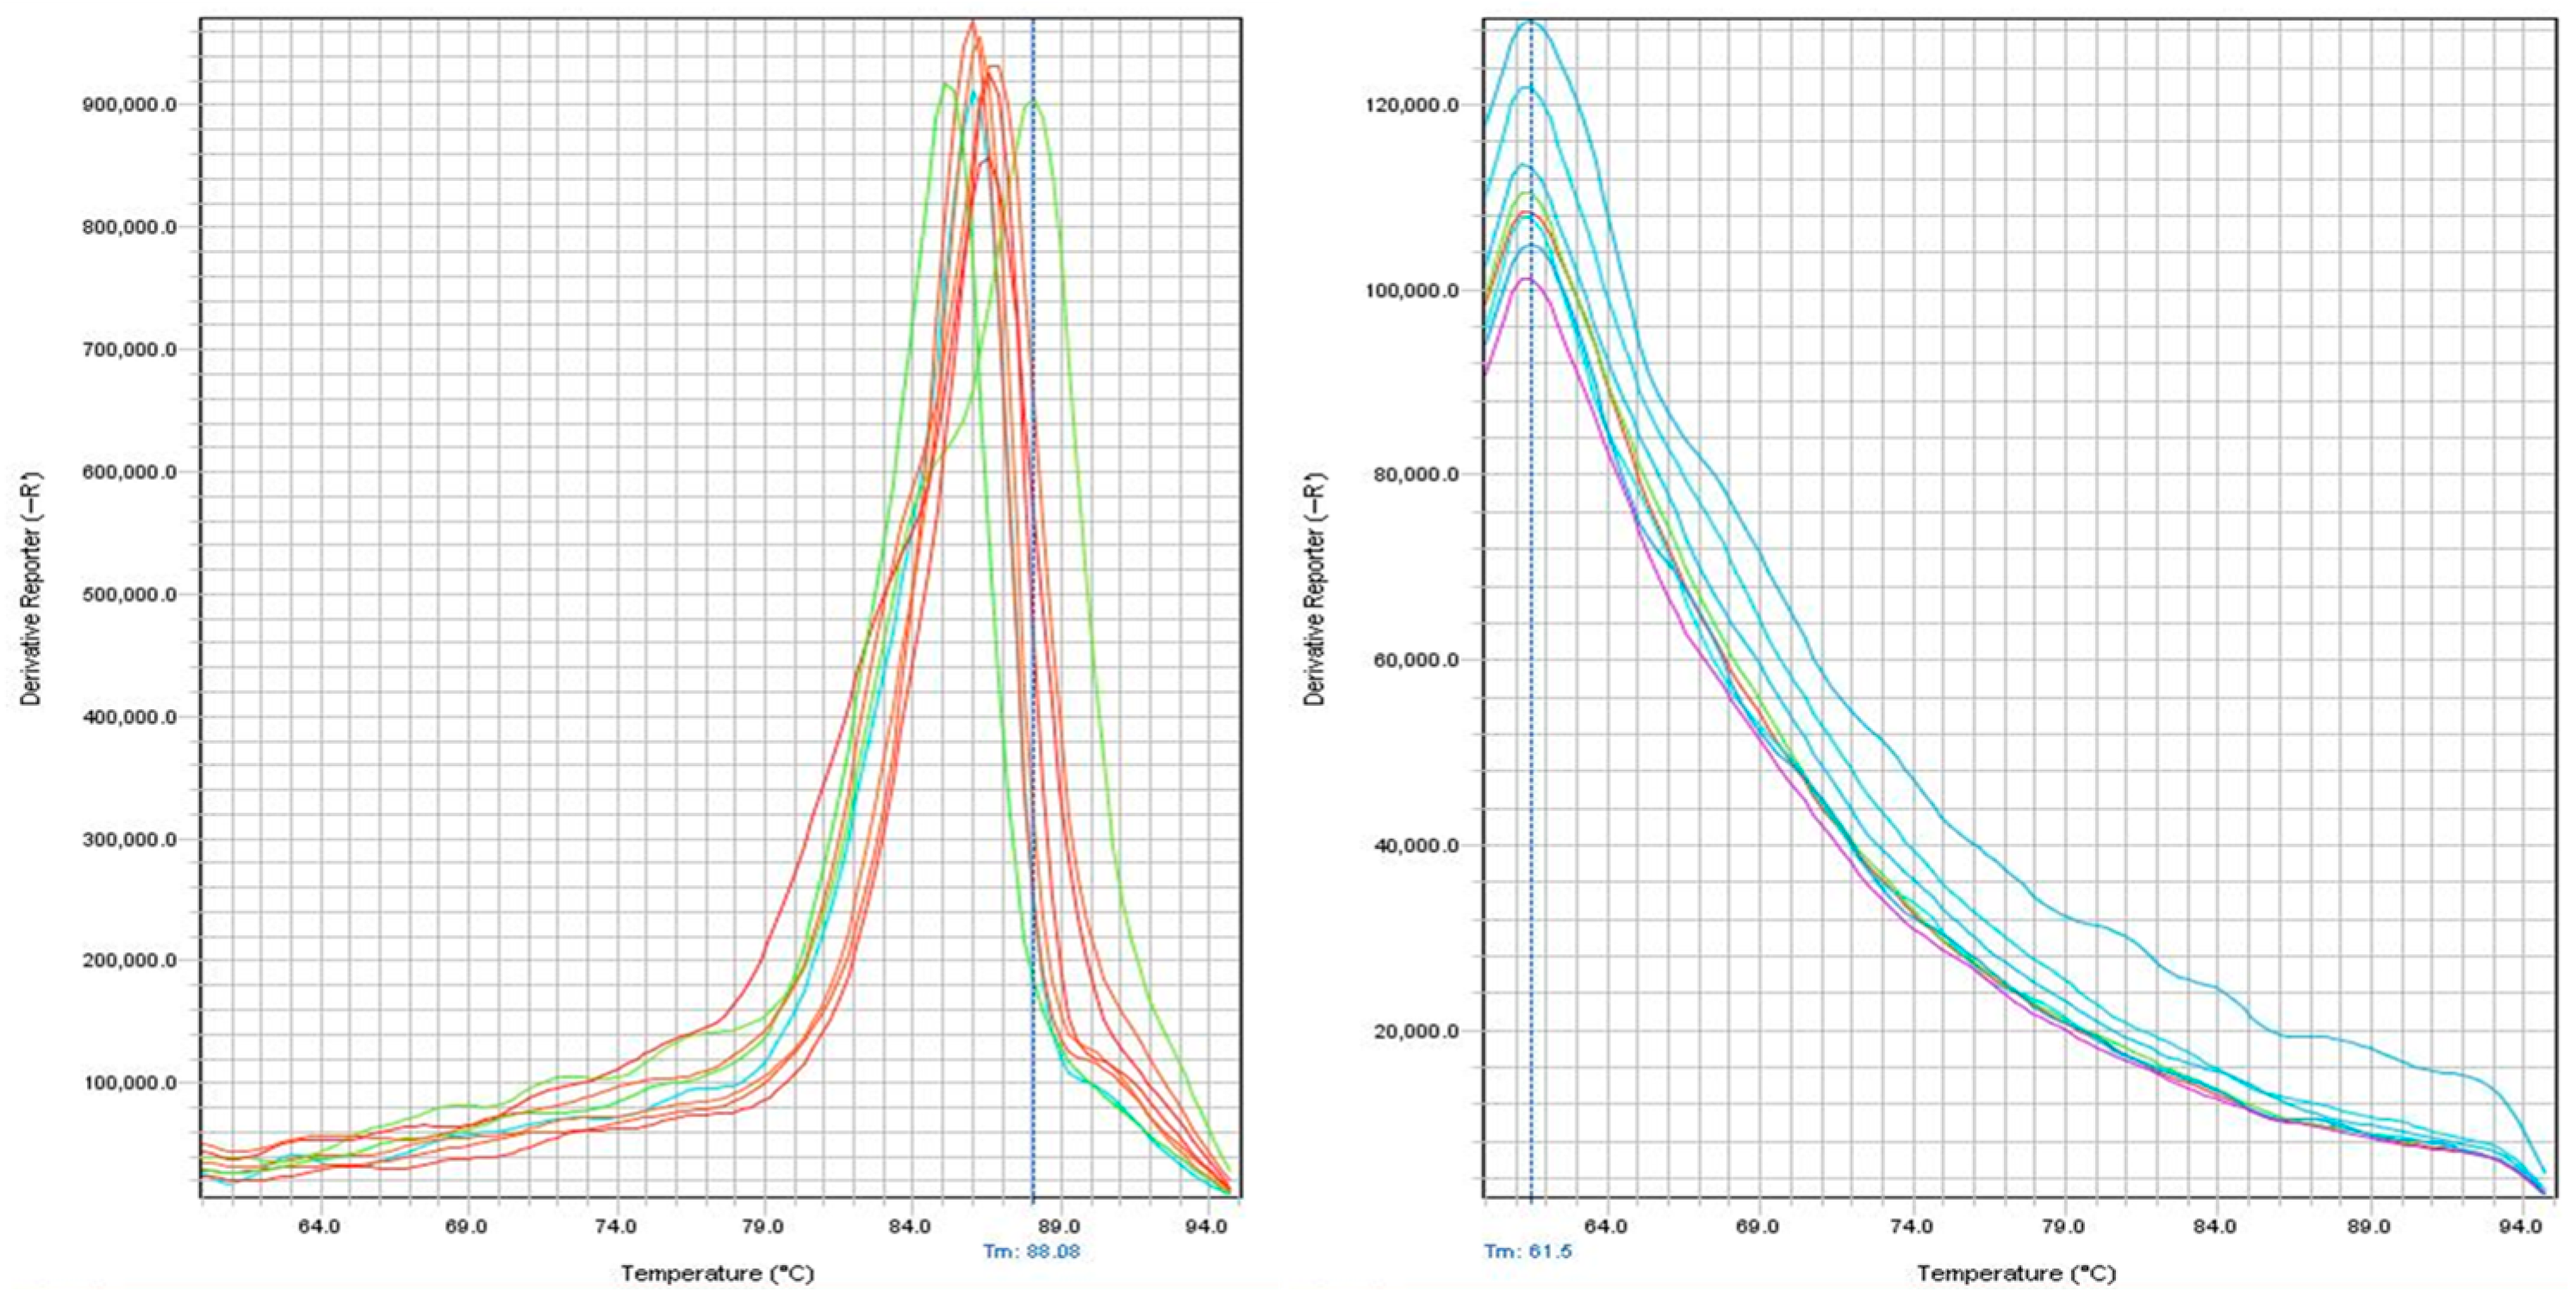
The precise sequence being amplified correlates to the melting temperature (Tm) of the DNA product. Consequently, selective amplification is suggested if the drop in fluorescence during the melt curve matches the expected Tm of the target sequence. On the other hand, a melt curve with several peaks may indicate the presence of non-specific products. Melt curve analysis combined with LAMP reactions was employed in this work to improve the assay’s accuracy and reliability. Therefore, the specificity of the LAMP reaction can be confirmed by analyzing the melt curve, to determine whether the decrease in fluorescence aligns with the anticipated Tm of the target sequence. A distinct and sharp peak signifies specific amplification, whereas multiple peaks suggest nonspecific products, as was validated for the LAMP primers targeting S. salar (Figure 7).

3.4. Sensitivity by LAMP

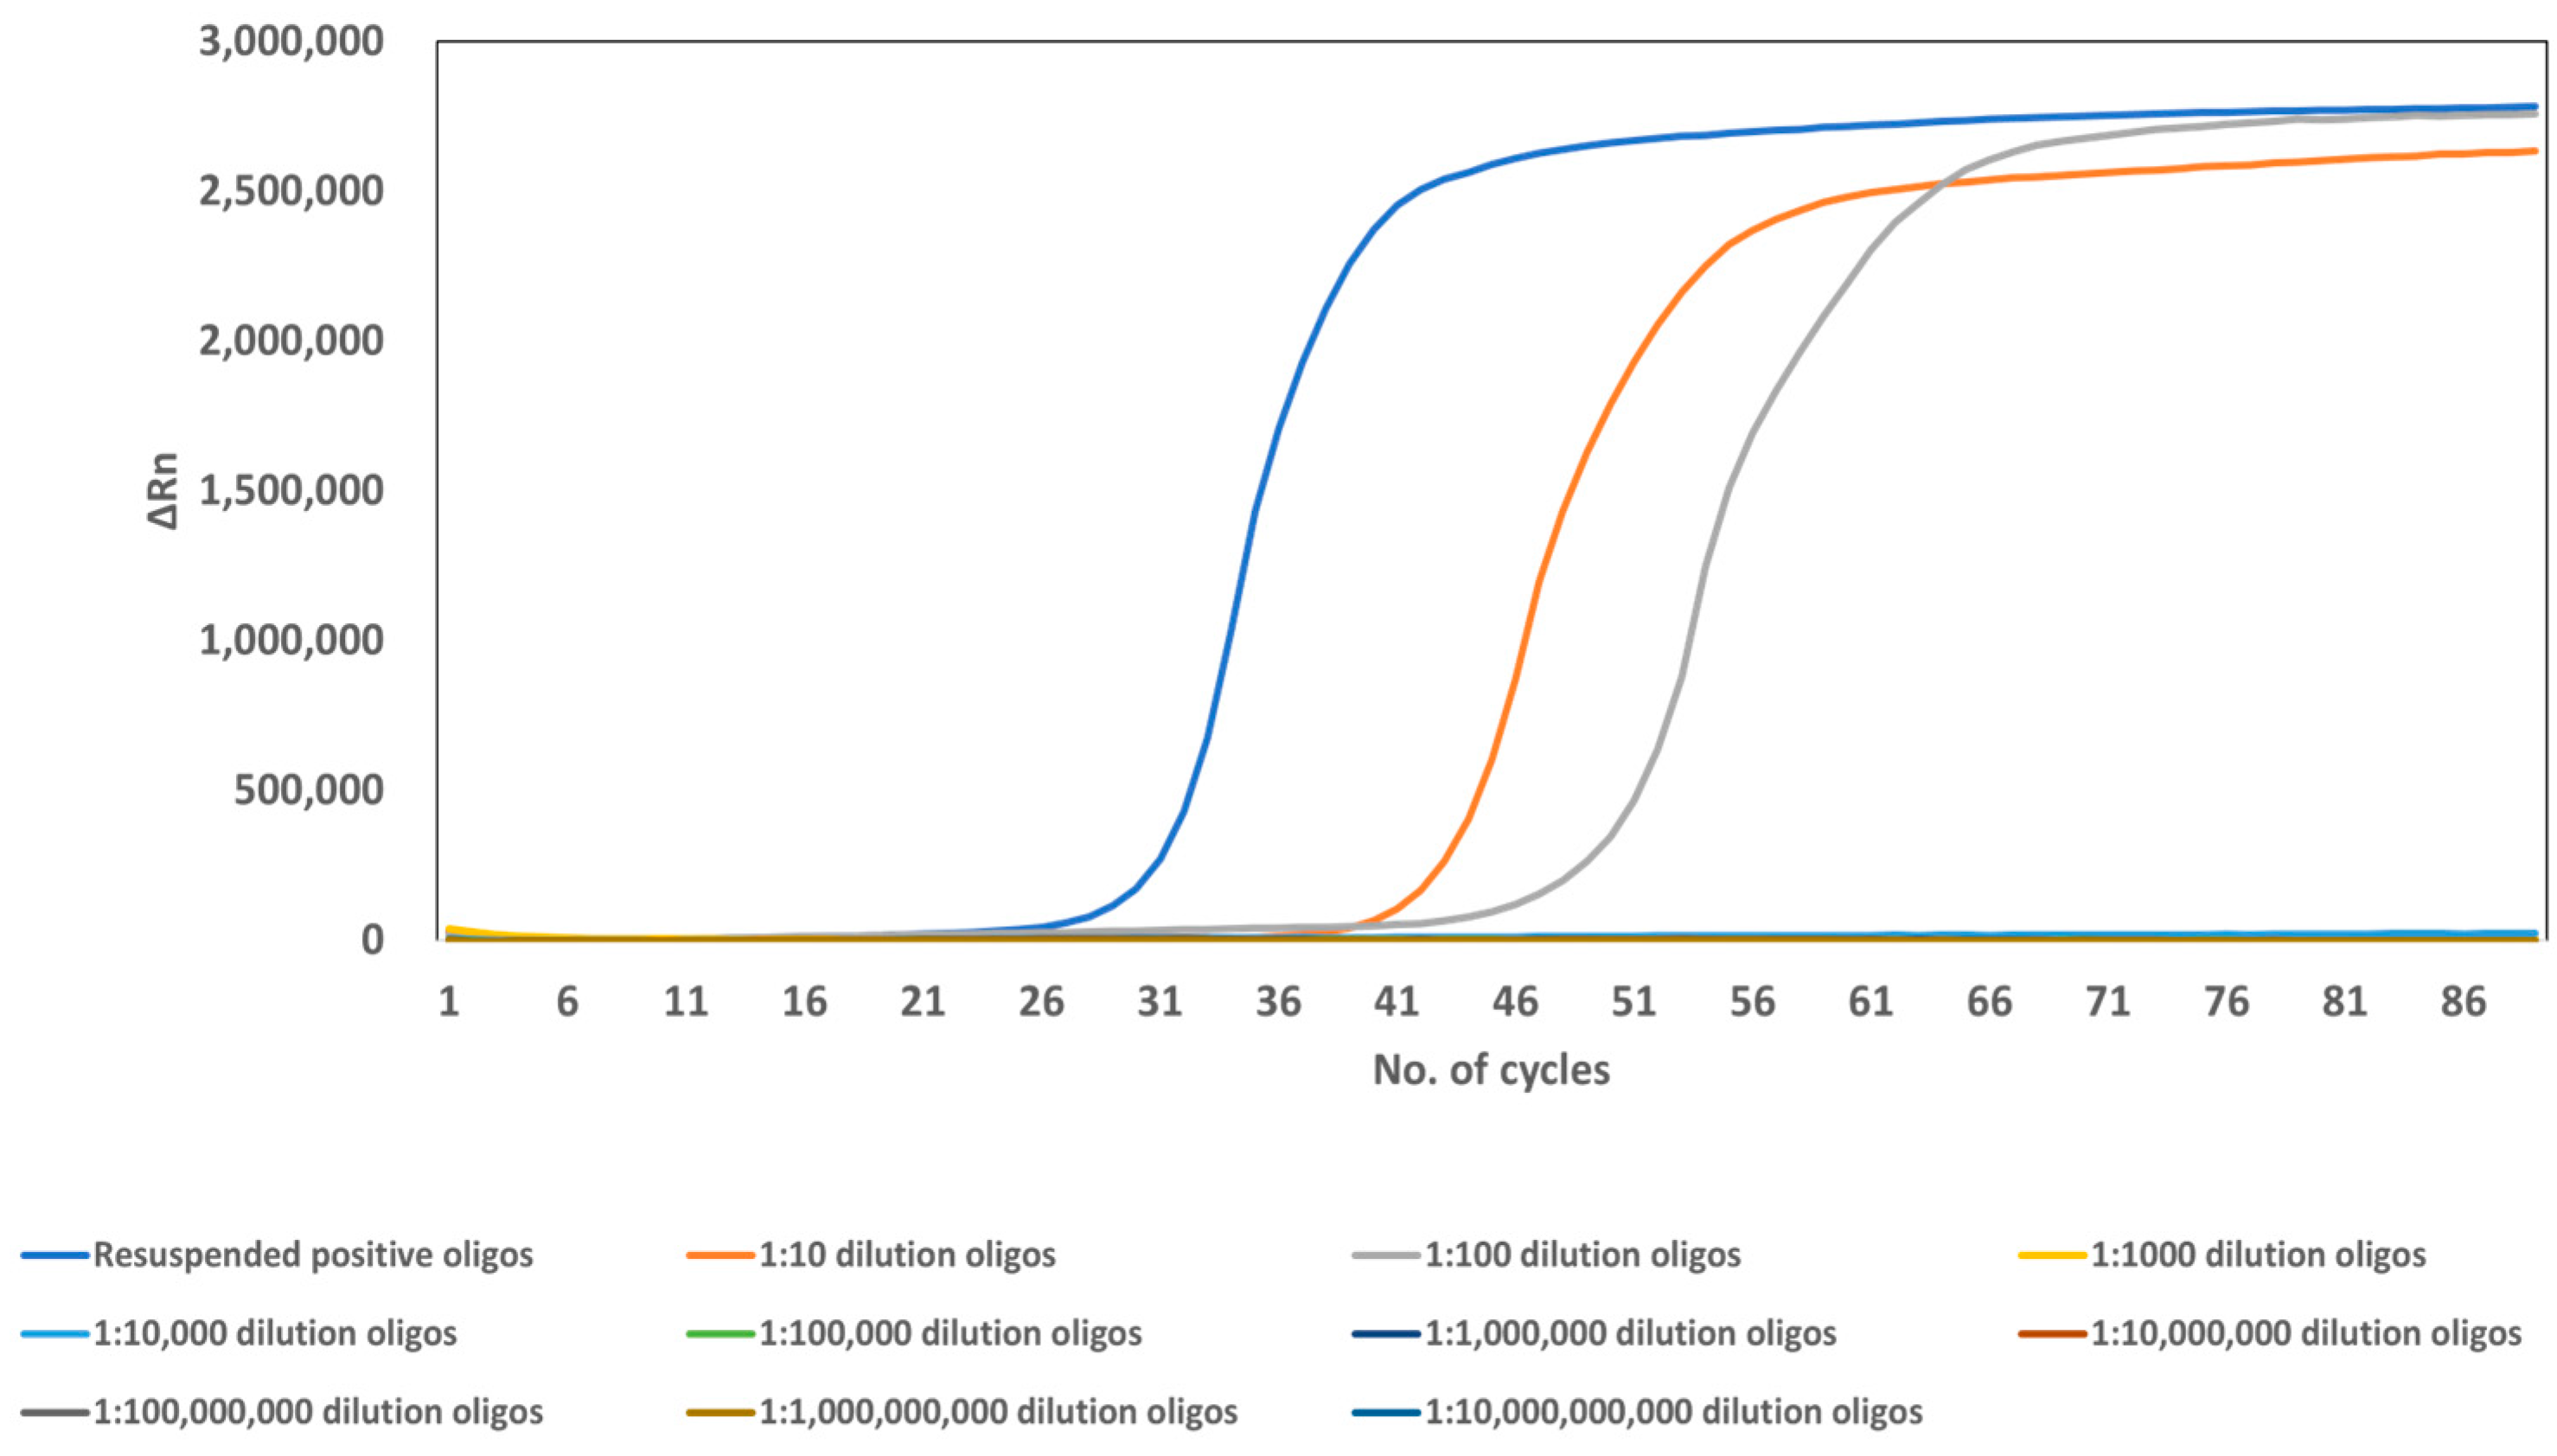
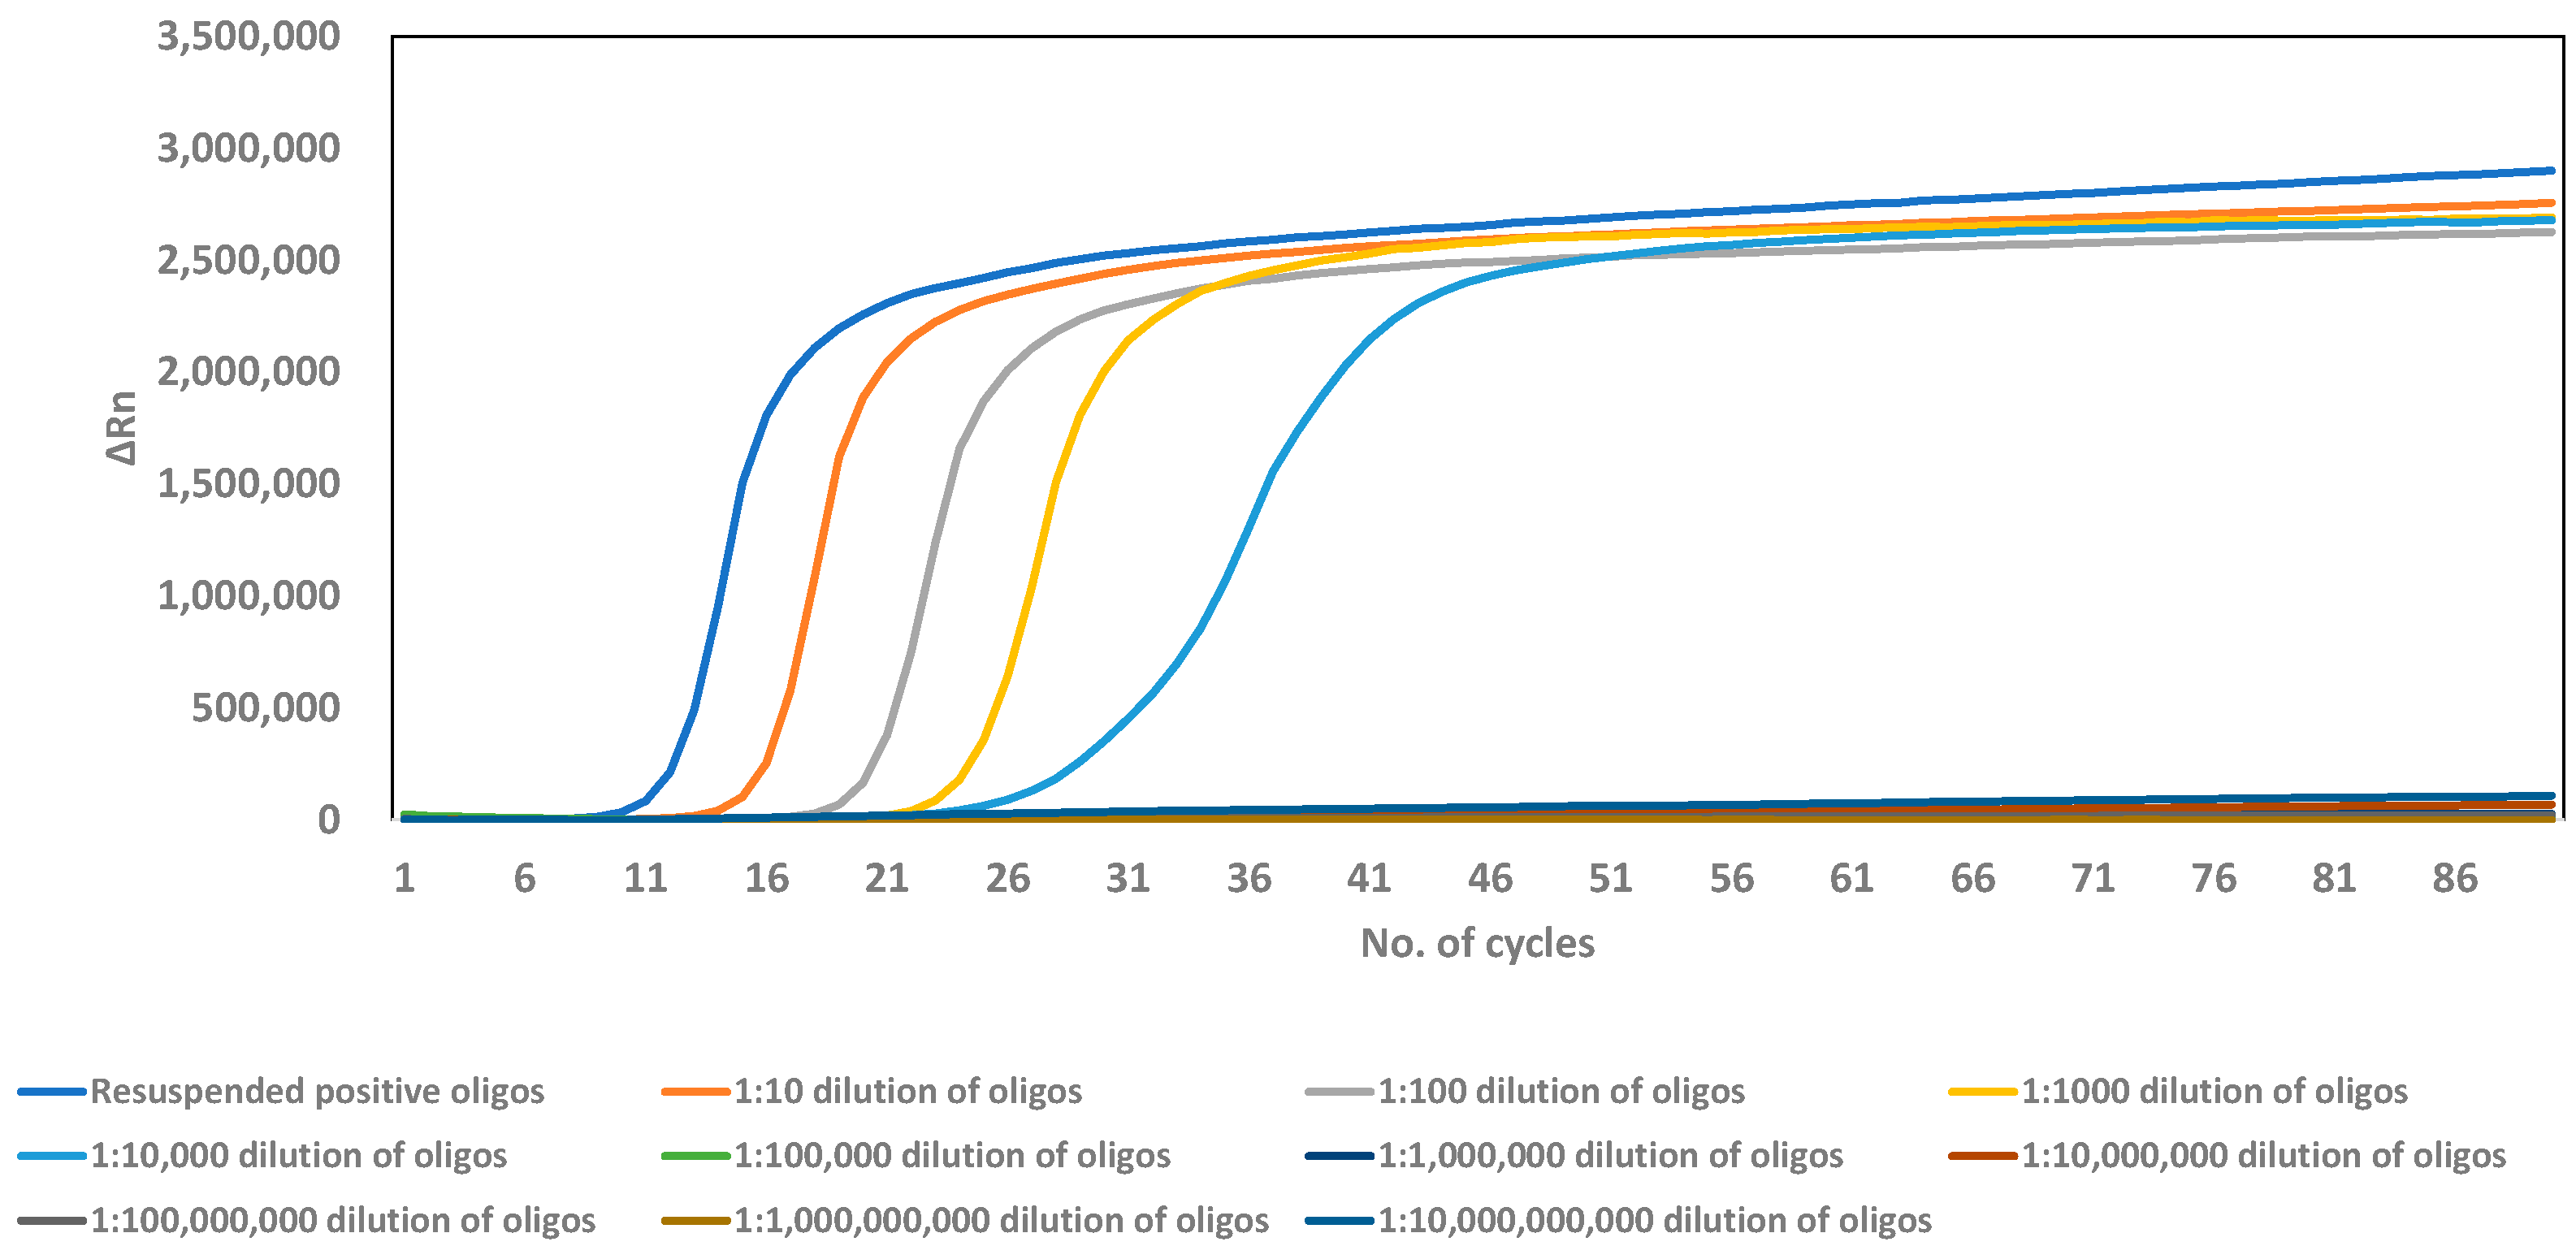
Sensitivity testing using serial dilutions of synthetic oligos demonstrated that the LAMP assays for S. salar (Cyt B) and G. salaris (COX1) reliably detected target DNA across a wide concentration range (Figure 8 and Figure 9). For S. salar, the resuspended oligo stock (100 ng in 1000 µL) corresponded to approximately 2.15 × 10⁷ molecules per µL. In the dilution series, the least dilution (10−10) contained a concentration of 0.00215 molecules. This sensitivity study for S. salar allowed detection up to 21,540 molecules (10−2) (Figure 8). In terms of mass (nanogram), the lower detection limit for S. salar was 1 ng, as determined by the oligo sensitivity test.
Similarly, the 100 ng of G. salaris oligo stock was mixed in 1000 µL of RNAse free water. This mixture of positive oligos corresponded to 21.49 × 10¹⁰ molecules in 1000 µL and 2.149 × 10⁸ molecules/µL. The sensitivity testing showed that the minimum detectable molecule counts for G. salaris was 2149 molecules in the 10−4 dilution (Figure 9) and the lower detection limit in mass was 0.01 ng. These calculations were adapted from a previous study on Northern pike [26]. Despite the low target concentrations, the designed primers reliably detected the target eDNA, as confirmed by our testing using both sampling methods. In general, LAMP sensitivity exceeds that of many other molecular techniques [27].

4. Discussion

The development of eDNA assays typically follows a five-stage validation framework that includes assay design, optimization, testing with environmental samples, determination of detection limits, and statistical estimation of detection probability [28,29,30]. Within this framework, the present study demonstrates that active and passive eDNA sampling methods, combined with LAMP-based detection, can reliably detect S. salar and G. salaris under riverine conditions characterized by variable flow and turbidity. Although later validation steps, particularly the quantification of detection probability under diverse environmental conditions, were beyond the scope of this study, our field results nonetheless provide insight into method performance under natural conditions.
Specifically, while host eDNA was consistently detected by both sampling approaches, parasite detection was substantially higher with active sampling. These method-dependent detection patterns are consistent with recent studies directly comparing active filtration and passive eDNA sampling across multiple genetic markers, which likewise reported method-specific differences in taxa detection despite the strong overall performance of both approaches [20].
Furthermore, systematic evaluations of passive sampler materials have shown that glass fibre (GF) filters often capture eDNA efficiently in both laboratory and field settings, sometimes matching or exceeding conventional water filtration for fish eDNA [31]. This supports our observation that passive GF membranes yielded substantially higher detection frequencies for both G. salaris and S. salar than cellulose acetate, which showed limited capture despite identical field exposure. GF’s high affinity for eDNA likely enhances the adsorption of both free and particle-associated DNA over the 8 h deployment, effectively integrating signals across temporal fluctuations in riverine eDNA shedding and transport. In the same study, they have shown that passive samplers can rapidly accumulate biologically meaningful eDNA signals, while longer deployments further enhance cumulative DNA capture by integrating temporal variability in eDNA shedding and transport [31]. Thus, in the present study, the 24 h deployment duration likely provided sufficient exposure for effective accumulation of both free and particle-associated eDNA on GF membranes. Likewise, filter pore size influences the efficiency of eDNA capture. Smaller pore sizes (e.g., 0.2–0.45 µm) generally retain more eDNA and improve species detection probability, although they are more prone to clogging in turbid conditions [14,32]. Their findings align with our observation that 0.2 µm active filters consistently detected both host and parasite eDNA more frequently than the coarse prefilter. However, the most consistent detections were observed for S. salar. These differences in capture efficiency highlight how sampling design can shape detection outcomes more broadly.
Turbidity and water flow are examples of environmental factors that could affect eDNA detection. By increasing particle collision with filter surfaces, high turbidity may improve passive eDNA capture, but it also introduces PCR inhibitors like humic substances such as complex natural organic materials formed from decomposition. LAMP assays are useful in turbid system because they are typically more resistant to inhibitors than PCR [33,34]. On the other hand, strong currents reduce the local detectability of rare taxa by raising the water flow and along with encouraging the eDNA dilution, which has been extensively documented in river systems [35]. The detection variability observed in the current study was probably influenced by spatial variation in water flow regimes.
Given that environmental conditions can strongly shape detection success, the choice of molecular target and assay design becomes equally important. The mitochondrial DNA target is found in high copy numbers per cell than nuclear DNA [36], thus increase the likelihood of detection in low concentration of eDNA samples [37,38]. The use of mitochondrial gene targets such as Cyt B for S. salar and COX1 for G. salaris, further improves the suitability of LAMP for eDNA applications. However, to reduce the cross amplification, careful in silico primer design and specificity assay is required when targeting parasite species within species-rich genera like Gyrodactylus. Such a step is important because mitochondrial loci of such species may be conserved across closely related taxa [39]. Due to unavailability of the non-target Gyrodactylus species for specificity testing, full taxonomic specificity could not be performed in this study. The assay was instead evaluated together with closely related salmonid species and common environmental bacteria. The designed assay verified that the LAMP reaction does not have cross-reactivity with the chosen species.
Nevertheless, G. salaris can be present in the water, and it has been shown that it still has an ability to spread rapidly and infect hundreds of fish [40]. Therefore, it is important to have knowledge of the detection limit if preventive measures are to be implemented in an environmental monitoring programme. Analysis of tissue-derived DNA samples revealed a relatively high detection limit of 2.15 × 10⁴ DNA copies per 25 µL for S. salar, while the parasite detection limit was 2.14 × 10³. Thus, further in silico primer optimization is necessary to improve sensitivity for S. salar detection.
From a future perspective, the present case study has certain limitations, as it focuses on a single sampling season. Expanding the analyses to include off-season sampling and resampling coupled with electrofishing would provide valuable comparative insights. Furthermore, applying rigorous statistical methods would enhance the robustness of the study and could contribute to the development of improved LAMP-based eDNA methodologies.

5. Conclusions

This study demonstrated the successful implementation of sampling approaches to detect eDNA of S. salar and G. salaris under environmental conditions, considering logistical factors such as site accessibility, sample transport, and storage. The newly developed LAMP assay for G. salaris showed effective detection in freshwater environments. The results indicate that, active sampling and passive sampling with glass fibre filters provide comparable detection of the host and parasite, although each method involves distinct operational and environmental considerations. Additionally, this study outlines practical field and laboratory protocols for applying LAMP-based eDNA monitoring to this host–parasite system. Despite limitations that prevented more extensive statistical assessment, the protocols and results presented here offer a valuable methodological foundation for future work. Ultimately, these findings may support the conservation and management of S. salar by improving the feasibility and reliability of eDNA-based detection tools and their application in on-site monitoring.

Author Contributions

N.J.: Field study, experiments, writing—review and editing; K.K.: Field study, writing—review and editing; F.K.: Writing, supervision; L.T.: Field study, experiments, writing—review and editing, supervision; L.E.R.: Field study, writing—review and editing, supervision. All authors have read and agreed to the published version of the manuscript.

Funding

This research was funded by “The Ministry of Education and Research (KD) and Norwegian Environment Agency” with the project no:2700116.

Institutional Review Board Statement

Not applicable.

Data Availability Statement

The original contributions presented in this study are included in the article. Further inquiries can be directed to the corresponding authors.

Acknowledgments

We would like to acknowledge Norwegian Micro- and Nano-Fabrication Facility (Project No: 295864 NORFAB III) for instruments. NJ would like to acknowledge the bio render for schematic diagram preparation.

Conflicts of Interest

The authors declare no competing interests.

References

  1. Malmberg, G. Om Forekomsten Av Gyrodactylus Pa Svenska Fiskar. Skr. Sod. Sver. Fisk. For. 1957, 19, 19–76. [Google Scholar]
  2. Mo, T.A.; Hansen, H.; Hytterød, S. Occurrence and Seasonality of Gyrodactylus salaris and G. Salmonis (Monogenea) on Arctic Char (Salvelinus alpinus (L.)) in the Fustvatnet Lake, Northern Norway. J. Fish Dis. 2023, 46, 395–403. [Google Scholar] [CrossRef] [PubMed]
  3. Appleby, C.; Mo, T.A. Population Dynamics of Gyrodactylus salaris (Monogenea) Infecting Atlantic Salmon, Salmo salar, Parr in the River Batnfjordselva, Norway. J. Parasitol. 1997, 83, 23. [Google Scholar] [CrossRef]
  4. Robertsen, G.; Hansen, H.; Bachmann, L.; Bakke, T.A. Arctic Charr (Salvelinus alpinus) Is a Suitable Host for Gyrodactylus salaris (Monogenea, Gyrodactylidae) in Norway. Parasitology 2007, 134, 257–267. [Google Scholar] [CrossRef]
  5. Hansen, H.; Fornes, G.J.; Mohammad, S.N.; Havn, J.; Amundsen, M.M.; Welde, H.I. The Surveillance Programme for Gyrodactylus salaris in Atlantic Salmon and Rainbow Trout in Norway 2022; Surveillance Program Report 20; Norwegian Veterinary Institute: Ås, Norway, 2023. [Google Scholar]
  6. Sigurd, H.; Mari, D.; Nasrin Mohammad, S.; Haakon, H. The Post-Treatment Control Programme to Ascertain Freedom from Infection with Gyrodactylus salaris in Atlantic Salmon 2017; Norwegian Veterinary Institute: Ås, Norway, 2018. [Google Scholar]
  7. Hansen, H.; Bachmann, L.; Bakke, T.A. Mitochondrial DNA Variation of Gyrodactylus Spp. (Monogenea, Gyrodactylidae) Populations Infecting Atlantic Salmon, Grayling, and Rainbow Trout in Norway and Sweden. Int. J. Parasitol. 2003, 33, 1471–1478. [Google Scholar] [CrossRef]
  8. Hansen, H.; Bakke, T.A.; Bachmann, L. DNA Taxonomy and Barcoding of Monogenean Parasites: Lessons from Gyrodactylus. Trends Parasitol. 2007, 23, 363–367. [Google Scholar] [CrossRef] [PubMed]
  9. Ficetola, G.F.; Miaud, C.; Pompanon, F.; Taberlet, P. Species Detection Using Environmental DNA from Water Samples. Biol. Lett. 2008, 4, 423–425. [Google Scholar] [CrossRef] [PubMed]
  10. Huang, S.; Yoshitake, K.; Watabe, S.; Asakawa, S. Environmental DNA Study on Aquatic Ecosystem Monitoring and Management: Recent Advances and Prospects. J. Environ. Manag. 2022, 323, 116310. [Google Scholar] [CrossRef]
  11. Stat, M.; John, J.; Dibattista, J.D.; Newman, S.J.; Bunce, M.; Harvey, E.S. Combined Use of eDNA Metabarcoding and Video Surveillance for the Assessment of Fish Biodiversity. Conserv. Biol. 2019, 33, 196–205. [Google Scholar] [CrossRef]
  12. Schumer, G.; Hansen, E.C.; Anders, P.J.; Blankenship, S.M. Development of a Quantitative Polymerase Chain Reaction Assay and Environmental DNA Sampling Methods for Giant Gartersnake (Thamnophis gigas). PLoS ONE 2019, 14, e0222493. [Google Scholar] [CrossRef]
  13. Bass, D.; Christison, K.W.; Stentiford, G.D.; Cook, L.S.J.; Hartikainen, H. Environmental DNA/RNA for Pathogen and Parasite Detection, Surveillance, and Ecology. Trends Parasitol. 2023, 39, 285–304. [Google Scholar] [CrossRef]
  14. Rusch, J.C.; Hansen, H.; Strand, D.A.; Markussen, T.; Hytterød, S.; Vrålstad, T. Catching the Fish with the Worm: A Case Study on eDNA Detection of the Monogenean Parasite Gyrodactylus salaris and Two of Its Hosts, Atlantic Salmon (Salmo salar) and Rainbow Trout (Oncorhynchus mykiss). Parasit. Vectors 2018, 11, 333. [Google Scholar] [CrossRef]
  15. Keikha, M. LAMP Method as One of the Best Candidates for Replacing with PCR Method. Malays. J. Med. Sci. 2018, 25, 121–123. [Google Scholar] [CrossRef] [PubMed]
  16. Soroka, M.; Wasowicz, B.; Rymaszewska, A. Loop-Mediated Isothermal Amplification (LAMP): The Better Sibling of PCR? Cells 2021, 10, 1931. [Google Scholar] [CrossRef]
  17. Foo, P.C.; Nurul Najian, A.B.; Muhamad, N.A.; Ahamad, M.; Mohamed, M.; Yean Yean, C.; Lim, B.H. Loop-Mediated Isothermal Amplification (LAMP) Reaction as Viable PCR Substitute for Diagnostic Applications: A Comparative Analysis Study of LAMP, Conventional PCR, Nested PCR (nPCR) and Real-Time PCR (qPCR) Based on Entamoeba Histolytica DNA Derived from Faecal Sample. BMC Biotechnol. 2020, 20, 34. [Google Scholar] [CrossRef]
  18. Thomas, A.C.; Howard, J.; Nguyen, P.L.; Seimon, T.A.; Goldberg, C.S. eDNA Sampler: A Fully Integrated Environmental DNA Sampling System. Methods Ecol. Evol. 2018, 9, 1379–1385. [Google Scholar] [CrossRef]
  19. Simmons, M.; Tucker, A.; Chadderton, W.L.; Jerde, C.L.; Mahon, A.R. Active and Passive Environmental DNA Surveillance of Aquatic Invasive Species. Can. J. Fish. Aquat. Sci. 2016, 73, 76–83. [Google Scholar] [CrossRef]
  20. Cananzi, G.; Tatini, I.; Li, T.; Montagna, M.; Serra, V.; Petroni, G. Active or Passive? A Multi-Marker Approach to Compare Active and Passive eDNA Sampling in Riverine Environments. Sci. Total Environ. 2025, 974, 179247. [Google Scholar] [CrossRef]
  21. Zhang, L.; Zhou, W.; Jiao, M.; Xie, T.; Xie, M.; Li, H.; Suo, A.; Yue, W.; Ding, D.; He, W. Use of Passive Sampling in Environmental DNA Metabarcoding Technology: Monitoring of Fish Diversity in the Jiangmen Coastal Waters. Sci. Total Environ. 2024, 908, 168298. [Google Scholar] [CrossRef] [PubMed]
  22. Verdier, H.; Konecny-Dupre, L.; Marquette, C.; Reveron, H.; Tadier, S.; Grémillard, L.; Barthès, A.; Datry, T.; Bouchez, A.; Lefébure, T. Passive Sampling of Environmental DNA in Aquatic Environments Using 3D-printed Hydroxyapatite Samplers. Mol. Ecol. Resour. 2022, 22, 2158–2170. [Google Scholar] [CrossRef]
  23. Bessey, C.; Gao, Y.; Truong, Y.B.; Miller, H.; Jarman, S.N.; Berry, O. Comparison of Materials for Rapid Passive Collection of Environmental DNA. Mol. Ecol. Resour. 2022, 22, 2559–2572. [Google Scholar] [CrossRef]
  24. Bardal, H. Now the Fight Against Gyro Begins in the Drammen Region; Norwegian Veterinary Institute: Ås, Norway, 2025. [Google Scholar]
  25. Jothinarayanan, N.; Pham, C.H.; Karlsen, F.; Roseng, L.E. eDNA-Based Survey of Fish Species in Water Bodies Using Loop-Mediated Isothermal Amplification (LAMP) for Application of Developing Automatic Sampler. Methods Protoc. 2024, 7, 85. [Google Scholar] [CrossRef] [PubMed]
  26. Jothinarayanan, N.; Karlsen, F.; Roseng, L.E. Comparative Evaluation of Loop-mediated Isothermal Amplification and PCR for Detection of Esox lucius Housekeeping Genes for Use in On-site Environmental Monitoring. J. Fish Biol. 2023, 103, 897–905. [Google Scholar] [CrossRef]
  27. Peterson, D.L.; Kyle, K.; Sallé, A.; Pecori, F.; Migliorini, D.; Santini, A.; Luchi, N.; Cleary, M. Specificity and Sensitivity of a Rapid LAMP Assay for Early Detection of Emerald Ash Borer (Agrilus planipennis) in Europe. Forests 2023, 14, 436. [Google Scholar] [CrossRef]
  28. Thalinger, B.; Deiner, K.; Harper, L.R.; Rees, H.C.; Blackman, R.C.; Sint, D.; Traugott, M.; Goldberg, C.S.; Bruce, K. A Validation Scale to Determine the Readiness of Environmental DNA Assays for Routine Species Monitoring. Environ. DNA 2021, 3, 823–836. [Google Scholar] [CrossRef]
  29. Kageyama, S.A.; Hoogland, M.R.; Tajjioui, T.; Schreier, T.M.; Erickson, R.A.; Merkes, C.M. Validation of a Portable eDNA Detection Kit for Invasive Carps. Fishes 2022, 7, 363. [Google Scholar] [CrossRef]
  30. Sundt, M.Ø. Validation of a Species-Specific eDNA-Based Test System for Detecting Non-Indigenous American Lobster Homarus Americanus. Master’s Thesis, The University of Bergen, Bergen, Norway, 2021. [Google Scholar]
  31. Chen, X.; Kong, Y.; Zhang, S.; Zhao, J.; Li, S.; Yao, M. Comparative Evaluation of Common Materials as Passive Samplers of Environmental DNA. Environ. Sci. Technol. 2022, 56, 10798–10807. [Google Scholar] [CrossRef]
  32. Li, J.; Lawson Handley, L.; Read, D.S.; Hänfling, B. The Effect of Filtration Method on the Efficiency of Environmental DNA Capture and Quantification via Metabarcoding. Mol. Ecol. Resour. 2018, 18, 1102–1114. [Google Scholar] [CrossRef] [PubMed]
  33. Nwe, M.K.; Jangpromma, N.; Taemaitree, L. Evaluation of Molecular Inhibitors of Loop-Mediated Isothermal Amplification (LAMP). Sci. Rep. 2024, 14, 5916. [Google Scholar] [CrossRef] [PubMed]
  34. Kaneko, H.; Kawana, T.; Fukushima, E.; Suzutani, T. Tolerance of Loop-Mediated Isothermal Amplification to a Culture Medium and Biological Substances. J. Biochem. Biophys. Methods 2007, 70, 499–501. [Google Scholar] [CrossRef]
  35. Fossøy, F.; Brandsegg, H.; Sivertsgård, R.; Pettersen, O.; Sandercock, B.K.; Solem, Ø.; Hindar, K.; Mo, T.A. Monitoring Presence and Abundance of Two Gyrodactylid Ectoparasites and Their Salmonid Hosts Using Environmental DNA. Environ. DNA 2020, 2, 53–62. [Google Scholar] [CrossRef]
  36. Castellani, C.A.; Longchamps, R.J.; Sun, J.; Guallar, E.; Arking, D.E. Thinking Outside the Nucleus: Mitochondrial DNA Copy Number in Health and Disease. Mitochondrion 2020, 53, 214–223. [Google Scholar] [CrossRef] [PubMed]
  37. Thomsen, P.F.; Kielgast, J.; Iversen, L.L.; Møller, P.R.; Rasmussen, M.; Willerslev, E. Detection of a Diverse Marine Fish Fauna Using Environmental DNA from Seawater Samples. PLoS ONE 2012, 7, e41732. [Google Scholar] [CrossRef] [PubMed]
  38. Clare, E.L.; Economou, C.K.; Bennett, F.J.; Dyer, C.E.; Adams, K.; McRobie, B.; Drinkwater, R.; Littlefair, J.E. Measuring Biodiversity from DNA in the Air. Curr. Biol. 2022, 32, 693–700.e5. [Google Scholar] [CrossRef]
  39. Jørgensen, T.; Larsen, T.; Jørgensen, L.; Bresciani, J.; Kania, P.; Buchmann, K. Characterisation of a Low Pathogenic Form of Gyrodactylus salaris from Rainbow Trout. Dis. Aquat. Organ. 2007, 73, 235–244. [Google Scholar] [CrossRef]
  40. Bakke, T.; Harris, P.; Cable, J. Host specificity dynamics: Observations on gyrodactylid monogeneans. Int. J. Parasitol. 2002, 32, 281–308. [Google Scholar] [CrossRef]
Figure 1. Illustration of eDNA sampling techniques employed in Sande River in this study.
Fishes 11 00101 g001
Figure 2. Illustration of eDNA extraction from filters acquired via active and passive sampling methods.
Fishes 11 00101 g002
Figure 3. Each chart demonstrates the detection of S. salar eDNA using different sampling methods and filter types. The upper panel (bars in orange) shows the result from active sampling method with subsequent filtration using two different pore size filters—(a) 50 µm pore size filter, (b) 0.2 µm pore size filter—while the lower panel (bars in green) shows the result from passive sampling method with two types of filter paper, (c) cellulose acetate filter paper—0.2 µm, (d) glass fibre filter paper—1 µm. Glass fibre filters exhibit better performance than cellulose acetate in detecting target eDNA.
Fishes 11 00101 g003
Figure 4. Each chart demonstrates the detection of G. salaris eDNA using different sampling methods and filter types. The upper panel (bars in orange) shows the result from active sampling method with subsequent filtration using two different pore size filters—(a) 50 µm pore size filter, (b) 0.2 µm pore size filter—while the lower panel (bars in green) shows the result from passive sampling method with two types of filter paper, (c) cellulose acetate filter paper—0.2 µm, (d) glass fibre filter paper 1 µm.
Fishes 11 00101 g004
Figure 5. Specificity test of S. salar Cyt B LAMP primers against the target species and ten non-target species. The amplification curve shows a strong positive signal only for S. salar (purple line), while all non-target species and the negative control remain at baseline throughout the reaction. The inset panel provides a magnified view of the baseline region (ΔRn 0–120 K), confirming that all non-target species exhibit no amplification, indicating high primer specificity.
Fishes 11 00101 g005
Figure 6. Specificity test of G. salaris COX1 LAMP primers against the target species and ten non-target species. The amplification curve shows a strong positive signal only for G. salaris (red line), while all non-target species and negative controls remain at baseline throughout the reaction. The inset panel provides a magnified view of the baseline region (ΔRn 0–50 K), confirming that all non-target species exhibit no amplification, indicating high primer specificity.
Fishes 11 00101 g006
Figure 7. Melt curve analysis of S. salar LAMP assay targeting Cyt B presented separately for direct interpretation. Chromatogram on the left shows positive samples with a single, sharp peak at ~84 °C, confirming specific amplification. The chromatogram on the right panel shows negative samples (non-target species and negative controls) with no distinct peak, indicating absence of non-specific amplification.
Fishes 11 00101 g007
Figure 8. Sensitivity test for S. salar positive oligos targeting the Cyt B gene. The test demonstrates detection down to a 10−2 dilution under assay condition. Amplification was observed at cycle 26 for positive oligos (undiluted) and at cycle 41 for 100-fold dilution.
Fishes 11 00101 g008
Figure 9. Sensitivity test for G. salaris positive oligos targeting the COX1 gene. The assay indicates the detection is up to 10−4 dilution under assay condition. Amplification was observed at cycle 10 for undiluted positive oligos and at cycle 23 for 10,000-fold dilution.
Fishes 11 00101 g009
Table 1. Shows the environmental conditions of sample sites from S1 to S5 with GPS coordinates underneath in row one. The temperature was measured by an electronic thermometer and pH was measured by litmus paper with colour change.
Parameters Considered During Sample Collection S1
(59.646114,
10.220543)
S2
(59.630261,
10.229855)
S3
(59.629052,
10.229953)
S4
(59.627414,
10.229681)
S5
(59.587583,
10.209606)
Water depth50–60 cm30–80 cm30 cm30–40 cm60 cm
Water temperature10.61413.313.813.6
Air temperature16.32120.317.118.1
Water pH5 to 66666
Table 2. LAMP primer sequence for the target species of host parasite system.
Name of the TargetSequence (5′–3′)Primer Type
S. salarTTCTGAGGAGCCACTGTAAF3
AGGATGTTAGGCCAAGTAGTAB3
GGAATAGGAAGTGGAAGGCGAAGCCCTTGTACAATGAATTTGAG FIP
GCTGCCACAGTACTCCATCTTCTATCGGCATCGGAGTTGA BIP
GGTGGCGTTGTCTACAGAA Loop F
GTCTAATAACCCAGCAGGCA Loop B
G. salarisTCCGTGAATATTAAGGACACTGF3
ATAGAGAACATGGCGAACACB3
CGCCCACTGGGTCAAAGAATAGCCGCTGGGATAACAAFIP
TTTGGTTCTTTGGCCACCCATGACTAATCATACCGAATGCCBIP
ATGAGTTGAAGTTCCGGTCAALoop F
GAGGTGTACGTGCTAATACTCCLoop B
Disclaimer/Publisher’s Note: The statements, opinions and data contained in all publications are solely those of the individual author(s) and contributor(s) and not of MDPI and/or the editor(s). MDPI and/or the editor(s) disclaim responsibility for any injury to people or property resulting from any ideas, methods, instructions or products referred to in the content.