Article

Spatial and Economic Concentration of Offshore Mariculture in China: Insights from a Nation-Scale GIS Dataset

School of Economics and Management, Shanghai Ocean University, Shanghai 201306, China
*
Author to whom correspondence should be addressed.
Fishes 2026, 11(1), 62; https://doi.org/10.3390/fishes11010062
Submission received: 12 December 2025 / Revised: 9 January 2026 / Accepted: 16 January 2026 / Published: 18 January 2026
(This article belongs to the Special Issue Advances in Fisheries Economics)

Abstract

China is the world’s leading producer of offshore mariculture, contributing more than 60 percent of global output. Yet the provincial distribution of mariculture space and its economic concentration are still not well described at a comparable national scale. This study draws on a publicly available nation-scale GIS dataset extracted from Landsat 8 imagery from 2018 to map offshore mariculture across nine coastal provinces and to quantify spatial inequality and specialization. The mapped offshore mariculture footprint totals 733,840 ha. The distribution is sharply uneven. Fujian alone reaches 183,025 ha, nearly thirty times the area of Hainan. The Gini coefficient is 0.412, and concentration ratios show that the top three provinces account for 64.0 percent of the total area, and the top five account for 84.5 percent. Location quotient results indicate strong specialization in Fujian, Jiangsu, and Hebei, while Hainan and Guangxi remain marginal. Cluster analysis further identifies three development modes: large-scale expansion, medium-scale and relatively balanced growth, and small-scale dispersed production. Overall, the pattern is consistent with resource endowment, agglomeration effects, and path dependence. The findings point to the need for improved coastal spatial planning, stronger interprovincial technology diffusion, and differentiated governance that balances efficiency with equity and environmental sustainability.
Key Contribution: This paper provides a nation-scale, spatially explicit economic assessment of China’s offshore mariculture using a public GIS dataset. It quantifies provincial inequality, concentration, and specialization, and identifies three development modes with direct implications for more targeted and sustainable aquaculture governance.

1. Introduction

Marine aquaculture is now central to global seafood supply and coastal livelihoods. It supports food security, and it also creates jobs and income along the shore. In blue economy debates, it is often discussed as one pathway toward more sustainable use of marine resources [1,2]. Many studies also note that the ocean area that is biophysically suitable for aquaculture is far larger than what is currently used [3]. The practical constraint is not only space. It is governance. Expansion becomes risky when density rises faster than environmental and institutional capacity can respond.
This is why carrying capacity remains a recurring concept in aquaculture planning and management. In ecological terms, growth slows once resources and environmental conditions become limiting. In shellfish farming, Carver et al. describe carrying capacity through a density lens as the stocking level that raises output without eroding productivity [4]. Later work broadened the idea by placing ecosystem feedbacks at the center, asking whether farming can persist without unacceptable ecological damage [5]. Many studies, therefore, treat carrying capacity as multidimensional, often framed through ecological, physical, and social constraints that interact rather than operate in isolation [6,7]. Methods have also evolved, moving from early empirical approaches toward more formal modeling, including the logistic model [8], box models [9], and ecosystem models built on an Ecosystem Conceptual Model [10]. In this study, carrying capacity is used as a conceptual background. We do not estimate capacity thresholds directly. Instead, we focus on the spatial footprint and concentration of offshore mariculture, since persistent clustering is a practical signal of where cumulative pressure is more likely to accumulate and where planning attention is usually most urgent.
Spatial planning is the main policy instrument for translating such concerns into enforceable rules. Aquaculture spatial planning is typically embedded in broader marine spatial planning, with the aim of aligning production needs with environmental protection through zoning and site allocation [11,12]. In practice, planning often proceeds in three steps: zoning sea areas, screening sites, and establishing dedicated management zones so that regulation can be implemented on the water [13]. Yet in many coastal settings, farming space still expands faster than planning can be updated. That gap makes it important to describe, in a comparable way, where mariculture is located and how unevenly it is distributed.
The need is especially clear in China. FAO reports that aquaculture supplies more than half of the fish consumed globally, and China contributes over 60 percent of total output [14]. Such growth has brought obvious economic gains, but it has also sharpened tensions around spatial concentration, ecological stress in hotspot areas, and widening regional gaps. A spatial economic assessment is useful here, not as a substitute for ecological evaluation, but as a baseline that shows the geography of the footprint and the degree of provincial inequality.
Related research broadly falls into two strands. One strand advances methods for mapping aquaculture, most often through remote sensing. Liu et al. quantified raft and cage farming using satellite imagery and demonstrated that remote sensing can identify aquaculture zones across long coastal stretches [15]. Wang et al. developed an object-based, threshold-guided NDVI approach and highlighted how heterogeneous coastal environments can challenge automated extraction [16]. Methodologically, this work has progressed quickly, and broader inventories have also been developed along segments of the Chinese coast [17]. A second strand focuses on provincial or regional organization. For instance, evidence from Jiangsu links aquaculture agglomeration to infrastructure, market access, and policy support [18]. What remains limited is the connection between these two strands. Mapping studies often stop at describing footprints, while economic discussions of concentration typically lack a consistent, spatially explicit national baseline for comparison.
International experience underscores why that link matters. Concentrating aquaculture space can produce scale advantages in feed supply, logistics, and processing, while also heightening ecological risks such as disease outbreaks and environmental degradation [19]. Cromey et al. used the DEPOMOD model to quantify waste dispersion from marine cage farms and showed that once ecological carrying capacity is exceeded, benthic biodiversity declines [20]. Other studies document additional risks, including climate-driven harmful algal blooms interacting with nutrient enrichment [21], the broader potential for offshore fish farming under current and future conditions [22], accumulation of antifouling agents, therapeutants, and dissolved nutrients [23], and ecological risks to marine wildlife associated with offshore infrastructure [24]. These findings suggest that the spatial structure of mariculture is not a neutral pattern. It shapes both economic performance and sustainability pressure, and it therefore deserves measurement at scale.
Against this background, this study provides a national-scale, spatially explicit assessment of offshore mariculture concentration across China’s nine coastal provinces using a publicly available GIS dataset derived from Landsat 8 imagery for 2018. Recent remote sensing evidence indicates that most marine aquaculture remains concentrated in nearshore and shallow waters, with strong persistence over time [25]. GIS has also become a standard platform for integrating oceanographic, ecological, and socioeconomic data and supporting spatial decision making [26]. Prior work has developed marine GIS systems and coastal information platforms [27,28,29] and applied GIS to protected area planning [30], hydrodynamic visualization [31], ecological vulnerability evaluation [32], and aquaculture suitability assessment [33]. Building on these advances, we address three questions. First, how large is the mapped offshore mariculture footprint, and how unequal is it across provinces? Second, which provinces display relative specialization when the footprint is compared with coastline length? Third, can provinces be grouped into distinct development patterns when scale is considered together with geographic position?
The remainder of the paper is structured as follows. Section 2 describes the GIS dataset and analytical methods; Section 3 reports the empirical results; Section 4 discusses the findings in relation to the existing literature; and Section 5 provides the conclusion.

2. Materials and Methods

2.1. Research Workflow

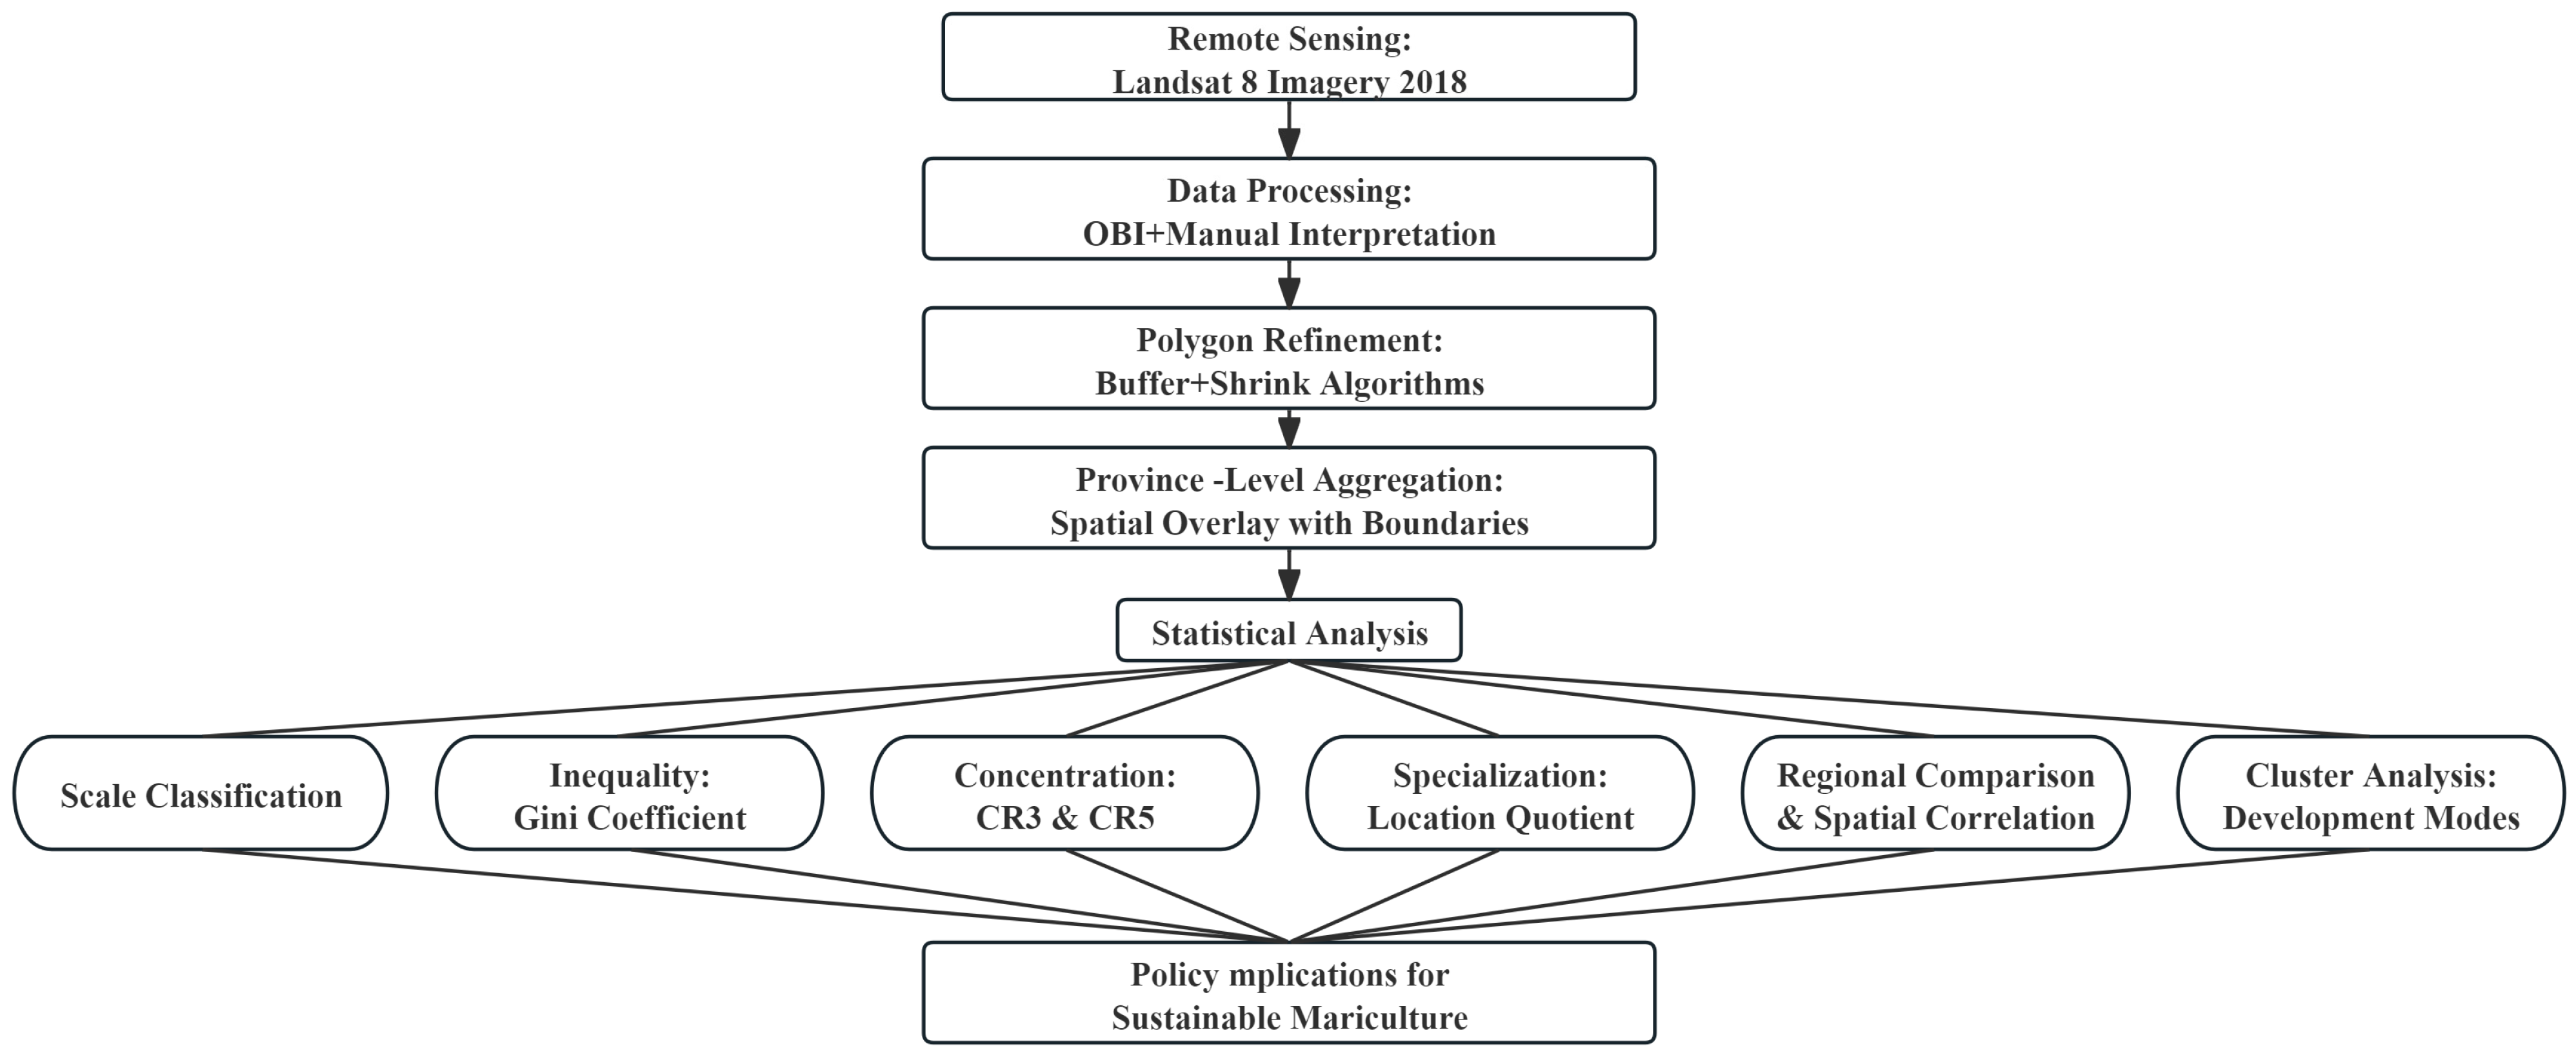
The research framework integrates remote sensing data acquisition, GIS-based spatial processing, and economic analysis. The complete workflow is illustrated in Figure 1. Firstly, from the Landsat 8 images along the coastline of the Chinese mainland, the aquaculture structures were extracted to generate a comprehensive dataset of offshore marine aquaculture. Then, the extracted features were converted into vector polygons and overlaid with the provincial administrative boundaries to construct a provincial database of marine aquaculture areas. Further, indicators such as the Gini coefficient, concentration ratio, and location quotient were calculated to explore spatial inequality, industrial concentration, and specialization. Finally, correlation and cluster analyses were conducted to study the relationship between the concentration of marine aquaculture and the geographical location of the provinces, and to identify typical spatial development patterns.

2.2. Data Source and Study Area

2.2.1. Background

China is the world’s largest producer of mariculture, exceeding the combined production of all other countries. Until recently, however, there was no spatially explicit dataset covering offshore mariculture across the entire nation [25], until the release of the public Landsat 8-derived dataset (2018) used in this study, which fills this gap.
Building on the above remote-sensing and GIS literature, we use a newly developed nation-scale GIS dataset derived from Landsat 8 imagery for the year 2018. The dataset covers nine coastal provinces and records a total of 733,840 hectares of offshore mariculture area. In our study, the remote-sensing literature is used in three practical ways: (i) it motivates a nearshore focus when defining the analysis domain (we extract and analyze mariculture areas within 100 km of the coastline); (ii) it informs the object-based image analysis workflow that combines spectral, textural, and geometric cues to delineate farms; and (iii) it underpins the validation strategy based on high-resolution imagery and expert checking, followed by manual refinement when necessary [25].

2.2.2. Dataset Source

The core offshore mariculture dataset used in this study is publicly accessible via the National Earth System Science Data Center, originally developed by Liu et al. (2020) based on Landsat 8 imagery (2018) [15]. In order to make the publicly available mariculture layer suitable for spatial economic assessment at the provincial scale, this study implemented a set of targeted coordination procedures. For the first time, the aquaculture polygon was combined with the 2018 provincial administrative boundaries of China released by the State Bureau of Surveying and Mapping. This coverage enables the verification of the provinces associated with each polygon and ensures the consistency of territorial attribution. This study then recalculates all polygonal areas within the WGS84 Albers equal-area conic system, which provides an equal-area basis and minimizes the measurement bias introduced by heterogeneous map projections on the coastline.
Geometric plausibility and positional credibility were assessed through validation exercises combined with the original quality control logic of the dataset. Using 1200 high-resolution Google Earth reference points, this study assessed polygon integrity and achieved an overall accuracy of 87.35%. The final analytical filter applied a 100 km coastal buffer to remove inland and pond-oriented aquaculture, thus focusing on the water-based mariculture structure. Because this buffer includes facilities near the coastline and further out in the sea, the term “offshore mariculture” has been used in this operational, data-driven sense.

2.2.3. Data Attribute

The mariculture dataset is stored as a vector-based polygon layer, in which each feature represents a continuous offshore aquaculture zone delineated from satellite imagery. Each polygon record contains three core attributes: the province name, the mariculture area, and the geometric representation of the aquaculture zone.
By intersecting the provincial administrative boundaries with the coastal buffer zones, the accurate spatial attributes of each province can be obtained. GIS can integrate polygonal spatial units to compute marine aquaculture coverage, enabling accurate assessment of the geographic extent of provincial aquaculture operations. Geometric information is preserved as a set of polygons capturing intricate spatial configurations such as several non-contiguous parcels within a single aquaculture zone. This public dataset covers nine coastal provinces in China: Shandong, Fujian, Guangdong, Guangxi, Hainan, Hebei, Jiangsu, Liaoning, and Zhejiang, which is consistent with the research scope.

2.2.4. Data Resolution and Accuracy

This mariculture dataset draws primary original image data from the Landsat 8 Operational Land Imager (OLI), a sensor providing 30 m multispectral resolution and 16 m panchromatic resolution. Integration of panchromatic and multispectral bands supports accurate recognition of aquaculture raft cages and other nearshore facilities at cartographic scales of around 1:50,000 or more detailed. While the spatial resolution is sufficient to delineate the general extent of mariculture zones, it does not allow the detection of finer structural details, such as individual cages. However, the dataset’s reliability was validated through cross-checking with 1200 reference points collected from high-resolution Google imagery, resulting in an overall accuracy of 87.35%.

2.3. Data Processing

2.3.1. Extraction of Mariculture Areas

An object-oriented image analysis (OBIA) technique was used to extract nearshore aquaculture areas from Landsat 8 remote sensing images. This project intends to carry out remote sensing observation and atmospheric correction of multi-period and multi-period remote sensing images, and decompose them into homogeneous ground objects representing water bodies and their associated structures. The spectral index, texture index, and morphological index were used to comprehensively identify the water body with open water, coastal wetland, and other sea areas.
The original classification results were manually edited to examine and improve them. In the case of adding missing blocks of known farmland areas, high-resolution images were used to correct misclassification, combined with existing local expertise. On this basis, the object-oriented automatic detection is combined with the targeted manual fine processing to obtain an efficient and reliable comprehensive map of the Marine aquaculture sea area.

2.3.2. Polygon Refinement

Aiming at the problem of 16–30 m high resolution image, a new post-processing method is proposed. Very small independent image blocks below the minimum rendering unit are examined and removed to reduce false detection due to mixed pixels and temporary human interference. On this basis, a new method based on remote sensing images is proposed, which is to extract the ground object information from remote sensing images by using the ground object information from remote sensing images. On this basis, this project intends to classify and classify mariculture in the coastal provinces and regions of our country.

2.3.3. Attribute Aggregation

In the final process, the detailed calculation of the administrative boundaries of each province and city is performed, and values are assigned to each province and city, respectively. In order to avoid the measurement distortion that often occurs in the estimation of coastal areas, the equal area projection method is used to calculate the area. For each province, the relevant polygons of each province and city are clustered to calculate the overall size of the sea area of each province and city, thus forming a data set suitable for economic analysis of each province.

2.4. Analytical Methods

2.4.1. Scale Classification

To clarify provincial heterogeneity in the coastal mariculture footprint, we aggregated the nearshore mariculture area by province and stratified it into three magnitude tiers. Provinces with <30,000 ha were treated as small, those spanning 30,000–100,000 ha as medium, and those exceeding 100,000 ha as large. This three-tier grouping highlights how uneven the scale of mariculture is across provinces and provides a simple basis for comparing their development profiles.

2.4.2. Inequality Analysis (Gini Coefficient)

The Gini coefficient [34] was used to measure the imbalance in the distribution of marine aquaculture in the nine coastal provinces. This coefficient was originally used to assess income inequality. Here, it has been adaptively applied to the allocation of spatial resources, replacing “income” with “the area of aquaculture in each province” and “population” with “the number of provinces (n = 9)”. This adjustment has been widely verified in spatial research, as it quantifies the deviation from the core logic of complete equality, and is also applicable to analyzing the regional distribution differences in aquaculture areas. Zheng et al. used the Lorenz curve and Gini coefficient to quantify the spatial inequality of land use structure, proving their effectiveness in the analysis of regional geographical resource distribution [35]. The Gini coefficient is defined as Equation (1):
G = i = 1 n j = 1 n x i x j 2 n 2 x ¯
where n is the number of provinces, x i and x j are provincial mariculture areas, and x ¯ is the mean. Values closer to 1 indicate greater inequality.

2.4.3. Concentration Ratios (CR3 and CR5)

Industrial dominance was evaluated using C R k indices [36], which is shown in Equation (2):
C R k = i = 1 k x i i = 1 n x i
where n is the total number of studied provinces and x i is the mariculture area of the i -th largest province. C R 3 and C R 5 represent the share of the top three and top five provinces, respectively. For example, C R 3 calculates the share of aquaculture area (from the public dataset) controlled by the top 3 provinces (Fujian, Jiangsu, Hebei), while C R 5 includes the top 5 (adding Guangdong and Liaoning).

2.4.4. Specialization (Location Quotient, LQ)

Provincial specialization was measured by the location quotient (LQ) [37], which is shown in Equation (3):
L Q i = x i X y i Y
where x i is the mariculture area of province i , X is the national total, y i is the coastal length of province i , and Y is the national total coastal length. LQ > 1 indicates specialization.

2.4.5. Regional Comparison

To reveal regional disparities, the provinces along the Chinese coastline were grouped into three macro-regions based on their geographic location. The central region comprises Shandong, Zhejiang, Jiangsu, and Fujian; the northern region includes Hebei and Liaoning; and the southern region encompasses Guangdong, Guangxi, and Hainan. The average and total farming areas for each region were compared separately to assess the differences in development scale.

2.4.6. Spatial Correlation and Cluster Analysis

Two supplementary analytical approaches were adopted to thoroughly explore the spatial attributes of provincial-scale marine aquaculture. Pearson’s correlation coefficients between marine aquaculture coverage and geographic positional data [38] were computed to detect potential spatial gradients. The K-means clustering method [39] was employed with provincial aquaculture area and spatial coordinates (latitude/longitude) as dual variables. Both variables underwent z-score standardization (mean = 0, standard deviation = 1) to eliminate biases from disparate units (area: ha; coordinates: decimal degrees). Cluster numbers from 2 to 5 were evaluated using the elbow method and the silhouette coefficient, yielding results of 2 clusters (silhouette coefficient = 0.58), 3 clusters (silhouette coefficient = 0.72, the highest), 4 clusters (silhouette coefficient = 0.63), and 5 clusters (silhouette coefficient = 0.51). Three clusters were selected based on the distinct “elbow” point in the elbow method (slowed reduction in within-cluster sum of squares) and the maximum silhouette coefficient indicating optimal differentiation of unique development patterns without over-clustering. Together, these steps partitioned the nine coastal provinces into three groups, which we interpret as distinct nearshore mariculture development patterns along China’s coastline.

2.5. Data Quality Control

Data quality was checked with a simple priority in mind: keep the time window consistent and avoid missing space. To limit seasonal effects and make provinces comparable, we only used imagery from 2018 [40]. A uniform 100 km buffer along the coastline was then used to represent the nearshore footprint. Accuracy was evaluated with 1200 reference points interpreted from high-resolution Google Earth imagery, yielding an overall classification accuracy of 87.35% [41].
We also cross-checked the mapped area against the 2019 China Fisheries Statistical Yearbook. The national totals aligned closely, differing only slightly, 733,840 ha in our map versus 731,600 ha in the Yearbook. At the provincial level, deviations ranged from −9.10% in Guangxi to 3.89% in Liaoning, which is more plausibly explained by differences in measurement scope and reporting practice than by mapping errors. One likely source of discrepancy is scope. Official statistics usually count nearshore pond farming, while our remote-sensing layer targets open-sea mariculture features and excludes ponds. Remote sensing records what is visible on the surface, whereas administrative statistics depend on local reporting and may miss some areas.

3. Results

3.1. Overall Scale of Offshore Mariculture

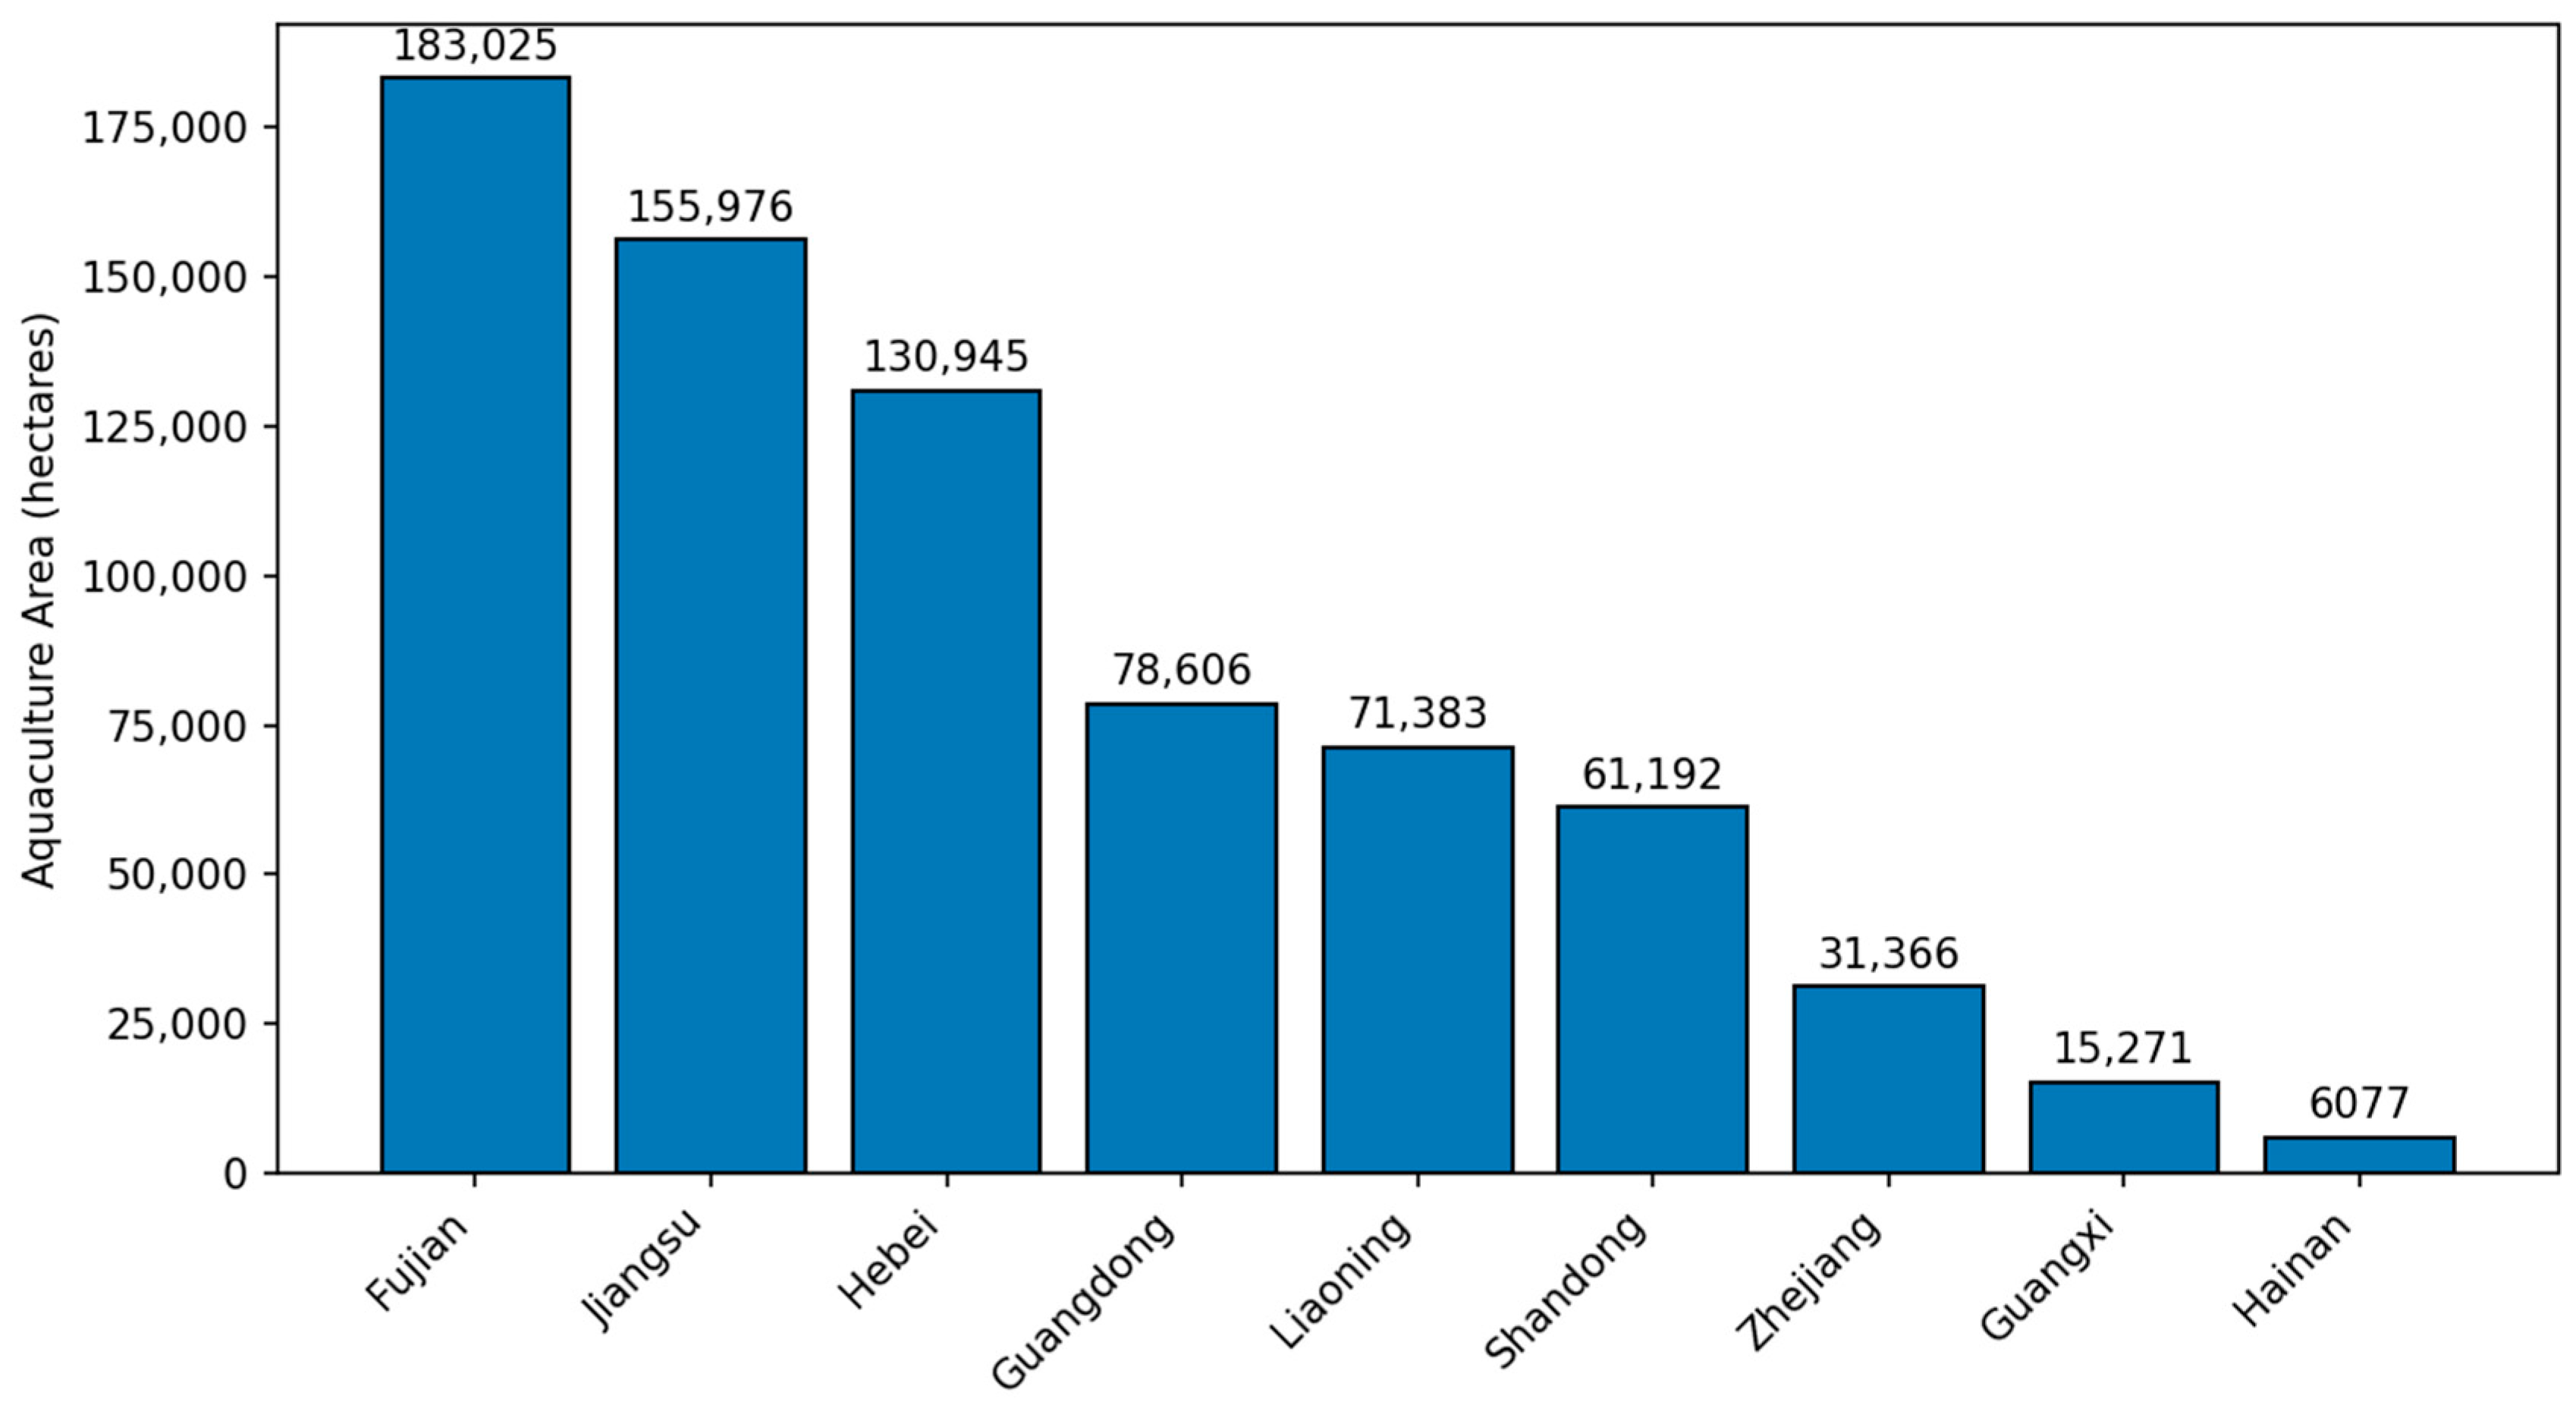
At the provincial level, the spatial dataset yields a total offshore mariculture area of 733,840 ha across the nine coastal provinces. The aggregate figure, however, hides a sharp gap. Fujian alone reaches 183,025 ha, whereas Hainan has only 6077 ha, almost a thirty-fold difference. This spatial polarization phenomenon is further confirmed by the index of location quotient (LQ), reflecting the stratified industrial structure. Among them, Fujian, Jiangsu, and Hebei have become specialized clusters, with location quotients ranging from 1.61 to 2.24; the other six provinces are all below 1, indicating that their aquaculture industry lacks relative advantages compared to the national average level. Province-level offshore mariculture area, specialization measured by LQ, and the corresponding rank are summarized in Table 1.
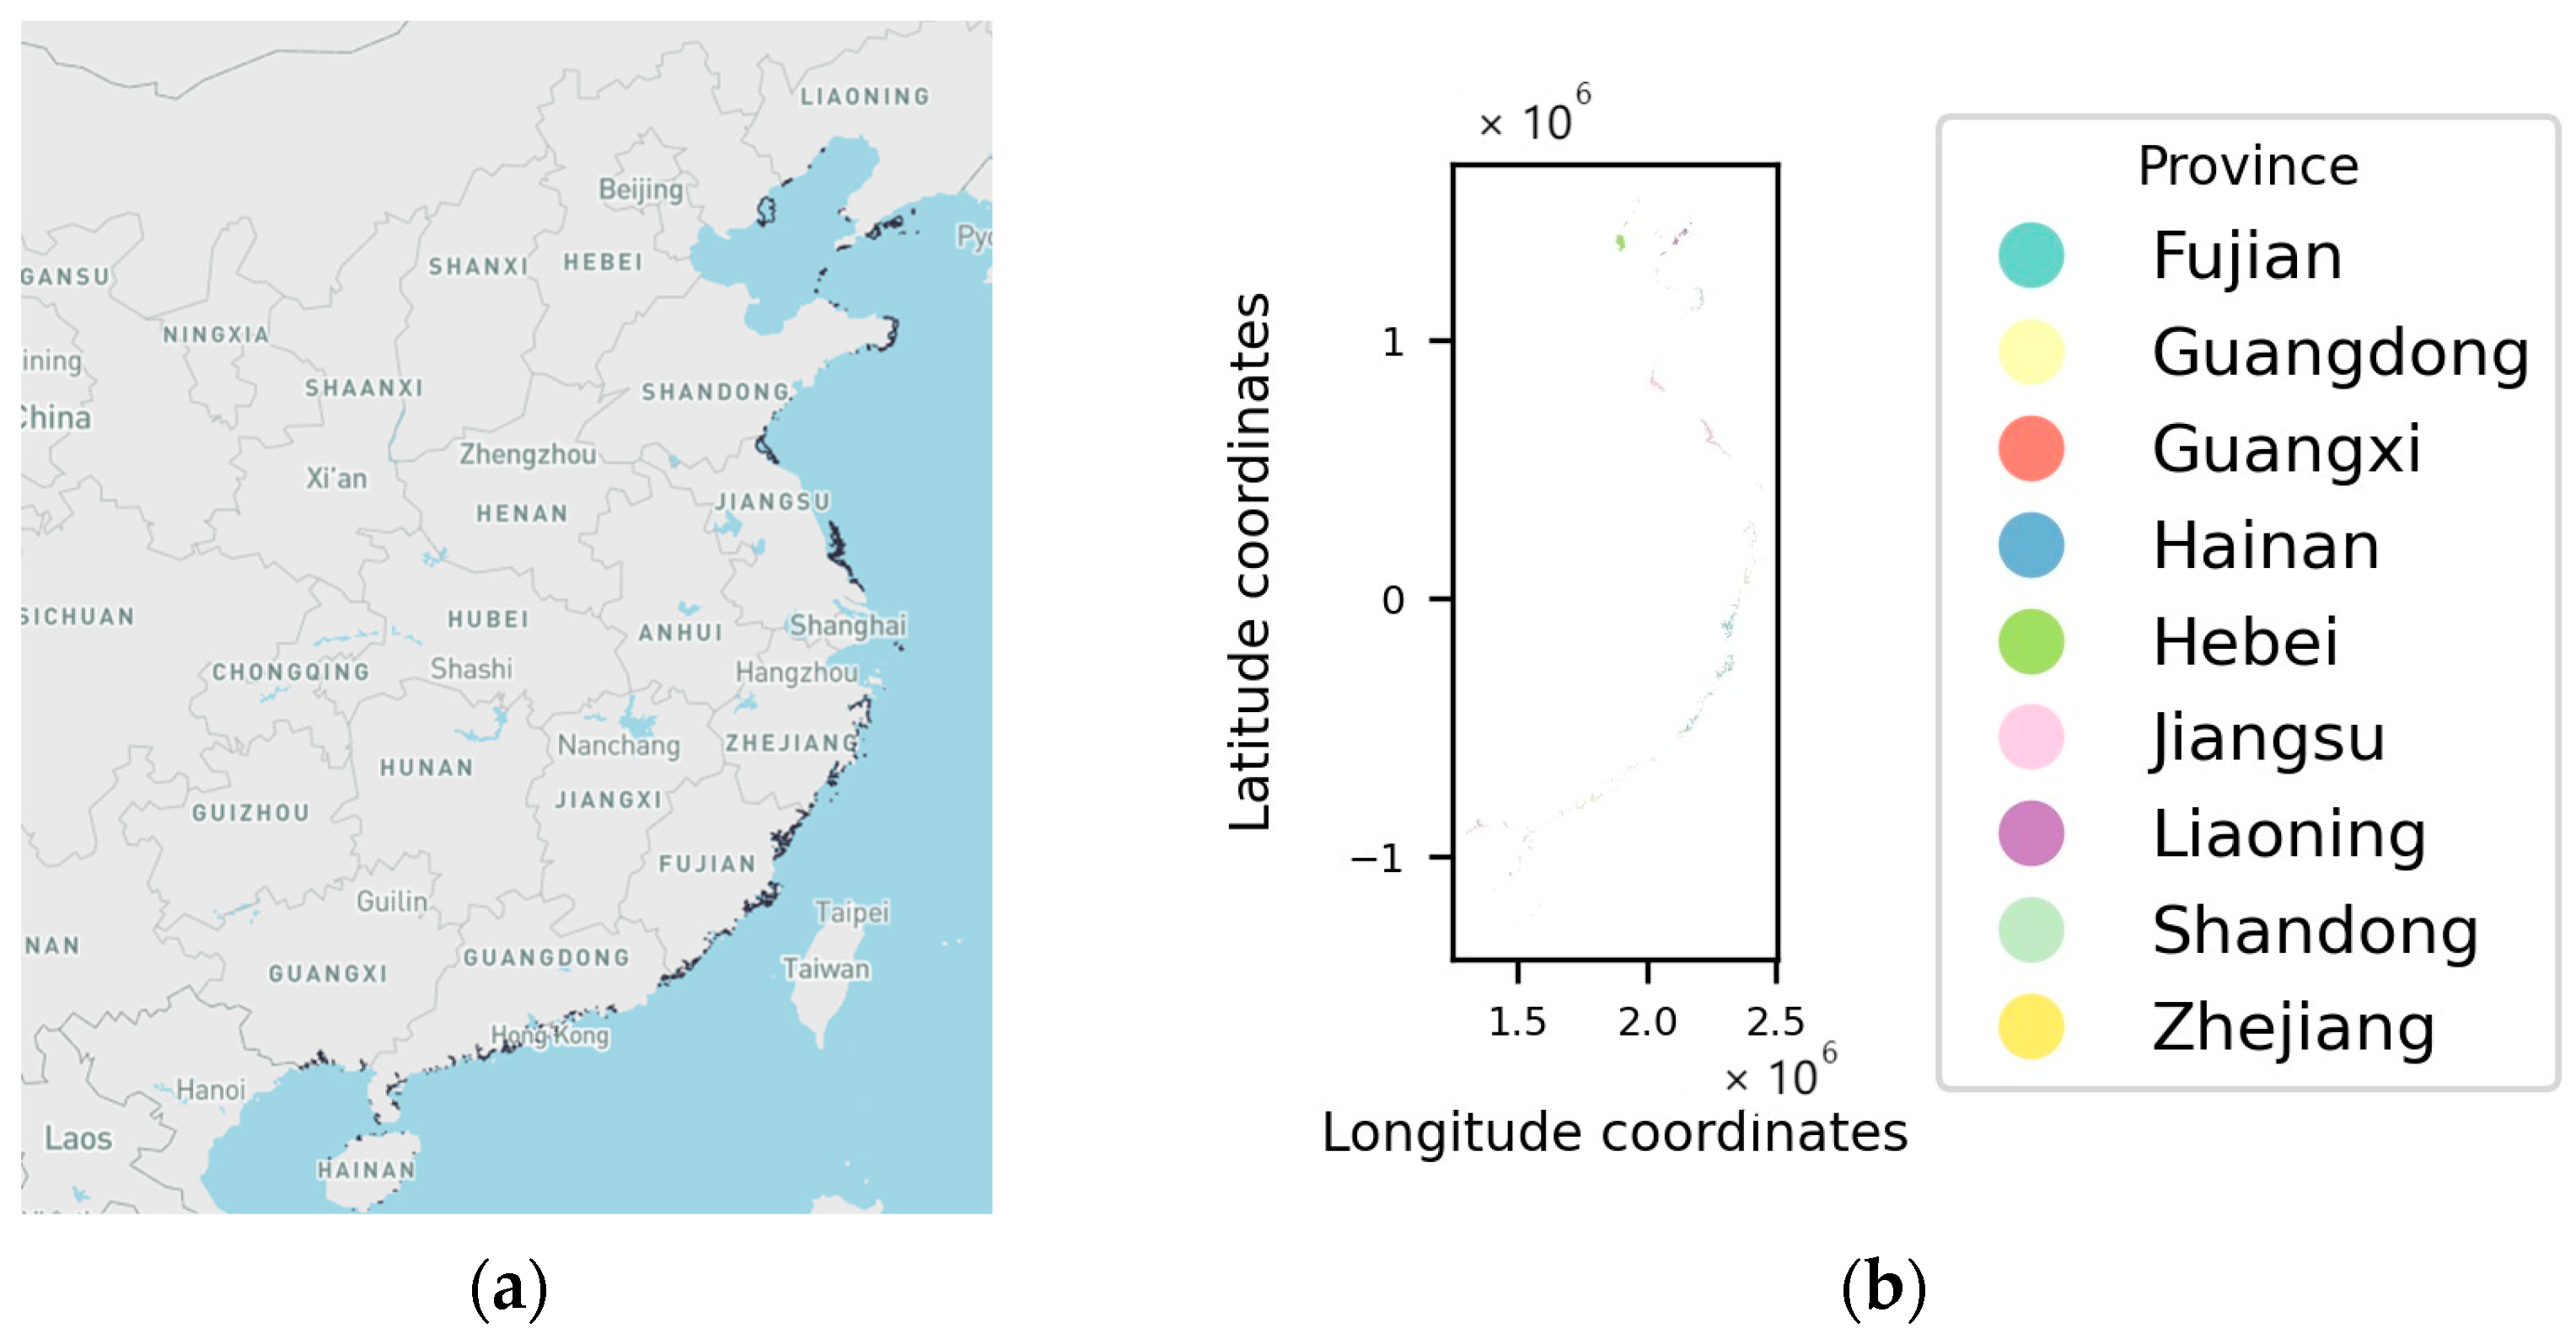
Figure 2 shows the distribution of aquaculture areas in the coastal provinces, combining map drawing and satellite image technology. The aquaculture areas are mainly concentrated in the eastern and southeastern coasts, which is attributed to the favorable natural conditions and a long history of development.

3.2. Regional Disparities

According to the division of north and south, the differences are obvious. The average sea-cultivation area in the northern provinces (Hebei, Liaoning, Shandong, Zhejiang) is 104,874 hectares, which is higher than that in the southern provinces (Fujian, Jiangsu, Guangdong, Guangxi, Hainan) at 62,869 hectares.
Figure 3 further shows the cultivation areas of each province. Fujian ranks first, followed by Jiangsu and Hebei. The overall superiority of the north is mainly attributed to the large-scale cultivation in Shandong and Hebei, while the south only reaches a similar level in Fujian and Jiangsu.
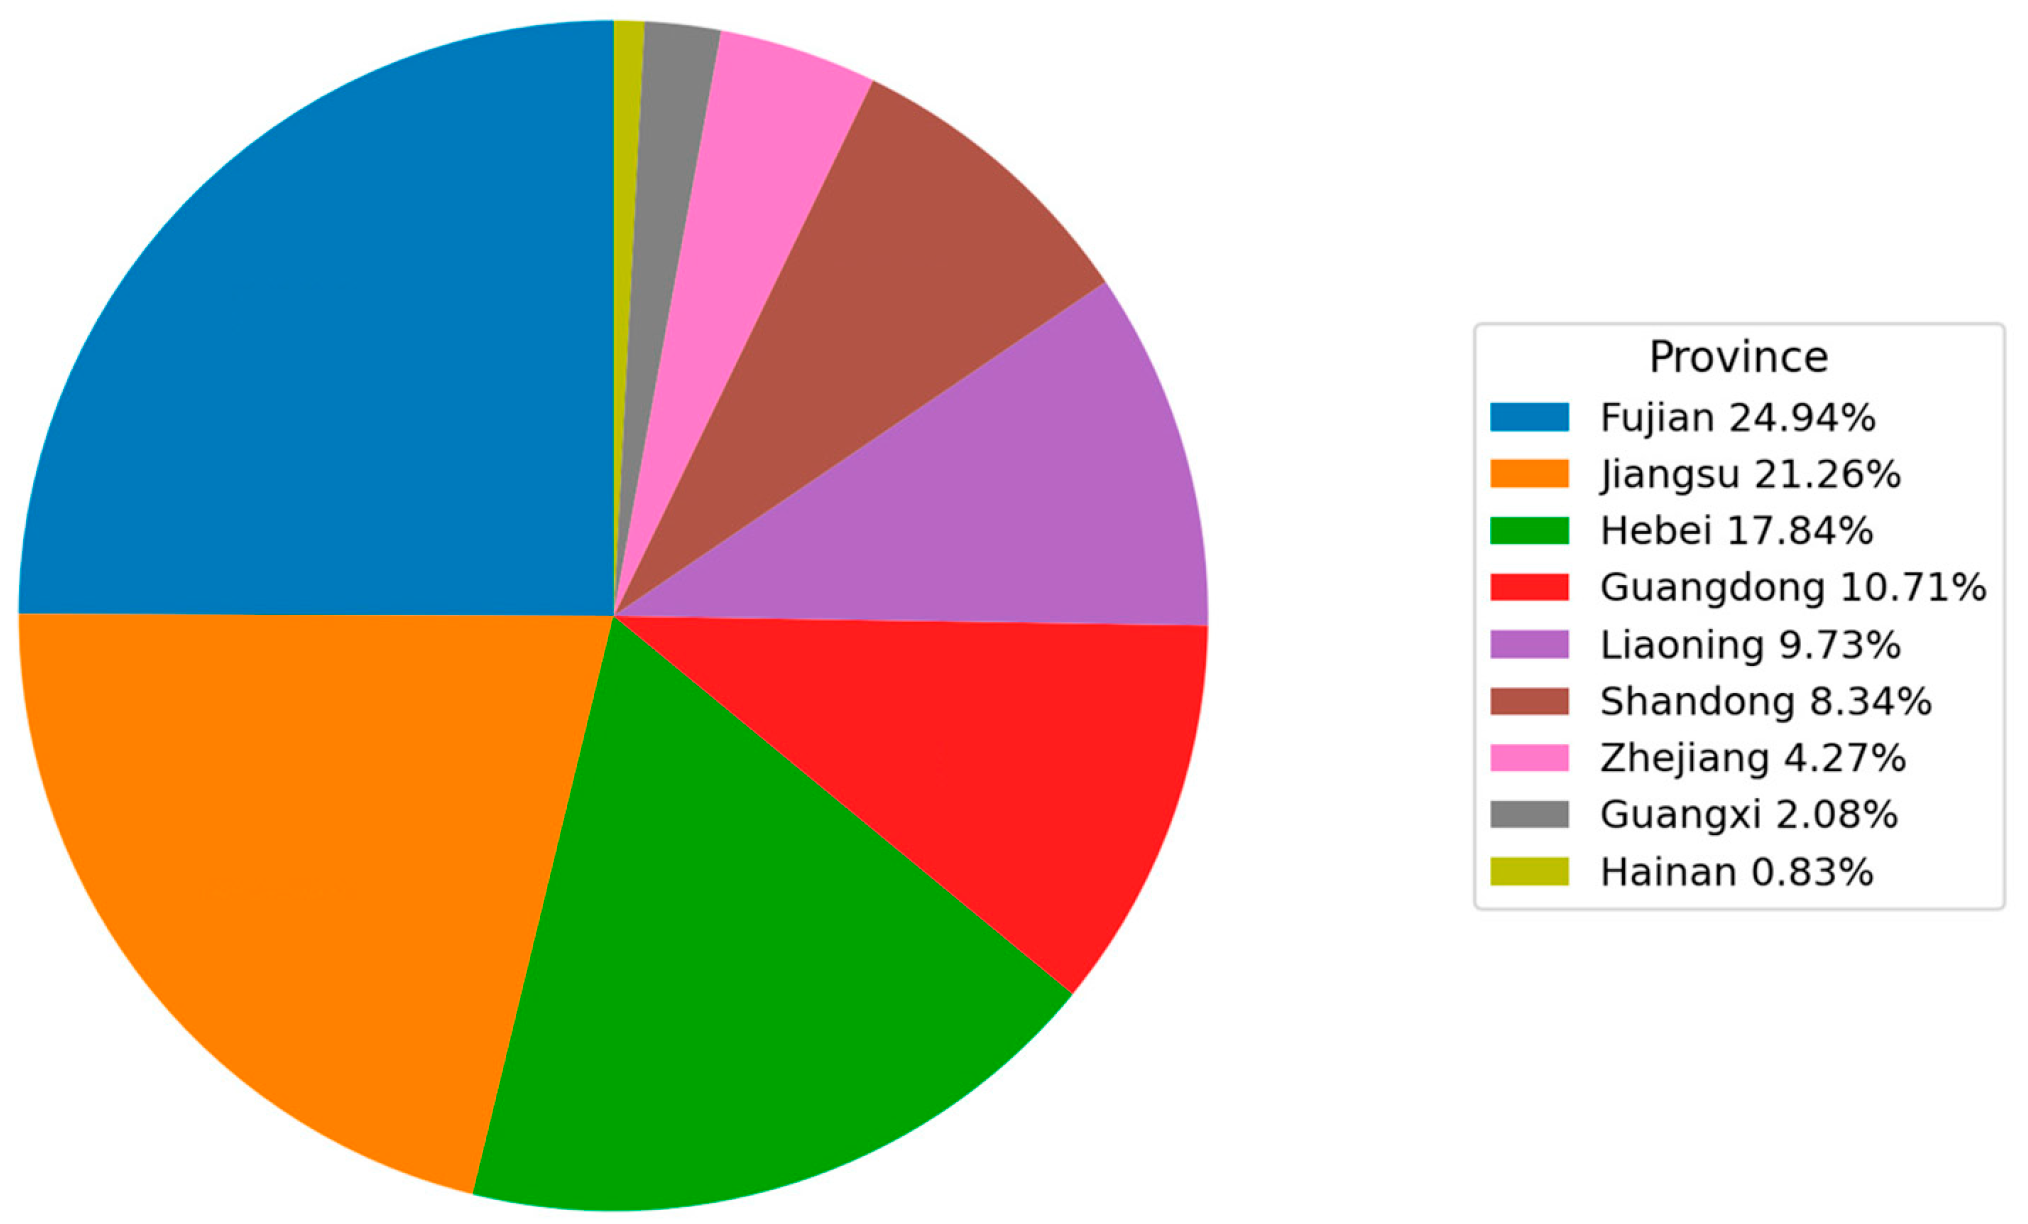
Figure 4 shows the contribution of each province to the national total output. Fujian alone accounted for 24.9%, while Jiangsu and Hebei provinces together accounted for nearly two-thirds of the national total output. Regions such as Guangxi and Hainan made relatively modest contributions by comparison. Such regional discrepancies suggest that natural conditions and regional policies exert a notable influence on the growth of open-sea aquaculture.

3.3. Inequality and Concentration

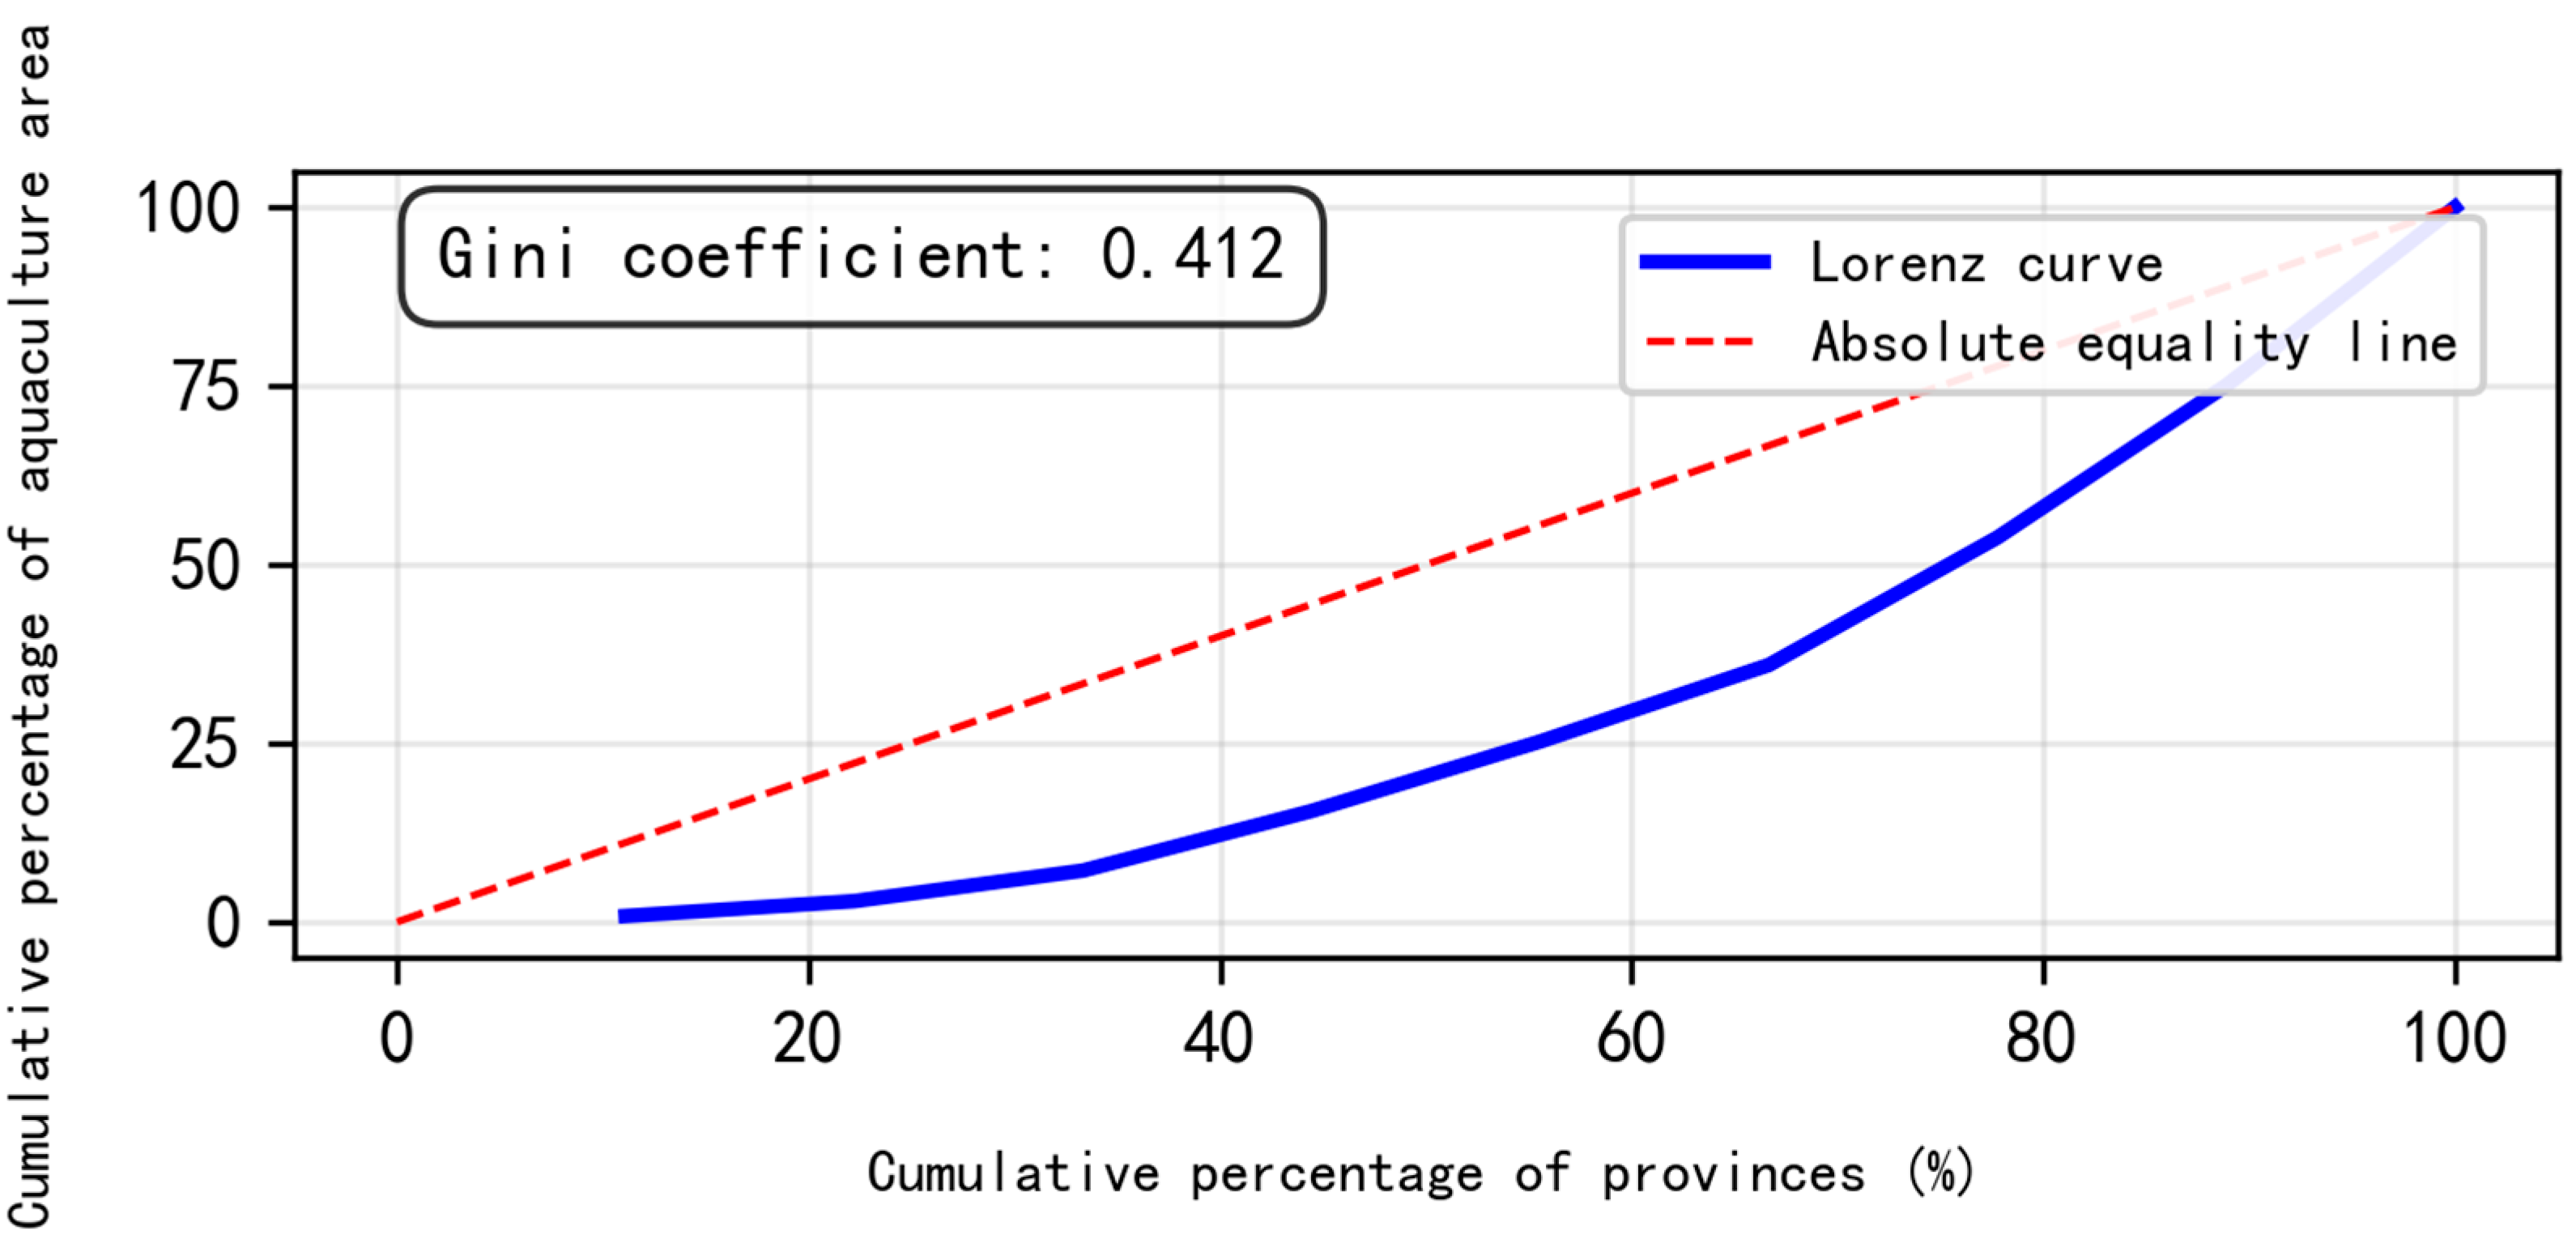
Clear spatial differences emerge from the dataset. At the provincial scale, the Gini coefficient reaches 0.412, suggesting that capacity is concentrated rather than evenly spread. The Lorenz curve in Figure 5 departs notably from the line of equality, visually reflecting such unevenness.
Spatial concentration assessment further confirms this tendency: CR3 (Fujian, Jiangsu, Hebei) stands at 64.0% CR5 climbs to 84.5%. Such data indicate that the marine aquaculture sector exhibits an oligopolistic spatial structure, with a small number of coastal provinces accounting for most of the national aquaculture capacity.

3.4. Provincial Specialization

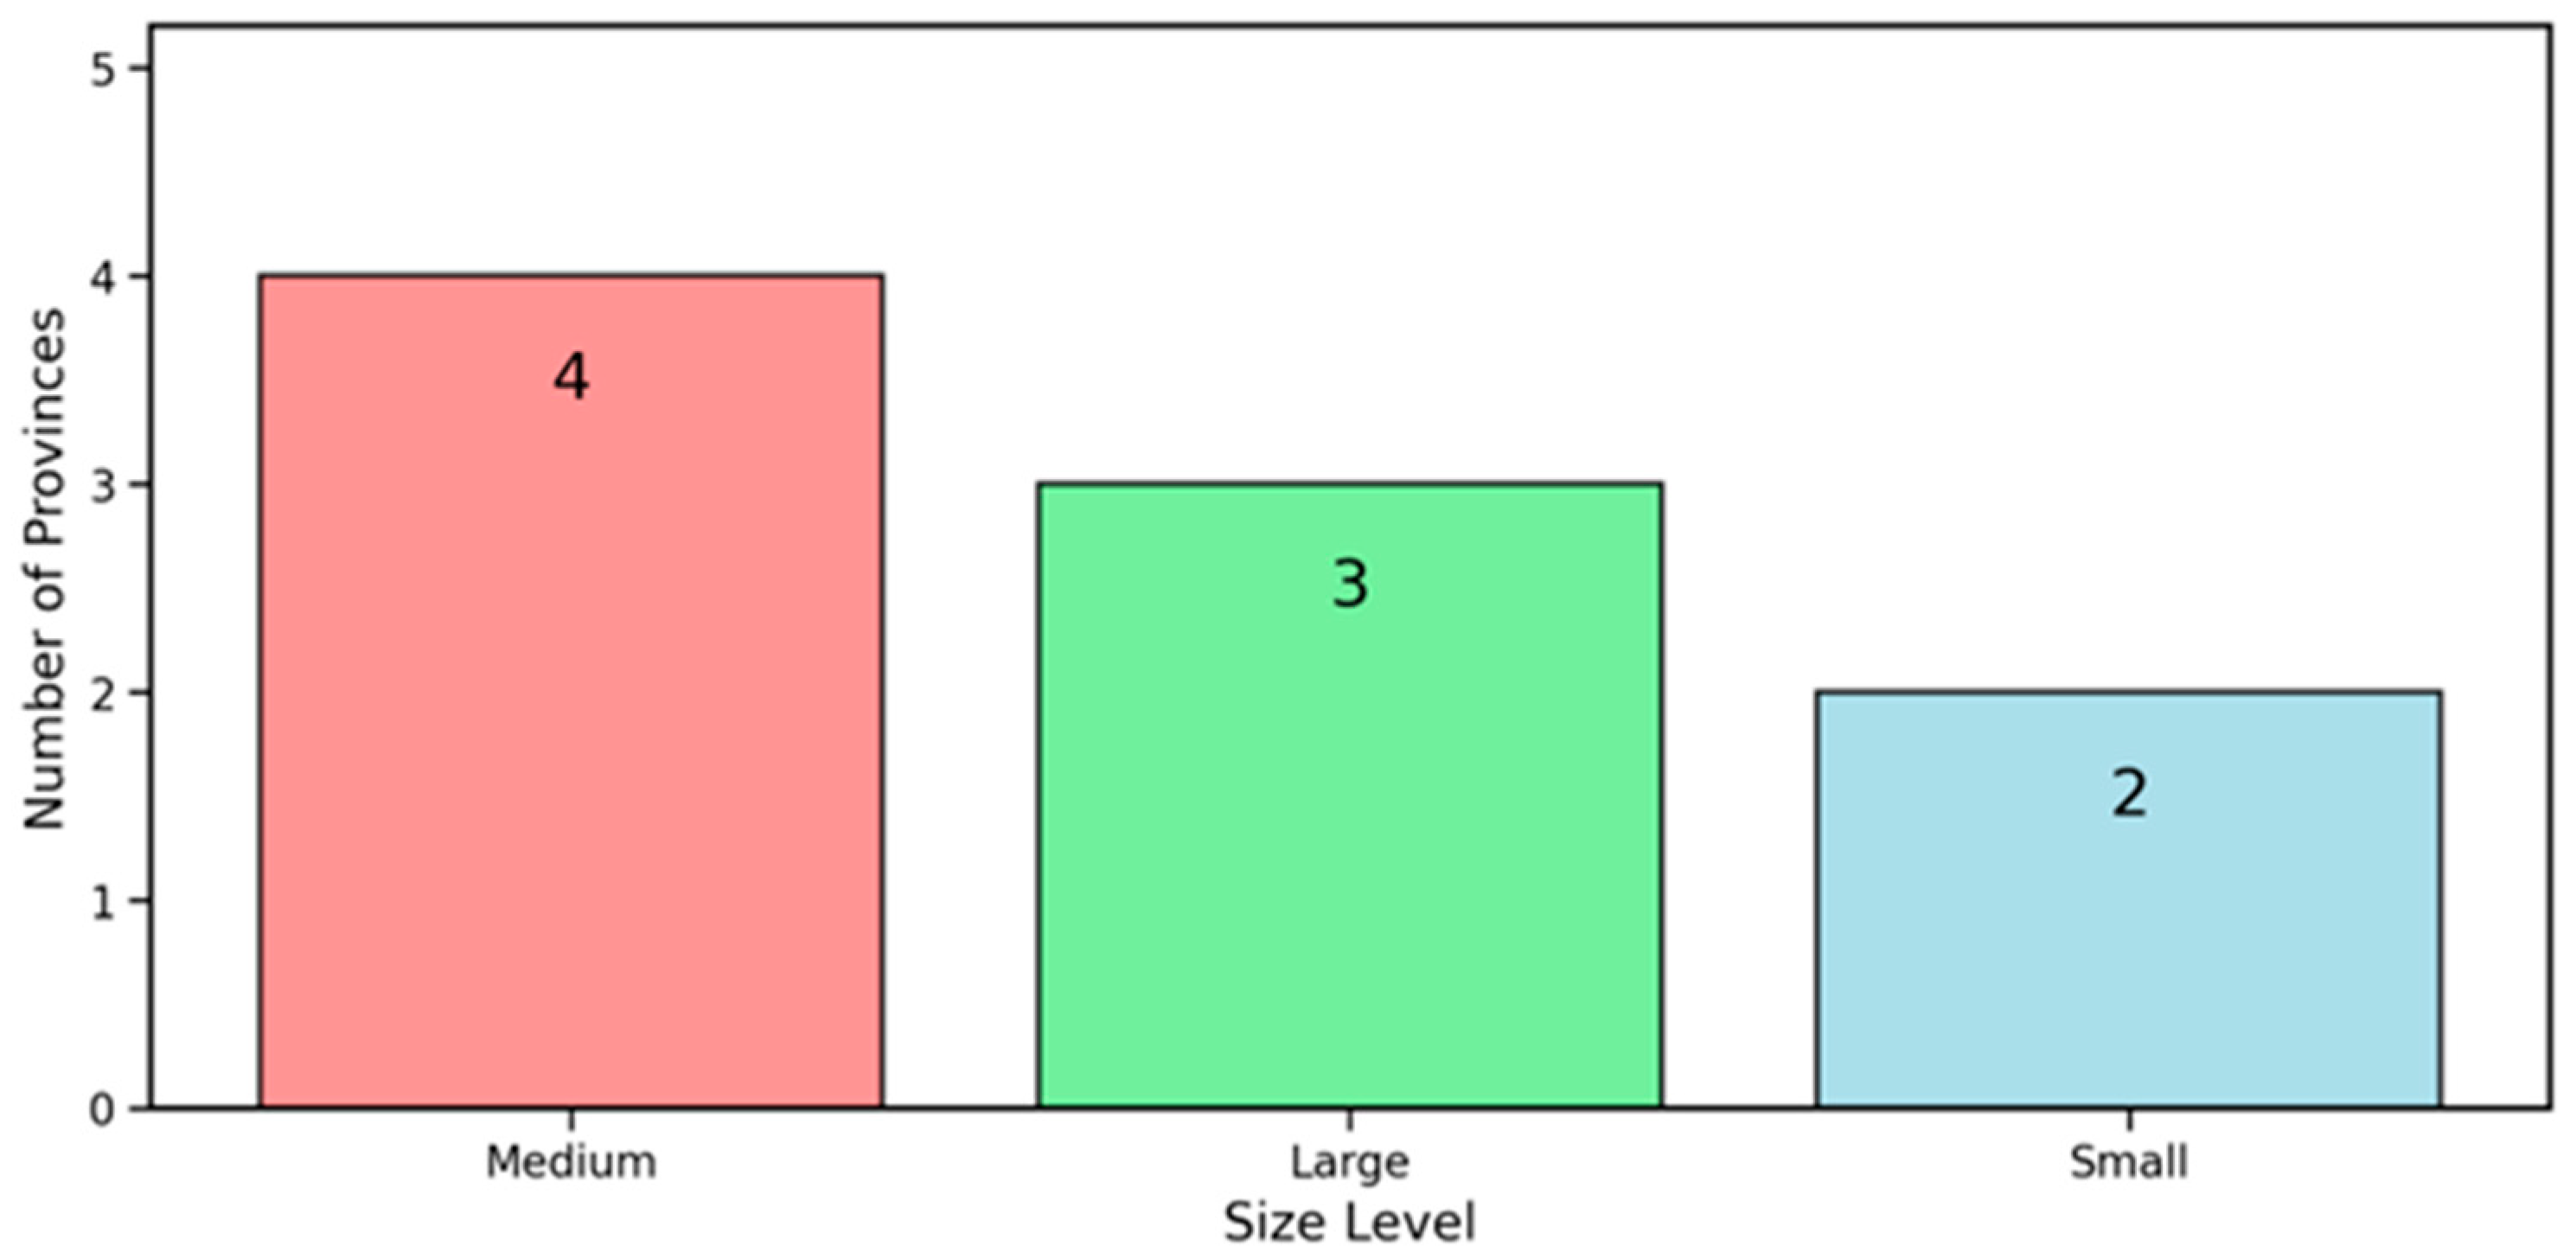
Scale classification and location coefficient analysis reveal distinct variations in specialization levels. Figure 6 illustrates two provinces categorized as small-scale (Hainan and Guangxi, for instance), four as medium-scale (Shandong, Zhejiang, among others), and three as large-scale (Fujian, Jiangsu, Hebei, etc.).
Fujian’s specialization level is notably prominent, embodying the advantages of its natural conditions and the effectiveness of policy support. Hainan, Guangxi, and similar provinces have relatively lower marine aquaculture participation relative to their coastline lengths, indicating a constrained specialization level.

3.5. Regional Aggregation by Macro-Zones

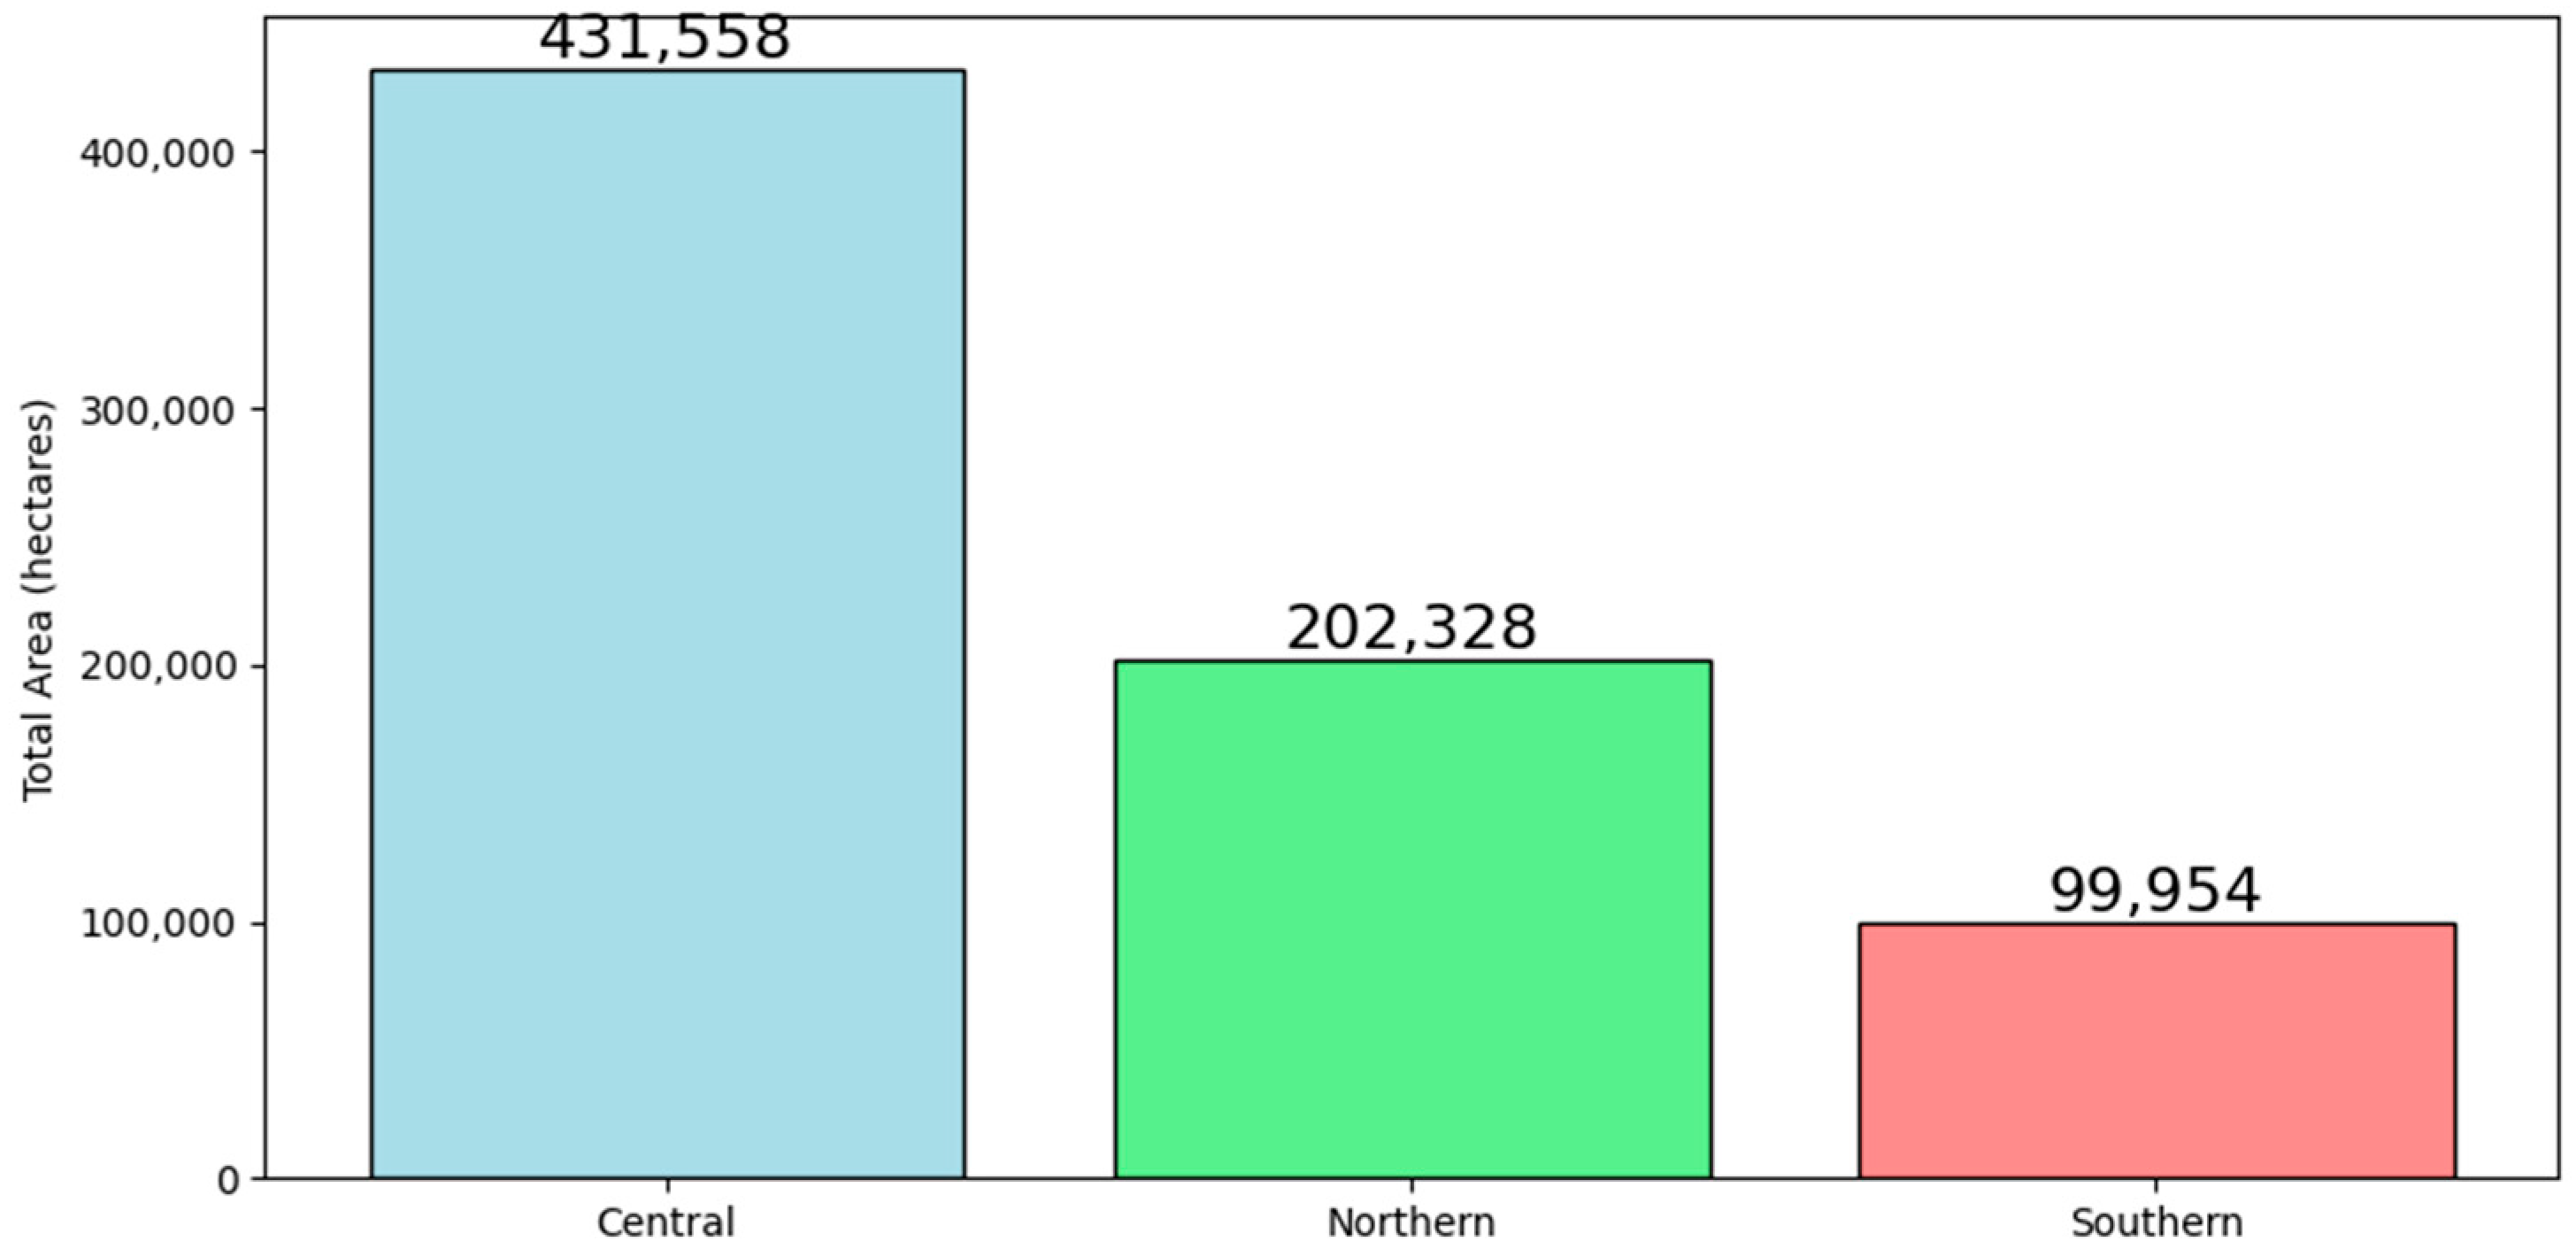
Macro-regional assessment uncovers notable spatial hierarchical variations in open-sea aquaculture intensity. Figure 7 illustrates the central region functioning as the core area with an aquaculture coverage of 431,558 hectares, representing nearly 59% of the national total, while the northern region makes up 28% (202,328 hectares), and the southern region constitutes 14% (99,954 hectares), occupying a peripheral position.
The statistics confirm the industry’s high concentration along the central coastal areas. Favorable hydrological environments and well-developed infrastructure in the Yellow Sea and East China Sea have fostered intensive industry growth [42]. The northern region acts as a key secondary area, and the southern region falls behind. The southern region’s relatively low production capacity implies that, beyond geographical elements, it may be constrained by environmental carrying capacity, marine space competition, and disparities in regional planning.

4. Discussion

4.1. Regional Inequality and Resource Endowment

Compared with the research conducted by Liu et al. (2023) [43], which employed remote sensing methods to document the temporal and spatial continuity of marine aquaculture and the concentrated characteristics in near-coastal areas, this study relies on a standardized national GIS dataset. To describe the differences and concentration levels among the various provinces, we reported the Gini coefficient, CR3, CR5, and LQ values. These indicators revealed the persistent and structural inequality in the distribution of the offshore aquaculture industry, with the central region dominated by Fujian, Jiangsu, and Shandong accounting for the largest share of the national offshore aquaculture area. In contrast, the southern and northern regions were more dispersed, with the southern region having an especially small share. This distribution imbalance was mainly influenced by differences in regional natural resources, economic development, and infrastructure. The central region’s advantageous position was attributed to superior natural conditions and strong government support, while the more dispersed southern region faced greater environmental and development constraints. Taken together, these patterns suggest that China’s offshore mariculture has a clear “core area” along the central coast, whereas the southern provinces participate in offshore mariculture to a much more limited extent.
This result is consistent with the differences in natural resource endowment, coastal exposure, nearshore topography, water depth, and extreme weather conditions among different provinces. Recent remote sensing evidence indicates that most of China’s marine aquaculture is concentrated in the nearshore and shallow water areas. Over 90% of the marine aquaculture areas are less than 20 km from the coastline, and over 80% of the areas are located in waters with a depth of less than 20 m [42]. At the same time, national surveys of tidal flats show that tidal flats are mainly concentrated in estuaries and bays. Jiangsu contains extensive tidal flats and is frequently identified as one of the provinces with the most abundant tidal-flat resources, and Fujian also has extensive tidal flats adjacent to the coastline. All these may provide a large amount of physical space and sheltered environments for long-line/raft/floor-type aquaculture facilities [43]. In contrast, the more remote coastal areas in the south are more frequently affected by typhoon-induced waves and storm surges, which increase the engineering and operational risks of offshore facilities and may limit their large-scale expansion. For example, a process-based model study conducted in Manao Bay, Hainan, indicated that typhoon events would cause waves over 5.5 m high in the cage aquaculture areas, exceeding the threshold of carrying capacity, thereby increasing the disaster risk [44]. In summary, the central core and southern periphery patterns to some extent reflect the cross-regional differences in coastal resource endowment and disaster exposure, which is consistent with the logic of factor endowment in resource-based industries.

4.2. Industrial Clustering and Agglomeration Economies

Section 3 documents a pronounced concentration pattern in China’s offshore mariculture space: the CR3/CR5 values and the Lorenz–Gini results jointly indicate that a small number of provinces account for a disproportionately large share of the national area. In what follows, we therefore place less emphasis on re-stating the descriptive rankings (already reported in Results) and more emphasis on what such concentration implies for industrial organization and governance.
The cluster analysis complements these concentration indicators by identifying three spatial-economic development modes: large-scale expansion, medium-scale balanced growth, and small-scale dispersed production. These modes capture differences in scale and specialization, and they help explain why provinces operating under broadly similar national policies can nevertheless follow divergent development paths.
From the perspective of regional economics, the observed spatial clustering is consistent with agglomeration economies. Once a province reaches a critical mass of farms, specialized suppliers and service providers tend to co-locate, lowering coordination and transaction costs. In leading provinces, these benefits are most visible in denser input markets (feed, seed/juveniles, and equipment), more frequent technical services, and shorter cold-chain links to processing and domestic markets, which together can reinforce cumulative advantages.
This clustering phenomenon is consistent with the agglomeration economic effect in offshore mariculture. The clustered layout can reduce unit costs by sharing specialized inputs and services, a broader local market, and the mutual dissemination of knowledge. Studies have shown that China’s economic activities related to aquaculture are spatially closely clustered with services such as hatcheries or seed supply, feed production and sales, equipment and technical services, processing, and logistics, which enables the farms in the main production areas to obtain more comprehensive services [45]. Moreover, the modernization of the marine aquaculture industry often occurs first in established production areas, thereby strengthening the cumulative advantages [46]. In summary, these research results provide support for interpreting the large-scale expansion provinces as beneficiaries of cumulative agglomeration processes, which strengthen their dominant position in the national marine aquaculture system.
However, agglomeration may also generate negative externalities. Higher farm density increases the likelihood that disease, pollution, and other externalities spread across neighboring sites, raising the expected cost of environmental monitoring, remediation, and biosecurity. This is one reason why concentration should be discussed alongside carrying-capacity constraints and cumulative impact management, rather than being treated as a purely efficiency-enhancing outcome. Research has shown that aquaculture expansion and spatial clustering can produce negative externalities, including deterioration of water quality, disease spillovers, and other ecosystem pressures, especially when farms are densely located without effective spatial governance [47]. In China, a national assessment estimated that fed mariculture discharged approximately 58,451 t of nitrogen and 9081 t of phosphorus along the coast [48]. This nutrient release contributes to water quality degradation and eutrophication, which can lead to ecological imbalances and increased disease risks in mariculture areas. These research findings indicate that although clustering can enhance competitiveness, when formulating spatial planning and regional management strategies, the environmental carrying capacity and biological safety risks must be fully taken into account.

4.3. Path Dependence and Historical Development

The cluster patterns revealed by GIS not only reflect the current production situation but also reflect the accumulation of historical development. The Fujian, Jiangsu, and Hebei provinces, which belong to the large-scale expansion clusters in contemporary coastal aquaculture, have been principal regions in China’s marine aquaculture development [42]. In the research results, these provinces have the largest total area, and their location index is far higher than 1, forming the core of the central coastal belt. This pattern of coexistence of large-scale and high-specialization is not formed by short-term fluctuations but rather indicates a long-term process, where early advantages are continuously consolidated and strengthened.
Once an initial base of farms, processing plants, and trading networks was established in these provinces, follow-up investment faced lower entry barriers. Existing ports, cold-chain facilities, and local expertise reduced transaction costs for new projects, while provincial governments had stronger incentives to support an already visible industry. Over time, these reinforcing mechanisms produced what can be seen in the cross-sectional data: a few provinces that simultaneously dominate national mariculture space and display a high degree of specialization. By contrast, Guangxi and Hainan, which appear in the “small-scale dispersed” cluster with low LQ values and limited mariculture area, illustrate the other side of the same process. Even if there are coastal resources, there is a significant and persistent regional disparity in the efficiency of marine aquaculture among the coastal provinces. Provinces with lower initial efficiency are unable to catch up with the already established central regions [49].
From this perspective, the current spatial structure of offshore mariculture is path-dependent. Time-series evidence from remote sensing indicates that the major aquatic farming centers along China’s coast have shown strong persistence over the past two decades, with changes occurring mainly through gradual expansion, contraction, or local redistribution, rather than through complete spatial reorganization [43]. Liu et al. 2023 [43] provide time series evidence that China’s main mariculture centers have remained remarkably stable over the past two decades, with changes largely taking the form of gradual expansion, contraction, or local reshuffling rather than wholesale relocation. This long-run persistence is consistent with what we observe in the 2018 cross-section, and it offers an external check on the concentration pattern reported in this study.
Related work, such as Wang et al. 2023 [49], has focused on efficiency evaluation and helps quantify performance differences across regions. Our contribution is different. We use spatial concentration and specialization indicators to organize provinces into development types that are easier to interpret in a geographic context. Read together, the evidence points to a strong historical imprint in provincial mariculture trajectories. Early leaders did not simply expand faster in one or two years. They accumulated farms, logistics capacity, processing links, and local know-how, and these advantages tended to reinforce one another over time. Regions that started later, even if they have coastal resources, still face higher barriers to catch-up. This is because there is a significant spatial imbalance and polarization in the efficiency of marine green aquaculture among the coastal provinces. The low-efficiency areas have been unable to gradually converge towards the high-efficiency regions for a long time [50].
This is why it is risky to explain today’s provincial gaps as short-term outcomes. A path-dependent process is a more plausible interpretation, and it implies that policy goals should be calibrated to initial conditions and the existing industrial base [51]. If long-run trajectories are ignored, interventions may unintentionally deepen the existing concentration or set targets that are unrealistic for lagging provinces. A more workable approach is to design measures that build on the observed evolution of the sector rather than trying to overturn it abruptly.

4.4. Efficiency and Sustainability Implications

This study indicates that spatial concentration in offshore mariculture is closely tied to both efficiency outcomes and sustainability pressure. Our measurements indicate that Fujian, Jiangsu, and Hebei together account for almost two-thirds of the national offshore mariculture area, which gives these provinces pronounced economies of scale along the entire value chain. In these coastal farming regions, feed supply, seed production, cold-chain transport, and product processing can be organized at a lower average cost and with higher returns, and the dense spatial clustering also helps to consolidate production standards and speed up the spread of new technologies. From a narrowly defined efficiency perspective, the “large-scale expansion” cluster can therefore be seen as the main growth engine of China’s offshore mariculture sector.
The size-level map (Figure 6) offers an additional layer of interpretation: large- and medium-sized offshore mariculture patches are concentrated in Fujian, Jiangsu, and Hebei, while provinces such as Guangxi and Hainan are dominated by smaller patches. This pattern is consistent with the three development modes identified by the cluster analysis, and it helps clarify why potential efficiency gains and cumulative ecological pressure tend to co-locate in the same core provinces.
However, this kind of spatial concentration also means that regional development in offshore mariculture is becoming more and more unbalanced. Concentration also reshapes who benefits from growth. The leading provinces keep pulling ahead, while Guangxi and Hainan remain small players in the national footprint. The message is simple: scale can lift efficiency, but it can also deepen spatial unevenness. Ecological risk, meanwhile, is the quieter cost of packing farms into the same waters.
When sites accumulate in a limited space, local environmental capacity is placed under sustained stress. In semi-enclosed waters, wastes and uneaten feed are more likely to remain in place, and residual chemicals can accumulate over time. Under such conditions, disease and pollution may spread more quickly across nearby farms [49]. Although large-scale expansion clusters may have an advantage in terms of output, the environmental pressure caused by high-density farming is relatively high. This usually means that more complex management and mitigation measures are required, resulting in higher management costs [52].
By contrast, the smaller and more scattered production observed in southern China usually delivers weaker scale efficiency and higher unit cost. Still, spatial dispersion can reduce local accumulation of pressure. It may also lower the probability that a single shock escalates into a large area ecological event. In this sense, the three spatial development modes identified in this study need to be assessed not only by their contribution to output but also in terms of their distinct ecological risks, efficiency implications, and consequences for spatial equity.
International experience also suggests that highly concentrated coastal farming zones tend to leave a heavy ecological footprint. Norway’s salmon industry, which is organized in dense clusters along the coast, has achieved striking cost advantages and strong global competitiveness, but at the same time has had to grapple with recurring problems such as sea-lice outbreaks, growing drug resistance, and localized environmental degradation [53]. In Chile, export-oriented salmon clusters expanded rapidly under favorable market conditions, yet the infectious salmon anemia (ISA) crisis exposed just how vulnerable systems can be when they rely heavily on spatial concentration and very high stocking densities.
By contrast, coastal aquaculture in many Southeast Asian countries remains dominated by spatially dispersed land-based aquaculture ponds along the shoreline, rather than highly concentrated industrial offshore mariculture [54]. This configuration does not generate the same output per kilometer of coastline as the Norwegian or Chilean model, but it may provide some ecological buffering for coastal ecosystems by avoiding extreme local accumulation.
Placed against this background, China’s offshore mariculture illustrates a familiar trade-off: spatial concentration can support scale efficiencies in input supply, logistics, processing, and market access, yet it may also widen regional gaps and amplify cumulative ecological pressure. It is important to distinguish offshore mariculture production from export-oriented processing trade. Along China’s coast, offshore mariculture output is largely absorbed by domestic demand; therefore, when we refer to “supply-chain advantages” of clustering, we mainly mean domestic distribution and processing networks, whereas export-oriented segments in China’s seafood sector are more closely related to processing and re-exporting imported or foreign-caught inputs. Finally, we do not treat these mechanisms as proven causal channels; rather, they are framed as plausible interpretations that can be tested as richer time-series and economic datasets become available.

4.5. Implications Grounded in the Spatial Indicators

The empirical results in this paper make it hard to treat China’s offshore mariculture as a single, homogeneous sector. The Gini coefficient, the high CR3 and CR5 values, and the three development modes identified by the cluster analysis all point to a system built around a narrow central core, a group of medium-scale followers, and a southern periphery that participates only weakly. Any policy response that ignores these structural differences is likely to face implementation constraints. In practice, this means that sustainable development of offshore mariculture will depend less on a single “grand blueprint” than on a set of differentiated strategies that take geography, history, and institutional capacity seriously.
The primary task is to focus on the spatial layout of marine aquaculture. In the central coastal area, large-scale expansion has already occurred, and the cumulative pressure is the most severe. The key task is not to further expand the area, but to strengthen the control of density and cumulative impact. Satellite-derived monitoring data indicate the actual spatial scope of marine aquaculture is expanding in ways that surpass and occasionally run counter to existing zoning regulations. Satellite monitoring suggests that mariculture is expanding in ways that do not always align with existing zoning. That gap matters. It implies that spatial planning cannot be treated as a fixed plan made once and left untouched. When monitoring flags encroachment or new conflicts, boundaries and permitted uses should be adjusted in time, and management requirements should be updated accordingly [55]. Recent work offers practical ways to do this by bringing ecological baselines and carrying capacity thresholds into the planning process, so development targets and protection needs can be judged on the same footing [56]. For Guangxi and Hainan, the question is not whether there is space to grow. It is how to expand without sliding into the high-density model seen along the central coast. A phased approach, guided by ecological zoning and site suitability screening, can help new farms avoid sensitive waters and reduce long-term lock-in risk [57].
These adjustments also hinge on people and practice, not only on infrastructure. Spillovers and path dependence mean early choices can shape nearby outcomes and leave a long shadow. This is why cross-provincial learning should be treated as part of governance, not an optional add-on. Joint pilots, structured demonstrations, and targeted training can help late-developing regions improve performance without copying high-intensity systems wholesale [58]. What transfers best is often routine work: tighter feeding to cut losses, better monitoring and early response, and stronger biosecurity across the production cycle.
Finally, governance and incentives need to match these structural conditions. Policy should not try to erase the historical advantages of leading provinces. The more realistic goal is to prevent those advantages from hardening into technological and environmental lock-in. One route is to internalize environmental costs and link licensing, fiscal support, and performance assessment to measurable ecological outcomes. At the same time, targeted upgrading support in underdeveloped regions can speed up capacity building and narrow quality gaps without undermining the benefits that have accumulated through regional trajectories. Evidence from recent work on China’s marine governance also indicates that policy effects vary across regions at different development stages, which supports differentiated regulation rather than uniform rules [59].
Seen together, these interpretive implications connect back to the three analytical threads running through this paper: factor endowment, agglomeration economies, and path dependence. The contribution of the present study is to make these relationships visible at the national scale and to provide a quantitative basis for moving from general statements about balanced development and ecological protection to more concrete, region-specific strategies for governing China’s offshore mariculture.

4.6. Future Work

This paper provides the first nation-scale, spatially explicit economic picture of offshore mariculture in China, but it is ultimately based on a static snapshot at a single point in time. Existing studies have already used multi-source remote sensing to map China’s aquaculture distribution across multiple time periods [42]. At the same time, the analysis is built on area-based spatial indicators and does not include farm-level accounts of costs and revenues. Several avenues, therefore, remain open for future research. First, the dataset can be updated temporally to capture dynamic changes and long-term trends, enabling time-series analysis of expansion, contraction, and potential ecological impacts. Linking the spatial layout to efficiency-related measures would make the regional development implications clearer. Later work can also widen the lens to ecology and society. That means tracking water quality, valuing ecosystem services, and looking at how coastal households and jobs rely on mariculture. It would also help to place China in a broader comparison. Evidence from other major mariculture countries can provide a more solid benchmark and point to governance practices that travel well across settings.
A second step is to test, more directly, whether occupying more space is associated with stronger economic performance. Area-based indicators show where mariculture concentrates and how uneven the footprint is, but they say little about productivity or value creation. To answer that, spatial patterns must be matched with basic economic facts such as output, employment, and firm organization. With richer data, the question becomes sharper: does clustering reliably raise value added, or can a more dispersed pattern compete under different conditions? Any convincing answer should still sit alongside ecological and social evidence, especially water quality dynamics and the degree of community dependence.
The approach can also be tested outside China. Applying the same mapping and concentration measures to other major producers would allow a clearer comparison of spatial evolution and governance outcomes across countries. Cross-national evidence can then help separate what looks like a general industry trajectory from what is more plausibly linked to policy design and institutional capacity. Through rigorous cross-national comparisons, it is possible to clarify how different political and economic systems affect the spatial evolution of industries and to distinguish the unique role of policy intervention from the general trends of the industry.
Finally, future research can go beyond the boundaries of the farm and pay more attention to the post-production stages in the value chain. Cold chain logistics, processing capabilities, and market organization are closely related to the location of the farm and jointly affect the resilience of the seafood system to shocks. Therefore, integrating the spatial production pattern with downstream infrastructure and trade networks is a natural extension of current research and also helps to incorporate the analysis into broader issues such as food system resilience, low-carbon transition, and efficient utilization of marine resources.

5. Conclusions

The results show a clear spatial polarization of offshore mariculture across the nine coastal provinces. Fujian, Jiangsu, and Hebei account for most of the offshore mariculture footprint, while Guangxi and Hainan contribute only a small share. The concentration metrics tell the same story. The Gini coefficient is 0.412, CR3 reaches 64.0 percent, and CR5 reaches 84.5 percent, which indicates that expansion has been driven by a limited number of provinces. Seen in this light, three broad development paths emerge. The central coast has expanded at a large scale, the north has grown more steadily with a relatively balanced layout, and the south remains dominated by smaller and more dispersed production. This pattern is consistent with differences in resource endowment, agglomeration forces, and the lasting influence of earlier development paths. It also implies that governance cannot be uniform. Core provinces need tighter ecological management to deal with cumulative pressure, while late-developing areas require region-specific support that allows growth without copying the high-density model.
Looking across coastal subzones helps to make the pattern easier to interpret. The central belt has expanded mainly by scaling up production capacity, supported by stronger natural conditions and a more mature cluster of suppliers, logistics, and processing. The northern provinces have grown at a steadier pace, with a medium scale and a more even spatial layout. The southern coast, by contrast, is still characterized by scattered small operations. That makes it harder to form self-reinforcing scale advantages and slows convergence with the leading regions. The northern provinces have developed more moderately, with a moderate scale and relatively balanced spatial distribution. However, the southern coastline mainly consists of scattered small-scale operations, which make it difficult to form a self-reinforcing agglomeration effect, thereby restricting the speed of catching up. Despite the natural limitations, the cumulative advantages of existing clusters and the long-term formed provincial development paths are equally crucial. Therefore, the current coastal system presents a pattern where a strong core exists alongside multiple peripheral areas that have not yet converged with the leading regions.
The findings point to the need for governance strategies that recognize, rather than gloss over, this spatial differentiation. In provinces where mariculture has already become highly concentrated, spatial planning and stricter environmental controls will be essential to keep ecological risks within acceptable bounds. In less-developed regions, by contrast, the priority is to support carefully managed growth and to use technology transfer and institutional support to raise efficiency without reproducing the same degree of ecological pressure. Ultimately, the long-term development of China’s offshore mariculture sector will depend on how well policies manage the tension between efficiency, spatial equity, and environmental sustainability. By bringing together spatial analysis and economic indicators at the national scale, this study offers a basis for this discussion and provides evidence that can be used to design more differentiated and sustainable governance of offshore mariculture in China.


Author Contributions

W.Y.: supervision, project administration, resources, funding acquisition. Y.H.: conceptualization, methodology, software, formal analysis, investigation, visualization, data curation, writing—original draft preparation, visualization. K.T.: methodology, validation, formal analysis, data curation, writing—original draft preparation, writing—review and editing, language polishing. All authors have read and agreed to the published version of the manuscript.

Funding

We gratefully acknowledge funding from the Development Research Center of the Shanghai Municipal People’s Government and the Shanghai Municipal Agriculture and Rural Affairs Committee for the decision-consulting project Shanghai Fishery High-Quality Development Research (grant no. 2025-LH-SN08; total funding RMB 60,000), and from the China Agriculture Research System (CARS-47-G29).

Institutional Review Board Statement

Not applicable.

Data Availability Statement

The original contributions presented in the study are included in the article; further inquiries can be directed to the corresponding author.

Conflicts of Interest

The authors declare no conflicts of interest.

Abbreviations

The following abbreviations are used in this manuscript:
FAOFood and Agriculture Organization of the United Nations
GISGeographic Information System
OBIAObject-Based Image Analysis
LQLocation Quotient
C R 3 Concentration Ratio of the top 3 provinces
C R 5 Concentration Ratio of the top 5 provinces
NDVINormalized Difference Vegetation Index
ISAInfectious Salmon Anemia

References

  1. Naylor, R.L.; Kishore, A.; Sumaila, U.R.; Issifu, I.; Hunter, B.P.; Belton, B.; Bush, S.R.; Cao, L.; Gelcich, S.; Gephart, J.A.; et al. Blue food demand across geographic and temporal scales. Nat. Commun. 2021, 12, 5413. [Google Scholar] [CrossRef]
  2. Tigchelaar, M.; Leape, J.; Micheli, F.; Allison, E.H.; Basurto, X.; Bennett, A.; Bush, S.R.; Cao, L.; Cheung, W.W.; Crona, B.; et al. The vital roles of blue foods in the global food system. Glob. Food Secur. 2022, 33, 100637. [Google Scholar] [CrossRef]
  3. Gentry, R.R.; Froehlich, H.E.; Grimm, D.; Kareiva, P.; Parke, M.; Rust, M.; Gaines, S.D.; Halpern, B.S. Mapping the global potential for marine aquaculture. Nat. Ecol. Evol. 2017, 1, 1317–1324. [Google Scholar] [CrossRef]
  4. Carver, C.E.A.; Mallet, A.L. Estimating the carrying capacity of a coastal inlet for mussel culture. Aquaculture 1990, 88, 39–53. [Google Scholar] [CrossRef]
  5. Inglis, G.J.; Hayden, B.J.; Ross, A. An Overview of Factors Affecting the Carrying Capacity of Coastal Embayments for Mussel Culture; Client Report CHC00/69; NIWA: Christchurch, New Zealand, 2000; pp. 1–31. [Google Scholar]
  6. You, J.; Yu, L.; Meillon, J.; Gangnery, A.; Bacher, C.; Liu, H.; Strand, Ø. A set of web-based public decision support tools for integrated planning and management in aquaculture. MethodsX 2022, 9, 101795. [Google Scholar] [CrossRef] [PubMed]
  7. Brugère, C.; Aguilar-Manjarrez, J.; Beveridge, M.C.; Soto, D. The ecosystem approach to aquaculture 10 years on—A critical review and consideration of its future role in blue growth. Rev. Aquac. 2019, 11, 493–514. [Google Scholar] [CrossRef]
  8. Duc, N.M. Contribution of Fish Production to Farmers’ Subjective Well-being in Vietnam—A Logistic Model. J. World Aquac. Soc. 2009, 40, 417–424. [Google Scholar] [CrossRef]
  9. Filgueira, R.; Grant, J. A box model for ecosystem-level management of mussel culture carrying capacity in a coastal bay. Ecosystems 2009, 12, 1222–1233. [Google Scholar] [CrossRef]
  10. Christensen, V.; Pauly, D. ECOPATH II—A software for balancing steady-state ecosystem models and calculating network characteristics. Ecol. Model. 1992, 61, 169–185. [Google Scholar] [CrossRef]
  11. Kirkfeldt, T.S.; Frazão Santos, C. A review of sustainability concepts in marine spatial planning and the potential to supporting the UN sustainable development goal 14. Front. Mar. Sci. 2021, 8, 713980. [Google Scholar] [CrossRef]
  12. Falconer, L.; Cutajar, K.; Krupandan, A.; Capuzzo, E.; Corner, R.A.; Ellis, T.; Jeffery, K.; Mikkelsen, E.; Moore, H.; O′BEirn, F.X.; et al. Planning and licensing for marine aquaculture. Rev. Aquac. 2023, 15, 1374–1404. [Google Scholar] [CrossRef]
  13. Aguilar-Manjarrez, J.; Kapetsky, J.M.; Soto, D. The Potential of Spatial Planning Tools to Support the Ecosystem Approach to Aquaculture; FAO: Rome, Italy, 2010. [Google Scholar]
  14. Agriculture Organization of the United Nations. Fisheries Department. The State of World Fisheries and Aquaculture; Food and Agriculture Organization of the United Nations: Rome, Italy, 2022. [Google Scholar]
  15. Liu, Y.; Wang, Z.; Yang, X.; Zhang, Y.; Yang, F.; Liu, B.; Cai, P. Satellite-based monitoring and statistics for raft and cage aquaculture in China’s offshore waters. Int. J. Appl. Earth Obs. Geoinf. 2020, 91, 102118. [Google Scholar] [CrossRef]
  16. Wang, Z.; Yang, X.; Liu, Y.; Lu, C. Extraction of coastal raft cultivation area with heterogeneous water background by thresholding object-based visually salient NDVI from high spatial resolution imagery. Remote Sens. Lett. 2018, 9, 839–846. [Google Scholar] [CrossRef]
  17. Beard, K.; Kimble, M.; Yuan, J.; Evans, K.S.; Liu, W.; Brady, D.; Moore, S. A method for heterogeneous spatio-temporal data integration in support of marine aquaculture site selection. J. Mar. Sci. Eng. 2020, 8, 96. [Google Scholar] [CrossRef]
  18. Wu, S.; Xiong, T.; Sun, C. Aquaculture industry under the blue transformation in Jiangsu, China: Structure evolution and spatial agglomeration. Open Geosci. 2023, 15, 20220531. [Google Scholar] [CrossRef]
  19. Asche, F.; Cojocaru, A.L.; Roth, B. The development of large scale aquaculture production: A comparison of the supply chains for chicken and salmon. Aquaculture 2018, 493, 446–455. [Google Scholar] [CrossRef]
  20. Cromey, C.J.; Nickell, T.D.; Black, K.D. DEPOMOD—Modelling the deposition and biological effects of waste solids from marine cage farms. Aquaculture 2002, 214, 211–239. [Google Scholar] [CrossRef]
  21. Glibert, P.M.; Mitra, A. From webs, loops, shunts, and pumps to microbial multitasking: Evolving concepts of marine microbial ecology, the mixoplankton paradigm, and implications for a future ocean. Limnol. Oceanogr. 2022, 67, 585–597. [Google Scholar] [CrossRef]
  22. Yu, S.E.; Liao, M.L.; Dong, S.L.; Dong, Y.W. Mapping the potential for global offshore finfish mariculture. Mar. Life Sci. Technol. 2024, 6, 651–664. [Google Scholar] [CrossRef] [PubMed]
  23. Simone, M.N.; Vopel, K. The need for proactive environmental management of offshore aquaculture. Rev. Aquac. 2024, 16, 603–607. [Google Scholar] [CrossRef]
  24. Fujita, R.; Brittingham, P.; Cao, L.; Froehlich, H.; Thompson, M.; Voorhees, T. Toward an environmentally responsible offshore aquaculture industry in the United States: Ecological risks, remedies, and knowledge gaps. Mar. Policy 2023, 147, 105351. [Google Scholar] [CrossRef]
  25. Liu, X.; Wang, Z.; Yang, X.; Liu, Y.; Liu, B.; Zhang, J.; Gao, K.; Meng, D.; Ding, Y. Mapping China’s offshore mariculture based on dense time-series optical and radar data. Int. J. Digit. Earth 2022, 15, 1326–1349. [Google Scholar] [CrossRef]
  26. Liu, Z.; Xie, Z.-R.; Shen, W.-S. A new method that can improve regional eco-environmental evaluation: Combining GIS with AHP. Resour. Environ. Yangtze Basin 2003, 12, 163–168. [Google Scholar]
  27. Bi, Z. A Study on Developing a Marine GIS System Using ArcObjects. Master’s Thesis, Dalian Maritime University, Dalian, China, 2007. Available online: https://kns.cnki.net/kcms2/article/abstract?v=BbvBZ4vy5aT8MbY_Kh5vjwjYe2iOwQGVx4mFJ4ve4jJVWf6YWxRQTkoCJv9vuclLaSWSbz2BYhmnhS6o3k6_fwbpvuxeJP3BZVBqivIMaze219pHdSbTIAYpnQe6Pg1mHlI1QNvsEjv3Zdw64hMqyIuY7VNZW-fP5aNMbjkJACgNo56Mgqq1yA==&uniplatform=NZKPT&language=CHS (accessed on 12 December 2025).
  28. Zhong, A.; Sun, Y.; Cai, Z.; Yang, C. Design and Development of Visualization System for Marine Early Warning Products based on GIS. In 2015 5th International Conference on Computer Sciences and Automation Engineering (ICCSAE 2015), Sanya, China, 14–15 November 2015; Atlantis Press: Paris, France, 2016; pp. 461–466. [Google Scholar]
  29. Liu, B.; Liu, K.-L.; Xiang, S.-Y. Design and implementation of multi-source data integrated management for marine ecological reserves in Shandong Province based on GIS. Mar. Environ. Sci. 2014, 33, 118–121. (In Chinese) [Google Scholar]
  30. Wei, B.-Q.; Wu, L.; Zhao, D.-Z.; Zhang, F.-S.; Sun, Y.-G. Dynamic visualization of flow field based on GIS in the Changhai Sea area. Mar. Environ. Sci. 2013, 32, 307–310. (In Chinese) [Google Scholar]
  31. Zhang, D.; Gao, H.; Yang, J.; Xi, J.; Li, X. Assessment of the ecological vulnerability of Nansihu Wetland based on GIS technology. Resour. Sci. 2014, 36, 874–882. (In Chinese) [Google Scholar]
  32. Lin, Y.; Liu, S.-X.; Guan, D.-M.; Zhang, Z.-D.; Wen, Q. GIS-based Japanese scallop (Patinopecten yessoensis) aquaculture suitability assessment: A case study with the islands of Dachangshan and Xiaochangshan, North Yellow Sea, China. Acta Ecol. Sin. 2014, 34, 5984–5992. (In Chinese) [Google Scholar] [CrossRef]
  33. Silva, C.; Ferreira, J.G.; Bricker, S.B.; DelValls, T.A.; Martín-Díaz, M.L.; Yáñez, E. Site selection for shellfish aquaculture by means of GIS and farm-scale models, with an emphasis on data-poor environments. Aquaculture 2011, 318, 444–457. [Google Scholar] [CrossRef]
  34. Gini, C. Measurement of inequality of incomes. Econ. J. 1921, 31, 124–125. [Google Scholar] [CrossRef]
  35. Zheng, X.; Xia, T.; Yang, X.; Yuan, T.; Hu, Y. The land Gini coefficient and its application for land use structure analysis in China. PLoS ONE 2013, 8, e76165. [Google Scholar] [CrossRef]
  36. Bain, J.S. Relation of profit rate to industry concentration: American manufacturing, 1936–1940. Q. J. Econ. 1951, 65, 293–324. [Google Scholar] [CrossRef]
  37. Isard, W. Methods of Regional Analysis; Pипoл Kлaccик: Moscow, Russia, 1966. [Google Scholar]
  38. Benesty, J.; Chen, J.; Huang, Y.; Cohen, I. Pearson correlation coefficient. In Noise Reduction in Speech Processing; Springer: Berlin/Heidelberg, Germany, 2009; pp. 1–4. [Google Scholar]
  39. McQueen, J.B. Some methods of classification and analysis of multivariate observations. In Proceedings of the 5th Berkeley Symposium on Mathematical Statistics and Probability, Berkeley, CA, USA, 27 December 1965–7 January 1966; pp. 281–297. [Google Scholar]
  40. Roy, D.P.; Wulder, M.A.; Loveland, T.R.; Woodcock, C.E.; Allen, R.G.; Anderson, M.C.; Helder, D.; Irons, J.R.; Johnson, D.M.; Kennedy, R.; et al. Landsat-8: Science and product vision for terrestrial global change research. Remote Sens. Environ. 2014, 145, 154–172. [Google Scholar] [CrossRef]
  41. Potere, D. Horizontal positional accuracy of Google Earth’s high-resolution imagery archive. Sensors 2008, 8, 7973–7981. [Google Scholar] [CrossRef]
  42. Meng, D.; Yang, X.; Wang, Z.; Liu, Y.; Zhang, J.; Liu, X.; Liu, B. Spatial Distribution and Differentiation Analysis of Coastal Aquaculture in China Based on Remote Sensing Monitoring. Remote Sens. 2024, 16, 1585. [Google Scholar] [CrossRef]
  43. Liu, Y.; Wang, Z.; Yang, X.; Wang, S.; Liu, X.; Liu, B.; Zhang, J.; Meng, D.; Ding, K.; Gao, K.; et al. Changes in the spatial distribution of mariculture in China over the past 20 years. J. Geogr. Sci. 2023, 33, 2377–2399. [Google Scholar] [CrossRef]
  44. Sun, J.; Tang, C.; Mu, K.; Li, Y.; Zheng, X.; Zou, T. Tidal flat extraction and analysis in China based on multi-source remote sensing image collection and MSIC-OA algorithm. Remote Sens. 2024, 16, 3607. [Google Scholar] [CrossRef]
  45. Zhang, M.; Wang, X.; Liu, C.; Cui, J.; Tian, Y.; Xu, X. Analysis of aquaculture safety in marine cage culture area of Maniao bay under the effect of typhoon. Appl. Ocean Res. 2024, 144, 103902. [Google Scholar] [CrossRef]
  46. Ma, Z.; Xu, H.; Newton, R.; Benter, A.; Fang, D.S.; Wang, C.; Little, D.; Zhang, W. Aquaculture Industry Composition, Distribution, and Development in China. Sustainability 2025, 17, 11331. [Google Scholar] [CrossRef]
  47. Asche, F.; Eggert, H.; Oglend, A.; Roheim, C.A.; Smith, M.D. Aquaculture: Externalities and policy options. Rev. Environ. Econ. Policy 2022, 16, 282–305. [Google Scholar] [CrossRef]
  48. Zhang, J.; Wu, W.; Li, Y.; Liu, Y.; Wang, X. Environmental effects of mariculture in China: An overall study of nitrogen and phosphorus loads. Acta Oceanol. Sin. 2022, 41, 4–11. [Google Scholar] [CrossRef]
  49. Wang, W.; Mao, W.; Zhu, J.; Wu, R.; Yang, Z. Research on Efficiency of Marine Green Aquaculture in China: Regional Disparity, Driving Factors, and Dynamic Evolution. Fishes 2023, 9, 11. [Google Scholar] [CrossRef]
  50. Wang, W.; Mao, W.; Wu, R.; Zhu, J.; Yang, Z. Study on the spatial imbalance and polarization of marine green aquaculture efficiency in China. Water 2024, 16, 273. [Google Scholar] [CrossRef]
  51. Yao, L.; Jia, Y.; Xia, J.; Xu, R.; Bai, C.; Xu, T.; Zhang, Q. Covert mortality nodavirus identified as a new causative agent in bivalves. Aquaculture 2025, 613, 743405. [Google Scholar] [CrossRef]
  52. Arshad, S.; Afzal, S.; Tasleem, F. Environmental Impact and Sustainable Practices in Aquaculture: A Comprehensive Review. Haya Saudi J. Life Sci. 2024, 9, 447–454. [Google Scholar] [CrossRef]
  53. Buschmann, A.H.; Cabello, F.; Young, K.; Carvajal, J.; Varela, D.A.; Henríquez, L. Salmon aquaculture and coastal ecosystem health in Chile: Analysis of regulations, environmental impacts and bioremediation systems. Ocean Coast. Manag. 2009, 52, 243–249. [Google Scholar] [CrossRef]
  54. Taranger, G.L.; Karlsen, Ø.; Bannister, R.J.; Glover, K.A.; Husa, V.; Karlsbakk, E.; Kvamme, B.O.; Boxaspen, K.K.; Bjørn, P.A.; Finstad, B.; et al. Risk assessment of the environmental impact of Norwegian Atlantic salmon farming. ICES J. Mar. Sci. 2015, 72, 997–1021. [Google Scholar] [CrossRef]
  55. Jiang, Y.; Li, J.; Zhang, Z.; Li, Y. Dynamics of coastal land-based aquaculture pond in China and Southeast Asia from 1990 to 2020. Int. J. Appl. Earth Obs. Geoinf. 2024, 127, 103654. [Google Scholar] [CrossRef]
  56. Wang, J.; Yang, X.; Wang, Z.; Ge, D.; Kang, J. Monitoring marine aquaculture and implications for marine spatial planning—An example from shandong province, China. Remote Sens. 2022, 14, 732. [Google Scholar] [CrossRef]
  57. Zeng, R.; Xu, Y.; Yang, L.; Ai, Y.; Liu, J.; Liu, C.; Lu, W. Adjustment of the marine ecological red lines in China. Sci. Rep. 2024, 14, 19247. [Google Scholar] [CrossRef]
  58. Chen, Z.; Xu, M.; Zhang, H.; Wang, J.; Liu, Y.; Fang, J. Selection of mariculture sites based on ecological zoning—Nantong, China. Aquaculture 2024, 578, 740039. [Google Scholar] [CrossRef]
  59. Chen, Y.; Ma, Y.; Wang, Y.; Sun, Z.; Han, Y. Impact of China’s marine governance policies on the marine ecological environment—A case study of the Bohai rim. Ocean Coast. Manag. 2023, 246, 106913. [Google Scholar] [CrossRef]
Figure 1. Research workflow integrating remote sensing, GIS processing, and economic analysis of offshore mariculture in China.
Fishes 11 00062 g001
Figure 2. Spatial distribution of offshore mariculture in China’s coastal zone: (a) GIS-based map of offshore mariculture polygons; (b) Longitude-latitude distribution of provincial mariculture zones.
Fishes 11 00062 g002
Figure 3. Offshore mariculture area by province.
Fishes 11 00062 g003
Figure 4. Percentage distribution of offshore mariculture area by province.
Fishes 11 00062 g004
Figure 5. Lorenz curve of offshore mariculture area distribution across provinces.
Fishes 11 00062 g005
Figure 6. Distribution of offshore mariculture size levels among provinces.
Fishes 11 00062 g006
Figure 7. Total offshore mariculture area by region.
Fishes 11 00062 g007
Table 1. Offshore mariculture areas and classification of China’s coastal provinces.
ProvinceSpecialization (LQ)Rank
Fujian2.24 (High)1
Jiangsu1.91 (High)2
Hebei1.61 (High)3
Guangdong0.96 (Non-specialized)4
Liaoning0.88 (Non-specialized)5
Shandong0.75 (Non-specialized)6
Zhejiang0.38 (Non-specialized)7
Guangxi0.19 (Non-specialized)8
Hainan0.07 (Non-specialized)9
Disclaimer/Publisher’s Note: The statements, opinions and data contained in all publications are solely those of the individual author(s) and contributor(s) and not of MDPI and/or the editor(s). MDPI and/or the editor(s) disclaim responsibility for any injury to people or property resulting from any ideas, methods, instructions or products referred to in the content.