Article

Study on the Reproductive Group Behavior of Schizothorax wangchiachii Based on Acoustic Telemetry

1
China Three Gorges Corporation, National Engineering Research Center of Eco-Environment Protection for Yangtze River Economic Belt, Wuhan 430010, China
2
Hubei Key Laboratory of Three Gorges Project for Conservation of Fishes, Yichang 443100, China
*
Author to whom correspondence should be addressed.
Fishes 2025, 10(7), 362; https://doi.org/10.3390/fishes10070362
Submission received: 18 May 2025 / Revised: 17 June 2025 / Accepted: 14 July 2025 / Published: 21 July 2025
(This article belongs to the Special Issue Behavioral Ecology of Fishes)

Abstract

To investigate the group behavioral characteristics of Schizothorax wangchiachii during the spawning period, we used acoustic telemetry to track 10 mature individuals (4 females, 12 males) in a semi-controlled stream section (28.1 m × 5.8 m) simulating natural spawning microhabitats from 23 to 26 January 2024. By integrating trajectory similarity analysis and wavelet transform, we examined the aggregation patterns and activity rhythms during natural spawning events. The population formed two relatively stable subgroups, with significantly shorter inter-individual distances during the day (1.69 ± 0.72 m) than at night (2.54 ± 0.85 m, p < 0.01). Aggregation behavior exhibited a dominant ultradian rhythm of 16.5 h, with stable clustering between 09:00 and 16:00 (spawning window: 13:40–14:20) and dispersal from 19:00 to 00:00. Group activity followed a decreasing-then-increasing trend, with higher nighttime activity. Males were more active than females (F = 51.89, p < 0.01); female activity peaked on the spawning day and was influenced by reproductive progression, while male activity was mainly driven by diel rhythms (p < 0.01). A weak positive correlation was found between active time and inter-individual distance in both sexes (r = 0.32, p < 0.05), indicating reduced activity when aggregated. These findings provide insight into the temporal coordination and spatial regulation of reproductive behavior under semi-controlled conditions. However, due to the short monitoring period and experimental setup, caution is warranted when generalizing to the full reproductive season or fully natural habitats.
Key Contribution: This study presents the first high-resolution, in situ tracking of Schizothorax wangchiachii group behavior during spawning events under semi-natural conditions. It combines trajectory similarity analysis with wavelet transform to reveal temporal patterns of aggregation and activity. A dominant ultradian rhythm and diel variation in spatial cohesion were identified, with peak aggregation aligning with the spawning window. This study demonstrates sex-specific behavioral drivers—reproductive progression in females (i.e., increased activity and aggregation associated with oviposition readiness) and diel rhythmicity in males (i.e., repeated behavioral cycles aligned with daytime). Furthermore, stronger spatial aggregation was associated with reduced individual activity levels, suggesting spatial regulation of behavioral rhythms under reproductive conditions.

1. Introduction

During the reproductive season, fish frequently exhibit group behaviors such as collective migration, spawning aggregation, and synchronized mating. These highly coordinated behavioral patterns not only significantly enhance reproductive efficiency and offspring survival but also serve as key mechanisms for maintaining population stability and adapting to environmental change [1]. Systematic investigation of the dynamics and key influencing factors of reproductive group behavior is crucial for identifying critical spawning habitats, delineating conservation windows, assessing the impacts of anthropogenic disturbances, and formulating effective ecological compensation and habitat restoration strategies [2].
Traditionally, studies on fish reproductive behavior have primarily relied on fishery data and behavioral observations under laboratory conditions. However, these approaches are constrained by spatial and environmental limitations, making it difficult to comprehensively reveal natural behavioral patterns in the wild [3]. With the advancement of biotelemetry technologies, researchers can now conduct continuous and fine-scale monitoring of individual fish in their natural habitats, including their spatial location, behavioral states, and environmental context. This has greatly expanded the methodologies and perspectives in aquatic animal ecology research [4,5]. Originating in the 1950s with acoustic tagging systems for marine organisms, this technology has evolved through advancements in acoustic sensors, materials, and ecological modeling. It is now widely applied in studies of key fish behaviors such as foraging, migration, and reproduction, including the tracking of home ranges, activity hotspots, hydrological key areas, and spawning and juvenile migration routes [6,7,8,9,10].
However, fish reproductive group behavior often exhibits pronounced temporal heterogeneity and individual behavioral diversity. Traditional time-series analysis methods, such as Fourier transforms and ARIMA models, are often limited in their capacity to handle complex, non-stationary environmental signals [11], and they are particularly inadequate for uncovering potential nonlinear coupling relationships between fish behavior and environmental cycles, such as diel rhythms or lunar phases [12]. Furthermore, typical reproductive behaviors—such as courtship chases, aggressive encounters, and egg guarding—are characterized by high degrees of spatiotemporal asynchrony. As a result, commonly used trajectory similarity measures (e.g., Euclidean distance, Dynamic Time Warping [DTW], and Edit Distance [ED]) often perform poorly when applied to noisy or irregular behavioral data [13,14].
Wavelet analysis, as a frequency-domain method designed for non-stationary time series, has been increasingly applied in recent years to the study of animal movement pattern recognition and group behavioral dynamics [11]. For instance, Continuous Wavelet Transform (CWT) enables the separation of short-term, transient behaviors (e.g., predation, escape responses) from long-term rhythmic behaviors (e.g., diel migrations) within animal movement trajectories [15,16]. Meanwhile, trajectory comparison techniques such as the Longest Common Subsequence (LCSS) have demonstrated strong robustness to variations in trajectory length and temporal misalignment. These methods can extract representative local behavioral segments without distorting the overall behavioral structure, making them well-suited for analyzing fish behavioral similarity in complex environmental contexts [17,18,19].
Schizothorax wangchiachii is a representative benthic cyprinid species endemic to the upper Yangtze River Basin and a focal species in ecological restoration programs in the Jinsha River. It inhabits high-altitude, fast-flowing rivers and exhibits short-distance upstream migration during the breeding season [20]. This gonochoristic species shows clear sexual dimorphism and reproduces via external fertilization. During reproduction, mature males develop conspicuous nuptial tubercles and a rough body surface, while females exhibit a swollen abdomen and a bright red genital papilla. Notably, females display batch spawning behavior, releasing eggs multiple times per day and selecting different mates and spawning sites for each event [21]. Spawning typically occurs in shallow gravel–sand shoals with flow velocities ranging from 0.39 to 0.79 m/s and water depths between 0.25 and 0.55 m. The substrate is mainly composed of fine sand, with occasional cobble patches [21,22]. These habitat preferences indicate a high level of environmental specialization, while the reproductive strategy suggests significant behavioral plasticity and complex mate selection processes.
In recent years, the natural reproductive habitats of S. wangchiachii have been increasingly fragmented or degraded due to the construction of large dams and alterations in sediment and flow regimes [23]. Understanding its fine-scale reproductive behavior under near-natural conditions is therefore crucial for designing conservation actions, such as habitat enhancement or ecological flow regulation. However, detailed investigations into its group coordination, temporal rhythms, and spatial behavior during reproduction remain scarce.
To address this gap, the present study tracked the reproductive behavior of S. wangchiachii over three consecutive days under semi-natural, controlled conditions that simulated key spawning habitat features, including the substrate type and flow regime. Using acoustic telemetry, the movement trajectories of a limited number of sexually mature individuals were recorded, and the behavioral data were analyzed through wavelet transformation and trajectory similarity detection to quantify temporal activity patterns and aggregation behavior.
It should be noted that, although the experiments were conducted under conditions designed to closely mimic the natural environment, the data were collected in a controlled setting and do not represent the full natural spawning cycle. Therefore, the findings of this study are intended to reveal short-term behavioral dynamics and individual coordination patterns during the breeding period, providing preliminary insights into the rhythmic organization of reproductive behavior. These results offer a foundation for future field-based studies and inform conservation strategies for this ecologically important native species.

2. Materials and Methods

2.1. Experimental Site

The experiment was conducted in a small mountain stream, a tributary of the Heishui River in Ningnan County, Sichuan Province, China—an area recognized as a key natural distribution range for S. wangchiachii [24]. The selected river section, spanning 28.1 m in length, with a width of 3.2–8.6 m (mean ± SD: 5.8 ± 0.4 m), featured high habitat heterogeneity, with alternating pools and riffles. Hydraulic measurements indicated water depths ranging from 0.07 to 1.1 m (mean ± SD: 0.56 ± 0.18 m), surface flow velocity from 0.03 to 0.79 m/s (mean ± SD: 0.28 ± 0.12 m/s), and bottom flow velocity from 0.03 to 0.44 m/s (mean ± SD: 0.12 ± 0.08 m/s) (Figure 1). The substrate was composed of fine gravel (2–64 mm), pebbles (64–256 mm), and boulders (>256 mm).
Based on substrate classification, the section was divided into five zones (S1–S5) representing different benthic types, ranging from fine gravel to large boulders [25] (Figure 2). Before the experiment, the upstream and downstream ends were blocked with 2 cm mesh nets to prevent the escape of tagged individuals. Fine sand and small gravel were selectively added to enhance the microhabitat’s diversity. Real-time flow regulation was implemented to ensure hydraulic stability throughout the experimental period (depth variation within ±5%; flow velocity CV < 0.15).
This site was selected because its hydrological and substrate features closely matched the spawning habitat requirements reported for S. wangchiachii in previous studies [21], with flow velocity ranging from 0.39 to 0.79 m/s, water depth between 0.12 and 0.41 m, and substrates dominated by fine sand with some cobbles. Additionally, the semi-enclosed and controllable nature of the site allowed for effective tracking of acoustic-tagged fish, making it suitable for detailed behavioral observations.

2.2. Experimental Methods

2.2.1. Acoustic Tags and Receivers

This study used 795-series acoustic tags (HTI, Seattle, WA, USA), operating at a transmission frequency of 307 kHz. Each tag was housed in a transparent, pressure-resistant acrylic casing, measuring 6.8 mm in diameter and 17.5 mm in length. The tags weighed 0.65 g in air and 0.34 g in water, with an operational lifespan of approximately four months. Before use, the tags were placed in the magnetic field coil of the programmer for their activation [3].
The receiver used in this study was the HR3 model, capable of continuously detecting and recording uniquely coded ultrasonic signals emitted by nearby transmitters. Each receiver could store up to 10 million signal detections. Powered by an internal lithium battery, the device could operate continuously for approximately six months. A total of five receivers were deployed in this study, arranged in a W-shaped configuration within the experimental river section. The distance between adjacent receivers ranged from 5 to 7 m. These receivers were mutually synchronized at the microsecond level, enabling precise localization of the transmitters. Before the experiment, the performance of each receiver was tested. The results showed that all five receivers achieved a 100% signal reception rate. During deployment, each receiver was suspended 0.5 m below the water surface using a nylon rope and anchored securely to the riverbed, with an insertion depth of more than 0.5 m to ensure overall stability without displacement.

2.2.2. Experimental Fish and Tagging Methods

The fish used in this experiment were captured from the main channel of the Heishui River between 18 and 20 January 2024, using a trawl net with a mesh size of 3 cm, a length of 10 m, and a height of 2 m. Gonadal assessments of the captured individuals indicated that most sexually mature fish were at gonadal development stage IV or above, suggesting that they were physiologically prepared for reproductive activities during the early pre-spawning period.
Considering the short-distance migratory behavior of Schizothorax wangchiachii, the experimental tributary—located within the same river system—was selected to ensure ecological continuity and reduce the potential stress caused by environmental shifts. Moreover, the water quality parameters of both locations were highly similar. In the main stream, the water temperature ranged from 11.30 to 13.98 °C (mean ± SD: 12.30 ± 0.05 °C), with a pH of 8.67 and dissolved oxygen of 8.81 mg/L. In the experimental tributary, the water temperature ranged from 11.22 to 13.87 °C (mean ± SD: 12.14 ± 0.03 °C), with a pH of 8.89 and dissolved oxygen of 9.04 mg/L. These consistent conditions validated the suitability of the experimental site and minimized the influence of environmental differences on fish behavior.
Following capture, the fish were temporarily held at the nearby Xingfu Farm for one week. Water used for temporary rearing was sourced from the Xingfu River to ensure consistency with the water conditions in the experimental area. A total of 16 healthy broodstock individuals (4 females and 12 males) displaying a strong physical condition and distinct secondary sexual characteristics were selected. All of the females had smooth body surfaces, distended abdomens, and prominently protruding, reddened genital pores; in one female, yellowish oocytes were visibly released upon gentle abdominal pressure. The males exhibited numerous prominent breeding tubercles on the snout and a generally rough body surface, indicating full reproductive maturity [20]. Among these, ten individuals were selected for acoustic tagging (Table 1). The tagged fish had body lengths ranging from 335 to 420 mm (mean: 390 mm) and body weights ranging from 750 to 1250 g (mean: 985 g), satisfying the widely accepted criterion that the transmitter weight should not exceed 2% of the fish’s body weight [26,27,28].
To minimize the impact of the tagging procedure on the experimental fish, a dorsal fin attachment method was employed instead of the conventional abdominal implantation technique. This approach was similar to the tag-hanging method and involved the use of MS-222 as an anesthetic. Optimal anesthesia was achieved when the fish displayed ventral-up positioning, ceased tail movements, and exhibited no response to gentle tactile stimulation [3]. Once anesthetized, tagging was performed as follows: the base of the dorsal fin was disinfected with iodine, and the tag was secured using a needle and thread passed between the first and second fin rays of the dorsal fin. After the tagging procedure, the wound was treated with antibiotics, and the fish were transferred to a holding pond adjacent to the experimental site for temporary recovery.

2.2.3. Experimental Process Record

After a 24 h temporary holding period, the tagged fish were monitored, and individuals exhibiting no abnormal behavior were released into the experimental site at 17:00 on 22 January 2024. Following their release, the fish displayed active swimming behavior, with no apparent signs of stress. To ensure comprehensive documentation of reproductive behaviors, two HIKVISION DS-2XC6284F signal-type underwater cameras were deployed at two likely spawning locations within the experimental area to allow for continuous video capture of potential spawning activity. Simultaneously, trained observers were stationed on the riverbank throughout the day. Once suspected spawning behaviors were detected, they immediately recorded the events using high-definition mobile phone cameras. To maximize the likelihood of capturing spawning events, we referred to the findings of Yan et al. [21], which identified peak spawning activity periods for this species. Accordingly, our monitoring window was set from 06:00 to 19:00 daily, aligning with daylight hours and optimal behavioral visibility.
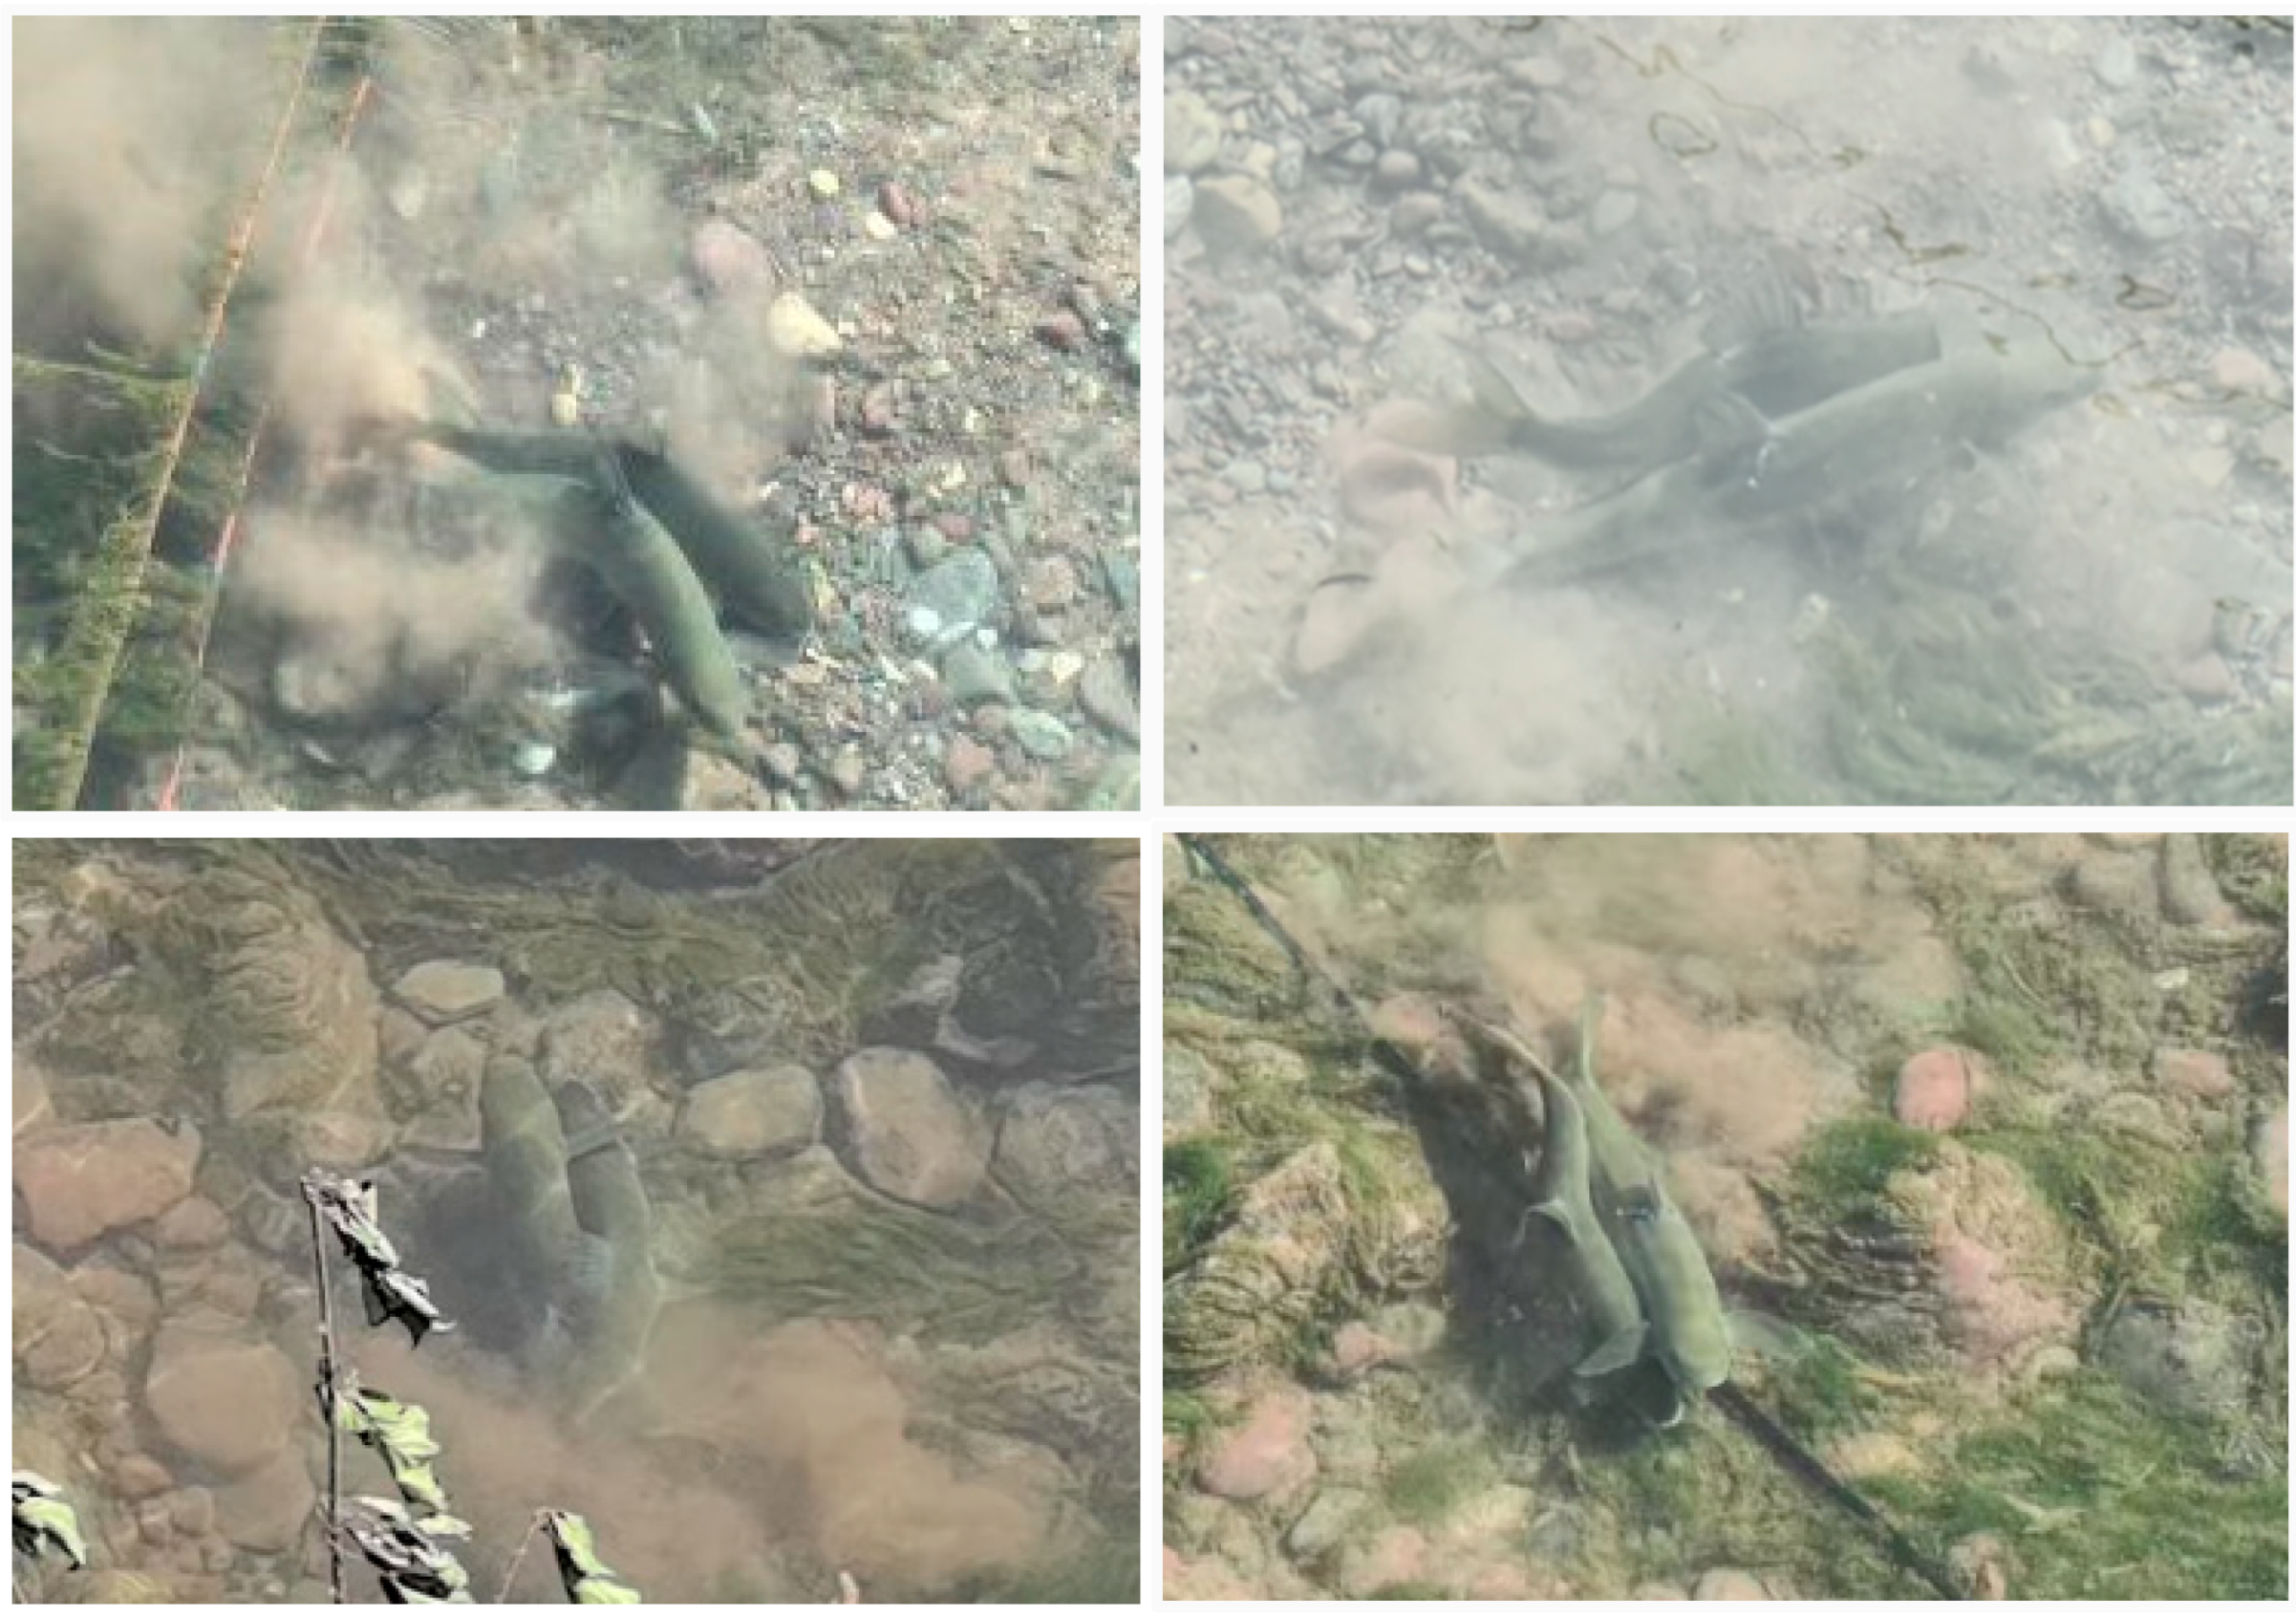
Natural spawning activity of Schizothorax wangchiachii was observed between 13:40 and 14:20 on 26 January 2024. During this period, five spawning and mating events were recorded, each lasting approximately 15–20 s (Figure 3). Spawning behavior was simultaneously documented by riverbank and underwater monitoring systems. The experiment concluded on 28 January 2024, upon which the tagged fish were retrieved and all equipment was removed from the study site.

2.3. Data Processing and Analysis

2.3.1. Trajectory Data Preprocessing

Data preprocessing and analysis were performed using VUE software version 2.1.3 (Vemco Inc. Nova Scotia, Canada) to assess the receiver detection efficiency and performance. Geospatial trajectories of the tagged fish were extracted using Fathom Position software version 4.4.2 (Vemco Inc.), resulting in a total of 61,949 raw detection records from ten tagged individuals during the experimental period. Each record included a timestamp (UTC+8), and geographic coordinates (longitude and latitude in WGS84). The data covered the period from 09:00 on 23 January to 19:00 on 27 January 2024, with trajectories recorded at non-uniform temporal intervals with second-level resolution. The preprocessing procedures involved three main steps: (1) removal of invalid data, including entries with missing values (NaN) or invalid timestamps (NaT); (2) coordinate transformation, in which the geographic coordinates were converted to a planar Cartesian coordinate system using the Universal Transverse Mercator (UTM, Zone 48N) projection to eliminate the influence of Earth’s curvature on spatial distance calculations [29]; and (3) time alignment, where linear interpolation was applied to the irregularly sampled trajectories to ensure the temporal continuity of the time series [30].

2.3.2. Individual Trajectory Similarity Analysis

This study employed a trajectory clustering method based on the Longest Common Subsequence (LCSS) algorithm to analyze individual fish’s movement trajectories [31]. Similarity between trajectories was quantified using the LCSS similarity metric, with the spatial tolerance parameter set to ε = 0.001 (in degrees of latitude/longitude) and the temporal tolerance δ set to 60 s, controlling for the influence of spatiotemporal deviations on similarity calculations. Based on the similarity matrix, hierarchical clustering was performed to classify the groups [32], with the dendrogram constructed using the average linkage method. The validity of the clustering results was evaluated by the silhouette coefficient [33], and the optimal number of clusters (k) was determined by comparing the silhouette scores across different cluster counts. Visualization of the clustering results further revealed the spatiotemporal heterogeneity characteristics of fish school dynamics [34].

2.3.3. Fish Schooling Behavior Characteristics Analysis

(1)
Activity Feature Extraction and Active State Identification
Individual movement speed (Vt) was calculated based on planar displacement between adjacent time points:
V t = x t + 1 x t 2 + y t + 1 y t 2 t
where xt and yt represent the horizontal and vertical positions of the individual at time t, respectively. The active state threshold was defined as the 30th percentile of the speed distribution; an individual was classified as being in an active state when its instantaneous speed exceeded this threshold, and inactive otherwise. This method, based on the statistical properties of speed, effectively distinguishes different activity levels [35]. The group aggregation degree was quantified by calculating the average Euclidean distance between individuals within a sliding window (window length: 60 min; step size: 10 min), reflecting the dynamic changes in grouping behavior [36].
(2)
Wavelet Transform and Dominant Period Extraction
To investigate the periodic variations in individual activity and group aggregation behavior, Continuous Wavelet Transform (CWT) was applied to the speed time series and the aggregation index series derived from average pairwise distance. The Morlet wavelet was selected as the mother wavelet to extract frequency features across multiple temporal scales [37]. The wavelet transform yielded two-dimensional power spectra in the scale–time domain, with scales converted to periods (in hours). The dominant period at each time point was defined as the period corresponding to the peak power in the spectrum [38], serving to characterize temporal patterns in fish behavioral rhythms.
(3)
Quantification of Active Time and Aggregation States
Active states were identified based on individual swimming speed. Using wavelet transform and applying a 1 h time window, the proportion of time each fish group remained active within each hour was calculated and expressed as a percentage. Aggregation states were identified based on a threshold of average inter-individual distance. Specifically, the time series of average distances between individuals was smoothed using a moving average with a window size of 10 to reduce high-frequency noise. The 40th percentile of the smoothed series was then used as the threshold: time points with average distances below this threshold were defined as “aggregated,” while those above were considered “dispersed” [39]. Transitions between these states were detected to segment continuous behavioral phases. For each phase, the start and end times, duration, and corresponding state were recorded. This method facilitates quantitative characterization of group behavior across different phases and provides foundational data for subsequent correlation analyses [40].
All analyses were conducted using MATLAB version R2023a (MathWorks Inc., Natick, MA, USA). Spatial computations were performed with the Mapping Toolbox, and statistical analysis and visualization were carried out using the Statistics and Machine Learning Toolbox.

3. Results

3.1. Trajectory Similarity Clustering Results

The trajectory similarity clustering results during the study period (Figure 4) revealed the following patterns: On 23 January, all individuals except for individual number 5 (No. 5) clustered into a single group, with a silhouette coefficient of 0.79. Within this group, the female individuals numbered 7, 8, and 9 (No. 7, 8, 9) formed a tightly associated subcluster, characterized by a mean intracluster distance of less than 0.25. From 24 to 27 January, two mixed-sex subgroups emerged each day. In both subgroups, spatial associations between females and males were observed, typically involving each female maintaining close proximity to one or two males, with average nearest-neighbor distances below 0.30 m. Notably, the female individual numbered 7 (No. 7), which successfully spawned naturally, maintained the closest spatial proximity to the males individuals numbered 3 and 4 (No. 3, 4) during the pre-spawning period (24–26 January). In addition, the female individuals numbered 8 and 9 (No. 8 and 9) consistently exhibited high trajectory similarity throughout the experiment.

3.2. Periodicity of Aggregation Behavior

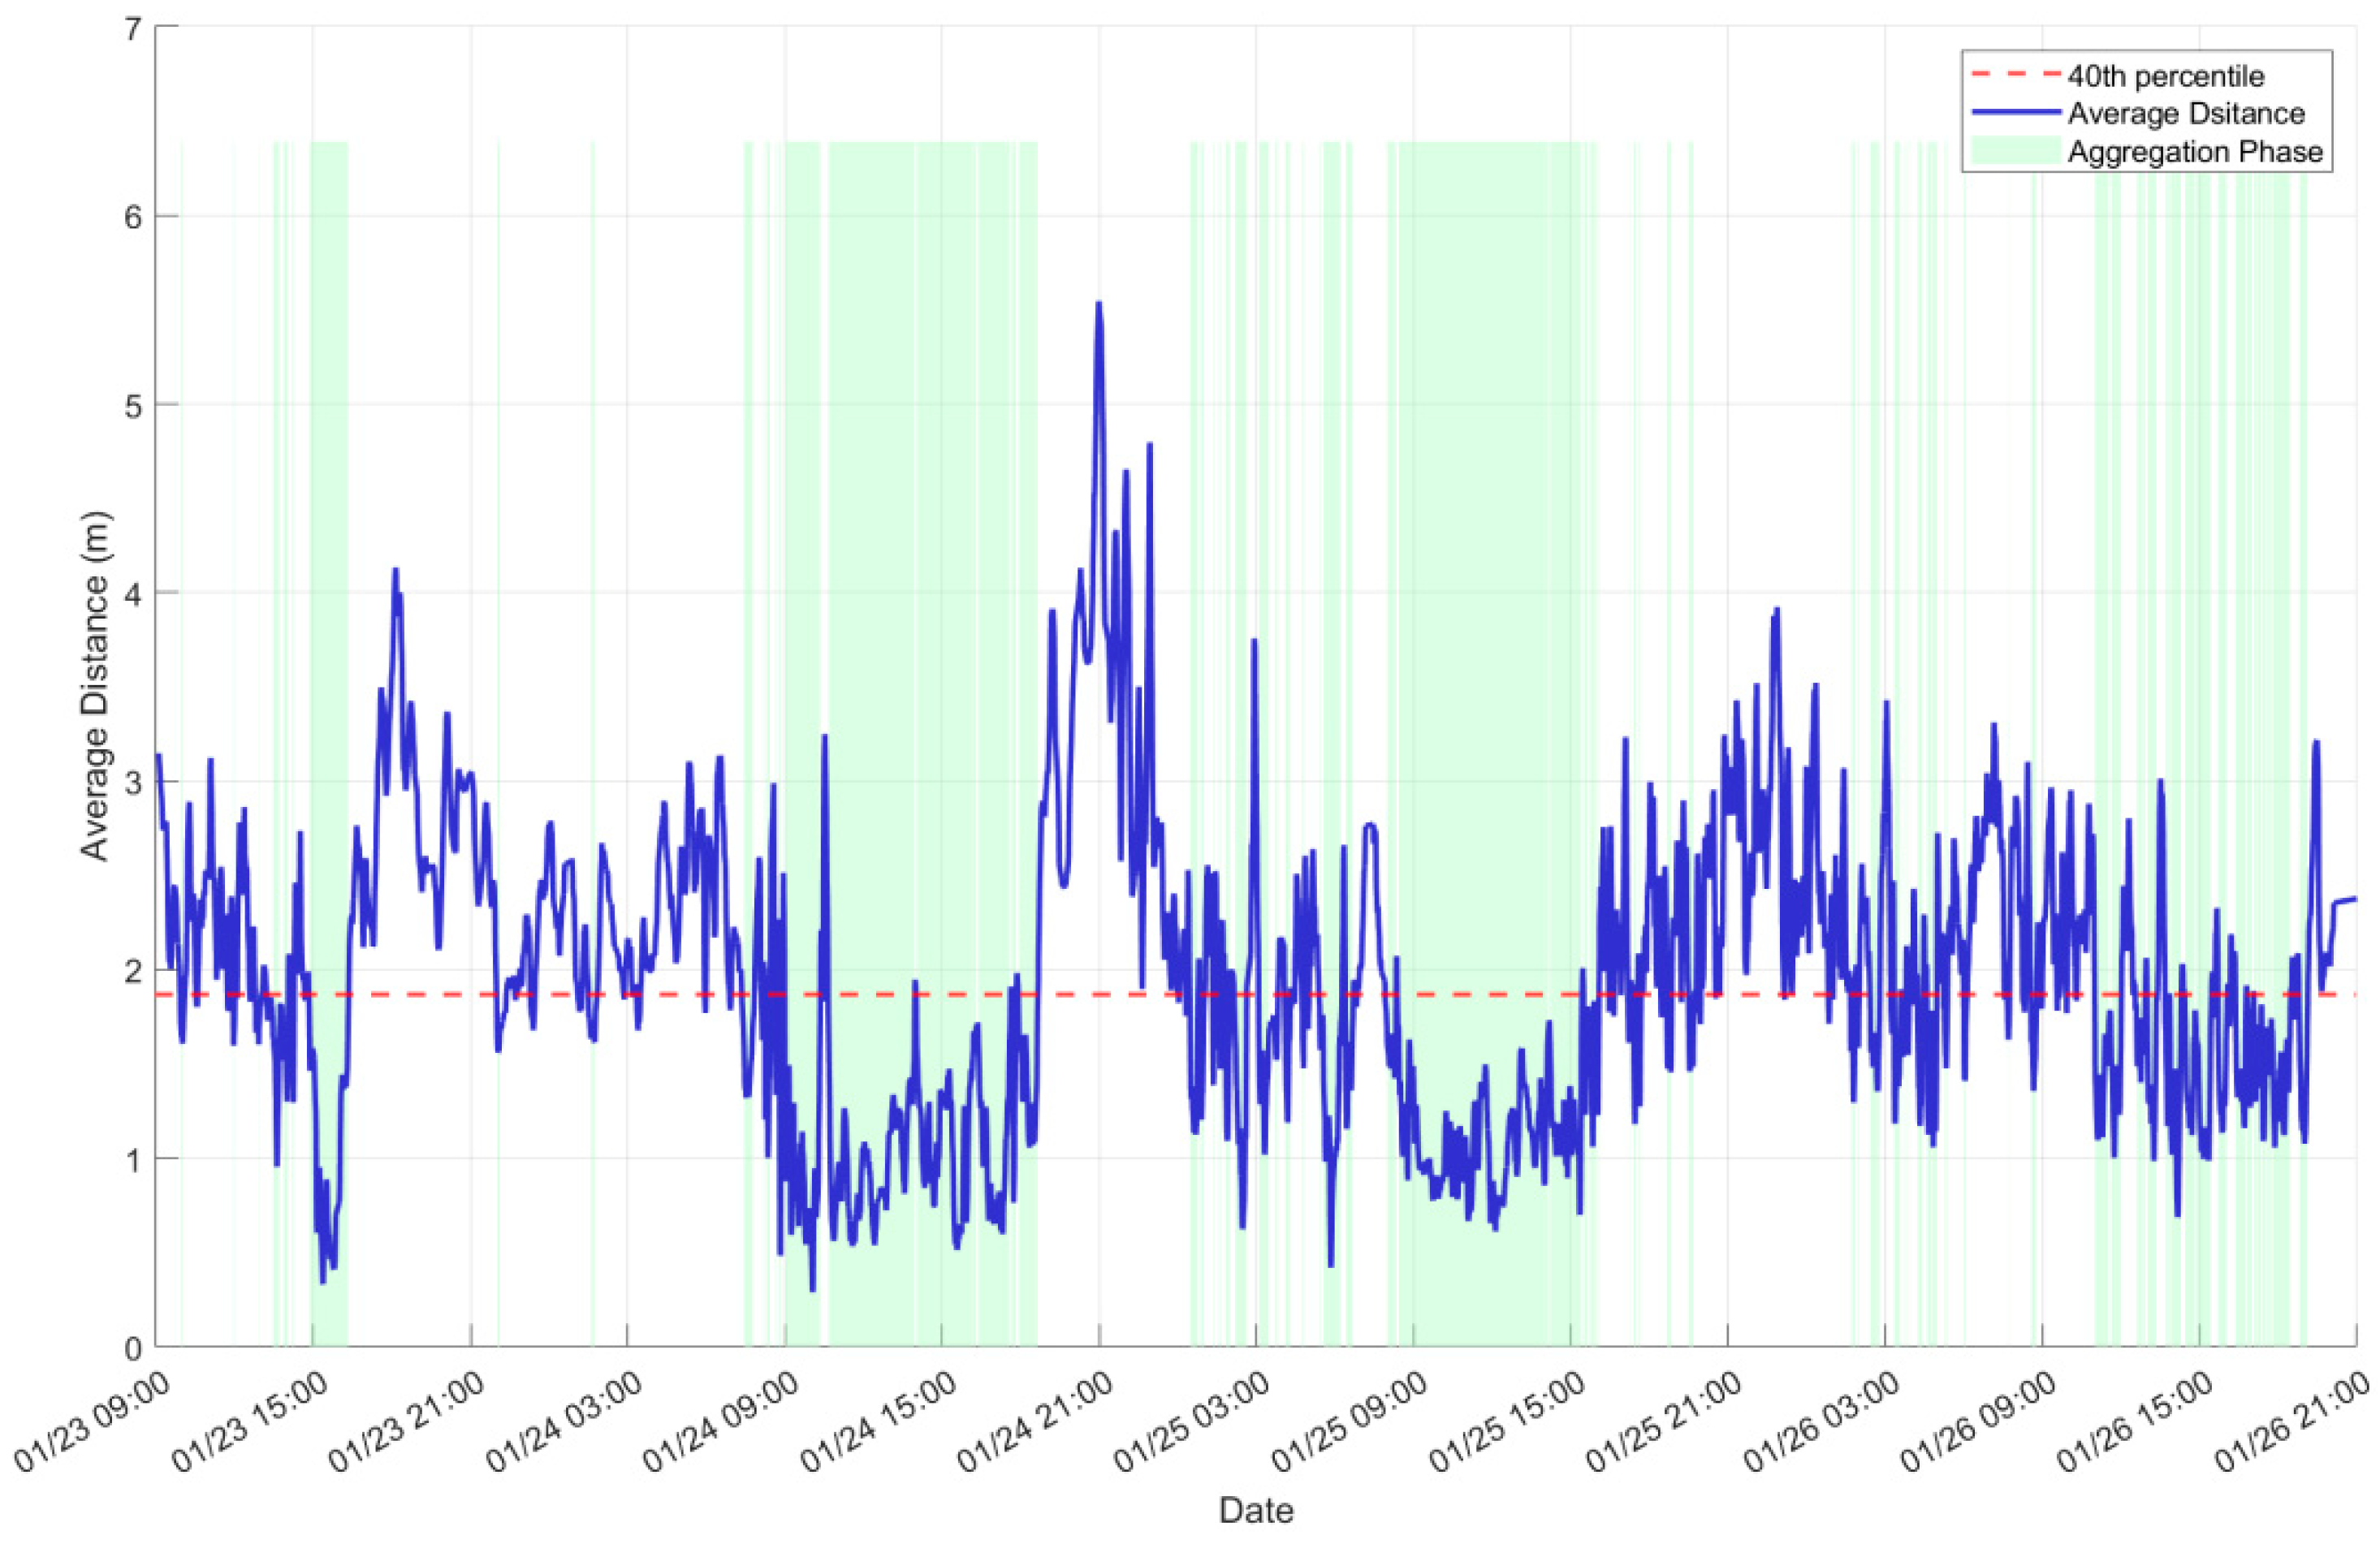
During the experimental period, the average inter-individual distance among fish ranged from 0.61 to 5.53 m. No significant differences were observed in this distance across days (one-way ANOVA: F = 1.02, p = 0.39); However, a significant diel rhythm was detected (repeated-measures ANOVA: F = 21.92, p < 0.01). Specifically, the nighttime distances (2.54 ± 0.85 m) were significantly greater than those recorded during the daytime (1.69 ± 0.72 m). Based on the 40th percentile (1.78 m) of the distance distribution, states with mean inter-individual distances below this threshold were defined as aggregation. The results from Continuous Wavelet Transform (CWT) analysis revealed a dominant periodicity of 16.51 h in aggregation behavior, with this principal cycle accounting for 11.78% of the total wavelet power. The diel rhythm analysis further showed that the fish group remained relatively stable in an aggregated state between 09:00 and 16:00 each day (Figure 5). From 19:00 to 00:00, the average distance increased beyond 2.5 m, indicating a dispersed state. During the early morning hours (02:00–06:00), the group frequently alternated between aggregation and dispersion.
It is important to acknowledge that this study was conducted under controlled conditions with a limited number of individuals (n = 10) within a semi-enclosed stream section over a short timeframe (5 days). These constraints may influence the generalizability of our findings to natural populations of Schizothorax wangchiachii. In the wild, fish aggregation patterns are shaped by a wider range of biotic and abiotic factors such as predator presence, complex flow regimes, and habitat connectivity, which were not replicated in our experimental design [41,42]. The restricted spatial scale could also limit the expression of natural exploratory or dispersal behaviors, while the short observation period may not fully capture long-term rhythmicity or variability in aggregation dynamics. Therefore, while the observed periodic aggregation cycles under constant flow conditions provide important insights into the species’ behavioral tendencies, caution should be exercised when extrapolating these findings to broader ecological contexts.

3.3. Behavioral Activity Characteristics of the Fish Group

Analysis of activity levels revealed that the male fish spent a significantly higher percentage of time active (range = 48.34–93.74%; mean ± SD: 72.13 ± 11.20%) than the female fish (range = 36.26–79.13%; mean: 60.28 ± 9.95%) (F = 51.89, p < 0.01). This sex difference was most pronounced in the period from 16:00 to 07:00 of the following day (Figure 3). From 23 to 26 January, the activity levels of both the male and female groups first decreased and then increased. However, in the male group, this change was not significant (F = 2.54, p > 0.05), with the activity being highest on 23 January (77.64 ± 9.62%) and lowest on 25 January (68.30 ± 11.78%). The female group showed significant differences (F = 4.91, p < 0.01), with their activity being lowest on 24 January (56.50 ± 10.85%) and highest on 26 January (65.52 ± 6.95%) (Figure 6). Further analysis indicated that both sexes had a higher average proportion of active time at night than during the day, but the day–night cycle exerted a significantly stronger effect on male activity (male: F = 7.85, p < 0.01; female: F = 0.99, p > 0.05). Pearson correlation analysis revealed a coupling between behavior and spatial distribution: the percentage of active time for both sexes was weakly positively correlated with the mean inter-individual distance (female: r = 0.26, p < 0.05; male: r = 0.33, p < 0.01), indicating that the fish were less active in a highly aggregated state (short inter-individual distances) and exhibited increased activity when more dispersed.

4. Discussion

4.1. Effects of Tagging on the Normal Activity of Schizothorax wangchiachii

To obtain representative data on fish behavior, tagging techniques must avoid causing significant physiological or behavioral changes. Although the species in this study is endemic to turbulent mountain rivers, evidence from other freshwater and marine fish suggests that well-managed tagging protocols can minimize stress. For example, in Gadus morhua, no significant changes were observed in swimming or feeding before and after tagging under laboratory conditions [43,44]. Similarly, behavioral impacts were minimal in Hypophthalmichthys nobilis following surgical implantation [45]. Although these species differ in ecology and morphology, their responses provide a useful comparative baseline for assessing tagging impacts in other teleosts, including schizothoracins.
To reduce tagging effects, the transmitters were externally attached to the dorsal fin rather than implanted, avoiding muscle or organ damage. The transmitters were small (HTI 795-LM, 0.34 g in water) and accounted for only 0.04% of body weight—far below the 2.5% recommended threshold [46]. Sterile techniques and consistent water parameters were maintained to further reduce physiological stress. After release, all individuals remained active and exploratory, suggesting that the tagging protocol did not disrupt normal behavior.

4.2. Fish School Structure and Subgroup Dynamics

School structure is critical for understanding fish group behavior. Using high-resolution acoustic telemetry, we observed that the tagged fish did not form a homogeneous aggregation but, rather, split into two relatively stable subgroups. This is consistent with prior observations that schools of cod begin to form subunits when their size exceeds 10–11 individuals [47,48]. In this study, four individuals (No. 2, 5, 8, and 9) formed a distinct subgroup on 24–25 April, reinforcing the hypothesis that S. wangchiachii also exhibits subgroup dynamics under certain conditions.
Previous studies have suggested that schooling is a self-organized behavior, lacking a fixed leader, and instead driven by local interactions [49,50]. Although we could not directly test the mechanisms, our observations showed that the individuals at the front of the school were not consistent, and several females alternated in leading positions. This dynamic is consistent with decentralized leadership models [51,52].

4.3. Reproductive Behavior of S. wangchiachii

Past investigations based on local interviews and broodstock sampling indicate that S. wangchiachii exhibits schooling and chasing behaviors during the reproductive season [53]. Behavioral classifications during this period include exploration, territorial establishment, mate selection, and mating [54]. However, these conclusions remain generalized and lack fine-scale behavioral detail.
In this preliminary study, involving 16 individuals (4 females and 12 males) monitored continuously for 5 days, we observed key reproductive behaviors in semi-natural conditions. On 23 January, the group was scattered and active, consistent with exploratory behavior. From 24 to 27 January, spatial associations between sexes emerged, such as persistent following of females by multiple males. Female No. 7 maintained close proximity with males No. 3 and 4, suggesting active mate evaluation. In contrast, non-participating females (e.g., No. 8 and 9) remained in deeper, still areas, mostly inactive. These observations reflect sex-specific roles during reproduction, aligning with previous reports [54], yet should be interpreted with caution due to the short observation period and small sample size.

4.4. Schooling and Activity Rhythms

The breeding season of Schizothorax species generally spans from February to July [55,56], with peak activity between 09:00–12:00 and 14:00–17:00 [57]. Interestingly, our data suggest that reproduction in S. wangchiachii may begin earlier (mid-December), with spawning observed at water temperatures between 13.1 and 14.5 °C.
Wavelet analysis of schooling behavior revealed a dominant period of 16.51 h, contributing 11.78% of spectral energy; this suggests that while the 16.51 h rhythm is representative, aggregation behavior in Schizothorax is not governed by a single rhythm but is likely modulated by multiple periodic and aperiodic factors [58,59,60]. However, the aggregation patterns also varied with the time of day and environmental factors. Stable aggregation typically occurred from 09:00 to 16:00, with spawning behavior concentrated between 13:26 and 14:40, coinciding with the peak temperature and light intensity—conditions known to support egg development [57,61,62,63].
At night (19:00–00:00), the average distance between individuals exceeded 2.5 m, suggesting a dispersed state. Such nocturnal dispersion may reduce the risk of predation or facilitate energy recovery [58,60]. Activity analysis further revealed that males were consistently more active than females. During group aggregation, both sexes exhibited reduced activity—an “inactive schooling” mode. In dispersed states, male activity sharply increased, likely due to mate searching, territory defense, and environmental assessment. In contrast, females prioritized energy conservation for spawning. These sex-specific behavioral rhythms align with previous findings on diel activity in schizothoracins [61,64].
Moreover, we observed a weak positive correlation between activity levels and inter-individual distance, suggesting that dispersion facilitates exploration and mate searching, while aggregation supports synchronization and energy conservation [58,59,65]. While these patterns offer valuable insight into group coordination strategies, they require validation through extended monitoring of wild populations.
In summary, this study sheds light on the periodic aggregation and activity patterns of Schizothorax wangchiachii under semi-controlled conditions, yet its scope is limited by sample size, observation duration, and habitat simplicity. To fully understand the species’ natural behavioral ecology, future research should employ larger sample sizes, extended monitoring periods, and more ecologically complex or open habitats that incorporate natural biotic and abiotic variability. Such studies will be critical to validate and extend the present findings to wild populations.

5. Conclusions

This study investigated the group behavioral dynamics of Schizothorax wangchiachii during the reproductive period under controlled conditions, using acoustic telemetry and wavelet analysis. The results revealed the presence of two relatively independent subgroups within the spawning population, supporting the hypothesis of self-organized social structures. Aggregation behavior exhibited a predominant ultradian rhythm, with a 16.51 h cycle, but was shaped by multiple interacting temporal and spatial factors rather than a single periodic driver.
Stable clustering primarily occurred during daytime (09:00–16:00), with peak spawning activity concentrated between 13:40 and 14:20, while individuals tended to disperse at night. Population-level activity showed a decline followed by recovery during the observation period, with males maintaining higher and more sustained activity than females. The male activity patterns aligned with circadian rhythms, whereas female activity peaked on the spawning day, likely reflecting physiological regulation associated with reproduction. A weak positive correlation between spatial proximity and individual activity levels suggests that group structure may influence behavioral rhythmicity.
While these findings advance our understanding of behavioral coordination and rhythmic regulation during fish reproduction, they are based on a short-term study within a semi-enclosed habitat and should be interpreted with caution. Future studies incorporating larger populations, longer time scales, and more naturalistic environments are needed to further validate and extend these insights.

Author Contributions

B.L.: Conceptualization, Data Curation, Project Administration, Writing—Original Draft, Writing—Review and Editing. F.H.: Data Curation, Writing—Review and Editing. W.L.: Data Curation, Writing—Review and Editing. W.S.: Data Curation, Writing—Review and Editing. J.Z.: Data Curation. W.J.: Conceptualization, Data Curation, Formal Analysis, Methodology, Project Administration, Writing—Original Draft, Writing—Review and Editing. All authors have read and agreed to the published version of the manuscript.

Funding

The authors declare that financial support was received for the research, authorship, and/or publication of this article. This research was supported by the Scientific Research Project of National Key Research and Development Plan (2022YFC3204200), and by the China Three Gorges Corporation (Grant/Award Number: NBWL202200489).

Institutional Review Board Statement

The animal use protocol listed below has been reviewed and approved by the Animal Ethical and Welfare Committee(AEWC), there is no approval code for the Committee, the application date is 1 April 2023.

Informed Consent Statement

Not applicable.

Data Availability Statement

The original contributions presented in this study are included in the article. Further inquiries can be directed to the corresponding author.

Acknowledgments

Throughout the writing of this dissertation, a great deal of support and assistance was received. Ping Liu is acknowledged for the discussions and English review.

Conflicts of Interest

The authors were employed by the company China Three Gorges Corporation, National Engineering Research Center of Eco-Environment Protection for Yangtze River Economic Belt. The authors declare that the research was conducted in the absence of any commercial or financial relationships that could be construed as a potential conflict of interest.

References

  1. Pitcher, T.J.; Parrish, J.K. Functions of shoaling behaviour in teleosts. In The Behaviour of Teleost Fishes; Springer: Dordrecht, The Netherlands, 1993; pp. 294–337. [Google Scholar] [CrossRef]
  2. Danylchuk, A.J.; Adams, A.J.; Horodysky, A.Z.; Suski, C.D.; Ward-Paige, C.A.; Brooks, E.J.; Cooke, S.J. Ecological and management implications of gear interactions for Nassau grouper spawning aggregations. Rev. Fish Biol. Fish. 2011, 21, 311–325. [Google Scholar] [CrossRef]
  3. Shi, L.; Ye, S.W.; Zhu, H.; Ji, X.; Wang, J.C.; Liu, C.A.; Liu, X.G. The spatial-temporal distribution of fish in lake usingacoustic tagging and tracking method. Acta Hydrobiol. Sin. 2022, 46, 611–620. [Google Scholar]
  4. Wang, C.Y.; Wei, Q.W.; Du, H.; Zhang, H.; Liu, Z.G. Applications of ultrasonic telemetry in aquatic animal ecology. Chin. J. Ecol. 2010, 29, 2286–2292. [Google Scholar]
  5. Cooke, S.J.; Wagner, G.N. Training, Experience, and Opinions of Researchers Who Use Surgical Techniques to Implant Telemetry Devices into Fish. Fisheries 2004, 29, 10–18. [Google Scholar] [CrossRef]
  6. Welch, D.W.; Ward, B.R.; Batten, S.D. Early ocean survival and marine movements of hatchery and wild steelhead trout (Oncorhynchus mykiss) determined by an acoustic array: Queen Charlotte Strait, British Columbia. Deep. Sea Res. Part Ⅱ Top. Stud. Oceanogr. 2004, 51, 897–909. [Google Scholar] [CrossRef]
  7. Hinch, S.G.; Standen, E.M.; Healey, M.C.; Farrell, A.P. Swimming patterns and behaviour of upriver-migrating adult pink (Oncorhynchus gorbuscha) and sockeye (O. nerka) salmon as assessed by EMG telemetry in the Fraser River, British Columbia, Canada. In Aquatic Telemetry; Springer: Dordrecht, The Netherlands, 2002; pp. 147–160. [Google Scholar] [CrossRef]
  8. Sulak, K.J.; Randall, M.T.; Edwards, R.E.; Summers, T.M.; Luke, K.E.; Smith, W.T.; Norem, A.D.; Harden, W.M.; Lukens, R.H.; Parauka, F.; et al. Defining winter trophic habitat of juvenile Gulf Sturgeon in the Suwannee and Apalachicola rivermouth estuaries, acoustic telemetry investigations. J. Appl. Ichthyol. 2009, 25, 505–515. [Google Scholar] [CrossRef]
  9. Yano, A.; Ogura, M.; Sato, A.; Sakaki, Y.; Ban, M.; Nagasawa, K. Development of Ultrasonic Telemetry Technique for Investigating the Magnetic of Salmonids. Fish. Sci. 1996, 62, 698–704. [Google Scholar] [CrossRef]
  10. Ogura, M.; Ishida, Y. Homing behavior and vertical movements of four species of Pacific salmon (Oncorhynchus spp.) in the central Bering Sea. Can. J. Fish. Aquat. Sci. 1995, 52, 532–540. [Google Scholar] [CrossRef]
  11. Cazelles, B.; Chavez, M.; Berteaux, D.; Ménard, F.; Vik, J.O.; Jenouvrier, S.; Stenseth, N.C. Wavelet analysis of ecological time series. Oecologia 2008, 156, 287–304. [Google Scholar] [CrossRef]
  12. Zhdanova, I.V.; Wang, S.Y.; Leclair, O.U.; Danilova, N.P. Melatonin promotes sleep-like state in zebrafish. Brain Res. 2001, 903, 263–268. [Google Scholar] [CrossRef]
  13. Sakoe, H.; Chiba, S. Dynamic Programming Algorithm Optimization for Spoken Word Recognition. In Readings in Speech Recognition; Elsevier: Amsterdam, The Netherlands, 1990; pp. 159–165. [Google Scholar] [CrossRef]
  14. Nathan, R.; Getz, W.M.; Revilla, E.; Holyoak, M.; Kadmon, R.; Saltz, D.; Smouse, P.E. A movement ecology paradigm for unifying organismal movement research. Proc. Natl. Acad. Sci. USA 2008, 105, 19052–19059. [Google Scholar] [CrossRef]
  15. Gallarda, B.W.; Sharpee, T.O.; Pfaff, S.L.; Alaynick, W.A. Defining rhythmic locomotor burst patterns using a continuous wavelet transform. Ann. N. Y. Acad. Sci. 2010, 1198, 133–139. [Google Scholar] [CrossRef]
  16. Leise, T.L. Wavelet analysis of circadian and ultradian behavioral rhythms. J. Circadian Rhythm. 2013, 11, 5. [Google Scholar] [CrossRef] [PubMed]
  17. Vlachos, M.; Kollios, G.; Gunopulos, D. Discovering similar multidimensional trajectories. In Proceedings of the 18th International Conference on Data Engineering, San Jose, CA, USA, 26 February–1 March 2002. [Google Scholar] [CrossRef]
  18. Chen, L.; Özsu, M.T.; Oria, V. Robust and fast similarity search for moving object trajectories. In Proceedings of the 2005 ACM SIGMOD International Conference on Management of Data. SIGMOD/PODS05: International Conference on Management of Data and Symposium on Principles Database and Systems, Baltimore, MD, USA, 14 June 2005. [Google Scholar] [CrossRef]
  19. Dodge, S.; Weibel, R.; Lautenschütz, A.-K. Towards a taxonomy of movement patterns. Inf. Vis. 2008, 7, 240–252. [Google Scholar] [CrossRef]
  20. Wu, X.W. Monograph on Cyprinidae Fishes of China; Shanghai Scientific and Technical Press: Shanghai, China, 1982. [Google Scholar]
  21. Yan, W.B. Studies on Reproductive Behavioural Ecology of Schizothorax wangchiachii; Shanghai Ocean University: Shanghai, China, 2016. [Google Scholar]
  22. Rong, Y.F.; Ban, X.; Zhou, Y.H.; Liu, W.C.; Qi, H.F.; Yang, J.X.; Zhang, H.; Zhou, W.G.; Yu, L.X.; Du, H. The spawning habitat characteristics of Gymnocypris przewalskii and its identification by the UAV in tributary of Qinghai Lake—Taking Quanji River as an example. Acta Ecol. Sin. 2022, 42, 9371–9382. [Google Scholar] [CrossRef]
  23. Qing, J.; Cheng, B.X.; Yan, X.; Yang, S.R.; Zhu, D.Z. Discussion on key technical problems of fish habitat ecological restoration in Heishui River. In Proceedings of the 2019 Annual Science and Technology Conference of the Chinese Society for Environmental Sciences—Sub-forum on Technological Innovation and Application in Environmental Engineering, Chengdu, China, 18–19 November 2019; Shanghai Investigation, Design & Research Institute Co., Ltd.: Shanghai, China; China Three Gorges Construction Management Co., Ltd.: Wuhan, China; Volume 3, pp. 154–157. [Google Scholar] [CrossRef]
  24. Teng, H.; Tian, H.-W.; Liu, H.-W.; Cheng, B.-X.; Yang, S.-R.; Liu, S.-P.; Chen, D.-Q.; Duan, X.-B. Fish resources status in Heishui River, a tributary of the lower reaches of Jinsha River. Chin. J. Ecol. 2021, 40, 1499–1511. [Google Scholar]
  25. Yang, Z.; Zhang, P.; Tang, H.Y.; Gong, Y.; Dong, C.; Chen, X.J.; Zhao, N. The formation of habitat suitability curves for Coreius guichenoti (Sauvage & Dabry de Thiersant, 1874) of the lower Jinsha River. Ecol. Sci. 2017, 36, 129–137. [Google Scholar] [CrossRef]
  26. Guillemette, M.; Woakes, A.J.; Flagstad, A.; Butler, P.J. Effects of Data-Loggers Implanted for a Full Year in Female Common Eiders. Condor 2002, 104, 448–452. [Google Scholar] [CrossRef]
  27. Bridger, C.J.; Booth, R.K. The Effects of Biotelemetry Transmitter Presence and Attachment Procedures on Fish Physiology and Behavior. Rev. Fish. Sci. 2003, 11, 13–34. [Google Scholar] [CrossRef]
  28. Luo, H.W.; Duan, X.B.; Liu, S.P.; Chen, D.Q. Effects of transmitter’s surgical implantation on fish: Research progress. Chin. J. Appl. Ecol. 2013, 24, 1160–1168. [Google Scholar] [CrossRef]
  29. Snyder, J.P. Professional Paper. In Map Projections: A Working Manual; U.S. Government Printing Office: Washington, DC, USA, 1987. [Google Scholar] [CrossRef]
  30. Pebesma, E. Simple Features for R: Standardized Support for Spatial Vector Data. R J. 2018, 10, 439. [Google Scholar] [CrossRef]
  31. Berndt, D.J.; Clifford, J. Using dynamic time warping to find patterns in time series. In Proceedings of the AAAI Workshop on Knowledge Discovery in Databases, Seattle, WA, USA, 31 July 1994; pp. 359–370. [Google Scholar]
  32. Hadi, A.S.; Kaufman, L.; Rousseeuw, P.J. Finding Groups in Data: An Introduction to Cluster Analysis. Technometrics 1992, 34, 111. [Google Scholar] [CrossRef]
  33. Rousseeuw, P.J. Silhouettes: A graphical aid to the interpretation and validation of cluster analysis. J. Comput. Appl. Math. 1987, 20, 53–65. [Google Scholar] [CrossRef]
  34. Couzin, I.D.; Krause, J.; Franks, N.R.; Levin, S.A. Effective leadership and decision-making in animal groups on the move. Nature 2005, 433, 513–516. [Google Scholar] [CrossRef]
  35. Addison, P.S. The illustrated wavelet transform handbook: Introductory theory and applications in science, engineering, medicine and finance, 2nd edition. Contemp. Phys. 2017, 59, 100. [Google Scholar] [CrossRef]
  36. Bode, N.W.F.; Faria, J.J.; Franks, D.W.; Krause, J.; Wood, A.J. How perceived threat increases synchronization in collectively moving animal groups. Proc. R. Soc. B Biol. Sci. 2010, 277, 3065–3070. [Google Scholar] [CrossRef]
  37. Torrence, C.; Compo, G.P. A Practical Guide to Wavelet Analysis. Bull. Am. Meteorol. Soc. 1998, 79, 61–78. [Google Scholar] [CrossRef]
  38. Grinsted, A.; Moore, J.C.; Jevrejeva, S. Application of the cross wavelet transform and wavelet coherence to geophysical time series. Nonlinear Process. Geophys. 2004, 11, 561–566. [Google Scholar] [CrossRef]
  39. Vicsek, T.; Zafeiris, A. Collective motion. Phys. Rep. 2012, 517, 71–140. [Google Scholar] [CrossRef]
  40. Bousquet, C.A.H.; Sumpter, D.J.T.; Manser, M.B. Moving calls: A vocal mechanism underlying quorum decisions in cohesive groups. Proc. R. Soc. B Biol. Sci. 2010, 278, 1482–1488. [Google Scholar] [CrossRef]
  41. Krause, J.; Ruxton, G.D.; James, R. Important topics in group living. In Social Behaviour: Genes, Ecology and Evolution; Oxford University Press: Oxford, UK, 2000. [Google Scholar]
  42. Ward, A.J.W.; Webster, M.M. Sociality: The Behaviour of Group-Living Animals; Springer: Cham, Switzerland, 2016. [Google Scholar] [CrossRef]
  43. Miyagi, A.; Amakasu, K.; Abe, K.; Imaizumi, T.; Miyamoto, Y.; Kakihara, T. Change of source level of pinger due to implanting into fish. Nippon Suisan Gakkaishi 2011, 77, 791–798. [Google Scholar] [CrossRef]
  44. McCovey, B.W., Jr. Klamath river green sturgeon acoustic tagging and biotelemetry monitoring 2010. In Final Technical Report; Yurok Tribal Fisheries Program, Klamath River Division: Hoopa, CA, USA, 2011; pp. 1–15. [Google Scholar]
  45. Luo, H.; Duan, X.; Liu, S.; Chen, D. Effects of surgically implanted dummy ultrasonic transmitters on physiological response of bighead carp Hypophthalmichthys nobilis. Fish Physiol. Biochem. 2014, 40, 1521–1532. [Google Scholar] [CrossRef]
  46. Grothues, T.M. A review of acoustic telemetry technology and a perspective on its diversification relative to coastal tracking arrays. In Tagging and Tracking of Marine Animals with Electronic Devices; Nielsen, J.L., Arrizabalaga, H., Fragoso, N., Hobday, A., Lutcavage, M., Sibert, J., Eds.; Springer: Berlin/Heidelberg, Germany, 2009; pp. 77–90. [Google Scholar]
  47. Zhou, Y.; Wang, J.; Qian, W.; Cao, D.; Zhang, Z.; Liu, L. Review of fish schooling behavior study. J. Shanghai Ocean. Univ. 2013, 22, 734–743. [Google Scholar]
  48. Partridge, B.L. Internal dynamics and the interrelations of fish schools. J. Comp. Physiol. A Neuroethol. 1981, 144, 313–325. [Google Scholar] [CrossRef]
  49. Parrish, J.K.; Viscido, S.V.; Grünbaum, D. Self-organized fish schools: An examination of emergent properties. Biol. Bull. 2002, 202, 296–305. [Google Scholar] [CrossRef] [PubMed]
  50. Mamei, M.; Menezes, R.; Tolksdorf, R.; Zambonelli, F. Case studies for self-organization in computer science. J. Syst. Archit. 2006, 52, 443–460. [Google Scholar] [CrossRef]
  51. Couzin, I.D.; Krause, J. Self-organization and collective behavior in vertebrates. Adv. Study Behav. 2003, 32, 10–1016. [Google Scholar] [CrossRef]
  52. Gautrais, J.; Jost, C.; Theraulaz, G. Key behavioural factors in a self-organised fish school model. Ann. Zool. Fenn. 2008, 45, 415–428. [Google Scholar] [CrossRef]
  53. Chen, Y.; Luo, Q. Study on the reproductive ecology biology of Sichuan cleft fish V: Reproductive groups and reproductive habits. J. Bijie Teach. Coll. 1997, 1, 1–5. [Google Scholar]
  54. Yan, W.; Zhu, T.; Wu, X.; Yang, D.; Chen, L. An observation of spawning behavior of Schizothorax wangchiachii. Freshw. Fish. 2017, 47, 9–15. [Google Scholar] [CrossRef]
  55. Ma, B.S.; Xie, C.X.; Huo, B.; Yang, X.F. Research progress on the biology of Schizothoracinae fishes. Jiangxi Fish. Sci. Technol. 2011, 128, 36–40. [Google Scholar]
  56. Zhou, X.J.; Xie, C.X.; Huo, B.; Duan, Y.J.; Yang, X. Reproductive biology of Schizothorax waltoni (Cyprinidae: Schizothoracinae) in the Yarlung Zangbo River in Tibet, China. Environ. Biol. Fishes 2015, 98, 597–609. [Google Scholar] [CrossRef]
  57. State Intellectual Property Office of China. Artificial Breeding Method for Schizothorax. China Patent Gazette CN1561704A, 2005. Granted on 1 July 2009. [Google Scholar]
  58. Reebs, S.G. Plasticity of diel and circadian activity rhythms in fishes. Rev. Fish Biol. Fish. 2002, 12, 349–371. [Google Scholar] [CrossRef]
  59. Pitcher, T.J.; Parrish, J.K. Functions of shoaling behaviour in teleosts. In The Behaviour of Teleost Fishes, 2nd ed.; Pitcher, T.J., Ed.; Chapman & Hall: London, UK, 1993; pp. 363–439. [Google Scholar]
  60. Boujard, T.; Leatherland, J.F. Circadian rhythms and feeding time in fishes. Environ. Biol. Fishes 1992, 35, 109–131. [Google Scholar] [CrossRef]
  61. Liu, Z.Q.; Li, S.C.; Li, D.J. Ecology and Biology of Fishes on the Qinghai-Tibet Plateau; China Agriculture Press: Beijing, China, 2008. [Google Scholar]
  62. Jobling, M. Environmental Biology of Fishes; Chapman & Hall: London, UK, 1995. [Google Scholar]
  63. Blaxter, J.H.S. The effect of temperature on larval fishes. Neth. J. Zool. 1991, 42, 336–357. [Google Scholar] [CrossRef]
  64. Zheng, Q.Y. Diel Activity Rhythms and Activity Intensity of Three Endemic Sinocyclocheilus Species in China. Master’s Thesis, University of Chinese Academy of Sciences, Beijing, China, 2017. [Google Scholar]
  65. Krause, J.; Ruxton, G.D. Living in Groups; Oxford University Press: Oxford, UK, 2002. [Google Scholar]
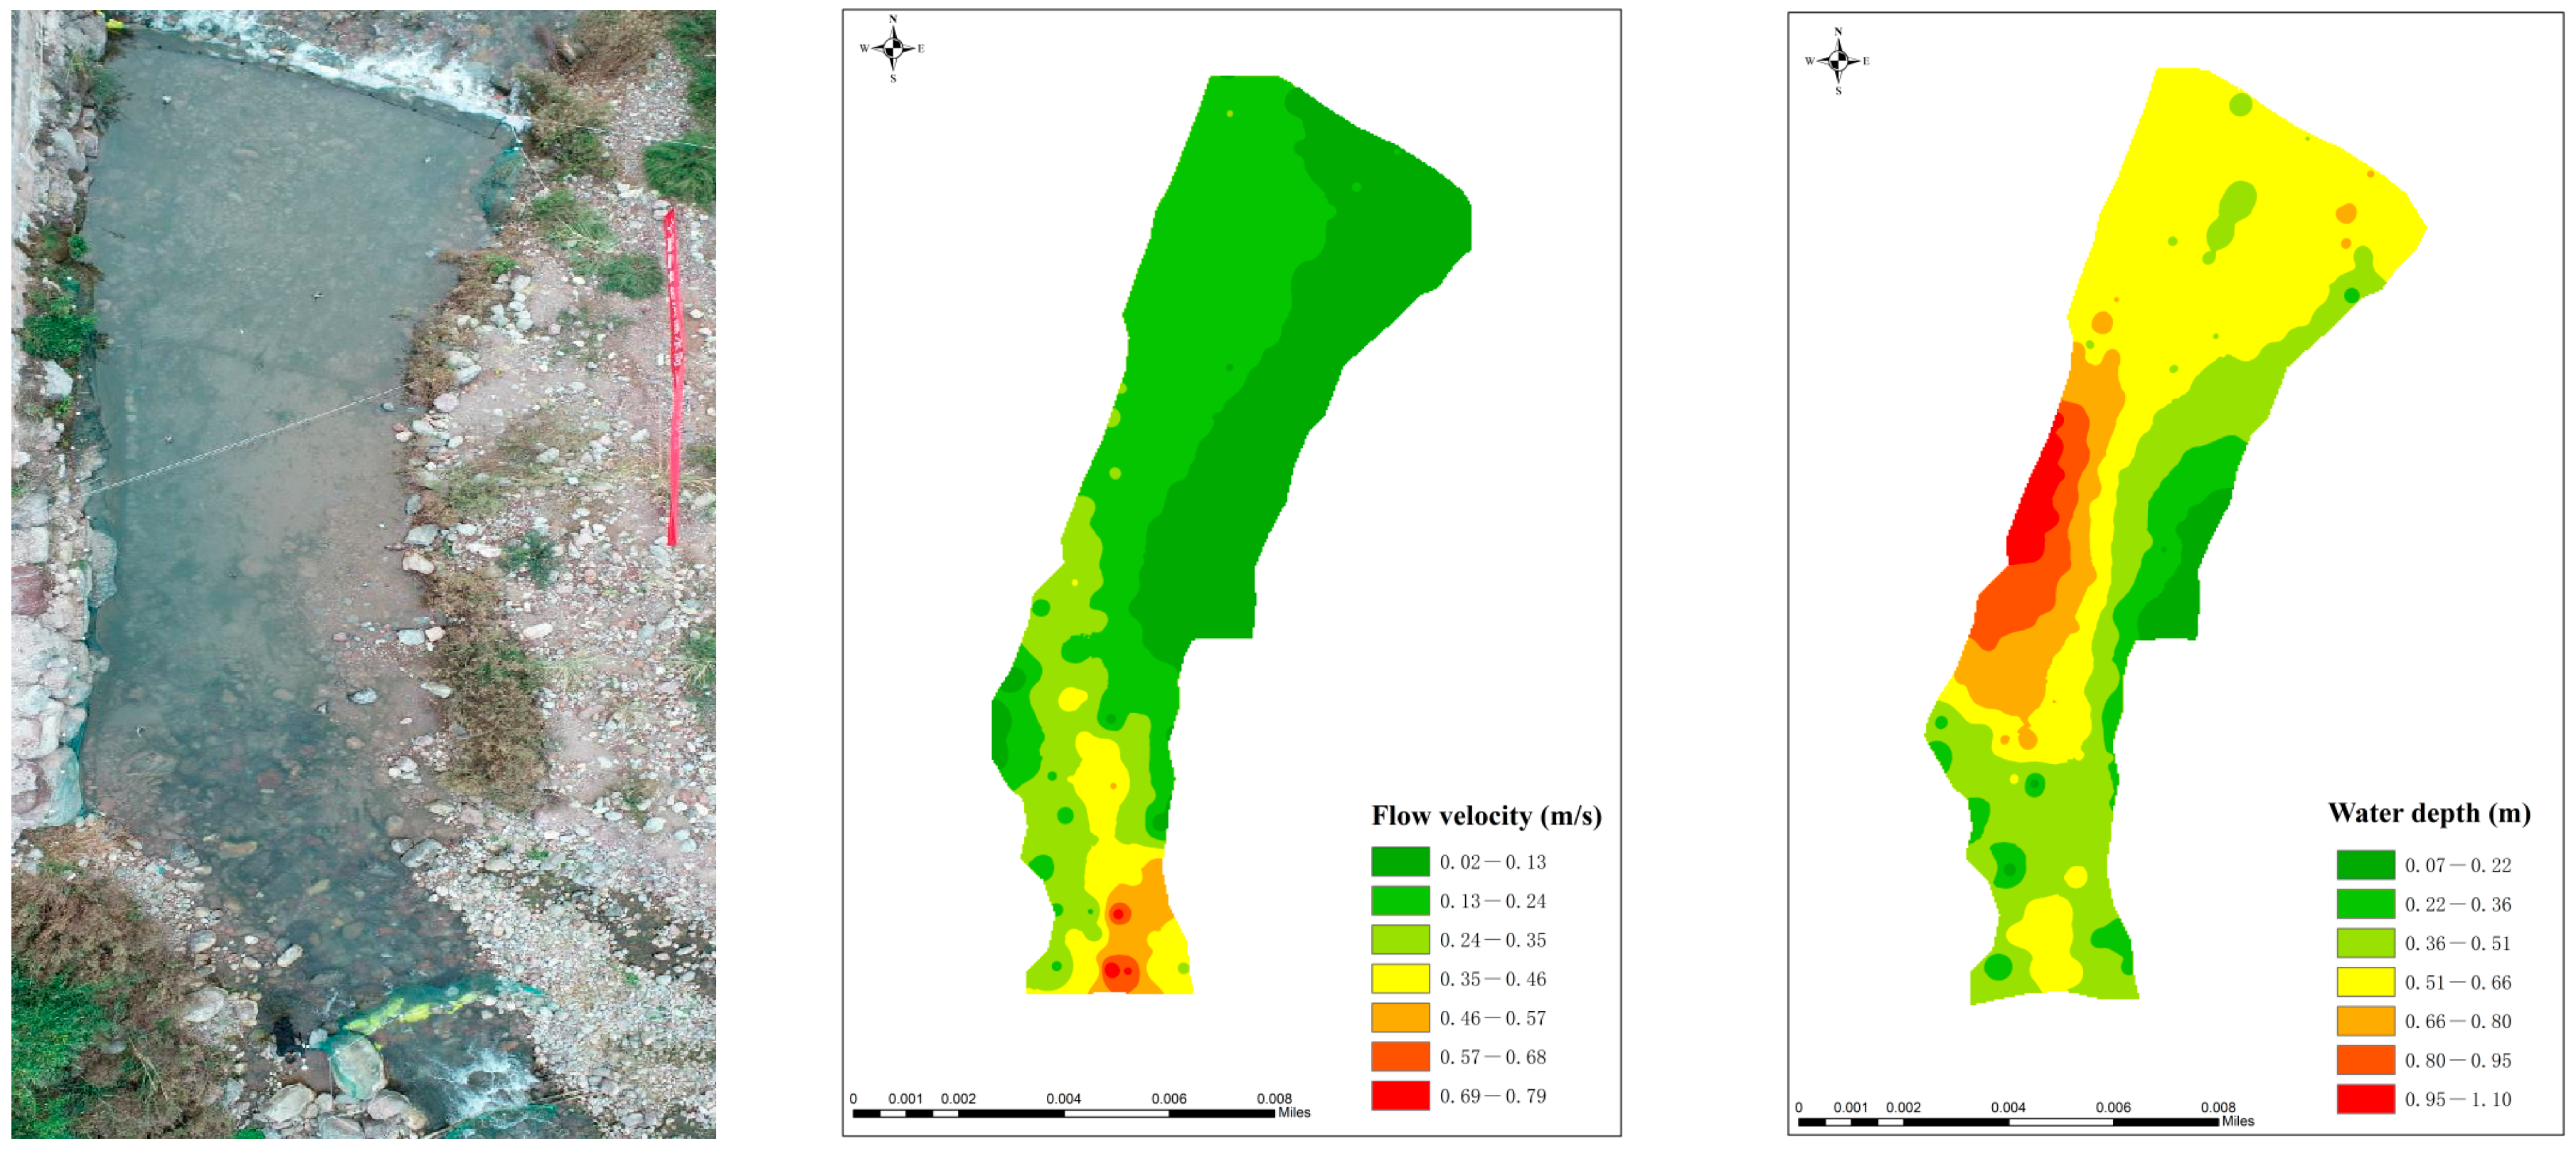
Figure 1. Overview and hydrodynamic characteristics of the experimental river section. From left to right: general layout of the experimental site, including the positions of blocking nets, acoustic receivers, and underwater monitoring systems; flow velocity distribution; and water depth distribution.
Fishes 10 00362 g001
Figure 2. Distribution of substrates in the experimental river section.
Fishes 10 00362 g002
Figure 3. Natural reproductive behavior of S. wangchiachii.
Fishes 10 00362 g003
Figure 4. Hierarchical clustering of acoustic-tagged fish’s trajectories during 23–27 January 2024: Steel blue and chocolate yellow indicate two distinct subgroups. Green lines represent individuals No. 3, 4, and 7, with the female fish (No. 7) maintaining minimal spatial distance from two males (No. 3 and 4) during the pre-spawning period (24–26 January). Red lines denote individuals No. 2, 5, 8, and 9, which formed a stable secondary subgroup between 24 and 25 January.
Fishes 10 00362 g004aFishes 10 00362 g004b
Figure 5. Identification of fish schooling aggregation and dispersion behavior.
Fishes 10 00362 g005
Figure 6. Hourly variations in the proportion of active time for female and male fish.
Fishes 10 00362 g006
Table 1. Basic characteristics of tagged S. wangchiachii.
No.Tagging NumberTotal Length (mm)Body Length (mm)Body Weight (g)Gender
17003.27420350750Male ♂
27059.235004201100Male ♂
37101.204903951000Male ♂
47143.17450380750Male ♂
57171.01440370750Male ♂
67185.025004101150Male ♂
77199.034703801250Female ♀
87269.084803801000Female ♀
97339.14480410950Female ♀
107353.154984201150Female ♀
Disclaimer/Publisher’s Note: The statements, opinions and data contained in all publications are solely those of the individual author(s) and contributor(s) and not of MDPI and/or the editor(s). MDPI and/or the editor(s) disclaim responsibility for any injury to people or property resulting from any ideas, methods, instructions or products referred to in the content.