Article

A Long-Term Overview of Elasmobranch Fisheries in an Oceanic Archipelago: A Case Study of the Madeira Archipelago †

1
Direção de Serviços de Monitorização, Estudos e Investigação do Mar, Direção Regional de Pescas (DSEIMar/DRP), Lota do Funchal Piso 1º, Rua Virgílio Teixeira, 9004-562 Funchal, Portugal
2
Observatório Oceânico da Madeira, Agência Regional para o Desenvolvimento da Investigação Tecnologia e Inovação (OOM/ARDITI)—Edifício Madeira Tecnopolo, 9020-105 Funchal, Portugal
3
MARE—Marine and Environmental Sciences Centre/ARNET—Aquatic Research Network, Agência Regional Para o Desenvolvimento da Investigação Tecnologia e Inovação (ARDITI), Edifício Madeira Tecnopolo Piso 0, Caminho da Penteada, 9020-105 Funchal, Portugal
4
Independent Researcher, 9004-562 Funchal, Portugal
*
Author to whom correspondence should be addressed.
This work is part of the Doctoral dissertation of the first author, Mafalda Freitas. Doctor at Universidade da Madeira, 9020-105 Funchal, Portugal.
Fishes 2025, 10(7), 358; https://doi.org/10.3390/fishes10070358
Submission received: 17 June 2025 / Revised: 9 July 2025 / Accepted: 17 July 2025 / Published: 19 July 2025
(This article belongs to the Special Issue Biology and Conservation of Elasmobranchs)

Abstract

Elasmobranch species are considered a global conservation priority due to their susceptibility to fishing pressure. In the Madeira Archipelago, Northeastern Atlantic, most elasmobranch species are caught as bycatch in artisanal drifting longline fishery targeting scabbardfishes. All commercial elasmobranch landings carried out in this archipelago over three decades (1990–2020) were analysed, aiming to provide a reliable overview of Madeira’s elasmobranch fisheries and their evolution. A total of 2316 tonnes of elasmobranchs were landed during the study period, corresponding to approximately EUR 2.1 million in first-sale value. The most representative period occurred from 2003 to 2013, corresponding to 75.21% of the total elasmobranch landings. A general pattern of supply and demand was evident, with mean price values typically showing an inverse trend to landed tonnage. At the species level, Centrophorus squamosus appears as the dominant species, representing about 89% of the total elasmobranch species landed, followed by Prionace glauca, with approximately 3%. The high dominance of C. squamosus in the scabbardfish fishery raises significant ecological and management concerns, as this deep-water shark species is known for its vulnerability to overexploitation. Management measures currently in place need to be updated and ought to be based on studies on the type and size of hooks for each fishery, to ultimately infer about species-specific survival rates, as well as the fishing gears’ soak time. Moreover, studies on the enhancement of food supply through fisheries discards are still missing, even though it is highly likely that this input may alter the dynamics of marine food webs.
Key Contribution: This study provides unprecedented insight into three decades of elasmobranch landings in the Madeira Archipelago, highlighting the vulnerability of deep-water shark species to bycatch and the urgent need for improved, data-driven conservation measures.

1. Introduction

Overfishing is currently the most significant global threat to elasmobranchs [1,2]. Most elasmobranch fisheries are incidental, yet they vary widely in target species, gear types, and vessel operations. This heterogeneity complicates stock assessments and critically effective management. Therefore, compiling data at national and regional levels is essential to evaluate the status of elasmobranch populations worldwide [3].
In oceanic archipelagos, fisheries play a vital role for coastal communities, serving as a crucial source of both food security and employment [4]. Madeira, a volcanic Portuguese archipelago in the Northeast Atlantic [5], exemplifies these challenges. Its narrow insular shelves and steep slopes, with depths exceeding 1800 m just five nautical miles offshore, severely constrain fishing activities [6]. Furthermore, the region’s oligotrophic waters [7] support limited fish biomass, concentrated primarily in the neritic zone [5]. Even so, due to isolation from the mainland, fish and other marine products have always played a major role in the diet of archipelago inhabitants.
Fishing has been an integral part of Madeira’s coastal communities since the archipelago’s discovery in the 15th century, maintaining significant economic importance to this day [8]. Over the past thirty years, annual landings of all types of fisheries averaged 7000 tonnes, with a first-sale value of EUR 12 million (Figure 1). However, landings have shown a steady decline since 1995. In 2020, annual landings represented 4000 tonnes, generating approximately EUR 11 million in auction value (DRP, 2020).
The Madeiran fishing fleet remains predominantly artisanal due to its small scale and use of traditional fishing methods. The active commercial fishing fleet decreased gradually in number of vessels from the 1990s onwards. Of the 86 fishing vessels operating in 2020, 71% measured under 12 m, while just 5% exceeded 24 m (DRP, 2020). These small-scale fisheries are dominated by mid-water drifting longlines targeting black and intermediate scabbard fishes, and by the pole and line vessels that target tuna. Together, these account for approximately 89% of the total exploited marine resources landed in the archipelago in 2020. The remaining 11% resulted from all the other fishing methods targeting small pelagics (6%), shellfish (3%), and demersal species (2%).
Elasmobranchs’ high susceptibility to overexploitation remains a critical conservation priority worldwide [1,3,9]. Their resilience to fishing pressure will always be subject to their life history characteristics. Deep-water sharks are characterised by slow growth, late maturation, high longevity, and low fecundity [10,11]. These features make populations less productive and more vulnerable to harvesting. In order to guarantee a sustainable exploitation, management plans should be based on robust scientific knowledge.
In the archipelagos of the Azores, Madeira, and the Canaries, elasmobranch fisheries are regulated under the European amendments to the Western Waters Regulation (EC 1954/2003) [12], which reduces the Exclusive Economic Zone (EEZ) from 200 nautical miles (nm) to 50 or 100 nm for all fisheries. However, these restrictions apply solely to vessels registered in island ports, exempting EU Community vessels with historical fishing rights in these waters.
In the Madeira Archipelago, most elasmobranchs are captured as bycatch in horizontal mid-water drifting longline fisheries, targeting black and intermediate scabbardfish (Aphanopus spp.), operated offshore primarily at depths of 800–1300 m [13]. Unlike the surface drifting longline, which is set to drift in the ocean’s epipelagic layer, the mid-water drifting longline operates strictly within the deep layer of the water column. Both fishing gears are never anchored and are always well above the seafloor [14]. In contrast, bottom longlines, stone-buoy-slim horizontal configurations, are deployed near the seafloor, closer to shore, at depths of 50–250 m.
Deep-water sharks hold cultural and gastronomic significance in Madeira. Species such as the leafscale gulper shark, gulper shark, kitefin shark, and dogfish are prized locally and commercially exploited for human consumption and squalene extraction. Since 2021, however, Council Regulation (EU) 2021/91 [15] has prohibited deep-water shark landings, restricting regional catches to demersal and pelagic elasmobranchs. This measure has been effective in the sense that no legal landings of deep-water sharks have been recorded in Portugal since its implementation, indicating a high level of compliance by the fishing sector.
Apart from bycatch data, information on elasmobranch species occurring around the island is scarcely available [16,17,18]. Recent years have seen growing research interest in their biology and population dynamics. Of the 67 chondrichthyan species recorded in the archipelago [18], eight are classified as Vulnerable, nine as Endangered, and seven as Critically Endangered on the IUCN European Red List of Marine Fishes [19]. This knowledge gap underscores the need for the present study, which provides a preliminary assessment of long-term elasmobranch exploitation in the region.
This work aims to provide an overview of Madeira’s elasmobranch fisheries in the NE Atlantic Ocean area and their evolution between 1990 and 2020. This characterisation will be achieved by (i) estimating the annual landings and auction values; (ii) identifying the main elasmobranch species landed; (iii) characterising the elasmobranch fishing fleet; and (iv) determining temporal trends from the elasmobranch landings. By quantifying fishing pressure and identifying vulnerable species, the results will support conservation priorities and fisheries management. The data will enable evidence-based policy updates, including species-specific catch limits, gear adaptations to reduce bycatch, and seasonal/spatial restrictions where needed.

2. Materials and Methods

All commercial elasmobranch landings carried out in the ports of the archipelago of Madeira between 1990 and 2020 were considered for this study. The data was obtained from the local authorities (Direção Regional das Pescas—DRP, Funchal, Portugal) in the auction houses (Figure 2). Landed weights (tonnes) and first-sale values (euros) were gathered and analysed. All the landing data from the ports include species-specific information from 1990 to 2020.
Species landings, mean yearly price per kilogram (PPK), and catches per unit of effort—CPUE (tonnes per fishing trip)—were analysed by fishing gear, considering two main categories: mid-water drifting longlines (DLLs) and a combined group comprising bottom longlines, pelagic longlines, and handlines (BLLs/PLLs/HLs). The fused classification of BLL/PLL and HL fishing gears was adopted because the vessels use multi-purpose fishing gears with joint landings.
Annual and monthly species landings trends were further investigated, and the mean yearly PPK per species was estimated, to verify changes in demand. Additionally, landings by vessel size according to species and year were also evaluated considering four categories: (i) VL0012—vessel length inferior to 12 m; (ii) VL1218—vessel length between 12 and 17.99 m; (iii) VL1824—vessel length between 18 and 23.99 m; and (iv) VL2440—vessel length between 24 and 39.99 m.
The data’s normal distribution was verified through the Anderson–Darling normality test for sample sizes bigger than five thousand observations, and homogeneity of variance was determined using Levene’s statistics. The Kruskal–Wallis nonparametric test was performed to compare the mean weight, selling price, and CPUE between years, months, and vessel size [20]. Dunns’s test with the Bonferroni correction was conducted as a post hoc test when significant differences were observed [20]. Differences at a p-value < 0.05 level were accepted as significant. All statistical analysis was performed using R Statistical Software (version 1.4.1006; R Foundation for Statistical Computing, Vienna, Austria).

3. Results

A total of 2316 tonnes of elasmobranchs were landed in the archipelago of Madeira between 1990 and 2020. This corresponded to approximately EUR 2.1 million in first-sale value. These landings accounted for 2% of total fisheries landings in the Madeira Archipelago between 1990 and 2020. Annual elasmobranch landings remained below 55 tonnes from 1990 to 2002, peaking at 283 tonnes in 2008. Since 2010, landings have been decreasing and remained below 12 tonnes in 2020, reflecting EU restrictions for the exploitation of deep-water sharks (Figure 3). Overall, the CPUE followed the same trend as the landings, whereas the mean price showed the opposite tendency during the same time periods.
Most elasmobranch species sold at the market were incidentally caught using DLLs (97.02%), and only 2.98% were accidentally harvested by BLLs/PLLs/HLs. An analysis of gear-specific landings (Figure 4) revealed Centrophorus squamosus (Bonnaterre, 1788) as the predominant species in DLL landings, accounting for approximately 91% of total landings (Figure 4a). The remaining 9% comprised Prionace glauca (Linnaeus, 1758), Dalatias licha (Bonnaterre, 1788), Isurus oxyrinchus Rafinesque, 1810, Centrophorus granulosus (Bloch and Schneider, 1801), Centroscymnus spp., and Deania spp.
For BLL/PLL/HL landings, Galeorhinus galeus (Linnaeus, 1758) emerged as the most frequently landed species (68%), followed by Raja spp. (12%), with Sphyrna zygaena (Linnaeus, 1758) and Mustelus mustelus (Linnaeus, 1758) collectively representing 10% of landings (Figure 4b).
The annual analysis showed significant statistical differences between the landings performed by DLL and BLL/PLL/HL fisheries (Kruskal–Wallis test with Dunn’s post hoc, p < 0.05), reflecting significant annual differences in species composition within both fishing gears (Kruskal–Wallis test with Dunn’s post hoc, p < 0.05). Similarly, the annual mean price also presented significant differences for DLLs and BLLs/PLLs/HLs (Kruskal–Wallis test followed by Dunn’s, p < 0.05), showing significant annual differences in species composition within both fishing gears (Kruskal–Wallis test with Dunn’s post hoc, p < 0.05).

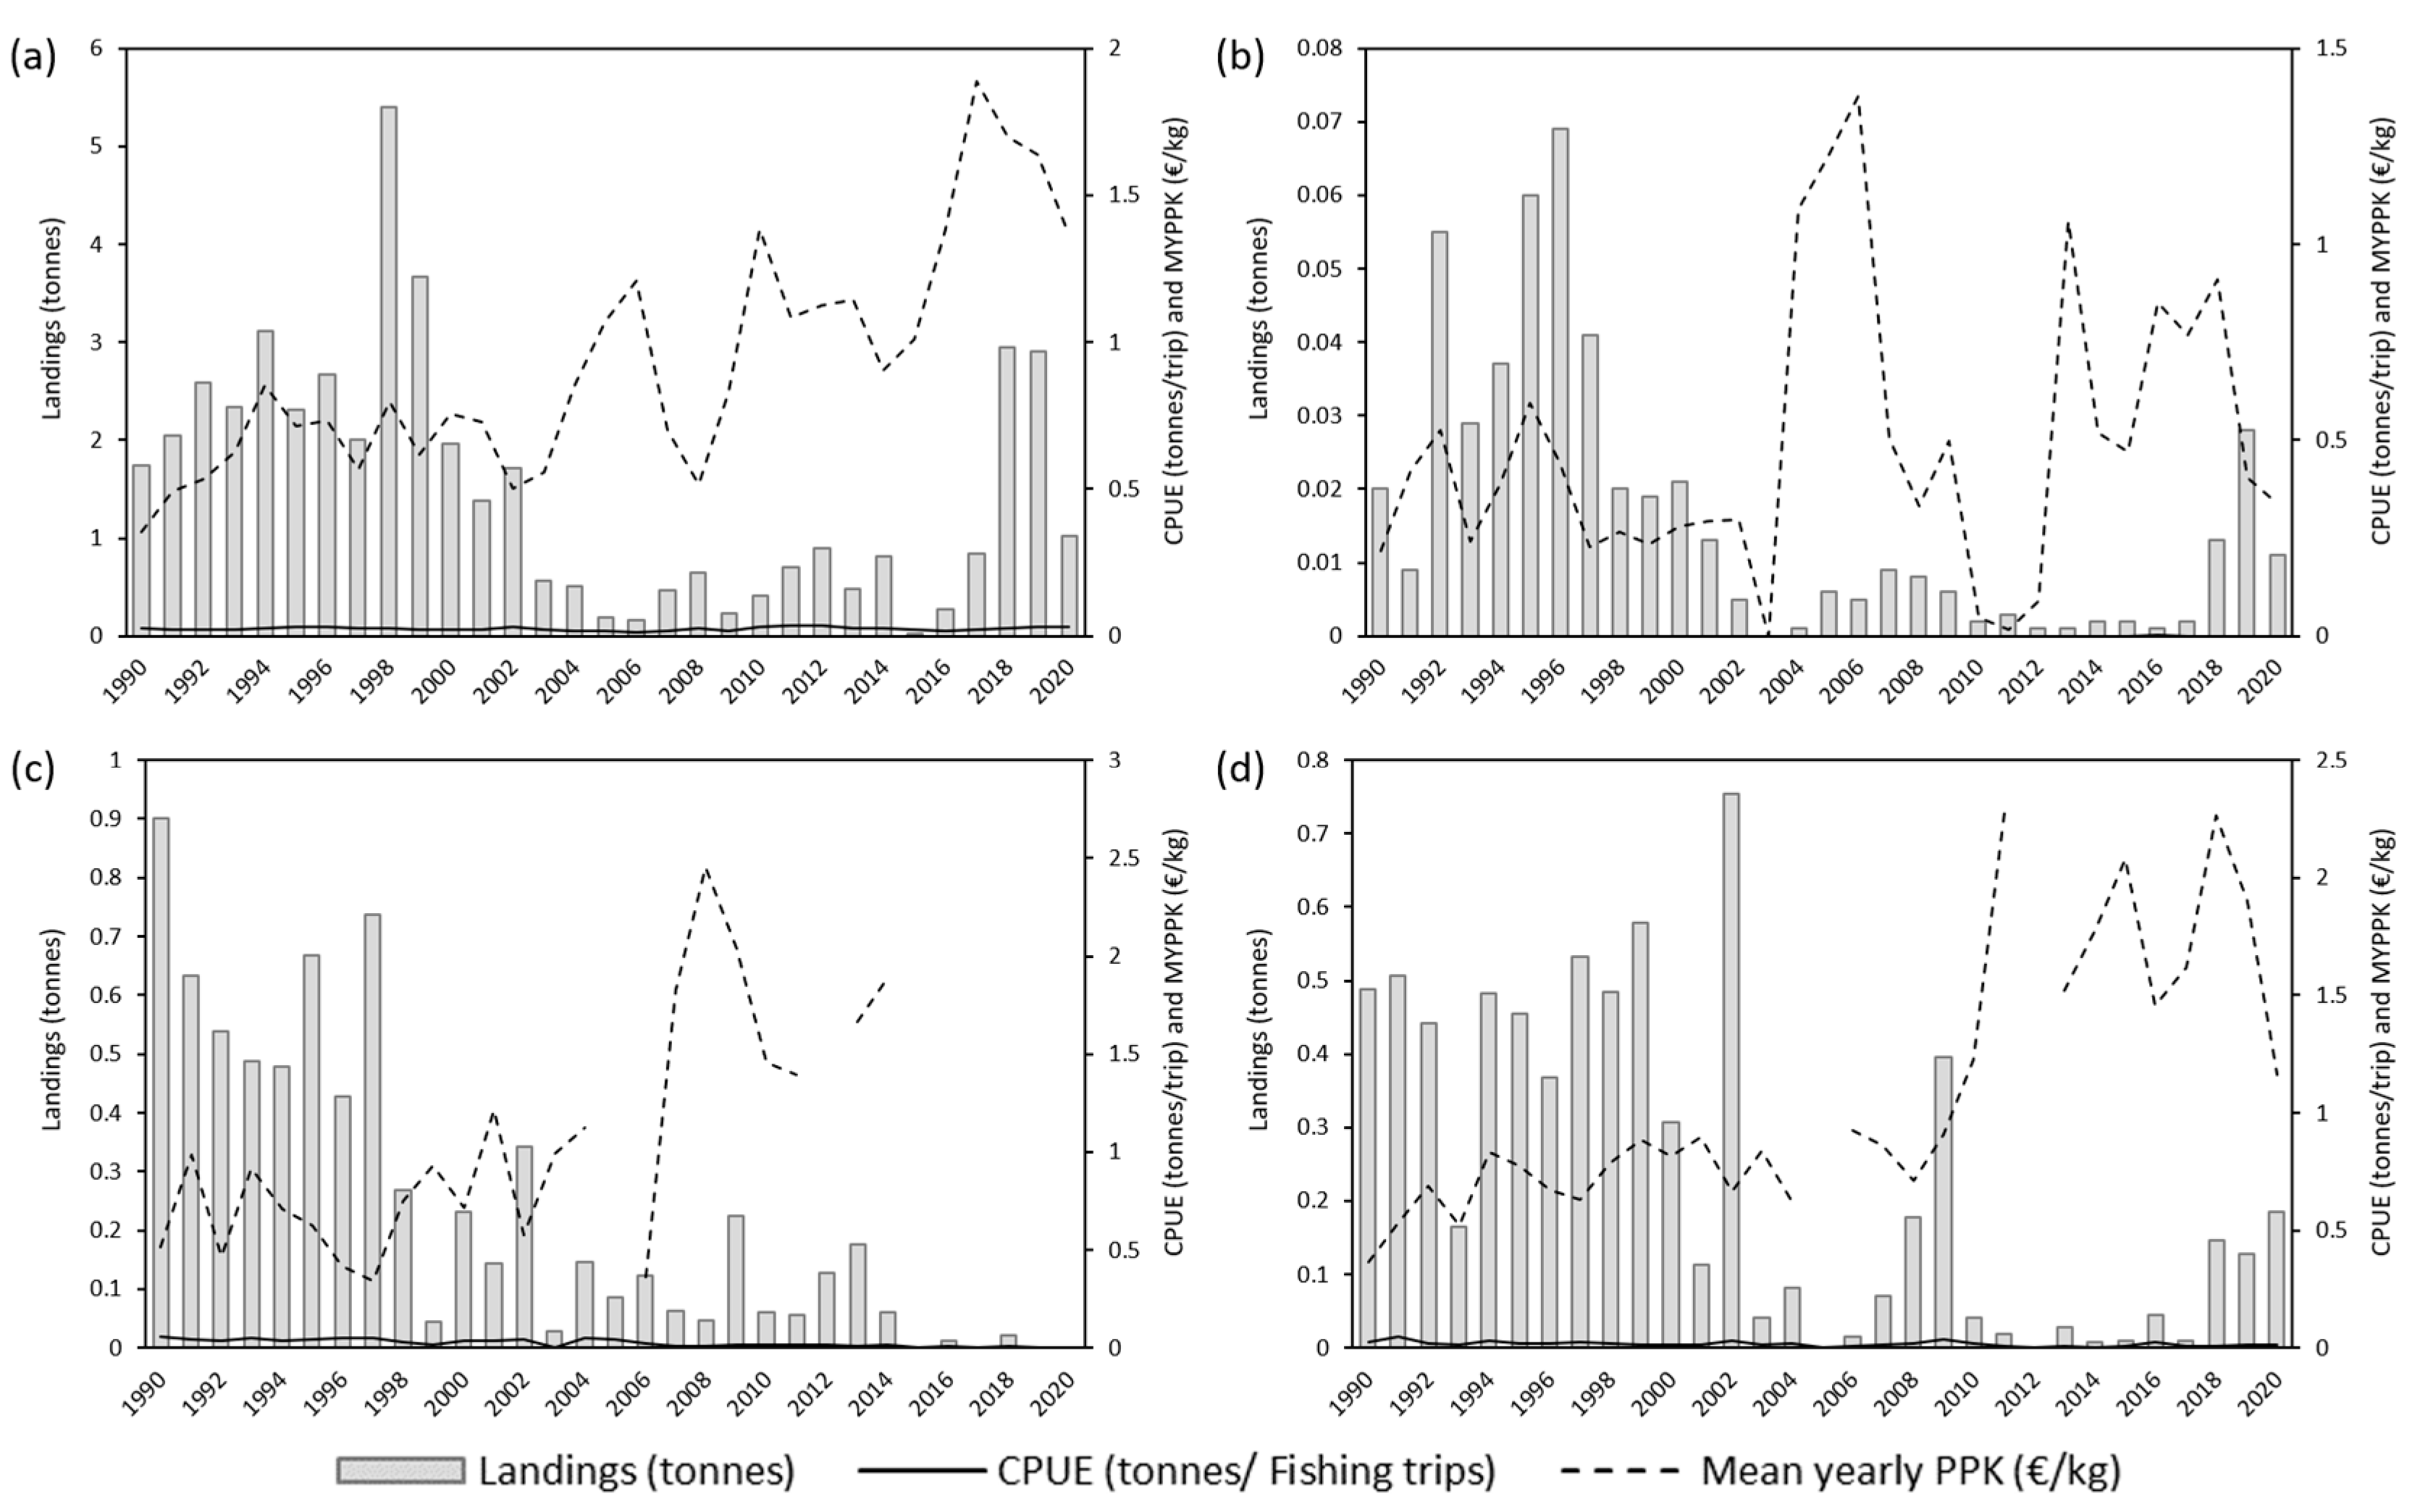
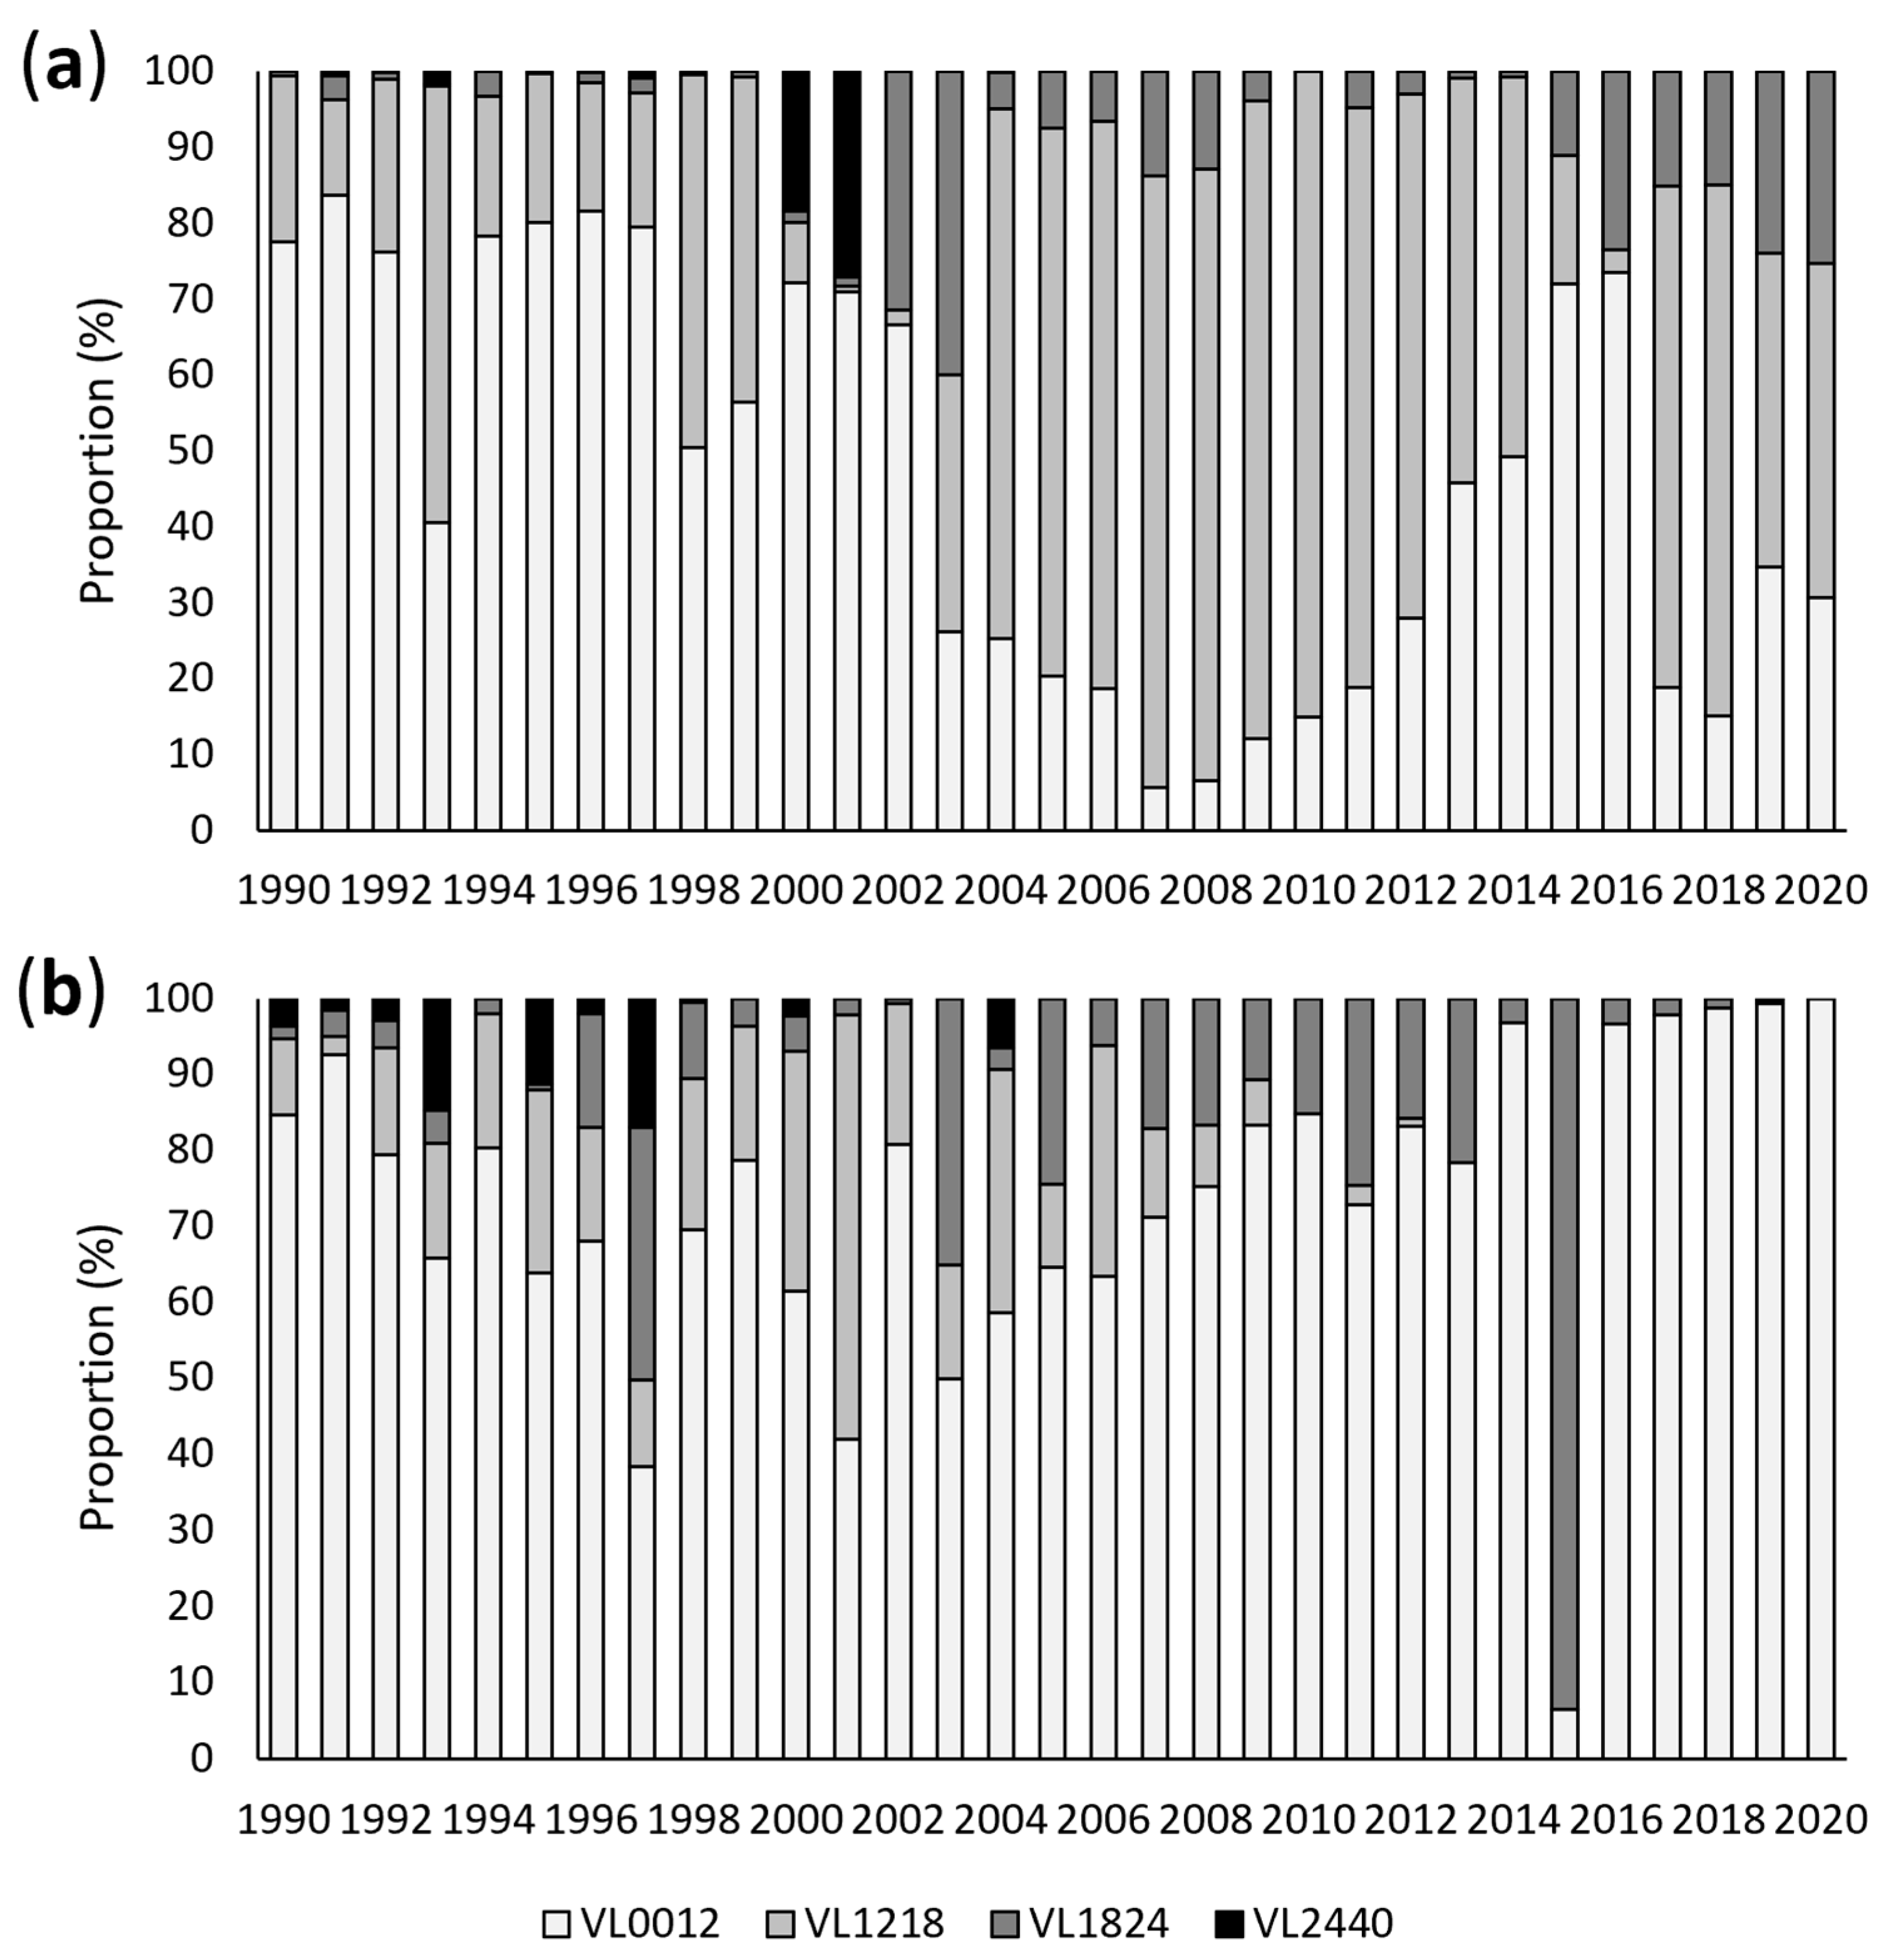
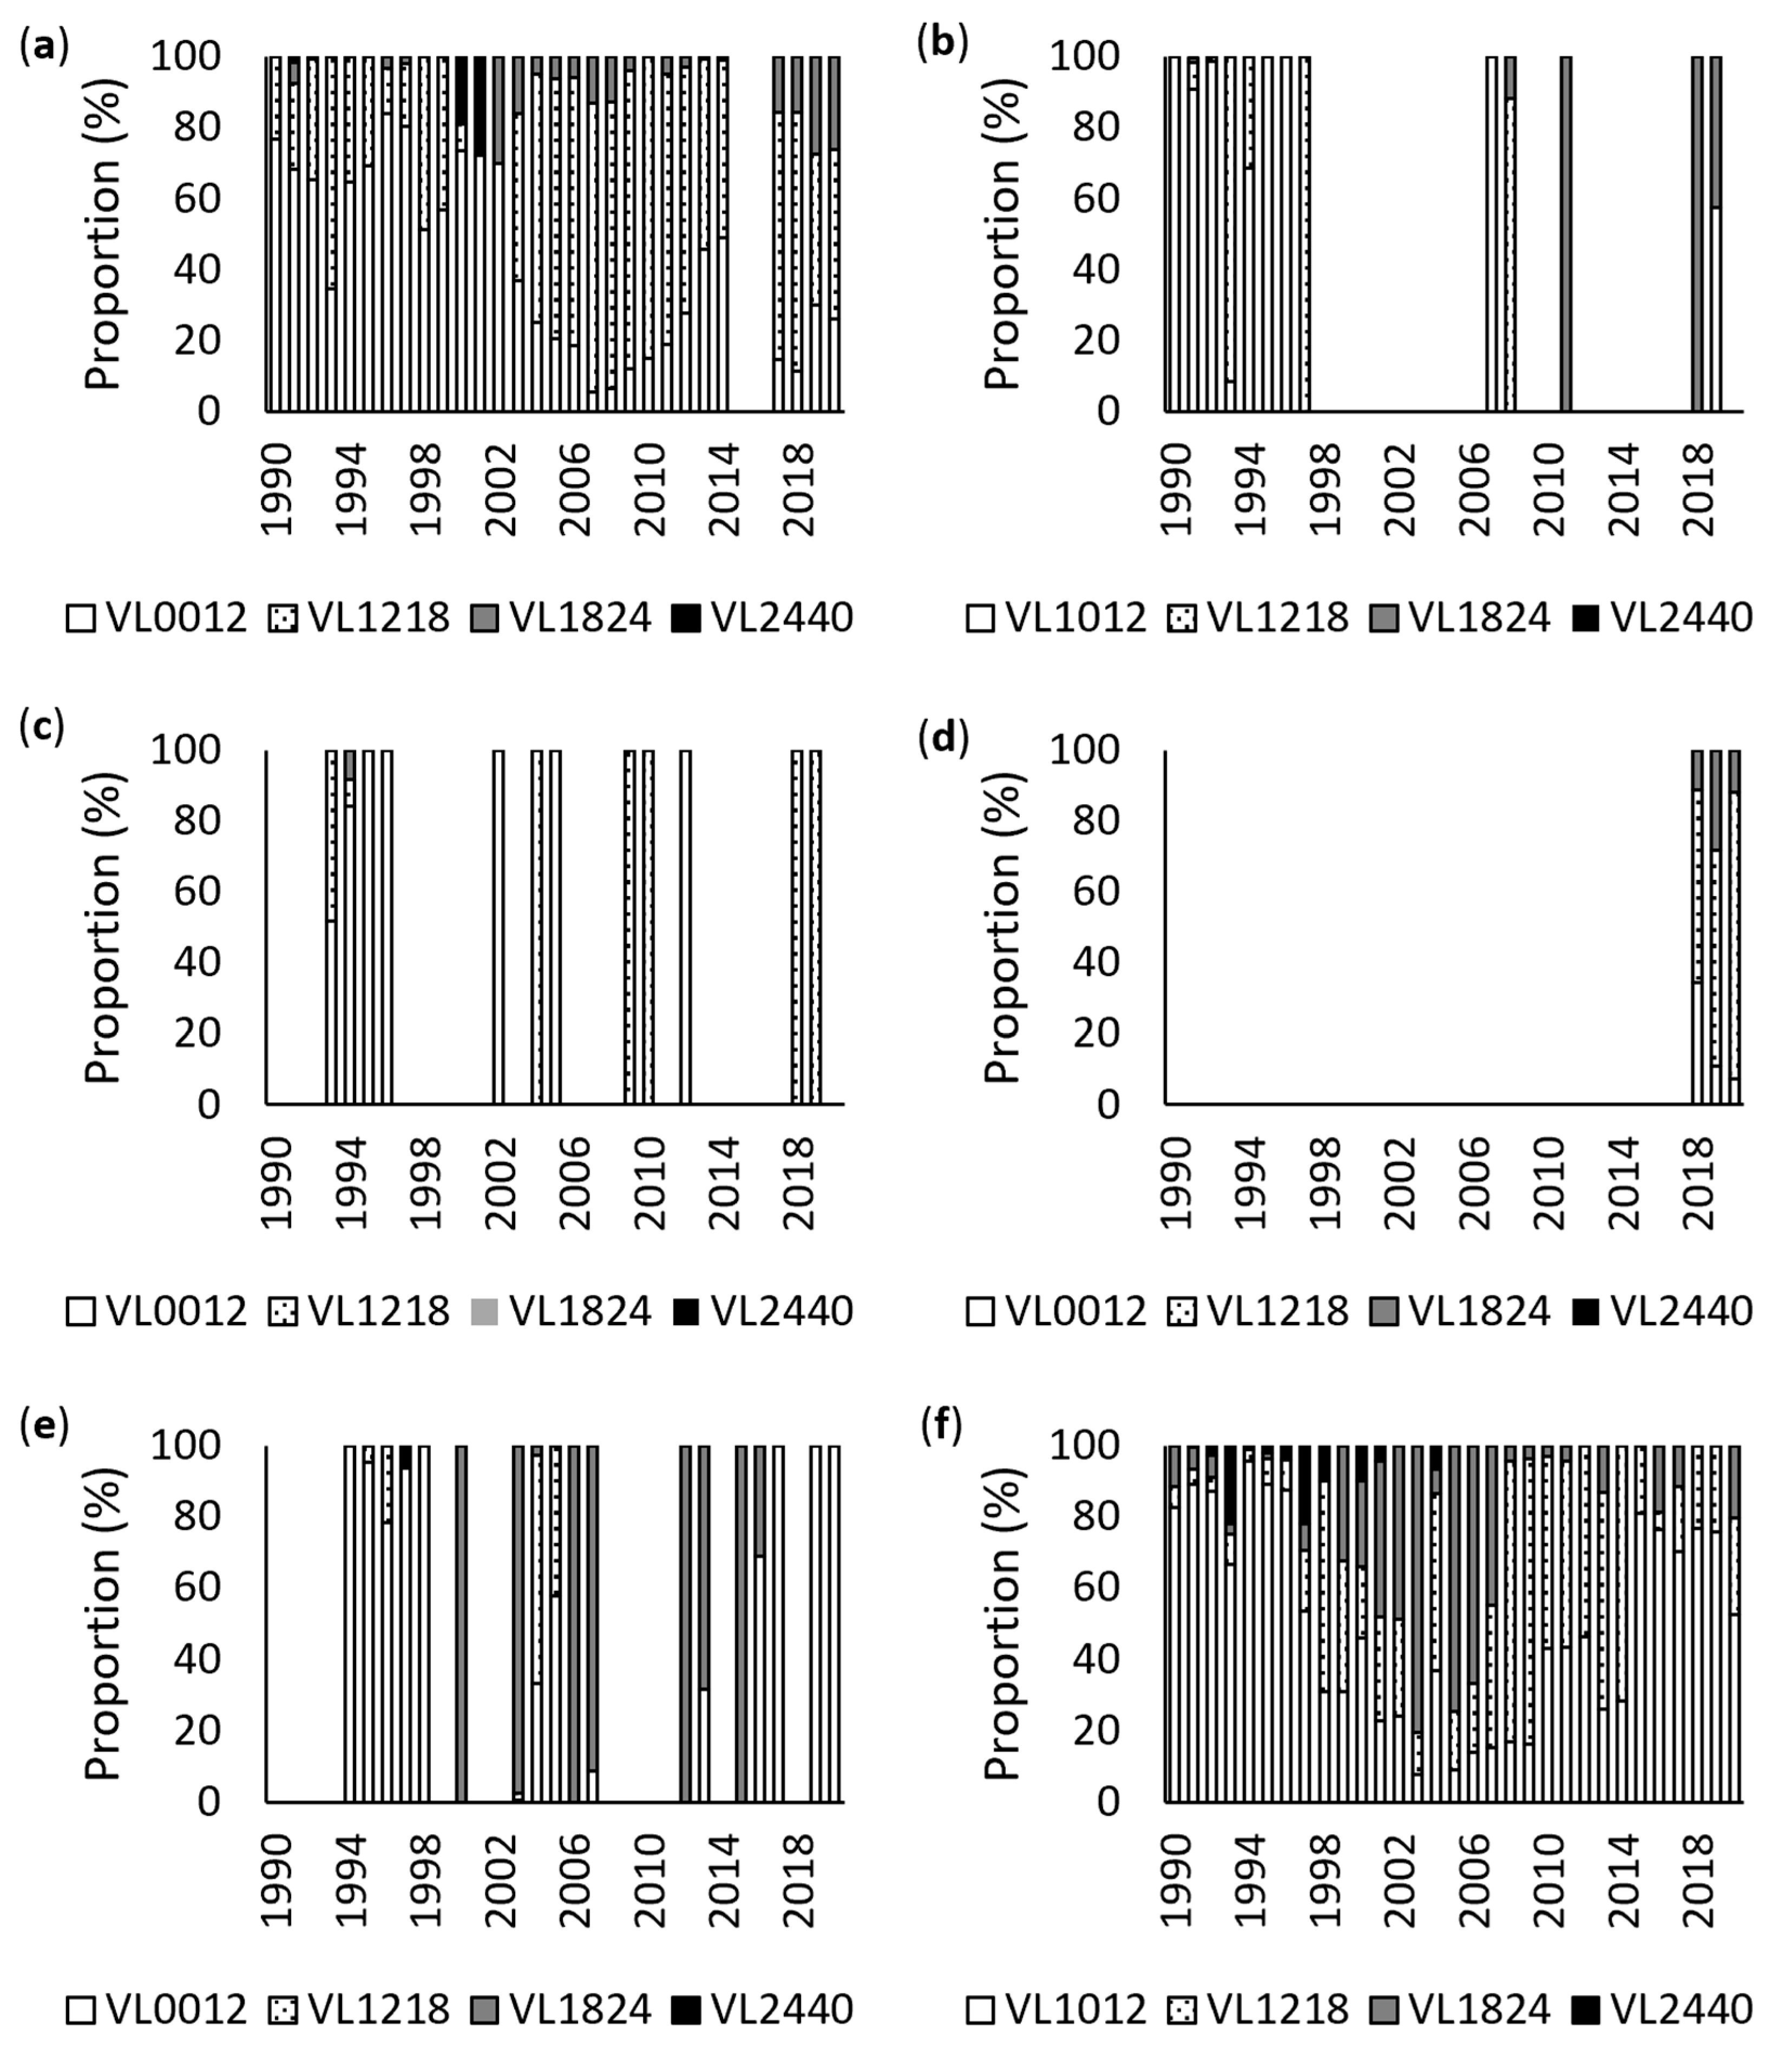
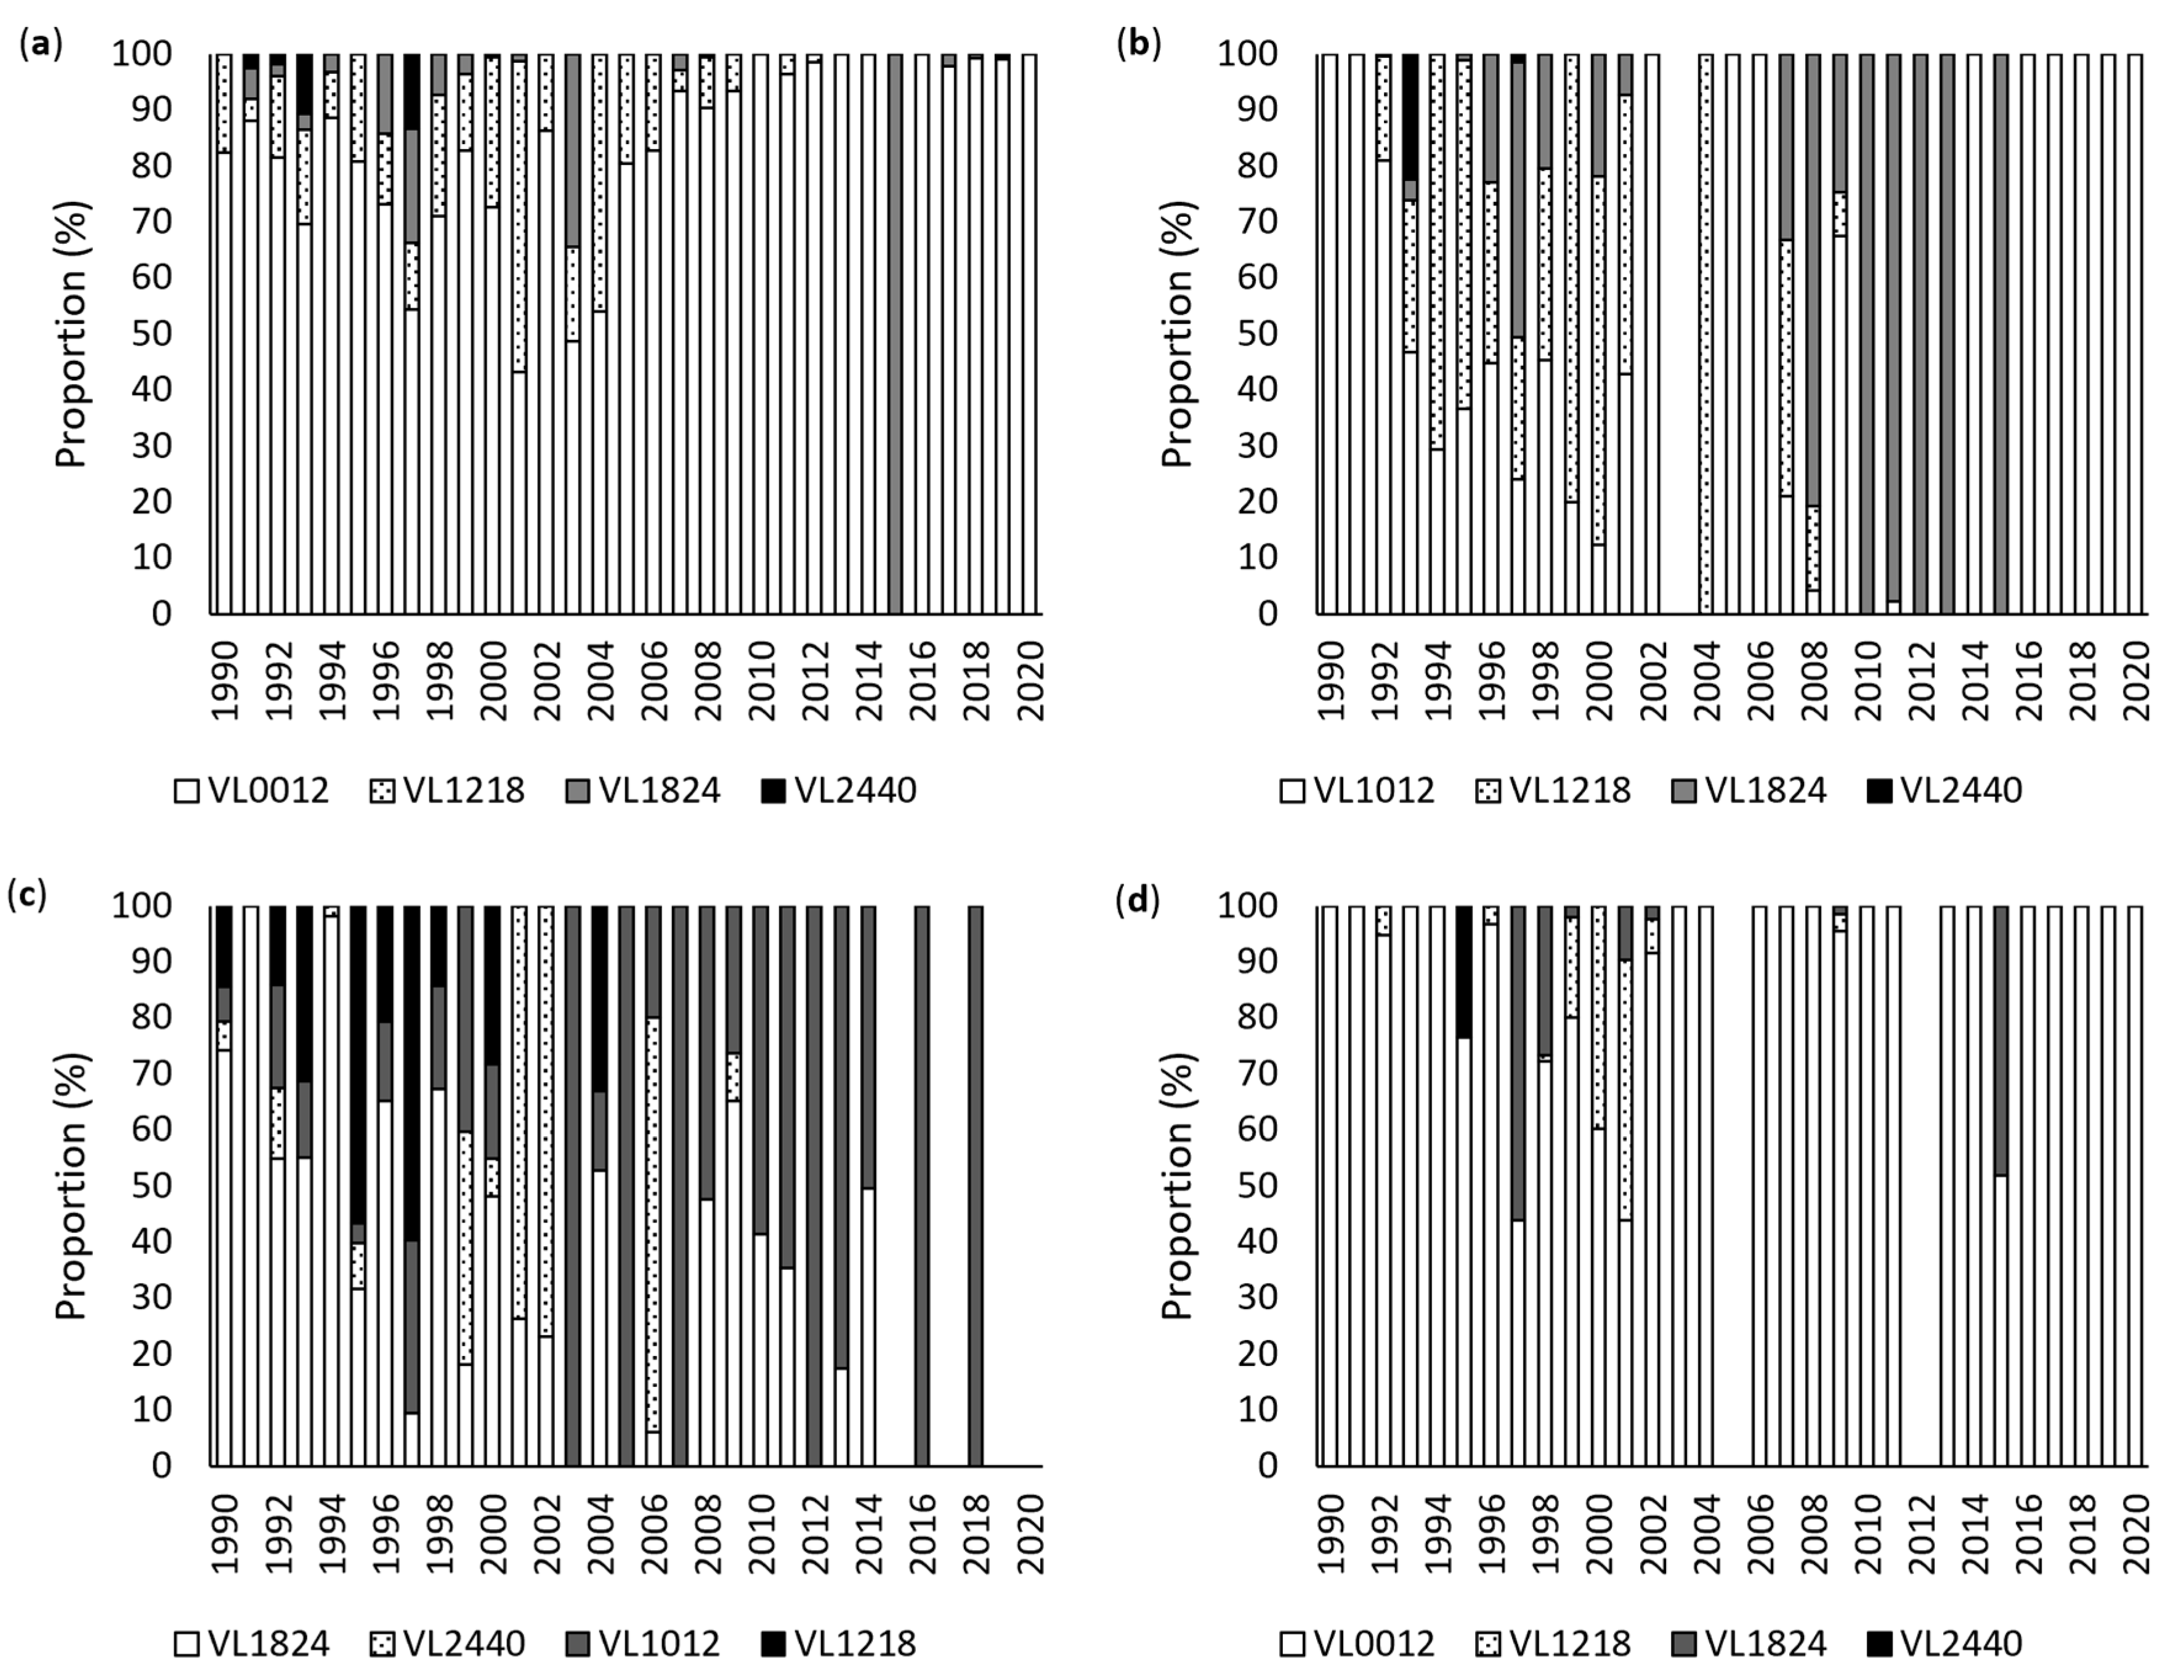
3.1. Annual Analysis

Annual elasmobranch landings from DLL fisheries remained consistently below 50 tonnes between 1990 and 2002. A subsequent increase culminated in the maximum landings of 282 tonnes in 2008, followed by a progressive decline to 56 tonnes by 2014. Post-2015, catch volumes aligned with European Union total allowable catches (TACs) for deep-water shark species, resulting in markedly reduced annual landings. This reduction correlated with a significant increase in PPK, particularly evident between 2015 and 2019, where mean annual PPK rose from EUR 1.55 to EUR 2.93, potentially reflecting heightened market demand (Figure 5a; Table S1—Supplementary Materials). Statistical analysis confirmed significant temporal variations in landing quantities (Kruskal–Wallis test with Dunn’s post hoc, p < 0.05) and PPK values (Kruskal–Wallis test with Dunn’s post hoc, p < 0.05).
For BLL/PLL/HL fisheries, annual elasmobranch landings increased from four tonnes (1990) to a peak of seven tonnes (1998), before declining to less than four tonnes post-2000. This gear category exhibited a parallel trend of decreasing landings accompanied by rising PPK, with mean annual values increasing from EUR 0.38 (1990) to EUR 1.84 (2017) (Figure 5b). Statistical analysis similarly revealed significant interannual differences in both landing volumes (Kruskal–Wallis test with Dunn’s post hoc, p < 0.05) and PPK (Kruskal–Wallis test with Dunn’s post hoc, p < 0.05). The CPUE showed a similar tendency to the landings throughout the study period for both fishing gears.
In the first half of the 1990s, elasmobranch landings from DLLs were predominantly composed of C. squamosus, D. licha, Centroscymnus spp., P. glauca, and I. oxyrinchus. The total C. squamosus landings in the Madeira Archipelago (1990 to 2020) amounted to 2055 tonnes, with an approximate market value of EUR 2 million (Figure 6a, Supplementary Materials—Table S1). Annual landings remained below 50 tonnes until 2002, followed by a peak of 281 tonnes in 2008. Subsequently, landings declined from 212 tonnes (2010) to 55 tonnes (2014). Landings of C. squamosus account for 89% of the total elasmobranch landings. The CPUE followed the same annual pattern as the landings, reaching its highest value in 1998 with 0.86 tonnes per fishing trip. The price per kilogram exhibited an inverse relationship, increasing from EUR 0.60 (1990) to EUR 1.41 (1994), stabilising around EUR 0.40 (1995 to 2006), before reaching a maximum of EUR 2.99 (2019). Statistical analysis confirmed significant temporal variations in both landing quantities and PPK (Kruskal–Wallis test with Dunn’s post hoc, p < 0.05).
Dalatias licha landings totalled 54 tonnes (EUR 51,000) during the study period (Figure 6b, Supplementary Materials—Table S1), with 53 tonnes captured between 1990 and 1997. Landings of D. licha account for 2% of the total elasmobranch landings. Whereas the CPUE showed a similar trend to the landings, the annual mean price presented an opposite trend, showing statistically significant temporal variation (Kruskal–Wallis test with Dunn’s post hoc, p < 0.05).
Centroscymnus spp. landings totalled 33 tonnes (EUR 37,000; mean PPK EUR 1.78), predominantly occurring during 1993 and 1994 (30 tonnes) (Figure 6c, Supplementary Materials—Table S1). Landings of Centroscymnus spp. represented approximately 1% of the total elasmobranch landings. Significant interannual differences were observed in both landing quantities and PPK (Kruskal–Wallis test with Dunn’s post hoc, p < 0.05).
Centrophorus granulosus landings (2018 to 2020) totalled 0.5 tonnes (EUR 1000; mean PPK EUR 1.93/kg) (Figure 6d, Supplementary Materials—Table S1), with significant annual variations in both landing volumes and PPK (Kruskal–Wallis test with Dunn’s post hoc, p < 0.05).
Prionace glauca landings (64 tonnes; EUR 12,000) showed pronounced interannual variability, with 90% of total landings occurring in 1995, 1996, and 2003 (Figure 6e, Supplementary Materials—Table S1). Landings of P. glauca represented approximately 3% of the total elasmobranch landings. The CPUE showed the same pattern, and the highest value occurred in 2003. In contrast, lower annual mean prices marked the years characterised by higher landings. Nonetheless, no landings were observed for this species for several years. Statistical analysis revealed significant annual differences (Kruskal–Wallis test with Dunn’s post hoc, p < 0.05).
Isurus oxyrinchus landings increased from one tonne (1990) to four tonnes (1994), with similar peaks in 2003 (Figure 6f, Supplementary Materials—Table S1). For most of the study period, annual landings remained below 1 tonne, though increases were observed from 2018 to 2020. Landings of I. oxyrinchus represented approximately 2% of the total elasmobranch landings. The CPUE suggested a similar trend to the landings. Contrarily, the mean price showed an opposite tendency, with statistically significant annual variations (Kruskal–Wallis test with Dunn’s post hoc, p < 0.05).
Between 1990 and 2020, the total amount of elasmobranchs landed by BLL/PLL/HL fisheries was dominated by G. galeus (ca. 47 tonnes; ca. EUR 41 thousand) (Figure 7a). Landing volumes were highest during the 1990s, peaking at five tonnes in 1998. Between 2000 and 2017, annual landings remained mostly below one tonne, followed by an increase to approximately three tonnes post-2018. The CPUE suggested an identical trend to the landings between 1993 and 2020. In general, the mean price increased with a decrease in landings (Supplementary Materials—Table S1), with statistically significant interannual variations in CPUE and mean PPK (Kruskal–Wallis test with Dunn’s post hoc, p < 0.05).
Other elasmobranch species included in this study were Raja spp. (eight tonnes; EUR 3000), S. zygaena (seven tonnes; EUR 6000), and M. mustelus (seven tonnes; EUR 6000). Raja spp. landings were predominantly recorded between 1990 and 2000 (76% of total), with a mean PPK of EUR 0.35 (Figure 7b). Post-2001 landings stabilised at approximately 0.1 tonnes annually (mean PPK of EUR 0.55), showing significant temporal variation in both quantity and PPK (Kruskal–Wallis test with Dunn’s post hoc, p < 0.05).
S. zygaena and M. mustelus exhibited similar temporal trends, with elevated landings persisting until 2002 (Figure 7c,d), followed by a pronounced decline. This reduction coincided with increasing PPK values.
In relation to the CPUE, both species showed a similar tendency to the landings (Figure 7b,c, Supplementary Materials—Table S1). Regarding M. mustelus, both the landings and the CPUE showed a similar pattern during the study period. Statistical analysis revealed significant annual differences in landing quantities for both species (Kruskal–Wallis test with Dunn’s post hoc, p < 0.05), while significant PPK variations were only observed for M. mustelus (Kruskal–Wallis test with Dunn’s post hoc, p < 0.05).

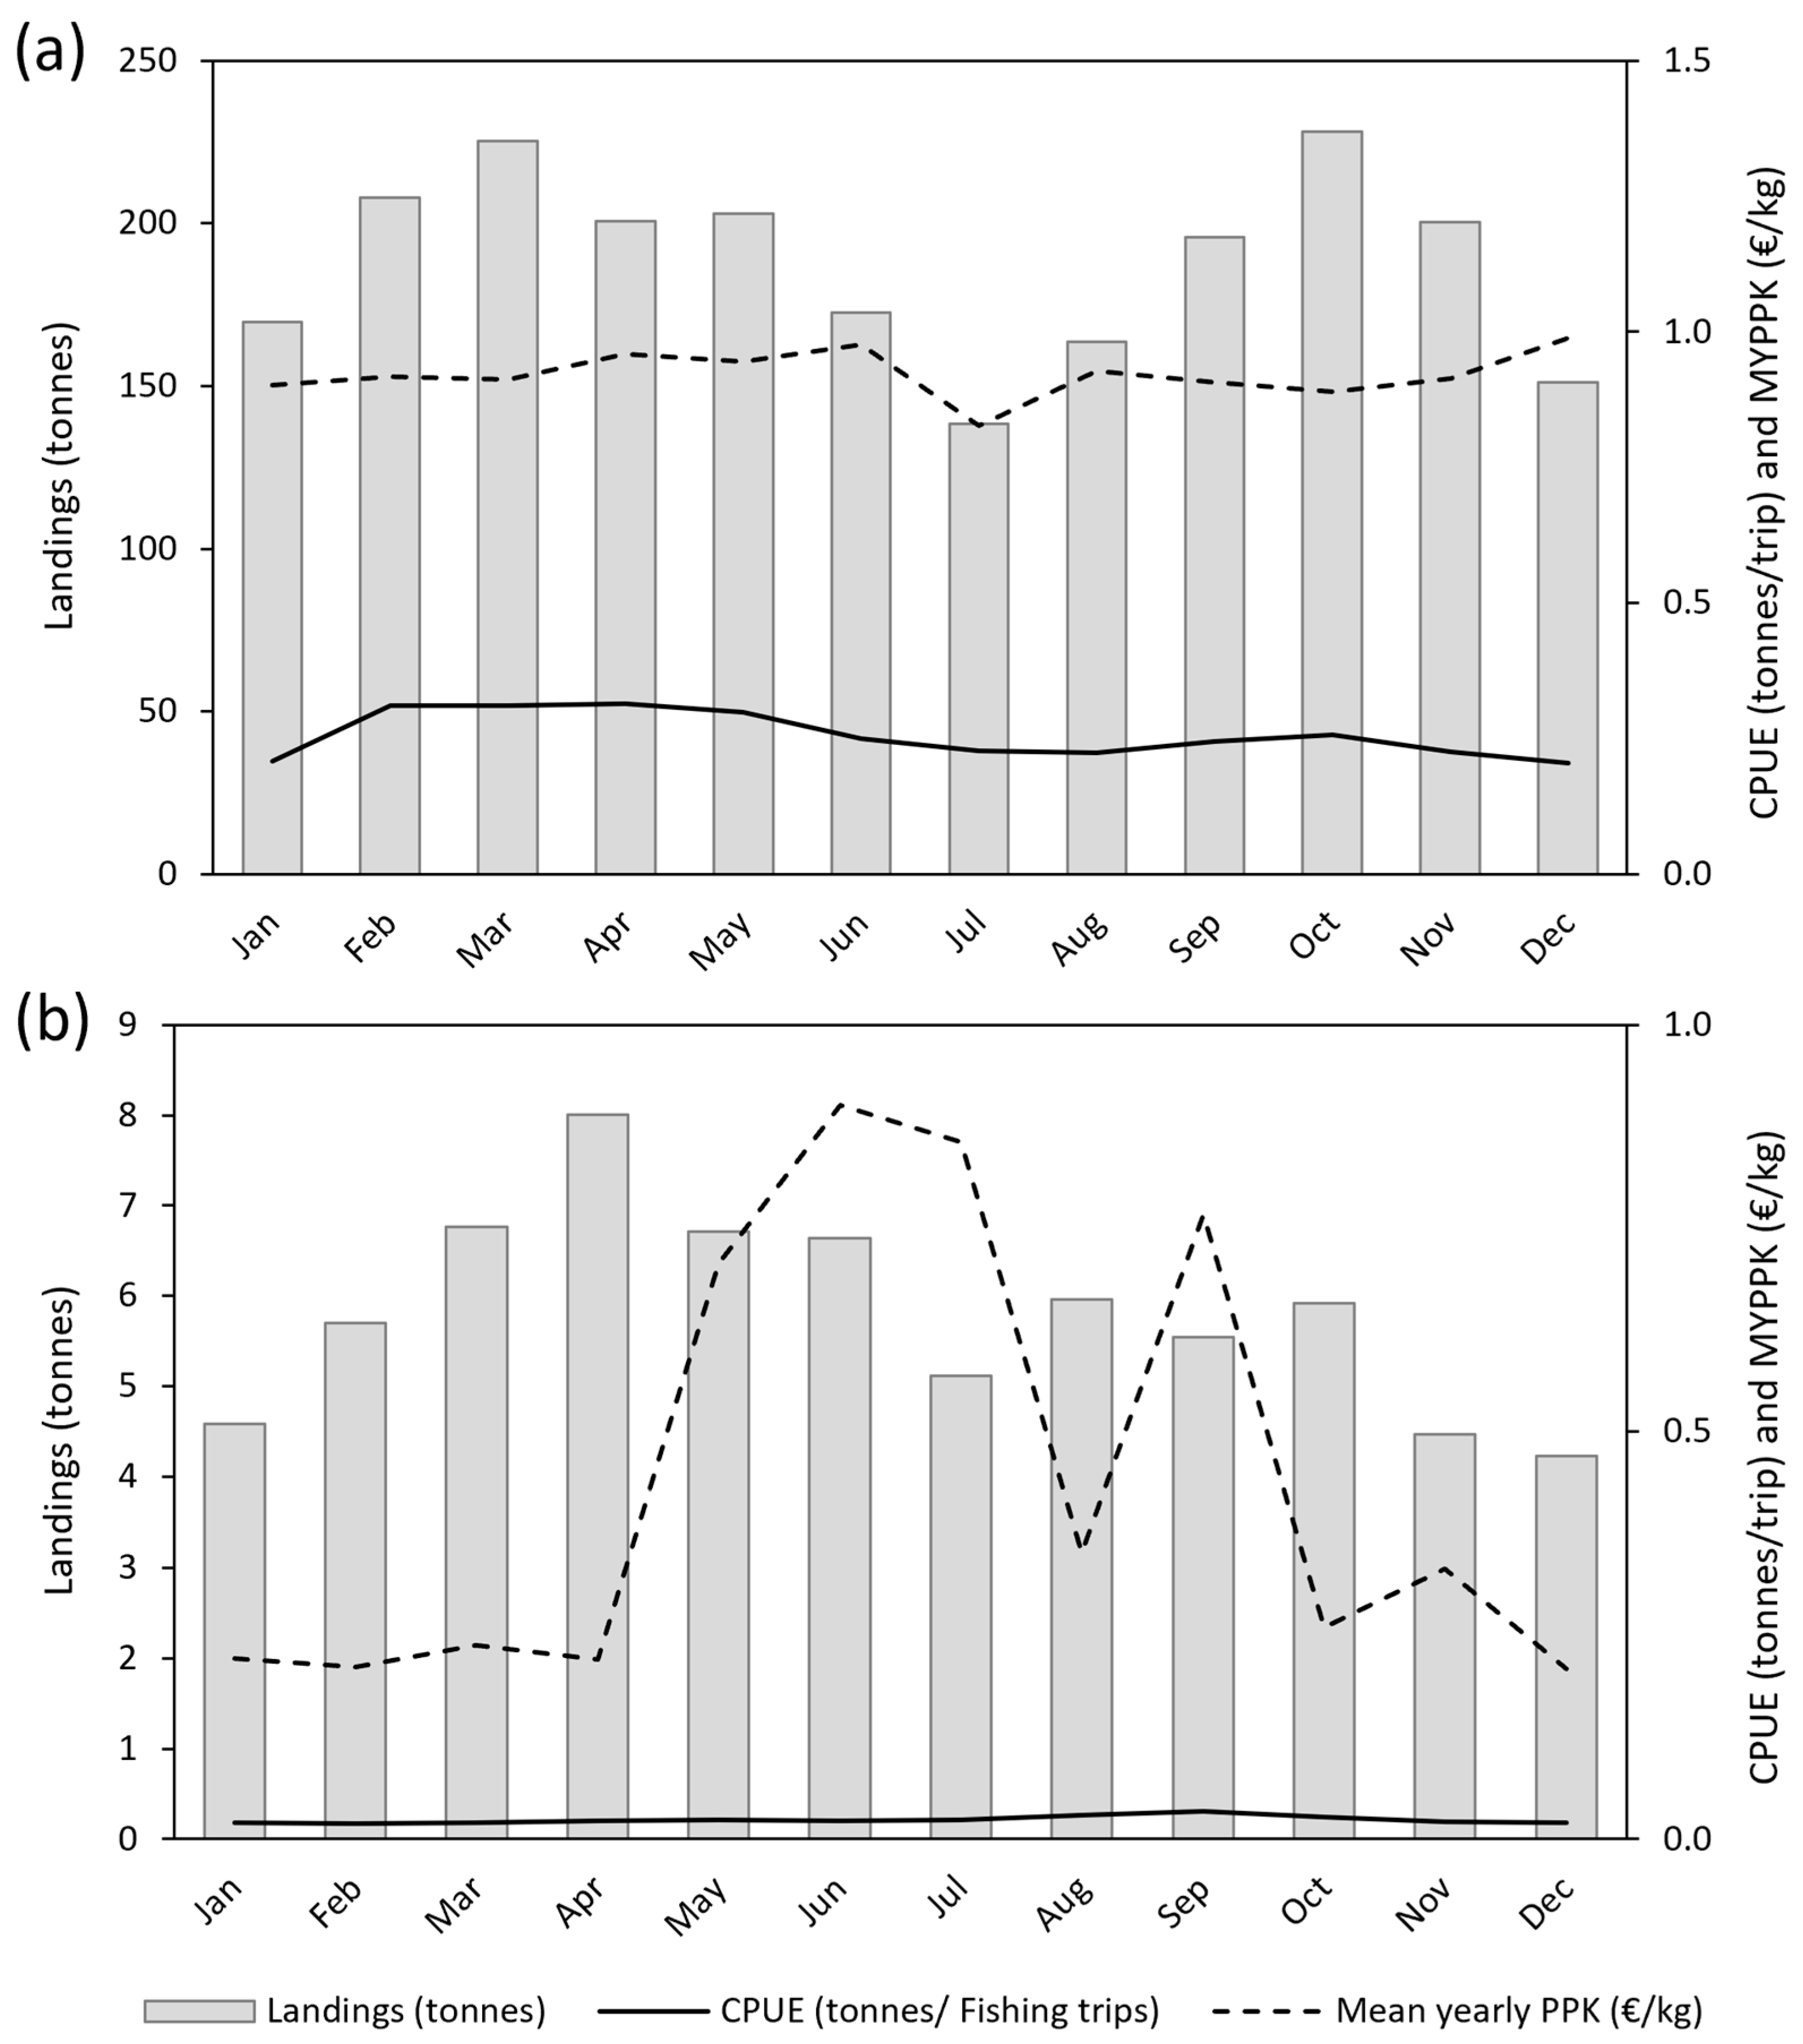
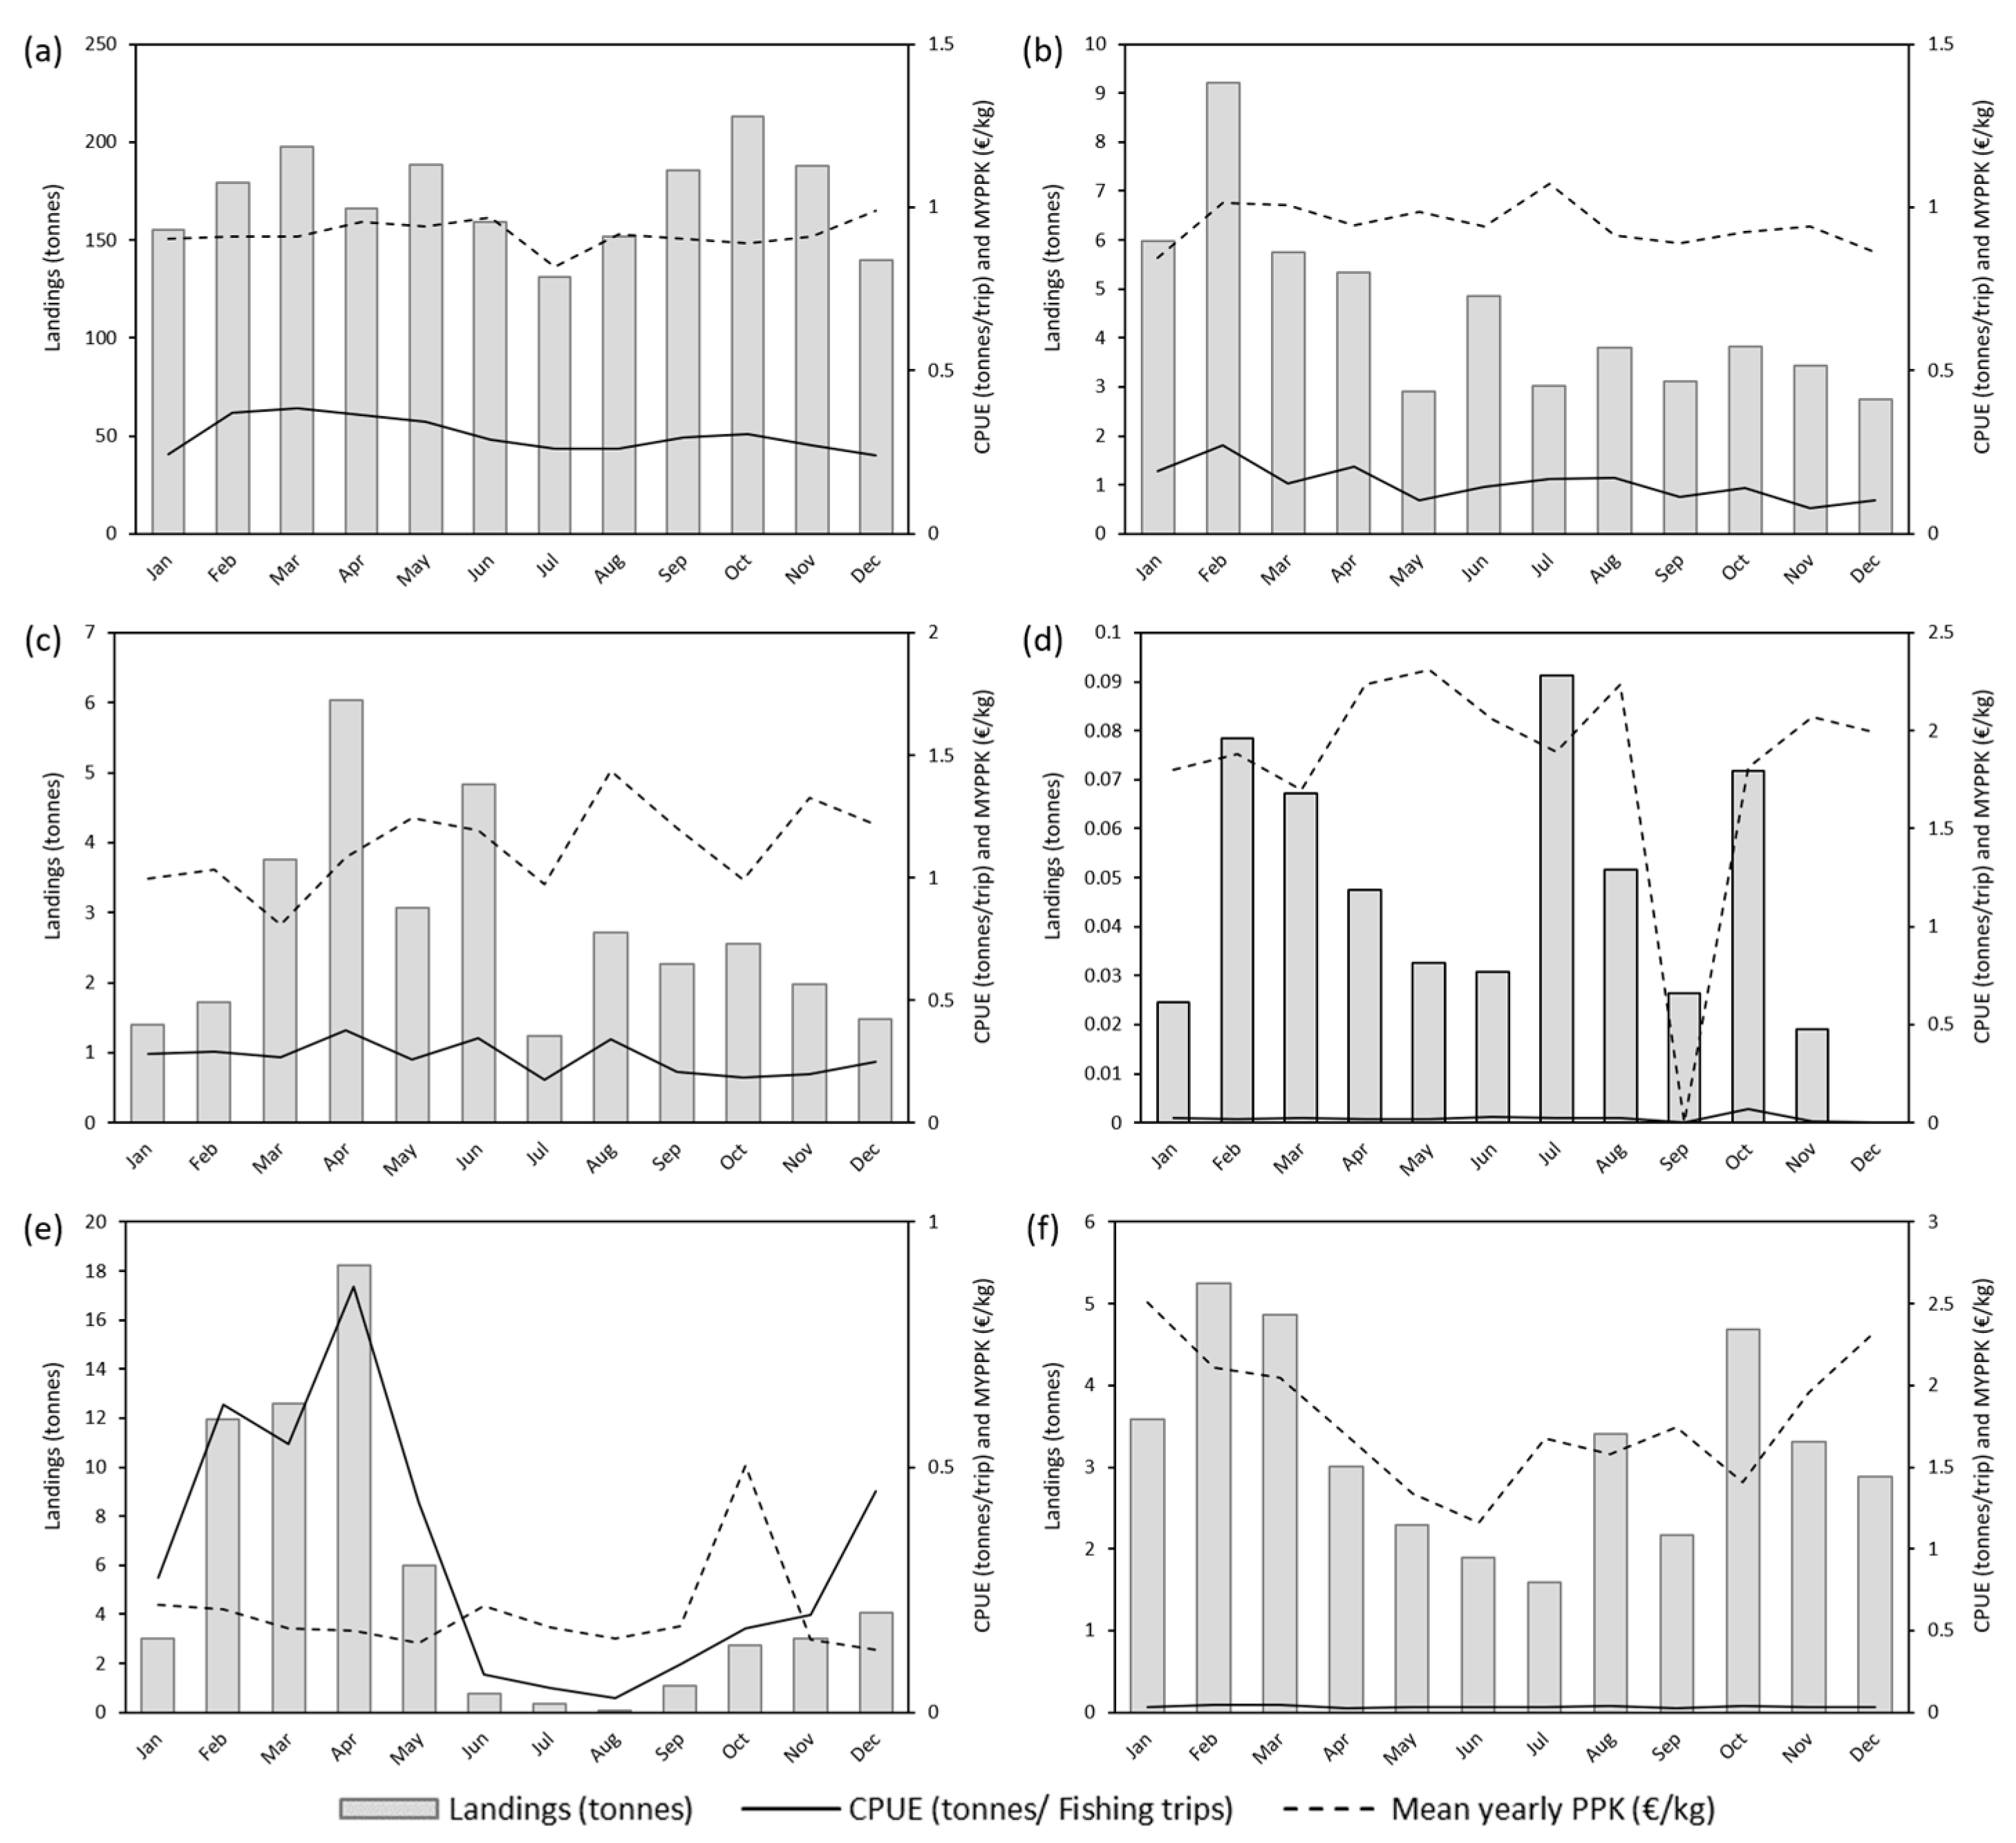
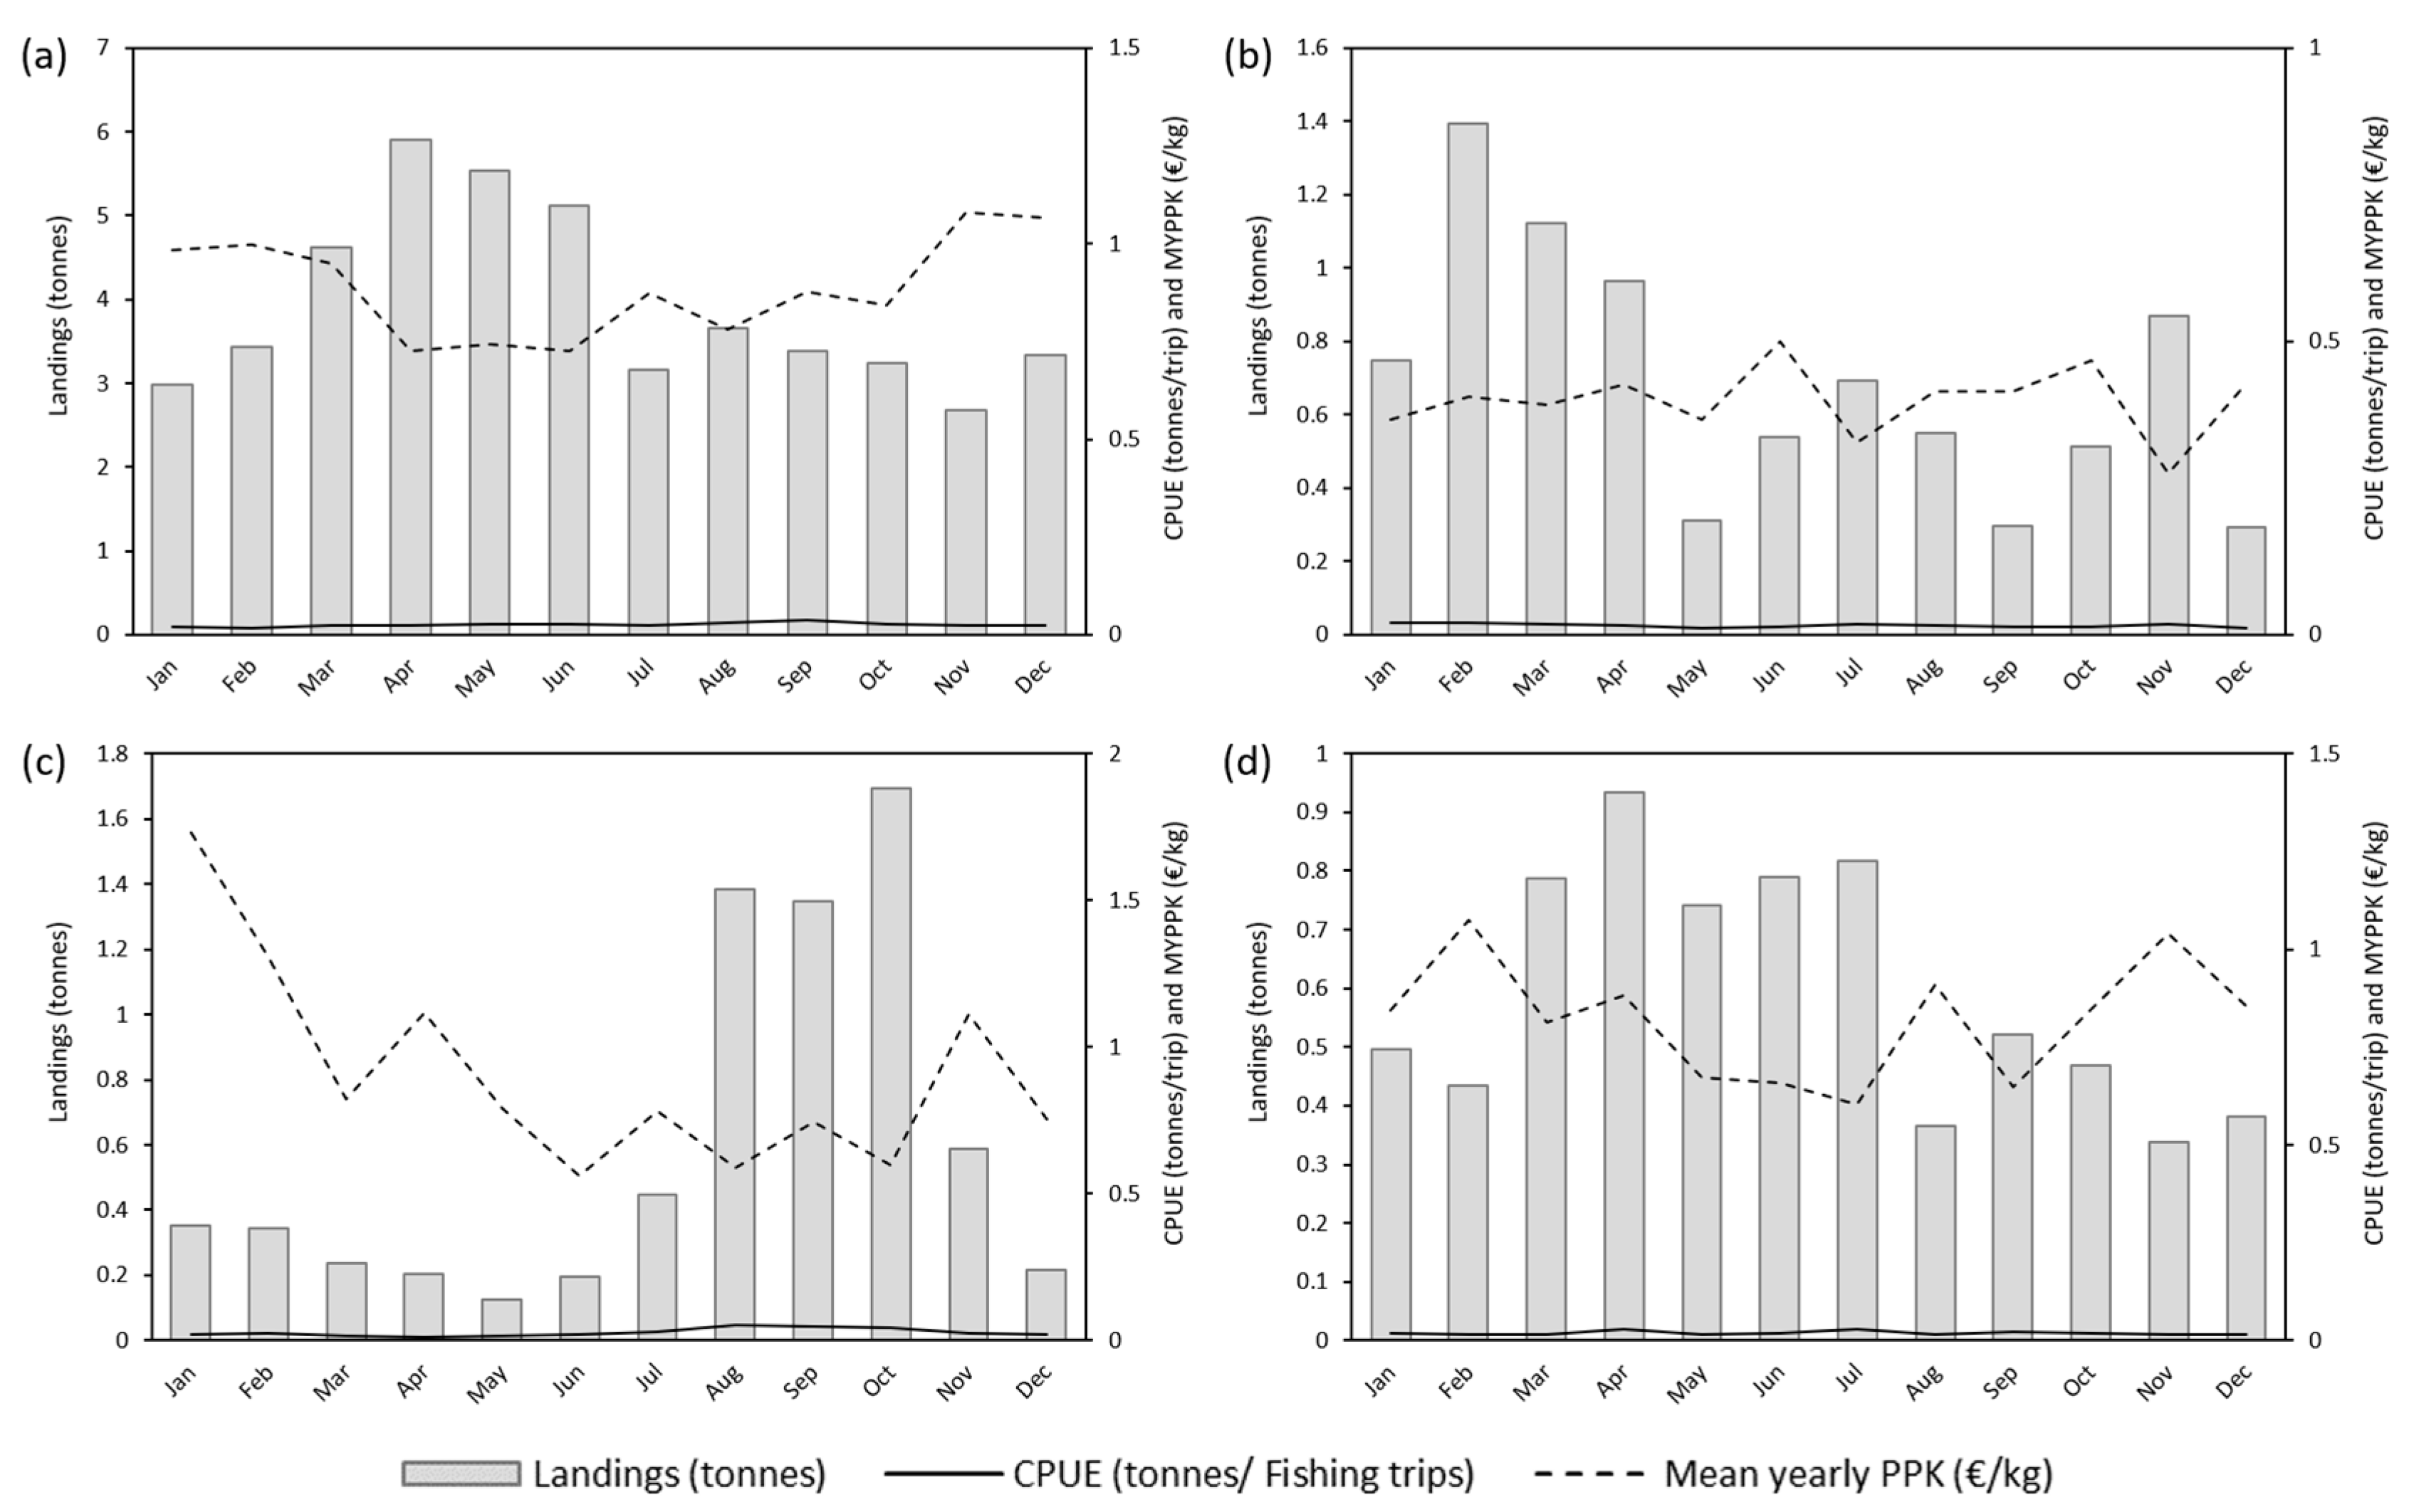
3.2. Monthly Analysis

Analysis of monthly landing patterns revealed significant seasonal fluctuations for both fishing methods. DLL fisheries demonstrated peak elasmobranch landings in March (225 tonnes) and October (227 tonnes), while maximum mean PPK values occurred in June (EUR 0.97) and December (EUR 0.99), exhibiting an inverse relationship between landing volume and market value (Figure 8a). These monthly variations proved statistically significant for both landing quantities (Kruskal–Wallis test with Dunn’s post hoc, p < 0.05) and PPK (Kruskal–Wallis test with Dunn’s post hoc, p < 0.05).
For BLL/PLL/HL fisheries, landing volumes increased progressively from January (five tonnes) to April (eight tonnes). Conversely, mean PPK followed an inverse seasonal pattern, reaching maximum values (>EUR 0.92) during January and December (Figure 8b). Statistical analysis confirmed significant monthly variations in both landing quantities (Kruskal–Wallis test with Dunn’s post hoc, p < 0.05) and PPK values (Kruskal–Wallis test with Dunn’s post hoc, p < 0.05).
Monthly analysis demonstrated distinct seasonal patterns in C. squamosus landings, with bimodal peaks occurring in October (213 tonnes) and March (200 tonnes) (Figure 9a; Supplementary Materials—Table S2) (min = 131 tonnes in July). Mean PPK remained stable between January and March (EUR 0.90), increasing to EUR 1.00 by June, while July recorded the minimum PPK (EUR 0.82). December exhibited characteristic inverse price-quantity dynamics, with reduced landings coinciding with elevated PPK. Significant monthly variations were observed for both landing quantities and PPK (Kruskal–Wallis test with Dunn’s post hoc, p < 0.05).
Dalatias licha landings showed maximal monthly volumes (>five tonnes) during January and April, peaking in February (nine tonnes) (Figure 9b; Supplementary Materials—Table S2). Corresponding PPK values demonstrated a unimodal trend, increasing from EUR 0.80 (January) to EUR 1.10 (July) before declining to EUR 0.90 by December. Statistical analysis confirmed significant monthly variations in both parameters (Kruskal–Wallis test with Dunn’s post hoc, p < 0.05).
Centroscymnus spp. landings were higher from March to June (>three tonnes monthly), reaching six tonnes in April (Figure 9c; Supplementary Materials—Table S2). Although PPK exhibited an inverse relationship with landing volumes, neither parameter showed statistically significant monthly variation (Kruskal–Wallis test with Dunn’s post hoc, p > 0.05).
For C. granulosus, no significant monthly differences were detected in either landing quantities or PPK values (Kruskal–Wallis test with Dunn’s post hoc, p > 0.05) (Figure 9d; Supplementary Materials—Table S2).
Prionace glauca landings showed pronounced seasonality, with February to May accounting for most landings (>six tonnes monthly), peaking in April (18 tonnes) (Figure 9e; Supplementary Materials—Table S2). PPK demonstrated inverse dynamics, maximising in October (EUR 0.50) and minimising in December (EUR 0.10). Significant monthly variations were observed for both metrics (Kruskal–Wallis test with Dunn’s post hoc, p < 0.05).
Isurus oxyrinchus landings exhibited strong seasonal concentration, with October to April accounting for 71% of total landings (Figure 9f; Supplementary Materials—Table S2). PPK values ranged from EUR 2.51 (January) to EUR 1.16 (June), showing significant monthly variation (Kruskal–Wallis test with Dunn’s post hoc, p < 0.05) despite non-significant landing fluctuations (p > 0.05).
Results on G. galeus suggested that this species was mostly landed between March and June (> 4.5 tonnes per month) (Figure 10a; Supplementary Materials—Table S2). On the contrary, the mean price revealed an opposite trend, reaching the highest value over the month of October. Statistical analysis showed significant differences in monthly landings (Kruskal–Wallis test followed by Dunn’s, p < 0.05) and mean PPK (Kruskal–Wallis test followed by Dunn’s, p < 0.05).
For Raja spp. the analysis demonstrated that 42% of the total landings occurred between February and April (Figure 10b; Supplementary Materials—Table S2). The mean price showed an opposite trend in relation to the landings and the highest value was observed in June (ca. EUR 0.50). Statistical analysis confirmed significant monthly variations in both landing quantities and PPK values (Kruskal–Wallis test with Dunn’s post hoc comparison, p < 0.05).
Regarding S. zygaena, 62% of the total landings occurred between August and October (Figure 10c; Supplementary Materials—Table S2), and the highest mean price was registered in January (ca. EUR 1.73). These monthly differences proved statistically significant for both landing volumes and PPK (Kruskal–Wallis test with Dunn’s post hoc comparison, p < 0.05). In relation to M. mustelus, 58% of the total landings occurred between March and July. In general, the mean price revealed an opposite trend to the landings (Figure 10d; Supplementary Materials—Table S2). Statistical analysis revealed no significant monthly variations in either parameter (Kruskal–Wallis test with Dunn’s post hoc comparison, p > 0.05).
Overall, the CPUE suggested a similar monthly trend to the landings for all of the species caught by BLLs/PLLs/HLs (Supplementary Materials—Table S2).

3.3. Vessel Size Analysis

The relationship between the total annual landings in tonnes and vessel size showed two opposite trends in the landings performed by DLLs during the study period (Figure 11a). Between 1990 and 2002, the majority of the landings were performed by small vessels (<12 m), with a peak in 1991 (ca. 84%). Contrarily, most incidental catches were landed by bigger vessels (12 > 18 m) from 2003 onwards, with a peak in 2010 (ca. 85%). Statistical analysis confirmed significant interannual variations in size-dependent landing patterns (Kruskal–Wallis test with Dunn’s post hoc comparison, p < 0.05).
Concerning the species caught by bottom longliners/pelagic longliners/handliners, most landings were achieved by small vessels (<12 m), except for the years of 1997, 2001, and 2015 (Figure 11b). These size-related landing differences proved to be statistically significant (Kruskal–Wallis test with Dunn’s post hoc comparison, p < 0.05).
An analysis of C. squamosus landings revealed a clear shift over time in the size class of vessels used for fishing (Figure 12a; Supplementary Materials—Table S3). From 1990 to 2002, small vessels (<12 m) accounted for most landings, but after 2003, medium-sized vessels (≥12 m and <18 m) became dominant. The Kruskal–Wallis test with Dunn’s post hoc comparison confirmed significant interannual variation in landing patterns across vessel size classes (p < 0.05), reflecting fluctuations in the relative contributions of small and medium vessels.
Dalatias licha exhibited a similar transition, with small vessels (<12 m) predominating between 1990 and 1996, followed by larger vessels (>12 m and <24 m) from 1997 onwards (Figure 12b; Supplementary Materials—Table S3). Statistical analysis confirmed significant vessel size-related differences across years (Kruskal–Wallis test with Dunn’s post hoc comparison, p < 0.05).
Centroscymnus spp. landings showed comparable dynamics, transitioning from small vessels (<12 m) between 1993 and 1995 to larger vessels (>12 m and <24 m) post-2002 (Figure 12c; Supplementary Materials—Table S3), with significant size-related variations (Kruskal–Wallis test with Dunn’s post hoc comparison, p < 0.05).
For C. granulosus, medium-sized vessels (>12 m and <18 m) consistently accounted for most landings (Figure 12d; Supplementary Materials—Table S3), though no significant size-related differences were detected (Kruskal–Wallis test with Dunn’s post hoc comparison, p > 0.05).
Prionace glauca demonstrated a more complex pattern, with small vessels (<12 m) dominating between 1994 and 1998, followed by larger vessels (>12 m and <24 m) from 2000 to 2015, before reverting to small vessels post-2016 (Figure 12e; Supplementary Materials—Table S3). These transitions proved statistically significant (Kruskal–Wallis test with Dunn’s post hoc comparison, p < 0.05).
Isurus oxyrinchus landings showed bimodal size distribution, with small vessels (<12 m) predominating from 1990 to 1997 and 2016 to 2020, interrupted by larger vessels (>12 m and <24 m) between 1998 and 2015 (Figure 12f; Supplementary Materials—Table S3). Significant interannual variations in vessel-size utilisation were observed (Kruskal–Wallis test with Dunn’s post hoc comparison, p < 0.05).
An analysis of G. galeus landings revealed a consistent predominance of small vessels (<12 m), with notable exceptions occurring in 2001 (>12 m and <18 m) and 2015 (>18 m and <24 m) (Figure 13a; Supplementary Materials—Table S3). No statistically significant variation in vessel-size utilisation was observed (Kruskal–Wallis test with Dunn’s post hoc comparison, p > 0.05).
Raja spp. exhibited distinct temporal patterns in vessel-size utilisation, with small vessels (<12 m) dominating landings from 1990 to 1994 and 2016 to 2020 (Figure 13b; Supplementary Materials—Table S3). The intervening period (1995 to 2015) showed no consistent trend. Statistical analysis confirmed significant interannual variations in vessel-size distribution (Kruskal–Wallis test with Dunn’s post hoc comparison, p < 0.05).
For S. zygaena, fishing operations transitioned from predominantly small vessels (<12 m) during 1990 to 1996 to medium/large vessels (>12 m and <24 m) from 2003 onward (Figure 13c; Supplementary Materials—Table S3). These differences proved statistically significant (Kruskal–Wallis test with Dunn’s post hoc comparison, p < 0.05).
Mustelus mustelus landings showed a consistent predominance of small vessels (<12 m) throughout the study period (Figure 13d; Supplementary Materials—Table S3), with no significant interannual variation in vessel-size utilisation (Kruskal–Wallis test with Dunn’s post hoc comparison, p > 0.05).

4. Discussion

This study reports the first analysis of fishery landings of elasmobranchs as non-target species in the Madeira Archipelago. The current fisheries management framework in the North Atlantic was not originally designed to incorporate elasmobranch conservation objectives [21]. Several critical knowledge gaps hinder the accurate assessment of chondrichthyan stock status, including deficient catch reporting, unquantified discard mortality, persistent species misidentification, and an insufficient understanding of elasmobranch life history parameters [11]. These knowledge deficits are especially problematic given that elasmobranchs’ life history traits, including slow growth rates, late sexual maturation, low fecundity, and exceptional longevity [10,11,22], render them significantly more vulnerable to overexploitation than teleost species [3,11]. The information gap only grew wider after the implementation of the restrictive zero TAC for deep-water shark landings, established by Council Regulation (EU) 1367/2014 on 15 December 2014. Despite this management measure, fishing gears have remained unchanged since then; hence, the same non-target species are still harvested but not landed, making it impossible to conduct any studies on their biology. Furthermore, substantial uncertainties remain regarding both the ecosystem-level consequences of predator/prey removal through fisheries and the ecological impacts of discard-derived nutrient subsidies—information that should be systematically incorporated into future management strategies [10].
The commercial elasmobranchs landed in the Madeira Archipelago include five species that raise considerable conservation concerns. Since Madeira is within European waters, conservation statuses are based on the European Red List of Marine Fishes [19]; one species is listed as Critically Endangered (C. granulosus), two are listed as Endangered (C. squamosus, D. licha), and two are listed as Vulnerable (G. galeus, M. mustelus).
In the Madeira Archipelago, elasmobranch landings are predominantly captured in DLL fisheries targeting scabbardfishes. In fact, elasmobranch annual landings showed a dominance of deep-water sharks, which accounted for more than 90% of the total species landed as non-target between 1990 and 2020. These are harvested using DLLs, which represent approximately 50% of the region’s total fisheries [23]. From 2015 to the present, landed values do not accurately reflect the harvested weight of deep-water shark species. In particular, the sharp reduction in elasmobranch landings in 2015 and 2016 is explained by the imposition of the above-mentioned legislation (TAC zero). The CPUE annual analysis suggested a similar trend to the landings from 1990 to 1996, and between 2006 and 2020. Nonetheless, a decrease in the total landings led to an increase in the PPK. This pattern was more pronounced between 2008 and 2019, possibly due to an increasing demand during those years. Before the introduction of the TAC zero, deep-water sharks were extremely commercially valuable and tightly linked to the gastronomical inheritance of the Madeira Archipelago. Shark’s liver oil was an important source of income for the local population as it was sold to the cosmetic industry at high market value. The supply–demand relationship followed expected patterns for commercially valuable species [24], with declining landings correlating with increasing market value (mean PPK). Similar trends have been observed across European fisheries, where reductions in available landings often led to higher prices [25].
Concerning the landed tonnage of deep-water sharks by DLLs, there is a significant period of 12 years (2003 to 2014) marked by landings over 50 tonnes annually. This is a substantial amount considering the small-scale nature of this fishery in the Madeira Archipelago for unmanaged elasmobranch species. When looking further into species levels within this fishery, it was clear that C. squamosus was the most representative species over the study period. The observed variations may be explained by fluctuations in fishing effort, including changes in the number of active vessels and vessel size. The increase in vessel size observed between 2003 and 2014 may have contributed to the higher C. squamosus landings during the same period. Larger vessels typically have greater capacity for longer fishing trips, potentially leading to increased catch. Ecologically, the pronounced dominance of this species’ landings can be explained by its bathydemersal nature, typically inhabiting soft-bottom continental slopes between 600 and 1400 m, which overlaps with the depth range of the DLL fishing depth range (800–1300 m). The landings peak in 2008 corresponded to the landings peak of the scabbardfishes (3109 tonnes) and is derived from an increase in fishing effort, namely the number of fishing vessels and fishing trips [14]. The period of increased landings predates the classification of C. squamosus as Endangered in Europe (2014) and globally (2020), suggesting a potential link between fishing pressure, landings, and conservation status.
Pelagic shark landings by DLLs were representative between 1990 and 2003, totalling 86 tonnes and peaking at over 30 tonnes in 2003. This might be explained by the increasing market demand for the blue shark P. glauca, driven primarily by the value of their fins in international trade, which likely led to more targeted fishing effort for this species. Interestingly enough, this species’ peaks were coincident with data reported by Roxo et al. [26] for Portugal and are in line with a pattern of offer and demand. Likewise, shark finning was banned by the EU in 2003 (Council Regulation (EC) No 1185/2003 of 26 June 2003), which explains a reduction in P. glauca landings as a non-target species from that year onwards.
With the enforcement of the zero TAC in 2015, the landing of deep-water sharks was entirely banned, and although these species may still have been incidentally caught, all specimens were subject to mandatory discarding. Since 2017, a maximum TAC of 10 tonnes for the exclusive exploitation of deep-sea sharks was established by the Council Regulation (EU) 2016/2285 on 12 December 2016. This regulation only applies to bycatch in the fishery for scabbardfish species using longline in EU waters of CECAF regions 34.1.1, 34.1.2 and 34.2. Later on, between 2019 and 2020, the TAC was adjusted to seven tonnes by the Council Regulation (EU) 2018/2025 on 17 December 2018. The main purposes of this TAC were to reduce bycatch and to gather robust data on the species’ biology and population dynamics. Currently, deep-sea sharks’ landings are strictly forbidden, and all accidental catches must be discarded. In all appearances, this might seem to be a good conservation measure; however, since fishing gear remains unchanged, this legislation continues to underestimate the real weight of elasmobranch catches in the Madeira Archipelago. This restriction would benefit from further scientific studies on species’ survival rates upon discard, which are presumably scarce, since it is known that most individual deep-water sharks do not survive the hauling of the fishing gear [27]. Changes in pressure are highly likely to guarantee that discarded individuals will not survive [11]. Moreover, studies on the enhancement of food supply through fisheries discards are still missing, even though it is highly likely that this input may alter the dynamics of marine food webs.
The total elasmobranch taxa caught by BLLs/PLLs/HLs were dominated by G. galeus. Other elasmobranchs like Raja spp., S. zygaena, and M. mustelus also showed a consistent landings trend throughout the years, with higher landings until 2002 and again from 2017 onwards. In addition, the landed tonnage and mean market price for G. galeus described in this study were similar to those revealed by Torres et al. [28] for the Azores, with a catch peak in 1998. This event might be explained by this species’ dynamic migratory behaviour, with routes coming close to the Atlantic archipelagos in some years, and in other periods moving towards other areas in the Northeast Atlantic [29]. This hypothesis is poorly investigated as studies on G. galeus migratory patterns are still missing, though previous research has shown that most individuals do not step out of a 500 km range [30]. In general, and similarly to the offer and demand pattern observed for the DLL fishery, an increase in the landed weight led to a decrease in the species PPK.
Elasmobranch monthly landings fluctuate throughout the year for both fishing gears considered, although a clear pattern does not seem to exist when looking into the data for DLLs. This fishery is mainly operated by vessels bigger than 12 m in length, which are generally better equipped to handle year-round meteorological conditions. In contrast, higher landings in the scabbardfish fishery occur mainly for autumn and winter months, likely reflecting the coastal migration patterns of these species during spawning season, as previously studied by Vasconcelos et al. [31] for the Madeira Archipelago. Regarding BLLs/PLLs/HLs, there is marked evidence of higher landings during spring, probably due to better sea conditions between April and June. This is particularly relevant given that this kind of fishery is mostly performed by smaller vessels, with reduced autonomy and poorer basic conditions [32].
Regarding the species’ monthly values of BLLs/PLLs/HLs, the data revealed more prominent landings for the majority of species during spring, with the sole exception of S. zygaena. This species’ landing pattern showed that it is predominantly harvested during late summer and early autumn months.
Two different trends in elasmobranch landings by DLLs became clear when analysing vessel size. Until 2002, most species were caught by vessels smaller than 12 m. From 2003 onwards, a shift became apparent, and elasmobranchs were predominantly harvested by vessels with sizes ranging between 12 m and 18 m. During this period, a reduction in the total number of vessels was verified. This decrease was most significant among vessels under 12 m, which is in line with this study’s findings (DRP, 2021). This alteration might be consistent with the increased EU-funded subsidies for fishing vessel decommissioning.
Landings performed by BLLs/PLLs/HLs were mostly done by smaller vessels (<12 m), which tend to capture more pelagic shark species, particularly during the deployment and hauling of the fishing gear. Similar patterns have been reported in both the Mediterranean and North Pacific, where small-scale longline vessels are commonly associated with pelagic shark bycatch [33,34]. In this study, this trend was especially evident for G. galeus and M. mustelus, whose landings were predominantly associated with vessels under 12 m.
A species-level analysis reveals that C. squamosus is the main species associated with the use of DLLs, with its overall pattern overlapping that of the total DLL bycatch. Recent internal studies (unpublished data) indicate that C. squamosus populations in the study area are predominantly composed of older, mature individuals, with sex ratios strongly skewed toward males and size classes generally exceeding 100 cm. Given the reduced landed tonnage for D. licha, Centroscymnus spp., and C. granulosus over the study period, no continuous pattern could be reported. The scabbardfish fishery, being the region’s oldest deep-sea fishery dating back to the 17th century, has seen fleets progressively move to new fishing grounds further offshore and away from coastal areas as resources have become increasingly scarce [13]. Concurrently, technological advancements in fishing vessels have enabled them to endure rougher sea conditions and longer trips, facilitating exploration of these new grounds. The combination of these factors likely contributed to a decrease in the bycatch of D. licha and Centroscymnus spp. as these species might be less abundant in the more distant fishing areas, and to an increase in the landed tonnage of C. squamosus. Moreover, species misidentification among deep water sharks could be an explanatory factor and should be accounted for [25,35].
Conservation measures aiming to reduce post-release bycatch mortality would benefit greatly from continuous experimental fishing cruises focused on pairing hook type and size with soak time, in order to assess species-specific survival rates [36,37]. These efforts are particularly relevant for elasmobranchs, which tend to exhibit slow growth, late maturity, and low reproductive output, making them especially vulnerable to fishing pressure. Matching gear design to species characteristics is a proven strategy to improve survival outcomes [38], and experiments under real fishing conditions are essential to fine-tune these parameters.
The establishment of science-based TACs for deep-sea sharks represents an urgent management priority. Considering that these species do not survive the hauling of the fishing gear, it makes traditional discard mitigation strategies biologically irrelevant. In these cases, valuable scientific data should be collected from all specimens rather than discarding them, as they provide crucial opportunities to study reproduction, age, growth, and feeding ecology, which are fundamental parameters that remain poorly understood for many deep-water species.
To further enhance bycatch mitigation strategies, a systematic analysis of electronic logbook data could be implemented to identify spatial bycatch hotspots for these vulnerable species. Such spatial risk assessment would allow for data-driven management by pinpointing high-priority areas where targeted interventions could most effectively reduce elasmobranch mortality.
As a complementary monitoring measure, onboard observers play a crucial role in collecting data, not only on catch composition and discards but also on the condition of released individuals, which informs realistic mortality estimates [39]. To complement these efforts, monitoring trips with observers will continue to be implemented in the Madeira Archipelago. Additionally, the introduction of a remote electronic monitoring system is planned to increase monitoring coverage, particularly on smaller vessels where observer deployment is more challenging. Remote electronic monitoring can provide continuous visual records, support compliance verification, and generate valuable data to guide management [40,41]. In the long term, integrating these measures into an adaptive management framework will be essential to ensure the effective conservation of elasmobranch species while maintaining the sustainability of local fisheries.

5. Conclusions

The present study constitutes the first comprehensive analysis of elasmobranch bycatch dynamics in Madeiran fisheries, revealing significant shortcomings in current management approaches. The predominance of vulnerable deep-water species, particularly C. squamosus, in DLL landings highlights the limitations of existing regulatory measures. The EU’s zero TAC policy has created an untenable situation where these biologically sensitive species continue to experience fishing mortality while being excluded from scientific monitoring due to mandatory discarding requirements. This policy gap requires urgent rectification to enable proper stock assessment and monitoring. Furthermore, the analysis demonstrates significant influences of vessel characteristics and seasonal variability on bycatch composition, suggesting these factors should be incorporated into adaptive management frameworks.
An analysis of landing patterns demonstrates clear relationships between fishing effort, market demands, and regulatory management measures, as evidenced by the decline of P. glauca following the 2003 finning prohibition. However, the current management paradigm remains fundamentally reactive rather than precautionary in nature. Three critical reforms emerge as necessary, including the replacement of counterproductive discard policies with science-based TACs that facilitate biological sampling, the implementation of spatially explicit management strategies informed by electronic monitoring data, and the immediate testing of modified fishing gear configurations to enhance survival rates of vulnerable species.
Failure to implement these reforms risks irreversible damage to ecologically and economically significant species that have historically supported regional fisheries. Moving forward, the development of science-based, adaptive management strategies that account for elasmobranch vulnerabilities while maintaining fishery viability is imperative.

Supplementary Materials

The following supporting information can be downloaded at: https://www.mdpi.com/article/10.3390/fishes10070358/s1, Table S1: Statistics for annual elasmobranch landings, Catches per Unit Effort (CPUE) and mean price per fishing gear and species (DLL—drifting longliners; BLLs/PLLs/HLs—bottom longliners, pelagic longliners, and handliners; Min—minimum; Max—maximum; IQR—Interquartile range (Q1–Q3); Sig.—* p < 0.05, n.s.—not significant; DF—degrees of freedom).; Table S2: Statistics for monthly elasmobranch landings, Catches per Unit Effort (CPUE) and mean price per fishing gear and species (DLL—drifting longliners; BLLs/PLLs/HLs—bottom longliners, pelagic longliners, and handliners; Min—minimum; Max—maximum; IQR—Interquartile range (Q1–Q3); Sig.—* p < 0.05, n.s.—not significant; DF—degrees of freedom); Table S3: Statistics for annual elasmobranch landings and CPUE per vessel size, species and fishing gear (DLL—drifting longliners; BLLs/PLLs/HLs—bottom longliners, pelagic longliners, and handliners; Min—minimum; Max—maximum; IQR—Interquartile range (Q1–Q3); Sig.—* p < 0.05, n.s.—not significant; DF—degrees of freedom).

Author Contributions

Conceptualization, M.F. and R.S.; methodology, M.F., J.D. and R.S.; software, M.G.; validation, F.P.-D., M.G., P.I., S.C.C. and R.S.; formal analysis, M.F. and R.S.; investigation, M.F., F.P.-D., M.G., P.I., J.D., S.C.C. and R.S.; resources, M.F., J.D. and R.S.; data curation, M.F. and M.G.; writing—original draft preparation, M.F., P.I. and R.S.; writing—review and editing, M.F., F.P.-D., M.G., P.I., J.D., S.C.C. and R.S.; visualization, M.F., F.P.-D., M.G., P.I., J.D., S.C.C. and R.S.; supervision, R.S.; project administration, M.F. and R.S. All authors have read and agreed to the published version of the manuscript.

Funding

This research received no external funding.

Institutional Review Board Statement

Not applicable.

Data Availability Statement

The data presented in this study are available upon request from the corresponding author. However, they are not publicly available due to confidentiality considerations, as they contain information about individual vessels that could potentially lead to their identification.

Acknowledgments

The authors acknowledge the dedicated work carried out by the technical assistants of the Regional Directorate of Fisheries, during the collection of data.

Conflicts of Interest

The authors declare no conflicts of interest.

Abbreviations

The following abbreviations are used in this manuscript:
DLLMid-water drifting longline
BLLs/PLLs/HLsBottom longlines, pelagic longlines, and handlines
TACTotal allowable catches

References

  1. Dulvy, N.K.; Fowler, S.L.; Musick, J.A.; Cavanagh, R.D.; Kyne, P.M.; Harrison, L.R.; Carlson, J.K.; Davisdson, L.N.K.; Fordham, S.; Francis, M.P.; et al. Extinction risk and conservation of the world’s sharks and rays. eLife 2014, 3, e00590. [Google Scholar] [CrossRef] [PubMed]
  2. Davidson, L.N.K.; Krawchuk, M.A.; Dulvy, N.K. Why have global shark and ray landings declined: Improved management or overfishing? Fish Fish. 2016, 17, 438–458. [Google Scholar] [CrossRef]
  3. Bonfil, R. Overview of World Elasmobranch Fisheries; FAO Fisheries Technical Paper, No.341; FAO: Rome, Italy, 1994; ISBN 925-103-566-0. [Google Scholar]
  4. Gillett, R.D. Marine Fishery Resources of the Pacific Islands; FAO Fisheries and Aquaculture Technical Paper No. 537; FAO: Rome, Italy, 2010; ISBN 978-92-5-106512-9. [Google Scholar]
  5. Alves, A.; Delgado, J. First Description of a New Local Fishery of Pink Dentex, Dentex (Cheimerius) gibbosus (Rafinesque, 1810) (Pisces: Sparidae) off Madeira Island. In Proceedings of the ICES Annual Science Conference, Copenhagen, Denmark, 1–5 October 2002. Paper No. L:07. [Google Scholar]
  6. Morato, T. Description of Environmental Issues, Fish Stocks and Fisheries in the EEZs Around the Azores and Madeira; European Commission, Directorate-General for Maritime Affairs and Fisheries: Brussels, Belgium, 2012. [Google Scholar]
  7. Caldeira, R.M.A.; Groom, S.; Miller, P.; Pilgrim, D.; Nezlin, N.P. Sea-surface signatures of the island mass effect phenomena around Madeira Island, Northeast Atlantic. Remote Sens. Environ. 2002, 80, 336–360. [Google Scholar] [CrossRef]
  8. Vieira, A. As riquezas novas e os novos mercados de procura e venda. Ilhas Atlânticas Bol. Inst. Hist. Ilha Terceira 1995, LIII, 593–638. [Google Scholar]
  9. Fowler, S.L.; Cavanagh, R.D. Species Status Reports. In Sharks, Rays and Chimaeras: The Status of the Chondrichthyan Fishes; Fowler, S.L., Cavanagh, R.D., Camhi, M., Burgess, G.H., Caillet, G.M., Fordham, S.V., Simpfendorfer, C.A., Muzick, J.A., Eds.; IUCN/SSC Shark Specialist Group: Gland, Switzerland; IUCN: Cambridge, UK, 2005; pp. 213–361. ISBN 2-8317-0700-5. [Google Scholar]
  10. Stevens, J.D.; Bonfil, R.; Dulvy, N.K.; Walker, P.A. The effects of fishing on sharks, rays, and chimaeras (chondrichthyans), and the implications for marine ecosystems. ICES J. Mar. Sci. 2000, 57, 476–494. [Google Scholar] [CrossRef]
  11. Large, P.A.; Hammer, C.; Bergstad, O.A.; Gordon, J.D.M.; Lorance, P. Deep-water fisheries of the Northeast Atlantic: II. Assessment and management approaches. J. Northwest Atl. Fish. Sci. 2003, 31, 151–163. [Google Scholar] [CrossRef]
  12. European Union. Regulation (EC) No 1954/2003 of 4 November 2003 on the Management of the Fishing Effort Relating to Certain Community Fishing Areas and Resources and Modifying Regulation (EC) No 2847/93 and Repealing Regulations (EC) No 685/95 and (EC) No 2027/95. Off. J. Eur. Union 2003, L 289, 1–5.
  13. Delgado, J.; Amorim, A.; Gouveia, L.; Gouveia, N. An Atlantic journey: The distribution and fishing pattern of the Madeira deep sea fishery. Reg. Stud. Mar. Sci. 2018, 23, 107–111. [Google Scholar] [CrossRef]
  14. ICES. Working Group on the Biology and Assessment of Deep-Sea Fisheries Resources (WGDEEP); No. 40; ICES: Copenhagen, Denmark, 2022; Volume 4. [Google Scholar] [CrossRef]
  15. Council Regulation (EU) 2021/91 of 28 January 2021 Fixing, for the Years 2021 and 2022, the Fishing Opportunities for Union Fishing Vessels for Certain Deep-Sea Fish Stocks. Off. J. Eur. Union 2021, L 31, 20–30.
  16. Freitas, M.; Vieira, S.; Costa, L.; Delgado, J.; Biscoito, M.; González, J.A. First records of Chimaera opalescens (Holocephali: Chimaeriformes: Chimaeridae) from Madeira and north-west African coast. Acta Ichthyol. Piscat. 2017, 47, 81–84. [Google Scholar] [CrossRef]
  17. Severino, R.B.; Afonso-Dias, I.; Delgado, J.; Afonso-Dias, M. Aspects of the biology of the leaf-scale gulper shark Centrophorus squamosus (Bonnaterre, 1788) off Madeira archipelago. Arquipélago Life Mar. Sci. 2009, 26, 57–61. Available online: http://hdl.handle.net/10400.3/450 (accessed on 3 February 2024).
  18. Biscoito, M.; Ribeiro, C.; Freitas, M. Annotated checklist of the fishes of the archipelago of Madeira (NE Atlantic): I-Chondrichthyes. Zootaxa 2018, 4429, 459–494. [Google Scholar] [CrossRef] [PubMed]
  19. Nieto, A.; Ralph, G.M.; Comeros-Raynal, M.T.; Kemp, J.; García Criado, M.; Allen, D.J.; Dulvy, N.K.; Walls, R.H.L.; Russell, B.; Pollard, D.; et al. European Red List of Marine Fishes; Publications Office of the European Union: Luxembourg, 2015. [Google Scholar]
  20. Zar, J.H. Biostatistical Analysis, 5th ed.; Pearson Prentice-Hall: Upper Saddle River, NJ, USA, 2010. [Google Scholar]
  21. Clarke, M.W. Sharks, skates and rays in the northeast Atlantic: Population status, advice and management. J. Appl. Ichthyol. 2009, 25, 3–8. [Google Scholar] [CrossRef]
  22. Denney, N.H.; Jennings, S.; Reynolds, J.D. Life-history correlates of maximum population growth rates in marine fishes. Proc. R. Soc. B Biol. Sci. 2002, 269, 2229–2237. [Google Scholar] [CrossRef] [PubMed]
  23. Delgado, J.; Reis, S.; González, J.A.; Isidro, E.; Biscoito, M.; Freitas, M.; Tuset, V.M. Reproduction and growth of Aphanopus carbo and A. intermedius (Teleostei: Trichiuridae) in the northeastern Atlantic. J. Appl. Ichthyol. 2013, 29, 1008–1014. [Google Scholar] [CrossRef]
  24. Yildiz, T.; Ulman, A.; Karakulak, F.S.; Uzer, U.; Demirel, N. Bio-economic indicators of fisheries: Impact of variations in landings and fish size on market prices in Istanbul Fish Market. PeerJ 2023, 11, e15141. [Google Scholar] [CrossRef] [PubMed]
  25. ICES. Report of the Working Group on Elasmobranch Fishes (WGEF); ICES: Copenhagen, Denmark, 2024; Volume 6, Issue 75. [Google Scholar] [CrossRef]
  26. Roxo, A.; Mendes, S.; Correia, J. Portuguese Commercial Fisheries of Swordfish, Xiphias gladius. Rev. Fish. Sci. Aquacult. 2017, 25, 150–157. [Google Scholar] [CrossRef]
  27. Aranha, S.G.; Teodósio, A.; Marsili, T.; Pires da Rocha, P.; Modesto, T.; Guerreiro, P.M.; Tambutte, A.; Alves, A.; Relvas, P.; Dias, E. Under pressure: Deep-sea elasmobranchs experience high mortality and stress in a crustacean trawling fishery. Front. Fish. Sci. 2025, 3, 1473376. [Google Scholar] [CrossRef]
  28. Torres, P.; Cunha, R.T.; Rodrigues, A.S. The elasmobranch fisheries of the Azores. Mar. Policy 2016, 73, 108–118. [Google Scholar] [CrossRef]
  29. Capapé, C.; Ben Souissi, J.; Mejri, H.; Guelorget, O.; Hemida, F. The reproductive biology of the school shark, Galeorhinus galeus Linnaeus 1758 (Chondrichthyes: Triakidae), from the Maghreb shore (southern Mediterranean). Acta Adriat. 2005, 46, 109–124. Available online: https://hrcak.srce.hr/84 (accessed on 25 March 2024).
  30. Thorburn, J.; Neat, F.; Burrett, I.; Henry, L.A.; Bailey, D.M.; Jones, C.S.; Noble, L.R. Ontogenetic variation in movements and depth use, and evidence of partial migration in a benthopelagic elasmobranch. Front. Ecol. Evol. 2019, 7, 353. [Google Scholar] [CrossRef]
  31. Vasconcelos, J.; Sousa, R.; Henriques, P.; Amorim, A.; Delgado, J.; Riera, R. Two sympatric, not externally discernible, and heavily exploited deepwater species with coastal migration during spawning season: Implications for sustainable stocks management of Aphanopus carbo and Aphanopus intermedius around Madeira. Can. J. Fish. Aquat. Sci. 2020, 77, 124–131. [Google Scholar] [CrossRef]
  32. Campos, A.; Leitão, P.; Sousa, L.; Gaspar, P.; Henriques, V. Spatial patterns of fishing activity inside the Gorringe bank MPA based on VMS, AIS and e-logbooks data. Mar. Policy 2023, 147, 105356. [Google Scholar] [CrossRef]
  33. O’Keefe, M.; Bengil, E.G.T.; Palmer, J.L.; Beton, D.; Çağlar, Ç.; Godley, B.J.; Özkan, M.; Snape, R.T.E.; Broderick, A.C. Diversity and distribution of elasmobranchs in the coastal waters of Cyprus: Using bycatch data to inform management and conservation. Front. Mar. Sci. 2023, 10, 1181437. [Google Scholar] [CrossRef]
  34. Liu, K.M.; Huang, L.H.; Su, K.Y. Assessment of the impact on 20 pelagic fish species by the Taiwanese small-scale longline fishery in the Western North Pacific using ecological risk assessment. Animals 2022, 12, 2124. [Google Scholar] [CrossRef] [PubMed]
  35. Fauconnet, L.; Ribeiro, A.; Catarino, D.; Giacomello, E.; Das, D.; Morato, T.; Rosa, A.; Afonso, P. Guia dos Tubarões de Profundidade dos Açores; Publicações Científicas Okeanos: Ponta Delgada, Portugal, 2020; ISBN 978-989-99834-2-7. [Google Scholar]
  36. Cameron, L.W.; Roche, W.K.; Beckett, K.; Payne, N.L. A review of elasmobranch catch-and-release science: Synthesis of current knowledge, implications for best practice and future research directions. Conserv. Physiol. 2023, 11, coad100. [Google Scholar] [CrossRef] [PubMed]
  37. Bowlby, H.D.; Benoît, H.P.; Joyce, W.; Sulikowski, J.; Coelho, R.; Domingo, A.; Cortés, E.; Hazin, F.; Macias, D.; Biais, G.; et al. Beyond post-release mortality: Inferences on recovery periods and natural mortality from electronic tagging data for discarded lamnid sharks. Front. Mar. Sci. 2021, 8, 619190. [Google Scholar] [CrossRef]
  38. Lima, F.D.; Parra, H.; Alves, R.B.; Santos, M.A.; Bjorndal, K.A.; Bolten, A.B.; Vandeperre, F. Correction: Effects of gear modifications in a North Atlantic pelagic longline fishery: A multiyear study. PLoS ONE 2024, 19, e0315684. [Google Scholar] [CrossRef] [PubMed]
  39. Suuronen, P.; Gilman, E. Monitoring and managing fisheries discards: New technologies and approaches. Mar. Policy 2020, 116, 103554. [Google Scholar] [CrossRef]
  40. Stahl, J.P.; Tucker, J.B.; Hawn, L.A.; Bradford, A.L. The Role of Electronic Monitoring in Assessing Post-Release Mortality of Protected Species in Pelagic Longline Fisheries; U.S. Department of Commerce: Washington, DC, USA, 2023. [Google Scholar] [CrossRef]
  41. Chan, A.N.; Long, K.; Alger, B. Examining the Potential of Electronic Monitoring to Augment Protected Species Bycatch Data Collection; U.S. Department of Commerce: Washington, DC, USA, 2024. [Google Scholar] [CrossRef]
Figure 1. Landings in tonnes and economic value in thousand euros of total fisheries of the archipelago of Madeira, from 1990 to 2020.
Fishes 10 00358 g001
Figure 2. Madeira Island’s main fishing ports, with registered elasmobranch species landings.
Fishes 10 00358 g002
Figure 3. Total elasmobranch landings (tonnes), CPUE (tonnes/fishing trip), and mean annual price (kg/EUR), for all fisheries of Madeira Archipelago between 1990 and 2020.
Fishes 10 00358 g003
Figure 4. Total elasmobranch landings (tonnes) by fishing gear in the Madeira Archipelago, between 1990 and 2020. (a) Landings from mid-water drifting longlines, dominated by Centrophorus squamosus; (b) Landings from bottom longlines/pelagic longlines/handlines, showing a broader species’ diversity and lower overall landing volumes. Data illustrates gear-specific species composition and landings magnitude over the 30-year period.
Fishes 10 00358 g004
Figure 5. Annual elasmobranch landings (tonnes), CPUE (tonnes/fishing trip), and mean annual price (kg/EUR), in Madeira Archipelago, between 1990 and 2020. (a) Mid-water drifting longlines; (b) Bottom longlines/pelagic longlines/handlines.
Fishes 10 00358 g005
Figure 6. Annual elasmobranch landings by species (tonnes), CPUE (tonnes/fishing trip), and mean annual price (kg/EUR), in the Madeira Archipelago, between 1990 and 2020, performed by mid-water drifting longlines. (a) Centrophorus squamosus dominated landings with peaks between 2006 and 2012 and rising prices after 2015; (b) Dalatias licha; (c) Centroscymnus spp.; (d) Centrophorus granulosus; (e) Prionace glauca; and (f) Isurus oxyrinchus. Species from (bf) were landed in much lower quantities and sometimes sporadically. These trends reflect the gear’s species selectivity and variation in commercial value over time.
Fishes 10 00358 g006
Figure 7. Annual elasmobranch landings by species (tonnes), CPUE (tonnes/fishing trip) and mean annual price (kg/EUR), in Madeira Archipelago, between 1990 and 2020, performed by bottom longlines/pelagic longlines/handlines fisheries. (a) Galeorhinus galeus, (b) Raja spp., (c) Sphyrna zygaena, and (d) Mustelus mustelus. Elasmobranch landings from BLL/PLL/HL fisheries were dominated by G. galeus. Species from (bd) were landed in much lower quantities and sometimes sporadically.
Fishes 10 00358 g007
Figure 8. Monthly elasmobranch landings (tonnes), CPUE (tonnes/fishing trip) and mean price (kg/EUR), in the Madeira Archipelago, between 1990 and 2020. (a) Landings from mid-water drifting longlines; (b) Landings from bottom longlines/pelagic longlines/handlines. Histogram bars represent the total landed weight per month (cumulative across years), the solid line represents CPUE, and the dotted line shows the mean monthly price per kilogram.
Fishes 10 00358 g008
Figure 9. Monthly elasmobranch landings (tonnes), CPUE (tonnes/fishing trip), and mean annual price (kg/EUR), for landings from mid-water drifting longlines in the Madeira Archipelago, between 1990 and 2020. (a) Centrophorus squamosus, (b) Dalatias licha, (c) Centroscymnus spp., (d) Centrophorus granulosus, (e) Prionace glauca, and (f) Isurus oxyrinchus. Histogram bars represent the total landed weight per month (cumulative across years), the solid line represents CPUE, and the dotted line shows the mean monthly price per kilogram.
Fishes 10 00358 g009
Figure 10. Monthly elasmobranch landings (tonnes), CPUE (tonnes/fishing trip), and mean annual price (kg/EUR), for landings from bottom longliners/pelagic longliners/handliners in the Madeira Archipelago, between 1990 and 2020. (a) Galeorhinus galeus, (b) Raja spp., (c) Sphyrna zygaena, and (d) Mustelus mustelus. Histogram bars represent the total landed weight per month (cumulative across years), the solid line represents CPUE, and the dotted line shows the mean monthly price per kilogram.
Fishes 10 00358 g010
Figure 11. Landings (%) by vessel size, in the Madeira Archipelago, between 1990 and 2020. (a) landings from mid-water drifting longlines; (b) landings from bottom longlines/pelagic longlines/handlines (VL0012—vessel length inferior to 12 m; VL1218—vessel length between 12 and 17.99 m; VL1824—vessel length between 18 and 23.99 m; VL2440—vessel length between 24 and 39.99 m).
Fishes 10 00358 g011
Figure 12. Landings from mid-water drifting longlines (%) by vessel size, in the Madeira Archipelago, between 1990 and 2020. (a) Centrophorus squamosus, (b) Dalatias licha, (c) Centroscymnus spp., (d) Centrophorus granulosus, (e) Prionace glauca, and (f) Isurus oxyrinchus. (VL0012—vessel length inferior to 12 m; VL1218—vessel length between 12 and 17.99 m; VL1824—vessel length between 18 and 23.99 m; VL2440—vessel length between 24 and 39.99 m).
Fishes 10 00358 g012
Figure 13. Landings from bottom longlines/pelagic longlines/handlines (%) by vessel size, in the Madeira Archipelago, between 1990 and 2020. (a) Galeorhinus galeus, (b) Raja spp., (c) Sphyrna zygaena, and (d) Mustelus mustelus. (VL0012—vessel length inferior to 12 m; VL1218—vessel length between 12 and 17.99 m; VL1824—vessel length between 18 and 23.99 m; VL2440—vessel length between 24 and 39.99 m).
Fishes 10 00358 g013
Disclaimer/Publisher’s Note: The statements, opinions and data contained in all publications are solely those of the individual author(s) and contributor(s) and not of MDPI and/or the editor(s). MDPI and/or the editor(s) disclaim responsibility for any injury to people or property resulting from any ideas, methods, instructions or products referred to in the content.

