Article

The Temporal Dynamics of the Impact of Overfishing on the Resilience of the Sarotherodon melanotheron (Rüppel, 1858) Fish Species’ Population in the West African Lake Toho

by
Clovis Ayodédji Idossou Hountcheme
1,*,
Simon Ahouansou Montcho
1,
Hyppolite Agadjihouede
1 and
Doru Bănăduc
2,*
1
Laboratory of Animal and Fisheries Sciences (LaSAH), National University of Agriculture (UNA), Porto-Novo P.O. Box 5, Benin
2
Faculty of Sciences, Lucian Blaga University of Sibiu, 550012 Sibiu, Romania
*
Authors to whom correspondence should be addressed.
Fishes 2025, 10(7), 357; https://doi.org/10.3390/fishes10070357
Submission received: 21 May 2025 / Revised: 11 July 2025 / Accepted: 12 July 2025 / Published: 18 July 2025
(This article belongs to the Section Biology and Ecology)

Abstract

This research investigated the temporal dynamics of the anthropogenic impact of fishing pressure on the resilience of the fish species Sarotherodon melanotheron (Rüppel, 1858) in the African Lake Toho, located in southwest Benin. The sampling and analysis of monthly length frequency data were conducted from April 2002 to March 2003 and from April 2022 to March 2023 using the FAO-ICLARM Stock Assessment Tool (FiSAT II software program (version 1.2.2.). The analysis of the S. melanotheron population in Lake Toho revealed a significantly diminishing resilience potential, reflected mainly in general reductions in both the average size and weight of individuals. There was a notable reduction in the size of Sarotherodon melanotheron individuals caught between 2002–2003 and 2022–2023, reflecting the increased pressure on juvenile size classes. Catches are now concentrated mainly on immature fish, revealing increasing exploitation before sexual maturity is reached. An analysis of maturity stages showed a decrease in the percentage of mature individuals in the catches (69.27% in 2002–2003 compared to 55.07% in 2022–2023) and a reduction in the number of mega-spawners (4.53% in 2002–2003 compared to 1.56% in 2022–2023). Growth parameters revealed a decrease in asymptotic length (from 32.2 cm to 23.8 cm) and longevity (from 9.37 years to 7.89 years), while the growth coefficient slightly increased. The mean size at first capture and optimal size significantly declined, indicating increased juvenile exploitation. The total and natural mortalities increased, whereas the fishing mortality remained stable. The exploitation rate remained high, despite a slight decrease from 0.69 to 0.65. Finally, the declines in the yield per recruit, maximum sustainable yield, and biomass confirm the increasing fishing pressure, leading to growth overfishing, recruitment overfishing, reproductive overfishing, and, last but not least, a decreasing resilience potential. These findings highlight the growing overexploitation of S. melanotheron in Lake Toho, compromising stock renewal, fish population resilience, sustainability, and production while jeopardizing local food safety.
Key Contribution: This research offers insight into how the resilience of the Sarotherodon melanotheron (Rüppel, 1858) population in Lake Toho was impacted by local overfishing over two decades. The growth and yield of the targeted economically important blackchin tilapia are decreasing. The growing overexploitation of S. melanotheron in Lake Toho is compromising stock renewal, fish population resilience, sustainability, and production, jeopardizing local food safety. This paper proposes fast recovery management solutions for the lake as a whole and its fish populations.

1. Introduction

Among the aquatic ecosystem’s natural resources, fish are certainly one of the most valuable and irreplaceable [1,2,3,4,5]. However, the presence and activities of humans in watersheds have resulted in complex and highly variable impacts on aquatic ecosystems, particularly in warm climate zones [6]. The codependent relationships between global aquatic ecosystems and numerous natural and human-induced stressors are very complex and impact freshwater ecosystems [5,6,7,8] and their organisms, including fish, all around the world, including Africa [9,10,11,12]. As far as fisheries are concerned, global estimates reveal increasing overexploitation; fish landings from inland waters have increased by 400% since 1950, and many freshwater stocks are at risk of collapse [13,14]. In 2016, excluding aquaculture production, Africa’s inland capture production reached nearly 2.9 million tons, accounting for 25% of the global catches and ranking the continent second worldwide, following Asia [15]. Still, the main aim of fisheries management is to achieve sustainability concerning this resource [16]. The issues related to water and fish have a special resonance in the following group of countries: Burkina Faso, Mali, Niger, Ivory Coast, Ghana, Togo, and, last but not least, Benin [17]. In spite of some policies targeting overfishing and high fishing pressures being more or less successfully implemented in these countries, the negative effects outweigh the positive effects, as this research will highlight through its analysis of one important economic fish species in the studied area between 2002–2003 and 2022–2023.
In Africa, fish production is undergoing a critical phase, illustrating the growing pressure on fish stocks and highlighting their vulnerability to heavy fishing and overexploitation within this era of complex environmental change [17]. In Benin, continental fisheries, which account for approximately 80% of the national fish production, are marked by the common use of destructive fishing gears and practices [18]. This critical situation is exacerbated by environmental constraints that when combined with overfishing and the effects of climate change, accelerate the degradation of fish stocks in quantitative and qualitative terms. However, while several studies have highlighted the overexploitation of fish resources, few have specified the particular types of overexploitation affecting fish populations.
This situation is particularly observed in Sarotherodon melanotheron (Rüppell, 1858), a species endemic to West Africa, which has adapted to marine, lagoons, estuarine brackish, and freshwater environments in both native and non-native ranges [19,20,21]. West Africa is relatively abundant in many of these specific habitats [22]. Therefore, this species is naturally found in lagoons and estuaries from Côte d’Ivoire to Cameroon. In Lake Toho, located in the southwest of Benin in the Mono Department, this fish species dominates the catches, representing 92% of the total number of individuals and 95% of the total weight of the catch, making it a fishery resource of major economic importance [23]. This species forms schools and is nocturnal, making it easy prey for fishermen, particularly those who favor night fishing; Sarotherodon melanotheron (Rüppell, 1858) also feeds on periphyton and detritus as well as on bivalves and zooplankton [22]. The fish spawns in shallow water inshore [24], exposing its spawned individuals to fishing. The decline in fish resources in the lake, as reported by Codjo et al. [25], is a result of high fishing pressure on this key species. Some fishing practices, such as the use of the large “Congo” net, primarily target immature individuals that have not yet had the opportunity to reproduce [26]. Unfortunately, these overexploitation activities persist, with an increasing proportion of immature individuals found in the catches. In light of this situation, and due to the needed sustainable management of this fish, a temporal assessment of the impacts of fishing pressure on the stock structure of S. melanotheron over two distinct periods (2002–2003 and 2022–2023) was performed.
The main goal of this study is to analyze the impacts of overfishing pressure on certain aspects of the Sarotherodon melanotheron (Rüppel, 1858) population’s structural dynamics in Lake Toho, with the aim of proposing some future management practices to implicitly improve the resilience of the species, which refers to the capacity of fish to respond to environmental challenges [27], and the sustainability and productivity of the fishery, considering today’s aquatic environment.

2. Materials and Methods

2.1. Study Area

Lake Toho extends from 6°35′ to 6°40′ N latitude and from 1°45′ to 1°50′ E longitude during low-water (Figure 1). It has an average length of 7 km, a southern width of 2.5 km, and a northern width of about 500 m [28]. The lake has a crescent shape, oriented from south to north, and is surrounded by the districts of Kpinnou (Athiémé Municipality), Zoungbonou (Houéyogbé Municipality), and Houin (Lokossa Municipality). It is a part of the Western Complex, known as Ramsar Site 1017, within the Mono Basin. Lake Toho receives water from two major tributaries, the Diko and Atakpatohoun Rivers. A third waterway, the Kpacohadji Channel, serves as a tributary and an outlet.
According to Ahouansou Montcho and other researchers [29,30,31,32,33] and testimonies from several fishers, Lake Toho experienced a temporary drying event in 1978. The hydrological balance, which includes water inputs and losses as well as their distribution over time, is a key factor in the functioning of shallow ecosystems. In Lake Toho, water inputs mainly come from tributaries and rainfall, while losses result from outflows, evaporation, and infiltration.
Various fishing gears and techniques are continuously used in the lake by the local fisherman communities, some of which have devastating impacts on the fishery resources.

2.2. Fish Sampling and Data Analysis

As a part of this study, individuals of S. melanotheron were sourced from artisanal fishing methods, with monthly catches made at four landing sites (Kpinnou, Logbo, Douimè, and Hogbonou) during two distinct periods, spanning from April 2002 to March 2003 and from April 2022 to March 2023. During these two periods, the fishermen used the types of gear and fishing techniques described by Ahouansou Montho et al. [34]. These included small dipnets (“Sèguè”), large dipnets (“Congo” or “Kounkouin” or “Adjakpo”), gillnets (“Sito” or “Adoun” and “Awlè” or “Dokpoè”), Malian traps (“Goura”), fish traps (“Montocloué”), and single hooks (“Mlinvi”). Additionally, some fishermen practice hand fishing, known as “Olotouè”, using only their hands.
These fishing gears, which have been in use for at least two decades, are still employed by Lake Toho fishermen to exploit this population. Fish were identified using the identification key by Paugy et al. [35]. For each fish specimen, the total length (Lt) and total weight (Pt) were measured in centimeters and grams, respectively, using an ichthyometer and either an electronic balance by Kern (2002–2003) or a kitchen scale (2022–2023), both with a capacity and precision of 0.1 g. Additionally, the fish were dissected, and their gonadal development phase was determined macroscopically before being classified according to the stages described by Micha [36] and modified by Laleye [37] (2002–2003) and Brown-Peterson et al. [38] (2022–2023). Gonads were collected and weighed to the nearest 0.01 g on a Kern electronic balance for both study periods.
According to Brown-Peterson, the following classifications were used [38]: Stage I—“immature” (very small ovaries/testes, often clear and threadlike); II—“developing” (expanding ovaries; small testes but easily identifiable); III—“spawning capable” (large ovaries, individual oocytes visible macroscopically; large and firm testes, actively spawning; milt released with light abdominal pressure); IV—“regressing” (flaccid ovaries; small, flaccid testes; no milt released by pressure); and V—“regenerating” (small ovaries; small testes, often threadlike). During the first and second periods, 3511 and 9161 individuals of S. melanotheron were measured, respectively.
The difference in sample sizes between 2002–2003 and 2022–2023 is mainly explained by several factors: First, human resources have improved; in 2022–2023, sampling was carried out with the support of two assistants, allowing for a more effective coverage of sampling sites and a greater volume of data collection.
Second, awareness campaigns led by agents of the Departmental Directorate of Agriculture, Livestock, and Fisheries of Mono (the department where Lake Toho is located) helped to foster better collaboration with fishers. Now being more aware of the scientific value and the need to protect declining fishery resources, fishers are more willing to voluntarily bring fish specimens to our laboratory. Refusing these contributions could jeopardize ongoing cooperation.
Lastly, the data were collected as a part of a doctoral research project, requiring a solid and representative dataset in order to support relevant recommendations for the authorities responsible for the sustainable management of the lake.

2.3. Data Organization

The ANOVA test (Analysis of Variance) was used to assess whether there were significant differences between the study periods regarding the mean total length and mean total weight of S. melanotheron individuals, regardless of sex. This statistical test helps to determine whether the observed variations in the means are attributable to effects related to the sampling period or simply to random variation.
The ANOVA test was used to compare the total length (Lt) values of female individuals in the subpopulation with those of male individuals in order to detect any potential growth dimorphism related to sex, a common biological phenomenon in fish [39,40,41]. The Lt values were organized into classes. The class amplitude was determined using Sturges’ formula [42]: Number of classes = 1 + (3.3 × log N). The amplitude (a) of each class is calculated using the formula a = X m a x X m i n N u m b e r   o f   c l a s s , where N, Xmax, and Xmin are the sample size, maximum value of the total length, and minimum value of the total length, respectively.
After amplitude determining, the Lt values were grouped in 2 cm class intervals.

2.3.1. Size at First Sexual Maturity (Lm50) and Sexually Mature Fish

The size at first sexual maturity (L50) is considered to be the average size at which 50% of the fish reaches maturity (phases III–V). This is determined from the sigmoid curve of the evolution of the proportion (p) of mature fish plotted as a function of the length (Lt). The logistic sigmoid model is its graphical representation [43,44] as follows:
p = ( e ( a + b L t ) 1 + e ( a + b L t ) ) , where p is the percentage of mature fish relative to all the fish of a certain size (Lt), and a and b are specific model coefficients. The a and b coefficients’ curve were obtained by the logarithmic transformation of the equation following Dagnelie’s method [45]: p = X 1 + X or x = e ( a + b L t ) . Thus, l n ( P 1 P ) = a + bLt, and L50 was obtained using the formula L50 = (−a/b) by substituting p = 50% into the equation.

2.3.2. Sexually Mature Fish in the Catches

The percentage of sexually mature fish (%Pm) in each size class for a given catch was determined by setting the maturity threshold to stage III, corresponding to vitellogenesis and gonad maturation [46]. The percentage of mature fish (%Pm) in a given month was calculated using the formula %Pm = n N 100 , where n and N are the number of mature individuals in the sample and the total number of individuals in the sample, respectively.
Statview software (Version 1992-98 SAS Institute INC) and Excel spreadsheets were used to calculate the observed proportion of mature fish, the estimated proportion, and coefficients a and b of the model.

2.3.3. Estimation of Growth Parameters

The FiSAT II program integrates the routine ELEFAN I program through the frequency distribution of the lengths and was used to determine the growth parameters, including L∞, K, and Φ’ [29,41,47,48]. The von Bertalanffy model (1948) was used to study growth (body length as an age function) through the equation Lt = L∞ (1 − e k ( 1 t 0 ) ), where Lt, L∞, K, and t0 are the length of the fish at age t (cm), asymptotic length (cm), growth coefficient or growth rate (year−1), and theoretical age at zero size, respectively. The growth performance index (Φ’) was calculated from the growth parameters (L∞ and K). This performance index was evaluated using the formula proposed by Pauly and Munro [49], with the equation Φ’= log10K + 2log10L∞. The theoretical age (t0) was obtained from Pauly’s equation [50]: log10 (−t0) = −0.392 − 0.275 log10 L∞ − 1.038 log10 K. The potential longevity (tmax) was calculated using the formula tmax = 3/K [51].

2.3.4. Mortality and Exploitation Rates

The total mortality (Z) was obtained using the catch curve method based on lengths converted in ELEFAN I/FiSAT II, following the formula by Gayanilo et al. [47], ln (N/∆ti) = a + bti, where N, ∆ti, t, and b are the number of fully recruited fish in the size class (i), the time required for the fish to develop within the size class (i), the mean age of the fish in the length class with a population of N, and the slope representing the total mortality with a sign change, respectively.
The natural mortality rate (M) was estimated using the empirical formula by Pauly [50]. Thus, we have log10 (M) = a − b log10 (L∞) + c log10 (k) + d log10 (T), where a = −0.0066, b = 0.279, c = 0.6543, d = 0.4634, M = the natural mortality rate (year−1), and T = the mean annual water temperature (°C) of the studied environment. The fishing mortality rate (F) was also estimated using Pauly’s formula [50]: F = Z − M. The exploitation rate (E) was determined using the formula by Gulland [52]: E = F/Z.
According to Gulland [52], the exploitation rate helps to evaluate the stock’s condition based on the different values it can take. Thus, if E = 0.5, the exploitation is optimal; if E < 0.5, the stock is underexploited, and if E > 0.5, the stock is overexploited.

2.3.5. Size at First Capture (Lc50 and the Optimal Length (Lopt))

The size at which 50% of the fish from both sexes enter the exploitable stock (Lc50) was determined based on the capture probabilities. The FiSAT II software program (version 1.2.2.) of FAO facilitates the estimation of Lc50, which is a selectivity parameter. Specifically, through a logistic curve, points are selected for regression based on the following equation: ln ((1/PL)−1) = S1 − S2*L, where PL is the capture probability for length L, S1 and S2 are variables used to estimate the capture probability in the logistic model, and Lc50C = S1/S2.
The optimal size or optimal length for a given age class is estimated according to Froese’s equation [20], L o p t = L 3 3 + M K , where L∞ and K are parameters of the von Bertalanffy growth function, and M is the instantaneous rate of natural mortality.

2.3.6. Relative Yield per Recruit (Y’/R) and Relative Biomass per Recruit (B’/R)

The FiSAT II software program (version 1.2.2.) was used to determine the yield per recruit. It is based on the Beverton and Holt [53] model and calculated using the formula Y’/R = EUM/K [1 ( 3 U ) ( 1 + m ) + 3 U 2 ( 1 + 2 m )   ( U 3 ) ( 1 + 3 m ) ] with m = ( 1 E ) M / K , and U = 1    L 50 C L , E = F / Z , where E = the exploitation rate, U = a measure of the proportion of the potential growth of a fish, M = the natural mortality rate, K = the growth rate, m = the mesh size, Lc50 = the size at first capture, and L∞ = the asymptotic length. This model allows for an evaluation of the exploitation of fishery resources. The relative biomass per recruit is given by B’/R = ( Y / R ) F .

2.3.7. Yield per Recruit (Y/R) and the Maximum Sustainable Yield (MSY)

The yield-per-recruit (Y/R) model, based on the Beverton and Holt [53] model and simplified by Gilbert et al. [54], is used to estimate the fishery production. The fundamental equation used in Y/R calculations derives from d Y t d t = F t . N t . W t , the differential function expressing the instantaneous production rate of a cohort, where Yt, Ft, Nt, and Wt are the total production of a cohort from recruitment to time t, the instantaneous fishing mortality coefficient at time t, the number of survivors at time t, and the average weight of the survivors at time t, respectively.
The population evolves exponentially within each time interval between ti and ti + 1, leading to the equation Ni + 1 = Ni. e F i + M i ( t i + 1 t i ) . The catch over the interval is then given by Yi = t i t i + 1 F i . N i . e ( F i + M i ) ( t i + 1 t i ) . W i , which simplifies to Yi = F i Z i . N i W i . ( 1 e Z i ) . Thus, the total catch is Yt = i = 1 n Y i , representing the yield per recruit.
The maximum sustainable yield (MSY) was determined using the Thompson and Bell method [55]. In the FiSAT II software program (version 1.2.2.), the Y/R model of Beverton and Holt [53] is combined with elements of the Virtual Population Analysis (VPA) in an inverse approach. The total yield (Y = ΣYi) is calculated as follows: Yi = Ci·wi, in which the bodyweight (Wi) is given by Wi = (1/Li+1 − Li) (a/b + 1) (Li+1 b+1 Li b+1), where a and b are the coefficients of the length–weight relationship, and Li and Li+1 are the lower- and upper-size class limits, respectively. Additionally, we have Ci = (Ni − Ni+1) (Fi/(M + Fi)), where the predicted population size (Ni) is given by Ni+1 = Ni.EXP (−(M + Fi). ∆ti), with ∆ti = (1/K) ln ((L − Li)/(L − Li+1)). This framework provides a quantitative approach for assessing fishing efforts and their impact on the stock’s sustainability.

2.3.8. Justification for the Use Micha’s Scale in 2002–2003 and Brown-Peterson’s Scale in 2011

This choice was made in the spirit of scientific integrity and methodological consistency. The gonadal maturity stages for the 2002–2003 data were determined using Micha’s scale (1973), in accordance with the standards available at the time. In contrast, the more recent scale by Brown-Peterson et al. [38] was applied to the 2022–2023 data due to its greater precision and its widespread use in the recent scientific literature.
It should be noted that the two approaches are not fundamentally different. Micha’s scale is based on macroscopic morphological criteria, such as gonad size, color, and turgidity. Brown-Peterson’s scale incorporates these criteria and adds histological observations, such as the presence of vitellogenic or atretic oocytes. Therefore, while the two scales differ in their level of detail, they remain consistent in their descriptive logic of gonadal development stages.

2.3.9. Water Temperature

In Benin, more specifically, in the Lake Toho region (Mono Department), the air temperature has shown little variation, as indicated by the data collected between 1993 and 2023 from the National Meteorological Agency. This stability is also reflected in the water temperature. In 2002–2003, the average water temperature was 28.80 °C, compared to 28.82 °C in 2022–2023. For analytical consistency, the FiSAT II software program (version 1.2.2.) retained a temperature of 28.80 °C for both study periods.

3. Results

3.1. Structural Characteristics of the S. melanotheron Population

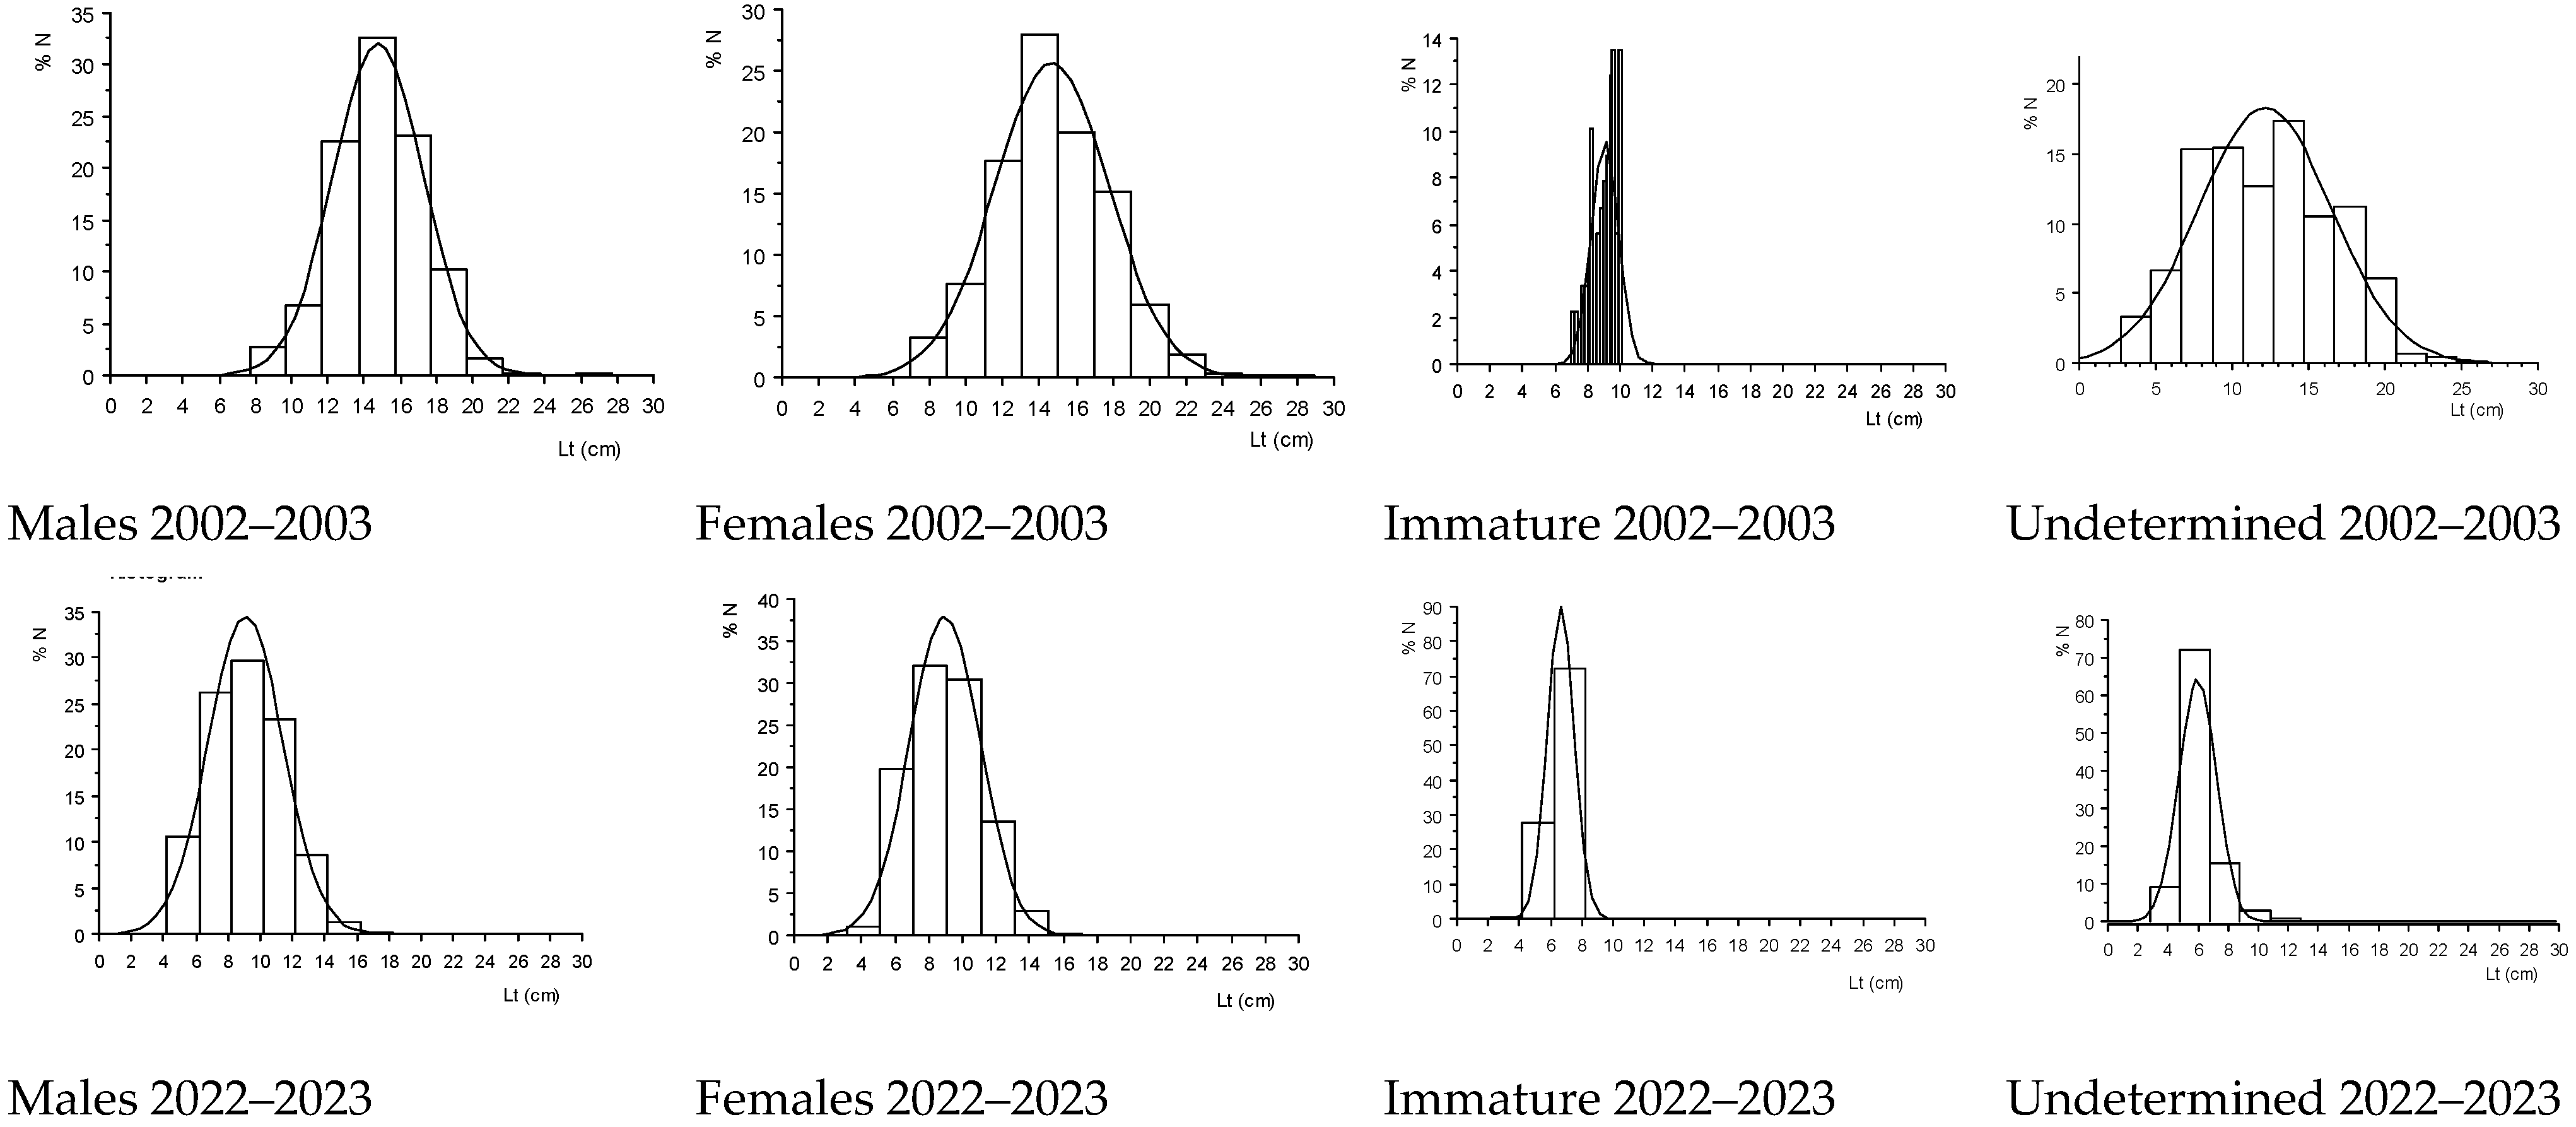
As shown in Figure 2, between 2002–2003 and 2022–2023, the catch structure of S. melanotheron underwent a significant transformation (Table 1), revealing increased pressure on smaller-size classes. Among males, the majority of the fish caught measured between 12 cm and 18 cm and between 9 cm and 11 cm in 2002–2003 and 2022–2023, respectively, indicating a marked decline in the sizes exploited.
For females, the fishing catches were mainly dominated by individuals between 10.5 cm and 16.5 cm and between 5.5 cm and 10.5 cm in 2002–2003 and 2022–2023, respectively, reflecting the intensified pressure on younger specimens.
Immature individuals measured between 10.5 cm and 15 cm in 2002–2003, reducing to between 6 cm and 8 cm in 2022–2023, which indicates the increased fishing pressure on individuals before they reach maturity.
Fish which sex could not be determined were previously dominated by sizes ranging from 6.5 cm to 15 cm in 2002–2003 and within the narrower range from 5 cm to 6.5 cm in 2022–2023, highlighting a drastic shift in the structure of the exploited populations.
These changes indicate a shift in the sizes of captured fish toward younger classes, demonstrating the cumulative effects of the fishing pressure on the availability and population dynamics of Sarotherodon melanotheron.
The average total length and average total weight significantly decreased. For females, the average length and weight decreased from 14.67 cm to 8.96 cm and from 68.88 g to 16.17 g, respectively; for males, the average length and weight decreased from 14.78 cm to 9.09 cm and from 63.57 g to 16.86 g. The total number of females, males, immature individuals, and individuals classified as undetermined reported between April 2022 and March 2023 is 9158.
Furthermore, a population-level comparison shows that the average total length decreased from 14.67 cm in 2002–2003 to 8.96 cm in 2022–2023, with the average total weight of S. melanotheron individuals decreasing from 68.88 g to 16.86 g over the same period (Figure 3).

3.1.1. Size at First Sexual Maturity (Lc (Lm50))

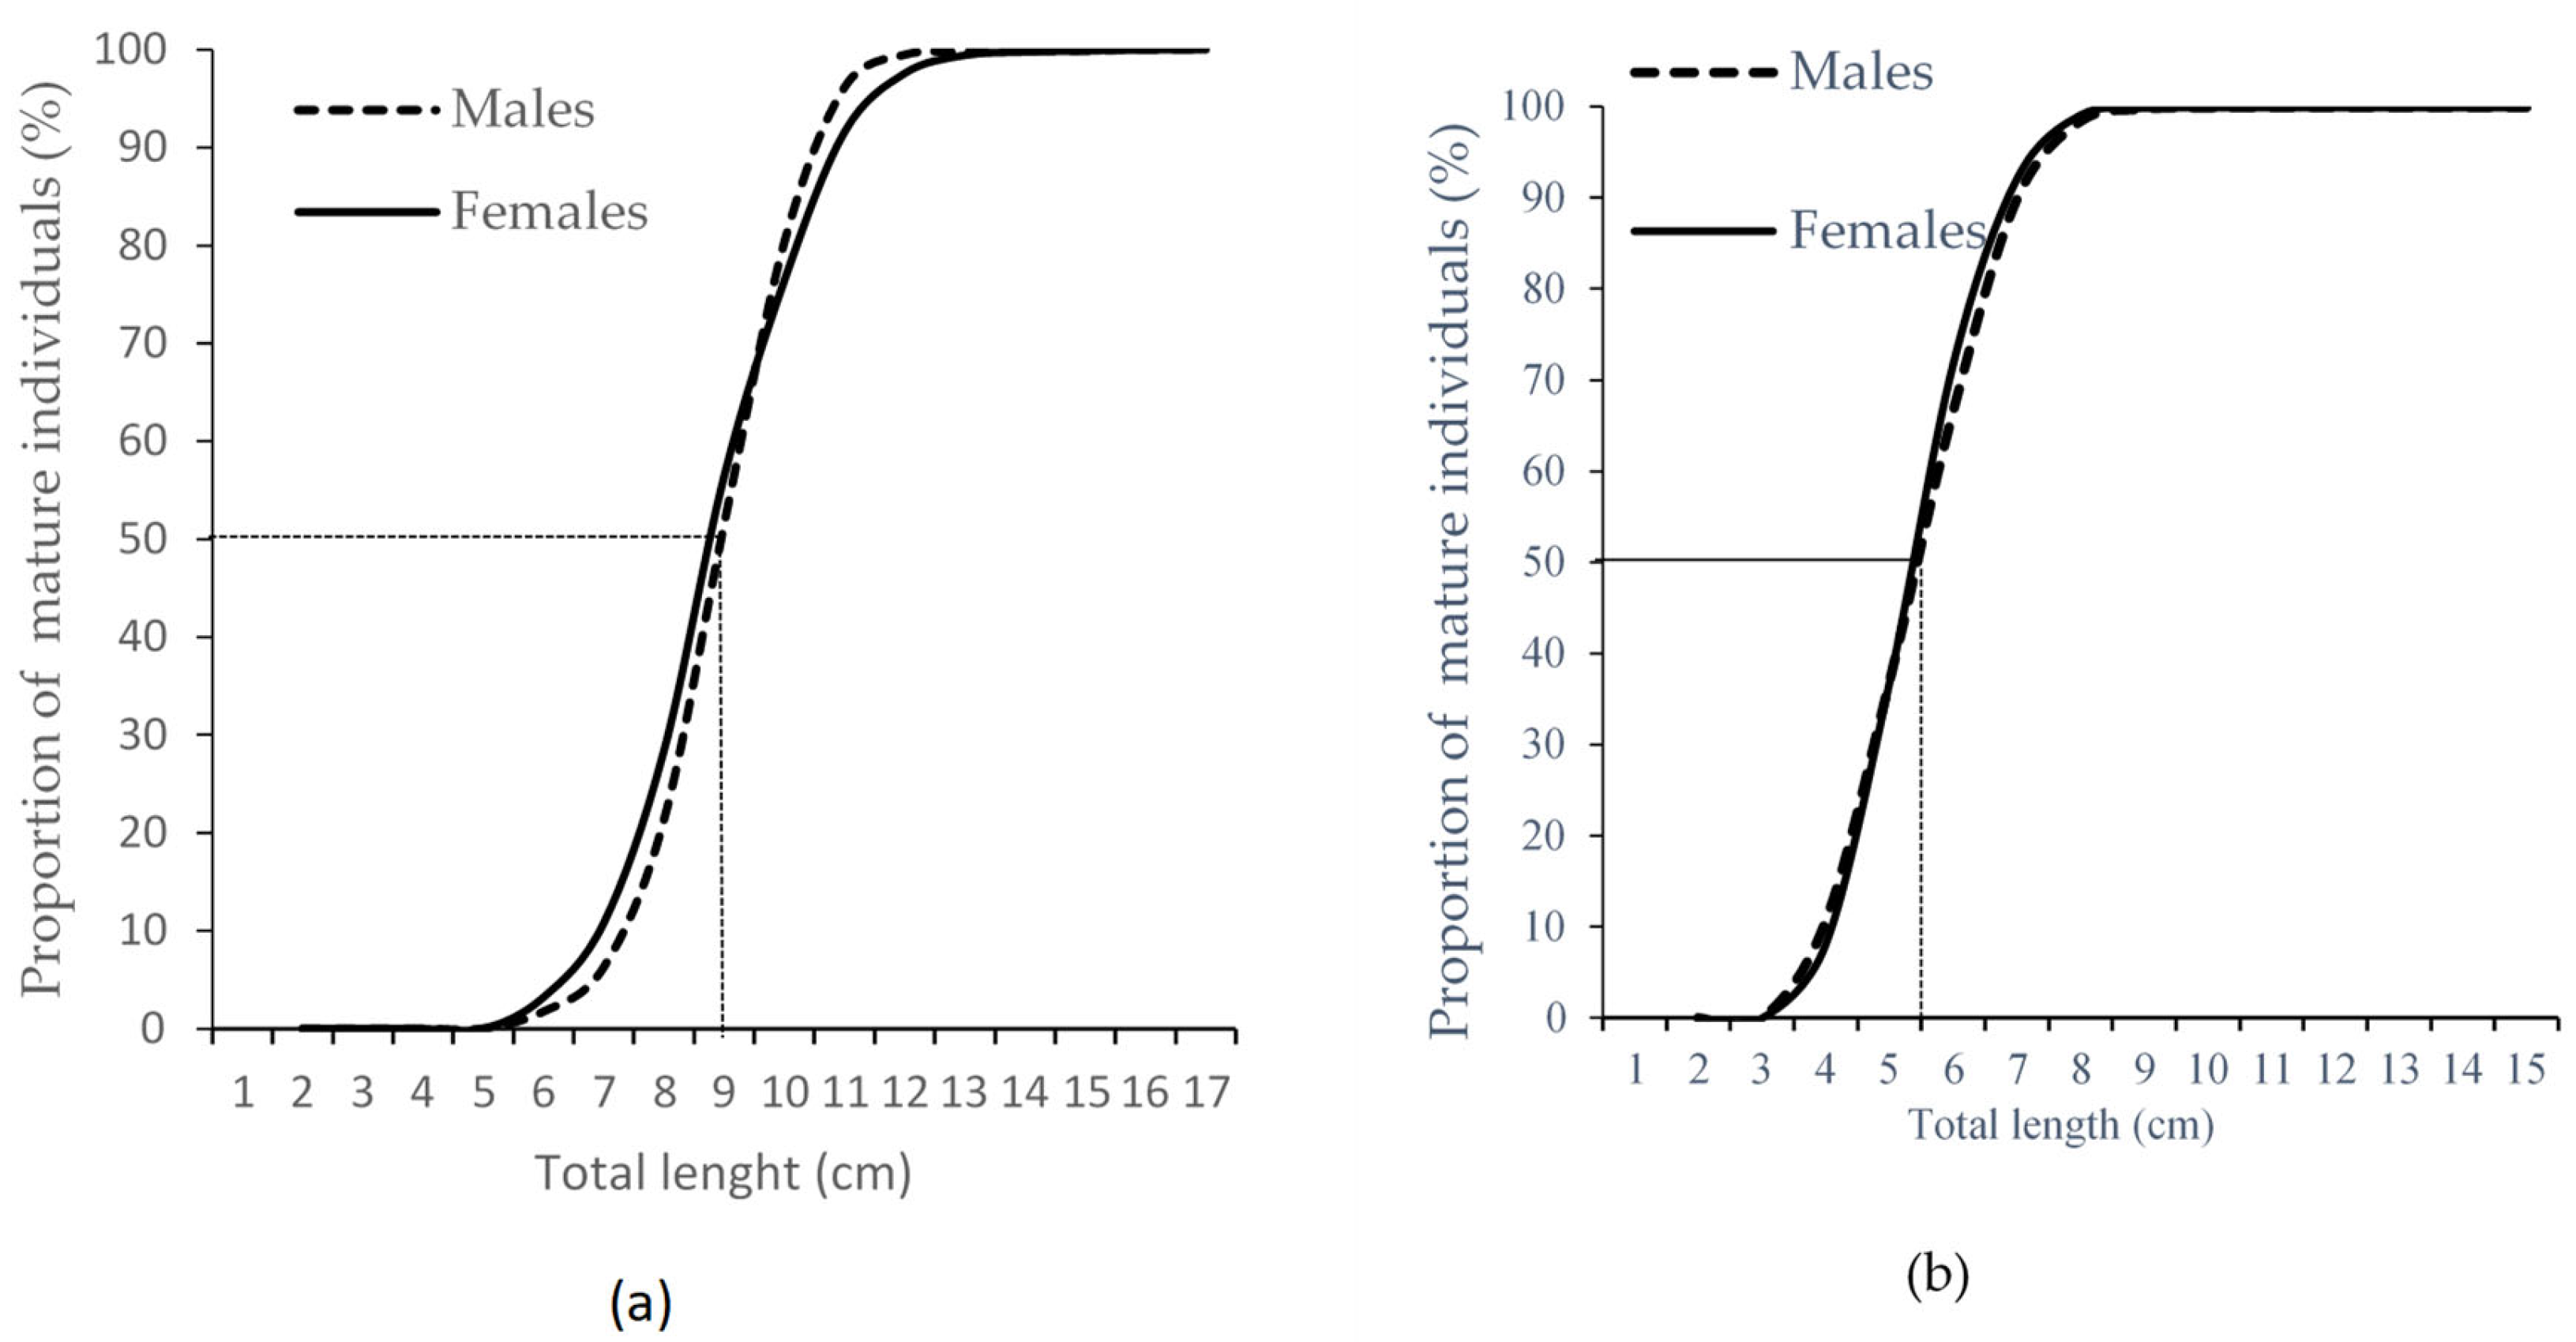
During the study, the size of S. melanotheron at first sexual maturity in Lake Toho showed a major reduction between 2002–2003 and 2022–2023. For males and females, it decreased from 8.50 cm to 5.0 cm and from 8.10 cm to 5.0 cm, respectively (Figure 4).
The chi-squared test was used to compare the distributions of the sexual maturity stages of S. melanotheron between two distinct periods (2002–2003 and 2022–2023).
In general, all the maturity stages were observed during this study. Table 2 presents the absolute frequencies of S. melanotheron individuals according to maturity stages during the two study periods. The data show a significant variation in the distribution of the maturity stages over the years, with totals of 1853 and 8539 individuals recorded in 2002–2003 and 2022–2023, respectively. The chi-squared test reveals a statistically significant difference between the two periods, with a p < 0.0001.
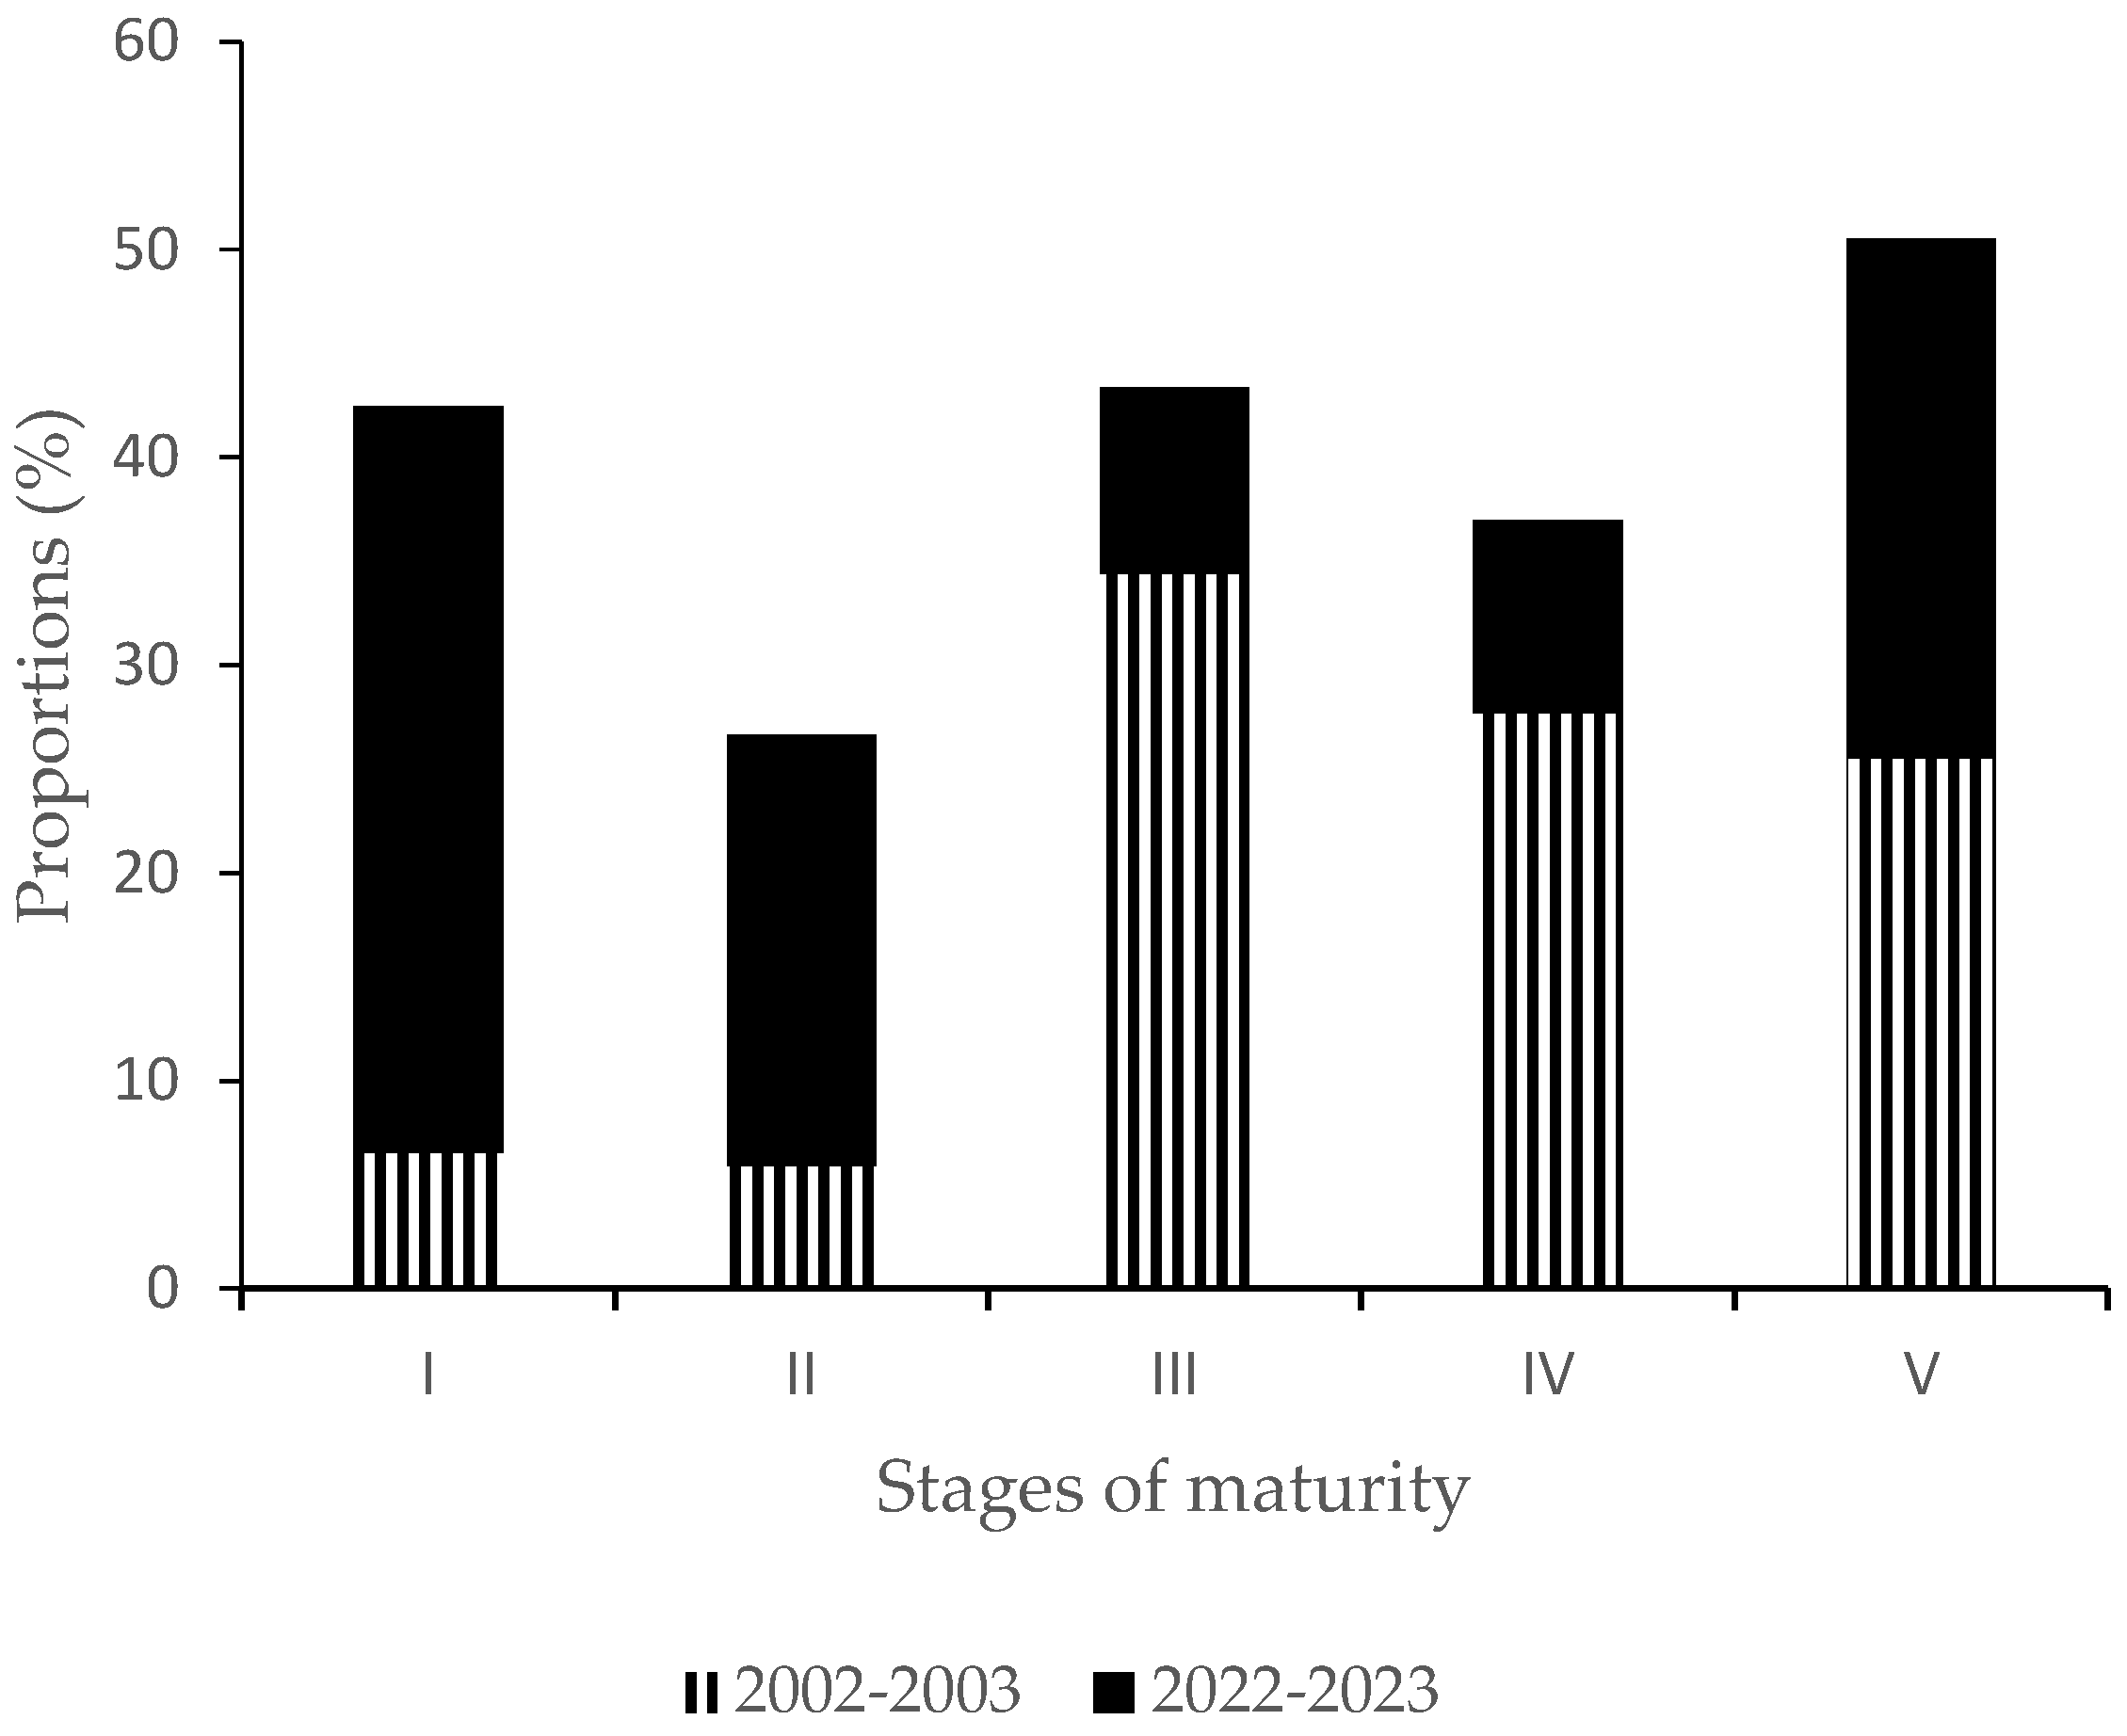
The relative frequencies of the maturity stages of the individuals (Figure 5) show a statistically significant difference (p = 0.0018) in terms of their distributions during the two study periods, as indicated by 87.58%/43.30%. Mature individuals are those at stages III, IV, and V, while individuals at stages I and II are considered as immature [38].

3.1.2. Percentage of Sexually Mature Fish in Catches

The trend in the percentage of individuals exceeding the optimal size by more than 20% is summarized in Table 3. These mega-spawners had an estimated length of 19.40 cm and 13.75 cm in 2002–2003 and 2022–2023, respectively. Analyzing the table reveals that the percentage of the mega-spawners in the total catches remained below 20% during both study periods. In 2002–2003, the proportion of the mega-spawners in the catches was 4.53%, compared to 1.56% in 2022–2023, indicating a sharp decline.

3.1.3. Estimation of Growth Parameters

The growth parameters of S. melanotheron were assessed for the different periods to highlight the changes over time (Table 4). Looking at the two time periods (2002/2022), the asymptotic length (L∞) decreased from 32.2 cm to 23.8 cm, while the growth coefficient (K) increased from 0.32 year−1 to 0.38 year−1. The theoretical age (t0) showed a slight variation (−0.50 years/−0.44 years), and the estimated maximum longevity (tmax) declined from 9.37 years to 7.89 years. Similarly, the growth performance index (Φ’) decreased from 2.53 to 2.33, reflecting changes in the species’ growth dynamics.

3.1.4. First-Capture Sizes (L50C) and Optimal Lengths (Lopt)

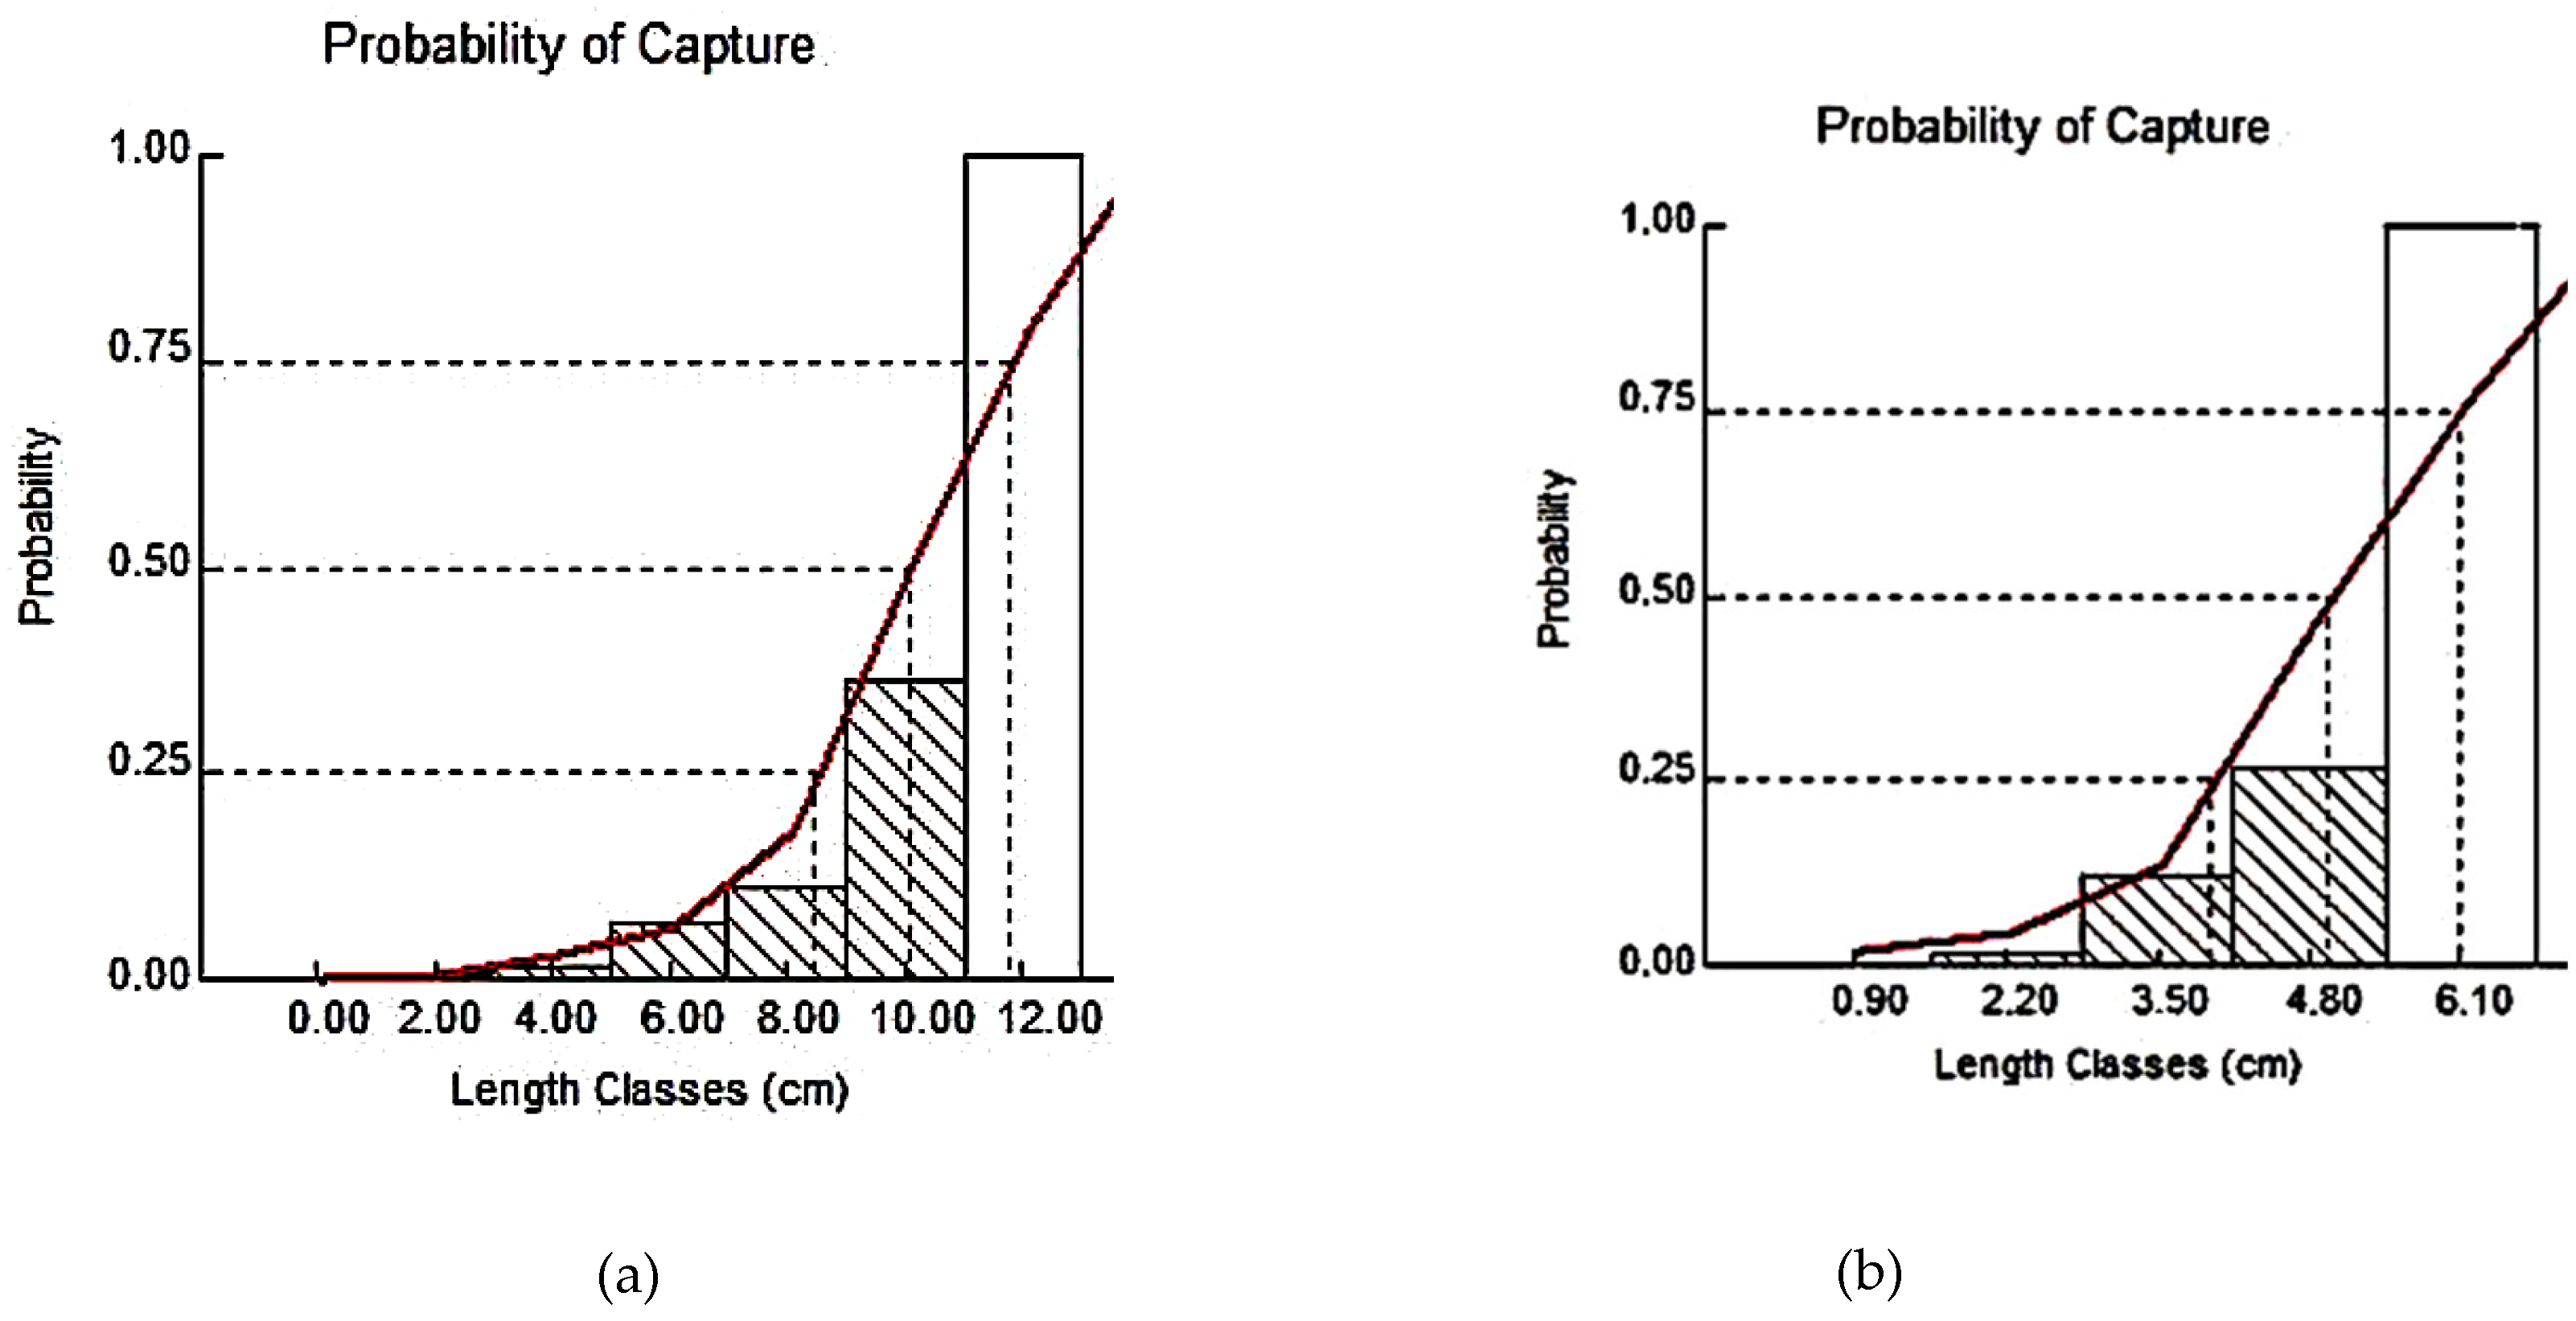
The lengths (L25, L50, and L75) correspond to the probabilities of capturing 25%, 50%, and 75% of the individuals of the species, respectively. Thus, the average first-capture sizes (Lc50) in 2002/2022 were 10.06 cm/4.97 cm (Figure 6). In 2002–2003, the optimal length of S. melanotheron individuals was 17.7 cm; however, in 2022–2023, this decreased to 12.50 cm.

3.1.5. Mortality and Exploitation Rates

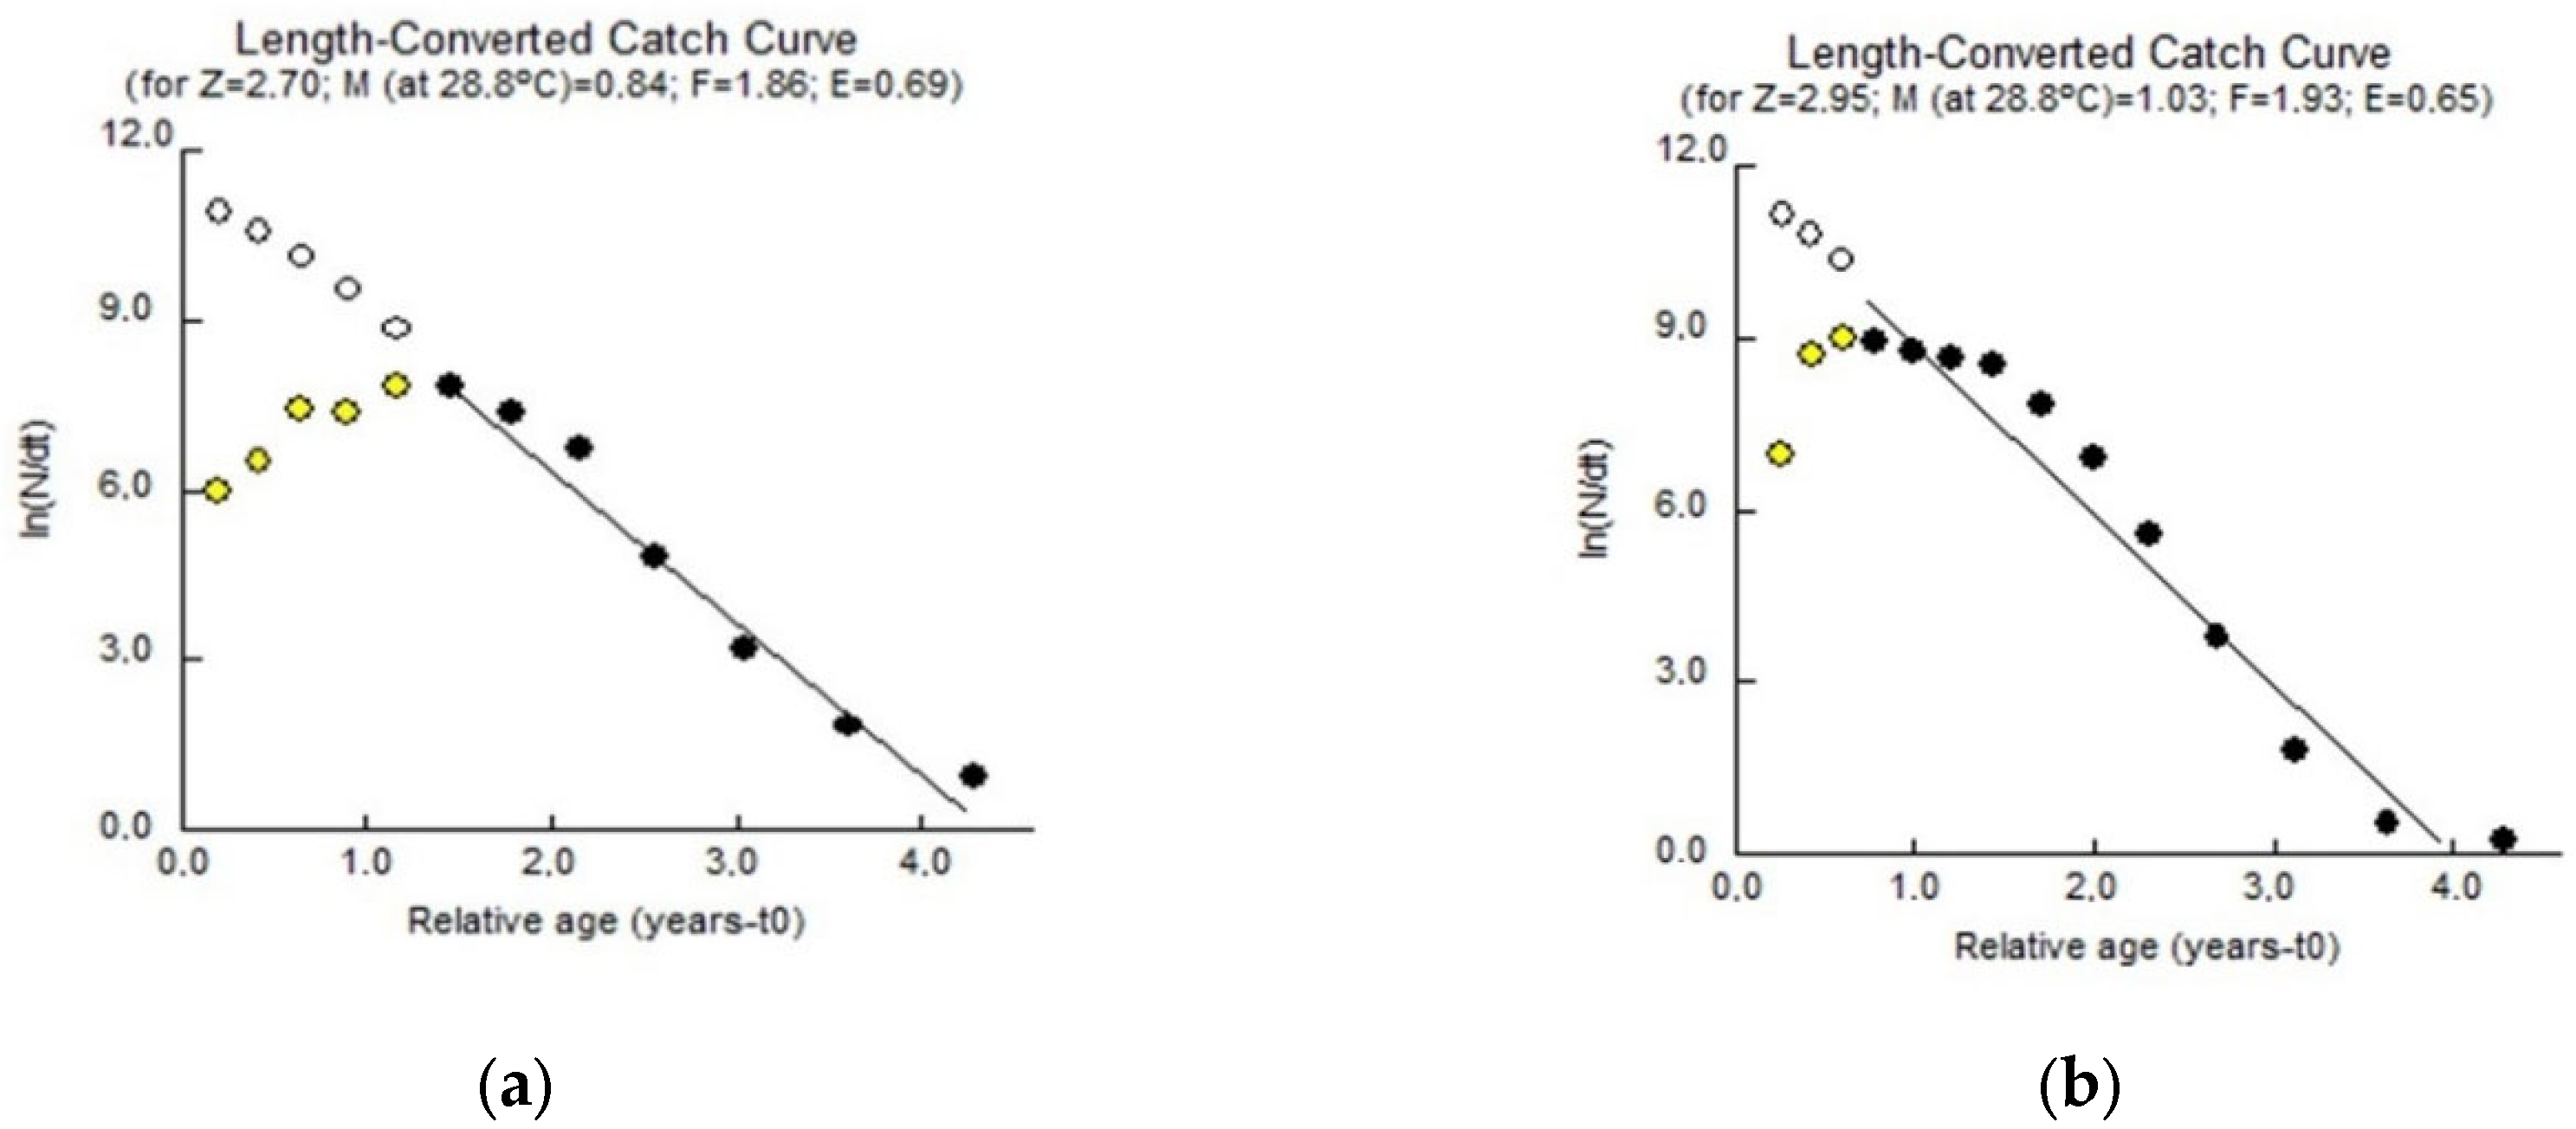
The estimated mortality rates are derived from the length-converted catch curve (Figure 7). In 2002–2003 and 2022–2023 (2002–2033/2022–2023), the total mortality rate (Z), natural mortality rate (M), fishing mortality rate (F), and exploitation rate (E) were 2.70 year−1/2.95 year−1, 0.84 year−1/1.03 year−1, 1.86 year−1/1.92 year−1, and between 0.69 and 0.65, respectively. In 2002–2003 and 2022–2023 (2002/2022), the M/K ratios were 2.63 and 2.71, respectively. The Lc/L∞ ratio during the study period was 0.31/0.20. Table 5 and Table 6 provides a summary of the exploitation parameters.

3.1.6. Relative Yield Per Recruit (Y’/R) and Relative Biomass Per Recruit (B’/R)

The average weight produced by each recruited individual in the population and the quantity of adult fish available for reproduction per recruit are illustrated in Figure 8. The results indicate that in 2002–2003 and 2022–2023 (2002/2022), the relative yields per recruit (Y’/R) were 0.011/0.008. In 2002/2022, the relative biomasses per recruit (B’/R) were 0.074/0.091 (Figure 8).

3.1.7. Maximum Sustainable Yield (MSY)

The maximum sustainable yield (MSY) is illustrated in Figure 9, representing the highest biomass that can be constantly extracted from the available stock without affecting the reproducion. This biological indicator is associated with the Biomass at the Maximum Sustainable Yield (BMSY) and the Fishing Mortality Rate at the Maximum Sustainable Yield (FMSY). In 2002–2003 and 2022–2023 (2002/2022), the MSY values were 679,427 kg/551,159 kg, respectively. During these periods, the associated BMSY values were 837,790 kg/628,870 kg, respectively. The FMSY values were 0.60 year−1/0.50 year−1, respectively. The expected yield per recruit in 2002–2003 was 543,202 kg, corresponding to a fishing mortality rate of 1.86 year−1. This yield per recruit decreased to 355,067 kg in 2022–2023, with a fishing mortality rate of 1.92 year−1 (Figure 9).

4. Discussion

Fish population assessments are a fundamental aspect of fisheries science, aimed at maximizing fishery yields while ensuring the long-term resilience and sustainability of stocks and their ecosystems [55]. This assessment becomes particularly crucial when the size of catches declines, rising concerns about excessive resource exploitation.
Between 2002–2003 and 2022–2023, the decreases in the average size and weight of Sarotherodon melanotheron individuals in Lake Toho reflect a structural change in the population. This shift may result from multiple factors, including environmental variations, physiological adaptations of the species to exploitation conditions, and increasing fishing pressure. Indeed, several authors [64,65,66,67] consider the reduction in the average fish size within a population to be a common indicator of stock overexploitation. Overexploitation can take different forms. According to Pauly [18] and Christensen et al. [68], growth overfishing occurs when fish are harvested before reaching their optimal size for capture. The analysis of the size at first capture (Lc50) in 2002–2003 and 2022–2023, both of which were lower than the optimal sizes (Lopt), confirms the prevalence of this phenomenon in Lake Toho, thereby limiting population yields. This type of overfishing is also evidenced by lower yields per recruit than the maximum sustainable yields for both periods, as well as a decreasing trend in the relative yield per recruit over time. The declines in the asymptotic length (L∞) and maximum longevity (tmax) and the reduction in the performance index (Ø’) are attributable to the fishing pressure. However, the slight increase in the growth coefficient (K) could be a response to a shorter lifespan, likely due to high fishing mortality rate. Additionally, the Z/K ratio being greater than 1 in both 2002–2003 and 2022–2023 confirms that mortality outweighs growth [69]. According to Pauly et al. [18], when fish are subjected to intensive exploitation, the fishing mortality rate can become predominant, leading to a significant increase in the total mortality rate compared to the growth coefficient. Despite these changes caused by increasing the fishing pressure, the growth parameters of S. melanotheron remain close to those observed in several African water bodies (Table 5). However, alterations in biological parameters have significant consequences for the dynamics of exploited populations. According to the FAO [70], harvesting fish stocks below the maximum sustainable yield threshold not only harms biodiversity and ecosystem functioning but also reduces fishery production. This, in turn, negatively impacts the social and economic well-being of fishing communities.
This situation explains the declining fish resources widely reported by fishers and the gradual reductions in the contributions of fisheries to food security, nutrition, the economy, and the well-being of fishing-dependent communities. Fishing plays a significant role in ensuring food security; the production of several relatively new localities can supply major urban centers, while traditional fisheries support rural areas [71]. An analysis of the factors contributing to the degradation of fishery resources shows that the lakes can be overexploited due to the intensification of fishing activities, poor fishing practices, the establishment of illegal fishing camps, and the weak enforcement of regulations, leading to progressive declines in fish stocks [72]. In a relatively similar lake to Lake Toho, namely, the Ahémé Lake, the stock of S. melanotheron is overexploited, requiring protective measures, including ecosystem restoration through the systematic removal of destructive fishing gear and techniques, enforcement actions, raising awareness among local populations about sustainable fishing methods, and creating biological reserve areas where fishing is prohibited to preserve breeding grounds and ensure the continuous removal of fish stocks [73]. Also, according to Kantoussan [74], in the Sélingué Lake, following a K-strategy, large-sized species have become rare in fish landings, now being dominated by small-sized, low-biomass species due to an r-strategy, thus posing a threat to food security in the region.
Furthermore, this form of overfishing compromises recruitment, thereby threatening stock renewal. When too many juveniles are caught before reaching sexual maturity, reproduction becomes insufficient to compensate for fishing-induced losses. Additionally, intense fishing pressure can alter fish reproductive behavior. Pulin [73] highlights that in cichlids, including S. melanotheron, neoteny promotes early maturation, allowing for rapid reproduction despite reductions in the average sizes of individuals. Thus, the observed decrease in size at first sexual maturity in S. melanotheron from Lake Toho could be an adaptive response to this pressure. Indeed, according to Anderson et al. [75] and Miethe et al. [76], under fishing pressure, individuals tend to reach sexual maturity at smaller sizes, as natural selection favors those that reproduce earlier to maximize their offspring before being captured. Despite this adaptation, recruitment overfishing can occur when the size at first capture (Lc50) remains below the size at first sexual maturity (Lm50), with a percentage of sexually mature fish below the 100% reference target [22,58,77,78]. The sizes at first capture in 2022–2023 were lower than the sizes at first sexual maturity for both male and female S. melanotheron individuals. This situation unequivocally indicates that this species’ population is currently undergoing recruitment overfishing, exacerbated by the use of prohibited fishing habits, gears, and techniques, including fine-mesh dipnets ranging from 5 mm to 30 mm.
Previous observations of this species reported by Lederoun et al. [79] suggested underexploitation of the population at the time. Similarly, in Lake Nokoué, Lederoun et al. [79] estimated that the Sarotherodon melanotheron population is underexploited. In contrast, in Lake Ahémé, Benin, the stock of Sarotherodon melanotheron is overexploited and requires conservation measures. These include ecosystem restoration through the systematic removal of destructive fishing gear and methods, enforcement operations, awareness campaigns about sustainable fishing practices among local communities, and the establishment of no-fishing zones to protect breeding grounds and ensure the continuous replenishment of fish stocks [80]. At the Ayamé Reservoir Lake (Côte d’Ivoire, West Africa), Gouré Bi et al. [80] revealed that the S. melanotheron population is experiencing overexploitation, characterized by the intensive fishing of small-sized individuals and a high proportion of one-year-old fish.
Nevertheless, early maturation associated with a reduced body size could decrease the reproductive potential of individuals, as smaller fish generally produce fewer eggs and have lower fecundity, ultimately lowering the height of the new local optimum, i.e., the average fitness of the population [18,58,78,81]. Moreover, very small individuals may not survive long enough to significantly impact the population, leading to reduced recruitment and stock collapse if, in the long term, fishing practices are not adjusted. Once fish reach sexual maturity, their reproductive role becomes crucial for population sustainability. Unfortunately, in S. melanotheron from Lake Toho, during both study periods, the percentage of the mega-spawners in the total catches was below 20%, with an exploitation rate (E) exceeding 0.50. This indicates fishing activity that primarily targets large breeders, compromising population renewal and leading to overfishing impacts on reproductive individuals. This form of overfishing is further confirmed by F/K ratios exceeding 1, indicating excessive fishing pressure that prevents fish from sufficiently contributing to stock renewal [20,79]. Additionally, the fishing mortality rate exceeded 60% of the total mortality rate during both study periods, a phenomenon largely attributed to the high density of fishers around the lake, where more than 1600 fishing households were recorded [80]. The current number of fishers at Lake Toho far exceeds the recommended limit of 2 fishers/km2 for Benin’s inland waters [82], thereby increasing pressure on stocks. This pressure results in the overexploitation of mega-spawners—large individuals that play key roles in fertility and reproductive stock contribution. Their gradual elimination disrupts the population’s demographic structure and reduces its reproductive capacity [18]. Furthermore, the decline in mega-spawners can have profound repercussions on the long-term viability of the population [83]. A high exploitation rate combined with a fishing mortality rate that significantly exceeds the natural mortality rate leads to the loss of large individuals, which are essential for maintaining the stock’s reproductive potential. This imbalance increases the risk of population collapse by limiting recruitment and compromising the sustainable exploitation of S. melanotheron. The findings of this study differ from those of Lederoun et al. [29], who reported a natural mortality rate exceeding the fishing mortality rate, indicating population underexploitation at the time. These differences may be due to sampling efforts or the resilience of the fish, which can adapt their behavior to avoid predators or fishing nets, influencing mortality dynamics and fishing mortality rates [83].
The current prevalence of growth, recruitment, and reproductive overfishing in S. melanotheron suggests the need for a reassessment of fishing practices, particularly regarding the implementation of minimum capture sizes and biological rest periods. These measures would help to protect adult and mature individuals, promote optimal production and growth, and ensure stock regeneration.

5. Conclusions

This research highlights a diminishing resilience based on some of the biological and ecological deterioration temporal trends in the population of Sarotherodon melanotheron in Lake Toho between 2002–2003 and 2022–2023. This degradation is reflected specifically in reductions in the average size and weight of fish individuals, a decrease in the size at first sexual maturity, and reductions in the numbers of mature individuals and mega-spawners, reflecting the increased fishing pressure on the local populations. The decreases in the asymptotic length and maximum longevity, combined with an increase in the growth coefficient, suggest an adaptation to the overexploitation of this biological resource. The reduction in the size at first capture reflects the targeting of younger individuals. Despite a high exploitation rate, the declines in the maximum sustainable yield and associated biomass indicate a decrease in fishery productivity, a situation that could jeopardize local fishermen communities and food safety, especially in terms of animal protein. These results reveal the existence of overfishing phenomena related to growth, recruitment, and reproduction and their impacts on the S. melanotheron population in Lake Toho. They stress the need for rigorous management measures to stop the decline and improve the lake’s productivity, mostly through the regulation of fishing gears and techniques and the establishment of much-needed bio-ecological rest periods.

Author Contributions

Conceptualization, S.A.M. and C.A.I.H.; data curation, S.A.M. and C.A.I.H.; formal analysis, C.A.I.H.; investigation, S.A.M. and C.A.I.H.; methodology, S.A.M., H.A., and D.B.; supervision, S.A.M. and H.A.; validation, S.A.M. and D.B.; visualization, C.A.I.H.; writing—original draft, C.A.I.H. and D.B.; writing—review and editing, C.A.I.H. and D.B. All authors have read and agreed to the published version of the manuscript.

Funding

This paper’s APC was partly funded by the Ecotur Sibiu Association.

Institutional Review Board Statement

The methodology of the study was approved by the National University of Agriculture (UNA), Laboratory of Animal and Fisheries Sciences (LaSAH), P.O. Box 5, Porto-Novo, Benin, through the committee overseeing the doctoral candidate. The idea for conducting such a study was authorized by the Ministry of Agriculture, Livestock, and Fisheries of Mono, under reference No. 437/DDAEP-MONO/MAEP/SRC/DRCPHA/29 September 2022. The first author holds a certificate in practical training for individuals actively participating in experiments (biotechnology)—category B, Annex 10 of the Royal Decree of 29/05/2013 from the University of Liège.

Informed Consent Statement

Not applicable.

Data Availability Statement

There were no supplementary data parts and no publicly archived datasets analyzed or generated during the study.

Acknowledgments

The authors would like to thank the fishermen from the villages of Logbo, Douimè, Hogbonou, and Kpinnou for facilitating access to the biological materials required for their research. They are also grateful to the Departmental Directorate of Agriculture, Livestock, and Fisheries of the Mono Department, as well as the Local Fishing Committees (CLPs) of each village for their various awareness efforts carried out with the local populations. The authors give thanks to the Ecotur Sibiu Association for funding a part of this paper’s APC.

Conflicts of Interest

The authors declare that they have neither personal relationships that could appear to have influenced the research reported in this study nor known competing financial interests.

References

  1. Curtean-Bănăduc, A.; Olosutean, H.; Bănăduc, D. The evaluation of ecosystem resources and services—A short historical review. Acta Oec. Carp. 2023, XVI, 81–88. [Google Scholar]
  2. Li, H.; Yu, X.; Wu, B.; Yu, L.; Wang, D.; Wang, K.; Wang, S.; Chen, D.; Li, Y.; Duan, X.; et al. Temporal and Spatial Distribution Characteristics of Fish Resources in a Typical River-Lake Confluence Ecosystem During the Initial Period of Fishing Ban. Fishes 2024, 9, 492. [Google Scholar] [CrossRef]
  3. Bănăduc, D.; Voicu, R.; Voicu, L.; Baki, A.B.M.; Serrano, I.; Barb, C.; Curtean-Bănăduc, A. Coştei hydrographic diversion node, a historical environment quality and biological resources accessibility game changer (Middle Danube Watershed); anthropogenic induced problems and sustainable solutions—An ichthyologic perspective. Transylv. Rev. Syst. Ecol. Res. 2021, 23, 87–114. [Google Scholar]
  4. Da Silveira, E.L.; Semmar, N.; Ballester, E.L.C.; Vaz-dos-Santos, A.M. Integrative Analysis to manage Aquatic Resources Based on Fish Feeding Patterns in Neotropical Rivers. Fishes 2023, 8, 157. [Google Scholar] [CrossRef]
  5. Bănăduc, D.; Simić, V.; Cianfaglione, K.; Barinova, S.; Afanasyev, S.; Öktener, A.; McCall, G.; Simić, S.; Curtean-Bănăduc, A. Freshwater as a sustainable resource and generator of secondary resources in the 21st century: Stressors, threats, risks, management and protection strategies, and conservation approaches. Int. J. Environ. Res. Public Health 2022, 19, 16570. [Google Scholar] [CrossRef]
  6. Curtean-Bănăduc, A.; Olosutean, H.; Bănăduc, D. Influence of environmental variables on the structure and diversity of ephemeropteran communities: A case study of the Timiș River, Romania. Acta Zool. Bulg. 2016, 68, 215–224. [Google Scholar]
  7. Bănăduc, D.; Barinova, S.; Cianfaglione, K.; Curtean-Bănăduc, A. Editorial: Multiple freshwater stressors-Key drivers for the future of freshwater environments. Front. Environ. Sci. 2023, 11, 1143706. [Google Scholar] [CrossRef]
  8. Bănăduc, D.; Afanasyev, S.; Akeroyd, J.R.; Năstase, A.; Năvodaru, I.; Tofan, L.; Curtean-Bănăduc, A. The Achilles Heel of Danube River-Danube Delta-Black Sea Region Fish Diversity under a Black Sea Impact Scenario Due to Sea Level Rise—A Prospective Review. Fishes 2023, 8, 355. [Google Scholar] [CrossRef]
  9. Oluwakayode-Oluyi, O.O.; Emmanuel, B.E.; Samuel, O.B. Children’s involvement in artisanal fishing in selected fishing communities of Badagry, Lagos (South-West Nigeria). Transylv. Rev. Syst. Ecol. Res. 2025, 27, 59–66. [Google Scholar] [CrossRef]
  10. Ajiboye, O.R.; Lawal-Are, A.O.; Obiakara-Amaechi, A.I. Trace metal contamination in two fish species from Epe Lagoon (South-West Nigeria): Health risk assessment. Transylv. Rev. Syst. Ecol. Res. 2024, 26, 71–80. [Google Scholar] [CrossRef]
  11. Sabai, D. The role of integrated coastal management approach in the protection of coastal and marine resources in the eastern coast of Tanzania. Transylv. Rev. Syst. Ecol. Res. 2023, 25, 77–86. [Google Scholar] [CrossRef]
  12. Olopade, O.A.; Dienye, H.E.; Nwosu, E.I. Some aspects of the growth features and condition factor of Arius gigas (Boulenger, 1911) from Obuama Creek (River State, Nigeria). Transylv. Rev. Syst. Ecol. Res. 2021, 23, 63–74. [Google Scholar] [CrossRef]
  13. Chu, C.; Barker, J.; Gutowsky, L.; de Kerckhove, D.A. Conceptual Management Framework for Multiple Stressor Interactions in Freshwater Lakes and Rivers; Ontario Ministry of Natural Resources and Forestry: Peterborough, ON, Canada, 2018. [Google Scholar]
  14. Allan, J.D.; Abell, R.; Hogan, Z.E.B.; Revenga, C.; Taylor, B.W.; Welcomme, R.L.; Winemiller, K. Overfishing of Inland Waters. Bioscience 2005, 55, 1041–1051. [Google Scholar] [CrossRef]
  15. FAO. The State of World Fisheries and Aquaculture 2018; Meeting the Sustainable Development Goals; FAO: Rome, Italy, 2018; ISBN 9789251305621. [Google Scholar]
  16. Owusu, V. Effects of the closed fishing season on small-scale fisheries and coastal livelihoods in Ghana. Fish. Aquat. Sci. 2024, 27, 753–768. [Google Scholar] [CrossRef]
  17. Organisation de coopération et de développement économiques (OCDE); Organisation des Nations Unies pour l’alimentation et l’agriculture (FAO). Perspectives Agricoles de l’OCDE et de la FAO 2023–2032; OCDE/FAO: Paris, France, 2023; 330p. [Google Scholar]
  18. Wohlfarth, G.W.; Hulata, G.G. Applied genetics of tilapias. In ICLARM Stud. Rev. 6, 2nd ed.; ICLARM: Makati, Philippines, 1983; 26p. [Google Scholar]
  19. Teugels, G.G.; Thys van den Audenaerde, D.F.E. Cichlidae. In The Fresh and Brackish Water Fishes of West Africa, Volume 2; Paugy, D., Lévêque, C., Teugels, G.G., Eds.; Coll. Faune et Flore Tropicale 40; Institut de Recherche de Développement: Paris, France; Musée royale de l’Afrique Centrale: Tervuren, Belgium, 2003; pp. 521–600. [Google Scholar]
  20. Lederoun, D.; Emmanuel, V.; Chikou, A.; Vreven, E.; Snoeks, J.; Moreau, J.; Vandewalle, P.; Lalèyè, P. Population parameters and exploitation rate of Sarotherodon melanotheron melanotheron rüppell, 1852 (Cichlidae) in Lake Toho, Benin. J. Biodivers. Environ. Sci. 2015, 6, 259–271. [Google Scholar]
  21. Codjo, V.; Zannou, A.; Biaou, G. Baisse des ressources halieutiques du lac Toho au Sud du Bénin: Perceptions des pêcheurs et efficacité des pratiques de gestion et stratégies d’adaptation. Tropicultura 2018, 36, 713–721. [Google Scholar]
  22. Meijboom, F.L.B.; Bovenkerk, B. Fish resilience as an ethical issue. J. Fish Biol. 2024, 106, 6–11. [Google Scholar] [CrossRef]
  23. Sanon, V.-P.; Toé, P.; Caballer Revenga, J.; El Bilali, H.; Hundscheid, L.J.; Kulakowska, M.; Magnuszewski, P.; Meulenbroek, P.; Paillaugue, J.; Sendzimir, J.; et al. Multiple-Line Identification of Socio-Ecological Stressors Affecting Aquatic Ecosystems in Semi-Arid Countries: Implications for Sustainable Management of Fisheries in Sub-Saharan Africa. Water 2020, 12, 1518. [Google Scholar] [CrossRef]
  24. Ayoubi, H.E.; Failler, P. Industrie des Pêches et de L’aquaculture au Bénin; Rapport N°5 de la Revue de L’industrie des Pêches et de L’aquaculture Dans la Zone de la COMHAFAT; 2013; 141p. Available online: https://www.researchgate.net/publication/277776052_Industrie_des_peches_et_de_l'aquaculture_au_Benin (accessed on 20 May 2025).
  25. Pauly, D.; Christensen, V.; Dalsgaard, J.; Froese, R.M.; Torres, F.C., Jr. Fishing down marine food webs. Science 1998, 279, 860–863. [Google Scholar] [CrossRef]
  26. Page, L.M.; Burr, B.M. A Field Guide to Freshwater Fishes of North America North of Mexico; Houghton Mifflin Company: Boston, MA, USA, 1991; 432p. [Google Scholar]
  27. Gobert, B.; Reynal, L. Les méthodes d’évaluation des ressources halieutiques. In La Pêche aux Antilles; IRD Edition: Marseille, France, 2002. [Google Scholar] [CrossRef]
  28. Trewavas, E. Tilapiine Fishes of the Genera Sarotherodon, Oreochromis and Danakilia; British Museum of Natural History: London, UK, 1983; 583p. [Google Scholar]
  29. Froese, R. Keep it simple three indicators to deal with overfishing. Fish Fish. 2004, 5, 86–91. [Google Scholar] [CrossRef]
  30. Trewavas, E.; Teugels, G.G. Sarotherodon. In Check-List of the Freshwater Fishes of Africa (CLOFFA); Daget, J., Gosse, J.-P., Teugels, G.G., Thys van den Audenaerd, D.F.E., Eds.; ISNB: Brussels, Belgium; MRAC: Brussels, Belgium; ORSTOM: Paris, France, 1991; Volume 4, pp. 425–437. [Google Scholar]
  31. Gabriel, W.L.; Mace, P.M. Examen des points de référence biologiques dans le contexte de l’approche de précaution. In Actes du 5ᵉ Atelier National d’évaluation des Stocks du NMFS: Fournir des Conseils Scientifiques Pour la Mise en œuvre de L’approche de Précaution Dans le Cadre de la loi Magnuson-Stevens sur la Conservation et la Gestion des pêcheries; Restrepo, V.R., Ed.; NOAA Technical Memorandum NMFS-F/SPO-40; U.S. Department of Commerce, National Marine Fisheries Service: Silver Spring, Maryland, USA, 1999; pp. 34–45. [Google Scholar]
  32. Ahouansou Montcho, S. Etude de l’écologie et de la Production Halieutique du lac Toho au Bénin; Diplôme d’Etude Supérieures Spécialisées en Aménagement et Gestion des Ressources Naturelles; Université d’Abomey-Calavi: Cotonou, Benin, 2003; 113p. [Google Scholar]
  33. FAO. Points de référence en aménagement des pêcheries. In Document Technique sur les Pêcheries; N° 347; FAO: Rome, Italy, 1997; 111p. [Google Scholar]
  34. Ahouansou Montcho, S.; Akele, D.G.; Hountcheme, I.A.C.; Montchowui, E.; Nyonkuru, C.; Laleye, P. Impact de la pêche sur la population de Oreochromis niloticus introduite dans le lac Toho (Bénin). Ann. Sci. Agron. 2023, 26, 89–102. [Google Scholar]
  35. Paugy, D.; Lévêque, C.; Teugels, G.G. Faune des Poissons D’eaux Douces et Saumâtres de l’Afrique de l’Ouest; IRD: Paris, France, 2003. [Google Scholar]
  36. Micha, J.C. Etude des Populations Piscicoles de l’Ouganda et Tentation de Sélection et D’adaptation de Quelques Espèces à L’étang de Pisciculture; Centre Technique Forestier Tropicale: Nogent-sur-Marne, France, 1973; 110p. [Google Scholar]
  37. Laleye, P. Ecologie Comparée de Deux Espèces de Chrysichthys, Poissons Siluriformes (Claroteidae) du Complexe lac Nokoué- Lagune de Porto/Novo au Bénin. Ph.D. Thesis, Faculté des Sciences Agronomiques, Université de Liège, Liège, Belgium, 1995; 199p. [Google Scholar]
  38. Brown-Peterson, N.J.; Wyanski, D.M.; Saborido-Rey, F.; Macewicz, B.J.; Lowerre-Barbieri, S.K. A standardized terminology for describing reproductive development in fishes. Mar. Coast. Fish. 2011, 3, 52–70. [Google Scholar] [CrossRef]
  39. Ahouansou Montcho, S.; Laleye, P.A. Some aspects of biology of Oreochromis niloticus L. (Perciformes: Cichlidae) recently introduced in Lake Toho (Benin, West Africa). Int. J. Biol. Chem. Sci. 2008, 2, 114–122. [Google Scholar] [CrossRef]
  40. Ahouansou Montcho, S. Diversité et Exploitation des Poissons de la Rivière Pendjari (Bénin, Afrique de l’Ouest). Ph.D. Thesis, Université d’Abomey-Calavi, Cotonou, Benin, 2011; 234p. [Google Scholar]
  41. Ahouansou-Montcho, S.; Agadjihouèdé, H.; Montchowui, E.; Lalèyè, P.A.; Moreau, J. Population parameters of Oreochromis niloticus (Cichlidae) recently introduced in lake Toho (Benin, West Africa). Int. J. Aqut. Stud. 2015, 2, 141–145. [Google Scholar]
  42. Sturges, H. The choice of a class interval. J. Am. Stat. Assoc. 1926, 21, 65–66. [Google Scholar] [CrossRef]
  43. Amenzoui, K.; Ferhan-Tachinante, F.; Yahyaoui, A.; Mesfioui, A.H.; Kifani, S. Etude de quelques aspects de la reproduction de la région de Saedina pilchardus (Walbaum, 1792) de la région de Laâyoune (Maroc). Bull. Inst. Sci. 2005, 27, 43–50. [Google Scholar]
  44. N’Guessan, Y.; N’Guessan, C.D.; Amande, J.M.; Kouame, J.-P.A.; Abekan, E.; Assan, F.N.; N’Da, K. Sex-ratio, stades de maturité, taille de première maturité et facteur de condition de Canthidermis maculata capturé dans l’océan Atlantique Est. Int. J. Biol. Chem. Sci. 2018, 11, 2876. [Google Scholar] [CrossRef]
  45. Dagnelie, P. Théorie et Méthodes Statistiques, 2nd ed.; Presses Agronomiques de Gembloux: Gembloux, Belgium, 1973; Volume 1. [Google Scholar]
  46. Albaret, J.J.; Legendre, M. Biologie et écologie des Mugilidae en lagune Ebrié (Côte d’Ivoire) intérêt potentiel pour l’aquaculture lagunaire. Rev. Hydrobiol. Trop. 1985, 18, 281–303. [Google Scholar]
  47. Gayanilo, F.C.; Sparre, P.; Pauly, D. FAO-ICLARM. Stock Assessment Tools II. User’s Guide; FAO Computerized Information Series (Fisheries); FAO: Rome, Italy, 2005; 168p. [Google Scholar]
  48. Pauly, D. Une Sélection des Méthodes Simples Pour L’estimation des Stocks de Poissons Tropicaux; Circulaire sur les Pêches N° 729; FAO: Rome, Italy, 1982; 60p. [Google Scholar]
  49. Pauly, D.; Munro, J.L. Once more: Growth comparisons fish and invertebrates. Fishbyte 1984, 2, 21. [Google Scholar]
  50. Pauly, D. Theory and Management of Tropical Multispecies Stocks: A Review with Emphasis on the Southeast Asian Demersal Fisheries; ICLARM Studies and Review N° 1; ICLARM: Manila, Philippines, 1979; pp. 1–35. [Google Scholar]
  51. Pauly, D. On the interrelationships between natural mortality, growth parameters, and mean environmental temperature in 175 fish stocks. ICES J. Mar. Sci. 1980, 39, 175–192. [Google Scholar] [CrossRef]
  52. Gulland, J.A. The Fish Resources of the Ocean West Polyfleet; Document Technique de la FAO N0 97; Survey Fishing News (Books) Ltd.: West Polyfleet, UK, 1971; 428p. [Google Scholar]
  53. Beverton, R.J.H.; Holt, S.J. Manual of Methods for Fish Stock Assessment: Part II. Tables of Yield Function; FAO Fisheries Biology; Technical Paper; FAO: Rome, Italy, 1966; pp. 1–67. [Google Scholar]
  54. Gilbert, A.; Andréfouët, S.; Gascuel, D. Dynamique des Populations, Modélisation Halieutique, Approche de Précaution et Stratégie de Co-Gestion Adaptative des Pêcheries de Bénitiers de Trois îles de Polynésie Française. Rapport Final, Convention 6.0080. 2007. 94p. Available online: https://horizon.documentation.ird.fr/exl-doc/pleins_textes/pleins_textes_6/Fau_trop/36564.pdf (accessed on 20 May 2025).
  55. Thompson, W.F.; Bell, F.H. Biological statistics of the Pacific halibut fishery. In Effect of Changes in Intensity Upon Total Yield and Yield per Unit of Gear; Report No. 8; International Fisheries Commission: Seattle, WA, USA, 1934; 49p. [Google Scholar]
  56. Viaho, C.C.; Lederoun, D.; Baglo, I.S.; Ahouansou Montcho, S.; Adandédjan, D.; Agblonon Houelome, T.; Gbedey, N.M.; Laleye, P. Paramètres de population et taux d’exploitation de Sarotherodon melanotheron melanotheron Rüppell (1852, Cichlidae) et Ethmalosa fimbriata (Bowdich, 1825, Clupeidae) dans le lac Ahémé et ses chenaux avant le dragage (Bénin, Afrique de l’Ouest). Int. J. Biol. Chem. Sci. 2021, 15, 1991–2007. [Google Scholar] [CrossRef]
  57. Niyonkuru, C.; Lalèyè, P.A.; Moreau, J. Impact of acadja fisheries on the population dynamics of Sarotherodon melanotheron and Hemichromis fasciatus in a Lake Nokoué (Benin, West Africa). Knowl. Manag. Aquatic. Ecosyst. 2010, 397, 1. [Google Scholar] [CrossRef]
  58. Lederoun, D.; Amoussou, G.; Baglo, I.S.; Adjibogoun, H.; Vodougnon, H.; Moreau, J.; Lalèyè, P. Growth, mortality and yield of Sarotherodon melanotheron melanotheron (Rüppell, 1852) in the Lake Nokoué and Porto-Novo Lagoon complex Benin, West Africa. Aquat. Living Resour. 2020, 33, 18. [Google Scholar] [CrossRef]
  59. Anagonou, S.P.G. Diversité et Exploitation des Poissons des lacs Datchi et Wozo au Sud-Bénin. Master’s Thesis, Université d’Abomey-Calavi, Abomey-Calavi, Bénin, 2016; 73p. [Google Scholar]
  60. Villanueva, M.C.S. Biodiversité et Relations Trophiques dans Quelques Milieux Estuariens et Lagunaires de l’Afrique de l’Ouest: Adaptations aux Pressions Environnementales. Ph.D. Thesis, Institut National Polytechnique de Toulouse, Toulouse, France, 2004; 272p. [Google Scholar]
  61. Cissé, M.; Kamelan, T.M.; Siaka, B.; Kouamelan, E.P. Population parameters of major fish species in Ayamé 1 man-made lake seven years after the return of non-native fishermen coming back. Rev. De L’environnement et de la Biodiversité-Programme D’appui Strat. à La Rech. Sci. Abidj. Côte D’ivoire 2021, 6, 23–26. [Google Scholar]
  62. Koranteng, K.A.; Ofori-Danson, P.K.; Entsua-Mensah, M. Fish and fisheries of Muni lagoon in Ghana, West Africa. Biodivers. Conserv. 2000, 9, 487–499. [Google Scholar] [CrossRef]
  63. Arizi, E.K.; Aggrey-Fynn, J.; Obodai, E.A. Growth, Mortality and Exploitation Rates of Sarotherodon melanotheron in the Dominlin Lagoon of Ghana. Momona Ethiopian. J. Sci. 2015, 7, 258–274. [Google Scholar]
  64. Jenning, S.; Kaisier, M.; Reynold, J. Marine Fisheries Ecology; Blackwell Science: Oxford, UK, 2000; 391p. [Google Scholar]
  65. Legendre, M.; Slembrouck, J.; Kerdchuen, N.; Oteme, Z. Evaluation D’une Méthode Extensive D’alevinage des Clariidae en Cages Implantées en Étangs; N04; Document ORSTOM: Montpellier, France, 1991; 35p. [Google Scholar]
  66. Law, R. Fishing, selection, and phenotypic evolution. ICES J. Mar. Sci. 2000, 57, 659–668. [Google Scholar] [CrossRef]
  67. Hutchings, J.A.; Baum, J.K. Measuring marine fish biodiversity: Temporal changes in abundance, life history and demography. Philos. Trans. R. Soc. B. 2005, 360, 315–338. [Google Scholar] [CrossRef]
  68. Christensen, V.; Guénette, S.; Heymans, J.J.; Walters, C.J.; Watson, R.; Zeller, D.; Pauly, D. Hundred-Year decline of North Atlantic predatory fishes. Fish Fish. 2003, 4, 1–24. [Google Scholar] [CrossRef]
  69. Barry, J.P.; Tegner, M.J. Inferring demographic processes from size-frequency distributions: Simple models indicate specific patterns of growth and mortality. Fish. Bull. 1990, 88, 13–19. [Google Scholar]
  70. Akou Loba, V.; Gbitry Bolou, A. La Problématique du Développement dans l’Ouest de la Côte d’Ivoire; Archives nationales de Côte d’Ivoire; Eléments de Diagnostics et de Réflexion; Abidjan, Côte d’Ivoire, 2018; 37p. [Google Scholar]
  71. Koigny, K.J.H.; Diarrassouba, A.; Yelkouni, M.; Assie, D.R.H. Analyse des facteurs de dégradation des ressources halieutiques du lac Buyo dans la Réserve de biosphère Taï en Cote d’Ivoire. Vertigo 2024, 24. [Google Scholar] [CrossRef]
  72. Kantoussan, J. Impacts de la Pression de Pêche sur L’organisation des Peuplements de Poissons: Application aux Retenues Artificielles de Sélingué et de Manantali, Mali, Afrique de l’Ouest. Ph.D. Thesis, Agrocampus Rennes, Rennes, France, 2007; 195p. [Google Scholar]
  73. Pulin, R.S.V.; Lazard, J.; Legendre, M.; Amon Kothias, J.-B.; Pauly, D. Le Troisième Symposium International sur le Tilapia en Aquaculture; ICLARM: Penang, Malaysia, 1966; 642p. [Google Scholar]
  74. Anderson, K.H.; Farnsworth, K.D.; Thygesen, U.H.; Beyer, J.E. The evolutionary pressure from fishing on size at maturation of Baltic cod. Ecol. Model. 2007, 204, 246–252. [Google Scholar] [CrossRef]
  75. Miethe, T.; Dytham, C.; Dieckmann, U.; Pitchford, J.W. Marine reserves and the evolutionary effects of fishing on size at maturation. ICES J. Mar. Sci. 2010, 67, 412–425. [Google Scholar] [CrossRef]
  76. Pauly, D.; Chua, T.E. The overfishing of marine ressources: Socioeconomic background in Southeast Asia. Ambio 1988, 17, 200–206. [Google Scholar]
  77. Hutchings, J.A.; Reynolds, J.D. Marine fish population collapses: Consequences for recovery and extinction risk. BioScience 2004, 54, 297–309. [Google Scholar] [CrossRef]
  78. Brown, J.H.; Sibly, R.M. Life-history evolution under a production constraint. Proc. Natl. Acad. Sci. USA 2006, 103, 17595–17599. [Google Scholar] [CrossRef]
  79. Hutchings, J.A.; Myers, R.A. What can be learned from the collaps of a renewable resource? Atlantic cod, Gadus morhua, of Newfounland and labrador. Can. J. Fish. Aquat. Sci. 1994, 51, 2126–2146. [Google Scholar] [CrossRef]
  80. Hountcheme, I.A.C.; Ahouansou Montcho, S.; Lederoun, D.; Kpossou, S.; Agadjihouede, H. La pêcherie du lac Toho, acteurs, engins et commercialisation du poisson. Ann. Sci. Agric. 2024, 26, 47–58. [Google Scholar]
  81. Gouré Bi, T.F.; Yeo, G.M.; Amian, A.F.R.; Niamien, K.J.; Blé, M.C. Age et croissance du tilapia estuarin Sarotherodon melanotheron dans le lac de barrage d’Ayamé 1 (Côte d’Ivoire, Afrique de l’Ouest). J. Appl. Biosci. 2023, 191, 20219–20230. [Google Scholar] [CrossRef]
  82. Adéoti, B.O.E.; Yabi, I.; Medeou, F.; Ogouwale, E. Caractérisation de la pêcherie continentale dans les communes d’Adjohoun et de Dangbo au sud-est Bénin. Afr. Sci. 2018, 14, 170–184. [Google Scholar]
  83. Hutchings, J.A. Life histories of fish. Fish Biol. 2002, 1, 149–174. [Google Scholar] [CrossRef]
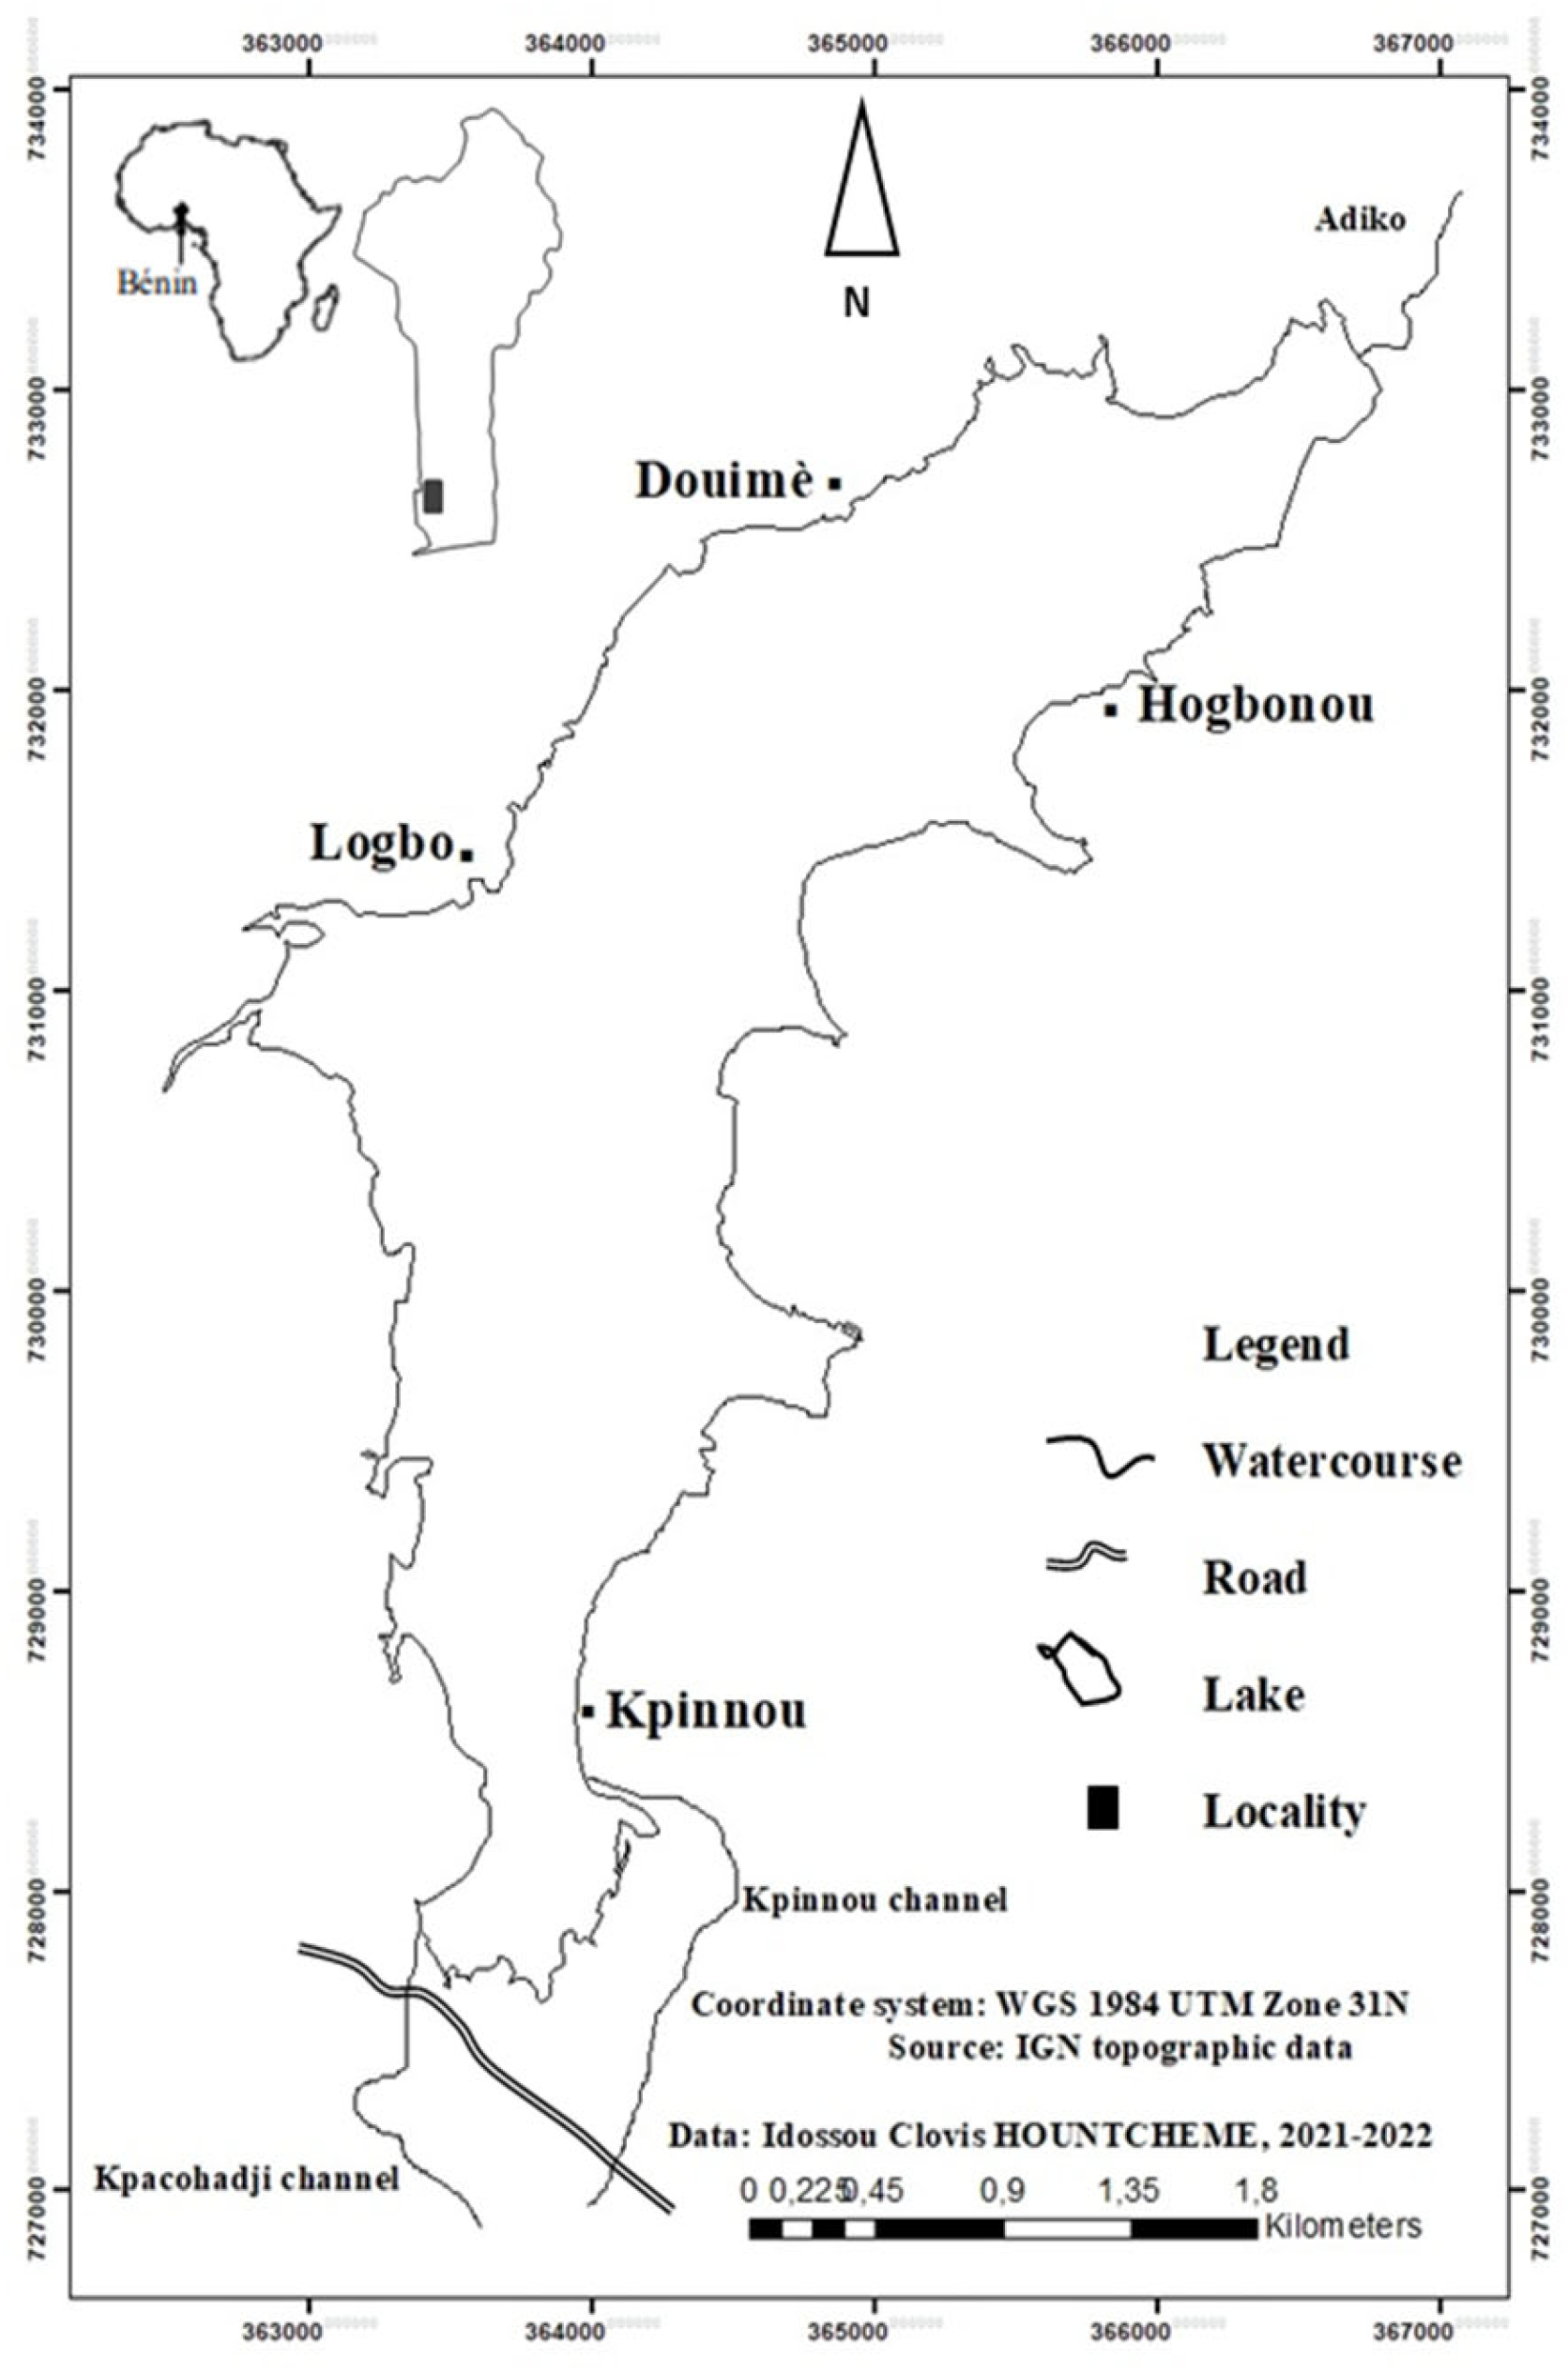
Figure 1. Lake Toho location.
Fishes 10 00357 g001
Figure 2. Size distributions of male, female, immature, and undetermined individuals of S. melanotheron caught in 2002–2003 and 2022–2023 in Lake Toho.
Fishes 10 00357 g002
Figure 3. Comparison of the mean total lengths (a) and mean total weights (b) of S. melanotheron individuals between 2002–2003 and 2022–2023. P is the probability of obtaining a result at least as extreme as the one observed, assuming that the null hypothesis is true.
Fishes 10 00357 g003
Figure 4. Logistic curves for determining the sizes of male and female S. melanotheron at first sexual maturity (L50m), caught in Lake Toho in 2002–2003 (a) and 2022–2023 (b).
Fishes 10 00357 g004
Figure 5. Comparison of the relative proportions of the different maturity stages of S. melanotheron caught in Lake Toho between the periods 2002–2003 and 2022–2023.
Fishes 10 00357 g005
Figure 6. Evolution of capture probability curves for S. melanotheron individuals in Lake Toho in 2002–2003 (a) and 2022–2023 (b).
Fishes 10 00357 g006
Figure 7. Catch curves of S. melanotheron caught in 2002–2003 (a) and 2022–2023 (b).
Fishes 10 00357 g007
Figure 8. Yield and biomass curves per recruit (ogive selection) for S. melanotheron in 2002–2003 (a) and 2022–2023 (b); the arrows correspond to the respective exploitation rates.
Fishes 10 00357 g008
Figure 9. Evolution of production and biomass at different fishing mortality (F) levels for S. melanotheron from Lake Toho in 2002–2003 (a) and 2022–2023 (b).
Fishes 10 00357 g009
Table 1. Structural characteristics of S. melanotheron individuals sampled in Lake Toho between 2002–2003 and 2022–2023.
Sex/MaturityNumber (N)Total Length (cm)
(min.–max.)
Average Length (cm)Total Weight (g)
(min.–max.)
Average Weight (g)
April 2002 to March 200335112.7–27.5 0.4–411.158.12 ± 33.44
Females8707.0–27.514.67 ± 2.44 6.0–411.168.88 ± 32.74
Males7537.7–27.014,78 ± 1.958.0–360.263.57 ± 22.42
Immature2307.5–9.212.15 ± 1.596.5–16.037.43 ± 13.55
Undetermined16582.7–27.512.15 ± 3.650.4–333.847.60 ± 38.22
April 2022 to March 202391582.2–19.47.95 ± 2.260.2–133.712.88 ± 9.11
Females30083.1–16.48.96 ± 1.711.2–79.916.17 ± 8.42
Males37082.2–19.49.09 ± 1,911.3–133.716.86 ± 9.27
Immature18232.3–7.77.46 ± 1.120.2–7.19.14 ± 4.13
Undetermined6192.8–11.75.96 ± 0.900.9–24.64.56 ± 2.19
Table 2. Absolute frequencies of S. melanotheron individuals according to maturity stages in catches for the periods 2002–2003 and 2022–2023.
Stage2002–20032022–2023Chi-Squared Test
I1213068p < 0.0001
II1091774
III637769
IV513793
V4732135
Total18538539
Table 3. Monthly trend in the percentage of the mega-spawners in the catches. Per = period; Par = parameters; Nt = total number; NMS = number of mega-spawners; %MS = percentage of mega-spawners in catches.
PeriodParApr.MayJun.Jul.Aug.Sep.Oct.Nov.Dec.Jan.Feb.Mar.Total
2002
2003
Nt3425818913538719945227747589194663511
NMS260211105253101300159
(%) MS0.581.0301.482.845.0311.5019.132.101.61004.53
2022
2023
Nt85325799144658211139099058558845687689131
NMR1620231491612486014142
(%) Ms1.887.782.323.141.551.441.320.440.940.6801.821.56
Table 4. Summary of growth parameters.
Growth Parameter2002–20032022–2023Observed Variation
Asymptotic length (L∞, cm)32.223.8Decrease
Growth coefficient (K, year−1)0.320.38Increase
Theoretical age at zero length (t0, years)−0.50−0.44Slight increase
Estimated maximum longevity (tmax, years)9.377.89Decrease
Growth performance (Φ’)2.532.33Decrease
Table 5. Synthetic exploitation parameters and biological indicators of S. melanotheron individuals from Lake Toho in 2002–2003 and 2022–2023.
Parameter2002–20032022–2023
Z2.702.95
M0.841.03
F1.861.92
K0.320.38
M/K2.632.71
F/K5.815.05
Lc50/L∞0.310.20
Lm50/L∞ (males)0.841.10
Lm50/L∞ (females)0.250.23
Table 6. Extended exploitation parameters and biological indicators of S. melanotheron individuals from Lake Toho in 2002–2003 and 2022–2023.
CountryNameYearsL∞
(cm)
K
(Year−1)
t0
(Year)
tmax
(Year)
Φ’MZ
(Year−1)
F
(Year−1)
E
(Year−1)
L50C
(cm)
BeninLake Toho2022–202323.800.38−0.447.892.331.032.951.920.654.97Present study, 2022–2023
BeninLake Toho2012–201321.530.58−0.315.172.431.371.950.580.306.70Lederoun et al., 2015 [20]
BeninLake Toho2002–200332.200.32−0.509.372.530.842.701.860.6910.06Present study, 2002–2003
BeninLake Ahémé2016–201718.900.71−0.264.232.401.622.560.940.377.89Viaho
et al., 2021 [56]
BeninLake Nokoué (in Acadja)2003–200426.800.520.025.802.571.201.530.330.21-Niyonkuru, 2010 [57]
BeninLake Nokoué (in Acadja)2003–200424.100.550.025.502.501.281.660.380.23-Niyonkuru, 2010 [57]
BeninLake Nokoué and Porto-Novo Lagoon201524.680.86−0.203.492.421.712.460.750.319.20Lederoun
et al. (2020) [58]
BeninLake Wozo201623.630.82--2.681.673.772.100.55-Anagonou, 2016 [59]
Côte d’IvoireLagoon Ebrié
1991–1992340.42---0.98-0.22--Villanueva, 2004 [60]
Côte d’IvoireAyamé 1 Dam2017–201833.260.56−0.285.352.791.231.880.650.35-Cissé et al., 2021 [61]
GhanaLagoon Muni199415.500.70−0.104.2002.031.845.383.550.4810.13Koranteng et al., 2000 [62]
GhanaLagoon Dominli2011–201220.480.97−0.813.102.602.023.861.840.4810.1Arizi et al., 2015 [63]
GambiaEstuaries1991–1992370.39---0.89-0.85--Villanueva, 2004 [60]
Disclaimer/Publisher’s Note: The statements, opinions and data contained in all publications are solely those of the individual author(s) and contributor(s) and not of MDPI and/or the editor(s). MDPI and/or the editor(s) disclaim responsibility for any injury to people or property resulting from any ideas, methods, instructions or products referred to in the content.