Article

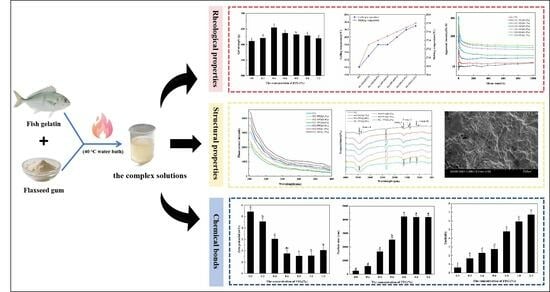
Effect of Flaxseed Gum on the Gelling and Structural Properties of Fish Gelatin

National R&D Center for Freshwater Fish Processing, College of Life Science, Jiangxi Normal University, Nanchang 330022, China
*
Authors to whom correspondence should be addressed.
Fishes 2025, 10(7), 346; https://doi.org/10.3390/fishes10070346
Submission received: 5 June 2025 / Revised: 26 June 2025 / Accepted: 4 July 2025 / Published: 14 July 2025
(This article belongs to the Special Issue Fish Processing and Preservation Technologies)

Abstract

Fish gelatin (FG) has garnered significant attention as an alternative to mammalian gelatin, primarily attributed to its distinct advantages. These include the absence of epidemic transmission risks and the lack of religious restrictions, making it a more universally acceptable and safer option. However, its application is limited due to shortcomings such as insufficient gel properties (such as rheological properties, gel strength, etc.). In this study, flaxseed gum (FFG) of 0–1.2% w/v was used to modify FG. The rheological properties, structural characteristics, and chemical bond changes of FG before and after modification were systematically analyzed using instruments such as a rheometer, infrared spectrometer, and Zeta potential analyzer. The results revealed that an appropriate amount of FFG could increase the gel strength of FG, but excessive FFG (>0.4%) reduced its gel strength. Moreover, FFG could increase the gelation transition temperature and apparent viscosity of the composite gel. FTIR confirmed that FFG and FG were bound through hydrogen bonding, β-sheet structure formation, and multi-electrolyte complexation. The ESEM showed that FFG promoted the formation of a denser network structure of FG. This study laid a theoretical foundation for the application and development of FG in the field of high-gel foods.
Key Contributions: This study modified fish gelatin with flaxseed gum, achieving an increase in the gel strength of fish gelatin and an improvement in rheological properties such as apparent viscosity. This provides key theoretical support for the application of fish gelatin in the field of high-gel food and promotes its functional expansion and industrial development.

Graphical Abstract

1. Introduction

Gelatin is widely used in industries such as food and medicine due to its multi-functional properties, such as gelation, foaming, and film formation [1,2]. At present, approximately 98.5% of commercial gelatin is derived from mammalian sources [3]. However, its application is restricted due to factors such as food safety risks, the development of vegetarianism, and religious beliefs. For instance, mammalian gelatin poses a risk of carrying pathogens, and the Muslim and Jewish communities prohibit the consumption of pork or beef, respectively, due to religious doctrines [4]. Currently, fish gelatin (FG) is regarded as one of the most promising substitutes for mammalian gelatin because it exhibits physical and chemical properties that are highly similar to those of mammalian gelatin [5]. Compared with mammalian gelatin, FG shows superior foaming performance but lacks functional characteristics such as gel strength and gel melting temperature. To develop high-quality FG capable of substituting mammalian gelatin, researchers have explored a variety of modification methods to improve its gelation properties, including physical, chemical, enzymatic and composite modification, etc. [6,7,8]. In gelatin modification experiments, the physical modification method of protein–polysaccharide is favored due to its unique dual advantages. First, most of the polysaccharides derived from plant gum (such as seaweed gum and cellulose gum) show superior gelatinability and stability. Moreover, these polysaccharides not only have excellent physical properties in the food industry but also play important roles in biomedicine [9,10]. Secondly, the physical modification via heating and co-melting does not require the introduction of chemical reagents, ensuring safety and environmental friendliness. Moreover, the process is simple and easy to operate, facilitating large-scale production [11]. This method can regulate parameters such as gel strength and rheological properties of the complex system by adjusting the proportion of polysaccharides, demonstrating remarkable flexibility and wide applicability in application scenarios [12].
Flaxseed gum (FFG), a natural polymer complex derived from linseed [13], consists of an anionic heteropolysaccharide. This heteropolysaccharide is made up of 75% neutral and 25% acidic monomers. The neutral monomers mainly include galactose, xylose, and arabinose, while acidic ones are mostly D-galacturonic acid, L-galactose, L-fucose, and L-rhamnose [14]. As a hydrophilic colloid, it has good emulsification, viscosity, and gelation properties. Therefore, FFG is extensively utilized in the food industry as a gelling agent, thickener, stabilizer, and emulsifier. It serves as an effective substitute for natural colloids like pectin and gum Arabic [14,15]. FFG also serves as a high-quality water-soluble dietary fiber, helping control weight, reducing blood sugar and cholesterol levels, and regulating the intestinal microbiota to prevent metabolic diseases [16]. The application of FFG in food has expanded to meat products, ice cream and dairy products, etc. [14]. Moakes et al. [17] demonstrated that flaxseed gum could be used to modify the properties of whey protein fluid gels, enhancing their stability and functional characteristics. However, little research has been done on using FFG to modify FG. Therefore, the physical modification of FG by using FFG has great application prospects.
In this study, the gel properties and rheological characteristics of FG were improved by adding FFG at concentrations ranging from 0 to 1.2% (w/v). Meanwhile, through Fourier Transform Infrared spectroscopy (FTIR) and environmental scanning electron microscopy (ESEM) techniques, the microstructure of the FG composite system was analyzed and the internal mechanism of the performance improvement of FG modified by FFG was explored. This research provided a scientific basis for optimizing the performance of FG and is conducive to promoting the industrial application of FG in multiple fields.

2. Materials and Methods

2.1. Materials

Tilapia skin gelatin was purchased from Geely Ding Marine Biotechnology Co., Ltd. (Suzhou, China). FFG was purchased from Xinjiang Lisidesheng Technology Co., Ltd. (Xinjiang, China). All other reagents used were of analytical reagent grade.

2.2. Preparation and Modification of Fish Gelatin Samples

Added FG to deionized water at 40 °C and stirred uniformly to prepare a 6.67% (w/v) FG solution. Subsequently, FFG was added to the FG solution at concentrations of 0%, 0.2%, 0.4%, 0.6%, 0.8%, 1.0%, and 1.2% (w/v) to create the FG–FFG complex solutions.

2.3. Determination of the Gel Strength

The gel strength of the FG was assessed based on a modified version of the method reported by Tu et al. [10]. Specifically, the FG–FFG complex solution was transferred into a 25 mL beaker (with dimensions of 33 mm × 22 mm) and subjected to incubation at 4 °C for a duration of 16 to 18 h. Subsequently, a TA.XT plus texture analyzer (manufactured by Stable Micro System, Surrey, UK) was employed to measure the gel strength. The measurement settings were set as follows: the probe utilized was P/0.5R, the test speed was set at 1 mm/s, and the gel strength was defined as the maximum force exerted when the penetration depth reached 4 mm.

2.4. Determination of the Melting Temperature

The melting temperature of gelatin was determined by employing a modified version of the method described by Tabarestani [18]. The FG–FFG solution was transferred into a test tube equipped with a cap, ensuring that the tube has a diameter of 12 mm, a length of 100 mm, and that a specific space was left at the top. Subsequently, the test tube was sealed with a corresponding cap, inverted, and placed in a refrigerator set at 4 °C for a period of 16 to 18 h. Following this, the test tube was transferred to a water bath maintained at 10 °C. At this stage, the bottom space of the test tube remained unfilled with gelatin. The heating rate of the water bath was set at 0.5 °C per minute. The temperature at which bubbles first began to rise from the bottom of the test tube was documented. This temperature corresponded to the melting point of the complex solution.

2.5. Determination of the Rheological Properties

The measurements were carried out following the method described by Huang et al. [19] with necessary modifications, utilizing a rheometer. Temperature scan: 17 mL of the FG–FFG complex solution was poured into a PP50 cylinder at 40 °C for 3 min. The solution temperature was then reduced from 40 °C to 5 °C for 30 min. The solution was subsequently reheated to 40 °C. The rate of the entire process was maintained at 0.5 °C/min, with a strain force set at 0.5% and a frequency of 1 Hz.
Viscosity scan: 15 mL of FG–FFG complex solution was taken and poured into the cylinder, 25 °C for 3 min, shear rate from 0 to 1000 s−1, and the apparent viscosity of the colloid was determined.

2.6. Determination of Particle Size, Zeta Potential, and Turbidity

Particle size determination: The FG–FFG colloid solution underwent a 10-fold dilution, after which the particle size distribution of the resultant compound colloid was assessed using a laser particle size analyzer. Zeta potential determination: Following the methodology developed by Wu et al. [20], the colloidal solution was diluted 10-fold with deionized water, and the zeta potential of the FG–FFG colloidal solution was determined by a zeta potential analyzer. Turbidity determination: Based on the approach put forward by Joshi et al. [21], the FG–FFG colloid solution was diluted 10-fold with deionized water. The spectrophotometer was first calibrated to 100% transmittance using deionized water, and then the absorbance of the diluted sample was measured at 600 nm using a UV-visible spectrophotometer. Turbidity of the solution was calculated according to Formula (1):
T ( N T U ) = 2.302 A V I
where T was used to characterize turbidity, A was the absorbance of FG at 600 nm, V was the dilution factor, and I was the optical path difference of 0.01 m.

2.7. Determination of Fluorescence Spectroscopy

Following the methodology developed by Xu et al. [22], the FG–FFG colloidal solution was diluted 10-fold with deionized water, and the spatial conformation of the modified FG dilute solution was determined using a fluorescence spectrometer. The instrument parameters were set as follows: the excitation wavelength was set at 285 nm, the slit width was adjusted to 5.0 nm, and fluorescence emission spectra were recorded within the range of 300 to 400 nm.

2.8. FTIR

The FG–FFG complex solution was subjected to freeze-drying to facilitate the determination of the infrared spectra of the samples, with minor modifications to the method described by Hu et al. [23]. Eight scans were performed on an infrared spectrometer, with each sample ranging from 4000 to 500 cm−1, and the resulting data were graphed with the wave number on the x-axis and absorbance on the y-axis.

2.9. ESEM

The FG–FFG complex solution was placed in a refrigerator at 4 °C and cut into thin adhesive blocks approximately 2–3 mm thick. The blocks were subsequently immersed in a 2.5% glutaraldehyde solution, which had been diluted with 0.2 M phosphate buffer (pH 7.0). They were then fixed at 4 °C for 12 h, followed by three rinses with distilled water, and subsequently lyophilized. After this process, the samples were mounted on conductive gel. The gel network structure of the composite colloid was visualized under a scanning electron microscope in a low-vacuum environment [24].

2.10. Data Analysis

All experiments were conducted in triplicate and the data were presented as mean ± standard deviation (SD). Statistical analysis was performed using SPSS 26 software. Significant differences between groups were determined at p < 0.05. Figures were generated using Origin 2024.

3. Results

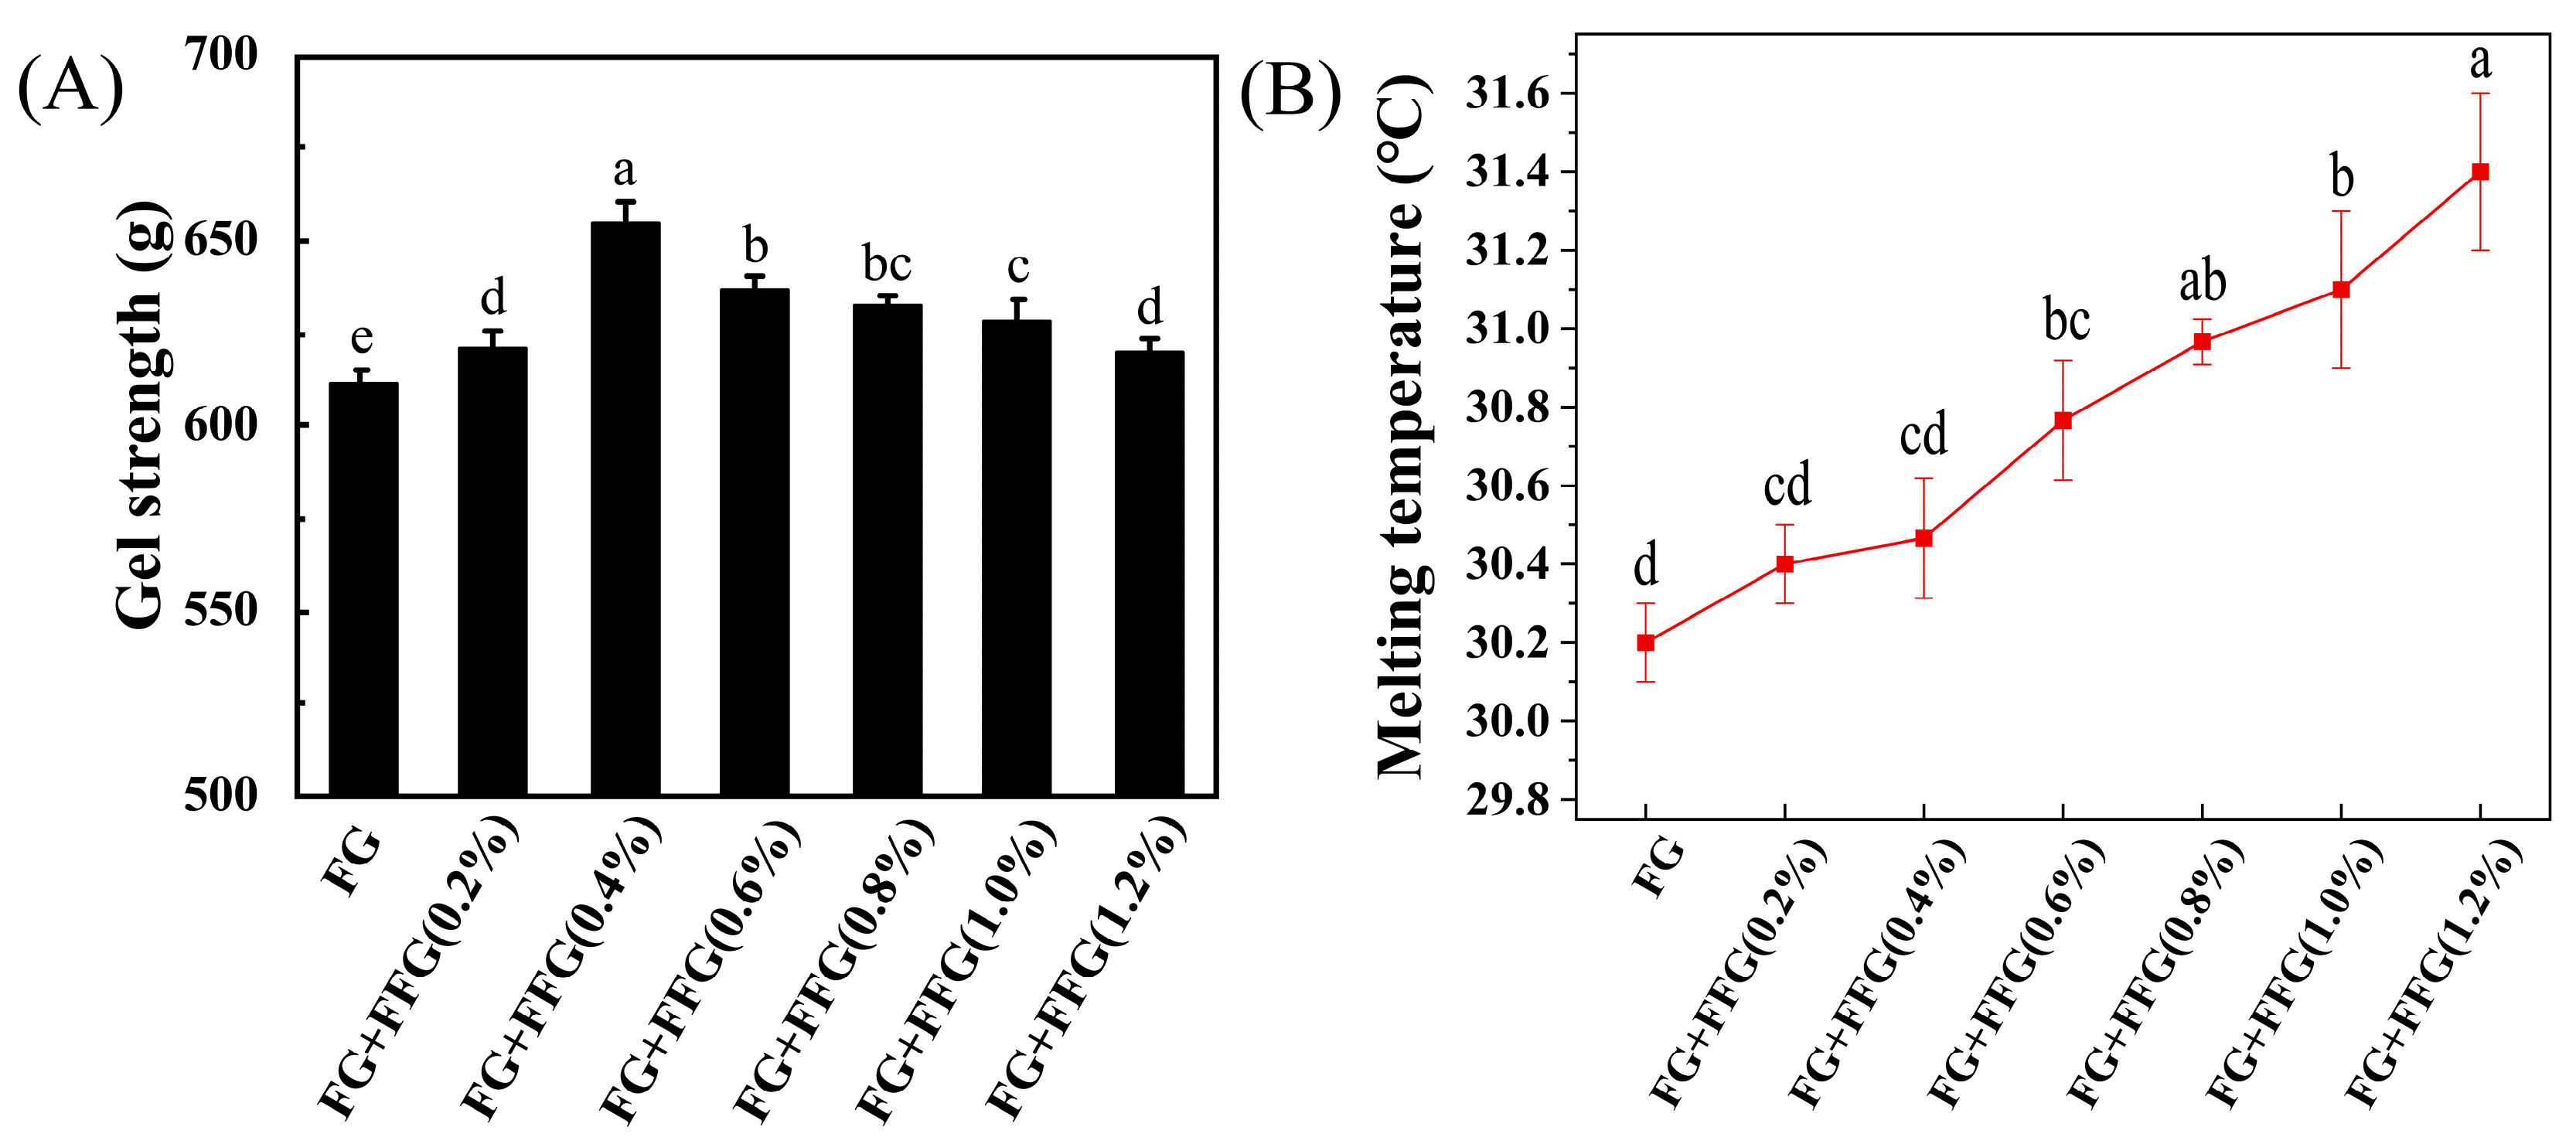
3.1. Effect of FFG Concentration on the Gel Strength of FG

As shown in Figure 1A, the gel strength of the unmodified FG was 611.33 g. The gel strength of the FG–FFG complex solution initially increased and then decreased with the FFG concentration increased, reaching a maximum of 654.45 g when the FFG concentration was 0.4%. The result indicated that an appropriate FFG concentration could notably improve the gelation properties of FG, as described in the method proposed by Huang et al. [25]—who reported that 1–3% pectin improved the gelation and viscosity of FG, whereas 5% pectin weakened the gel network and reduced hardness.

3.2. Effect of FFG Concentration on the Melting Temperature of FG

As shown in Figure 1B, the melting temperature of unmodified FG was 30.2 °C. The melting temperature of FG modified with FFG was generally higher compared to the unmodified FG. The melting temperature of the FG–FFG complex solution exhibited a significant increase as the concentration of FFG raised. Specifically, when the FFG concentration reached 1.2%, the melting temperature of the complex solution peaked at 31.4 °C. This observation was somewhat in line with the results reported by Sow et al. [12]. The authors noted that adding κ-carrageenan (κC) to FG caused a rise in the melting temperature of the formed composite.

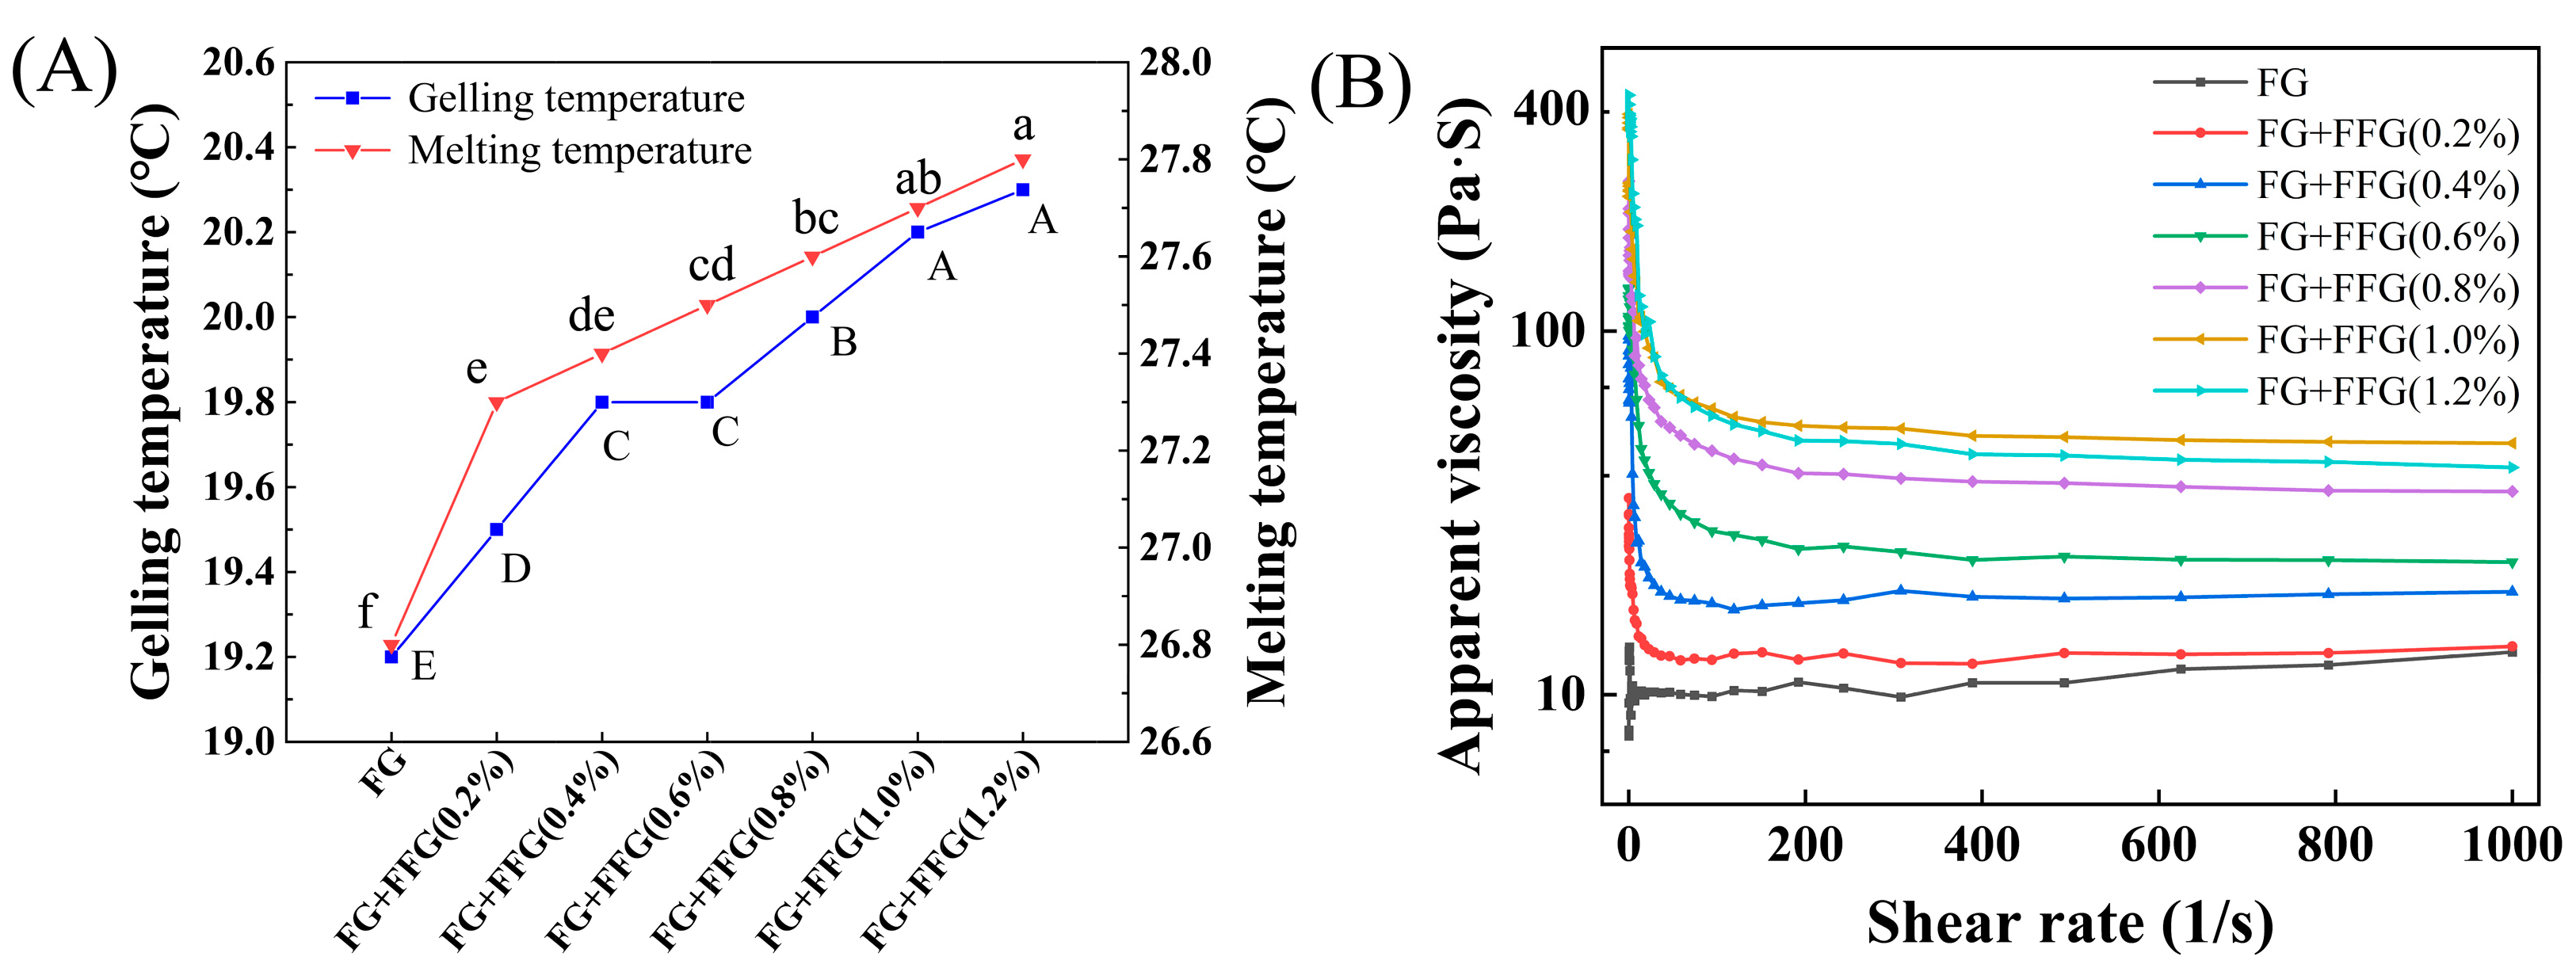
3.3. Effect of FFG Concentration on the Rheological Properties of FG

3.3.1. Effect of FFG Concentration on the Gelling–Melting Temperature of FG

The effect of FFG on the gelation–melting process of FG was shown in Figure 2A. During the gelation process, the gelling temperature of the unmodified FG was 19.2 °C. This was partially similar to Karim et al. [5], who reported that the gelling temperature of FG was 8–25 °C. As the FFG concentration increased, the gelling temperature exhibited a pattern of initial increase, followed by stabilization, and subsequent further increase. When the FFG concentration reached 1.2%, the gelling temperature of the FG–FFG complex solution peaked at 20.3 °C. During the melting process, the melting temperature of the complex solution steadily increased from 26.8 °C to 27.8 °C with an increase in FFG concentration.

3.3.2. Effect of FFG Concentration on the Viscosity of FG

The apparent viscosity of the FG–FFG complex solution exhibited an initial increase followed by a decrease as the concentration of FFG raised (Figure 2B). When the FFG concentration was lower than 1.0%, the apparent viscosity gradually increased with the increase of concentration. When the concentration of FFG reached 1.0%, the apparent viscosity began to decrease. This was partially similar to Gómez-Guillén et al. [26] and Kołodziejska et al. [27], who reported that the viscosity of FG can be enhanced by increasing the concentration of MTGase. This phenomenon can be ascribed to the decreased mobility of water molecules due to the action of MTGase, which provides greater resistance to flow and consequently increases the viscosity of the product.

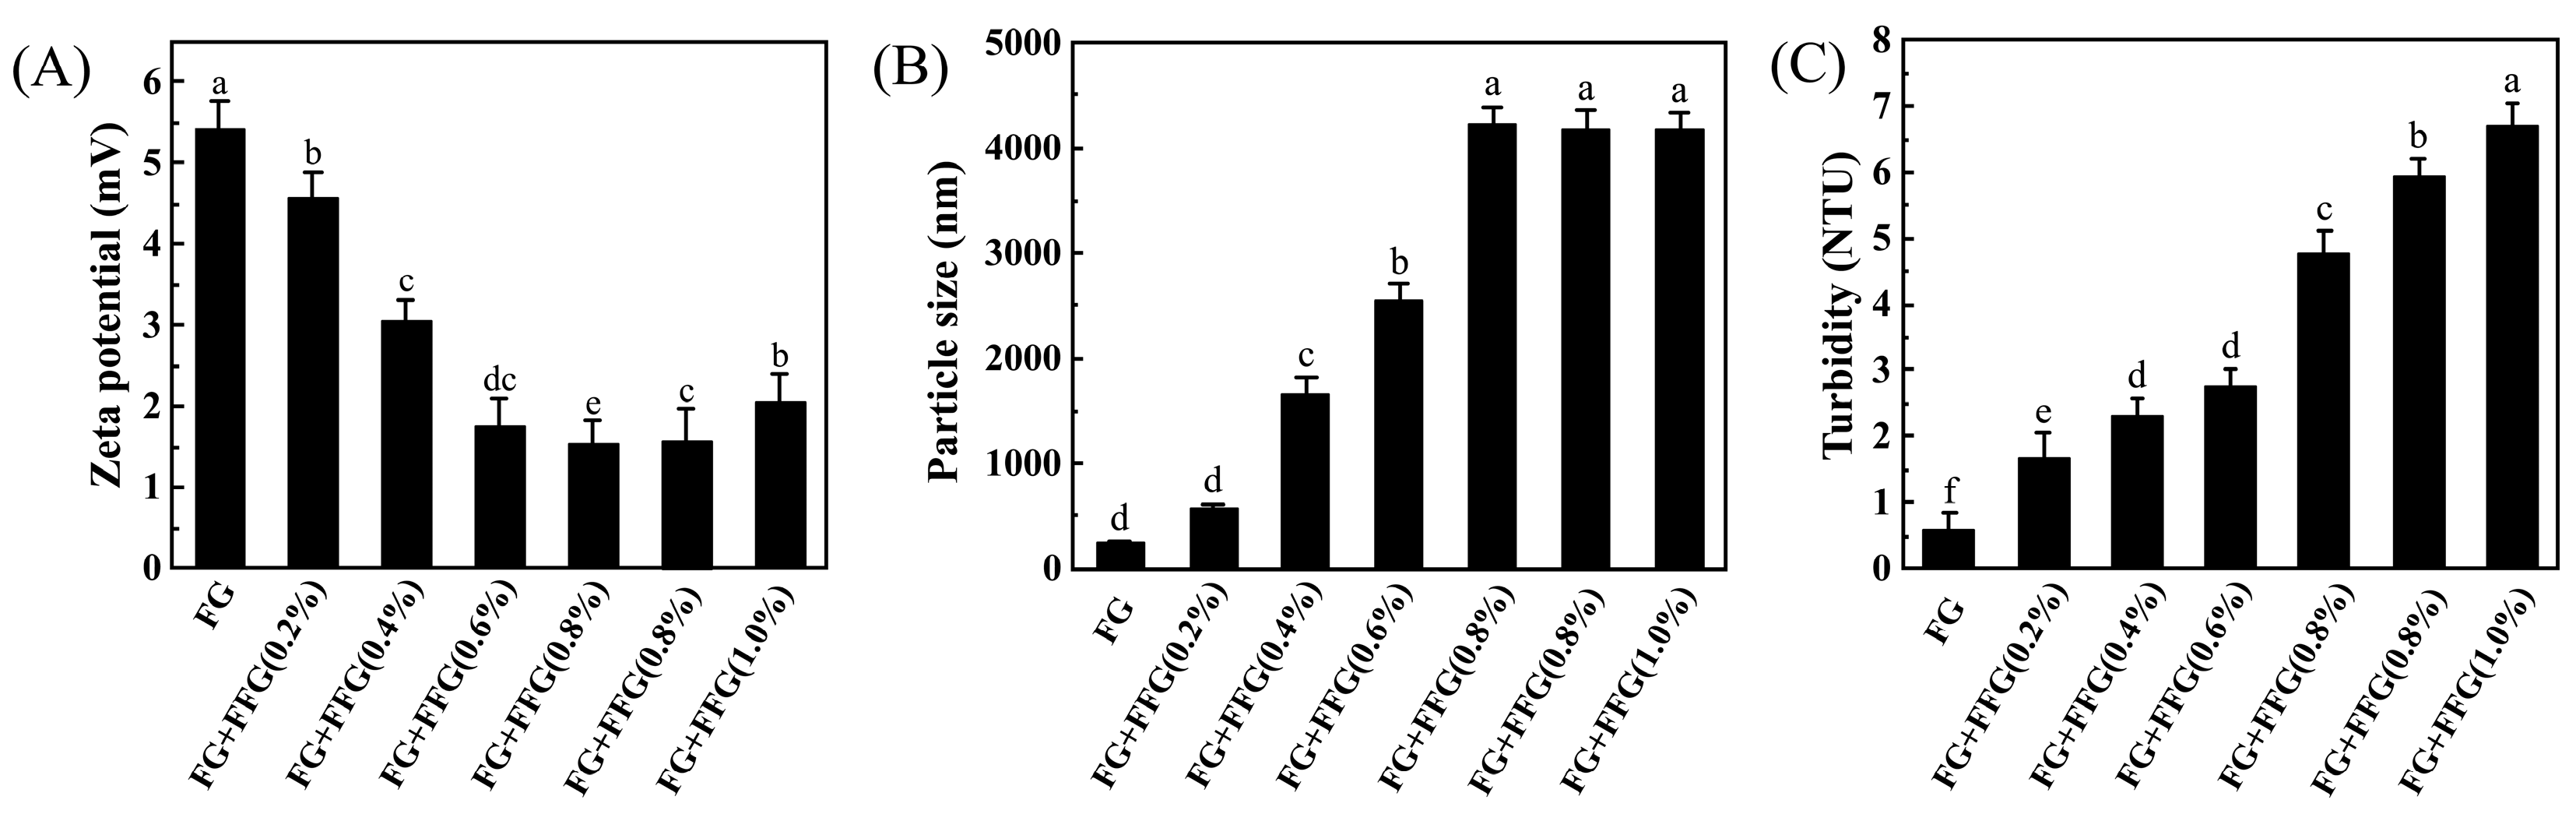
3.4. Effect of FFG Concentration on the Zeta Potential of FG

As shown in Figure 3A, a highly significant potential difference (p < 0.05) was observed between unmodified FG and the FG–FFG composite solution. With the FFG concentration increased, the zeta potential of the composite solution remained positive but exhibited an overall downward trend. When the concentration of FFG was 0.8%, the zeta potential of the composite solution reached the lowest value. When the FFG concentration increased from 1.0% to 1.2%, the zeta potential of the system increased slightly.

3.5. Effect of FFG Concentration on the Particle Size of FG

It can be observed from Figure 3B that as the concentration of FFG increased the particle size of the FG–FFG composite system first increased and then tended to stabilize. The particle size of the unmodified FG was 242.45 nm. When the concentration of FFG was 0.8%, the particle size peaked at 4228.94 nm.

3.6. Effect of FFG Concentration on the Turbidity of FG

As the concentration of FFG increased, the turbidity of the FG–FFG composite solution also gradually increased (Figure 3C). The turbidity rose from 0.59 NTU to 6.71 NTU. When the concentration reached 1.2%, the turbidity of the system peaked. At this point, FG and FFG exhibited strong electrostatic interactions. This was partially similar to Cheng et al. [28], who reported that the turbidity of the FG solution increased with the concentration of carboxylated chitosan and reached its maximum turbidity when the carboxylated chitosan concentration was 0.2%.

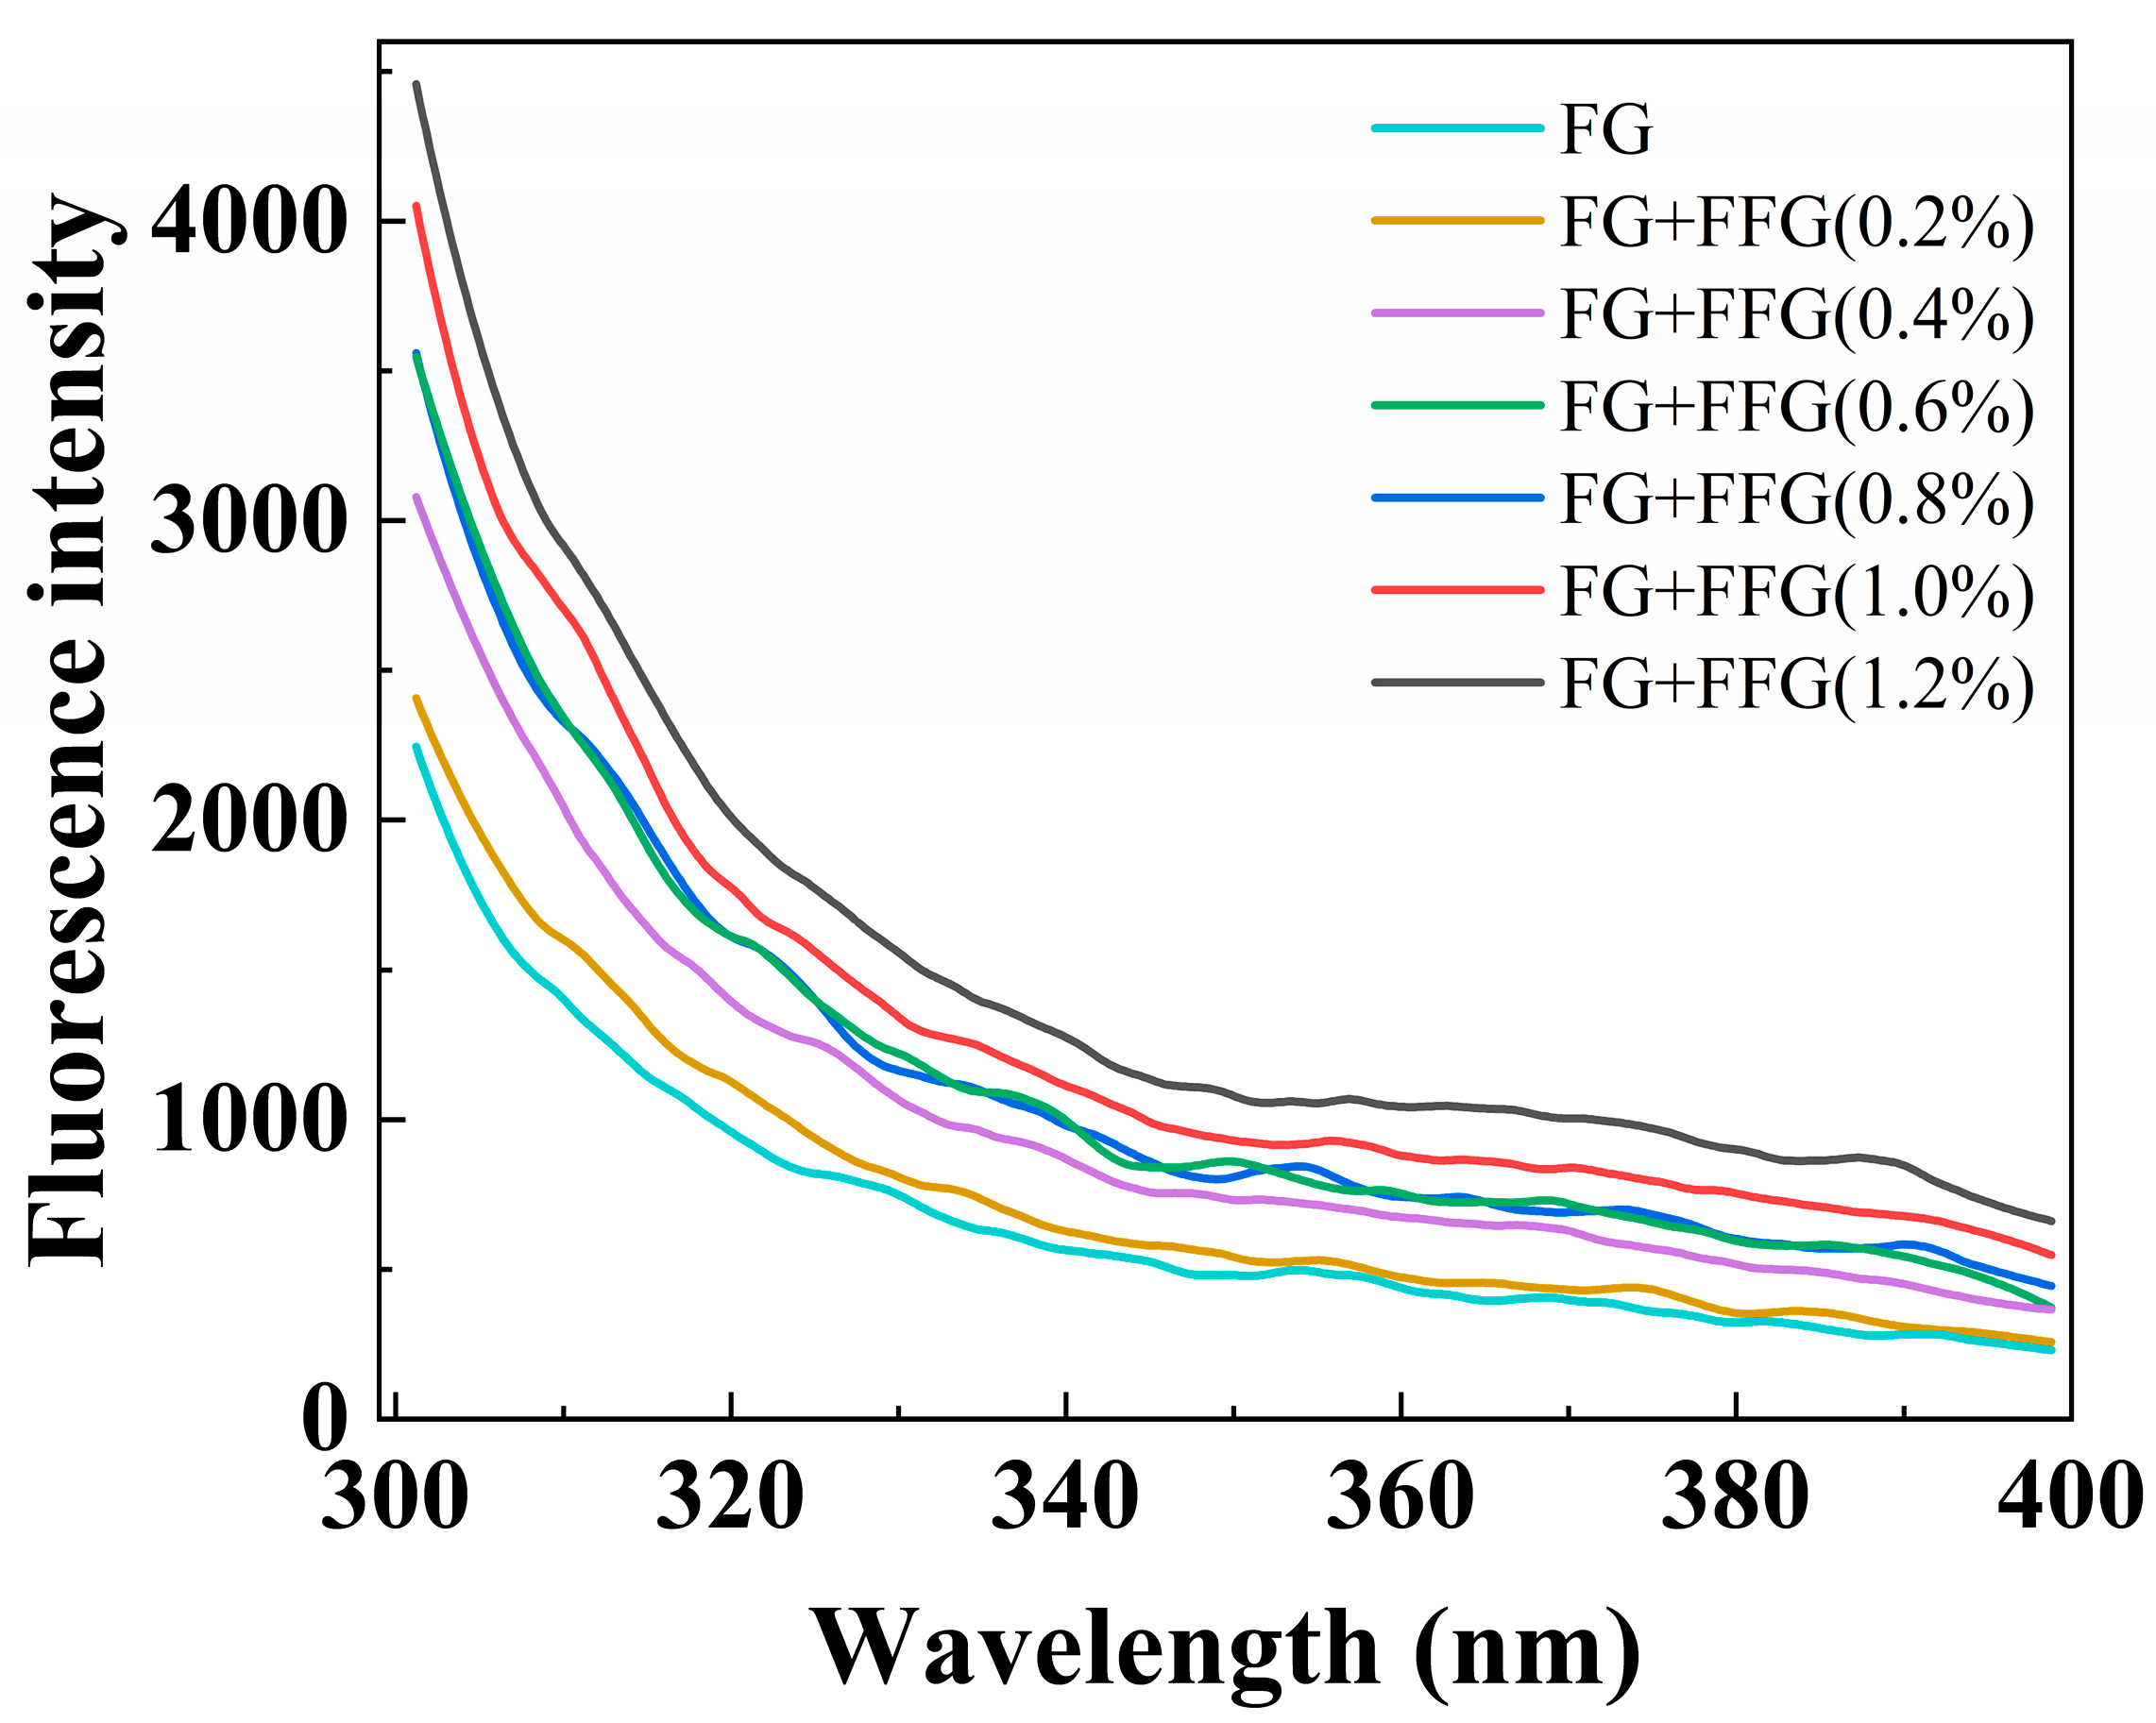
3.7. Analysis of Fluorescence Spectroscopy

Figure 4 showed that the fluorescence intensity of the FG–FFG complex system increased significantly with the increase of FFG concentration. When the FFG concentration reached 1.2%, the fluorescence intensity of the composite system peaked, and the turbidity of the system was the highest at this time. This phenomenon was consistent with the turbidity trend shown in Figure 3C.

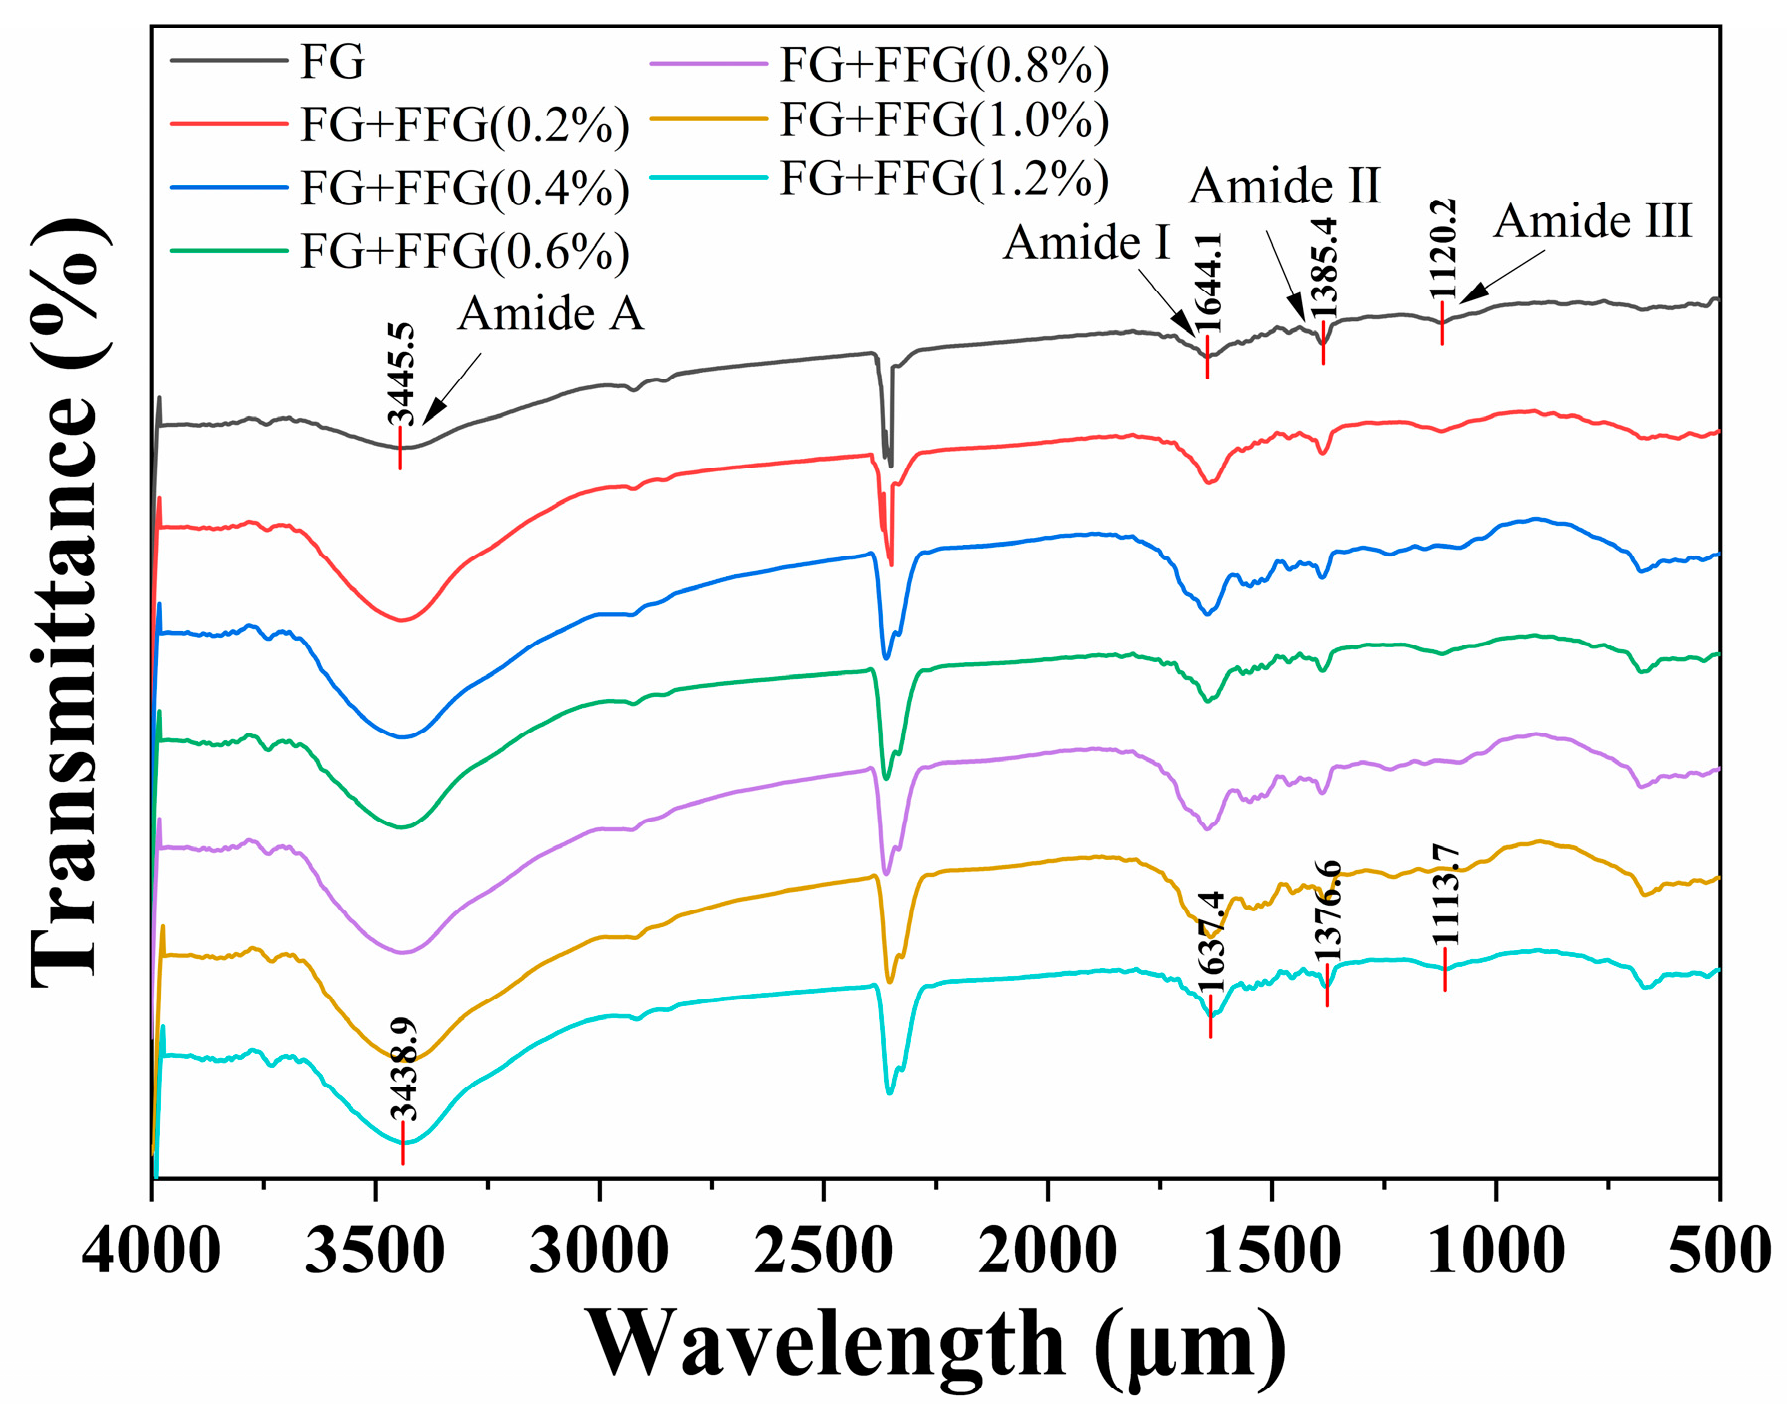
3.8. Analysis of FTIR

It could be seen from Figure 5 that the peak positions in the composite system had not changed and all had characteristic absorption peaks of amide A (3600~3200 cm−1), amide I (1700–1600 cm−1), amide II (1560–1335 cm−1), and amide III (1330–670 cm−1) [29]. Hassan et al. [30] also reported comparable outcomes, suggesting that the addition of FFG does not destroy the typical functional groups in FG. The amide A band of unmodified FG was located at 3445.5 cm−1, while after modification with different concentrations (0.2–1.2%) of FFG, the positions of the amide A band were 3440.5, 3439.9, 3439.5, 3439.2, and 3438.9 cm−1, respectively. In addition, the amide I band of unmodified FG was located at 1644.1 cm−1; after modification by 0.2–1.2% FFG, its amide I band shifted to 1642.7–1637.4 cm−1. The amide II band of unmodified FG was located at 1385.4 cm−1 and the wavenumber of the 0.2–0.8% FFG modified samples remained unchanged. When the concentration of FFG rose to 1.0% and 1.2%, the wave numbers of amide II bands both decreased to 1376.6 cm−1. The infrared signal of amide III showed no significant change (1120.2–1113.7 cm−1).

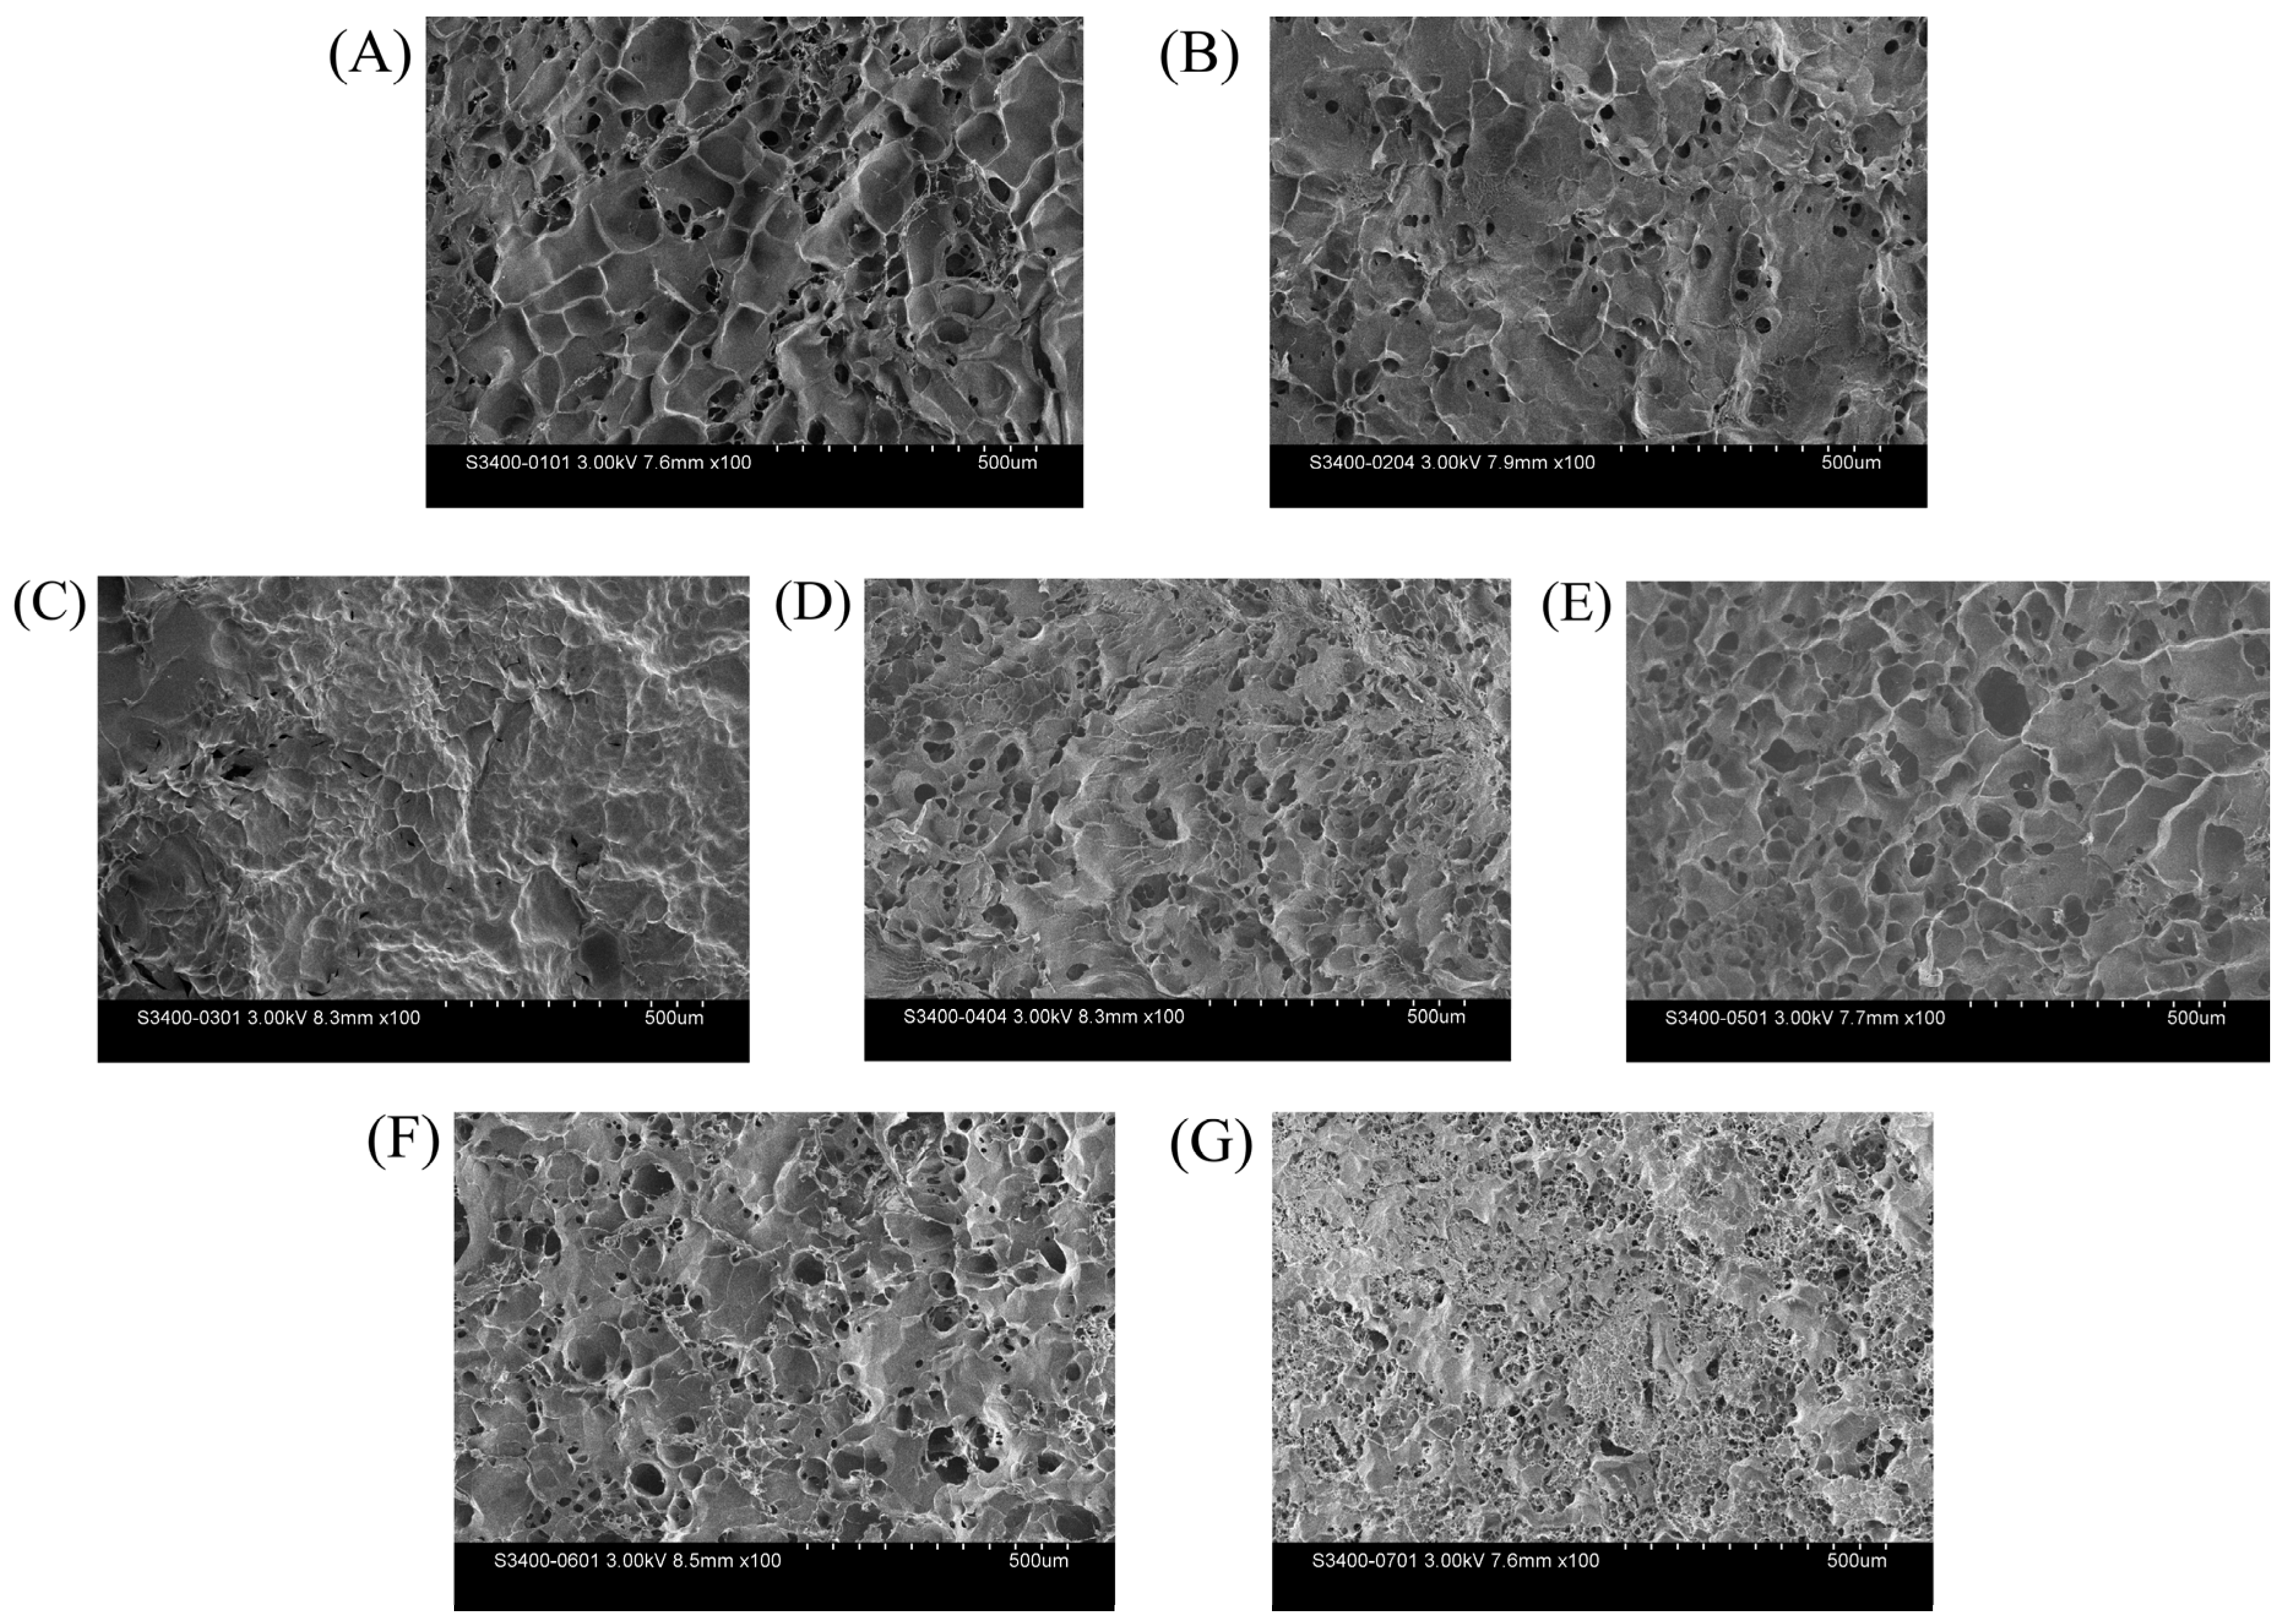
3.9. The Influence of FFG on the Microstructure of FG

As shown in Figure 6, the unmodified FG was spongy or coral-like, with irregular blocky structures and many holes of different sizes formed on its surface. With the FFG concentration increased, FG tended to form a denser and more uniform gel network structure. As shown in Figure 6B,C, when the concentration of FFG was 0.2% the pores of the colloid were significantly reduced, and the surface appeared relatively smooth. When the concentration increased to 0.4%, FG combined with FFG formed a larger aggregate, and the pores almost disappeared. This resulted in a well-formed gel network structure which aligned with the findings from the gel strength analysis. When the concentration of FFG was between 0.6% and 1.2%, as shown in Figure 6D–G, the reticular structure of the colloid weakened and the pores reappeared.

4. Discussion

The gel strength serves as a crucial parameter in assessing the quality of FG [31]. As the concentration of FFG was progressively raised, the gel strength of the FG–FFG complex solution initially increased and subsequently decreased. This improvement can be ascribed to the formation of electrostatic complexes between FFG and FG, which alter protein aggregation patterns and strengthen the gel network structure. Anionic polysaccharides, such as FFG, are known for improving the gel performance of proteins through electrostatic interactions and hydrogen bonding, and play a critical role in stabilizing gelatin networks [32]. However, excessive FFG concentration may disrupt the gel structure by inducing over-crosslinking, which interferes with hydrogen bond formation and destabilizes the network balance. In conclusion, an appropriate concentration of FFG can achieve the effect of enhancing gel strength.
The melting temperature serves as a crucial parameter in assessing the gelling characteristics of FG [9]. Generally, the melting temperature of FG (11–28 °C) is lower than mammalian gelatin (28–31 °C) [33]. The melting temperature was primarily influenced by several factors, including the amino acid composition of FG, such as proline and hydroxyproline, the ratio of α chain to β chain, and the molecular weight distribution [5,10]. In this research, both static (controlled temperature water bath) and dynamic methods (rheometer) were employed to examine how different concentrations of FFG influence the melting temperature of FG [19]. According to Figure 1B and Figure 2A, the trend of the melting temperature of the two methods was almost consistent, and the values measured by the static method were higher. This discrepancy likely arises from the fact that the addition of FFG increased the viscosity of FG, thereby restricting the upward movement of bubbles. As the concentration of FFG increased, the melting temperature of the FG–FFG composite solution also rose. This phenomenon was primarily due to the electrostatic interactions and hydrogen bonds formed between FG and FFG. The interactions collectively facilitated the development of triple helix structures within the composite colloid, thereby establishing a more stable gel network [1]. During the gelling process, it was observed that the gelling temperature of the composite solution rose in tandem with the increasing concentration of FFG. The entire system underwent a single-phase transformation from solid to liquid, accompanied by a structural change of the colloid from the triple helix to the irregular coil state [34,35]. In conclusion, modification with FFG can increase the melting temperature of FG and improve its mouth melting defects, showing great application potential in the production of candies, capsules, and other products.
Viscosity is a critical parameter in assessing the quality of gelatin, and its measurement results are affected by multiple factors including shear rate, solution pH, and time [36]. As shown in Figure 2B, the apparent viscosity of the FG–FFG complex solution initially increased and subsequently decreased with the addition of FFG. Generally, the alterations in apparent viscosity are indicative of changes in the intermolecular forces among proteins. The greater the intermolecular attraction, the higher the apparent viscosity of the protein solution [37]. The observed trend is primarily due to the electrostatic and hydrogen bond interactions between FFG and FG. These interactions facilitate the formation of protein aggregates. These interactions increase the effective mass concentration within the colloidal solution, thereby enhancing the complex viscosity [38,39]. However, excessive addition of FFG may augment electrostatic repulsion between its charged groups, weakening intermolecular forces and causing a decline in overall apparent viscosity [40].
When two biopolymers are mixed, they may undergo binding or phase separation [37]. The stability of the composite system and the electrostatic interactions influencing can be evaluated by analyzing zeta potential changes. As shown in Figure 3A, the zeta potential of the composite solution decreased with increasing FFG concentration (<1.0%), this suggested that the positive charges present on fish gelatin FG were progressively neutralized by the negative charges of FFG, driving electrostatic interactions and forming unstable complexes [38,39]. However, when the FFG concentration increased from 1.0% to 1.2%, a slight increase in zeta potential was observed. This suggested a weakening of electrostatic interactions within the composite systems, thereby enhancing their stability. The magnitude of the zeta potential serves as a crucial metric for evaluating the stability of colloidal systems. The larger the value, the higher the stability [41]. Therefore, excessive modification of FFG may undermine the stability of the system. It can be observed from Figure 3B, the particle size of the FG–FFG system initially increased and subsequently exhibited a slight decrease as the concentration of FFG raised. This trend suggests that FFG facilitates the formation of high-molecular-weight polymers within the system [40]. This phenomenon may arise from the electrostatic interaction between the positively charged FG and the negatively charged FFG, which leads to condensation polymerization and the formation of macromolecules [42]. At a high FFG concentration, the reduction in particle size might be due to excessive negative charges disrupting the charge balance, leading to the partial breakdown of the polymer structure and a corresponding decrease in the size of the particles [43]. Therefore, modifying FG with an appropriate amount of FFG can effectively increase its particle size. The formation of insoluble complexes was indicated by turbidity, which occurred through three primary stages. Electrostatic interaction formed soluble protein–polysaccharide complexes, which then aggregated into quasi-neutralized complexes. Ultimately, the complete neutralization of charges induced the macroscopic phase separation into phases that were rich in complexes and phases that were rich in solvent [41]. Figure 3C showed that the turbidity of the system was found to increase upon the addition of FFG, which may be due to the charge neutralization promoting the formation of insoluble polymers, and the turbidity rose with the accumulation of polymers. Consistent results were achieved by Yang et al. [44], who documented that the densest insoluble complex forms when charges are neutralized. Therefore, the FFG modification increased the turbidity of FG. In conclusion, FFG interacts with FG via electrostatic forces, thereby resulting in an increase in both the particle size and turbidity of FG.
Tyrosine and phenylalanine, which are present in gelatin, serve as the primary fluorescent components. Fluorescence analysis is capable of reflecting subtle alterations in the tertiary structure of proteins [38]. As shown in Figure 4, the fluorescence intensity of the FG–FFG complex system exhibited a significant increase as the concentration of FFG was elevated. This may be attributed to the fact that the negatively charged FFG interacts with FG via electrostatic forces, disrupting the hydrogen bonds or hydrophobic interactions within FG molecules. This disruption induces a conformational change from a tightly folded state to an extended state [40]. In the extended conformation, the fluorescent groups that were originally concealed within the molecules were exposed to the polar solvent. This exposure led to a reduction in the self-quenching effect among these groups, which in turn amplified the fluorescence signal [45]. The findings indicated that the incorporation of FFG was capable of altering the tertiary structure of FG.
FTIR can reflect the functional group information of proteins and their secondary structures. Figure 5 showed that the Amide A peak of FG was relatively regular, reflecting the inherent hydrogen bond network of fish gelatin. The peak width of the modified amide A slightly increased, indicating that the hydroxyl and other groups of FFG formed a weak interaction with the N-H of fish gelatin. This interaction made the hydrogen bond environment more complex, but did not completely destroy the original hydrogen bond framework [29]. The amide I band corresponds to the stretching vibrations of C=O and C=N [43,46]. Additionally, conformations such as β-sheet (1610–1642 cm−1), random coil (1642–1650 cm−1), and α-helix (1650–1660 cm−1) are distributed [46]. The modified amide I band showed a redshift phenomenon, which suggested that the addition of FFG promoted the adjustment of the secondary structure of FG. The proportions of structures such as α-helix and β-sheet changed, thereby enhancing the structural diversity [47]. The vibration characteristics of amide II bands are linked to N-H bending and C-N stretching vibrations [48]. It was observed that the peak intensity of the modified amide II showed a slight decrease, indicating that the addition of FFG promoted the loosening of the intermolecular packing structure of FG. With the weakening of the intermolecular constraint effect, the synchronization of N-H bending and C-N stretching vibration decreased, eventually leading to the attenuation of peak intensity [49]. The infrared signal of amide III showed no significant change, which might be due to the modification sites having no obvious effect on the vibration mode of the amide main chain bond [50].
As shown in Figure 6, with the increase in FFG concentration, the system tended to form a denser gel network structure. This indicated that, at this specific concentration, FFG interacted with FG through electrostatic interaction and hydrogen bonding, thereby enhancing its gel properties and increasing gel strength [51]. Subsequently, with the increase in FFG concentration, the network structure of the colloid weakened. This might be due to the excessive interaction between FG and FFG within this concentration range. Therefore, an appropriate amount of FFG was beneficial for enhancing the network structure of the composite colloid.

5. Conclusions

This study systematically explored the impact of different concentrations of FFG on the rheological properties and structural performance of FG. The modifications led to enhancements in the gel strength, gelling temperature, melting temperature, and viscosity of the FG. Specifically, the gel strength of the modified FG peaked at an FFG concentration of 0.4%, while the gel point and melting point temperatures reached their maximum values at 1.2% FFG. FTIR and ESEM analyses further revealed that incorporating FFG into FG promoted the formation of a dense and uniform gel network structure. Notably, the densest network structure of the composite colloid was observed at an FFG addition level of 0.4%. In conclusion, through intermolecular synergy, FFG effectively strengthened the gel network structure of FG and enhanced gel strength and viscoelasticity, indicating that FFG modification significantly improved the gel performance of FG. These research results not only reveal the interaction mechanism between FFG and FG but also provide crucial theoretical foundations for the development and process optimization of high-performance FG materials.

Author Contributions

T.-T.W.: Methodology, data curation, and writing—original draft. Y.-T.K.: Methodology, investigation, and writing—original draft. C.-Y.P.: Writing—review & editing. X.-W.H.: Writing—review & editing. P.Y.: Methodology and investigation. X.-M.S.: Methodology, funding acquisition, and data curation. Z.-Z.H.: Methodology, investigation, and data curation. All authors have read and agreed to the published version of the manuscript.

Funding

This research was funded by Xiao-Mei Sha. This study was supported by the Jiangxi Province Modern Agricultural Industrial Technology System Construction Project (JXARS-03-2025) and the earmarked fund for CARS (CARS-45).

Institutional Review Board Statement

Not applicable.

Informed Consent Statement

Not applicable.

Data Availability Statement

The data that has been used is confidential.

Acknowledgments

This study was supported by the Jiangxi Province Modern Agricultural Industrial Technology System Construction Project (JXARS-03-2025) and the earmarked fund for CARS (CARS-45).

Conflicts of Interest

The authors declare no conflicts of interests.

References

  1. Hu, Z.Z.; Sha, X.M.; Huang, T.; Yuan, C.H.; Chen, W.M.; Li, X.X.; Tu, Z.C. Gelling properties and structure modification of tilapia skin gelatin by the addition of γ-polyglutamic acid at different pH levels. Int. J. Food Sci. Technol. 2021, 56, 5812–5823. [Google Scholar] [CrossRef]
  2. Huang, T.; Tu, Z.C.; Shangguan, X.; Sha, X.; Wang, H.; Zhang, L.; Bansal, N. Fish gelatin modifications: A comprehensive review. Trends Food Sci. Technol. 2019, 86, 260–269. [Google Scholar] [CrossRef]
  3. Alfaro, A.d.T.; Balbinot, E.; Weber, C.I.; Tonial, I.B.; Machado-Lunkes, A. Fish gelatin: Characteristics, functional properties, applications and future potentials. Food Eng. Rev. 2015, 7, 33–44. [Google Scholar] [CrossRef]
  4. Sha, X.M.; Tu, Z.C.; Wang, H.; Huang, T.; Duan, D.L.; He, N.; Li, D.J.; Xiao, H. Gelatin quantification by oxygen-18 labeling and liquid chromatography-high-resolution mass spectrometry. J. Agric. Food Chem. 2014, 62, 11840–11853. [Google Scholar] [CrossRef] [PubMed]
  5. Karim, A.A.; Bhat, R. Fish gelatin: Properties, challenges, and prospects as an alternative to mammalian gelatins. Food Hydrocoll. 2009, 23, 563–576. [Google Scholar] [CrossRef]
  6. Thi, P.L.; Lee, Y.; Tran, D.L.; Thai Thanh Hoang, T.; Park, K.D. Horseradish peroxidase-catalyzed hydrogelation of fish gelatin with tunable mechanical properties and biocompatibility. J. Biomater. Appl. 2020, 34, 1216–1226. [Google Scholar] [CrossRef]
  7. Kaewruang, P.; Benjakul, S.; Prodpran, T. Effect of phosphorylation on gel properties of gelatin from the skin of unicorn leatherjacket. Food Hydrocoll. 2014, 35, 694–699. [Google Scholar] [CrossRef]
  8. Yang, D.Y.; Gao, S.; Yang, H.S. Effects of sucrose addition on the rheology and structure of iota-carrageenan. Food Hydrocoll. 2020, 68, 99–105. [Google Scholar] [CrossRef]
  9. Huang, T.; Tu, Z.C.; Wang, H.; Liu, W.; Zhang, L.; Zhang, Y.; ShangGuan, X.C. Comparison of rheological behaviors and nanostructure of bighead carp scales gelatin modified by different modification methods. J. Food Sci. Technol. 2017, 54, 1256–1265. [Google Scholar] [CrossRef]
  10. Tu, Z.C.; Huang, T.; Wang, H.; Sha, X.M.; Shi, Y.; Huang, X.Q.; Man, Z.Z.; Li, D.J. Physico-chemical properties of gelatin from bighead carp (Hypophthalmichthys nobilis) scales by ultrasound-assisted extraction. J. Food Sci. Technol. 2015, 52, 2166–2174. [Google Scholar] [CrossRef]
  11. Yu, Z.L.; Zeng, W.C.; Zhang, W.H.; Liao, X.P.; Shi, B. Effect of ultrasonic pretreatment on kinetics of gelatin hydrolysis by collagenase and its mechanism. Ultrason. Sonochem. 2016, 29, 495–501. [Google Scholar] [CrossRef] [PubMed]
  12. Sow, L.C.; Chong, J.M.N.; Liao, Q.X.; Yang, H. Effects of κ-carrageenan on the structure and rheological properties of fish gelatin. J. Food Eng. 2018, 239, 92–103. [Google Scholar] [CrossRef]
  13. Kajla, P.; Sharma, A.; Sood, D.R. Flaxseed—A potential functional food source. J. Food Sci. Technol. 2015, 52, 1857–1871. [Google Scholar] [CrossRef] [PubMed]
  14. Kaushik, P.; Dowling, K.; Adhikari, R.; Barrow, C.J.; Adhikari, B. Effect of extraction temperature on composition, structure and functional properties of flaxseed gum. Food Chem. 2017, 215, 333–340. [Google Scholar] [CrossRef]
  15. Cardoso Carraro, J.C.; de Souza Dantas, M.I.; Rocha Espeschit, A.C.; Duarte Martino, H.S.; Rocha Ribeiro, S.M. Flaxseed and human health: Reviewing benefits and adverse effects. Food Rev. Int. 2012, 28, 203–230. [Google Scholar] [CrossRef]
  16. Chen, C.; Huang, X.; Wang, L.J.; Li, D.; Adhikari, B. Effect of flaxseed gum on the rheological properties of peanut protein isolate dispersions and gels. LWT-Food Sci. Technol. 2016, 74, 528–533. [Google Scholar] [CrossRef]
  17. Moakes, R.J.A.; Sullo, A.; Norton, I.T. Preparation and characterisation of whey protein fluid gels: The effects of shear and thermal history. Food Hydrocoll. 2015, 45, 227–235. [Google Scholar] [CrossRef]
  18. Tabarestani, H.S.; Maghsoudlou, Y.; Motamedzadegan, A.; Mahoonak, A.R.S. Optimization of physico-chemical properties of gelatin extracted from fish skin of rainbow trout (Onchorhynchus mykiss). Bioresour. Technol. 2010, 101, 6207–6214. [Google Scholar] [CrossRef]
  19. Huang, T.; Tu, Z.C.; Shangguan, X.; Wang, H.; Sha, X.M.; Bansal, N. Rheological behavior, emulsifying properties and structural characterization of phosphorylated fish gelatin. Food Chem. 2018, 246, 428–436. [Google Scholar] [CrossRef]
  20. Wu, B.C.; McClements, D.J. Microgels formed by electrostatic complexation of gelatin and OSA starch: Potential fat or starch mimetics. Food Hydrocoll. 2015, 47, 87–93. [Google Scholar] [CrossRef]
  21. Joshi, N.; Rawat, K.; Bohidar, H.B. pH and ionic strength induced complex coacervation of pectin and gelatin A. Food Hydrocoll. 2018, 74, 132–138. [Google Scholar] [CrossRef]
  22. Xu, X.; Liu, W.; Liu, C.; Luo, L.; Chen, J.; Luo, S.; McClements, D.J.; Wu, L. Effect of limited enzymatic hydrolysis on structure and emulsifying properties of rice glutelin. Food Hydrocoll. 2016, 61, 251–260. [Google Scholar] [CrossRef]
  23. Hu, Z.Z.; Sha, X.M.; Ye, Y.H.; Xiao, W.R.; Tu, Z.C. Effects of γ-polyglutamic acid on the gelling properties and non-covalent interactions of fish gelatin. J. Texture Stud. 2020, 51, 511–520. [Google Scholar] [CrossRef] [PubMed]
  24. Cona, C.; Bailey, K.; Barker, E. Characterization methods to determine interpenetrating polymer network (IPN) in hydrogels. Polymers 2024, 16, 2050. [Google Scholar] [CrossRef]
  25. Huang, T.; Zhao, H.; Fang, Y.; Lu, J.; Yang, W.; Qiao, Z.; Lou, Q.; Xu, D.; Zhang, J. Comparison of gelling properties and flow behaviors of microbial transglutaminase (MTGase) and pectin modified fish gelatin. J. Texture Stud. 2019, 50, 400–409. [Google Scholar] [CrossRef]
  26. Gómez-Guillén, M.C.; Sarabia, A.I.; Solas, M.T.; Montero, P. Effect of microbial transglutaminase on the functional properties of megrim (Lepidorhombus boscii) skin gelatin. J. Sci. Food Agric. 2001, 81, 665–673. [Google Scholar] [CrossRef]
  27. Kolodzlejska, I.; Kaczorowski, K.; Piotrowska, B.; Sadowska, M. Modification of the properties of gelatin from skins of Baltic cod (Gadus morhua) with transglutaminase. Food Chem. 2004, 86, 203–209. [Google Scholar] [CrossRef]
  28. Cheng, C.; Tu, Z.C.; Wang, H. pH-induced complex coacervation of fish gelatin and carboxylated chitosan: Phase behavior and structural properties. Food Res. Int. 2023, 167, 34–42. [Google Scholar] [CrossRef]
  29. Nagarajan, M.; Benjakul, S.; Prodpran, T.; Songtipya, P.; Kishimura, H. Characteristics and functional properties of gelatin from splendid squid (Loligo formosana) skin as affected by extraction temperatures. Food Hydrocoll. 2012, 29, 389–397. [Google Scholar] [CrossRef]
  30. Hassan, N.; Ahmad, T.; Zain, N.M.; Awang, S.R. A fuzzy graph based chemometrics method for gelatin authentication. Mathematics 2020, 8, 1969. [Google Scholar] [CrossRef]
  31. Geng, H.; Sun, W.; Zhan, S.; Jia, R.; Lou, Q.; Huang, T. Glycosylation with different saccharides on the gelling, rheological and structural properties of fish gelatin. Food Hydrocoll. 2024, 150, 22–32. [Google Scholar] [CrossRef]
  32. Cheng, Z.; Zhang, B.; Qiao, D.; Yan, X.; Zhao, S.; Jia, C.; Niu, M.; Xu, Y. Addition of κ-carrageenan increases the strength and chewiness of gelatin-based composite gel. Food Hydrocoll. 2022, 128, 54–59. [Google Scholar] [CrossRef]
  33. Huang, T.; Tu, Z.C.; Wang, H.; Shangguan, X.; Zhang, L.; Zhang, N.-H.; Bansal, N. Pectin and enzyme complex modified fish scales gelatin: Rheological behavior, gel properties and nanostructure. Carbohyd. Polym. 2017, 156, 294–302. [Google Scholar] [CrossRef] [PubMed]
  34. da Silva, R.S.G.; Pinto, L.A.A. Physical cross-linkers: Alternatives to improve the mechanical properties of fish gelatin. Food Eng. Rev. 2012, 4, 165–170. [Google Scholar] [CrossRef]
  35. da Silva, M.A.; Bode, F.; Grillo, I.; Dreiss, C.A. Exploring the kinetics of gelation and final architecture of enzymatically cross-linked chitosan/gelatin gels. Biomacromolecules 2015, 16, 1401–1409. [Google Scholar] [CrossRef]
  36. Hu, Z.Z.; Sha, X.M.; Huang, T.; Zhang, L.; Wang, G.Y.; Tu, Z.C. Microbial transglutaminase (MTGase) modified fish gelatin-γ-polyglutamic acid (γ-PGA): Rheological behavior, gelling properties, and structure. Food Chem. 2021, 348, 123–134. [Google Scholar] [CrossRef]
  37. Hong, T.; Iwashita, K.; Shiraki, K. Viscosity control of protein solution by small solutes: A review. Curr. Protein Pept. Sci. 2018, 19, 746–758. [Google Scholar] [CrossRef]
  38. Su, K.; Sun, W.; Li, Z.; Huang, T.; Lou, Q.; Zhan, S. Complex modification orders alleviate the gelling weakening behavior of high microbial transglutaminase (MTGase)-catalyzed fish gelatin: Gelling and structural analysis. Foods 2023, 12, 3027. [Google Scholar] [CrossRef]
  39. Ramanathan, G.; Hassan, M.; Rochev, Y. Optimising the viscoelastic properties of hyaluronic acid hydrogels through colloidal particle interactions: A response surface methodology approach. Colloids Surf. A 2024, 703, 34–41. [Google Scholar] [CrossRef]
  40. Feng, Q.; Jia, F.J.; Peng, Z.G.; Zheng, Y. Development of temperature-responsive suspension stabilizer and its application in cementing slurry system. Colloids Surf. A 2003, 658, 13–21. [Google Scholar] [CrossRef]
  41. Muhoza, B.; Xia, S.; Cai, J.; Zhang, X.; Duhoranimana, E.; Su, J. Gelatin and pectin complex coacervates as carriers for cinnamaldehyde: Effect of pectin esterification degree on coacervate formation, and enhanced thermal stability. Food Hydrocoll. 2019, 87, 712–722. [Google Scholar] [CrossRef]
  42. Guo, C.; Gemeinhart, R.A. Understanding the adsorption mechanism of chitosan onto poly(lactide-co-glycolide) particles. Eur. J. Pharm. Biopharm. 2008, 70, 597–604. [Google Scholar] [CrossRef] [PubMed]
  43. Wang, Y.R.; Yang, Q.; Du, Y.N.; Chen, H.Q. Chitosan can improve the storage stability of ovalbumin fibrils at pH higher than isoelectric point. Food Hydrocoll. 2023, 136, 65–71. [Google Scholar] [CrossRef]
  44. Yang, Y.; Anvari, M.; Pan, C.H.; Chung, D. Characterisation of interactions between fish gelatin and gum arabic in aqueous solutions. Food Chem. 2012, 135, 555–561. [Google Scholar] [CrossRef]
  45. Bae, W.; Yoon, T.Y.; Jeong, C. Direct evaluation of self-quenching behavior of fluorophores at high concentrations using an evanescent field. PLoS ONE 2021, 16, 21–28. [Google Scholar] [CrossRef]
  46. Yang, M.; Zhang, J.; Guo, X.; Deng, X.; Kang, S.; Zhu, X.; Guo, X. Effect of phosphorylation on the structure and emulsification properties of different fish scale gelatins. Foods 2022, 11, 804. [Google Scholar] [CrossRef]
  47. Lacy, H.A.; Jencová, V.; Hauzerová, S.; Stanishevsky, A. High-throughput fabrication, structural characterization, and cellular interaction of compositionally diverse fish gelatin/polycaprolactone (PCL) nanofibrous materials. J. Appl. Polym. Sci. 2023, 140, 15–18. [Google Scholar] [CrossRef]
  48. Kaewruang, P.; Benjakul, S.; Prodpran, T. Characteristics and gelling property of phosphorylated gelatin from the skin of unicorn leatherjacket. Food Chem. 2014, 146, 591–596. [Google Scholar] [CrossRef]
  49. Fang, Q.; Ma, N.; Ding, K.Y.; Zhan, S.N.; Lou, Q.M.; Huang, T. Interaction between negatively charged fish gelatin and cyclodextrin in aqueous solution: Characteristics and formation mechanism. Gels 2021, 7, 260. [Google Scholar] [CrossRef]
  50. Pan, J.; Li, Q.; Jia, H.; Xia, L.; Jin, W.; Shang, M.; Xu, C.; Dong, X. Physiochemical and functional properties of tiger puffer (Takifugu rubripes) skin gelatin as affected by extraction conditions. Int. J. Biol. Macromol. 2018, 109, 1045–1053. [Google Scholar] [CrossRef]
  51. Tang, W.; Pan, Q.; He, J.; Liu, J. Plant-based meat: The influence on texture by protein-polysaccharide interactions and processing techniques. Food Res. Int. 2025, 202, 76–82. [Google Scholar] [CrossRef]
Figure 1. Effect of different FFG concentrations on (A) the gel strength and (B) the melting temperature of FG. Note: different lowercase letters in the figure indicate significant differences. FG denotes fish gelatin, FFG designates flaxseed gum, and FG+FFG (0.2–1.2) signifies a gradient increase in FFG concentration (ranging from 0.2 to 1.2).
Fishes 10 00346 g001
Figure 2. Effect of different FFG concentrations on (A) the gelling–melting temperature and (B) the apparent viscosity of FG. Note: different lowercase and uppercase letters in the figure indicate significant differences. FG denotes fish gelatin, FFG designates flaxseed gum, and FG+FFG (0.2–1.2) signifies a gradient increase in FFG concentration (ranging from 0.2 to 1.2).
Fishes 10 00346 g002
Figure 3. Effect of different FFG concentrations on (A) the zeta potential, (B) the particle size, and (C) the turbidity of FG. Note: different lowercase letters indicate in the figure significant differences. FG denotes fish gelatin, FFG designates flaxseed gum, and FG+FFG (0.2–1.2) signifies a gradient increase in FFG concentration (ranging from 0.2 to 1.2).
Fishes 10 00346 g003
Figure 4. Effect of different FFG concentrations on the fluorescence intensity of FG. FG denotes fish gelatin, FFG designates flaxseed gum, and FG+FFG (0.2–1.2) signifies a gradient increase in FFG concentration (ranging from 0.2 to 1.2).
Fishes 10 00346 g004
Figure 5. The infrared spectrum of the FG–FFG composite system. FG denotes fish gelatin, FFG designates flaxseed gum, and FG+FFG (0.2–1.2) signifies a gradient increase in FFG concentration (ranging from 0.2 to 1.2).
Fishes 10 00346 g005
Figure 6. Microstructure diagram of the FG–FFG composite system (100 times). (AG): FG, FG+FFG (0.2%), FG+FFG (0.4%), FG+FFG (0.6%), FG+FFG (0.8%), FG+FFG (1.0%), FG+FFG (1.2%). FG denotes fish gelatin, FFG designates flaxseed gum.
Fishes 10 00346 g006
Disclaimer/Publisher’s Note: The statements, opinions and data contained in all publications are solely those of the individual author(s) and contributor(s) and not of MDPI and/or the editor(s). MDPI and/or the editor(s) disclaim responsibility for any injury to people or property resulting from any ideas, methods, instructions or products referred to in the content.

