Abstract
Understanding individual movement patterns in stream-resident salmonids is critical for conservation and river management, particularly in Mediterranean streams characterized by high environmental variability. We tagged 997 Mediterranean brown trout (Salmo trutta complex) and conducted an 11-month mark–recapture study using Passive Integrated Transponder (PIT) technology to assess movement behavior in the Flamisell River (Ebro Basin, northeastern Iberian Peninsula). Movements followed a leptokurtic distribution, with 81.8% of the individuals classified as sedentary (median movement = 24.9 m) and 18.2% as mobile (median movement = 376.2 m). Generalized linear models revealed distinct drivers of fish movement for each group. In sedentary trout, movement was mainly influenced by mesohabitat type, season, sex, and body size, with males and larger individuals moving farther. In mobile trout, mesohabitat type, density, and body size were key predictors. Movement patterns were repeatable over time, indicating consistent behavioral tendencies. These results support a bimodal movement strategy and highlight the importance of individual variation. Conservation planning should account for both sedentary and mobile groups to preserve functional and genetic connectivity and improve resilience of Mediterranean streams.
Keywords:
movement ecology; PIT telemetry; sedentary vs. mobile strategy; mesohabitat influence; repeatability of behavior Key Contribution:
This study reveals that Mediterranean brown trout exhibit consistent individual differences in movement behavior, shaped by both environmental factors and intrinsic traits such as sex and body size. It provides empirical support for a bimodal movement strategy—sedentary versus mobile—and highlights the need to consider such variation in conservation planning for stream-resident fish.
1. Introduction
Movement is a fundamental behavioral trait in stream-dwelling fishes. It critically enables individuals to locate and exploit essential habitats throughout their life cycles, respond to changing environmental and biotic conditions, and ultimately optimize fitness components such as growth, survival, and reproductive success [1,2,3]. Therefore, understanding fish movement patterns is essential for identifying appropriate spatial scales for effective population management and conservation strategies. In riverine systems, fish movements are governed by a dynamic interplay of extrinsic and intrinsic factors. These include water temperature [4,5], hydrological variability [6], habitat structure and resource availability [7,8], competitive interactions [9], age [10], and sex [11]. This ecological complexity generates substantial inter- and intra-specific variation in movement behaviors across both spatial and temporal scales [12,13].
Among salmonids, the brown trout (Salmo trutta complex) is a particularly well-studied model species, largely due to its ecological plasticity and its importance to both recreational and commercial fisheries [14,15]. Stream-resident brown trout populations exhibit a wide range of movement strategies, from sedentary individuals with home ranges of less than 50 m to highly mobile conspecifics capable of displacing several kilometers, particularly in response to seasonal shifts in the environment (e.g., water flow, temperature, food availability) or reproductive cues [16,17,18]. This variation in mobility often results in leptokurtic movement distributions, where the majority of individuals are sedentary and a minority exhibit large displacements [12,19]. The intrapopulation variability is influenced not only by extrinsic environmental factors but also by intrinsic traits such as body size, sex, and behavioral phenotypes, including boldness and exploratory tendency [20,21]. Previous studies have demonstrated that such behavioral traits often correspond to stable, repeatable movement patterns, underscoring the role of individual personality in shaping dispersal strategies [22]. Integrating these behavioral traits with environmental drivers is essential for understanding fish movement, assessing functional connectivity, predicting dispersal patterns, and developing conservation strategies to preserve both ecological functionality and genetic diversity [23].
In Mediterranean streams, brown trout exhibit genetically differentiated lineages within the Salmo trutta complex, reflecting a highly structured evolutionary history shaped by long-term geographic isolation and local adaptation [24]. Mediterranean populations are subjected to additional selective pressures such as highly variable hydrology and the increasing frequency of climate anomalies [25]. These environmental stressors have been associated with heightened dispersal tendencies and movement patterns that diverge from those populations in the more hydrologically stable systems of northern Europe. For example, a genetic study conducted in a Mediterranean river in northeastern Spain identified trout family groups dispersing over several kilometers, suggesting an adaptive response to harsh and unpredictable environmental conditions [26]. Nevertheless, studies directly monitoring individual movement in Mediterranean brown trout populations are scarce.
Consequently, we studied the spatial dynamics of individually tagged brown trout with Passive Integrated Transponder (PIT) tags over a year in a headwater stream on the Iberian Peninsula. Our primary objective was to identify the drivers of movement and to examine the extent of inter-individual variation within the population. The specific objectives of this study were (i) to quantify movement distances and their temporal variation; (ii) to evaluate the degree and consistency of behavioral variation among individuals; and (iii) to determine the relative contributions of environmental factors (e.g., mesohabitat type and population density) and individual traits (e.g., sex and body length) to observed movement patterns.
2. Materials and Methods
2.1. Study Area
Brown trout movements were monitored in the Flamisell River (Figure 1), a tributary of the Noguera Pallaresa River in the Ebro Basin (northeastern Iberian Peninsula). It originates in the Pyrenees and flows southward for about 31 km draining a watershed of 583 km2. The study reach (central point: 42°23′46″ N, 0°58′1″ E) was 3560 m long, with an average elevation of ca. 900 m above sea level (Figure 1). A weir at the upstream boundary prevents fish movement beyond the reach, which otherwise lacks physical barriers or major tributaries. The reach had a mean wetted width of 5.9 ± 1.7 m (µ ± SD) and an average depth of 35 ± 24 cm, with a channel slope of 53.3 m/km. Its morphology was primarily composed of pool–run–riffle sequences under a forested canopy. River hydrology is regulated by snowmelt in spring and increased rainfall in autumn, with lower flows in summer and winter (Ebro Water Authority; https://www.chebro.es, accessed on 07/04/2025). Brown trout of the Mediterranean lineage is the sole fish species present [27]. Recreational fishing pressure was negligible during the study period, with management regulations enforcing catch-and-release angling.
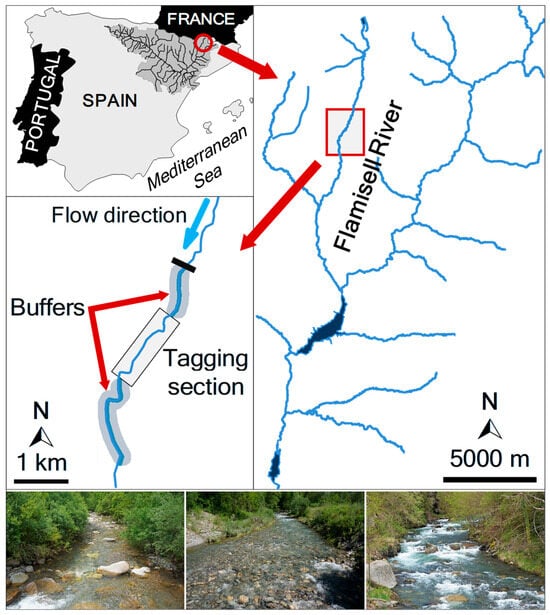
Figure 1.
Location of the study area in the Flamisell River (Ebro River basin). The location of the weir preventing upstream fish movements is indicated by a black bar (middle left panel). The photos show representative habitats in the reach. Photographs by Enric Aparicio.
2.2. Fish Sampling and PIT Tagging
Brown trout were sampled in April 2013 from a 2100 m core tagging zone within the 3560 m study reach (Figure 1). The core tagging segment was flanked by two buffer zones extending 800 m upstream and 1060 m downstream, used to detect potential fish movement beyond the tagging area. The reach was divided into 72 discrete sections based on mesohabitat units (pools, riffles, and runs), which were classified according to the velocity-to-depth ratio [28]. Fish were captured by electrofishing (Hans-Grassl GmbH ELT60-IIH backpack electrofisher, DC pulsed, 1.3 kW) and temporarily held in section-specific keep-nets. A total of 997 individuals with a fork length (FL) range between 80 and 310 mm were selected for PIT tagging. Fish were anesthetized with clove oil (1 mL/20 L stream water), measured for FL (to the nearest mm), and weighed (to the nearest 0.1 g). Two sizes of half-duplex (HDX) PIT tags (Oregon RFID, Portland, OR, USA) were used: 12 mm tags (0.1 g) for trout 80–120 mm FL, and 23 mm tags (0.6 g) for trout >120 mm FL (Figure 2). Tags were inserted into the peritoneal cavity via a ~5 mm lateral-ventral incision using a sterilized needle and injector. Incisions were treated with topical antiseptic, and the adipose fin was clipped to enable visual identification upon recapture. No mortality was observed during fish handling and tagging procedure. Clipped fin tissue was preserved in 95% ethanol for molecular sex determination, returning 606 females (65.4%) and 320 males (34.6%). Thus, overall sex ratio was significantly skewed (G = 1194, df = 1, p < 0.0001) to females (1.89:1). Tagged fish were released at their point of capture after full recovery. A second electrofishing survey was conducted in November 2013 to assess tag retention and detection efficiency. All procedures adhered to applicable Spanish and EU regulations for animal research and welfare.
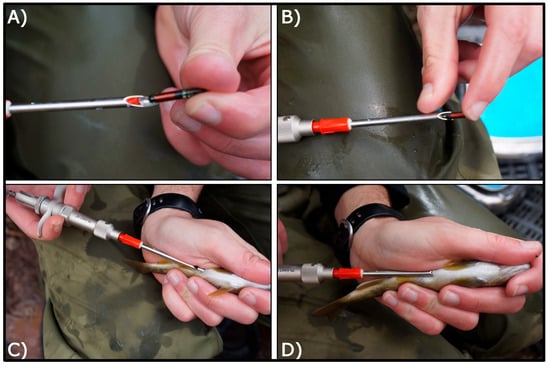
Figure 2.
Tagging procedure showing tag sizes (A,B), implantation technique (B–D), and anatomical positioning (C,D). Photographs by Enric Aparicio.
2.3. PIT Detection Surveys
The spatial locations of PIT-tagged brown trout were determined using a portable half-duplex (HDX) PIT tag detection system [29,30]. This system comprised an HDX Backpack PIT Reader (Oregon RFID, Portland, OR, USA) connected to a waterproof antenna mounted on a 2.5 m PVC pole. The maximum detection range varied between 30 and 55 cm, depending on PIT tag orientation. Detection surveys were conducted at approximately monthly intervals from June 2013 to February 2014 (N = 8 surveys). May survey was not possible due to high discharge from snowmelt, which precluded safe wading. In each survey, the entire 3560 m study reach was systematically scanned by wading upstream, ensuring full coverage of the wetted area. The operator maneuvered the antenna laterally across the channel, from bank to bank, covering the entire channel width. In deeper sections (>30 cm), the antenna was fully submerged to maximize detection efficiency. Upon detection of a PIT tag, the following data were recorded: unique tag code, date and time of detection, geographic coordinates (collected using a Leica Zeno GG03 GPS unit; Leica Geosystems, Heerbrugg, Switzerland), and mesohabitat type (pool, riffle, or run). To distinguish live fish from expelled tags, the operator disturbed the substrate near the detection point to flush fish from cover. Based on fish response, each detection was categorized as (i) live trout, the fish was visually confirmed or the signal ceased upon disturbance, indicating movement; (ii) possible live trout, the fish was not seen but the signal persisted following disturbance; or (iii) tag loss, the signal originated from clearly unsuitable habitat (e.g., shallow gravel bars or dry areas), suggesting mortality or tag expulsion. After each survey, detection histories were reviewed. Tags initially categorized as ’possible live trout’ were reclassified as ‘live trout’ if subsequent detections demonstrated active movement (i.e., a change in spatial location over time). Tags that did not meet this criterion, as well as those categorized as tag loss, were excluded from subsequent analyses.
2.4. Detection Efficiency Assessment
Detection efficiency was evaluated during the November survey by electrofishing (two-pass removal method) immediately after PIT scanning in two different 200 m sections of the study reach. Estimates of capture probability, derived from the electrofishing data, were applied to the number of recaptured tagged fish to estimate the total number of tagged individuals present in each section. Detection efficiency was then calculated as:
2.5. Data Analyses
Fish population size (N) for stream sections was estimated using a two-pass removal electrofishing method during the April tagging survey, following a method described by Seber and Le Cren [31]:
where C1 and C2 are the number of fish captured in the first and second pass, respectively. Fish density (individuals/m2) per section was calculated by dividing N by the sampled stream area.
Fish movement distances were quantified in QGIS [32] by measuring the longitudinal distance (m) between successive detection positions along the stream centerline. Movement direction was indicated by sign, positive values denoted upstream movement, and negative downstream. Absolute movement distances were used to quantify total displacement. Directional bias in fish movement (i.e., whether the mean displacement differed significantly from zero) was assessed with one-sample t-tests. To evaluate individual variability in movement behavior, the distribution of movement distances was tested for normality using the Shapiro–Wilk test, and kurtosis was calculated following the method described by Turchin [33]. Elevated kurtosis indicates evidence of leptokurtic (i.e., fat-tailed) distributions, and hence disproportionate contributions from highly mobile individuals [19].
Fish dispersal was modeled using the R package fishmove v0.3-3 [34]. This package implements a leptokurtic dispersal model based on a double-normal probability density function, enabling the estimation of the mean movement distance for the sedentary (σsed) and mobile (σmob) components, as well as the proportion of sedentary individuals within the total population (p). The fishmove package also predicts movement parameters for different species using multiple regression models that incorporate fish length, caudal fin aspect ratio, stream order, and time between observations [34]. Movement predictions were generated for a mean fork length of 165.1 mm (derived from April and November electrofishing surveys), Salmo trutta fario as species, stream order of 3, and time interval based on the interval between tagging and detection. Predicted values were compared to field estimates; thus, non-overlapping confidence intervals were considered indicative of significant differences.
Differences in maximum linear displacement (MLD, the distance between the most distant detection positions) between sex groups were analyzed with analysis of covariance (one-way ANCOVA), using fork length as covariate. Analysis of variance (two-way ANOVA) was used to compare trout fork length between mobile groups (i.e., mobile vs. sedentary), and sex groups. The proportion of gender categories was compared between mobile groups with a G-test of independence.
The effects of both environmental factors and fish traits on trout movement were analyzed with Generalized Linear Models (GLMs). Only those fish detected at least three times during the study period were included in the analysis. An information-theory approach was implemented to find the best predictive models following the methodology described by Burnham and Anderson [35]. GLMs were built including all possible combinations of independent variables (i.e., initial and final habitat, initial and final density, behavioral group, sex, fork length, and month), but excluding interactions due to the large number of variables included. Initial (habitat and density) refers to the condition of the section from which the individual departed, and final to the section to which the individual moved; the behavioral group classifies individuals as sedentary or mobile, and fork length was measured when tagging. Only those models performing significantly better than the null model and with a variance inflation factor ≤ 5, to avoid multicollinearity effects in regression models [36], were considered as candidate models. The degree of support for each candidate model was assessed with the second-order Akaike Information Criterion (AICc), rescaled to obtain ΔAICc values (ΔAICc = AICci − minimum AICc) [37]. Finally, since models with ΔAICc > 4 have less support, they were omitted from further consideration. The relative plausibility of each candidate model was assessed by calculating Akaike’s weights (wi), which range from 0 to 1 and can be interpreted as the probability that a given model is the best model in the candidate set. Because there was not a clearly best model (i.e., wi ≥ 0.9), we averaged regression coefficients (βi) by weighing selected model coefficients by model wi. The relative importance of each variable (i.e., the selection probability, SP) was also calculated by the sum of wi for all models in which a given variable occurs, which estimates the importance of an independent variable for differentiating the response variable (see Burnham and Anderson [35]). In addition to SP, we also provide standardized estimates of βi based on partial standard deviations for their variables following Cade [38]. See [18,39] for more details regarding model criteria selection. Model selection was performed with R software version 4.5.0 [40]; MuMIn 1.48.11 was used for multi-model inference analysis; car 3.1-3 was used for VIF analysis of each of the candidate models; and Nortest 1.0-4 was used for normality test analysis.
To assess consistency in individual movement behavior, a partial correlation analysis was conducted between sequential movement distances for fish with ≥2 recorded movements, controlling for fork length [41]. Prior to analysis, quantitative variables were log-transformed to improve linearity and homoscedasticity.
3. Results
3.1. Detection Efficiency and General Movement Patterns
A total of 997 individuals were captured and fin-clipped during the study. Tagged fish had a mean FL of 142.3 ± 36.7 mm (µ ± SD) and a mean weight of 39.1 ± 34.4 g. In the November electrofishing survey, 131 of 135 recaptured trout had retained their PIT tags, resulting in a tag retention rate of 96.3%. All recaptured fish exhibited complete healing at the tag insertion site, with no signs of external infection or abnormalities. The average capture probability of electrofishing was estimated at 0.52, while the mean detection efficiency for PIT-tagged individuals was 0.51. The number of detected individuals decreased over the study period, from 377 in July 2013 to 184 in February 2014 (µ ± SE: 299 ± 24 detections per sampling event). Over the entire study period, 70.4% of the tagged fish were detected at least once.
Overall, brown trout in the Flamisell River exhibited limited movement throughout the study. For individuals with three or more detections (N = 389), the mean maximum linear displacement (MLD, the distance between the most distant detection positions) was 130.01 ± 15.03 m, ranging from 0 to 2013 m. Of these, 96 individuals (24.7%) exhibited displacements of 20 m or less, 313 individuals (80.5%) displaced 100 m or less, and only 43 individuals (11.1%) moved more than 200 m. The median MLD across all tagged individuals was 40 m. The MLD was not significantly correlated with fork length (ANCOVA, F1, 386 = 1.78; p = 0.18), but it differed significantly between sexes (F1, 386 = 9.20; p = 0.003). Males moved significantly more than females, with mean displacements of 154.2 ± 27.2 m and 117.1 ± 17.9 m, respectively.
Between consecutive tracking surveys, the median distance moved by tagged individuals ranged from 0 to 1 m in all sampling events, except for June, when the median movement increased to 8 m (Figure 3). Directional movements (defined as upstream = positive, downstream = negative) were predominantly upstream across most sampling periods, except in December and February, when movements were primarily downstream. Mean directional movement reached a maximum in October (44.51 ± 16.60 m) and a minimum in December (−2.89 ± 9.28 m) (Figure 3). However, directional movement was significantly different only in October (Student’s t = 2.68, df = 143, p = 0.004), when it was mostly upstream (Figure 3).
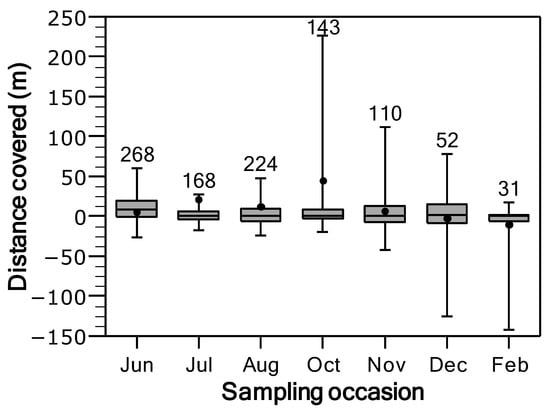
Figure 3.
Box plots of distance moved by brown trout in the Flamisell River from June 2013 to February 2014. The box corresponds to the 25th and 75th percentiles, the median is shown by the dark line inside the box, and the mean by the filled circle. Whiskers represent the 5th and 95th percentiles. Sample sizes are shown above each box plot. Positive and negative values denote upstream and downstream movements.
3.2. Mobile vs. Sedentary Individuals
The distance-frequency distribution derived from tracking data was highly right-skewed and leptokurtic, indicating a significantly greater than expected frequency of both short- and long-distance displacements relative to a normal distribution. Overall, the kurtosis value was 101.9 ± 0.16 (µ ± SE), exhibiting marked temporal variation. It ranged from a minimum of 7.91 ± 0.65 in December to a maximum of 151.2 ± 0.34 in August (Figure 4). The two-group exponential model for stream-resident brown trout, implemented using the fishmove package, provided a good fit to the observed dispersal frequency distribution (Figure 5). The estimated mean dispersal range (calculated as 1/λ) was 35.97 m for the sedentary group (representing 81.8% of the population) and 542.8 m for the mobile group (18.2% of the population). However, model parameters and derived estimates varied over the course of the study (Table 1). The proportion of sedentary individuals (p) declined from June to November and December (Table 1), reflecting increased mobility in late autumn. The mean dispersal range of the sedentary group (σsed) increased from 20.25 m in June to a peak of 31.00 m in October, before decreasing to 22.72 m by February. Similarly, the dispersal range of the mobile group (σmob) showed a marked increase from 303.60 m in June to 923.97 m in October, followed by a decline to 619.39 m in February (Table 1). Despite generally limited movement, 66.5% of sedentary individuals were detected in two or more distinct mesohabitat units, suggesting that these fish were not strictly site-attached but regularly shifted among adjacent habitats. Model predictions generated by fishmove closely matched empirical observations, with overlapping confidence intervals (Figure 6). However, during the spawning period and preceding months, observed movement distances in the mobile group exceeded model predictions, probable due to behavioral changes associated with reproduction not fully captured by the predictive model (Figure 6).
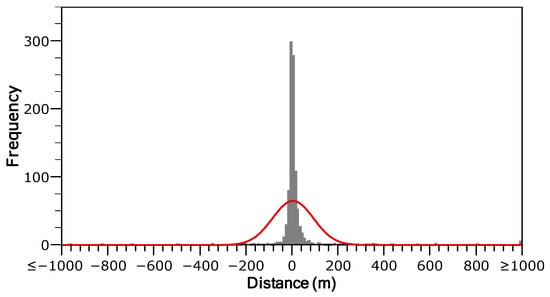
Figure 4.
Frequency distribution of total movement distances recorded between consecutive sampling surveys for brown trout in the Flamisell River. The red line is the fitted normal distribution (N = 996). Positive and negative values on the x-axis represent upstream and downstream movements, respectively.
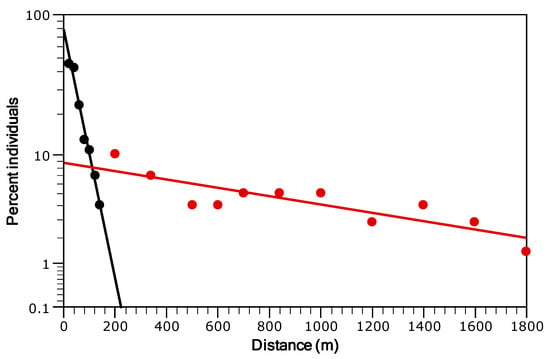
Figure 5.
Fit of the two-group exponential model to the frequency distribution of maximum linear displacement by individual brown trout with at least three detections (N = 270). Data are grouped into distance classes (irrespective of movement direction). Linear regressions are shown for the sedentary (black circles) and mobile (red circles) groups. Note the logarithmic scale on the y-axis.

Table 1.
Mean movement distances (in meters) and standard errors (SE) for both the sedentary (σsed) and the mobile (σmob) components of trout population, estimated from the two-group exponential model along the study period. The proportion of the sedentary group (p) is also shown.
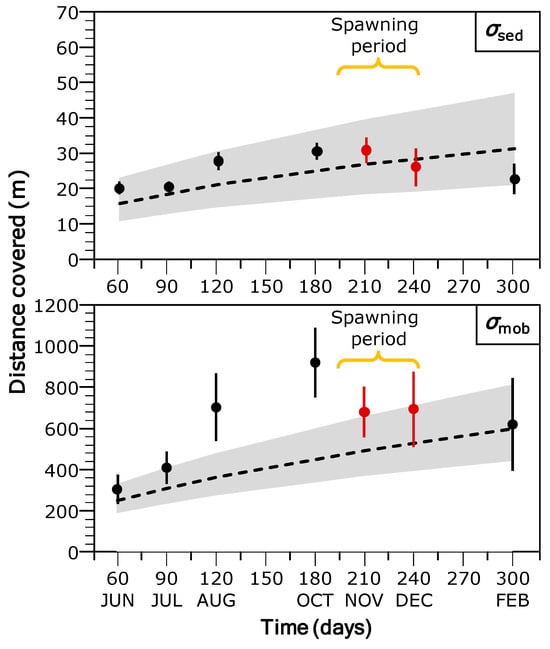
Figure 6.
Mean movement distance (±95% confidence interval) of sedentary (σsed) and mobile (σmob) brown trout groups along the study period (sampling occasion is also shown). Trout spawning period (red circles) is shown. The dashed line and shaded areas represent the median and 95% confidence interval, respectively, of the model-predicted movement distances from the fishmove package (see methods for details).
Overall, the sex ratio of brown trout did not vary between mobile and sedentary groups (G = 1.61, df = 1, p = 0.21). Furthermore, fish fork length did not show significant differences between sexes (ANOVA, p = 0.95), mobile groups (p = 0.37), or their interaction (p = 0.29). Therefore, differences between mobile and sedentary groups could not be explained by differences in size-class or sex composition.
3.3. Influence of Intrinsic and Extrinsic Factors on Movements
Several intrinsic and extrinsic factors were associated with brown trout movement patterns. An information-theoretic approach applied to a set of candidate GLMs identified seven plausible models (ΔAICc ≤ 4) explaining variability in trout movements. The best explanatory variables were initial habitat, sampling month, sex, fork length, and group classification (sedentary vs. mobile), as indicated by standardized parameter estimates and model selection probabilities (SP and βpSD; Table 2). In contrast, initial density and final habitat had the weakest relationship with trout movements. Fish group was a key factor explaining movements, indicating some differences between sedentary and mobile individuals. Thus, both groups were analyzed separately, improving model performance (see Pearson’s r values in Table 2 and Table 3, Figure 7).

Table 2.
Results from the information-theoretic framework analysis (Generalized Linear Models) to assess the influence of both intrinsic and extrinsic factors on brown trout movements in the Flamisell River. Model-averaged coefficients (β) are parameter coefficients; selection probability (SP) and standardized estimates of β based on partial standard deviations (βpSD) indicate the relative importance of each independent variable. Parameter bias is defined as the difference between model-averaged estimates and the corresponding full model coefficients. The table also includes the number (N) of plausible candidate models (∆AICc < 4) and the Pearson correlation coefficient (r) between observed and model-predicted values.

Table 3.
Results from the information-theoretic framework analysis (GLMs) to assess the influence of both intrinsic and extrinsic factors on brown trout movements in the Flamisell River, for both the sedentary and mobile group. Model-averaged coefficients (β) are parameter coefficients; selection probability (SP) and standardized estimates of β based on partial standard deviations (βpSD) indicate the relative importance of each independent variable. Parameter bias is defined as the difference between model-averaged estimates and the corresponding full model coefficients. The table also includes the number (N) of plausible candidate models (∆AICc < 4), and the Pearson correlation coefficient (r) between observed and model-predicted values.
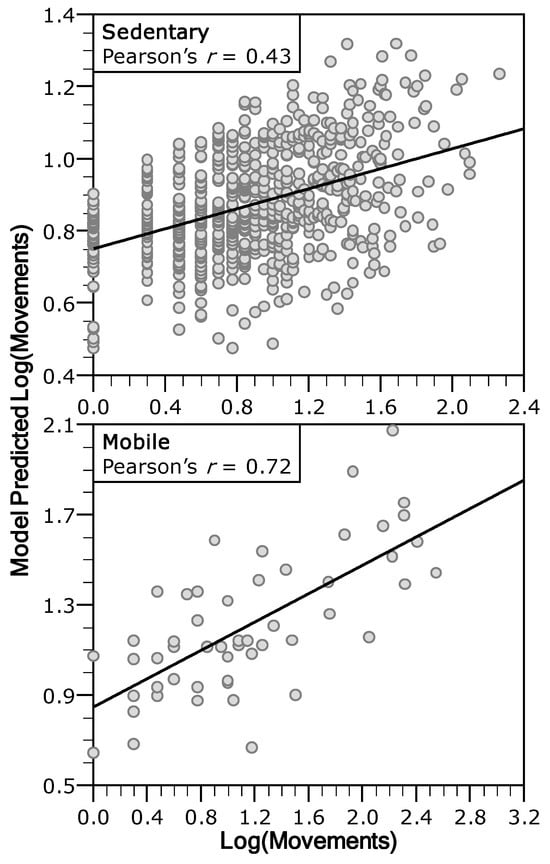
Figure 7.
Relationship between the observed and the predicted trout movements by the GLMs averaged through an information theoretical approach.
The sedentary group showed a similar pattern to the global model (Table 2 and Table 3), since most of the individuals were sedentary (Table 1). Eight models were selected as candidates, in which habitat type, sampling month, and sex were again the most influential predictors for trout movement, while fork length, initial density, and final density showed intermediate to weak importance (Table 3). Conditional residual revealed that individuals previously detected in pools moved farther when transitioning to runs and riffles. Fork length was positively associated with movement, males movements were larger than females, and movements significantly varied seasonally, being greatest in June, November, and December, and lowest in February (Figure 8).
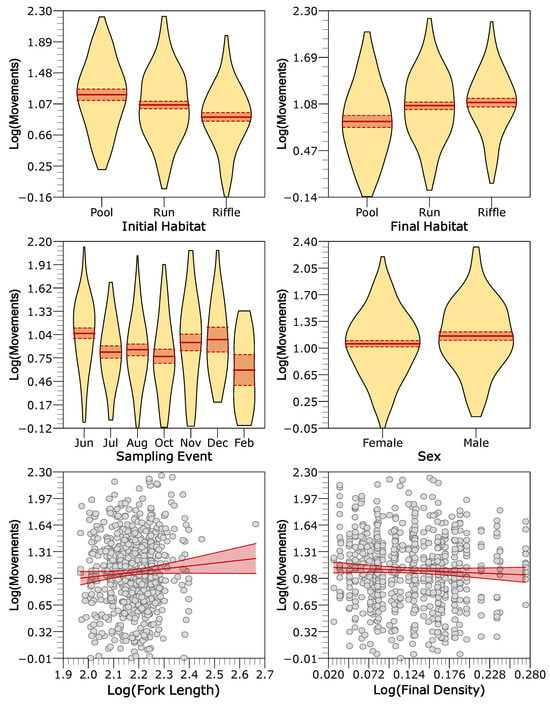
Figure 8.
Conditional residuals plots for the most important variables in the averaged generalized linear model of sedentary trout movements. The plots show the relationship between a given independent variable and the response while accounting for the other variables included in the model. For the conditioning, the other continuous variables are set to their median and to the most common category for factors. Points are the partial residuals, the red line is the prediction line, and the red dashed bands are the confidence intervals based on standard error.
For mobile individuals, seven models were retained as plausible, and only final habitat, fork length, and final density were the most influential predictors, while initial density had moderate importance (Table 3) in trout movement. Fork length again showed a positive relationship with movement. A contrasting pattern was observed for density: movement increased with higher initial density but decreased with higher final density (Figure 9). Mobile trout did not exhibit significant seasonal variation in movement, suggesting a consistent mobility pattern across time.
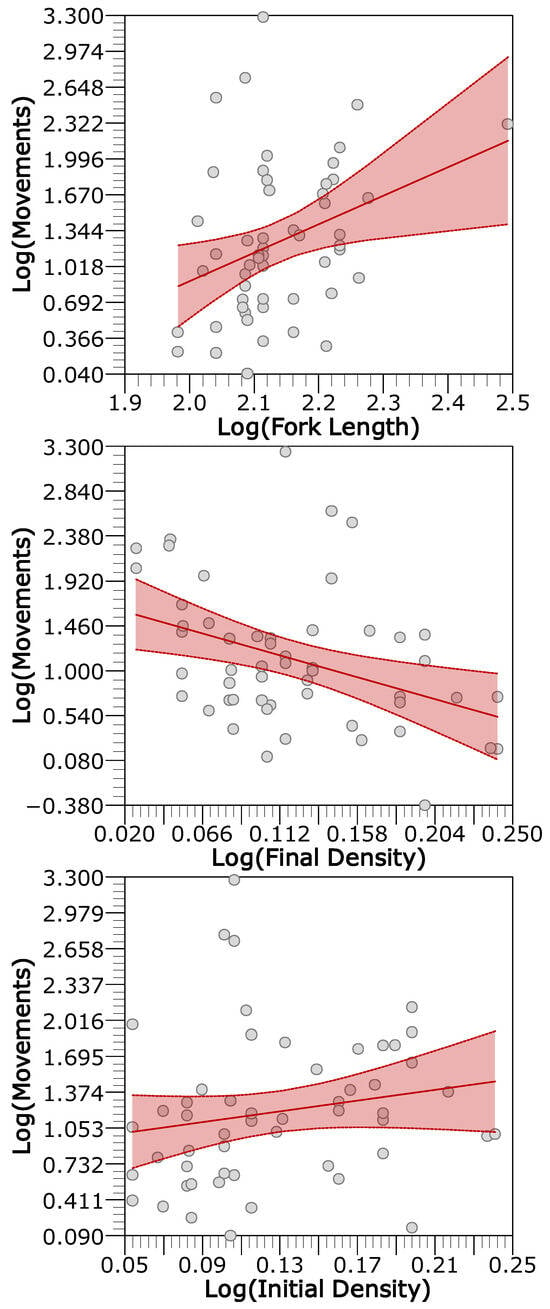
Figure 9.
Conditional residuals plots for the most important variables in the averaged generalized linear model of mobile trout movements. The plots show the relationship between a given independent variable and the response while accounting for the other variables included in the model. For the conditioning, the other continuous variables are set to their median and to the most common category for factors. Points are the partial residuals, the red line is the prediction line, and the red dashed bands are the confidence intervals based on standard error.
For individual fish, movements between consecutive tracking events were highly correlated (Pearson’s r = 0.26, N = 656, p < 0.0001), indicating consistent inter-individual differences in movement behavior. Partial correlation analysis (controlling for fish length) showed a significant positive relationship between successive movement distances for both females (r = 0.33; Student’s t = 6.91, df = 399, p < 0.0001) and males (r = 0.14; Student’s t = 2.97, df = 223, p = 0.04). These findings suggest that past movement predicts future movement, highlighting the presence of repeatable individual variation in mobility within the population.
4. Discussion
4.1. Overall Movement Patterns and Mobile Fish Ratio
Movement patterns of brown trout in the Flamisell River exhibited a markedly leptokurtic distribution, characterized by a high frequency of short-range displacements (<50 m, classified as restricted movement [12]) and infrequent long-distance movements. These longer movements were more common in October, preceding the spawning season, but occurred in other months. This movement pattern supports the coexistence of both sedentary and mobile individuals within the population, a phenomenon widely documented in stream-resident salmonids (e.g., [1,12,21]). The observed proportion of mobile individuals (18.2%) was consistent with previously provided estimates, such as the median value of 19% for salmonid species [12], and proportions of 13–20% reported for other brown trout populations [16,42]. However, the 45.7% reported in [43] suggests that local ecological context may influence the mobility ratio. The fishmove model provided a reliable framework for estimating movement parameters, with predicted values generally consistent with field estimates, both for the proportion of sedentary and mobile individuals and their displacement distances. The main deviation between predicted and observed values was in the mobile component during the pre-spawning period, when observed movement distances exceeded model predictions. This discrepancy reflects the heightened migratory activity associated with reproduction, in agreement with previous studies [6,44].
Our findings in the Flamisell River contrast with previous inferences based on genetic population structure from a nearby river in the same basin, which suggested notable dispersal by adult brown trout [26]. In that study, the random spatial distribution of related individuals in older age classes, as opposed to the localized clustering in juveniles, was interpreted as evidence of adult movement over several kilometers. This pattern was mediated by ecological constraints such as low productivity, variable flow regimes, and limited spawning habitat typical of Mediterranean streams. In contrast, our results show that most trout were sedentary, in concordance with other studies in Mediterranean systems [6,18]. The discrepancy between genetic and direct-tracking methods is common [45,46], and may stem from several sources. Genetic signals of long-distance movement may reflect rare or historical dispersal events across generations, while mark–recapture methods may miss early-life or non-detectable movements [46,47]. The relative contribution of these factors remains unknown, but the prevailing evidence from movement studies suggests that adult trout in Mediterranean streams are largely sedentary. However, rare long-distance movements likely play a critical role both in maintaining genetic connectivity and ensuring resilience to high and often catastrophic natural hydrological variability of Mediterranean streams.
Our results on trout movement are based on recaptured tagged fish (i.e., surviving individuals); thus, several potential sources of bias could have affected our results. For instance, tag insertion and adipose fin clipping may affect behavior or mortality rate compared to non-tagged individuals. However, several studies on salmonids have shown that tagging and adipose fin clipping do not affect condition, growth, or survival (e.g., [48,49,50]), and therefore the behavior of tagged fish is representative of the population. The 29.6% of the PIT-tagged fish were never detected. These individuals may have been in the study reach but not detected, may have died, or could have moved outside the study boundaries. Escaping while the operator is scanning for fish could be an important source of missing tags. Fish predation could also be important since several piscivorous birds and mammals (e.g., grey heron Ardea cinerea, great cormorant Phalacrocorax carbo, and river otter Lutra lutra) were frequently observed at the study site. Indeed, some PIT tags were recovered from otter spraints and a cormorant’s stomach contents, thus suggesting that predation was a major cause of PIT tag loss. In addition, the annual mortality rate of adult brown trout is estimated to range between 43 and 72% [51]. Although detection efficiency was relatively low, our estimate was similar to that reported in previous studies on the movement of salmonids in open systems (e.g., [50]). Furthermore, while tag loss biases abundance estimates, movement estimates are not affected since behavioral differences between tagged and tag-loss fish are not expected (e.g., [48,49,52]). Movements of tagged trout out of the study area could have occurred, but they were probably limited. The upstream end of the study reach is bounded by an impassable weir, and fish could only leave the study area downstream. However, less than 3% of the total PIT tag detections occurred outside of the central tagging section, suggesting that the length of the study reach was adequate for the detection of most movements and did not significantly affect our overall results.
4.2. Drivers of Movement Variability
The observed intrapopulation variability in movement appears to stem from the interaction between local environmental conditions and individual-specific traits. Among the extrinsic factors, mesohabitat type and population density, both varying at local spatial scales, influenced brown trout movement patterns in the Flamisell River, but differed between mobile and sedentary individuals. Sedentary fish occupying riffle and run habitats exhibited significantly shorter movement distances than individuals in pool habitats. This pattern was not observed in mobile fish, thus suggesting divergent drivers of movement in the two groups. The reduced mobility of sedentary individuals in faster-flowing mesohabitats may reflect adequate feeding opportunities and cover from predators in these environments. As a drift-feeding species, brown trout benefit from the continuous delivery of drifting aquatic invertebrates facilitated by increased current velocity, thereby increasing habitat suitability and feeding efficiency [53]. In contrast, the movement patterns of mobile individuals were not associated with specific mesohabitats, implying that other intrinsic or extrinsic factors govern their movement decisions. In addition to habitat features, fish density also emerged as a significant predictor of individual mobility, highlighting the role of social interactions in shaping movement behavior. Our model showed that individuals located in high-density sections during one sampling event were more likely to relocate to lower-density areas in subsequent surveys. This pattern is indicative of density-dependent dispersal, likely driven by competition avoidance. In salmonids, elevated conspecific density is known to promote redistribution and movement, functioning as a mechanism to reduce intraspecific competition and optimize habitat use [54]. In fact, both sedentary and mobile groups exhibited this response, although the effect was stronger in mobile individuals. This heightened responsiveness of mobile fish under crowded conditions may reflect also a subdominant status within the social hierarchy, as subordinate fish are more likely to be displaced from high-quality territories by dominant conspecifics [55].
Among intrinsic traits, sex was a significant predictor of movement primarily in sedentary individuals, with males moving approximately 1.4 times farther than females. In contrast, the effect of sex was weak among mobile individuals, although males in this group also tended to move farther than females. Sex-biased movement patterns have been observed in other salmonids (e.g., [11]) and are consistent with polygynous mating systems, where male reproductive success is often limited by access to mates, while female success is constrained by fecundity [56]. Increased male mobility may therefore represent an adaptive strategy to maximize reproductive opportunities across spatially structured environments. These differences in movement behavior have important implications for gene flow and recolonization dynamics. Greater male dispersal may facilitate genetic connectivity among subpopulations, whereas limited female movement could constrain demographic expansion and reduce the rate at which new or recovering habitats are colonized. Fish length was also significantly associated with movement distances for both sedentary and mobile individuals. In salmonids, numerous studies have reported a positive relationship between body size and mobility, with larger individuals typically displacing greater distances (e.g., [57,58]). This positive correlation between body size and mobility can be attributed to several factors; for instance, larger individuals often possess greater swimming capacity, enabling them to navigate through stronger currents and overcome physical barriers more effectively [59]. Additionally, larger salmonids may have higher energetic demands, prompting them to explore broader areas to meet their metabolic needs [60].
Consistent individual differences in movement behavior—evidenced by repeatable movement patterns across recaptures—indicate the presence of stable behavioral traits that may reflect aspects of fish personality [20,22]. These patterns were observed across both sexes and were independent of body size, suggesting that such behavioral consistency is not merely a byproduct of morphological or sex-related variation. Similar findings in other studies reinforce the interpretation of movement behavior as a personality-linked trait [61,62], which is likely to have a genetic basis [63]. Supporting this, metabolomic analyses in brown trout revealed distinct physiological profiles between sedentary and mobile individuals, particularly in energy metabolism and stress response [64].
5. Conclusions
Overall, this study adds to the growing body of evidence that stream-resident brown trout populations are composed of individuals exhibiting diverse movement strategies. This ecological complexity has significant implications for conservation and management. While sedentary individuals may be more susceptible to local habitat degradation, mobile individuals face greater risks from landscape-scale fragmentation. The presence of physical barriers may selectively disadvantage mobile individuals, potentially reducing their frequency and threatening long-term population resilience [65]. Even in populations with predominantly sedentary strategies, maintaining genetic and behavioral diversity, including mobility traits, is vital for ensuring population connectivity, recolonization potential, and adaptability to environmental change. Effective management must therefore adopt multi-scale approaches that preserve both local habitat integrity and regional connectivity to sustain the ecological and evolutionary viability of brown trout populations in dynamic stream environments.
Author Contributions
Conceptualization, R.R., E.A., A.P.-I. and D.V.; methodology, R.R., N.O. and E.A.; data analysis and interpretation, C.A. and E.A.; visualization, C.A. and E.A., writing—original draft preparation, E.A., C.A., and R.R.; writing—review and editing, E.A., C.A., R.R., A.P.-I., D.V. and N.O. Funding acquisition and project management, E.A. and R.R. All authors have read and agreed to the published version of the manuscript.
Funding
This research was financially supported by the Biodiversity Conservation Plan of ENDESA.
Institutional Review Board Statement
Permission for electrofishing and capture of S. trutta individuals was approved by the competent authorities: Departament de Medi Ambient i Habitatge de la Generalitat de Catalunya (current Departament de Medi Ambient i Sostenibilitat) (SF/220) of the regional authorities of Catalonia.
Data Availability Statement
The data that support the findings of this study are available from the corresponding authors, upon reasonable request.
Acknowledgments
We thank Delfí Sanuy, Mariona Pascual, Roger Guillem, Nines Marín, Antoni Palau Nadal, Clara Companys, and Inma Ordoñez for their collaboration and field assistance. C.A. also acknowledges the support from the CERCA Program (Generalitat de Catalunya).
Conflicts of Interest
R.C. was employed by the company Gesna Estudis Ambientals S.L. The remaining authors declare that the research was conducted in the absence of any commercial or financial relationships that could be construed as a potential conflict of interest.
References
- Gowan, C.; Fausch, K.D. Mobile Brook Trout in Two High-Elevation Colorado Streams: Reevaluating the Concept of Restricted Movement. Can. J. Fish. Aquat. Sci. 1996, 53, 1370–1381. [Google Scholar] [CrossRef]
- Hodges, S.W.; Magoulick, D.D. Refuge Habitats for Fishes during Seasonal Drying in an Intermittent Stream: Movement, Survival and Abundance of Three Minnow Species. Aquat. Sci. 2011, 73, 513–522. [Google Scholar] [CrossRef]
- Cooke, S.J.; Bergman, J.N.; Twardek, W.M.; Piczak, M.L.; Casselberry, G.A.; Lutek, K.; Dahlmo, L.S.; Birnie-Gauvin, K.; Griffin, L.P.; Brownscombe, J.W.; et al. The Movement Ecology of Fishes. J. Fish Biol. 2022, 101, 756–779. [Google Scholar] [CrossRef] [PubMed]
- Garrett, J.W.; Bennett, D.H. Seasonal Movements of Adult Brown Trout Relative to Temperature in a Coolwater Reservoir. N. Am. J. Fish. Manag. 1995, 15, 480–487. [Google Scholar] [CrossRef]
- Zimmer, M.; Schreer, J.F.; Power, M. Seasonal Movement Patterns of Credit River Brown Trout (Salmo trutta). Ecol. Freshw. Fish 2010, 19, 290–299. [Google Scholar] [CrossRef]
- Rocaspana, R.; Aparicio, E.; Palau-Ibars, A.; Guillem, R.; Alcaraz, C. Hydropeaking Effects on Movement Patterns of Brown Trout (L.). River Res. Appl. 2019, 35, 646–655. [Google Scholar] [CrossRef]
- Aparicio, E.; De Sostoa, A. Pattern of Movements of Adult Barbus Haasi in a Small Mediterranean Stream. J. Fish Biol. 1999, 55, 1086–1095. [Google Scholar] [CrossRef]
- Albanese, B.; Angermeier, P.L.; Dorai-Raj, S. Ecological Correlates of Fish Movement in a Network of Virginia Streams. Can. J. Fish. Aquat. Sci. 2004, 61, 857–869. [Google Scholar] [CrossRef]
- Slavík, O.; Horký, P.; Maciak, M.; Horká, P.; Langrová, I. Diel Movement of Brown Trout, Salmo trutta, is Reduced in Dense Populations with High Site Fidelity. Ecol. Evol. 2018, 8, 4495–4507. [Google Scholar] [CrossRef]
- Downs, C.C.; Horan, D.; Morgan-Harris, E.; Jakubowski, R. Spawning Demographics and Juvenile Dispersal of an Adfluvial Bull Trout Population in Trestle Creek, Idaho. N. Am. J. Fish. Manag. 2006, 26, 190–200. [Google Scholar] [CrossRef]
- Hutchings, J.A.; Gerber, L. Sex–Biased Dispersal in a Salmonid Fish. Proc. R. Soc. London. Ser. B Biol. Sci. 2002, 269, 2487–2493. [Google Scholar] [CrossRef] [PubMed]
- Rodríguez, M.A. Restricted Movement in Stream Fish: The Paradigm Is Incomplete, Not Lost. Ecology 2002, 83, 1–13. [Google Scholar] [CrossRef]
- Woolnough, D.A.; Downing, J.A.; Newton, T.J. Fish Movement and Habitat Use Depends on Water Body Size and Shape. Ecol. Freshw. Fish 2009, 18, 83–91. [Google Scholar] [CrossRef]
- Jonsson, B.; Jonsson, N. Ecology of Atlantic Salmon and Brown Trout: Habitat as a Template for Life Histories; Springer Science & Business Media: Berlin/Heidelberg, Germany, 2011; ISBN 978-94-007-1189-1. [Google Scholar]
- Lobón-Cerviá, J. Introduction. In Brown Trout; John Wiley & Sons, Ltd: Hoboken, NJ, USA, 2017; pp. 1–13. ISBN 978-1-119-26835-2. [Google Scholar][Green Version]
- Hesthagen, T. Movements of Brown Trout, Salmo trutta, and Juvenile Atlantic Salmon, Salmo salar, in a Coastal Stream in Northern Norway. J. Fish Biol. 1988, 32, 639–653. [Google Scholar] [CrossRef]
- Knouft, J.H.; Spotila, J.R. Assessment of Movements of Resident Stream Brown Trout, Salmo trutta L., among Contiguous Sections of Stream. Ecol. Freshw. Fish 2002, 11, 85–92. [Google Scholar] [CrossRef]
- Aparicio, E.; Rocaspana, R.; de Sostoa, A.; Palau-Ibars, A.; Alcaraz, C. Movements and Dispersal of Brown Trout (Salmo trutta Linnaeus, 1758) in Mediterranean Streams: Influence of Habitat and Biotic Factors. PeerJ 2018, 6, e5730. [Google Scholar] [CrossRef] [PubMed]
- Skalski, G.T.; Gilliam, J.F. Modeling Diffusive Spread in a Heterogeneous Population: A Movement Study with Stream Fish. Ecology 2000, 81, 1685–1700. [Google Scholar] [CrossRef]
- Rasmussen, J.E.; Belk, M.C. Individual Movement of Stream Fishes: Linking Ecological Drivers with Evolutionary Processes. Rev. Fish. Sci. Aquac. 2017, 25, 70–83. [Google Scholar] [CrossRef]
- Johnsson, J.I.; Näslund, J. Studying Behavioural Variation in Salmonids from an Ecological Perspective: Observations Questions methodological considerations. Rev. Fish Biol. Fish. 2018, 28, 795–823. [Google Scholar] [CrossRef]
- Conrad, J.L.; Weinersmith, K.L.; Brodin, T.; Saltz, J.B.; Sih, A. Behavioural Syndromes in Fishes: A Review with Implications for Ecology and Fisheries Management. J. Fish Biol. 2011, 78, 395–435. [Google Scholar] [CrossRef]
- Lucas, M.; Baras, E. Migration of Freshwater Fishes; John Wiley & Sons: Hoboken, NJ, USA, 2008; ISBN 978-0-470-99964-6. [Google Scholar][Green Version]
- Sanz, N. Phylogeographic History of Brown Trout: A Review. In Brown trout: Biology, Ecology and Management; John Wiley & Sons, Ltd: Hoboken, NJ, USA, 2017; pp. 17–63. ISBN 978-1-119-26835-2. [Google Scholar][Green Version]
- Ayllón, D.; Railsback, S.F.; Harvey, B.C.; García Quirós, I.; Nicola, G.G.; Elvira, B.; Almodóvar, A. Mechanistic Simulations Predict that Thermal and Hydrological Effects of Climate Change on Mediterranean Trout cannot be Offset by Adaptive Behaviour, Evolution, and Increased Food Production. Sci. Total Environ. 2019, 693, 133648. [Google Scholar] [CrossRef] [PubMed]
- Vera, M.; Sanz, N.; Hansen, M.M.; Almodóvar, A.; García-Marín, J.-L. Population and Family Structure of Brown Trout, Salmo trutta, in a Mediterranean Stream. Mar. Freshw. Res. 2010, 61, 672–681. [Google Scholar] [CrossRef]
- Aparicio, E.; García-Berthou, E.; Araguas, R.M.; Martínez, P.; García-Marín, J.L. Body Pigmentation Pattern to Assess Introgression by Hatchery Stocks in Native Salmo trutta from Mediterranean Streams. J. Fish Biol. 2005, 67, 931–949. [Google Scholar] [CrossRef]
- Jowett, I.G. A Method for Objectively Identifying Pool, Run, and Riffle Habitats from Physical Measurements. N. Z. J. Mar. Freshw. Res. 1993, 27, 241–248. [Google Scholar] [CrossRef]
- Roussel, J.-M.; Haro, A.; Cunjak, R.A. Field Test of a New Method for Tracking Small Fishes in Shallow Rivers Using Passive Integrated Transponder (PIT) technology. Can. J. Fish. Aquat. Sci. 2000, 57, 1326–1329. [Google Scholar] [CrossRef]
- Zydlewski, G.B.; Haro, A.; Whalen, K.G.; McCormick, S.D. Performance of Stationary and Portable Passive Transponder Detection Systems for Monitoring of Fish Movements. J. Fish Biol. 2001, 58, 1471–1475. [Google Scholar] [CrossRef]
- Seber, G.A.F.; Le Cren, E.D. Estimating Population Parameters from Catches Large Relative to the Population. J. Anim. Ecol. 1967, 36, 631–643. [Google Scholar] [CrossRef]
- QGIS Development Team QGIS Geographic Information System, Version 3.28.14; 2023. Available online: https://download.qgis.org/downloads/ (accessed on 24 June 2025).[Green Version]
- Turchin, P. Quantitative Analysis of Movement: Measuring and Modeling Population Redistribution in Animals and Plants; Sinauer Associates: Sunderland, MA, USA, 1998; ISBN 978-0-87893-847-6. [Google Scholar][Green Version]
- Radinger, J.; Wolter, C. Patterns and Predictors of Fish Dispersal in Rivers. Fish Fish. 2014, 15, 456–473. [Google Scholar] [CrossRef]
- Burnham, K.P.; Anderson, D.R. Model Selection and Multimodel Inference. A Practical Information-Theoretic Approach; Springer: New York, NY, USA, 2002. [Google Scholar][Green Version]
- Maggini, R.; Lehmann, A.; Zimmermann, N.E.; Guisan, A. Improving Generalized Regression Analysis for the Spatial Prediction of Forest Communities. J. Biogeogr. 2006, 33, 1729–1749. [Google Scholar] [CrossRef]
- Burnham, K.P.; Anderson, D.R.; Huyvaert, K.P. AIC Model Selection and Multimodel Inference in Behavioral Ecology: Some Background, Observations, and Comparisons. Behav. Ecol. Sociobiol. 2011, 65, 23–35. [Google Scholar] [CrossRef]
- Cade, B.S. Model Averaging and Muddled Multimodel Inferences. Ecology 2015, 96, 2370–2382. [Google Scholar] [CrossRef] [PubMed]
- Genua-Olmedo, A.; Temmerman, S.; Ibáñez, C.; Alcaraz, C. Evaluating Adaptation Options to Sea Level Rise and Benefits to Agriculture: The Ebro Delta Showcase. Sci. Total Environ. 2022, 806, 150624. [Google Scholar] [CrossRef] [PubMed]
- R Core Team. R: A Language and Environment for Statistical Computing; R Core Team: Vienna, Austria, 2016. [Google Scholar][Green Version]
- Fraser, D.F.; Gilliam, J.F.; Daley, M.J.; Le, A.N.; Skalski, G.T. Explaining Leptokurtic Movement Distributions: Intrapopulation Variation in Boldness and Exploration. Am. Nat. 2001, 158, 124–135. [Google Scholar] [CrossRef]
- Harcup, M.F.; Williams, R.; Ellis, D.M. Movements of Brown Trout, Salmo trutta L., in the River Gwyddon, South Wales. J. Fish Biol. 1984, 24, 415–426. [Google Scholar] [CrossRef]
- Bridcut, E.E.; Giller, P.S. Movement and Site Fidelity in Young Brown Trout Salmo trutta Populations in a Southern Irish Stream. J. Fish Biol. 1993, 43, 889–899. [Google Scholar] [CrossRef]
- García-Vega, A.; Sanz-Ronda, F.J.; Fuentes-Pérez, J.F. Seasonal and Daily Upstream Movements of Brown Trout Salmo trutta in an Iberian Regulated River. Knowl. Manag. Aquat. Ecosyst. 2017, 418, 9. [Google Scholar] [CrossRef]
- Wilson, A.J.; Hutchings, J.A.; Ferguson, M.M. Dispersal in a Stream Dwelling Salmonid: Inferences from Tagging and Microsatellite Studies. Conserv. Genet. 2004, 5, 25–37. [Google Scholar] [CrossRef]
- Lamphere, B.A.; Blum, M.J. Genetic Estimates of Population Structure and Dispersal in a Benthic Stream Fish. Ecol. Freshw. Fish 2012, 21, 75–86. [Google Scholar] [CrossRef]
- Morrissey, M.B.; Ferguson, M.M. Individual Variation in Movement throughout the Life Cycle of a Stream-Dwelling Salmonid Fish. Mol. Ecol. 2011, 20, 235–248. [Google Scholar] [CrossRef]
- Bryan, R.D.; Ney, J.J. Visible Implant Tag Retention by and Effects on Condition of a Stream Population of Brook Trout. N. Am. J. Fish. Manag. 1994, 14, 216–219. [Google Scholar] [CrossRef]
- Shepard, B.B.; Robison-Cox, J.; Ireland, S.C.; White, R.G. Factors Influencing Retention of Visible Implant Tags by Westslope Cutthroat Trout Inhabiting Headwater Streams of Montana. N. Am. J. Fish. Manag. 1996, 16, 913–920. [Google Scholar] [CrossRef]
- Cucherousset, J.; Britton, J.; Beaumont, W.; Nyqvist, M.; Sievers, K.; Gozlan, R. Determining the Effects of Species, Environmental Conditions and Tracking Method on the Detection Efficiency of Portable PIT Telemetry. J. Fish Biol. 2010, 76, 1039–1045. [Google Scholar] [CrossRef]
- Gouraud, V.; Baran, P.; Lim, P.; Sabaton, C.; Cowx, I. Dynamics of a Population of Brown Trout (Salmo trutta) and Fluctuations in Physical Habitat Conditions—Experiments on a Stream in the Pyrenees; First Results. In Management and Ecology of River Fisheries; Fishing News Books, Blackwell Science: Oxford, UK, 2000; pp. 126–142. [Google Scholar][Green Version]
- Frenette, B.J.; Bryant, M.D. Evaluation of Visible Implant Tags Applied to Wild Coastal Cutthroat Trout and Dolly Varden in Margaret Lake, Southeast Alaska. N. Am. J. Fish. Manag. 1996, 16, 926–930. [Google Scholar] [CrossRef]
- Sánchez-Hernández, J.; Cobo, F. Modelling the Factors Influencing Ontogenetic Dietary Shifts in Stream-Dwelling Brown Trout (Salmo trutta). Can. J. Fish. Aquat. Sci. 2018, 75, 590–599. [Google Scholar] [CrossRef]
- Heggenes, J. Effect of Experimentally Increased Intraspecific Competition on Sedentary Adult Brown Trout (Salmo trutta) Movement and Stream Habitat Choice. Can. J. Fish. Aquat. Sci. 1988, 45, 1163–1172. [Google Scholar] [CrossRef]
- Akbaripasand, A.; Krkosek, M.; Lokman, P.M.; Closs, G.P. Does Social Status within a Dominance Hierarchy Mediate Individual Growth, Residency and Relocation? Oecologia 2014, 176, 771–779. [Google Scholar] [CrossRef]
- Perrin, N.; Mazalov, V. Local Competition, Inbreeding, and the Evolution of Sex-Biased Dispersal. Am. Nat. 2000, 155, 116–127. [Google Scholar] [CrossRef]
- Meyers, L.S.; Thuemler, T.F.; Kornely, G.W. Seasonal Movements of Brown Trout in Northeast Wisconsin. N. Am. J. Fish. Manag. 1992, 12, 433–441. [Google Scholar] [CrossRef]
- Young, M.K. Summer Diel Activity and Movement of Adult Brown Trout in High-Elevation Streams in Wyoming, U.S.A. J. Fish Biol. 1999, 54, 181–189. [Google Scholar] [CrossRef]
- Gowan, C.; Young, M.K.; Fausch, K.D.; Riley, S.C. Restricted Movement in Resident Stream Salmonids: A Paradigm Lost? Can. J. Fish. Aquat. Sci. 1994, 51, 2626–2637. [Google Scholar] [CrossRef]
- Lans, L.; Greenberg, L.A.; Karlsson, J.; Calles, O.; Schmitz, M.; Bergman, E. The Effects of Ration Size on Migration by Hatchery-Raised Atlantic Salmon (Salmo salar) and Brown Trout (Salmo trutta). Ecol. Freshw. Fish 2011, 20, 548–557. [Google Scholar] [CrossRef]
- Höjesjö, J.; ØKland, F.; Sundström, L.F.; Pettersson, J.; Johnsson, J.I. Movement and Home Range in Relation to Dominance; a Telemetry Study on Brown Trout Salmo trutta. J. Fish Biol. 2007, 70, 257–268. [Google Scholar] [CrossRef]
- Adriaenssens, B.; Johnsson, J.I. Shy Trout Grow Faster: Exploring Links between Personality and Fitness-Related Traits in the Wild. Behav. Ecol. 2011, 22, 135–143. [Google Scholar] [CrossRef]
- Kortet, R.; Vainikka, A.; Janhunen, M.; Piironen, J.; Hyvärinen, P. Behavioral Variation Shows Heritability in Juvenile Brown Trout Salmo trutta. Behav. Ecol. Sociobiol. 2014, 68, 927–934. [Google Scholar] [CrossRef]
- Oromi, N.; Jové, M.; Pascual-Pons, M.; Royo, J.L.; Rocaspana, R.; Aparicio, E.; Pamplona, R.; Palau, A.; Sanuy, D.; Fibla, J.; et al. Differential Metabolic Profiles associated to Movement Behaviour of Stream-Resident Brown Trout (Salmo trutta). PLoS ONE 2017, 12, e0181697. [Google Scholar] [CrossRef]
- Zarri, L.J.; Palkovacs, E.P.; Post, D.M.; Therkildsen, N.O.; Flecker, A.S. The Evolutionary Consequences of Dams and Other Barriers for Riverine Fishes. BioScience 2022, 72, 431–448. [Google Scholar] [CrossRef]
Disclaimer/Publisher’s Note: The statements, opinions and data contained in all publications are solely those of the individual author(s) and contributor(s) and not of MDPI and/or the editor(s). MDPI and/or the editor(s) disclaim responsibility for any injury to people or property resulting from any ideas, methods, instructions or products referred to in the content. |
© 2025 by the authors. Licensee MDPI, Basel, Switzerland. This article is an open access article distributed under the terms and conditions of the Creative Commons Attribution (CC BY) license (https://creativecommons.org/licenses/by/4.0/).