Article

Hepcidin Deficiency Disrupts Iron Homeostasis and Induces Ferroptosis in Zebrafish Liver

by
Mingli Liu
1,2,†,
Mingjian Peng
1,2,†,
Jingwen Ma
1,2,
Ruiqin Hu
1,2,
Qianghua Xu
2,3,
Peng Hu
1,2,4,* and
Liangbiao Chen
1,2,*
1
Key Laboratory of Exploration and Utilization of Aquatic Genetic Resources, Ministry of Education, Shanghai Ocean University, Shanghai 201306, China
2
International Research Center for Marine Biosciences, Ministry of Science and Technology, Shanghai Ocean University, Shanghai 201306, China
3
Key Laboratory of Sustainable Exploitation of Oceanic Fisheries Resources, Ministry of Education, Shanghai Ocean University, Shanghai 201306, China
4
Marine Biomedical Science and Technology Innovation Platform of Lin-Gang Special Area, Shanghai 201306, China
*
Authors to whom correspondence should be addressed.
These authors contributed equally to this work.
Fishes 2025, 10(5), 243; https://doi.org/10.3390/fishes10050243
Submission received: 24 March 2025 / Revised: 5 May 2025 / Accepted: 13 May 2025 / Published: 21 May 2025
(This article belongs to the Special Issue Genomics Applied to Fish Health)

Abstract

Hepcidin is a key regulator of systemic iron homeostasis, which is essential for maintaining iron balance and cellular health. To investigate its role in zebrafish, we empolyed a hepcidin knockout model. Morphological and histological analyses revealed pale livers and significant iron accumulation in hep−/− zebrafish, particularly in liver, skin, and egg tissues. RNA sequencing identified 1,424 differentially expressed genes (DEGs) between wild-type (WT) and hep−/− zebrafish, with significant enrichment in pathways related to ferroptosis, fatty acid degradation, and heme binding. Western blot analysis showed reduced levels of key iron-related proteins, including GPX4, Fth1, and ferroportin (FPN), indicating impaired iron transport and increased oxidative stress. Gene Ontology (GO) and KEGG analyses highlighted disruptions in iron metabolism and lipid oxidation, linking iron overload to ferroptosis in the absence of hepcidin. These findings demonstrate that hepcidin deficiency leads to profound dysregulation of iron homeostasis, driving lipid peroxidation and ferroptosis in the zebrafish liver. Our study provides mechanistic insights into the molecular consequences of hepcidin loss, advancing our understanding of iron-related oxidative damage and its physiological impacts.
Key Contribution: This study demonstrates that hepcidin deficiency in adult zebrafish leads to iron overload in the liver, providing novel mechanistic insights into homeostasis and oxidative stress regulation in vertebrates.

1. Introduction

Iron is a vital element for vertebrates, playing indispensable roles in numerous biological processes, including oxygen transport via hemoglobin and myoglobin, electron transport, oxidative phosphorylation, the tricarboxylic acid cycle, and the synthesis of iron-containing proteins [1]. However, iron imbalance, whether deficiency or overload, can result in severe physiological disorders, including anemia, oxidative stress, and even death [2]. Achieving systemic iron homeostasis is critical and relies on tightly regulated pathways involving iron uptake, storage, utilization, and export. Among these mechanisms, the iron-regulatory hormone hepcidin plays a central role and is evolutionarily conserved across vertebrates, from fish to mammals [3]. Despite extensive studies on hepcidin in mammals, the systemic impact of its absence, particularly in the liver, remains poorly understood in fish.
Hepcidin was first identified as a liver-derived antimicrobial peptide [4,5] before being recognized as a key regulator of systemic iron metabolism [6,7,8]. Structurally, hepcidin comprises three domains, namely a signal peptide, a pro-peptide, and a bioactive mature peptide, stabilized by four intramolecular disulfide bonds formed by eight conserved cysteine residues [9,10]. Hepcidin achieves iron homeostasis by binding to ferroportin (FPN), the only known cellular iron exporter, promoting its internalization and degradation, thereby limiting iron efflux into circulation [11,12,13]. In hepcidin-deficient states, uncontrolled ferroportin activity leads to systemic iron overload, as observed in hepcidin-null mice, which exhibit excessive iron deposition in multiple tissues [8,14]. While these studies provide a foundation, the downstream consequences of hepcidin loss, especially in liver-specific contexts, demand further exploration.
Iron metabolism is orchestrated by an interconnected network of proteins, including transferrin receptors (TFR), divalent metal transporter 1 (DMT1), ferritin, and ferroportin [1,15]. While TFR and DMT1 mediate cellular iron uptake, ferritin stores excess intracellular iron, and ferroportin exports iron to the extracellular environment [16]. Hepcidin fine-tunes this system by regulating ferroportin activity to prevent excessive iron release [13,17]. Disruption of this equilibrium in hepcidin-deficient models often results in pathological iron accumulation. However, the liver’s dual roles as an iron reservoir and the primary site of hepcidin production make it a particularly vulnerable organ under conditions of hepcidin loss.
Iron overload is intricately linked to lipid peroxidation [18] and ferroptosis [19], a specialized form of iron-dependent cell death driven by the accumulation of lipid peroxides [20]. Glutathione peroxidase 4 (GPX4), a key regulator of ferroptosis, protects cells from oxidative damage by efficiently neutralizing lipid peroxides [21,22]. In conditions of iron overload, reduced GPX4 activity exacerbates oxidative stress, suggesting a direct link between iron dysregulation and liver pathophysiology. Despite this connection, the role of hepcidin in mediating ferroptosis in the liver remains largely unexplored.
Despite the well-established role of hepcidin in regulating systemic iron homeostasis through ferroportin degradation, critical gaps remain in understanding its tissue-specific functions, particularly in aquatic vertebrates. Previous studies in mammals have primarily focused on systemic iron overload phenotypes in hepcidin−/− models [8,14], yet unresolved issues highlight the necessity of this study: Evolutionary conservation of hepcidin’s function, while mammalian hepcidin is known to mediate the disorder of iron homeostasis [8,18], its protective role in teleost fish—where iron metabolism exhibits unique adaptations to aquatic environments—remains poorly characterized. Zebrafish offer a valuable model for investigating genetic and physiological processes due to their high genetic similarity to humans—approximately 70% of human genes have identifiable zebrafish orthologs—and their compatibility with gene-editing technologies [23]. Zebrafish provide unique opportunities to study the systemic and tissue-specific effects of hepcidin loss, particularly in the liver, where the interplay between iron homeostasis and oxidative stress can be examined in detail.
In this study, we utilized a stable hepcidin knockout zebrafish model as previously described [24], to investigate the effects of hepcidin deficiency. By integrating transcriptomic profiling, iron quantification, and histological analyses, we demonstrated that hepcidin loss results in significant liver iron overload, lipid peroxidation, and ferroptosis. Our findings reveal the critical role of hepcidin in maintaining liver iron homeostasis and preventing oxidative damage, providing novel insights into its function in vertebrate iron regulation and its potential implications for liver pathophysiology.

2. Materials and Methods

2.1. Zebrafish Husbandry

All zebrafish procedures were approved by the Shanghai Ocean University Animal Care and Use Committee (approval date: 2 March 2024; approval code: SHOU-DW-2024-030). The wild-type zebrafish (AB strain) were purchased from the Shanghai Institute of Biochemistry and Cell Biology, Chinese Academy of Sciences (SIBCB). The light cycle was maintained at 10 h of darkness and 14 h of light.

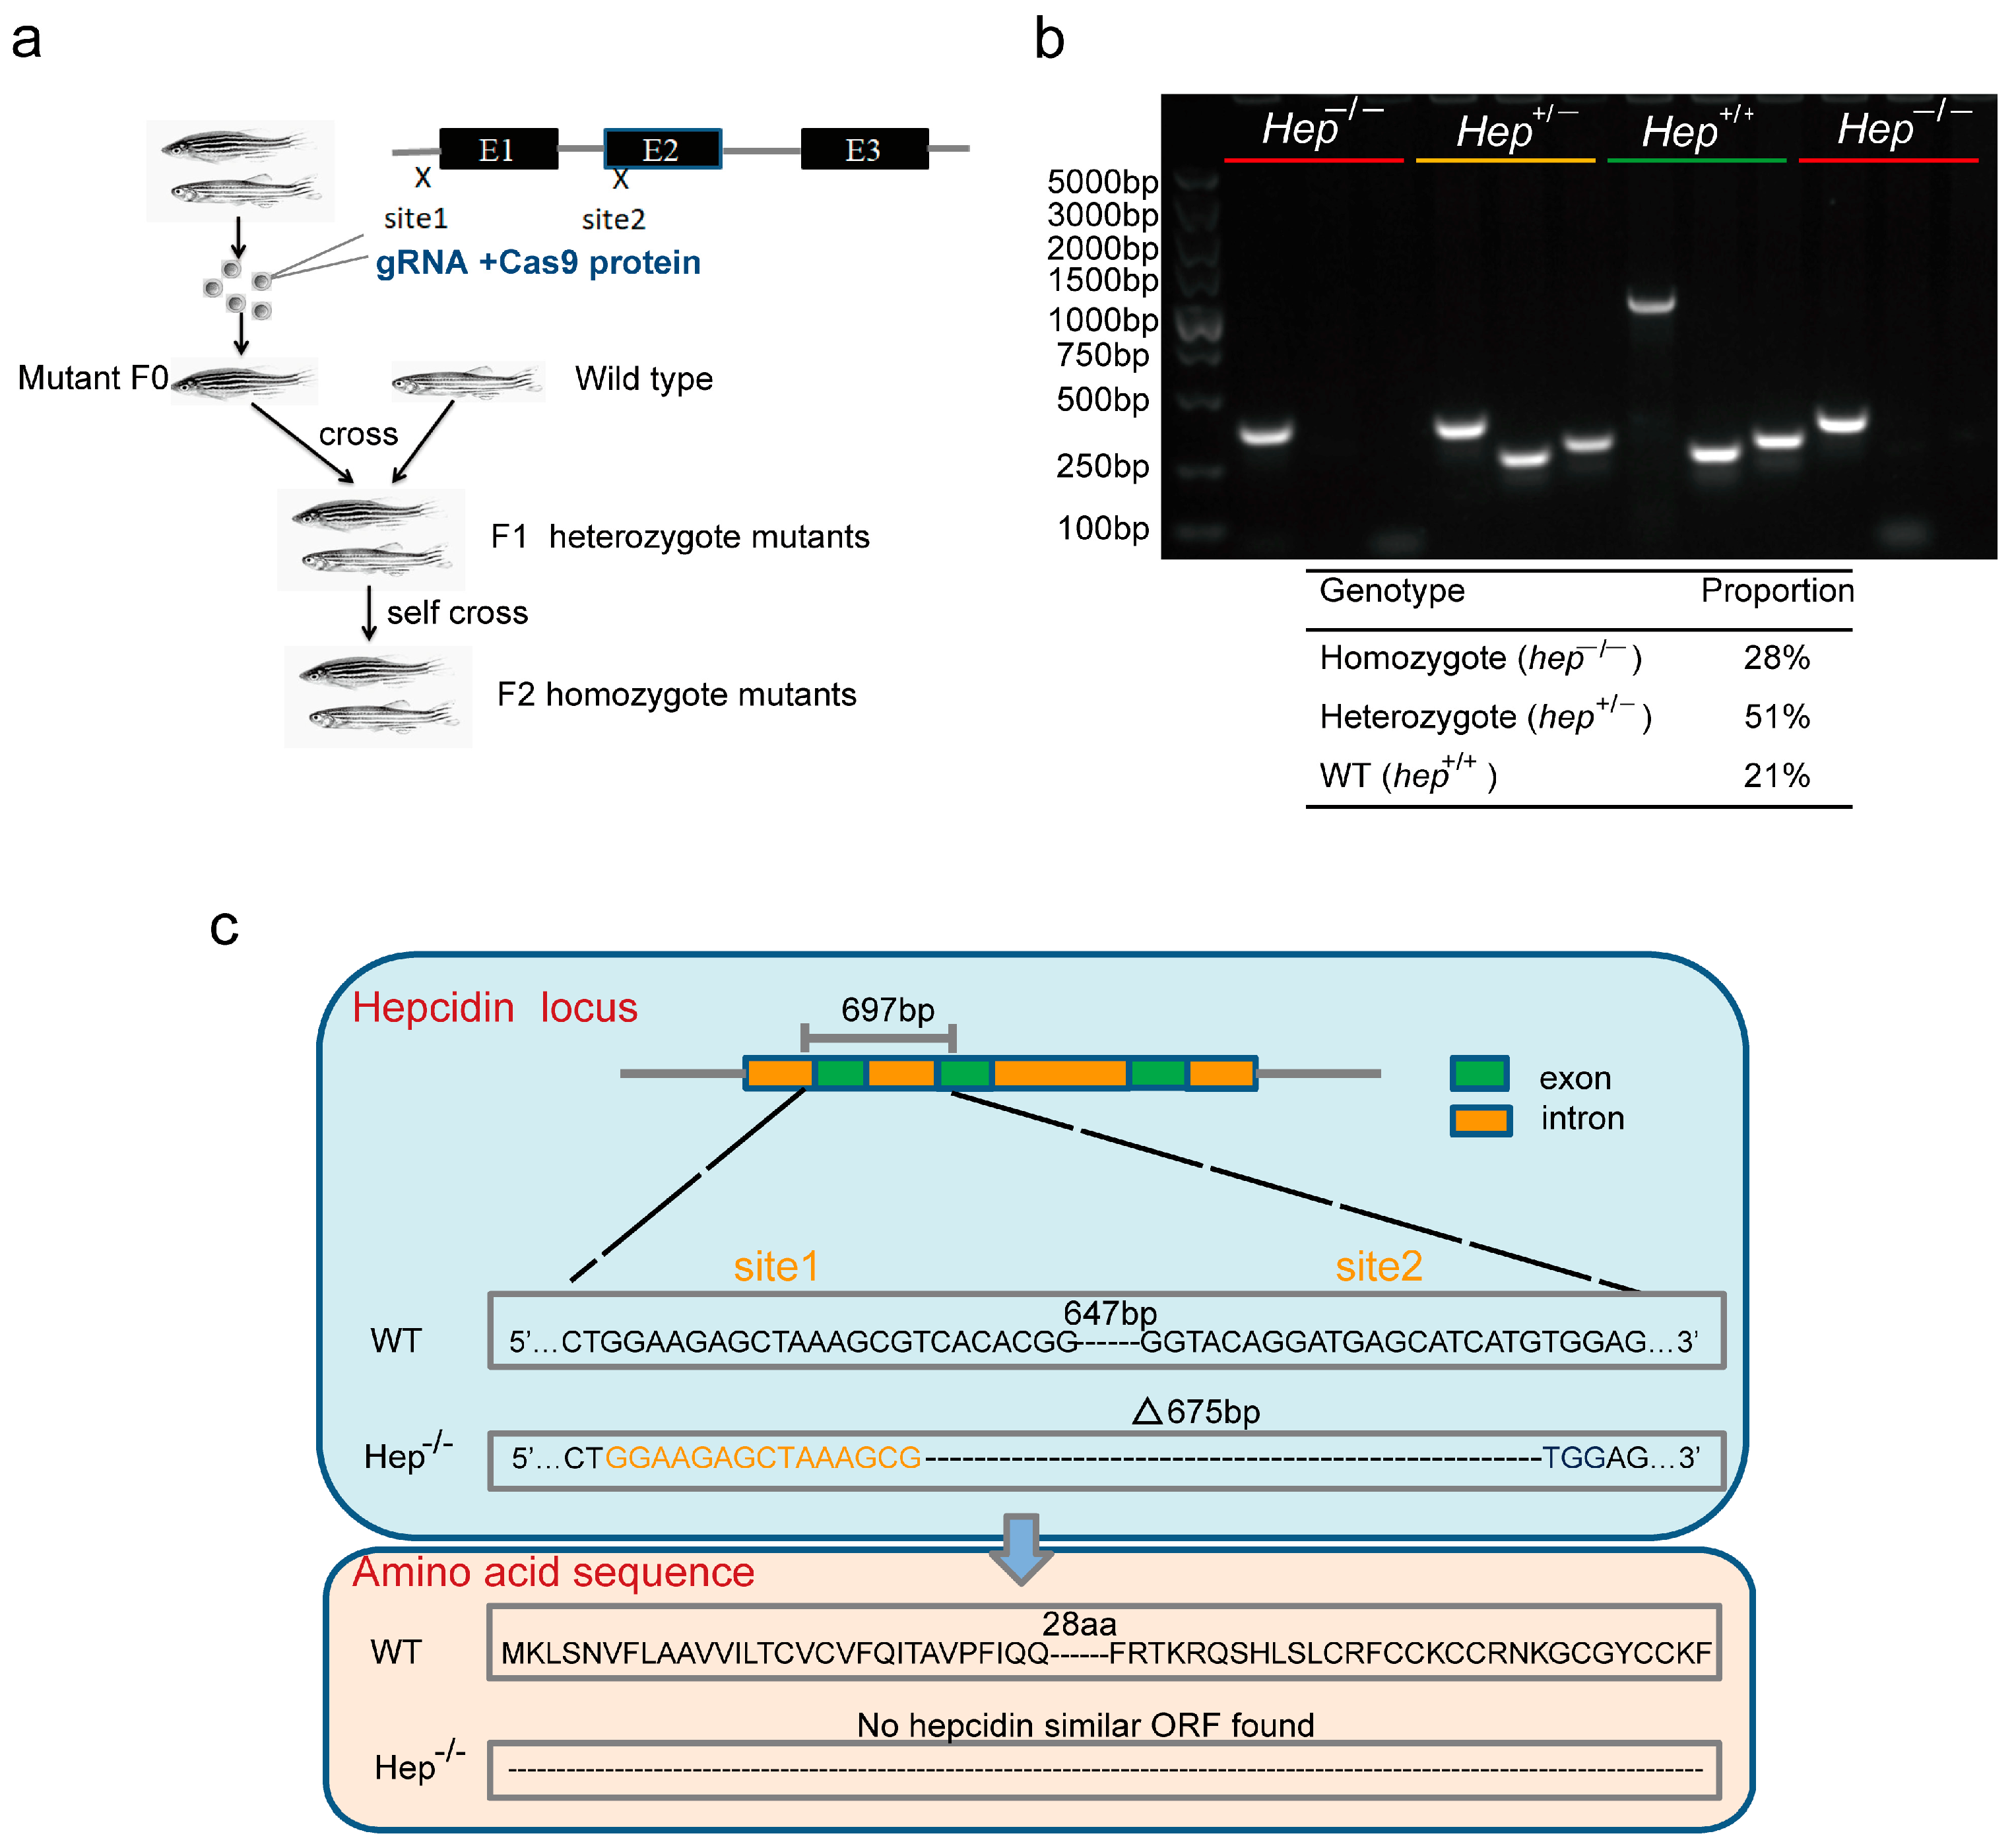
2.2. Construction of Zebrafish Mutant by CRISPR/cas9 Genome Editing

As previously described [24], CRISPR gRNAs were designed using the online tool ZiFiT. The double sgRNA target sequences for hepcidin (NCBI accession number: NC_007127.7) are shown in Table 1. The sgRNA were annealed with a sgRNA-scaffold containing the T7 promoter sequence and transcribed in vitro (Invitrogen, Waltham, MA, USA, AM1314). Cas9 protein was purchased from Genscript. The final concentrations of Cas9 protein and the gRNA mix were 800 ng/µL and 100 ng/µL, respectively. In total, 1 nL of the mixture was injected into each 1-cell stage embryo.
Injected embryos were raised to adulthood as F0 chimeric founders. Tail-clip genotyping confirmed indels at the target sites. Positive F0 founders were crossed with wild-type zebrafish, and the resulting F1 embryos with indels were raised as stable mutant lines. F1 adult mutants of different sexes were crossed to produce F2 embryos. Approximately 25% of F2 individuals were homozygous mutants (hep−/−), consistent with Mendelian inheritance.

2.3. Genotyping

To genotype hepcidin knockout zebrafish, a small piece of tail tissue was clipped and digested in 50 µL of 50 mM NaOH at 95 °C for 20 min. For 48 hpf zebrafish embryos, whole embryos were digested in 10 µL of 50 mM NaOH at 95 °C for 20 min [25]. The lysates were neutralized with a 1/10 volume of 1 M Tris-HCl (pH 8.0). One microliter of lysate was used for PCR genotyping. The information of the primers is shown in Table 1.

2.4. RNA Isolation and Sequencing

Adult zebrafish tissues were dissected as previously described. Total RNA was extracted from the liver using Trizol reagent (Invitrogen, MA, USA, AM9738) following the manufacturer’s protocol. RNA quality was assessed via 1% agarose gel electrophoresis, and concentrations were measured using a spectrophotometer (Thermo Fisher, Waltham, MA, USA, Nanodrop 2000). Libraries for mRNA sequencing were prepared using the TruSeq RNA Sample Prep Kit (Illumina, San Diego, CA, USA, RS-122-2001) and sequenced on an Illumina HiSeq 2500 system (Illumina, San Diego, CA, USA).

2.5. Liver Bulk RNA Sequencing Data Processing

Samples were sequenced on the Illumina HiSeq 2500 platform (Illumina, San Diego, CA, USA). Raw sequencing data underwent quality control using FastQC (version 0.12.1), and low-quality bases were trimmed and filtered with Fastp (version 0.22.0) using the default parameters. Reads were mapped to the zebrafish (Danio rerio) genome (GRCz11, Ensembl release 112) using HISAT2 (version 2.2.1) with the default settings. Read counts were generated with featureCounts (version 2.0.3), using the parameters -p and -t exon to assign reads to exonic regions and aggregate counts by gene.
The variance stabilizing transformation (VST) expression matrix was used as input for principal component analysis (PCA). PCA was performed using the PCA function from the FactoMineR (version 2.8) package in R. Visualizations of sample clustering were generated with the fviz_pca_ind function from factoextra (version 1.0.7), plotting principal components with 95% confidence ellipses for each group.
Pearson correlation analysis was performed on the expression matrix using the cor function in R (method = “pearson”) and visualized with the pheatmap R package (version 1.0.12). DEGs were identified using DESeq2 (version 1.38.3), applying a p-value cutoff of <0.05. Genes with log2 fold changes > 0.5 were considered upregulated, while those with log2 fold changes < −0.5 were considered downregulated. Volcano plots were generated using ggplot2 (version 3.4.4).

2.6. Enrichment Analysis

Gene Ontology (GO) enrichment and Kyoto Encyclopedia of Genes and Genomes (KEGG) pathway analyses were conducted using the clusterProfiler R package (version 4.6.2) on the basis of hypergeometric distribution. For GO enrichment, the enrichGO function was used with the parameters OrgDb = org.Dr.eg.db, ont = “ALL”, and pAdjustMethod = “fdr”. For KEGG pathway analysis, zebrafish gene symbols were converted to Entrez IDs using the toTable function (parameter: org.Dr.egSYMBOL). Pathway enrichment analysis was performed with the enrichKEGG function (parameters: gene = ENTREZID, organism = “dre”, keyType = “kegg”, and pAdjustMethod = “fdr”). Terms or pathways with p-values < 0.05 were considered to be significantly enriched.

2.7. Visualization of Differential Gene Expression

To visualize gene expression patterns within enriched pathways, size factors for each sample were estimated using the estimateSizeFactors function in DESeq2 to normalize sequencing depth differences. Dispersion parameters for each gene were calculated using estimateDispersions, and the vst function was applied for variance stabilizing transformation (VST) to reduce technical noise.
The transformed expression matrix was extracted using the assay function, standardized using the scale function, and visualized with the ComplexHeatmap package (version 2.14.0).

2.8. Statistical Analysis

All statistical analyses were performed in GraphPad Prism 8 (GraphPad, San Diego, CA, USA). Data are presented as the mean ± SEM. Differences between groups were assessed using unpaired, two-tailed Student’s t-tests. Statistical significance was defined as p < 0.05, while p < 0.01 indicated high significance.

2.9. Western Blot Assay

Livers from 18-month-old zebrafish were collected in a lysis buffer containing 1/100 volume PMSF (Beyotime, SHA, CHN, ST506) and a 1/10 volume cocktail (Sigma, St. Louis, MO, USA, P8340), homogenized on ice for 5 min, and centrifuged at 12,000 rpm for 15 min at 4 °C. The supernatant was collected, and 4× SDS-PAGE loading buffer (Takara, Kyoto, Japan) was added before heating at 95–100 °C for 10 min.
Proteins were separated on a 10–12% SDS-PAGE gel, transferred to 0.45 µm polyvinylidene difluoride membranes (Millipore, St. Louis, MO, USA, IPVH00010), and blocked overnight in TBST containing 5% non-fat milk at 4 °C. Membranes were incubated with the following primary antibodies for 2 h at room temperature: rabbit anti-SLC40A1 (1:1000), rabbit anti-GAPDH (1:1000), rabbit anti-GPX4 (1:1000), and rabbit anti-ferritin (1:1000). After three washes with TBST, membranes were incubated with HRP-conjugated goat anti-rabbit IgG (1:4000) for 1 h at room temperature. Chemiluminescence was detected using SuperSignal™ West Pico PLUS substrate (Thermo Fisher, 34580), and images were captured on an imager (Amersham Imager 600, GE, Boston, MA, USA).

2.10. Iron Measurement by ICP-MS

Tissue iron content was measured by inductively coupled plasma mass spectrometry. Zebrafish tissues (n = 15 per sample, three replicates) were collected from adult zebrafish, weighed, and digested in 70% HNO3 in a microwave oven for 4 h. Digested samples were analyzed using an iCAP6300 ICP-MS system (Thermo Scientific, Waltham, MA, USA, iCAP6300).

2.11. Tissue Section Preparation and Perls’ Prussian Blue Staining

Fe3+ levels were detected using Perls’ Prussian Blue staining. Dewaxed paraffin sections were treated with fresh a Perls’ dye solution (5% potassium ferrocyanide and 10% HCl; Sangon) for 30 min at room temperature, rinsed in deionized water, and counterstained with 0.1% Nuclear Fast Red for 5 min. Sections were rinsed and imaged using a microscope (Leica, DM300, Wetzlar, Germany).

3. Results

3.1. Zebrafish Lacking Hepcidin Exhibit Iron Overload

To investigate the in vivo role of hepcidin, we used a hepcidin knockout zebrafish line previously established by our group [24] (Figure A1a). The hepcidin mutant carries a 675 bp genomic deletion, including a 200 bp deletion in the transcription region, with 178 bp in Exon 1 and the remaining 22 bp in Exon 2. This deletion eliminates the open reading frame (ORF) in the remaining exons (Figure A1c). Sequencing of the residual hepcidin mRNA in mutants, followed by ORF finder analysis, confirmed the absence of any alternative ORF resembling the hepcidin peptide.
Stable homozygous mutants were established from F2 progeny obtained by self-crossing F1 heterozygous mutants. PCR genotyping confirmed that the genotypic ratios among F2 individuals were 28% homozygous mutants (hep−/−), 51% heterozygotes (hep+/−), and 21% wild-type (hep+/+), consistent with Mendel’s expected 1:2:1 ratio (Figure A1b).
Consistent with prior studies [12], hepcidin expression is nearly restricted to the liver. To evaluate the effects of hepcidin deletion on liver physiology and iron homeostasis, we compared livers from wild-type (WT) and hep−/− adult zebrafish. Gross morphological examination revealed that hep−/− livers appeared pale and lacked the characteristic reddish hue of WT livers (Figure 1a). Histological analysis using Prussian Blue and Nuclear Fast Red staining further corroborated these observations. In WT livers, numerous red-stained nuclei, indicative of normal blood cells’ presence, were observed (Figure 1b). Conversely, hep−/− livers exhibited sparse red-stained nuclei and prominent blue staining, reflecting abnormal iron deposition (Figure 1b).
Inductively coupled plasma mass spectrometry (ICP-MS) was used to measure the levels of various metals in mice [26]. Iron quantification using ICP-MS revealed significantly elevated total iron levels in hep−/− zebrafish compared with the WT controls, particularly in the liver, skin, and egg tissues (p < 0.05) (Figure 1c). Interesting, iron increased in the eggs of adult fish, suggesting that the initial iron overload is maternally derived [24]. These findings demonstrate that hepcidin is essential for maintaining iron homeostasis in zebrafish, with its absence leading to disrupted iron storage and distribution.

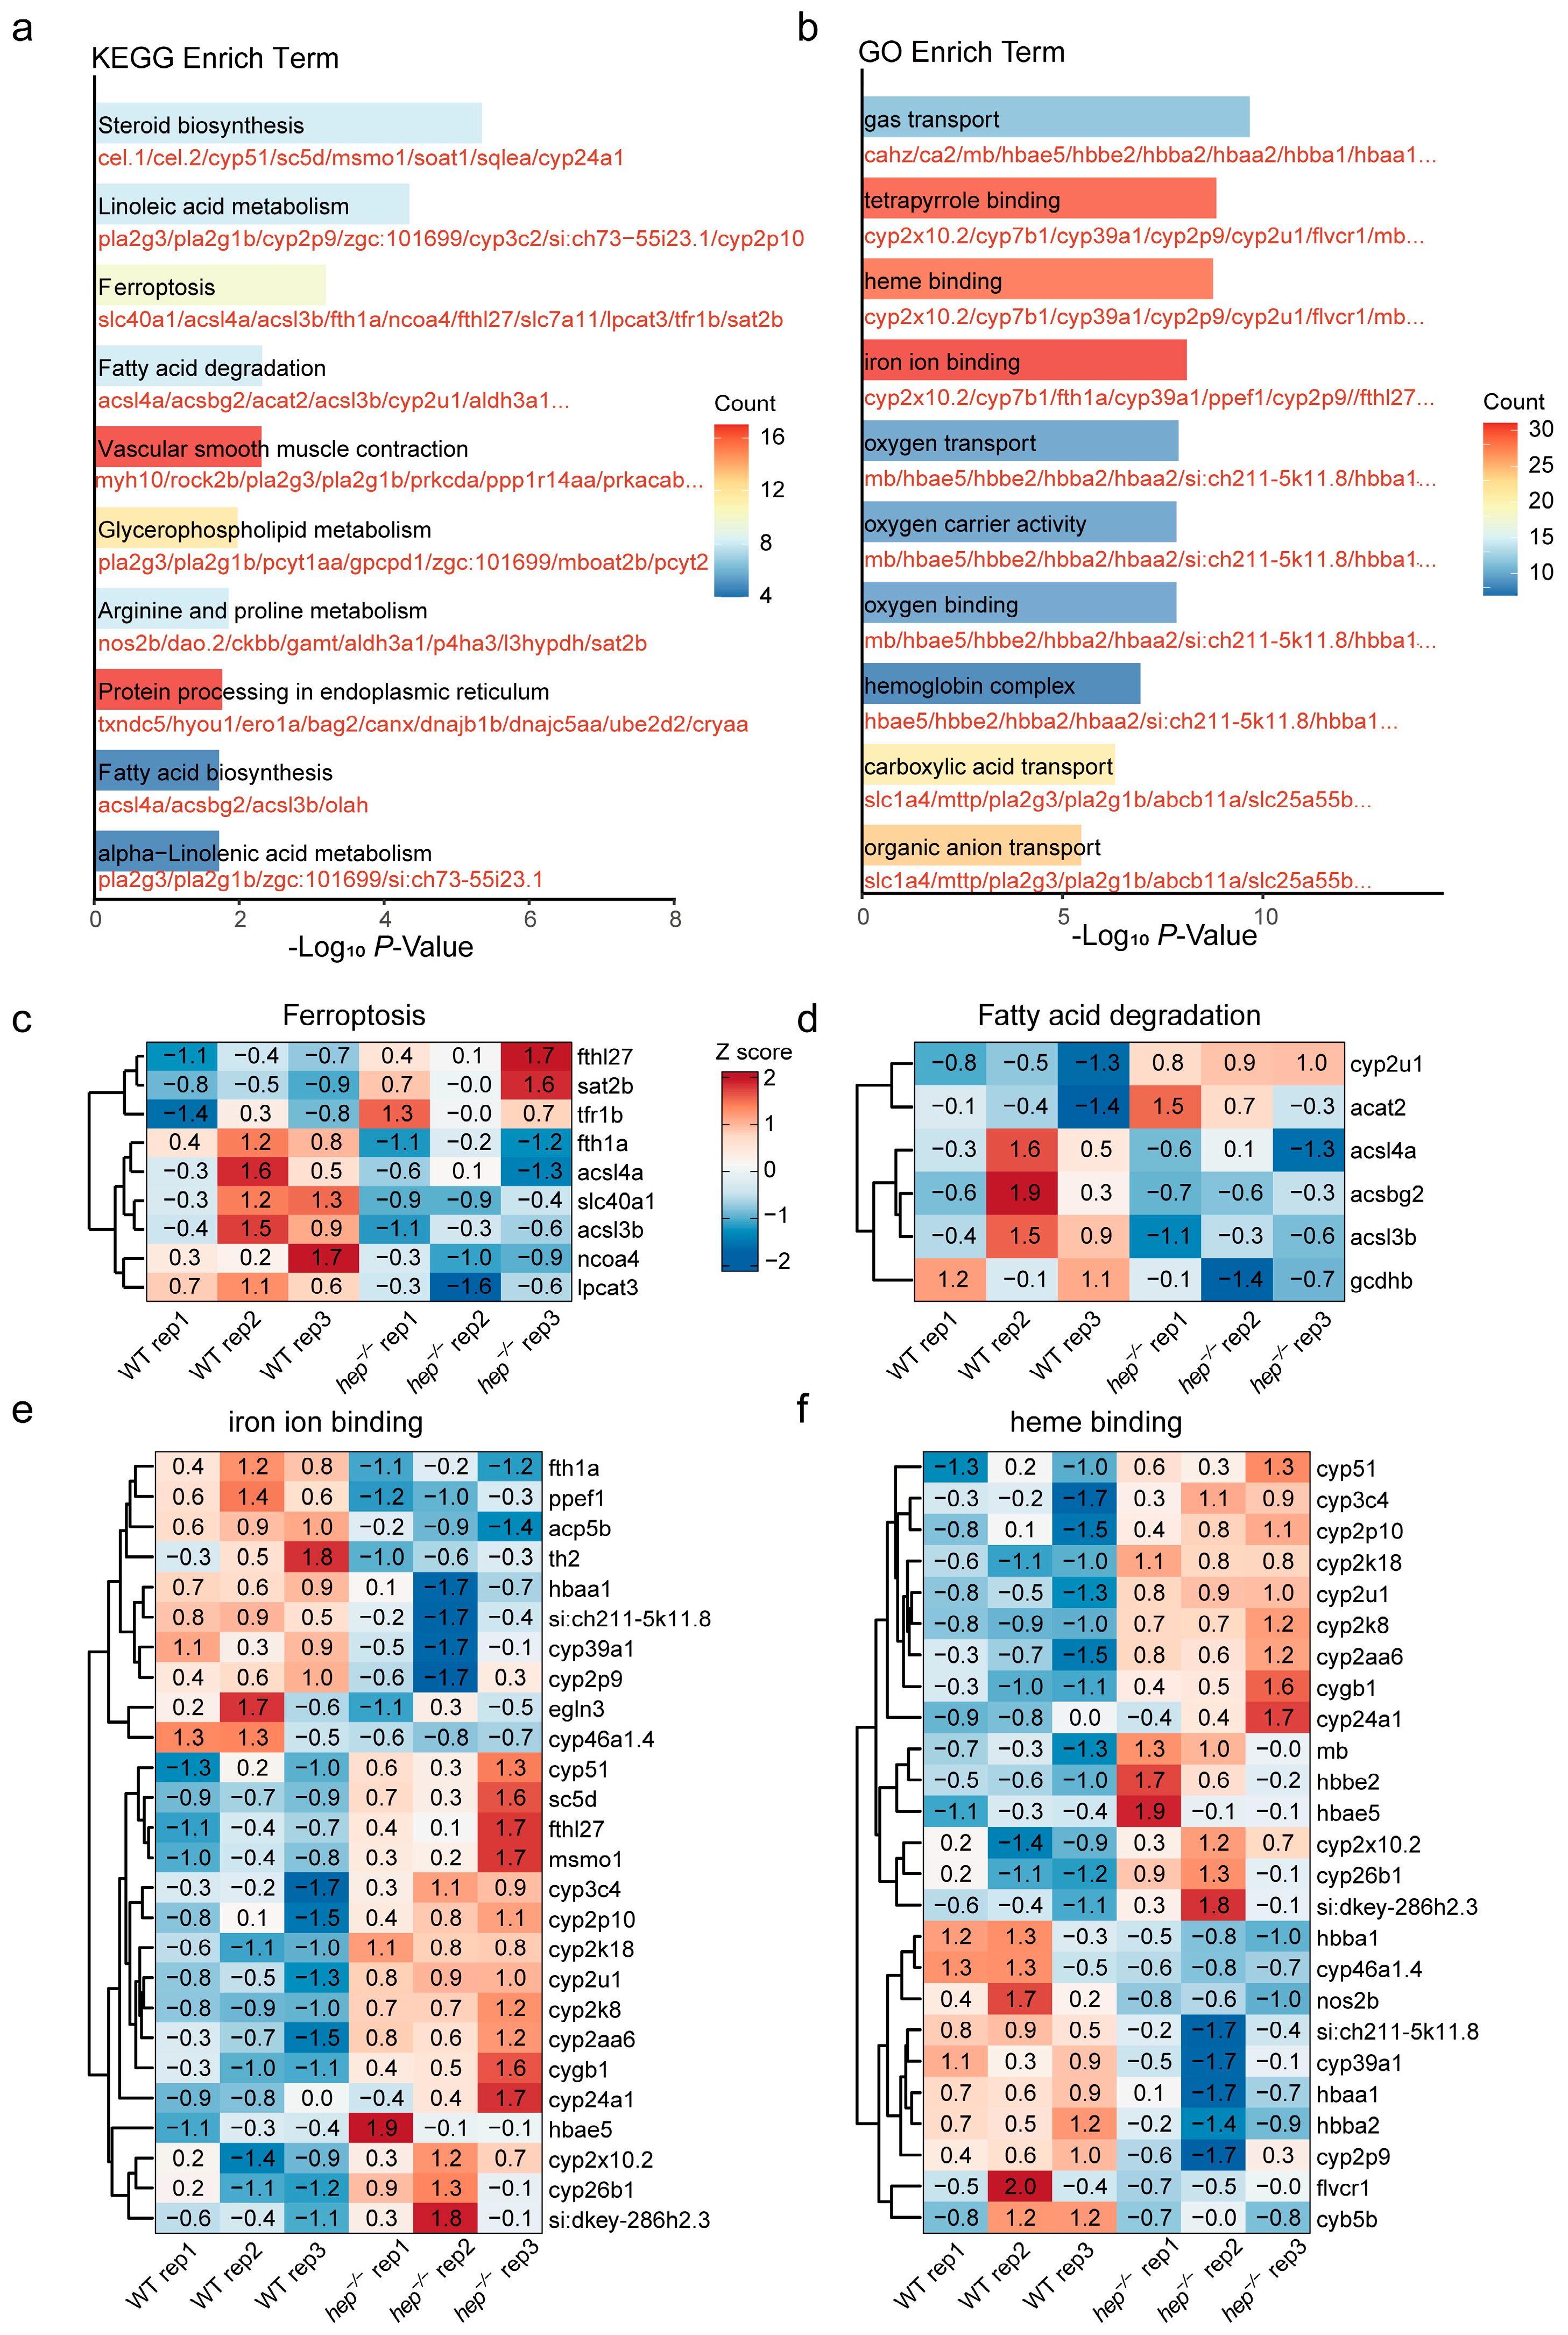
3.2. RNA-Seq Reveals Ferroptosis and Key Regulatory Genes in hep−/− Zebrafish Livers

To explore the molecular consequences of hepcidin deficiency, we performed RNA-seq on liver samples from WT and hep−/− zebrafish. Principal component analysis (PCA) revealed distinct clustering between WT and hep−/− groups, indicating significant transcriptional differences (Figure 1d). Pearson correlation heatmaps validated the high consistency within replicates for each genotype (Figure 1e).
Differential gene expression analysis identified 1,424 differentially expressed genes (DEGs), including 596 downregulated and 828 upregulated genes in hep−/− livers compared with the WT (Figure 1f). Notably upregulated genes included cyp2k8, rnd2, and smad9, while downregulated genes included rnasel2, cacna1g, and slc16a6. Genes directly involved in iron regulation, such as fth1a and fthl27 [27] (Figure 1f and Figure 2c,e), as well as lipid metabolism-related genes like cidec [28] (Figure 1f), exhibited significant expression changes (Figure 2f).
Gene Ontology (GO) and KEGG pathway enrichment analyses of DEGs highlighted significant alterations in pathways associated with iron metabolism, lipid metabolism, and ferroptosis (Figure 2a,b). Notably, the “iron ion binding” pathway was highly enriched (p = 7.87 × 10⁻⁹), as was “heme binding” (p = 1.76 × 10⁻⁹), emphasizing disruptions in iron homeostasis. Additionally, “ferroptosis” (p = 6.41 × 10⁻⁴) and “fatty acid degradation” (p = 4.80 × 10⁻³) were significantly enriched, indicating lipid metabolic dysregulation.
Heatmaps of gene expression in these enriched pathways (Figure 2c–f) demonstrated distinct transcriptional profiles between WT and hep−/− livers. Genes associated with ferroptosis, including fthl27 and sat2b (Figure 2c), were significantly upregulated in hep−/− livers, consistent with iron overload and oxidative stress. Similarly, genes in the “iron ion binding” and “heme binding” pathways, such as fth1a (Figure 2e) and hbae5 (Figure 2f), exhibited altered expression, reflecting disruptions in iron storage and transport. In the “fatty acid degradation” pathway, key genes such as acsl4a and cyp2u1 (Figure 2d) displayed significant changes, further supporting the hypothesis of lipid metabolic dysregulation in hep−/− zebrafish.
These findings collectively reveal that hepcidin deficiency induces extensive changes in the liver iron metabolism, lipid oxidation, and ferroptosis pathways. The observed iron overload and ferroptosis underscore the essential role of hepcidin in maintaining iron homeostasis and preventing oxidative damage.

3.3. Validation of Key Differentially Expressed Genes via Western Blotting

To validate the protein-level expression of key DEGs identified via RNA-seq, we performed Western blot analysis. The results showed that the protein levels of FPN (SLC40A1), Fth1, and GPX4 were significantly reduced in hep−/− zebrafish compared with the WT (Figure 3). These findings align with the transcriptomic data and support the conclusion that hepcidin deficiency disrupts critical pathways in iron metabolism and ferroptosis regulation.

4. Discussion

In this study, we empolyed a hepcidin-deficient zebrafish model and demonstrated that the complete knockout of the hepcidin gene leads to iron accumulation in the liver, even when zebrafish are maintained on an iron-normal diet (Figure 1b,c). This phenotype mirrors observations in hepcidin-deficient mice [8], further supporting the conserved role of hepcidin as a key regulator of systemic iron homeostasis across vertebrates. Notably, iron accumulation was also observed in the eggs (Figure 1c), suggesting maternal transfer of iron overload to subsequent generations [24]. These findings highlight the critical role of hepcidin in preventing iron dysregulation in both somatic and reproductive tissues.
Iron metabolism involves tightly regulated processes, including absorption, storage, and export, to maintain appropriate cellular and systemic iron levels and avoid toxicity [29]. The dysregulation observed in hep−/− zebrafish results from two key factors: increased iron absorption and decreased iron efflux. Given that the WT and hep−/− zebrafish were fed identical iron-normal diets, differences in intestinal iron absorption are unlikely to explain the iron overload phenotype. Instead, reduced expression of FPN, the sole known iron exporter, appears to be the primary cause. Consistent with findings from Jiang et al. [30], who observed reduced FPN levels in zebrafish with blocked hepcidin splicing, our study demonstrates significantly decreased FPN expression in hep−/− zebrafish (Figure 3). This reduction limits iron release from cells into circulation, exacerbating intracellular iron retention.
In contrast, TFR, which facilitates cellular iron uptake [31], was upregulated in hep−/− zebrafish compared with the WT controls. The simultaneous reduction in iron export and the increase in cellular iron uptake likely amplify the iron overload phenotype. Additionally, elevated levels of the iron storage protein ferritin (fthl27) in hep−/− zebrafish. Collectively, these findings reveal that hepcidin deficiency disrupts the balance of iron transport and storage, resulting in systemic iron overload.
Beyond iron dysregulation, our transcriptomic analysis revealed profound changes in global gene expression profiles between hep−/− and WT zebrafish. DEGs were significantly enriched in pathways related to ferroptosis, fatty acid metabolism, iron ion binding, and heme binding (Figure 2a,b). Ferroptosis, a form of iron-dependent, non-apoptotic cell death, is characterized by lipid peroxidation driven by excessive iron [20]. Key regulators of ferroptosis, such as GPX4, play a central role in mitigating lipid peroxide accumulation [23]. While gpx4 mRNA levels were not significantly altered in hep−/− zebrafish, protein levels of GPX4 were markedly reduced (Figure 3). This discrepancy suggests that post-transcriptional or translational mechanisms may contribute to the induction of ferroptosis under conditions of iron overload. Reduced GPX4 protein levels, combined with iron accumulation, provide strong evidence of ferroptosis in hep−/− zebrafish livers.
The heme binding pathway was also significantly disrupted in hep−/− zebrafish (Figure 2b). Heme, a critical molecule comprising iron complexed in a porphyrin ring, plays essential roles in oxygen transport, electron transfer, and enzymatic processes [32]. Alterations in heme binding suggest that hepcidin deficiency impairs the utilization of heme for vital biological functions, potentially contributing to systemic metabolic dysfunction. Dysregulated heme metabolism may further exacerbate oxidative stress and ferroptosis, compounding the observed liver phenotype in hep−/− zebrafish.
In conclusion, our study highlights the indispensable role of hepcidin in regulating iron homeostasis and preventing iron-mediated toxicity in zebrafish. Hepcidin deficiency disrupts iron transport and storage, leading to systemic iron overload, lipid peroxidation, and ferroptosis in the liver. These findings not only deepen our understanding of hepcidin’s conserved function across vertebrates but also provide insights into the molecular mechanisms linking iron metabolism to ferroptosis. Further studies are needed to elucidate the downstream consequences of heme dysregulation and ferroptosis for zebrafish physiology and potential compensatory mechanisms that may mitigate iron toxicity over time. The zebrafish model provides a robust platform for studying early-stage iron toxicity and ferroptosis, which are challenging to investigate in mammalian embryos due to in utero development.

5. Conclusions

This study demonstrates that hepcidin deficiency disrupts iron homeostasis in zebrafish liver, leading to iron overload, oxidative stress, and ferroptosis. Our findings highlight the conserved role of hepcidin in regulating systemic iron metabolism across vertebrates, as similar mechanisms have been observed in mammalian models.

Author Contributions

L.C. and P.H. conceived the study. M.L. and J.M. conducted most of the experiments. M.P. and R.H. performed the computational analysis. M.L. performed construction of the knockout zebrafish, RNA-Seq library preparation, and the Western blot experiment. J.M. assisted with the zebrafish genotyping experiment and prepared the zebrafish materials. Q.X. and M.L. aided in the experimental design. M.L. and M.P. analyzed the results and wrote the manuscript with input from all authors. L.C. supervised the study. All authors have read and agreed to the published version of the manuscript.

Funding

This work was partially supported by the Funding Project of the National Natural Science Foundation of China (32200414), and by the SciTech Funding by CSPFTZ Lingang Special Area Marine Biomedical Innovation Platform.

Institutional Review Board Statement

The animal study protocol was approved by the Animal Care and Use Committee of Shanghai Ocean University (approval date: 2 March 2024; approval code: SHOU-DW-2024-030).

Informed Consent Statement

Not applicable.

Data Availability Statement

All sequencing data associated with this study will be available on the China National Center for Bioinformation database (https://www.cncb.ac.cn/, 19 May 2025), project number: PRJCA035030.

Conflicts of Interest

The authors declare no conflicts of interest.

Abbreviations

The following abbreviations are used in this manuscript.
DEGs Differentially expressed genes
WTWild-type
hep−/−Homozygote of hepcidin knockout zebrafish
hep+/−Heterozygote of hepcidin knockout zebrafish
FPNFerroportin
SLC40A1Solute carrier family 40 member 1
GPX4Glutathione peroxidase 4
Fth1Ferritin heavy chain 1
GOGene Ontology
KEGGKyoto Encyclopedia of Genes and Genomes
TFRTransferrin receptors
DMT1Divalent metal transporter 1
ORFOpen reading frame
ICP-MSInductively coupled plasma mass spectrometry
PCAPrincipal component analysis

Appendix A

Figure A1. Generation and characterization of zebrafish hepcidin knockout mutants. (a) Schematic of the CRISPR/Cas9-mediated knockout strategy targeting the zebrafish hepcidin gene. Two guide RNAs (gRNAs) were designed to target exon regions (Site 1 and Site 2) to induce frameshift mutations. F0 mutant founders were generated and crossed with wild-type fish to produce F1 heterozygous offspring. F1 individuals were then self-crossed to yield F2 homozygous mutants. E is short for Exon. Site 1 indicates sgRNA1; Site 2 indicates sgRNA2. (b) Genotyping analysis of F2 offspring. Representative PCR-based genotyping results are shown, with distinct gel electrophoresis patterns corresponding to wild-type, heterozygous, and homozygous mutants. The table on the right summarizes genotype frequencies, confirming the successful establishment of stable homozygous mutant lines in accordance with Mendelian inheritance. (c) mRNA and protein characterization of the hepcidin knockout zebrafish. The top panel illustrates the exon–intron organization of the hepcidin locus, highlighting the 651 bp genomic region targeted by CRISPR/Cas9. The middle panel depicts transcript-level changes, including a 675 bp deletion (Δ675 bp) encompassing Site 1 and Site 2, leading to frameshift mutations. The bottom panel shows the corresponding alterations in the amino acid sequence, resulting in a 91 amino acid deletion (Δ91aa). This mutation significantly disrupts the predicted structure and function of the hepcidin protein, effectively abrogating its regulatory role in iron homeostasis.
Fishes 10 00243 g0a1

References

  1. Hentze, M.W.; Muckenthaler, M.U.; Galy, B.; Camaschella, C. Two to tango: Regulation of Mammalian iron metabolism. Cell 2010, 142, 24–38. [Google Scholar] [CrossRef] [PubMed]
  2. Ru, Q.; Li, Y.S.; Chen, L.; Wu, Y.X.; Min, J.X.; Wang, F.D. Iron homeostasis and ferroptosis in human diseases: Mechanisms and therapeutic prospects. Signal Transduct Target Ther. 2024, 9, 271–336. [Google Scholar] [PubMed]
  3. Li, L.; Holscher, C.; Chen, B.B.; Zhang, Z.F.; Liu, Y.Z. Hepcidin treatment modulates the expression of divalent metal transporter-1, ceruloplasmin, and ferroportin-1 in the rat cerebral cortex and hippocampus. Biol. Trace Elem. Res. 2011, 143, 1581–1593. [Google Scholar] [CrossRef]
  4. Park, C.H.; Valore, E.V.; Waring, A.J.; Ganz, T. Hepcidin, a urinary antimicrobial peptide synthesized in the liver. J. Biol. Chem. 2001, 276, 7806–7810. [Google Scholar] [CrossRef]
  5. Krause, A.; Neitz, S.; Mägert, H.J.; Schulz, A.; Forssmann, W.G.; Knappe, P.S.; Adermann, K. LEAP-1, a novel highly disulfide-bonded human peptide, exhibits antimicrobial activity. FEBS Lett. 2000, 480, 147–150. [Google Scholar] [CrossRef]
  6. Fleming, R.E.; Sly, W.S. Hepcidin: A putative iron-regulatory hormone relevant to hereditary hemochromatosis and the anemia of chronic disease. Proc. Natl. Acad. Sci. USA 2001, 98, 8160. [Google Scholar] [CrossRef]
  7. Weinstein, D.A.; Roy, C.N.; Fleming, M.D.; Loda, M.F.; Wolfsdorf, J.I.; Andrews, N.C. Inappropriate expression of hepcidin is associated with iron refractory anemia: Implications for the anemia of chronic disease. Blood 2002, 100, 3776–3781. [Google Scholar] [CrossRef]
  8. Nicolas, G.; Bennoun, M.; Devaux, I.; Vaulont, S. Lack of hepcidin gene expression and severe tissue iron overload in upstream stimulatory factor 2 (USF2) knockout mice. Proc. Natl. Acad. Sci. USA 2001, 98, 8780–8785. [Google Scholar] [CrossRef]
  9. Lin, W.; Liu, S.S.; Hu, L.L.; Zhang, S.C. Characterization and bioactivity of hepcidin-2 in zebrafish: Dependence of antibacterial activity upon disulfide bridges. Peptides 2014, 57, 36–42. [Google Scholar] [CrossRef]
  10. Lauth, X.; Babon, J.J.; Stannard, J.A.; Singh, S.; Nizet, V.; Carlberg, J.M.; Ostland, V.E.; Pennington, M.W.; Norton, R.S.; Westerman, M.E. Bass hepcidin synthesis, solution structure, antimicrobial activities and synergism, and in vivo hepatic response to bacterial infections. J. Biol. Chem. 2005, 280, 9272–9282. [Google Scholar] [CrossRef]
  11. Domenico, I.D.; Ward, D.M.; Patti, M.C.B.; Jeong, S.Y.; David, S.; Musci, G.; Kaplan, J. Ferroxidase activity is required for the stability of cell surface ferroportin in cells expressing GPI-ceruloplasmin. Embo J. 2007, 26, 2823–2831. [Google Scholar] [CrossRef] [PubMed]
  12. Fleming, M.D. The regulation of hepcidin and its effects on systemic and cellular iron metabolism. Hematol. Am. Soc. Hematol. Educ. Program 2008, 2008, 151–158. [Google Scholar] [CrossRef]
  13. Nemeth, E.; Tuttle, M.S.; Powelson, J.; Vaughn, M.B.; Donovan, A.; Ward, D.M.; Ganz, T.; Kaplan, J. Hepcidin regulates cellular iron efflux by binding to ferroportin and inducing its internalization. Science 2004, 306, 2090–2093. [Google Scholar] [CrossRef]
  14. Viatte, L.; Lesbordes-Brion, J.C.; Lou, D.Q.; Bennoun, M.; Nicolas, G.; Kahn, A.; Canonne-Hergaux, F.; Vaulont, S. Deregulation of proteins involved in iron metabolism in hepcidin-deficient mice. Blood 2005, 105, 4861–4864. [Google Scholar] [CrossRef]
  15. Hu, R.; Li, G.F.; Hu, P.; Niu, H.B.; Li, W.H.; Jiang, S.W.; Guan, G.J.; Xu, Q.H.; Liu, M.L.; Chen, L.B. bmp10 maintains cardiac function by regulating iron homeostasis. J. Genet. Genom. 2024, 51, 1459–1473. [Google Scholar] [CrossRef]
  16. Skjørringe, T.; Burkhart, A.; Johnsen, K.B.; Moos, T. Divalent metal transporter 1 (DMT1) in the brain: Implications for a role in iron transport at the blood-brain barrier, and neuronal and glial pathology. Front. Mol. Neurosci. 2015, 8, 1–13. [Google Scholar]
  17. Lim, D.; Kim, K.S.; Jeong, J.H.; Marques, O.; Kim, H.J.; Song, M.; Le, T.H.; Kim, J.; Choi, H.S.; Min, J.J.; et al. The hepcidin-ferroportin axis controls the iron content of Salmonella-containing vacuoles in macrophages. Nat. Commun. 2018, 9, 2091–2104. [Google Scholar] [CrossRef]
  18. Brunet, S.; Thibault, L.; Delvin, E.; Yotov, W.; Bendayan, M.; Levy, E. Dietary iron overload and induced lipid peroxidation are associated with impaired plasma lipid transport and hepatic sterol metabolism in rats. Hepatology 1999, 29, 1809–1817. [Google Scholar] [CrossRef]
  19. Dixon, S.J.; Lemberg, K.M.; Lamprecht, M.R.; Skouta, R.; Zaitsev, E.M.; Gleason, C.E.; Patel, D.N.; Bauer, A.J.; Cantley, A.M.; Yang, W.S.; et al. Ferroptosis: An iron-dependent form of nonapoptotic cell death. Cell 2012, 149, 1060–1072. [Google Scholar] [CrossRef]
  20. Stockwell, B.R. Ferroptosis turns 10: Emerging mechanisms, physiological functions, and therapeutic applications. Cell 2022, 185, 2401–2421. [Google Scholar] [CrossRef]
  21. Jiang, X.; Stockwell, B.R.; Conrad, M. Ferroptosis: Mechanisms, biology and role in disease. Nat. Rev. Mol. Cell Biol. 2021, 22, 266–282. [Google Scholar] [CrossRef] [PubMed]
  22. Lei, G.; Mao, C.; Yan, Y.L.; Zhuang, L.; Gan, B.Y. Ferroptosis, radiotherapy, and combination therapeutic strategies. Protein Cell 2021, 12, 836–857. [Google Scholar] [CrossRef] [PubMed]
  23. Howe, K.; Clark, M.D.; Torroja, C.F.; Torrance, J.; Berthelot, C.; Muffato, M.; Collins, J.E.; Humphray, S.; McLaren, K.; Matthews, L.; et al. The zebrafish reference genome sequence and its relationship to the human genome. Nature 2013, 496, 498–503. [Google Scholar] [CrossRef]
  24. Yang, W.Y.; Peng, M.J.; Wang, Y.Q.; Zhang, X.W.; Li, W.; Zhai, X.; Wu, Z.C.; Hu, P.; Chen, L.B. Deletion of hepcidin disrupts iron homeostasis and hematopoiesis in zebrafish embryogenesis. Development 2025, 152, dev204307. [Google Scholar] [CrossRef]
  25. Wilkinson, R.N.; Elworthy, S.; Ingham, P.W.; van Eeden, F.J.M. A method for high-throughout PCR-based genotyping of larval zebrafish tail biopsies. Bio Tech. 2013, 55, 314–316. [Google Scholar]
  26. Xin, Y.J.; Gao, H.; Wang, J.; Qiang, Y.Z.; Imam, M.U.; Li, Y.; Wang, J.Y.; Zhang, R.; Zhang, H.; Yingying, Y.; et al. Manganese transporter Slc39a14 deficiency revealed its key role in maintaining manganese homeostasis in mice. Cell Discov. 2017, 3, 17025. [Google Scholar] [CrossRef]
  27. Fei, Y.Y.; Wang, Q.; Lu, J.G.; Ouyang, L.Y.; Hu, Q.Q.; Chen, L.B. New insights into the antimicrobial mechanism of LEAP2 mutant zebrafish under Aeromonas hydrophila infection using transcriptome analysis. Fish Shellfish. Immunol. 2023, 143, 109225. [Google Scholar] [CrossRef]
  28. Gupta, A.; Balakrishnan, B.; Karki, S.; Slayton, M.; Jash, S.; Banerjee, S.; Grahn, T.H.M.; Jambunathan, S.; Disney, S.; Hussein, H.; et al. Human CIDEC transgene improves lipid metabolism and protects against high-fat diet-induced glucose intolerance in mice. J. Biol. Chem. 2022, 298, 102347. [Google Scholar] [CrossRef]
  29. Gao, G.; Li, J.; Zhang, Y.T.; Chang, Y.Z. Cellular Iron Metabolism and Regulation. Adv. Exp. Med. Biol. 2019, 1173, 21–32. [Google Scholar]
  30. Jiang, Y.; Yan, L.L.; Wang, X.; Zhu, G.X.; Xu, Y.J. Hepcidin inhibition on the effect of osteogenesis in zebrafish. Biochem. Biophys. Res. Commun. 2016, 476, 1–6. [Google Scholar] [CrossRef]
  31. Das, B.K.; Wang, L.; Fujiwara, T.; Zhou, J.; Burns, N.A.; Krager, K.J.; Lan, R.; Mackintosh, S.G.; Edmondson, R.; Jennings, M.L.; et al. Transferrin receptor 1-mediated iron uptake regulates bone mass in mice via osteoclast mitochondria and cytoskeleton. Elife 2022, 11, 73539–73570. [Google Scholar] [CrossRef] [PubMed]
  32. Kubo, Y. A new world of heme function. Pflügers Arch. Eur. J. Physiol. 2020, 472, 547–548. [Google Scholar] [CrossRef]
Figure 1. Hepcidin knockout in zebrafish alters liver iron distribution and gene expression profiles. (a) Dissected livers from wild-type (WT) and hepcidin knockout (hep−/−) zebrafish exhibited visible differences, with hep−/− livers appearing pale and lacking the characteristic reddish hue of WT livers. (b) Histological analysis using Prussian blue and Nuclear Fast Red staining revealed altered iron deposition. Blue staining, highlighted by black arrows, indicates iron accumulation, while red staining highlights cell nuclei. Insets provide magnified views of the regions with notable iron deposits in hep−/− livers. (c) Total iron content (Fe, μg/g) was quantified in the liver, gut, gill, skin, and eggs, showing significantly increased iron levels in hep−/− tissues compared with the WT. Eggs refer to unfertilized eggs collected from adult female zebrafish. Bar graphs display the mean values with individual data points, and statistically significant differences are denoted by asterisks (p < 0.05). (d) Principal component analysis (PCA) of liver samples showed distinct clustering of WT (red) and hep−/− (blue) groups according to the gene expression profiles, with Dim1 and Dim2 accounting for 28.3% and 22.6% of the variance, respectively. Ellipses represent 95% confidence intervals for each group. (e) Pearson’s correlation analysis of biological replicates demonstrated high intra-group consistency, as reflected by the intensity of the heatmap color, indicating correlation strength. (f) Differential expression analysis revealed significant transcriptional alterations in hep−/− livers, with 596 genes downregulated and 828 upregulated compared with the WT. The volcano plot displays log2 fold changes on the x-axis and −log10 p-values on the y-axis, with genes color-coded as up regulated gene (orange), up regulated gene with name marked (red), down regulated gene (light blue), down regulated gene with name marked (blue), or non-significant (gray).
Fishes 10 00243 g001
Figure 2. Functional enrichment analysis and gene expression profiles in the zebrafish liver transcriptome. (a) KEGG pathway enrichment analysis of DEGs, highlighting the top 10 enriched pathways. The x-axis represents −log10 p-values, with the color gradient indicating the number of genes contributing to each pathway. (b) Gene Ontology (GO) term enrichment analysis of DEGs, displaying the top 10 enriched terms categorized into biological processes and molecular functions. The x-axis shows −log10 p-values, and the color gradient represents the number of genes in each term. (cf) Heatmaps depicting the relative expression levels of genes enriched in key pathways in WT and hep−/− zebrafish liver samples. Expression values are normalized as Z-scores. (c) Genes involved in the ferroptosis pathway. (d) Genes involved in the fatty acid degradation pathway. (e) Genes associated with iron ion binding. (f) Genes associated with heme binding. Each row corresponds to an individual gene, and each column represents a biological replicate of WT or hep−/− samples. The color gradient indicates the relative expression levels, with blue indicating lower expression and red indicating higher expression.
Fishes 10 00243 g002
Figure 3. Impact of hepcidin deficiency on protein expression levels in zebrafish liver. Western blot (WB) analysis showed reduced expression levels of GPX4, Fth1, and FPN in the livers of hep−/− zebrafish compared with the WT controls. GAPDH was used as a loading control. GPX4, Fth1, and FPN correspond to the proteins encoded by the gpx4, ferritin heavy chain 1, and slc40a1 (ferroportin) genes, respectively. The number above the gel figure represents the distinct replicates within each group.
Fishes 10 00243 g003
Table 1. The primers used in this study.
PrimerSequence (5′-3′)Location in GRCz11Primer Binding LocationProduct Size (bp)
Hep-F1GATTAAAGGGACTACGCCGAATGchr16:50,289,518-50,289,5405′ UTR986
Hep-R1TAGGCCAAAATCATATCCCTGTchr16:50,290,678-50,290,699Intron2
Hep-F2CTTCCAGATCACAGCCGTTCCCTTCATACAGchr16:50,290,064-50,290,094Exon1170
Hep-R2GTGAATGTGTATTGTCTATATGTCCCCATAGchr16:50,290,203-50,290,233Intron1
Hep-F3AAATATCAGAGCCGAGCAGAAGchr16:50,289,922-50,289,943Exon1306
Hep-R3GTGTATTGTCTATATGTCCCCATAGGchr16:50,290,202-50,290,227Intron1
sgRNA1GATCACTAATACGACTCACTAT GGAAGAGCTAAAGCGTCACAAGTTTTAGAGCTAGAAATAGC chr16:50,289,873-50,289,8925’ UTR123
sgRNA-scaffoldAAAAGCACCGACTCGGTGCCACTTTTTCAAGTTGATAACGGACTAGCCTTATTTTAACTTGCTATTTCTAGCTCTAAAAC
sgRNA2GATCACTAATACGACTCACTAT GGTACAGGATGAGCATCATGAGTTTTAGAGCTAGAAATAGC chr16:50,290,543-50,290,562Exon2123
Disclaimer/Publisher’s Note: The statements, opinions and data contained in all publications are solely those of the individual author(s) and contributor(s) and not of MDPI and/or the editor(s). MDPI and/or the editor(s) disclaim responsibility for any injury to people or property resulting from any ideas, methods, instructions or products referred to in the content.

