Article

Numerical Simulation of Aquaculture-Derived Organic Matter Sedimentation in a Temperate Intensive Aquaculture Bay Based on a Finite-Volume Coastal Ocean Model

1
East China Sea Fishery Research Institute, Chinese Academy of Fishery Sciences, Shanghai 200090, China
2
College of Science, University of Shanghai for Science and Technology, Shanghai 200093, China
3
Ningde Marine Environment Monitoring Center, State Oceanic Administration (SOA), Ningde 352100, China
*
Author to whom correspondence should be addressed.
These authors contributed equally to this work.
Fishes 2025, 10(10), 483; https://doi.org/10.3390/fishes10100483
Submission received: 30 July 2024 / Revised: 1 September 2025 / Accepted: 8 September 2025 / Published: 28 September 2025

Abstract

In this study, a numerical model consisting of high-resolution hydrodynamic and Lagrangian particle tracking modules based on the Finite-Volume Coastal Ocean Model framework was established to simulate the hydrodynamic conditions and characteristics of the sedimentation of aquaculture-derived organic matter (AOM) from cage aquaculture in Sansha Bay. The results showed that Sansha Bay was characterized by regular semidiurnal tides and large tidal ranges. Reciprocating currents with main currents directed northward and southward during the rising and falling tides, respectively, predominated the main channels of the bay. Residual feed had larger settling velocities than feces. The maximal dispersion distances of residual feed and feces during the spring tide were 217.1 and 1805.7 m, respectively, three times those during the neap tide (74.2 and 675.6 m, respectively). During the spring tide, the largest dispersion distance of AOM occurred at the rush moment. The AOM movement trajectories were mainly controlled by the main currents. Both the tidal structure and current characteristics affected the AOM sedimentation in Sansha Bay. The sedimentation characteristics of AOM were unrelated to feeding intensity. The results of simulations agreed with the field observations in this study, suggesting that the estimated model had a good accuracy and sensitivity.
Key Contribution: This study established a numerical model based on the Finite-Volume Coastal Ocean Model framework to simulate the hydrodynamic conditions and characteristics of the sedimentation of aquaculture-derived organic matter (AOM). This study found water depth and current velocities affected AOM sedimentation. Moreover, feeding intensity barely affected dispersion distance and settling time.

1. Introduction

Cage farming is one of the most common types of aquaculture worldwide. During the cage farm operation, a considerable amount of aquaculture-derived organic matter (AOM), including feces and residual feed, is generated [1]. The AOM rich in nitrogen and phosphorus is released in both dissolved and particulate forms. Recent research in Daya Bay in the South China Sea showed that the annual amount of N and P released from fish cage cultures was 205.6 metric tons of N and 39.2 tons of P, while dissolved inorganic nitrogen (DIN) and dissolved inorganic phosphorus (DIP) accounted for 142.7 tons and 15.1 tons, respectively [2]. Dissolved nitrogen and phosphorus are consumed by primary producers such as phytoplankton and epiphyte [3]. Particulate AOM, which settles onto the seabed, may be utilized by benthic animals [4]. The long-term accumulation of dissolved AOM increases the risk of eutrophication in the water body. Excessive AOM deposition elevates the biochemical oxygen demand of the sediment and modifies the structures of benthic communities.
The sedimentation characteristics of AOM depends on the local hydrodynamic conditions (e.g., tidal structure and current velocity patterns) and management practices (e.g., stocking density and feeding manner); however, site-specific details of AOM sedimentation are not easily accessible. To date, the sedimentation characteristics of AOM had only been studied in a few fish farms worldwide. In such experimental studies, the AOM deposition rates at discontinuous sites were commonly analyzed along a distance transect [1,3,5,6]. In recent years, modeling approaches aiming at tracking and predicting the settlement of AOM as well as its spatial distribution have been employed in a few farms [7,8,9]. The results showed that modeling methods provided much more detailed results than those of in situ experiments.
Sansha Bay is one of the most typical temperate aquaculture bays on China’s coasts, which is characterized by the highest production of the large yellow croaker (Pseudosciaena crocea), that is, a single marine fish with the largest aquaculture output in China. The annual fish production of P. crocea in Sansha Bay reached 165,000 t in 2019, accounting for 73% of the total national yield (225,549 t) [10,11]. Sustainable aquaculture in Sansha Bay has been a target of the local government; therefore, a series of measures, such as mariculture licensing and fish cage abatement, have been implemented. However, these policies were determined empirically rather than experimentally and the AOM sedimentation in Sansha Bay, which represents the environmental effects of cage farming, remains poorly understood. The determination of the sedimentation characteristics of AOM in Sansha Bay will provide a theoretical basis for scientific management. The results of previous research revealed a disagreement between intensive cage farming and minor benthic environmental effects in Sansha Bay [12]. Understanding the AOM sedimentation in the area will contribute to a better understanding of the environmental effects of cage farming.
Because of the popularization of supercomputing platforms and the improvement of calculation methods in recent years, numerical models have been utilized to simulate AOM sedimentation. The Finite-Volume Coastal Ocean Model (FVCOM), originally developed by Chen et al. (2003) [13], has been widely employed to simulate the particle movement in marine environments. This model combines the best features of finite-element and finite-difference methods, fits the complex shoreline in the study regions well, and ensures the efficiency of the calculation [14]. It has been verified that the FVCOM was an effective tool in studies on the environmental effects of aquacultures [15].
In this study, a numerical model coupling high-resolution hydrodynamic and Lagrangian particle tracking models based on the FVCOM framework was established to simulate the sedimentation characteristics of AOM in Sansha Bay. The aims of this work were to (1) clarify the tidal structure and current velocity patterns in Sansha Bay; (2) simulate the sedimentation characteristics, mainly including horizontal dispersion distance, settling time and movement trajectories of feces and residual feed under varied hydrodynamic conditions; and (3) reveal the main sources affecting the sedimentation of AOM in Sansha Bay.

2. Materials and Methods

2.1. Study Region and Experimental Cage Unit

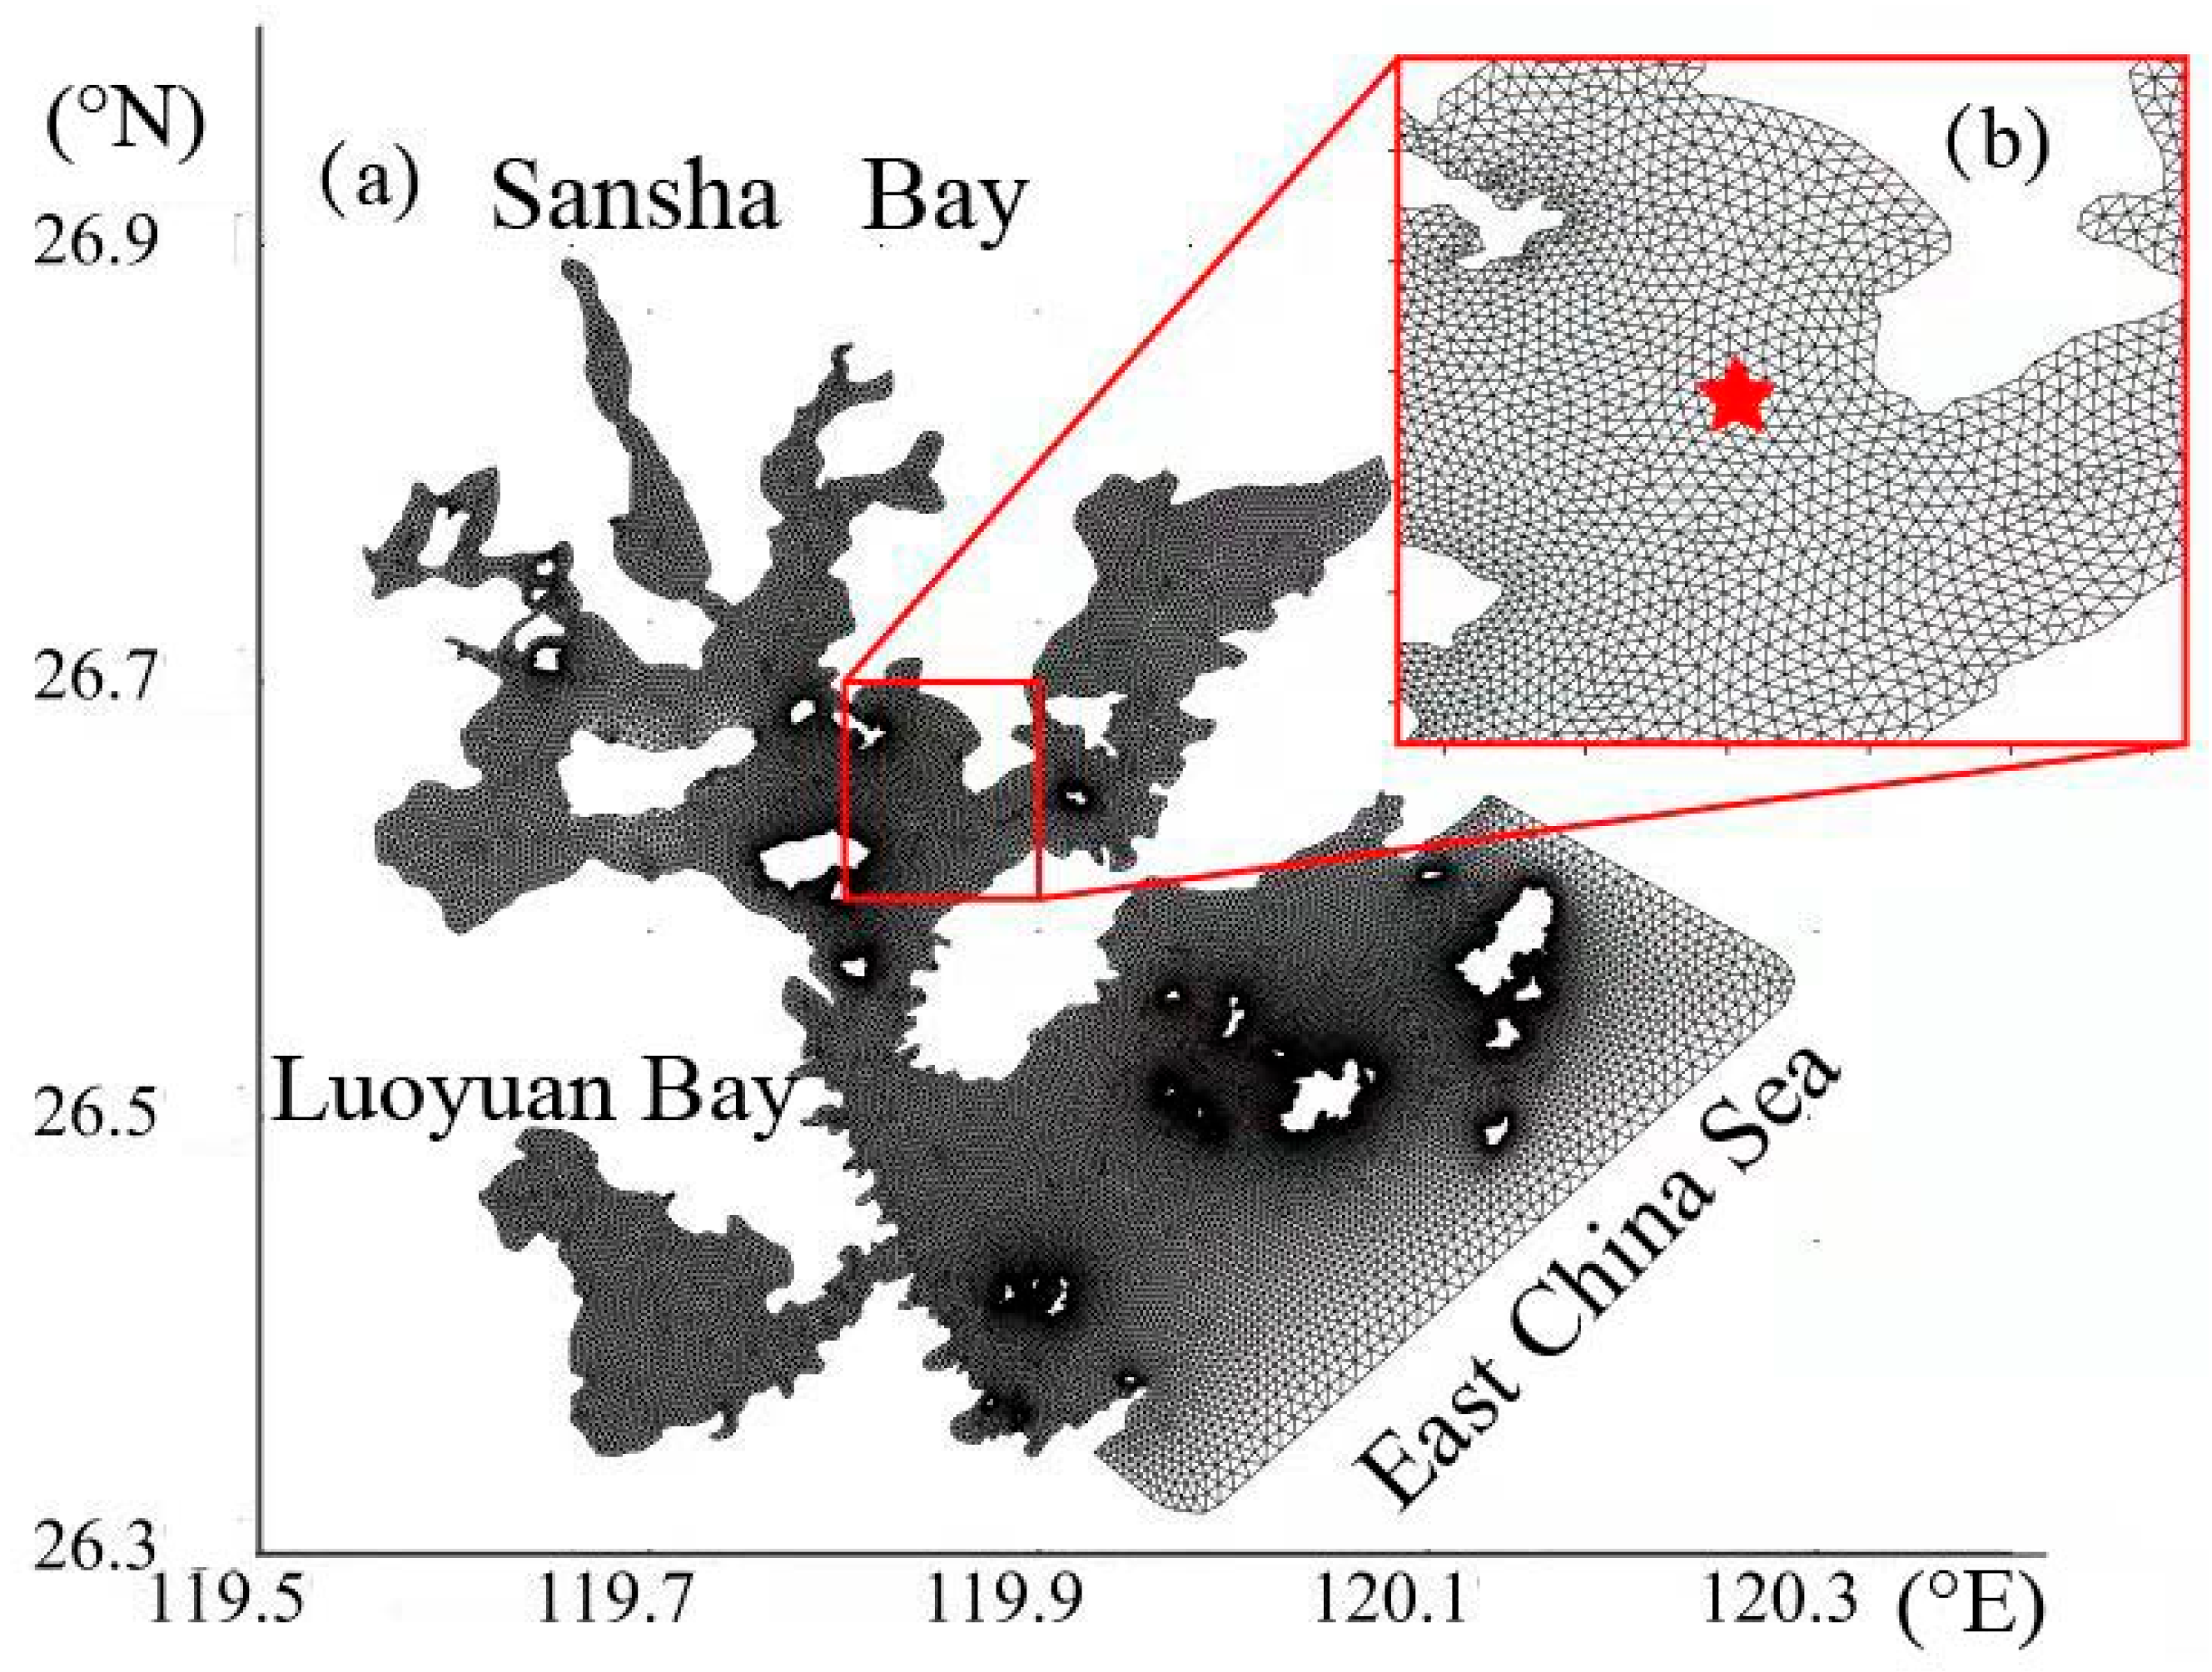
Sansha Bay (26.50–26.97° N, 119.43–120.17° E) is located at the northeastern coast of the Fujian Province, at the seaside junction of Xiapu County, Fu’an and Ningde, and Luoyuan Bay. Sansha Bay is a semi-closed bay, which is surrounded by the Luoyuan Bay and Dongchong Peninsula. Only a narrow (~3 km wide) entrance in the southeast connects the bay with the East China Sea (Figure 1). The coast of Sansha Bay is tortuous and complex. The total length of the shoreline is 488.8 km. The total bay area enclosed by the water boundary and shoreline is 738.0 km2; the island area is 62.54 km2.
The experimental cage unit (center geographical position: 119.8431° E, 26.6508° N) was located in the middle of Sansha Bay, characterized by intensive P. crocea cage farming. The unit consisted of 120 floating cages (length × width × height of a cage: 3 m × 3 m × 4 m), covering an area of ~4320 m3. The upper part of an individual cage is made of a wooden frame, and the lower part is a net made of nylon. The depth of the location of the experiment cage was ~15 m (Figure 1), and the depths of most cage farm areas in Sansha Bay ranged from 10 m to 40 m. The minimal distance between the experimental cage unit and its neighboring cages was 350 m. The experimental cage unit was fed once a day and the daily feed amount was ~120 kg of pellets or 1250 kg of trash fishes. Details about the aquaculture in Sansha Bay can be found in Ji et al. (2021) [12].

2.2. Model Configuration

In this study, a numerical model coupling hydrodynamic and particle tracking models based on the FVCOM framework was established to simulate the sedimentation characteristics of particulate AOM in Sansha Bay. During the simulation, all particulate AOM in the study area were considered as uniform particles. The hydrodynamic and particle tracking models were closely related. The hydrodynamic model outputs the tidal levels and current velocities in the study area. Based on these outputs, the particle tracking model calculated the AOM dispersion distances in the main directions in the σ coordinate system and simulated the particle movement trajectories. During the study, the two hydrodynamic and particle tracking models were run with the non-hydrostatic and the particle tracking modules, two of a series of modules involved in the FVCOM framework, respectively [13]. The non-hydrostatic module in FVCOM commonly consists of an equation set including the continuity equation, momentum equation, temperature diffusion equation, salinity diffusion equation and density equation. In this study, the temperature and salinity diffusion equations were omitted as the temperature and salinity fields in the study area were not involved.

2.3. Hydrodynamic Model

2.3.1. Description of the σ Coordinate System

In order to more accurately simulate the topography of the sea floor, which was considered to be expressed in terms of water depths, in Sansha Bay, the σ coordinate system expressed as Equation (1) was utilized. In the system, x, y and σ represents the horizontal direction, vertical direction, and direction perpendicular to the horizontal and vertical directions.
σ = z ζ H + ζ = z ζ D
where H is the water depth, ζ is the elevation of the still water body, D is the total depth of water body ( D = H ζ ). In the sea surface water, the value of σ is zero ( z = ζ ), while in the sea bottom water, the value of σ is −1 ( z = H ).

2.3.2. Equations in the σ-Coordinate System

The continuity (Equation (2)) and momentum equations (Equations (3) and (4)) and their related definitions (Equations (5) and (6)) can be described using the σ-coordinate system [13].
ζ t + D u x + D v y + w σ = 0 ,
u D t + u 2 D x + u v D y + u w σ f v D = g D ζ x g D ρ 0 [ x ( D σ 0 ρ d σ ) + σ ρ D x ] + 1 D σ ( K m u σ ) + D F x ,
v D t + u v D x + v 2 D y + v w σ + f u D = g D ζ y g D ρ 0 [ y ( D σ 0 ρ d σ ) + σ ρ D y ] + 1 D σ ( K m v σ ) + D F y ,
D F x x [ 2 A m H u x ] + y [ A m H ( u y + v x ) ] ,
D F y y [ 2 A m H v y ] + x [ A m H ( u y + v x ) ] ,
where x, y, and σ represent the main current directions in the σ-coordinate as defined in Section 2.3.1; t is the time (s); u, v, and w are the components of the current velocity (m s–1) on the x, y, and σ axes, respectively; ρ0 is the reference density of water (kg m–3); ζ is the tide level (m); D is the elevation of the still water surface (m); f is the Coriolis parameter (s–1); g is the acceleration of gravity (9.80665, m s–2); H is the water depth (m); DFx and DFy represent the horizontal momentum dispersion term; and Km and Am are the mixing coefficients of the vertical and horizontal directions, respectively, (m s–2).
Equation (2) was based on the law of conservation of mass, ζ t represented the variation in water elevation at a particular moment (t), D u x + D v y + w σ represented the variations in water elevation at different directions at a particular moment (t). Equations (3) and (4) were based on the law of conservation of momentum and Newton’s second law. D u t represented the accelerated speed at a particular moment (t). u 2 D x + u v D y + u w σ referred to the accelerated speed in a specific spatial extent. f is the Coriolis parameter (s–1), which originates from the earth’s gravity. g is the acceleration of gravity (9.80665, m s–2). g D ρ 0 [ x ( D σ 0 ρ d σ ) + σ ρ D x ] represents the water pressure. 1 D σ ( K m u σ ) + D F x refers to viscous force.

2.3.3. Grid Division

The whole area of Sansha Bay was used for the analysis of the hydrodynamic characteristics in this study. To avoid the influence of the boundary effect of the model, the Luoyuan Bay and East China Sea areas neighboring Sansha Bay were included. An unstructured triangular grid, which is of advantage because of the local encryption of specific areas, was utilized in this model to better match the simulated conditions to actual conditions. The unstructured triangular grid was obtained with the Surface Water Model System model (Figure 2). The minimal grid size was 25 m in areas around the experimental cage unit and the maximum was 1245.8 m in areas far away from the experimental cage unit. In Sansha Bay, individual fish cages (sizes could be referred to Section 2.1) were closely linked to form a unit. For example, the experimental cage unit in the present study consisted of 120 individual cages. In this case, the grid resolution was sufficient to simulate the deposition characteristics of fish farm waste in Sansha Bay. The horizontal triangular grid contained 25,792 nodes and 48,646 elements and the grid size for the calculation was moderate (Table 1).

2.3.4. Setting Boundary Conditions

(1) Vertical boundary conditions
The vertical velocities are mainly determined based on the vertical eddy viscosity, wind stress in the surface layer, and bottom stress in the bottom layer. The dynamic boundary conditions of the surface and bottom layers can be described using Equations (6) and (7):
u σ , v σ = D ρ 0 K m τ s x , τ s y w = ζ t + u ζ x + v ζ y ,
u σ , v σ = D ρ 0 K m τ b x , τ b y w = u H x v H y ,
where ( τ s x , τ s y ) and ( τ b x , τ b y ) = C d u 2 + v 2 ( u , v ) are the x and y components of the surface wind and bottom stresses, respectively. The drag coefficient Cd can be determined by matching a logarithmic bottom layer to the model at a height Zab above the bottom:
C d = max k 2 I n ( Z a b Z 0 ) 2 , 0.0025 ,
where the vertical eddy viscosity was set to 10–4, the von Karman’s constant was selected to be k = 0.4, and the bottom roughness parameter was Z0 [13]. The descriptions of other parameters in Equations (7) and (8) are the same as those provided for Equations (2)–(6).
(2) Open boundary conditions
The model operation was driven by tide levels on open boundaries. The tide levels were predicted using the NAOTIDE model, which was obtained from the website of the National Astronomical and Meteorological Observatory of Japan. The equation included in the NAOTIDE model is as follows:
ξ = i = 1 n f i H i cos [ w i t + ( V i + u i ) g i ] ,
where ξ represents the tide level, t is the time, fi is the ith tidal node factor (16 tidal components, including M2, S2, K1, O1, N2, P1, K2, Q1, M1, J1, OO1, 2N2, Mu2, Nu2, L2, and T2, were considered in this study), Hi is the amplitude of the ith tidal component, ωi is the angular frequency of the ith component tide, Vi + ui is the correction angle of the ith component tide, and gi is the ith tide phase lag. The values of Hi, ωi, Vi + ui, and gi were obtained with the NAOTIDE model.
(3) Closed boundary conditions
The closed boundary was a natural boundary with a normal current velocity of 0.
u n = 0 ,
where n is the normal vector of the side boundary.

2.3.5. Model Operation

The hydrodynamic model was initialized by the tidal level which was commonly found in FVCOM framework-based models. The model operation was driven by tide levels on open boundaries. The model was started from a static state and the initial current velocities and tide levels were set to 0. The hydrodynamic model started on 20 September 2020, and ended on 25 October 2020. The model operation was in the optimization process for the first five days and the outputs were utilized since 25 September 2020. Considering that the AOM sedimentation in the study area may be completed within a few minutes, the time step of the model calculation was set to a relatively small value to ensure the accuracy and efficiency of the calculation. After debugging, the time step of the external mode was 1 s and the step of the internal mode was 5 s. The minimum roughness of the bottom surface was 0.0025. The experimental cage unit was placed at a relatively shallow water depth and the vertical direction was divided into six layers. The output time interval of the model was 1 h (Table 1).

2.3.6. Determination of the Tidal Structure and Current Pattern

Tidal structure and current characteristics were determined by using the discriminant coefficient K and morphological coefficient F, respectively. The two coefficients were calculated as follows:
K = H K 1 + H O 1 H M 2 ,
F = W O 1 + W K 1 W M 2 ,
where H K 1 , H O 1 , and H M 2 are the amplitudes of the tidal components K1, O1, and M2 respectively, and W K 1 , W O 1 , and W M 2 are the lengths of the elliptic long half axes of the tidal currents K1, O1, and M2, respectively. When K < 0.5, 0.5 < K < 2.0, 2.0 < K < 4.0, and K > 4.0, the tidal structure is considered to be a regular semidiurnal tide, irregular semidiurnal tide, irregular diurnal tide, and regular diurnal tide, respectively. When F ≤ 0.5, 0.5 < F ≤ 2.0, 2.0 < F ≤ 4.0, and F > 4.0, the current is a regular semidiurnal tidal current, irregular semidiurnal tidal current, irregular diurnal tidal current, and regular diurnal tidal current, respectively.

2.3.7. Verification of the Tidal Structure and Current Pattern

The model accuracy and sensitivity were analyzed in this research to determine the credibility of the simulated tide structure and current characteristics, that is, the two main modeling outputs. The correlation coefficient, mean absolute errors of the simulating results and observations of tide structure (tide levels, amplitude and phase lag) and current characteristics (current velocities and directions) were calculated during the analysis. The simulated tide structure was verified at four sites, that is, Baima, Chengao, Dongchong, and Qingyu (Figure 1) from 20 September 2020, to 25 October 2020. The simulated tide levels, amplitude and phase lag were calculated using harmonic analysis with T_Tide in MATLAB. The observed tide levels, amplitude, and phase lag were obtained with the NAOTIDE model. The simulated current characteristics were verified at one station (119.79° E, 26.64° N) close to Qingshan Island in Sansha Bay. Acoustic Doppler Current Profilers (ADCPs, WHM600kHz, Teledyne RD Instruments, Poway, CA, US) were used to monitor the current velocities and directions from 7:00 a.m. (GMT+8) on 2 October 2020, to 8:00 a.m. on 3 October 2020. Data were collected every hour at three water depths (0.2 H, 0.6 H, and 0.8 H).

2.4. Lagrangian Particle Tracking Model

2.4.1. Equations in the σ-Coordinate System

The present study aimed to elucidate the dispersion characteristics of the residual feed and feces particles in Sansha Bay, employing a particle tracking model for simulation. The movement trajectories of the particles from the surface to the seabed were analyzed with the 3-D (three dimensional) Lagrangian particle tracking model in the FVCOM. Matlab R2018a software was used to digitize the results of the hydrodynamic model. The trajectories of the particles were tracked by solving the equations in the x, y, and σ space as follows:
d x d t = u , d y d t = v , d σ d t = ϖ H + ζ ϖ = ω ( 2 + σ ) d ζ d t σ d H d t ,
where the velocity components of the x, y, and σ axes are represented by u, v and ϖ, respectively. The 4- stage ERK (explicit Runge-Kutta) algorithm can be used to solve this equation.

2.4.2. Parameter Setting

During the model analysis in the present study, the cage unit was treated as the initial position of the particle. Residual feed and fecal matter were treated as standard particles. The two kinds of particles differed in the settling velocities and the dispersion distances of the particles were simulated separately. The horizontal and vertical dispersion coefficients were 0.01 and 0.001 m2 s–1, respectively, based on previous studies [13]. The settling velocities of feces and residual feed were designated as 0.007 and 0.07 m s–1, respectively, in this study. The velocities had been verified in sea bass (Lateolabrax japonicas) farming practices in the Yellow Sea of China [15]. The L. japonicas and P. crocea were similar in feeding habits, that is, both are carnivorous fish, and in their feeds during the farming operations. Part of AOM may be dissolved during sedimentation which potentially affects the settling velocities. The present study attempted to minimize such kinds of influences through citing the settling velocities values obtained from an analog indoor experiment [15]. The time step, a key parameter in Lagrangian particle tracking model analysis, may affect the accuracy of the particle trajectories. After debugging, the time step was 60 s of the particle trajectories simulation. In accordance with previous studies, the number of releasing particles was set as 5000 during the simulating of AOM sedimentation in varied scenarios [14]. The numbers of releasing particles at three levels (5000, 10,000, and 15,000) were designated and were aimed at representing the varying feeding intensities during the model analysis (Table 2).

2.5. Scenarios and Contents of Numerical Simulations

In this study, AOM sedimentation characteristics were simulated for every hour of a complete tidal cycle. Specific hydrodynamic conditions, such as high and low water, rush and ebb moments, and spring and neap tides, were included in the simulation. The largest water depths were observed under high water, whereas the smallest depths were detected under low water during the spring tide. The current velocities of the rush and ebb moments were greater than those during other periods in the tidal cycle. The AOM was expected to disperse at greater distances in deeper waters with high current velocities. In each scenario, the movement trajectories and dispersion distances of feces and residual feed were simulated under the condition that the number of releasing particles was 5000.

3. Results

3.1. Hydrodynamic Characteristics of Sansha Bay

3.1.1. Tidal Structure

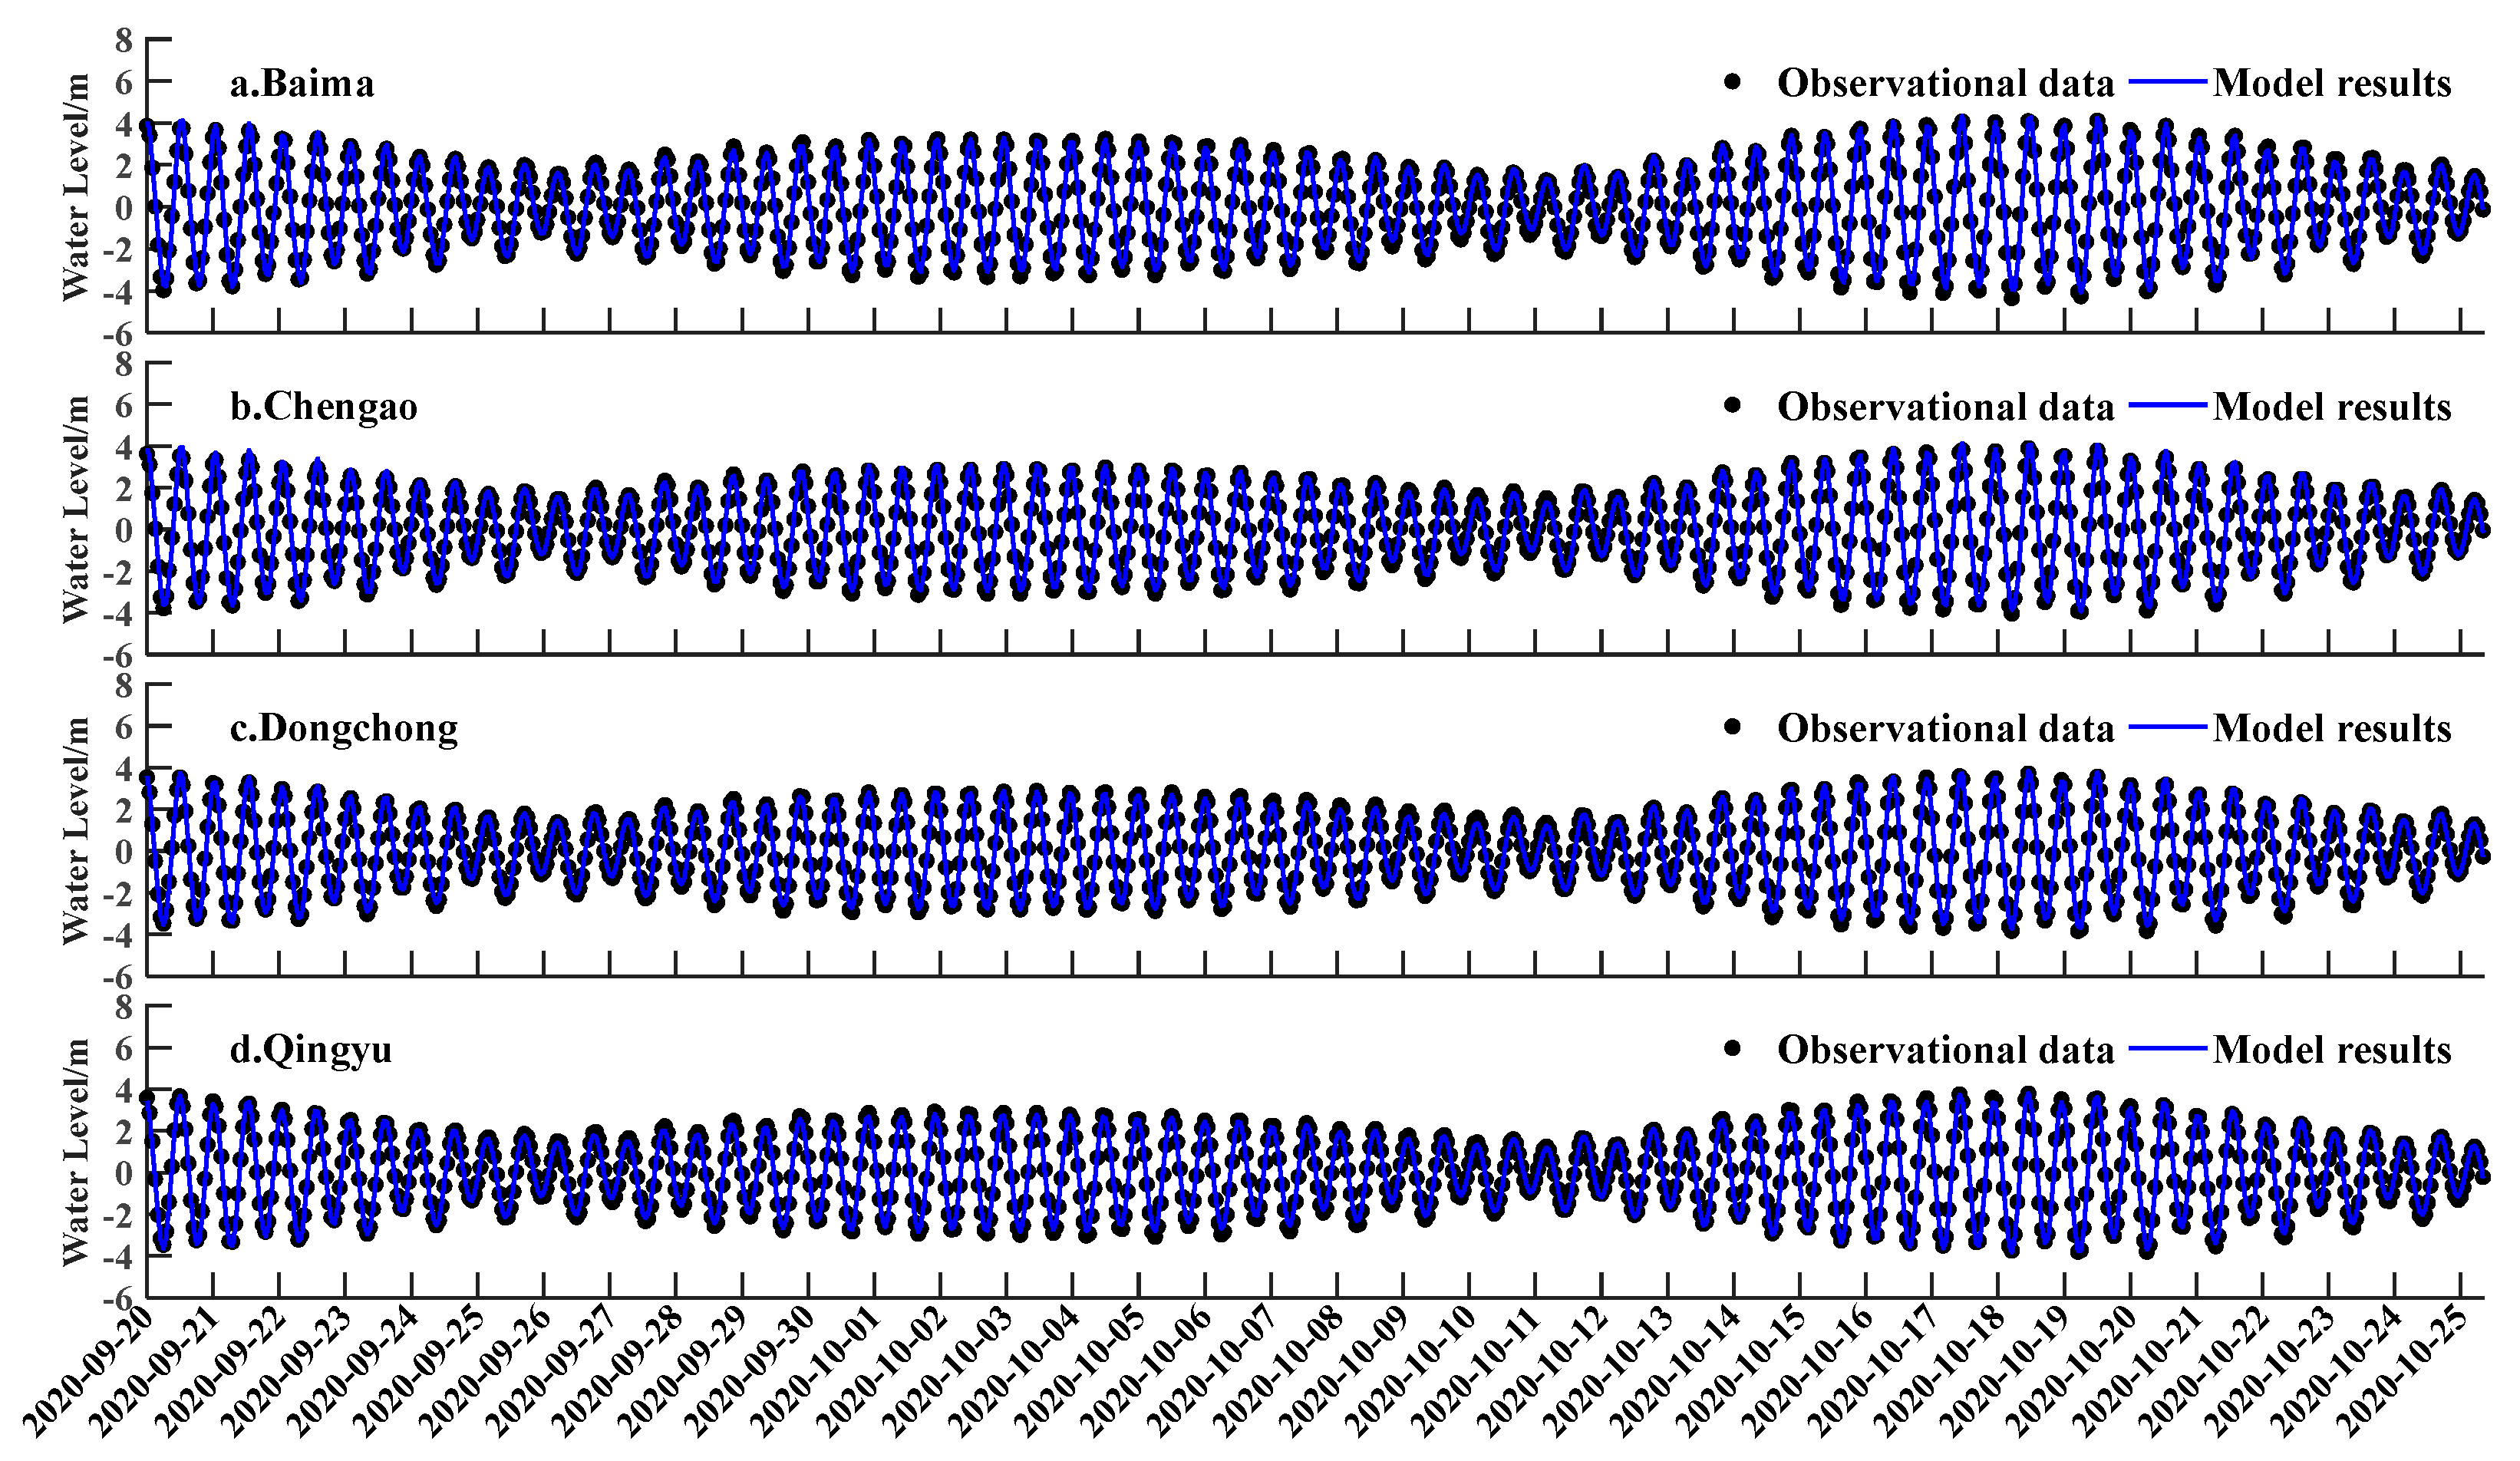
The discriminant coefficient K values of the tides in Sansha Bay ranged from 0.2 to 0.3, indicating that the local tidal structure was representative of a regular semidiurnal tide. The results of the simulations showed that the amplitudes between the highest and lowest tide levels were large and spatially varied. The largest amplitude occurred in the inner part of the Bay (highest and lowest tide levels of 4.1 and –4.3 m, respectively), whereas minor discrepancies were present in the middle, mouth, and outside of the bay. The average tidal amplitude obtained at four field monitoring stations (Baima, Chengao, Dongchong, and Qingyu) was 7.9 m.
The simulated tide levels were consistent with the field observations, with a correlation coefficient of 0.99 (Figure 3a–d). The mean absolute errors of the monitored and simulated tide levels at the four monitoring stations were 0.20, 0.20, 0.13, and 0.13 m, respectively. The mean absolute errors of the amplitude and phase lag between the simulated and monitored results for the four main tidal components (M2, S2, K1, and O1) in Sansha Bay are shown in Table 3. The mean absolute errors of the tidal amplitude were less than 10 cm (M2: 1.68 cm; S2: 2.88 cm; K1: 0.92 cm; O1: 0.24 cm) and those of the phase lag were less than 10° (M2: 1.54°; S2: 1.61°; K1: 3.51°; O1: 0.76°).

3.1.2. Current Velocities and Directions

The morphological coefficient F of the tides in Sansha Bay was less than 0.5, suggesting that reciprocating currents predominated the study area. The current velocities and directions in Sansha Bay spatially varied (Figure 4). The main current directions during the falling and rising tides were opposite, that was, northward and southward, respectively. The mean current velocities of the rising tide were slightly greater than those of the falling tide. The maximal vertical velocity in Sansha Bay of 3.0 m s–1 was observed at Dongchongkou Station during rising tide. Under high and low water, the channel and entrance of the bay were characterized by swift currents, whereas the currents in most other bay areas were weak.
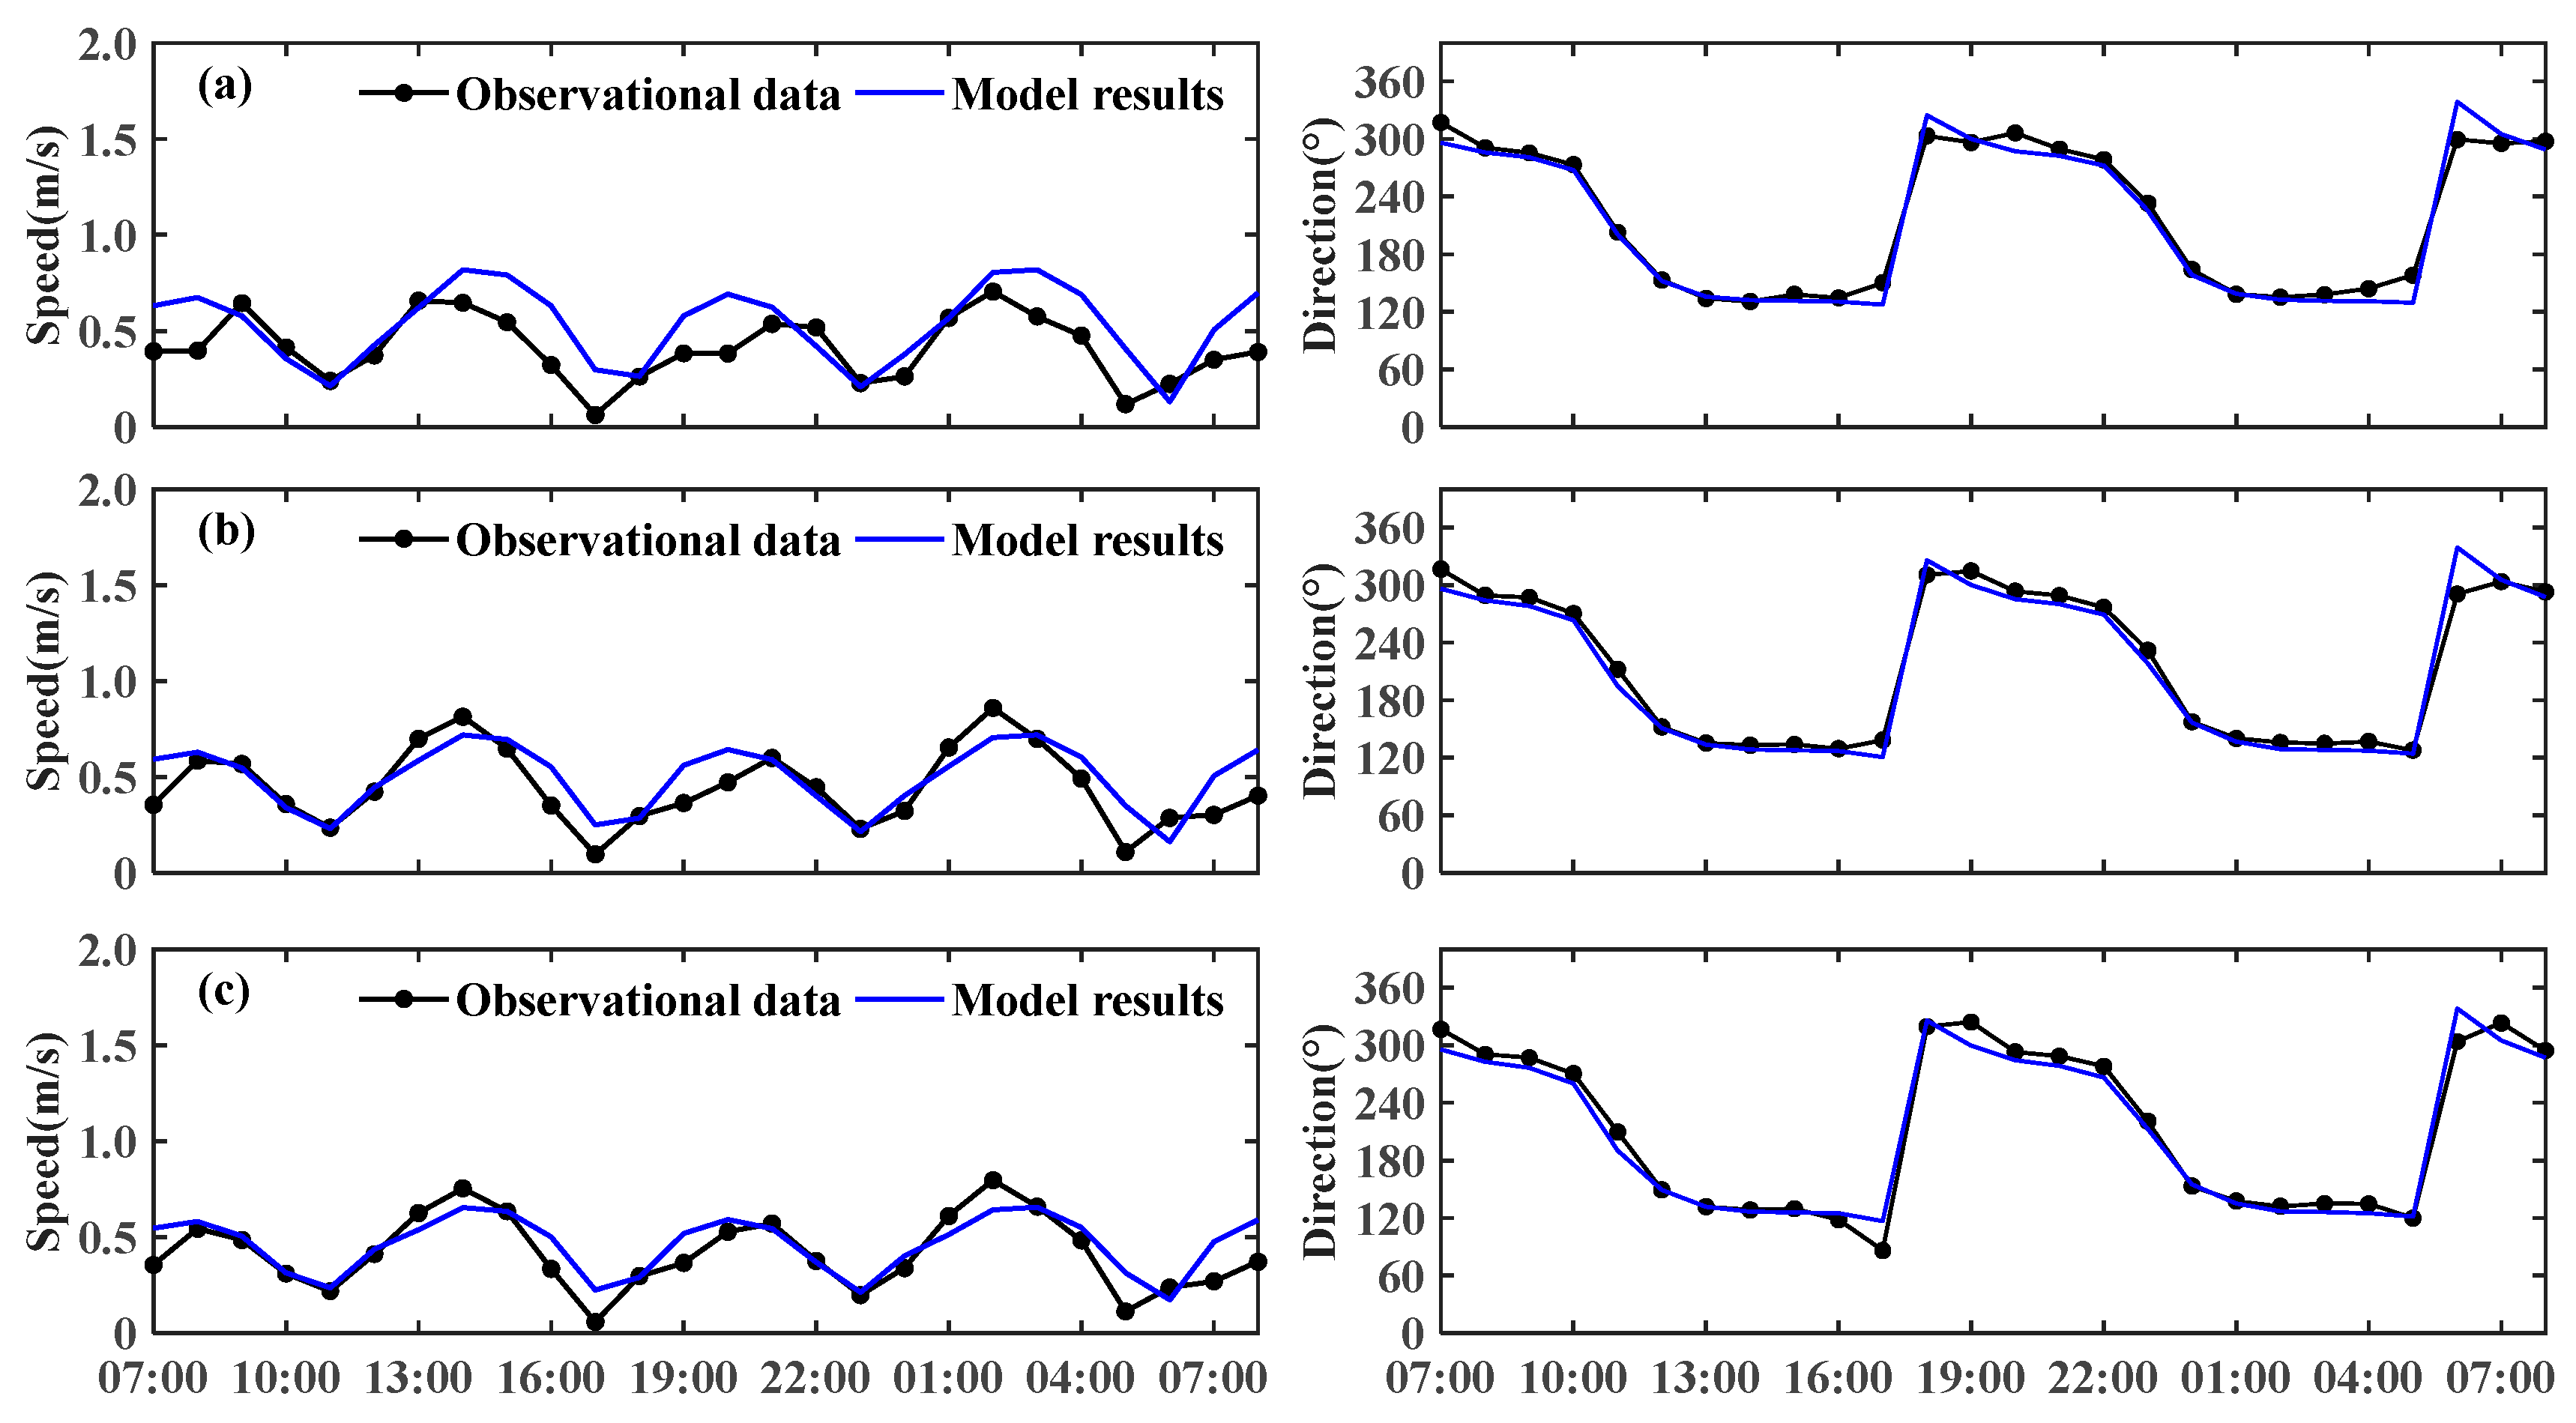
The simulated current velocities and directions of the different water layers (0.2 H, 0.6 H, and 0.8 H) are shown in Figure 5a–c. The simulated results, including the maximum and turning points, were consistent with the observations. The mean absolute errors between the simulated and observed current velocities at each level were 0.152, 0.103, and 0.098 m s–1, respectively. The mean absolute errors of the tide direction at each level were 9.88°, 9.52°, and 10.42°, respectively, (Table 4).

3.2. Sedimentation Characteristics of Feces and Residual Feed

3.2.1. Dispersion Distance of Feces and Residual Feed

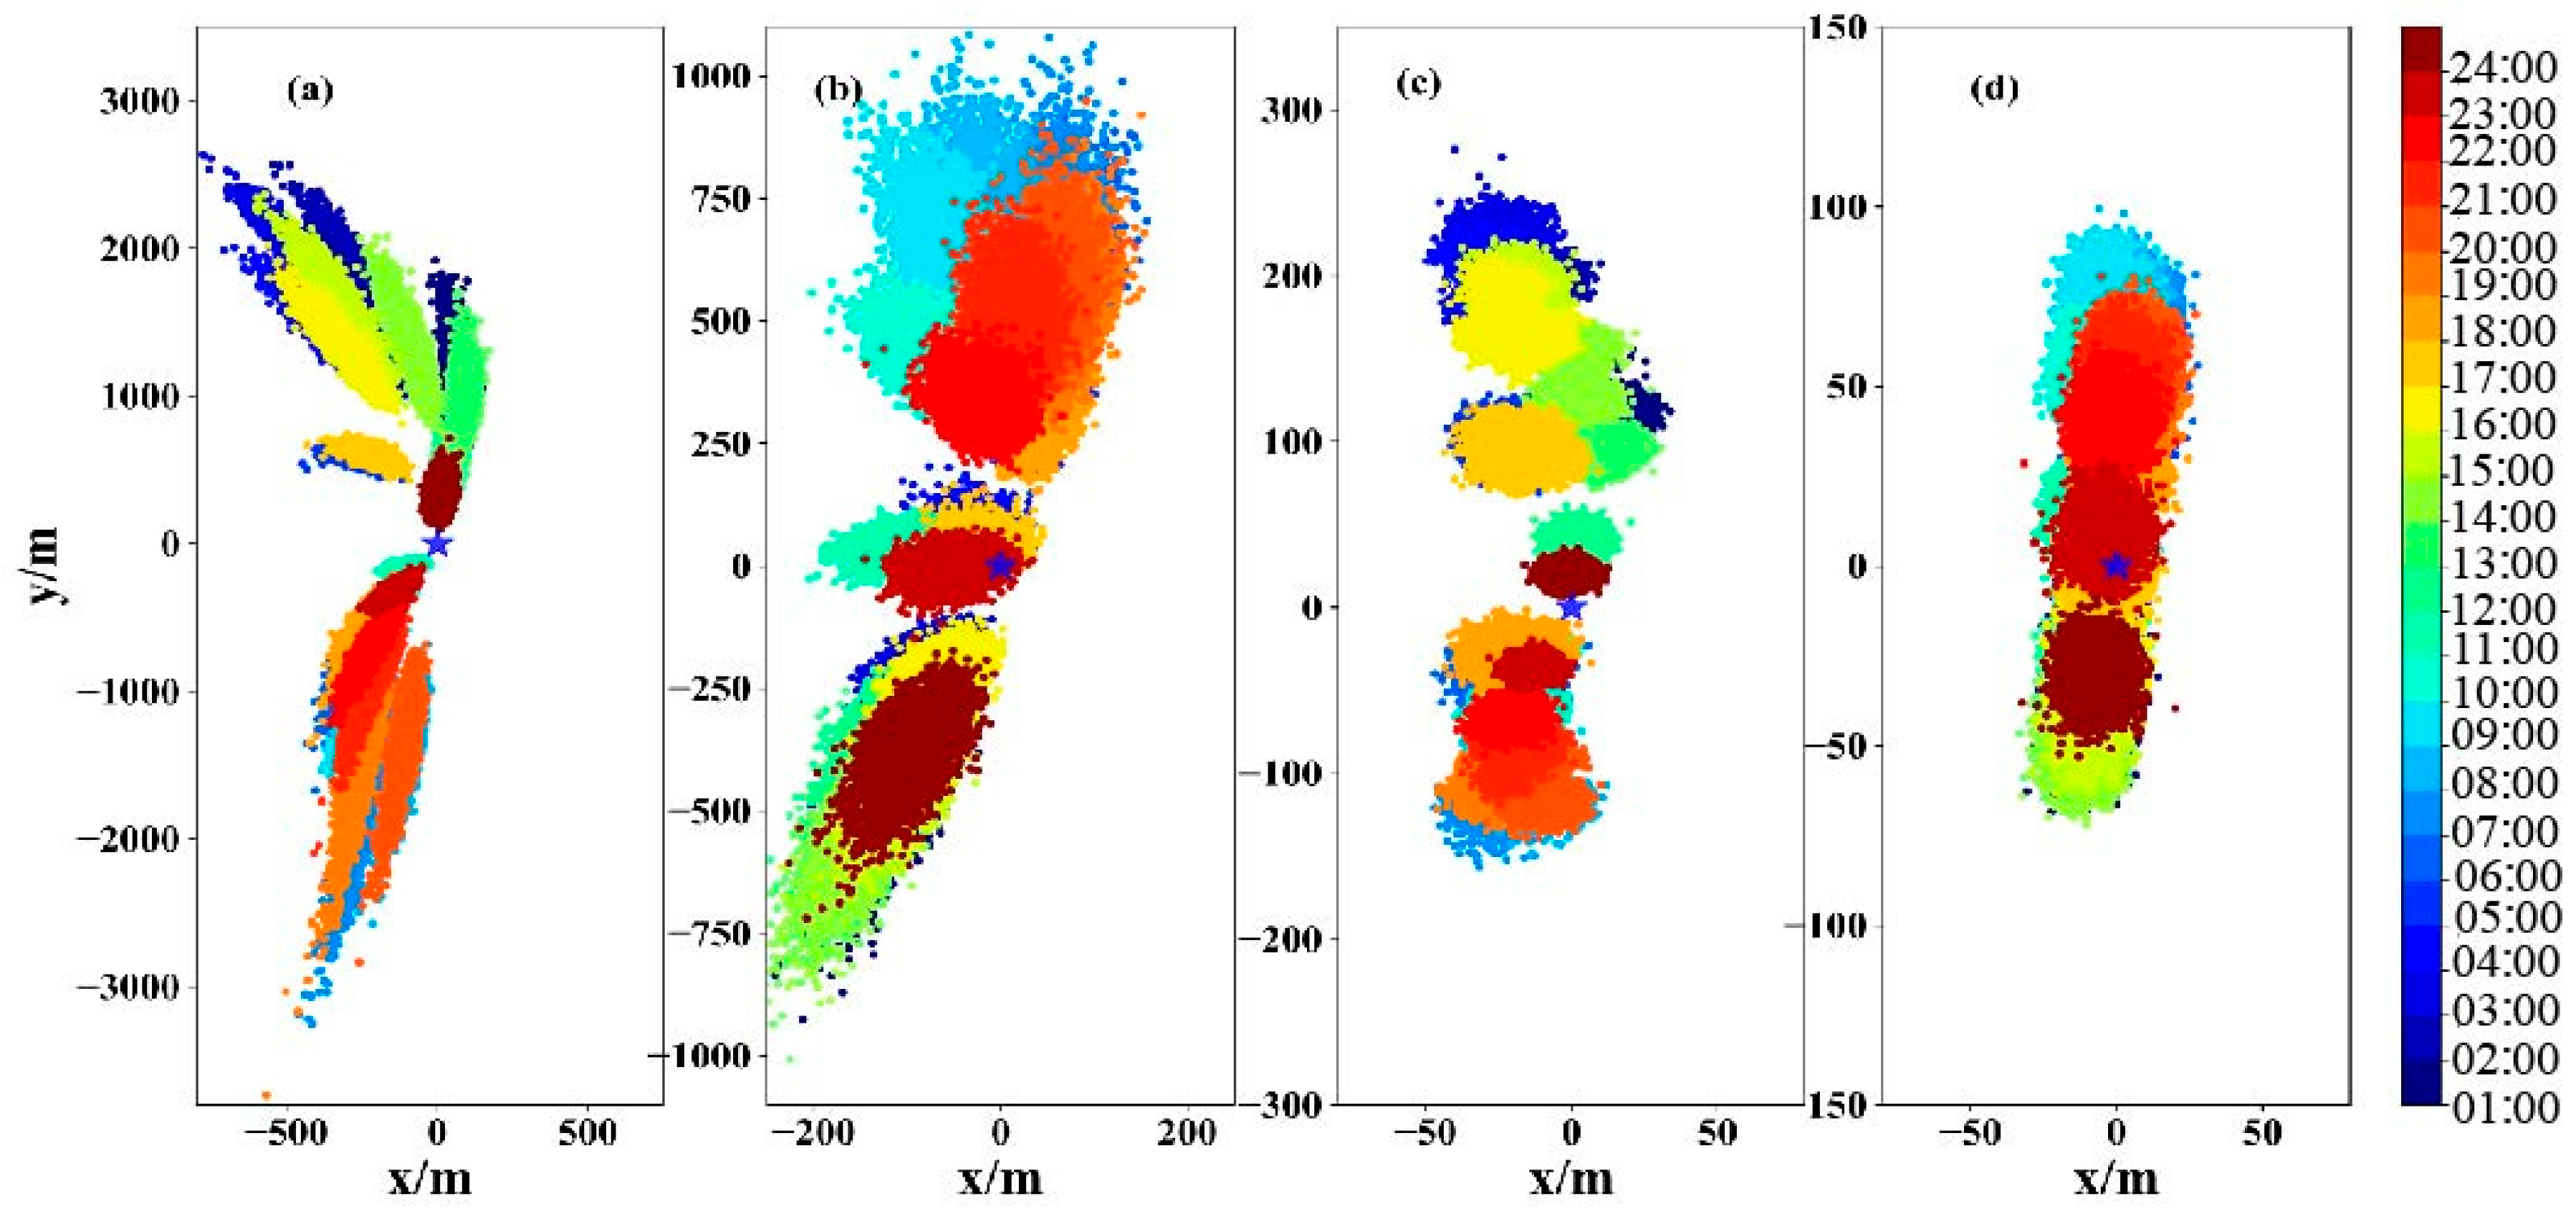
The dispersion distances of feces and residual feed every hour and the specific hydrodynamic conditions of a complete tidal cycle in Sansha Bay were simulated (Table 5). The results showed that the dispersion distances of the feces and residual feed significantly differed depending on the scenario. For example, the dispersion distance of feces ranged from 45.7 to 675.6 m during neap tide and from 190.2 to 1805.7 m during spring tide. Residual feed was dispersed at distances ranging from 3.8 to 74.2 m and 20.9 to 217.1 m during the neap and spring tide, respectively. The dispersion distances of both feces and residual feed were much larger during the spring tide. The maximum dispersion distance (1805.7 m) of feces was approximately three times that during the neap tide (675.6 m). The dispersion distances of residual feed were 217.1 and 74.2 m, respectively. Residual feed had smaller dispersion distances than those of feces, with maximum distances of 217.1 and 1805.7 m, respectively. Most feces and residual feed were dispersed northward and southward during rising and falling tides, respectively, (Figure 6).

3.2.2. Effect of the Feeding Intensity on the Sedimentation Characteristics of Feces and Residual Feed

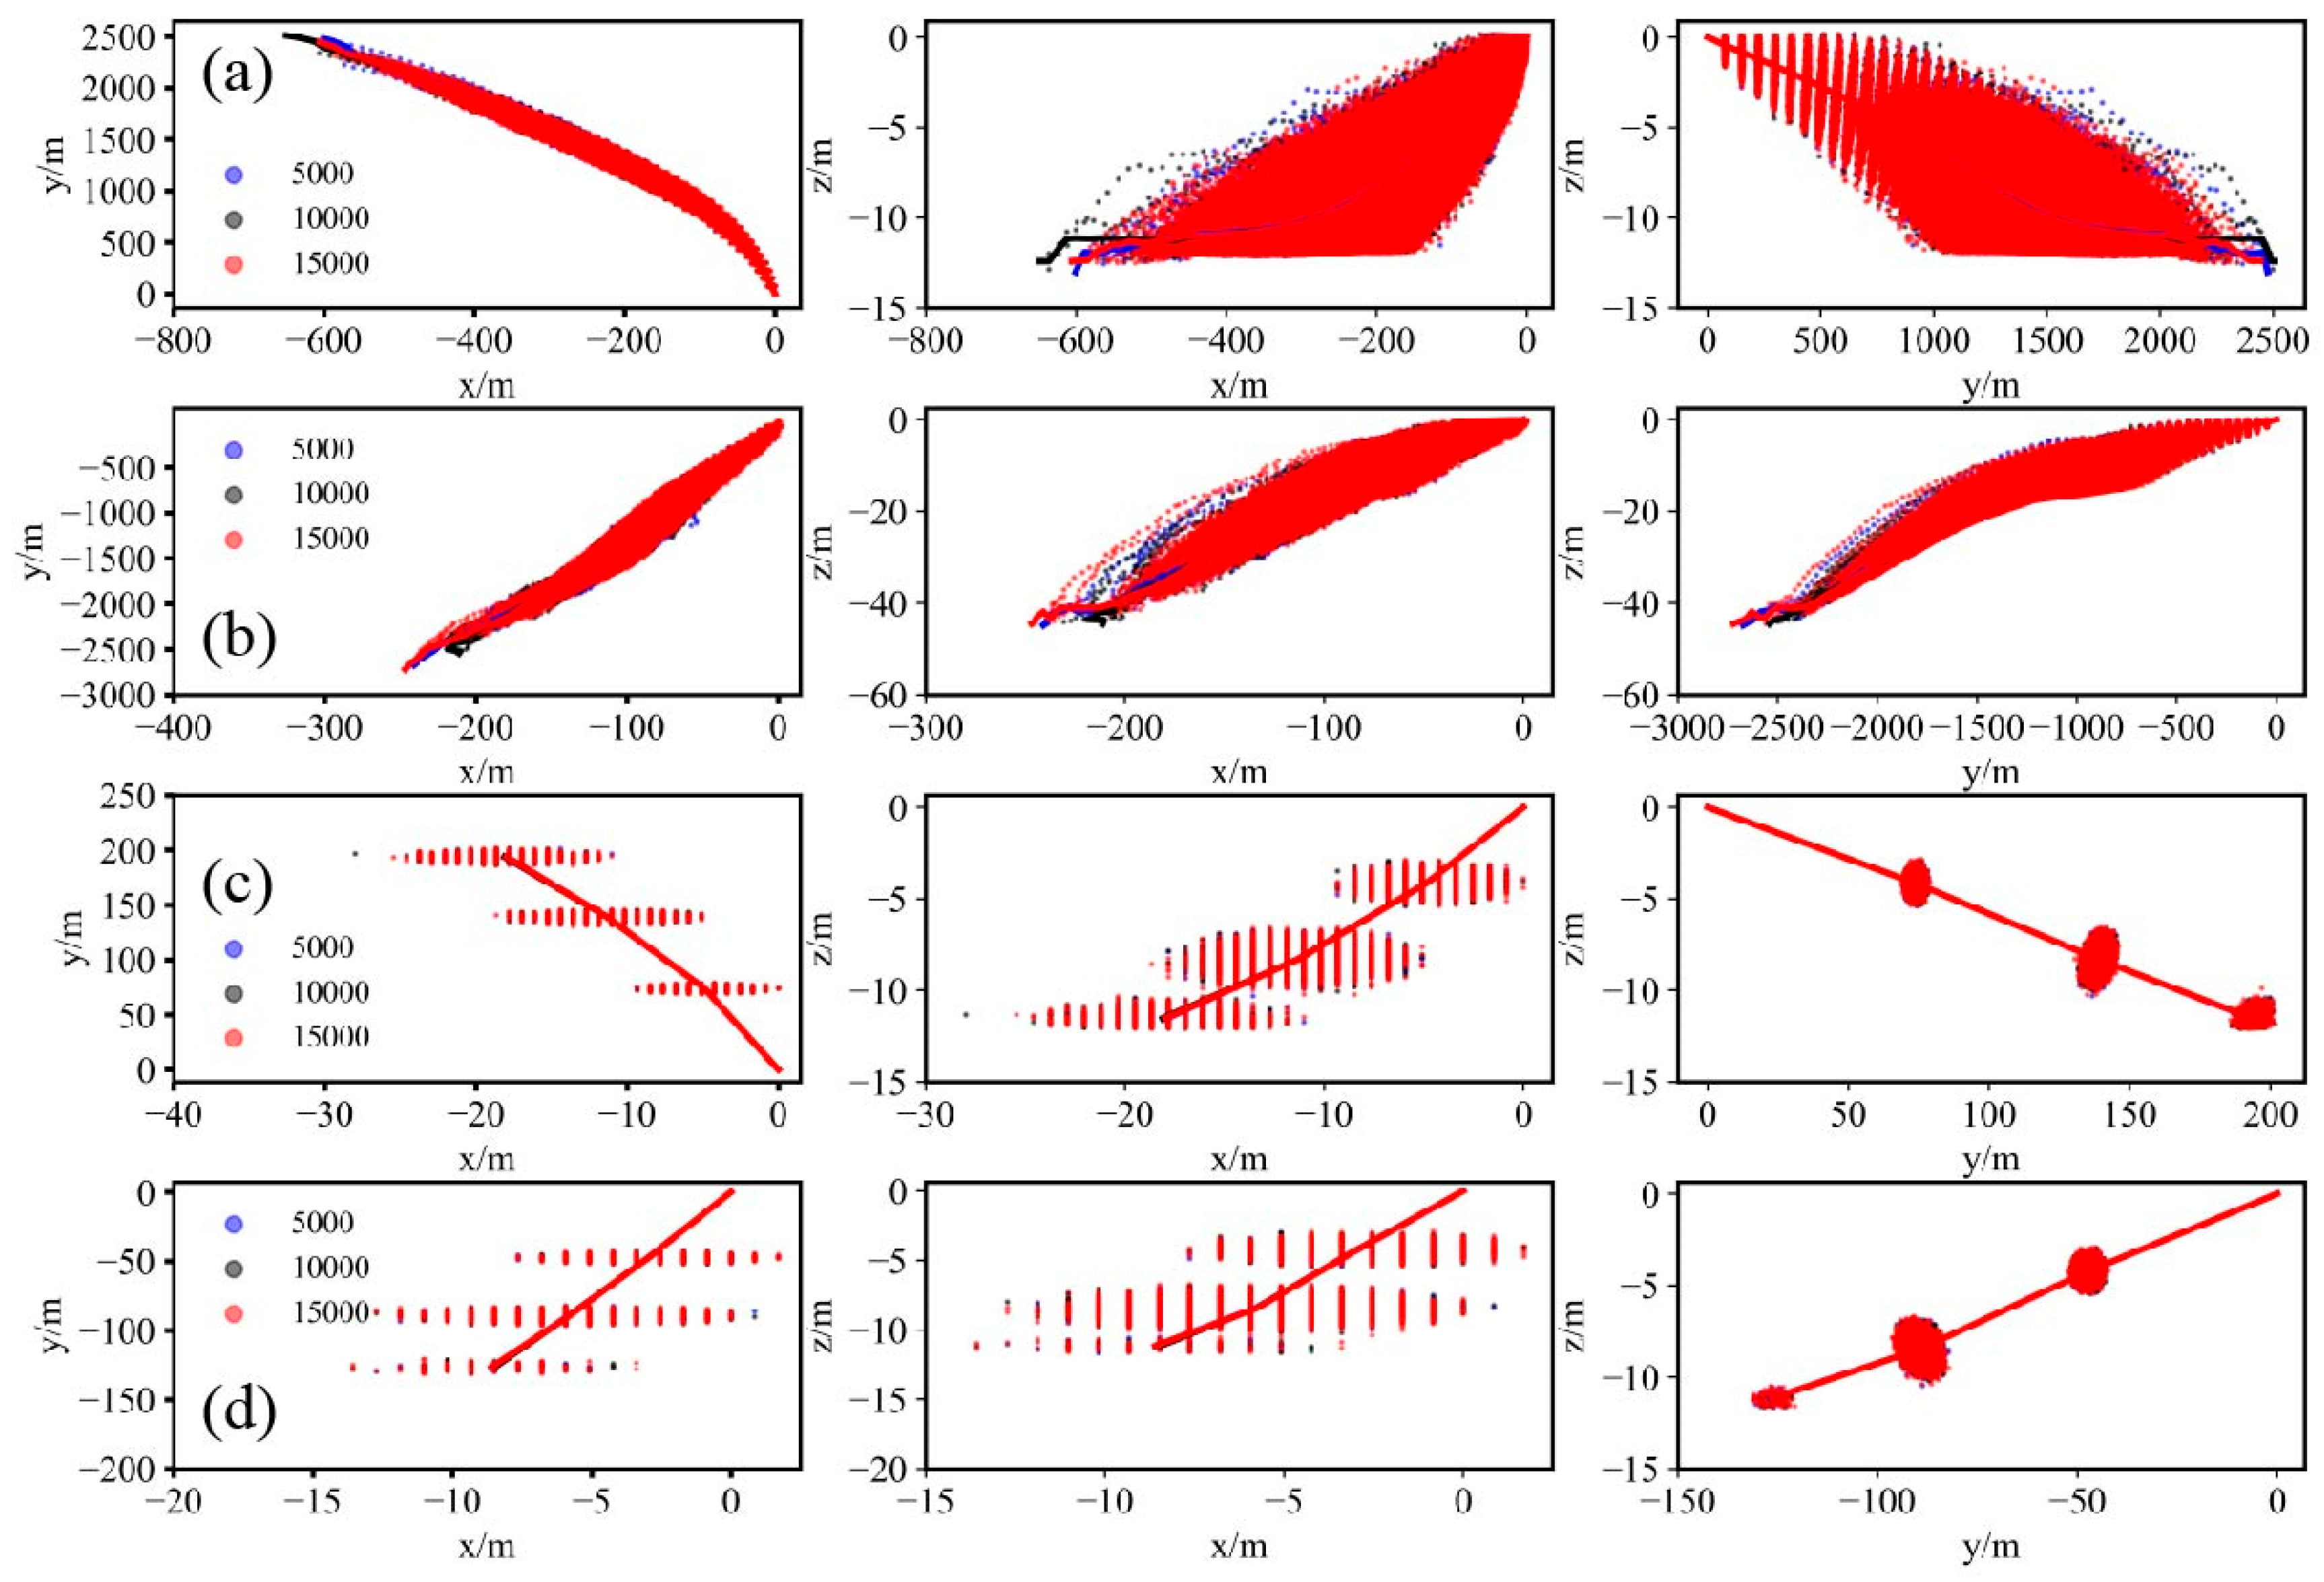
The dispersion distances and settling time of feces and residual feed were simulated under three scenarios in which the numbers of the releasing particles were set to 5000, 10,000 and 15,000, respectively, aiming at reflecting the feeding intensities. The results showed that the feeding intensity insignificantly affected the dispersion distance and settling time of AOM (Table 6). For example, the dispersion distances and settling time of feces under high water during the spring tide were almost the same at three different feeding intensities (626.6, 625.4, and 625.3 m, respectively, and 35.2, 35.1, and 35.2 s, respectively).
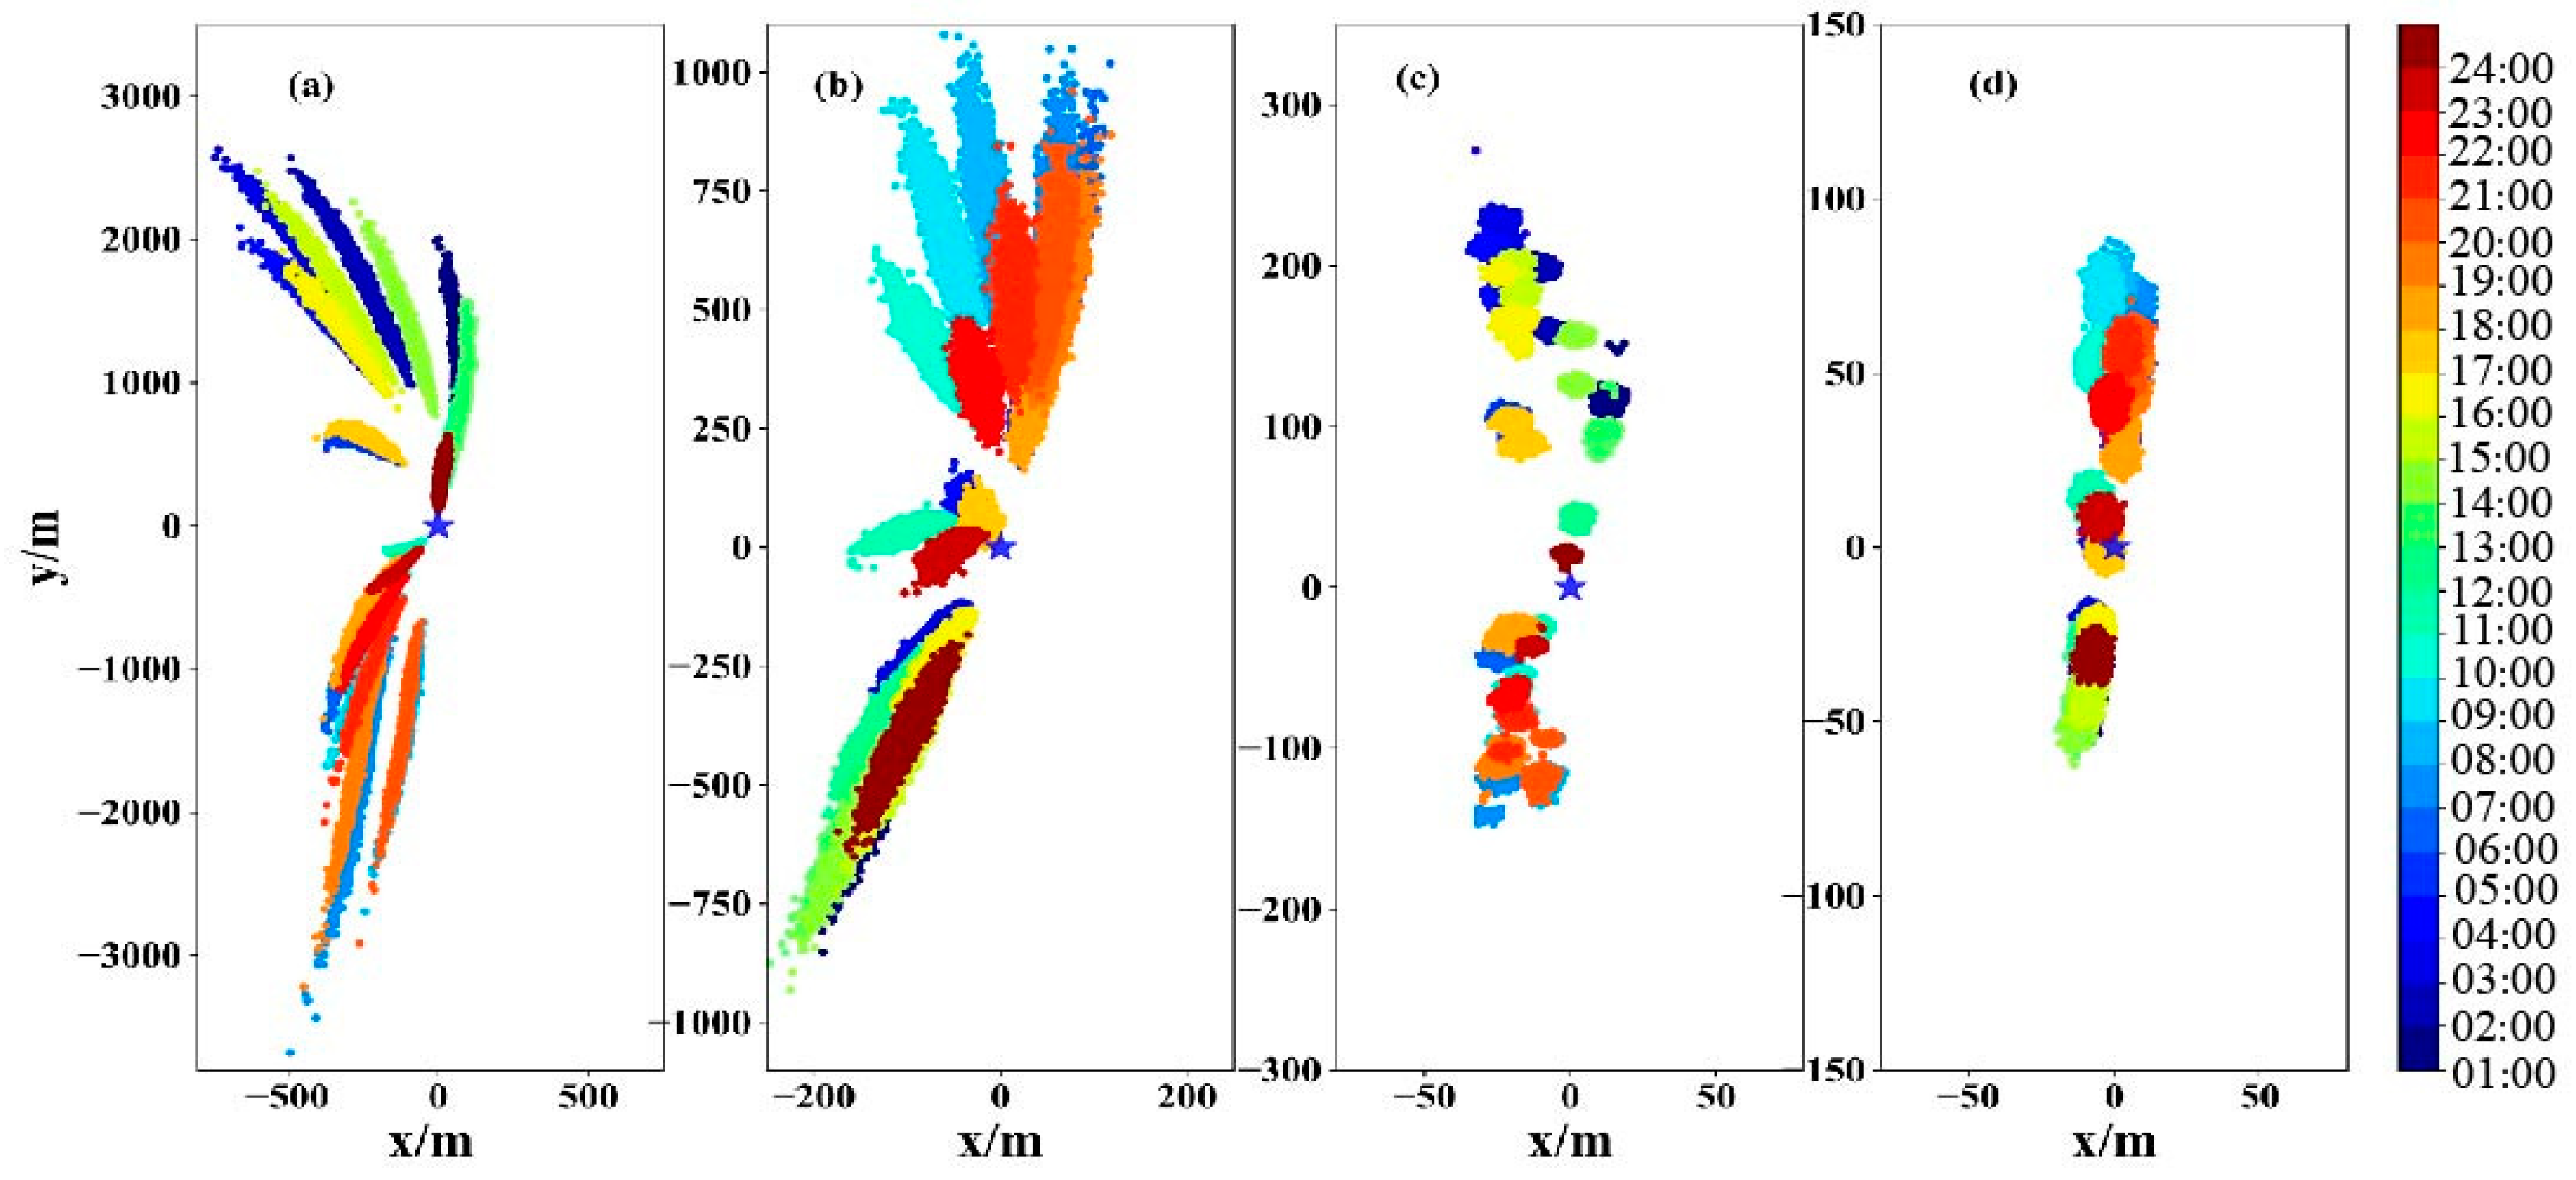
The movement trajectories of the feces and residual feed at varied feeding intensities were plotted in Figure 7. Most feces and residual feed moved along the dominant current direction. Currents in non-dominant directions jointly affected the particle movements. The trajectories of the feces and residual feed at different feeding intensities were basically the same based on the coincidence of the center masses of varying trajectories.

4. Discussion

4.1. Model Accuracy and Sensitivity Analysis

The accuracy and sensitivity of the models used in this study were determined to be good, suggesting that the simulation results were credible. Model accuracy and sensitivity testing was a key procedure in numerical simulation analysis and affected the quality of the outputs. In this study, the accuracy and sensitivity of the models were analyzed by determining the correlation between the simulation results and observations. The coefficient of the correlation between the simulated tidal levels and observations was 0.99, suggesting that the simulations were reliable (Figure 3). The mean absolute errors of the simulated and monitored results of the amplitudes of the four main tidal components (M2, S2, K1, and O1) were less than three cm (Table 3), which was relatively low. The errors of the phase lag of the four components were less than 10°, implying that the simulated and monitoring results fit well. The mean absolute errors of the current velocities at each depth were less than 0.2 m s–1 and the errors of the tide directions were ~10°, indicating the high quality of the simulations.
The horizontal dispersion coefficient method was employed in this study. The results showed that the simulated particle movement trajectories were reliable. The horizontal dispersion coefficient has been proven to be a useful factor in testing the sensitivity of particle trajectories [16]. In this study, the horizontal dispersion coefficient was utilized to describe the random movement of particles. In marine environments, the movement of particles was driven by the main current and random motions of particles were insignificant. In this case, the horizontal dispersion coefficient of the particles was expected to be low. In this study, particle movement trajectories were simulated under the condition that the horizontal dispersion coefficient increases tenfold (0.1 m2 s–1) while the other parameters remained the same as those shown in Figure 8. Based on the increase in the horizontal dispersion distance compared with that in Figure 6, the particle trajectories were dispersed more; however, the main trajectories remained the same (Figure 8).

4.2. Hydrodynamic Characteristics of Sansha Bay

Based on the discriminant coefficient K and morphological coefficient F determined in this study, Sansha Bay had a regular semidiurnal tide and reciprocating currents, respectively. The hydrodynamic characteristics of Sansha Bay determined in this study coincided with those determined in previous studies. Reciprocating currents were previously documented for Sansha Bay, with seawater flowing from the outer bay into the inner bay during rising tide and opposite flows during the falling tide [17]. Sansha Bay was characterized by high current velocities. The velocities spatially varied, and the maximum velocity was 3.0 m s–1 based on the simulations in this study. The current velocities in Sansha Bay were significantly higher than those reported for other cage farms (e.g., the maximum 0.41 m s–1 and the average 0.20 m s–1 in two cage farming areas at Mediterranean coasts, that was, the coasts of Spain and Greece, respectively).
The tidal structure and current characteristics were important factors affecting particle sedimentation in marine environments. High tidal ranges and strong currents were expected to facilitate particle dispersion. Sansha Bay was characterized by strong currents and large tidal ranges, where the AOM was expected to have large dispersion distances. The tidal structure and current characteristics in Sansha Bay spatially varied (Figure 3 and Figure 4), which suggested that the discrepancies of regional adaptability for aquaculture practices were present. Site selection based mainly on hydrodynamic characteristics was considered to be a vital step for the establishment of environmentally friendly aquaculture operations.
The existence of aquaculture infrastructure in Sansha Bay is likely to have an impact on the local hydrodynamic conditions. Field observations have indicated that fish cages in Sansha Bay can reduce the current velocities in the upper layer of the water column by 54% [18]. Numerical simulation results revealed that the drag on the flow field caused by fish cages can extend as deep as 20 m in the relatively deep channels of Sansha Bay. Cage aquaculture weakens the local flow while strengthening the flow in the vicinity of the cages. Additionally, reducing the frictional drag in channels can significantly increase the water exchange rate [19]. In this study, the impacts induced by fish cages were considered through parameter debugging. For instance, the roughness of the bottom surface was specifically adjusted to conform to the actual conditions. The field observations, upon which the verification of the model were executed, were conducted in actual fish farm waters. The close agreement between the modeling results and the field observations (Figure 3a–d, Table 4) suggested that the current simulation results were close to the actual hydrographic conditions in Sansha Bay. A large number of numerical simulating method have been utilized worldwide in recent years [20]. It can be anticipated that detailed simulations of the impacts of aquaculture facilities on local hydrographic conditions could be accomplished in future studies.

4.3. Horizontal Dispersion Distance and Settling Time of AOM in Sansha Bay

In this study, the horizontal dispersion distances of AOM in Sansha Bay were revealed for the first time based on numerical simulations. The results overall agreed with those of previous studies. The sedimentation characteristics of AOM in Sansha Bay were investigated through in situ experimental studies, which revealed spatial variations in deposition rates across five stations along a transect line. The findings indicated that the dispersal range of AOM in the vicinity of aquaculture cages was ~100 m [6]. The dispersion distances of AOM in Sansha Bay obtained from the numerical simulations in this study ranged from 3.8 m (residual feed under low water during the neap tide) to 1805.7 m (feces during the rush moment during the spring tide). The in situ experiment method-based dispersion distances fall within the ranges obtained by the numerical simulations in this study.
Modeling methods provided more detailed results than those of in situ experiments. In situ experiments yield discontinuous results because of limited data sources, whereas models provided successive output. The conclusions drawn based on limited data sources may be inaccurate. Modeling was much more efficient in revealing the sedimentation characteristics under varying tidal structures and current velocities; however, models have only been employed to clarify the sedimentation characteristics of AOM in a few fish farms worldwide [8,16]. There was a high demand for the utilization of models to demonstrate the environmental effects of aquacultures. The present study successfully simulated the trajectories of particulate AOM mainly driven by tides and currents; the method may have limitations in areas with strong waves and low tides.
The dispersion distances of residual feed in Sansha Bay were similar to those obtained in previous studies, whereas the distances of feces were significantly larger. The reasons for this difference may be complex. The settling velocity of feces was relatively small (0.007 m s–1) and the settling time ranged from 23.5 to 35.2 min. Therefore, the dispersion distances of the feces should be relatively large. Strong resuspension in Sansha Bay, involving a complex mechanism and complicating the numerical simulation, may lead to an increase in the dispersion distance of AOM. The effect of sediment resuspension on the AOM dispersion must be further studied.

4.4. Main Factors Affecting the AOM Sedimentations in Sansha Bay

The sedimentation characteristics of AOM in Sansha Bay were simulated under varying scenarios to identify the main influencing factors. The maximal horizontal dispersion distances of residual feed and feces were observed during the spring tide (217.1 and 1805.7 m, respectively) which were approximately three times the distances observed during the neap tide (74.2 and 675.6 m, respectively). During the spring tide, the largest dispersion distance of AOM was observed close to the rush moment. In this case, tidal levels and current velocities were considered to be the important factors affecting the sedimentation characteristics of AOM. High tidal levels indicated large water depths and longer settling times. Strong current resulted in large horizontal velocities under a constant water depth. The sedimentation velocities, related to the physiochemical properties of AOM, affected the sedimentation characteristics [21]. Of the two components of AOM, residual feed, which had larger settling velocities than feces, exhibited smaller dispersion distances and settling times in Sansha Bay under each simulation scenario.
In addition to ocean currents, other elements such as wind and seawater stratification have the potential to modulate the movements of AOM in Sansha Bay. The wind-generated forces in the area are considered to be insignificant compared to those driven by currents. Winds can be categorized into alongshore and cross-shore types. Previous research has indicated that circulation in open ocean is mainly driven by alongshore wind, while that caused by cross-shore wind is generally regarded as secondary or negligible [22]. Sansha Bay, which has an east–west orientation, is perpendicular to the East China Sea, implying that cross-shore wind may be the dominant factor in wind-induced impacts. In situ observations demonstrated that tides dominated the water-level fluctuations in Sansha Bay, with the range of raw water levels being six to seven times larger than that of residual (non-tidal) water levels [23]. Taking into account the properties of the simulated objects, previous studies have shown that for those with an aspect ratio (A/W, total cross-sectional area exposed in air/total area submerged in water) of zero, waves can be presumed negligible during the simulating process [24]. The AOM in Sansha Bay originates from submerged fish cages and settles to the seabed within a matter of minutes, suggesting that wind has a minimal effect on the movements of AOM in the area. Field observations indicated that seawater stratification was not widespread in Sansha Bay. In particular, water mixes well during the flood tide [25]; therefore, seawater stratification has not been considered in this study.
The effect of the feeding intensity, which was related to the aquaculture type, on the AOM sedimentation in Sansha Bay was not found in the present research. In this study, the feeding intensities were parameterized as the numbers of released particles. A total of three classes were designated (5000, 10,000, and 15,000) to reflect the feeding intensities. The dispersion distances and movement trajectories output from the Lagrangian particle tracking model under the three different scenarios were similar. The results showed that the AOM sedimentation in Sansha Bay was insignificantly affected by the feeding intensity.

4.5. Environmental Effect of the AOM Deposition in Sansha Bay

Although Sansha Bay offered high aquaculture yields (P. crocea, 165,000 t yr–1), the AOM sedimentation was moderate in the area. Dispersion distance and deposition rate mainly regulated the AOM sedimentation in Sansha Bay. The present result showed that the maximal dispersion distances of residual feed and feces were 217.1 and 1805.7 m, respectively, in Sansha Bay, suggesting that cage farming induced environmental impacts were restricted to limited areas. In a previous study, the sedimentation rates of AOM in Sansha Bay were 27.3 and 13.0 g m−2 d−1 when commercial pellets and trash fishes were used as feed, respectively, which was similar to other aquaculture waters with less yield [6].
In fish farm areas, continuous AOM sedimentation may cause significant environmental effects. Although the clarification of the environmental effects from the AOM sedimentation in Sansha Bay was not the main objective of this research, such effects could be found in previous studies (e.g., [7,12]). Based on previous studies, the effects of cage farming on the sediment of Sansha Bay were minor (e.g., Total Organic Matter: 1.33–10.05 mg g–1; Total Nitrogen: 0.09–0.43 mg g–1; Total Phosphorus: 0.4–0.79 mg g–1; Acid Volatile Sulfide: <0.46 mg g–1) [12]. This indicated that the AOM elimination rate in Sansha Bay must be high. The details of the AOM removal processes in Sansha Bay must be further studied.

5. Conclusions

This research successfully revealed the AOM sedimentation characteristics in Sansha Bay, the largest known cage aquaculture water in the world, using a numerical modeling method. The present results showed that the dispersion distances of feces and residual feed ranged from 45.7 to 1805.7 m and from 3.8 to 217.1 m, respectively, in Sansha Bay, indicating that the AOM dispersions maybe restricted to a small area. Of the two main components of AOM, the distribution distances of feces were approximately nine times larger than those of residual feed. Based on this, the enhancement of feed quality which can consequently reduce the amount of feces were expected to minimize the fish farm impacts. The AOM sedimentation characteristics were related to combined factors. The feeding intensity insignificantly affected the dispersion distance and settling time of AOM in Sansha Bay. In this study, numerical simulating methods consisting of hydrodynamic and Lagrangian particle tracking models were proved to be effective in clarifying AOM dispersion in Sansha Bay. The utilization of methods could be extended to other aquaculture waters by more accurate calibration in different scenarios.

Author Contributions

Conceptualization, J.Z.; methodology, R.Y.; software, Q.H. Huang; validation, J.Z., J.F.; formal analysis, R.Y., S.Y.; investigation, J.F.; writing—original draft preparation, J.F.; writing—review and editing, S.Y.; visualization, R.Y.; supervision, S.Y., J.Z.; project administration, J.Z.; funding acquisition, J.Z. All authors have read and agreed to the published version of the manuscript.

Funding

This research was funded by the National Nature Science Foundation (No. 42006142).

Institutional Review Board Statement

Not applicable.

Data Availability Statement

The original contributions presented in the study are included in the article, further inquiries can be directed to the corresponding author.

Conflicts of Interest

The authors declare no conflicts of interest.

References

  1. Yokoyama, H.; Abo, K.; Ishihi, Y. Quantifying aquaculture-derived organic matter in the sediment in and around a coastal fish farm using stable carbon and nitrogen isotope ratios. Aquaculture 2006, 254, 411–425. [Google Scholar] [CrossRef]
  2. Qi, Z.H.; Shi, R.J.; Yu, Z.H.; Han, T.T.; Li, C.H.; Xu, S.M.; Xu, S.N.; Liang, Q.Y.; Yu, W.; Lin, H.Z.; et al. Nutrient release from fish cage aquaculture and mitigation strategies in Daya Bay, southern China. Mar. Poll. Bull. 2019, 146, 399–407. [Google Scholar] [CrossRef]
  3. Holmer, M.; Marba, N.; Diaz-Almela, E.; Duarte, C.M.; Tsapakis, M.; Danovaro, R. Sedimentation of organic matter from fish farms in oligotrophic Mediterranean assessed through bulk and stable isotope (δ13C and δ15N) analyses. Aquaculture 2007, 262, 268–280. [Google Scholar] [CrossRef]
  4. Zhulay, I.; Reiss, K.; Reiss, H. Effects of aquaculture fallowing on the recovery of macrofauna communities. Mar. Poll. Bull. 2015, 97, 381–390. [Google Scholar] [CrossRef]
  5. Go, Y.S.; Kim, C.S.; Lee, W.C.; Lee, D.H. A stable isotopic approach for quantifying aquaculture-derived organic matter deposition dynamics in the sediment of a coastal fish farm. Mar. Poll. Bull. 2023, 192, 115132. [Google Scholar] [CrossRef] [PubMed]
  6. Huang, W.Q.; Ji, W.W.; Fu, J.; Ma, Z.L.; Zhou, J. Sedimentation characteristics of derived organic compounds in cage culture of large yellow croaker in Sansha Bay. J. Fish. Sci. China. 2020, 27, 709–719. [Google Scholar] [CrossRef]
  7. Doglioli, A.M.; Magaldi, M.G.; Vezzulli, L.; Tucci, S. Development of a numerical model to study the dispersion of wastes coming from a marine fish farm in the Ligurian Sea (western Mediterranean). Aquaculture 2003, 231, 215–235. [Google Scholar] [CrossRef]
  8. Riera, R.; Pérez, Ó.; Cromey, C.; Rodríguez, M.; Ramos, E.; Álvarez, O.; Domínguez, J.; Monterroso, Ó.; Tuya, F. MACAROMOD: A tool to model particulate waste dispersion and benthic impact from offshore sea-cage aquaculture in the Macaronesian region. Ecol. Modell. 2017, 361, 122–134. [Google Scholar] [CrossRef]
  9. Telfer, T.C.; Bostock, J.; Oliver, R.L.; Corner, R.A.; Falconer, L. CAPOT: A flexible rapid assessment model to estimate local deposition of fish cage farm wastes. Mar. Environ. Res. 2022, 182, 105788. [Google Scholar] [CrossRef] [PubMed]
  10. Bureau of Statistics of Ningde city. Statistical Yearbook of Ningde City; Bureau of Statistics of Ningde City: Ningde City, China, 2020. [Google Scholar]
  11. Bureau of Fishery, Ministry of Agriculture. China Fisheries Statistical Yearbook; Bureau of Fishery, Ministry of Agriculture: Beijing City, China, 2020. [Google Scholar]
  12. Ji, W.W.; Yokoyama, H.; Fu, J.; Zhou, J. Effects of intensive fish farming on sediments of a temperate bay characterised by polyculture and strong currents. Aquacult. Rep. 2021, 19, 100579. [Google Scholar] [CrossRef]
  13. Chen, C.; Liu, H.; Beardsley, R.C. An unstructured grid, finite-volume, three-dimensional, primitive equations ocean model: Application to coastal ocean and estuaries. J. Atmos. Oceanic. Technol. 2003, 20, 159–186. [Google Scholar] [CrossRef]
  14. Telfer, T.; Falconer, L.; Kaas, H.; Jackson, D. TAPAS-tools for assessment and planning of aquaculture sustainability-Horizon2020. Impact 2018, 8, 9–11. [Google Scholar] [CrossRef]
  15. Zhao, Y.X.; Zhang, J.H.; Liu, Y.; Sun, K.; Zhang, C.; Wu, W.G.; Teng, F. Numerical assessment of the environmental impacts of deep sea cage culture in the Yellow Sea, China. Sci. Total Environ. 2020, 706, 135752. [Google Scholar] [CrossRef] [PubMed]
  16. Cromey, C.J.; Nickell, T.D.; Black, K.D. DEPOMOD—Modelling the deposition and biological effects of waste solids from marine cage farms. Aquaculture 2002, 214, 211–239. [Google Scholar] [CrossRef]
  17. Lin, H.; Chen, Z.; Hu, J.; Cucco, A.; Zhu, J.; Sun, Z.; Huang, L. Numerical simulation of the hydrodynamics and water exchange in Sansha Bay. Ocean Eng. 2017, 139, 85–94. [Google Scholar] [CrossRef]
  18. Jiang, X.; Tu, J.; Fan, D. The influence of a suspended cage aquaculture farm on the hydrodynamic environment in a semienclosed Bay, SE China. Front. Mar. Sci. 2022, 8, 779866. [Google Scholar] [CrossRef]
  19. Lin, H.Y.; Chen, Z.Z.; Hu, J.Y.; Cucco, A.; Sun, Z.Y.; Chen, X.R.; Huang, L.F. Impact of cage aquaculture on water exchange in Sansha Bay. Cont. Shelf Res. 2019, 188, 103963. [Google Scholar] [CrossRef]
  20. Wang, X.Y.; Cuthbertson, A.; Gualtieri, C.; Shao, D.D. A Review on Mariculture Effluent: Characterization and Management Tools. Water 2020, 12, 2991. [Google Scholar] [CrossRef]
  21. Chen, Y.S.; Beveridge, M.; Telfer, T.C. Physical characteristics of commercial pelleted Atlantic salmon feeds and consideration of implications for modeling of waste dispersion through sedimentation. Aquacult. Int. 1999, 7, 89–100. [Google Scholar] [CrossRef]
  22. Csanady, G.T. Circulation in the Coastal Ocean; Springer: Dordrecht, The Netherlands, 1982. [Google Scholar]
  23. Lin, H.Y.; Hu, J.Y.; Zhu, J.; Cheng, P.; Chen, Z.Z.; Sun, Z.Y.; Chen, D.W. Tide- and wind-driven variability of water level in Sansha Bay, Fujian, China. Front. Earth Sci. 2016, 11, 332–346. [Google Scholar] [CrossRef]
  24. Suara, K.; Khanarmuei, M.; Ghosh, A.; Yu, Y.Y.; Zhang, H.; Soomere, T.; Brown, R.J. Material and debris transport patterns in Moreton Bay, Australia: The influence of Lagrangian coherent structures. Sci. Total Environ. 2020, 721, 137715. [Google Scholar] [CrossRef] [PubMed]
  25. Qi, Y.K.; Tu, J.B.; Yu, J.J.; Fan, D.D. Hydrodynamic processes of the bottom boundary layer and suspended sediment transport in the Sansha Bay in summer. Mar. Sci. 2021, 45, 1–12. [Google Scholar] [CrossRef]
Figure 1. Locations of the four field monitoring stations at which the hydrodynamic characteristics were analyzed (a) and experimental cage unit (b). St. 1: Baima Station; St. 2: Chengao Station; St. 3: Dongchong Station; St. 4: Qingyu Station; asterisk: experimental cage unit.
Fishes 10 00483 g001
Figure 2. Grid pattern of the study region. (a) The whole area; (b) the areas around the experimental cage, with the highest grid resolution and darker colors.
Fishes 10 00483 g002
Figure 3. Verification of simulated (lines) and observed tide levels (points) at the Baima (a), Chengao (b), Dongchong (c), and Qingyu (d) stations.
Fishes 10 00483 g003
Figure 4. Current characteristics of surface water during the rush moment (a), ebb moment (b), high water (c), and low water (d) during the spring tide in Sansha Bay.
Fishes 10 00483 g004
Figure 5. Verification of simulated current velocities (lines) using field monitoring data (points) at 0.2 H (a), 0.6 H (b), and 0.8 H (c) on Qingshan Island.
Fishes 10 00483 g005
Figure 6. Movement trajectories of feces during the spring tide (a) and neap tide (b) and those of the residual feed during the spring tide (c) and neap tide (d).
Fishes 10 00483 g006
Figure 7. Movement trajectories of feces during the rush moment (a) and ebb moment (b) and those of the residual feed during the rush moment (c) and ebb moment (d) under varying numbers of released particles. The solid lines in the figure represented the moving centers of the masses of the feces and residual feed.
Fishes 10 00483 g007
Figure 8. Spatial distribution characteristics of the feces during the spring (a) and neap tides (b) and those of the residual feed during the spring (c) and neap tides (d). Different colors represented the trajectories of the feces and residual feed at different times.
Fishes 10 00483 g008
Table 1. Parameters of the hydrodynamic model.
Parameter NameParameter Setting
Number of grid nodes25,792
Number of grid cells48,646
Minimal grid mesh25 m
Time stepOuter membrane: 1 s, inner membrane: 5 s
Total simulation time35 days
Bottom friction coefficient0.001
Vertical layers6
Table 2. Parameters of the Lagrangian particle tracking model.
ParameterParameter Setting
Horizontal dispersion coefficient0.01 m2 s–1
Vertical dispersion coefficient0.001 m2 s–1
Time stepOuter membrane: 300 s, inner membrane: 60 s
Settling velocity of feces0.007 m s–1
Settling velocity of residual feed0.07 m s–1
Number of released particles5000, 10,000, 15,000
Table 3. Discrepancies between the amplitude and phase lag between the simulated results and field monitoring data for the four main components of the tides in Sansha Bay (M2, S2, K1, and O1) based on harmonic analysis.
SiteLongitude (°E)Latitude (°N)M2S2K1O1
Δ H ( c m ) Δ g ( ) Δ H ( c m ) Δ g ( ) Δ H ( c m ) Δ g ( ) Δ H ( c m ) Δ g ( )
Baima119.7326.730.41–2.57–4.32–2.08–0.173.100.35–1.18
Chengao119.7326.62–1.25–0.88–3.07–0.36–0.173.570.34–0.41
Dongchong119.8326.553.30–0.131.920.220.254.090.190.69
Qingyu119.7226.361.742.572.223.780.333.260.060.76
Mean absolute error————1.681.542.881.610.923.510.240.76
Table 4. Mean absolute errors of the current velocities and current directions between measured and simulated data.
LayersCurrent Velocities (m s–1)Current Direction (°)
0.2 H0.1529.88
0.6 H0.1039.52
0.8 H0.09810.42
Table 5. Dispersion distance of feces and residual feed in varied simulating scenarios. A total of 28 various scenarios were simulated, of which the first 24 scenarios were 24 h a day and the last 4 scenarios were special physical moments.
ScenariosFeces (m)Residual Feed (m)
Neap TideSpring TideNeap TideSpring Tide
01:00498.31126.547.1118.8
02:00391.71635.936.8188.4
03:00208.81805.723.0217.1
04:0070.51493.84.6189.1
05:00357.5626.331.5104.3
06:00549.9736.052.444.5
07:00634.01635.466.7120.3
08:00675.61326.374.2117.4
09:00631.8916.771.482.9
10:00426.5618.452.062.7
11:00101.8190.215.826.0
12:00346.1477.428.139.9
13:00526.6952.148.896.8
14:00532.51314.352.9142.9
15:00424.11589.242.3186.1
16:00229.11355.624.5167.6
17:0045.7635.53.895.8
18:00323.2579.026.932.8
19:00501.31451.449.2108.7
20:00552.51325.659.7116.3
21:00500.8945.755.284.7
22:00335.8694.640.267.0
23:0052.7328.59.538.5
24:00382.2280.030.920.9
High water101.8626.615.8104.3
Low water45.7190.23.826.0
Ebb moment532.51326.352.9117.4
Rush moment552.51589.259.7186.1
Table 6. Horizontal dispersion distances and settling times of feces and residual feed for three different numbers of released particles.
Particle TypeTidal StencilsFeeding MomentsHorizontal Dispersion Distance (m)Settling Time (min)
500010,00015,000500010,00015,000
FecesSpring tideHigh water626.6625.4625.335.235.135.2
Ebb moment1326.31321.51320.634.634.434.4
Low water190.2189.9189.519.619.519.4
Rush moment1589.21584.91583.129.629.529.5
Neap tideHigh water101.8101.5101.330.730.630.6
Ebb moment532.5530.0529.928.628.528.5
Low water45.745.545.623.523.423.4
Rush moment552.5551.0550.226.526.426.4
Residual feedSpring tideHigh water104.3104.3104.24.04.04.0
Ebb moment117.4117.4117.43.03.03.0
Low water26.026.126.02.02.02.0
Rush moment186.1186.1186.03.13.13.1
Neap tideHigh water15.815.815.83.63.63.6
Ebb moment52.952.952.93.03.03.0
Low water3.83.83.73.03.03.0
Rush moment59.759.659.63.03.03.0
Disclaimer/Publisher’s Note: The statements, opinions and data contained in all publications are solely those of the individual author(s) and contributor(s) and not of MDPI and/or the editor(s). MDPI and/or the editor(s) disclaim responsibility for any injury to people or property resulting from any ideas, methods, instructions or products referred to in the content.