Article

Estimating Whale Shark, Rhincodon typus, Length Using Multi-Stereo-Image Measurement

1
Department of Fisheries, Graduate School of Agriculture, Kindai University, 3327-204 Nakamachi, Nara 631-8505, Nara, Japan
2
Department of Natural Environmental Studies, Graduate School of Frontier Sciences, University of Tokyo, 5-1-5 Kashiwano-ha, Kashiwa 277-8564, Chiba, Japan
3
Io World Kagoshima City Aquarium, 3-1 Honkoushinmachi, Kagoshima 892-0814, Kagoshima, Japan
4
Okinawa Churaumi Aquarium, 424 Ishikawa, Motobu 905-0206, Okinawa, Japan
5
Department of Fisheries, Faculty of Agriculture, Kindai University, 3327-204 Nakamachi, Nara 631-8505, Nara, Japan
*
Author to whom correspondence should be addressed.
Fishes 2025, 10(10), 513; https://doi.org/10.3390/fishes10100513
Submission received: 29 August 2025 / Revised: 2 October 2025 / Accepted: 3 October 2025 / Published: 10 October 2025

Abstract

The whale shark Rhincodon typus is the largest known extant omnivorous fish species, reaching up to 17 m in length. Because of its slow growth and late maturity, R. typus is particularly vulnerable to human activities and is listed as endangered on the IUCN Red List. Understanding its biological characteristics, such as growth rate, is essential for their conservation. Non-invasive methods, including stereo-image measurements, have been used to measure the body length of the species over the years, which aggregates in coastal areas during specific life stages. This method enables us to estimate fish length by recording the target using a stereo camera, which commonly consists of two cameras. However, measurement errors increase in the setup as the target moves away from the camera. Therefore, we conducted a multi-stereo video shoot of a free-swimming whale shark in an aquarium tank and compared the performance of stereo cameras using two, three, and four cameras. The setups with three and four cameras outperformed the traditional two-camera stereo setup in terms of precision and accuracy, suggesting that a multi-stereo camera system can effectively estimate the body length of large animals such as whale sharks from a considerable distance.
Key Contribution: The body length of the whale shark was estimated more accurately and precisely using multi-stereo image measurements. Therefore, this method is suitable for measuring large marine megafauna in the wild.

1. Introduction

The whale shark Rhincodon typus, the world’s largest omnivore [1] with a maximum length of 17 m [2], is primarily distributed in the tropical and temperate oceans between 30° N and 35° S [3]. Although marine megafauna, such as whale sharks, spend most of their lives in the open ocean [4,5], they temporarily form aggregates in coastal surface waters during specific life stages [6]. Therefore, researchers can take advantage of the accessibility of these aggregations to gather demographic information, such as individual identity, population size, and body length [1,7,8]. Owing to their slow growth and late maturity [9], large marine species are particularly vulnerable to human activities and growing concerns are being raised about the status of their populations [10,11]. The population of R. typus is particularly threatened by illegal fishing [12,13], vessel strikes, pollution [14], and bycatch [15]. Consequently, the species has been classified as endangered (Category IB) on the IUCN Red List [16]. Even though many countries have prohibited targeted fisheries, multiple sources of evidence indicate that whale shark populations continue to decline [17,18]. Limited biological and ecological knowledge of this species hinders a comprehensive understanding of its population health and size despite the importance of its conservation [19]. Studies on their growth and reproductive ecology are particularly limited [20]. A major obstacle to conserving whale sharks is the limited knowledge of key life-history traits, including age and growth rates [21]. In addition, precise measurements of body length are crucial for evaluating biological parameters and addressing fundamental ecological questions in both including growth rates, biomass, and overall body size. Due to the importance of their conservation, studies on the age and growth of wild whale sharks have been conducted using vertebral growth rings and body length of dead individuals [22]. However, due to the limited number of samples and the difficulty of age determination, it is desirable to estimate growth parameters from free-swimming individuals. In particular, measuring the body length of the same individuals over multiple years is essential. This approach is feasible for whale sharks due to their unique spot and stripe patterns [23]. For large organisms such as whale sharks and marine mammals, it is extremely difficult to restrict their movement, making it essential to measure body length accurately in a non-invasive manner. For example, at Ningaloo Reef in Western Australia, juvenile whale sharks of 3–7 m in total length form seasonal aggregations each year, allowing long-term monitoring of their body size [7,8]. To date, methods such as visual estimation, laser photogrammetry, and stereo-image measurement have been used to assess the body length of free-swimming whale sharks. A simple approach is to estimate body length by comparing it with an object of known size [24,25]. However, underwater visual estimation is prone to bias and often contains substantial error, even when performed by experienced observers. In fact, visual estimation tends to underestimate the body length of whale sharks as their size increases [8]. Instead, researchers have begun using laser photogrammetry and stereo-imaging techniques to estimate body length of marine megafauna. Stereo-image measurement reduces the errors associated with visual estimation and enables more accurate length measurements [8,26,27].
Stereo image measurement is a method that estimates three-dimensional spatial coordinates of points in real space by applying the principle of triangulation to images captured by multiple cameras. This technique enables the underwater non-invasive measurement of fish body length [28]. For example, it has been applied to measure the body length of free-swimming Pacific bluefin tuna, Thunnus orientalis, in aquaculture cages [29,30] and the Mekong giant catfish, Pangasianodon gigas, swimming freely in tanks [31]. Two-camera setups are commonly used for stereo-image measurement; however, measurement errors increase as the distance to the target increases when the distance between the cameras is short [29,32]. For large marine organisms, such as whale sharks and marine mammals, capturing the entire body within the camera frame requires maintaining a greater distance from the target, making it essential to address this issue. Potential solutions include increasing the parallax between cameras or aligning the optical axes orthogonally [33,34,35], although these are often impractical due to the size of stereo camera in field settings. Multi-camera systems have been proposed to mitigate accuracy loss [36]. By increasing the number of cameras, it becomes possible to obtain accurate measurements without making the system excessively large. In this study, we validated the effectiveness of using multi-stereo camera systems by estimating the body length of captive whale sharks and comparing the results with those of direct measurements obtained using a measuring tape.

2. Materials and Methods

2.1. Specimen and Rearing Conditions

We recorded a whale shark reared in a water tank (13 × 25 m, 5 m deep) at Kagoshima City Aquarium on 7 September 2022. The whale shark was incidentally caught in a set net off the coast of Kagoshima, Japan. At this aquarium, whale sharks are released back into the wild before reaching a total length of 5.5 m due to the tank size limitations. Body length measurements were conducted every four months by multiple trained keepers using a measuring tape to monitor growth rates. Prior to this study, body length measurements were performed using this method on 5 September 2022.
This study was conducted as part of captive animal health monitoring at the Kagoshima City Aquarium. This study was specifically approved by Kindai University Committee on Animal Research and Bioethics (Permit Number: KAAG-2021-002). The maintenance, animal handling, and all procedures associated with this study were conducted in accordance with the ethical guidelines of the Kagoshima City Aquarium and Kindai University.

2.2. Stereo-Video Recording

To construct the multi-stereo camera system, four GoPro HERO9 cameras (GoPro Inc., San Mateo, CA, USA) were mounted on a single metal frame (Figure 1). At this time, the cameras were mounted slightly inward so that most of all fields of view overlapped. A multi-stereo camera was set in the tank using ropes to ensure that the water surface and the bottom of the tank were within the field of view. Using this setup, we recorded a free-swimming whale shark for approximately 1 h (Figure 1). The cameras were set to a wide field of view with a resolution of 1920 × 1080 pixels and a frame rate of 30 fps. Before recording the target, a robust 3D cubic frame with known dimensions (120 cm per side) was recorded for calibration.
The spatial coordinates in real space were reconstructed using images captured from different angles to obtain three-dimensional spatial coordinates from the video. In this process, the spatial and image positions were related to internal and external camera parameters. These parameters were determined by the focal length, installation position, and camera orientation. The camera was calibrated using the Direct Linear Transformation (DLT) method [37]. The parameters were estimated using spatial points with known 3D coordinates and their corresponding projected points on the images. The DLT method allows high-precision and accurate measurements by calibrating the camera using a 3D cubic frame with reference calibration points distributed across it.
Before recording, the camera was calibrated using a 3D cubic frame (approximately 120 cm per side). The following equations incorporating the DLT parameters determined through the least-squares method enabled us to compute the 3D spatial coordinates of the points in the images.
u = L 1 X + L 2 Y + L 3 Z + L 4 L 9 X + L 10 Y + L 11 Z + 1
v = L 5 X + L 6 Y + L 7 Z + L 8 L 9 X + L 10 Y + L 11 Z + 1
where u and v represent the x and y coordinates of a point in the 2D coordinate system, and X, Y, and Z represent the corresponding positions in the 3D coordinate system. The parameters L1L11 denote the DLT parameters for each camera.
Eight calibration points were distributed at the corners of a 3D cubic frame and captured underwater for calibration. The 3D spatial coordinates of each calibration point were measured using a measuring tape and treated as true positions. Camera calibration was performed using Move-tr/3D image analysis software (Library Co., Tokyo, Japan, https://www.library-inc.co.jp/product/?id=1372147489-429207&ca=1 accessed on 28 August 2025) by manually detecting the coordinates of the calibration points in the images. For calibration procedures and recording the whale shark, the flashing of a light was recorded before and after the session to synchronize all cameras.

2.3. Video Analysis

Before recording the target, a 3D cubic frame (120 cm per side) was recorded, and image calibration was performed using the DLT method with two, three, and four cameras. The footage from all cameras was synchronized by trimming the videos at the moment the light switched on before recording the 3D frame. Then, we converted into sequential images and selected the images in which all eight reference points were captured by all cameras for image calibration. Subsequently, scenes in which the whale shark was captured by all the cameras and its caudal fin was aligned along the body axis were selected (n = 20), and 20 sequential frames from each scene were detected. From these images, we obtained the 3D coordinates of the snout and fork of the caudal fin using Move-tr/3D image analysis software (Library Co.) and estimated the fork length. The estimated fork lengths from the 20 frames were averaged to obtain the estimated values for each scene. We analyzed the same scenes using two, three, and four cameras and evaluated the accuracy and precision of the estimated values. Precision was assessed by calculating the error ratio (standard error/mean), whereas accuracy was evaluated using the Mean Absolute Percentage Error (MAPE), calculated using the following formula:
M A P E ( % ) = 100 n i = 1 n y ^ i y i y i
where y ^ i is the estimated value of the stereo-image measurements and y i is the fork length measured using a measuring tape.

2.4. Statistical Analysis

Statistical analyses were performed using R ver 4.3.1 (R Core Team). The Shapiro–Wilk test was used to verify the normality of the data, and Bartlett’s test was used to verify the homoscedasticity of the data. The fork lengths of the whale shark estimated using different numbers of cameras were compared using paired t-tests, with p-values adjusted using Bonferroni correction. The Pearson’s correlation coefficient was calculated to examine the relationships between the distance from the camera to the target and the error ratio and MAPE. Additionally, a two-way analysis of variance (ANOVA) was conducted to test for interactions between distance and error ratio or MAPE. If no interaction was detected, the Wilcoxon signed-rank sum test was used to compare the results based on the number of cameras, with Bonferroni correction applied to the p-values. The significance level was set at 5% for all analyses.

3. Results

3.1. Stereo-Video Image Calibration

The 3D spatial coordinates were estimated based on the calibration derived from eight reference points of the 3D cubic frame captured from different angles. The mean error and standard deviation between the known 3D coordinates and the estimated 3D coordinates of the eight reference points were 0.77 cm (<1%) ± 0.38 cm (two cameras), 0.69 cm (<1%) ± 0.26 cm (three cameras), 0.74 cm (<1%) ± 0.21 cm (four cameras), respectively (Figure 2).

3.2. Whale Shark Length Estimation

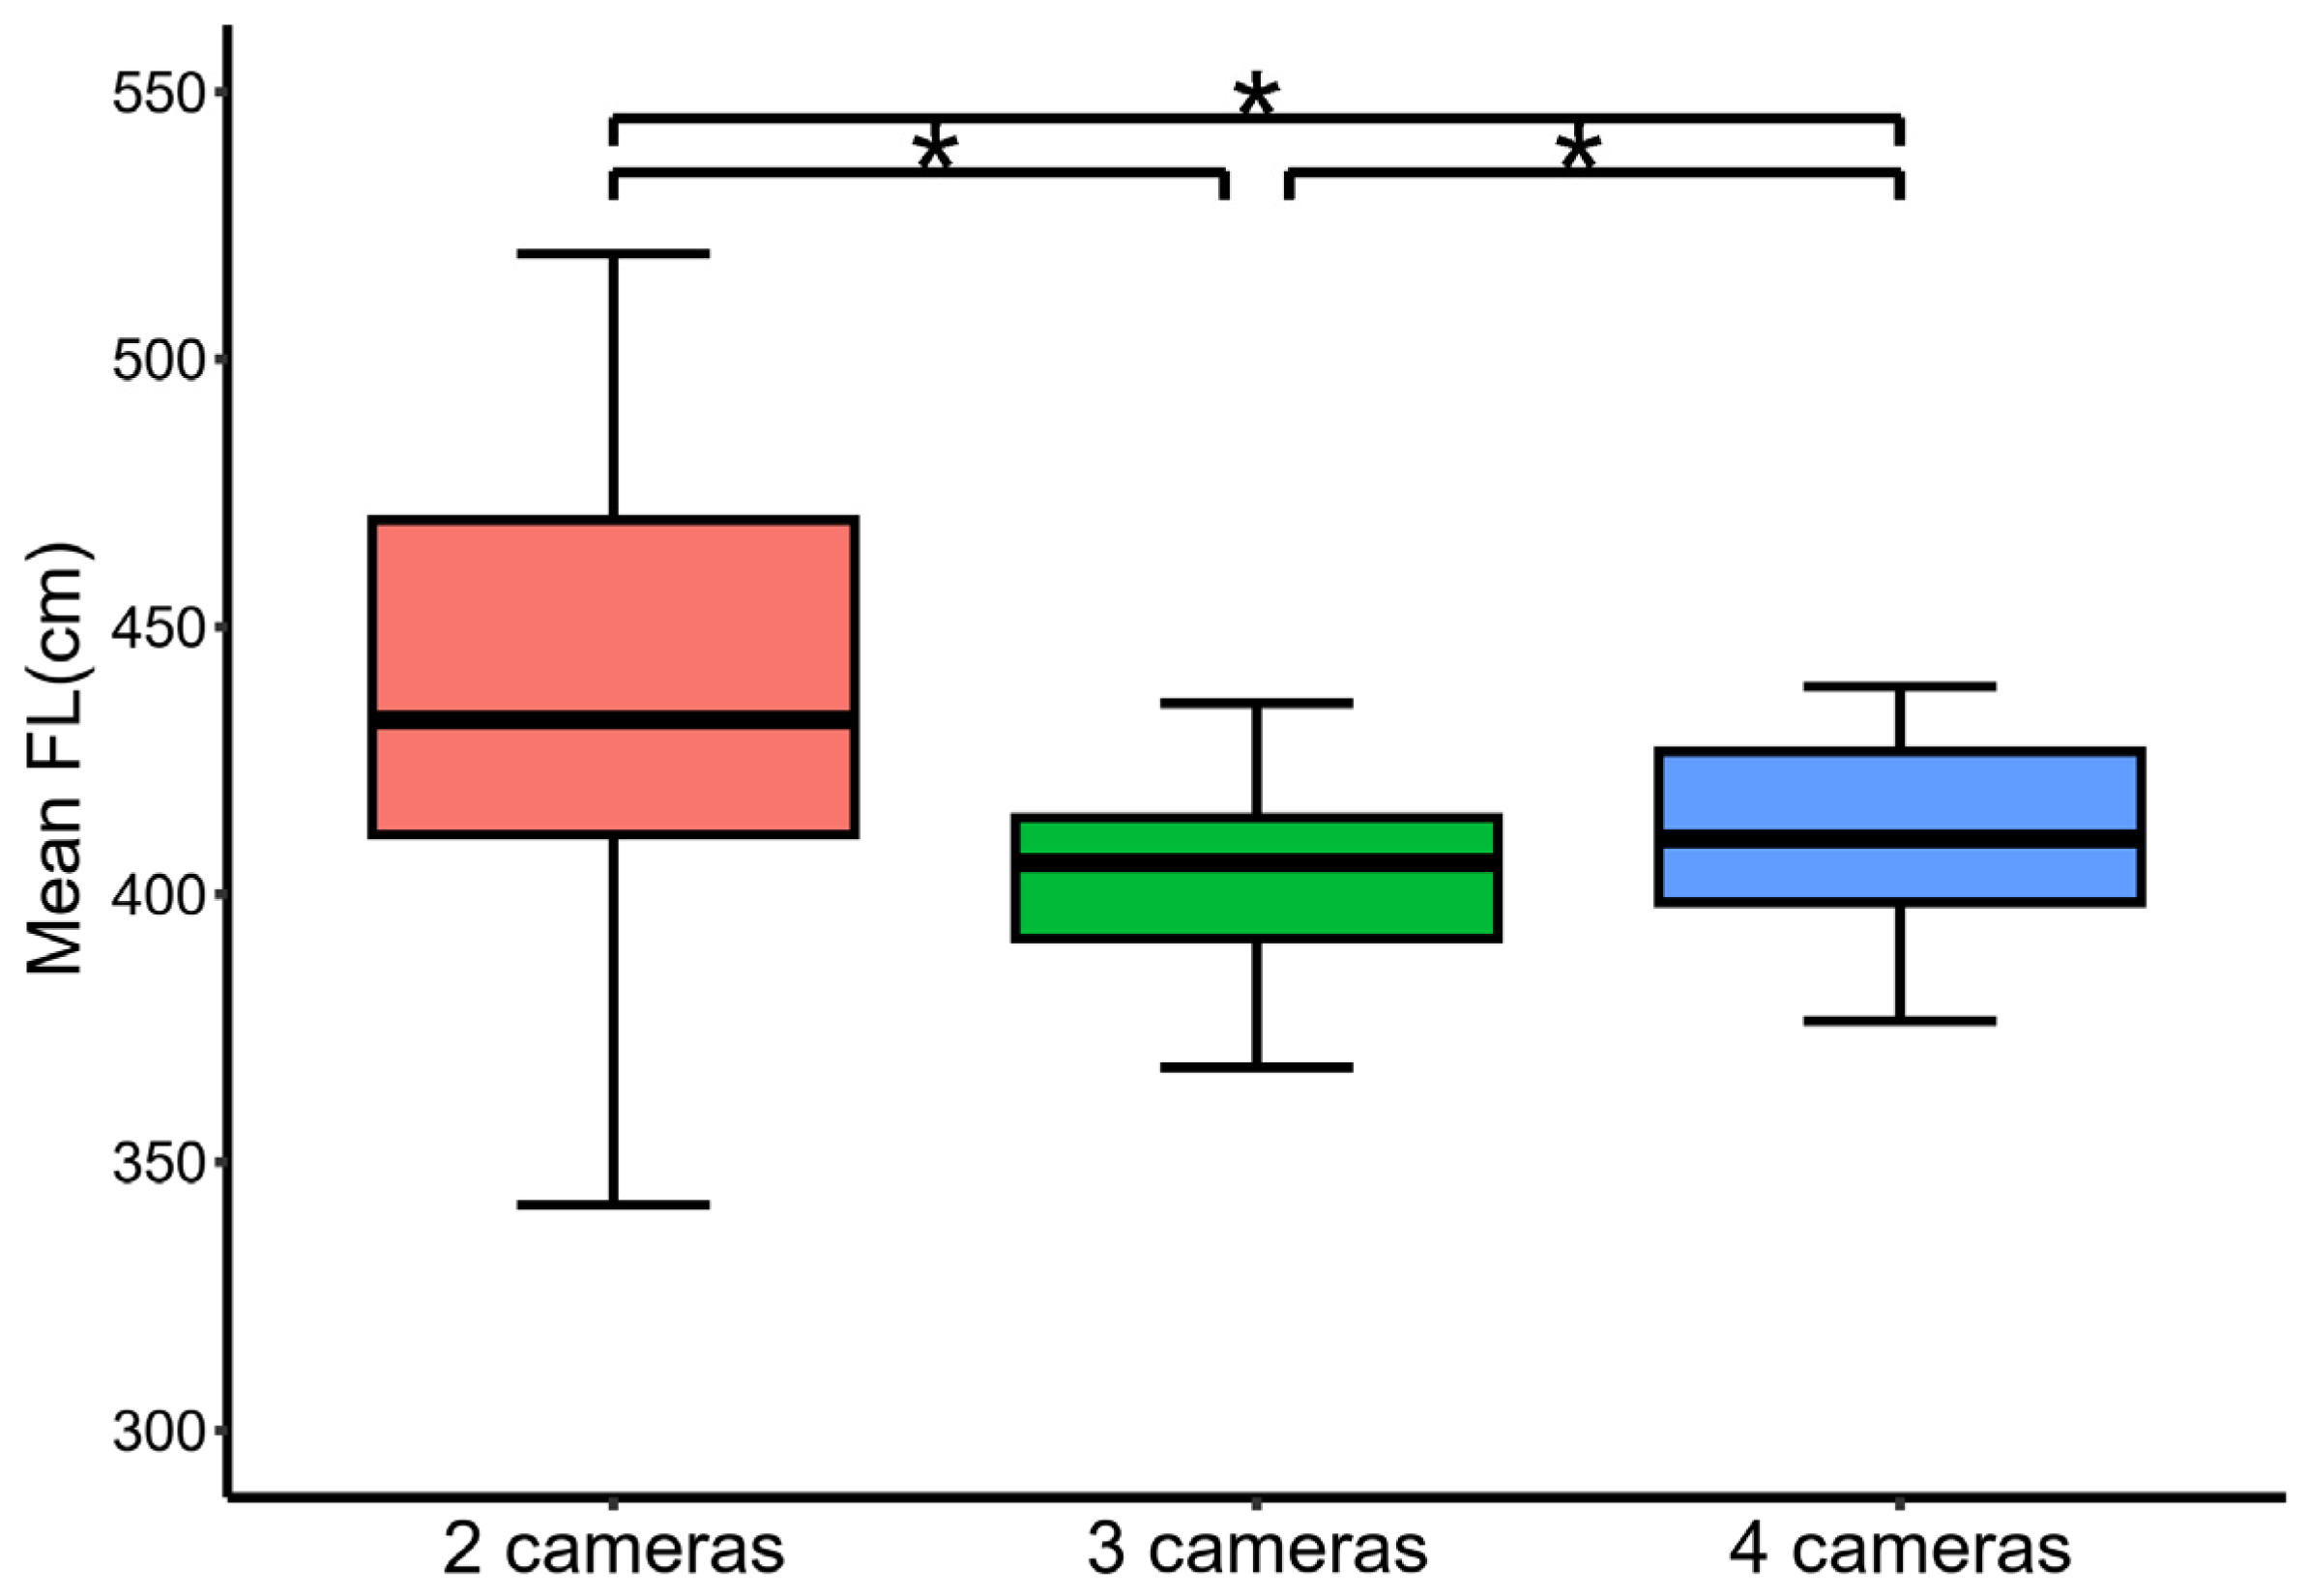
The mean fork length of the whale shark estimated from the extracted scenes (n = 20) differed significantly across the different numbers of cameras (Figure 2; two vs. three cameras: t = 4.5, df = 19, p = 0.00066, two vs. four cameras: t = 3.5, df = 19, p = 0.0077, three vs. four cameras: t = −4.8, df = 19, p = 0.00035). The fork length of whale shark which was measured by trained aquarium keepers with a measuring tape was 379 cm. On the other hand, the estimated mean fork lengths for two, three, and four cameras were 437 ± 46 cm (maximum: 520 cm, minimum: 342 cm), 402 ± 17 cm (maximum: 436 cm, minimum: 368 cm), 411 ± 18 cm (maximum: 439 cm, minimum: 376 cm), respectively. However, because this study used a method in which stereo camera was moored, most of the scenes suitable for analysis, where the whale shark’s body was straight, were recorded at distances greater than 10 m from the cameras (15 out of 20 scenes). As a result, the estimated lengths tended to be larger than the measurements obtained with a tape measure.

3.3. The Precision of Stereo-Image Measurements

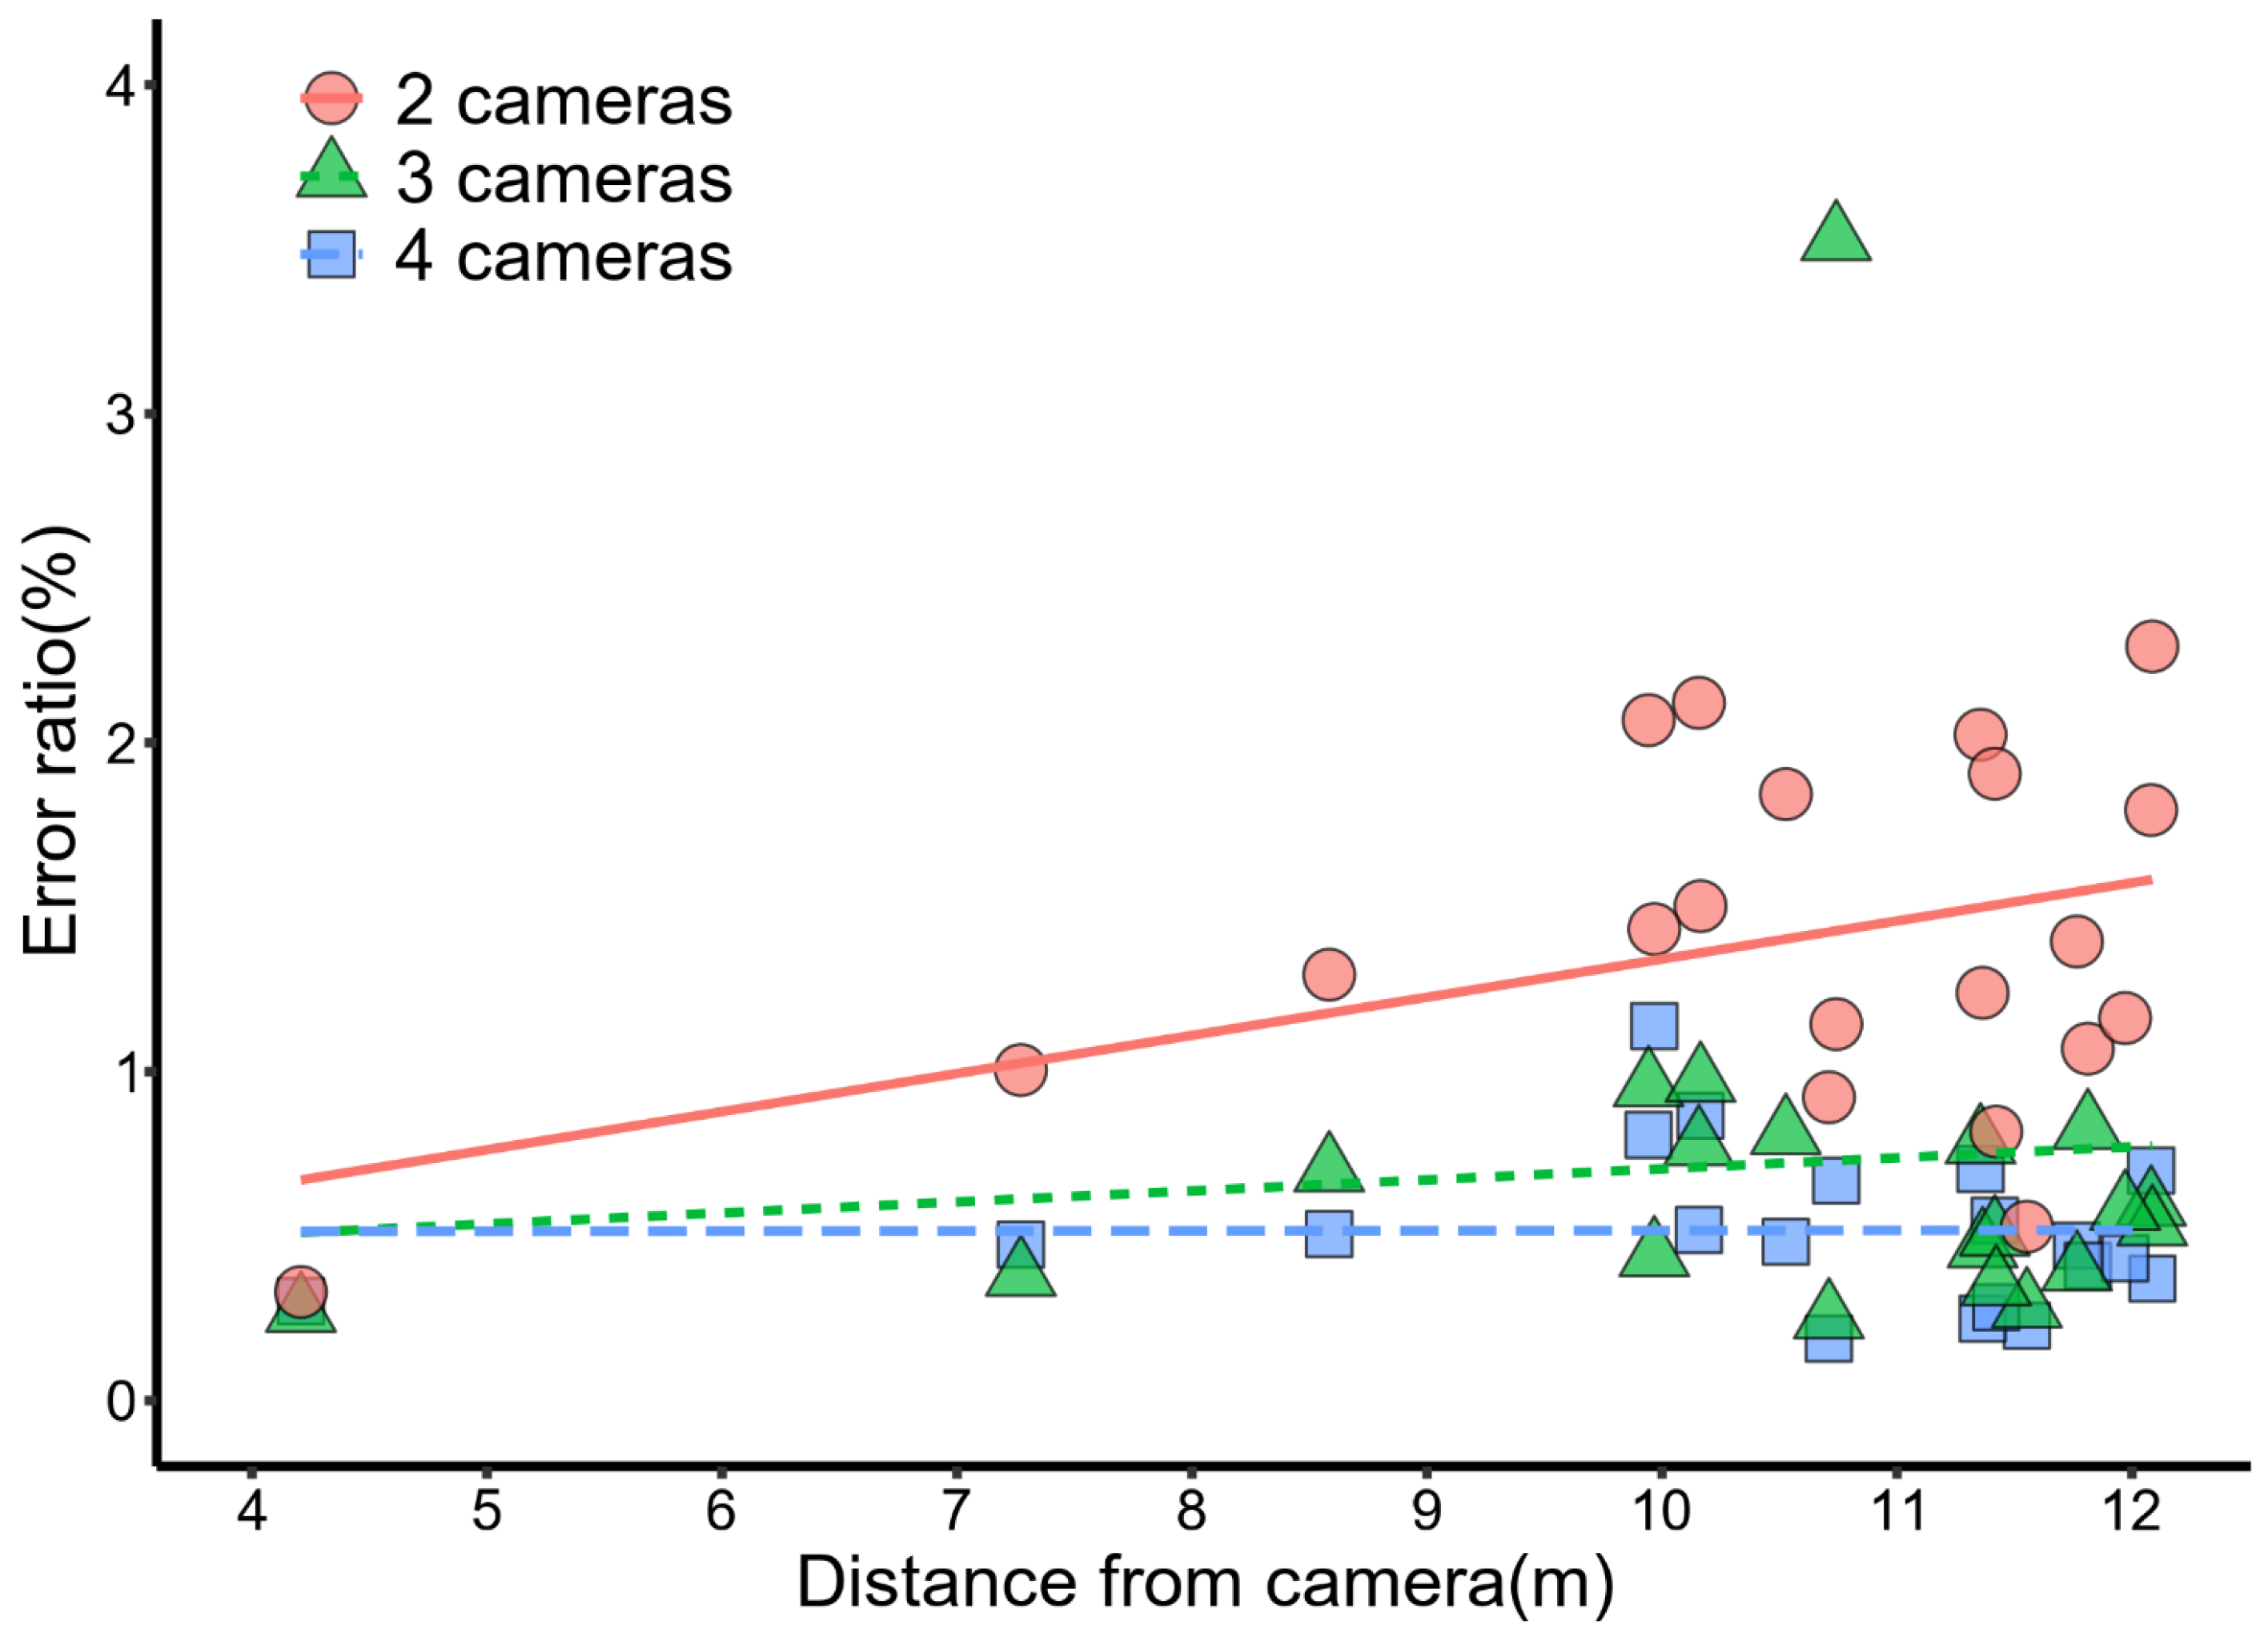
No correlation was observed between the distance from the camera to the target and the error ratio for any number of cameras (Figure 3 and Table 1; two cameras: t = 1.9, df = 18, p = 0.076, r = 0.41; three cameras: t = 0.39, df = 18, p = 0.70, r = 0.092; four cameras: t = 0.017, df = 18, p = 0.99, r = 0.0040). However, the slope of the regression line between the distance from the camera to the target and the error ratio was the smallest when four cameras were used (Table 1; two cameras: y = 0.12x + 0.18, three cameras: y = 0.034x + 0.37, four cameras: y = 0.00050x + 0.51). No interaction was observed between the number of cameras and distance from the camera to the target (p = 0.36). Although the error ratio significantly differed by the number of cameras (two vs. three cameras: V = 190, p = 0.0021, two vs. four cameras: V = 210, p = 5.7 × 10⁻⁶, three vs. four cameras: V = 210, p = 5.7 × 10⁻⁶), the error ratio was ˂ 4% for all camera configurations (Figure 3).

3.4. The Accuracy of Stereo-Image Measurements

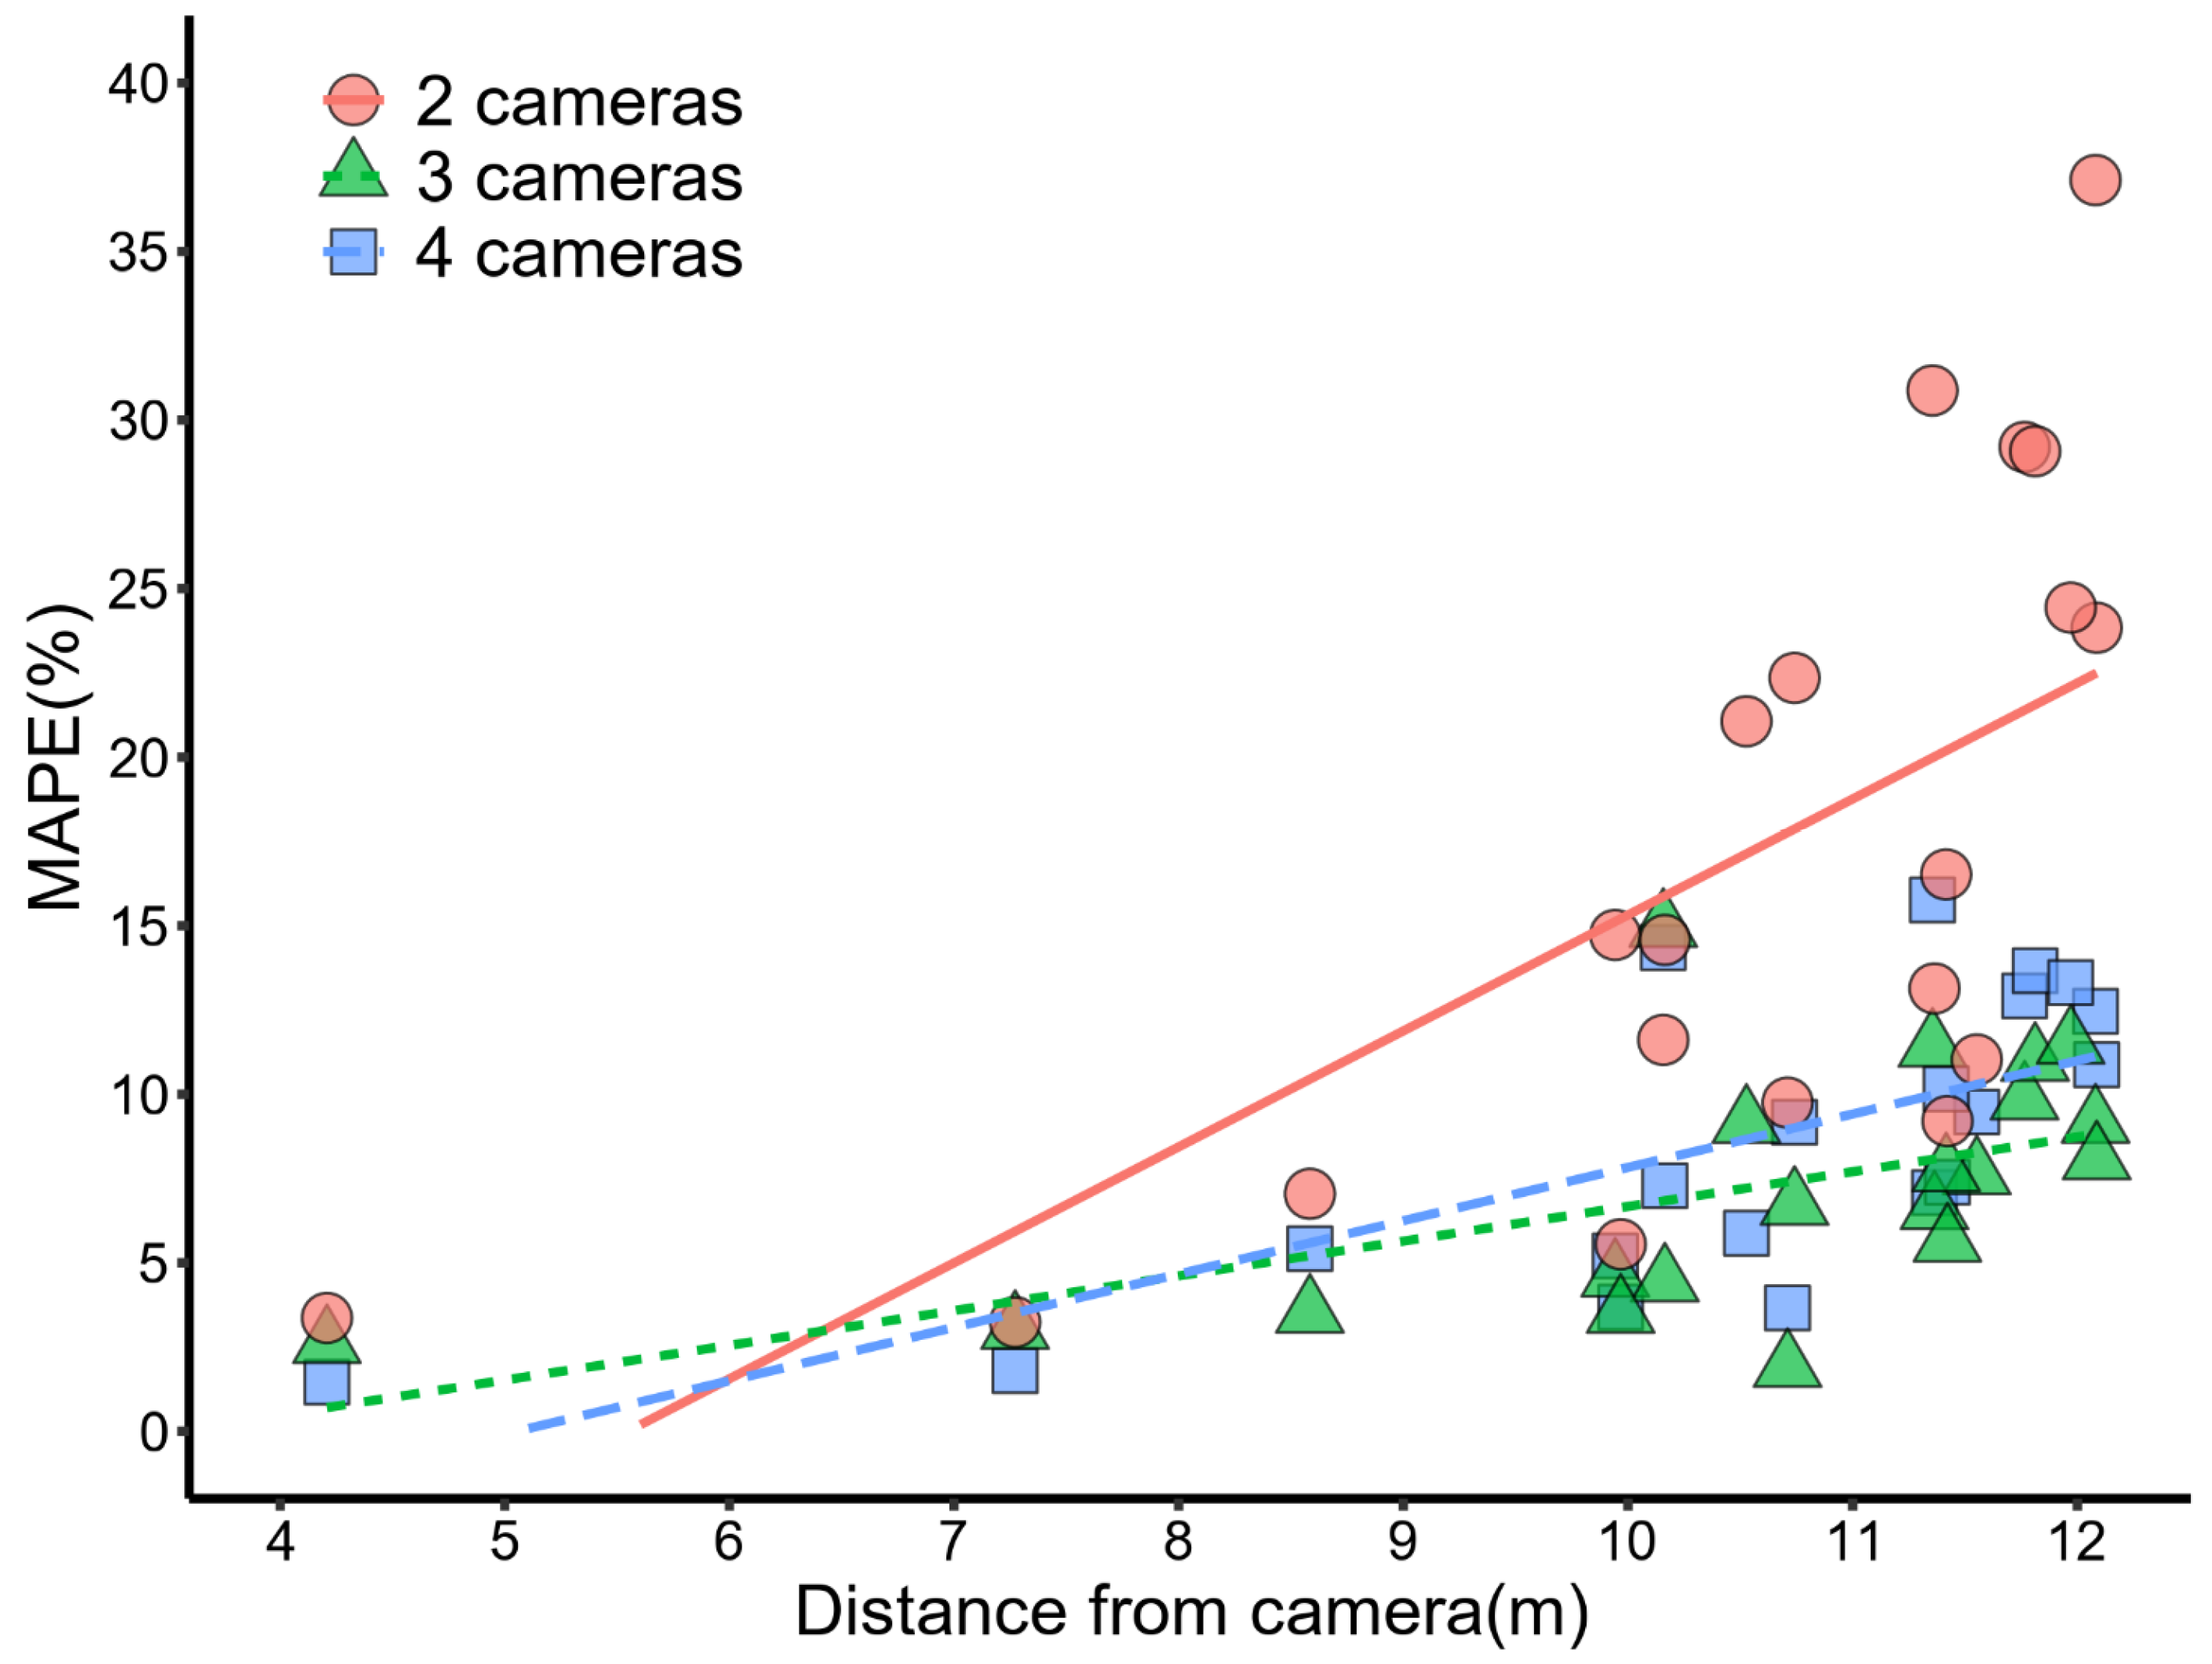
A positive correlation was observed between the distance from the camera to the target and the MAPE for all camera configurations (Figure 4 and Table 1; two cameras: t = 3.8, df = 18, p = 0.0013, r = 0.67; three cameras: t = 2.8, df = 18, p = 0.011, r = 0.56; four cameras: t = 4.2, df = 18, p = 0.00060, r = 0.70). Although, the MAPE obtained from conventional two-camera setups increased sharply when whale shark moved away from the stereo camera. The slope of the regression line between the distance from the camera to the target and the MAPE was smallest with three cameras (Table 1; two cameras: y = 3.4x − 19, three cameras: y = 1.0x − 3.6, four cameras: y = 1.6x − 8.0). However, the MAPE obtained with four cameras was lower than that with three cameras until the distance from the camera was approximately 8 m. The MAPE with two cameras ranged from a minimum of 3.2% (equivalent to 12.1 cm) to a maximum of 37.1% (equivalent to 140.6 cm). The MAPE with three cameras ranged from a minimum of 1.9% (equivalent to 7.2 cm) to a maximum of 15.0% (equivalent to 56.9 cm). The MAPE with four cameras ranged from a minimum of 1.5% (equivalent to 5.7 cm) to a maximum of 15.8% (equivalent to 59.9 cm). Significant effects were observed in the distance from the camera to the target (p = 0.00052), the number of cameras (p = 1.0 × 10⁻⁹), and their interaction (p = 0.0016).

4. Discussion

In image calibration using two, three, and four cameras, the mean error between the known 3D coordinates and estimated 3D coordinates of the eight calibration points was ˂1%. Because this is below the 5% threshold commonly accepted in previous studies [29,30,31], the validity of the calibration can be considered satisfactory.
The estimated mean fork length was significantly different for all camera setups. However, the variability in the estimated mean fork length was smaller when using three or four cameras than when using the two-camera setup (standard deviation: two cameras = 46 cm, three cameras = 17 cm, and four cameras = 18 cm). The increase in the error rate with longer distances from the cameras was significantly greater with two cameras than with three or four cameras (Figure 3). This is likely owing to the increasing number of epipolar lines with additional cameras, which constrained the estimation of the position of the target. In other words, the increase in image pairs likely reduced errors caused by misidentifying corresponding points (the snout and caudal fork of the whale shark) across images from different cameras.
As the number of cameras increased, the increase in error rate with increasing distance from the target was mitigated (Figure 3). However, it remained under 4%, even at the highest error rate. Precision was not problematic for any camera setup because this was below the 5% threshold commonly used as a standard in previous studies.
Regarding accuracy, the MAPE significantly increased as the distance to the target increased for all camera setups (Figure 4). This is likely due to the accumulation of estimation errors as the target moves farther away. However, unlike previous studies [36], the increase in MAPE with distance was most effectively suppressed with the three cameras (Figure 4). The higher rate of increase in MAPE with four cameras compared to three cameras might be attributed to misalignments between the actual 3D positions and detected positions during image calibration. Additionally, when detecting the 3D positions of the whale shark snout and caudal fin, factors such as turbidity and lighting conditions may have led to corresponding point errors in some cameras. The corresponding point errors occur when correctly matched points on the camera images are incorrectly identified. However, this issue may have arisen from the recording method used in this study. Since the multi-stereo camera system was fixed in the tank with ropes and only scenes where whale sharks happened to be recorded were analyzed, capturing footage from appropriate angles by experienced diver might resolve this problem. For distances of up to approximately 8 m, the MAPE from four cameras was smaller than that from two or three cameras (Figure 4). This indicates that the turbidity and lighting effects become more pronounced as the target moves farther away, leading to corresponding point errors in some cameras. However, increasing the number of cameras reduces the impact of misalignment between the actual and detected points on images. This requires further verification in future studies. In the scenes analyzed in this study, the shortest distance to the subject (whale shark) was 421 cm, and at that distance, the MAPE remained below 5% regardless of the number of cameras used. If the entire body of the whale shark can be captured at this distance, then the conventional stereo camera setup with two lenses would likely be sufficient. However, since the individuals recorded in this study were relatively small (379 cm measured by trained keepers with a measuring tape), estimating the body length of larger individuals approaching 10 m using stereo-image measurement would require recording from a greater distance. In such cases, a multi-stereo camera system, which shows a more gradual increase in MAPE with increasing distance from the cameras, would be advantageous for researchers.
Using more than two cameras allowed for more accurate measurements of the body length of a whale shark; however, this study did not examine the effects of the distance, arrangement, or angles between the cameras on the measurement accuracy. Furthermore, since the study was conducted in a relatively clear aquarium environment, it is necessary to further investigate its applicability in the field where turbidity and lighting conditions may have a significant impact.

5. Conclusions

This study demonstrated that using a multi-stereo camera system allows a more accurate estimation of the body length of large animals, such as whale sharks and marine mammals, from distant positions, compared with traditional methods (stereo-image measurement with two cameras). Increasing the number of cameras without enlarging the equipment (Figure 1) makes this method more suitable for field applications, such as measuring body length in wild environments [8]. Furthermore, if recording is carried out with four cameras, estimations can subsequently be made using combinations of 2, 3, and 4 cameras. Analyses with fewer cameras may lead to larger estimation errors for distant targets, although this is unlikely to be problematic for nearby ones. In contrast, when the target is farther away, using a greater number of cameras is expected to reduce estimation errors.

Author Contributions

H.Y. and S.T. conceived the ideas and designed methodology; H.Y., A.S., T.K. and S.T. collected the data; H.Y. analyzed the data; A.S., Y.M. and S.T. supervised the study; H.Y. and S.T. led the writing of the manuscript. All authors have read and agreed to the published version of the manuscript.

Funding

This research was partially supported by a Grant-in-Aid for Scientific Research (C) from the Japan Society for the Promotion of Science (Grant number 23K03754).

Institutional Review Board Statement

The study was approved by Kindai University Committee on Animal Research and Bioethics (Permit Number KAAG-2021-002, approval date 2021-04-01).

Data Availability Statement

The original contributions presented in this study are included in the article. Further inquiries can be directed to the corresponding author.

Acknowledgments

We thank A. Yoshida, H. Tsuchida, and M. Horie, staff at the Kagoshima City Aquarium, and A. Ozaki and K. Tamekuni (Kindai University) for their assistance with fish rearing and experiments.

Conflicts of Interest

The authors declare no conflicts of interest.

References

  1. Meekan, M.G.; Virtue, P.; Marcus, L.; Clements, K.D.; Nichols, P.D.; Revill, A.T. The world’s largest omnivore is a fish. Ecology 2022, 103, e3818. [Google Scholar] [CrossRef]
  2. Weigmann, S. Annotated checklist of the living sharks, batoids and chimaeras (Chondrichthyes) of the world, with a focus on biogeographical diversity. J. Fish Biol. 2016, 88, 837–1037. [Google Scholar] [CrossRef]
  3. Rowat, D.; Brooks, K.S. A review of the biology, fisheries and conservation of the whale shark Rhincodon typus. J. Fish Biol. 2012, 80, 1019–1056. [Google Scholar] [CrossRef]
  4. Block, B.A.; Jonsen, I.D.; Jorgensen, S.J.; Winship, A.J.; Shaffer, S.A.; Bograd, S.J.; Hazen, E.L.; Foley, D.G.; Breed, G.A.; Harrison, A.-L.; et al. Tracking apex marine predator movements in a dynamic ocean. Nature 2011, 475, 86–90. [Google Scholar] [CrossRef] [PubMed]
  5. Sequeira, A.M.M.; Mellin, C.; Fordham, D.A.; Meekan, M.G.; Bradshaw, C.J.A. Predicting current and future global distributions of whale sharks. Glob. Change Biol. 2014, 20, 778–789. [Google Scholar] [CrossRef] [PubMed]
  6. Sequeira, A.M.M.; Mellin, C.; Meekan, M.G.; Sims, D.W.; Bradshaw, C.J.A. Inferred global connectivity of whale shark Rhincodon typus populations. J. Fish Biol. 2013, 82, 367–389. [Google Scholar] [CrossRef] [PubMed]
  7. Meekan, M.G.; Bradshaw, C.J.; Press, M.; McLean, C.; Richards, A.; Quasnichka, S.; Taylor, J.G. Population size and structure of whale sharks Rhincodon typus at Ningaloo Reef, Western Australia. Mar. Ecol. Prog. Ser. 2006, 319, 275–285. [Google Scholar] [CrossRef]
  8. Sequeira, A.M.M.; Thums, M.; Brooks, K.; Meekan, M.G. Error and bias in size estimates of whale sharks: Implications for understanding demography. R. Soc. Open Sci. 2016, 3, 150668. [Google Scholar] [CrossRef]
  9. Speakman, J.R. Body size, energy metabolism and lifespan. J. Exp. Biol. 2005, 208, 1717–1730. [Google Scholar] [CrossRef]
  10. Baum, J.K.; Myers, R.A.; Kehler, D.G.; Worm, B.; Harley, S.J.; Doherty, P.A. Collapse and Conservation of Shark Populations in the Northwest Atlantic. Science 2003, 299, 389–392. [Google Scholar] [CrossRef]
  11. Hutchings, J.A.; Myers, R.A.; García, V.B.; Lucifora, L.O.; Kuparinen, A. Life-history correlates of extinction risk and recovery potential. Ecol. Appl. 2012, 22, 1061–1067. [Google Scholar] [CrossRef]
  12. Li, W.; Wang, Y.; Norman, B. A preliminary survey of whale shark Rhincodon typus catch and trade in China: An emerging crisis. J. Fish Biol. 2012, 80, 1608–1618. [Google Scholar] [CrossRef] [PubMed]
  13. Riley, M.J.; Harman, A.; Rees, R.G. Evidence of continued hunting of whale sharks Rhincodon typus in the Maldives. Environ. Biol. Fishes 2009, 86, 371–374. [Google Scholar] [CrossRef]
  14. Speed, C.W.; Meekan, M.G.; Rowat, D.; Pierce, S.J.; Marshall, A.D.; Bradshaw, C.J.A. Scarring patterns and relative mortality rates of Indian Ocean whale sharks. J. Fish Biol. 2008, 72, 1488–1503. [Google Scholar] [CrossRef]
  15. Amandè, M.J.; Ariz, J.; Chassot, E.; de Molina, A.D.; Gaertner, D.; Murua, H.; Pianet, R.; Ruiz, J.; Chavance, P. Bycatch of the European purse seine tuna fishery in the Atlantic Ocean for the 2003–2007 period. Aquat. Living Resour. 2010, 23, 353–362. [Google Scholar] [CrossRef]
  16. Pierce, S.J.; Norman, B. Rhincodon typus. In IUCN Red List Threatened Species; IUCN Biodiversity Assessment & Knowledge Team: Cambridge, UK, 2016; p. e.T19488A2365291. [Google Scholar]
  17. Bradshaw, C.J.A.; Fitzpatrick, B.M.; Steinberg, C.C.; Brook, B.W.; Meekan, M.G. Decline in whale shark size and abundance at Ningaloo Reef over the past decade: The world’s largest fish is getting smaller. Biol. Conserv. 2008, 141, 1894–1905. [Google Scholar] [CrossRef]
  18. Sequeira, A.M.M.; Mellin, C.; Delean, S.; Meekan, M.G.; Bradshaw, C.J.A. Spatial and temporal predictions of inter-decadal trends in Indian Ocean whale sharks. Mar. Ecol. Prog. Ser. 2013, 478, 185–195. [Google Scholar] [CrossRef]
  19. Jeffreys, G.L.; Rowat, D.; Marshall, H.; Brooks, K. The development of robust morphometric indices from accurate and precise measurements of free-swimming whale sharks using laser photogrammetry. J. Mar. Biol. Assoc. UK 2013, 93, 309–320. [Google Scholar] [CrossRef]
  20. Holmberg, J.; Norman, B.; Arzoumanian, Z. Estimating population size, structure, and residency time for whale sharks Rhincodon typus through collaborative photo-identification. Endanger. Species Res. 2009, 7, 39–53. [Google Scholar] [CrossRef]
  21. Perry, C.T.; Figueiredo, J.; Vaudo, J.J.; Hancock, J.; Rees, R.; Shivji, M. Comparing length-measurement methods and estimating growth parameters of free-swimming whale sharks (Rhincodon typus) near the South Ari Atoll, Maldives. Mar. Freshw. Res. 2018, 69, 1487. [Google Scholar] [CrossRef]
  22. Wintner, S.P. Preliminary Study of Vertebral Growth Rings in the Whale Shark, Rhincodon typus, from the East Coast of South Africa. Environ. Biol. Fishes 2000, 59, 441–451. [Google Scholar] [CrossRef]
  23. Arzoumanian, Z.; Holmberg, J.; Norman, B. An astronomical pattern-matching algorithm for computer-aided identification of whale sharks Rhincodon typus. J. Appl. Ecol. 2005, 42, 999–1011. [Google Scholar] [CrossRef]
  24. Graham, R.T.; Roberts, C.M. Assessing the size, growth rate and structure of a seasonal population of whale sharks (Rhincodon typus Smith 1828) using conventional tagging and photo identification. Fish. Res. 2007, 84, 71–80. [Google Scholar] [CrossRef]
  25. Norman, B.M.; Stevens, J.D. Size and maturity status of the whale shark (Rhincodon typus) at Ningaloo Reef in Western Australia. Fish. Res. 2007, 84, 81–86. [Google Scholar] [CrossRef]
  26. Harvey, E.; Fletcher, D.; Shortis, M.R.; Kendrick, G.A. A comparison of underwater visual distance estimates made by scuba divers and a stereo-video system: Implications for underwater visual census of reef fish abundance. Mar. Freshw. Res. 2004, 55, 573–580. [Google Scholar] [CrossRef]
  27. Delacy, C.; Olsen, A.; Howey, L.; Chapman, D.; Brooks, E.; Bond, M. Affordable and accurate stereo-video system for measuring dimensions underwater: A case study using oceanic whitetip sharks Carcharhinus longimanus. Mar. Ecol. Prog. Ser. 2017, 574, 75–84. [Google Scholar] [CrossRef]
  28. Harvey, E.; Fletcher, D.; Shortis, M. Estimation of reef fish length by divers and by stereo-video: A first comparison of the accuracy and precision in the field on living fish under operational conditions. Fish. Res. 2002, 57, 255–265. [Google Scholar] [CrossRef]
  29. Torisawa, S.; Kadota, M.; Komeyama, K.; Suzuki, K.; Takagi, T. A digital stereo-video camera system for three-dimensional monitoring of free-swimming Pacific bluefin tuna, Thunnus orientalis, cultured in a net cage. Aquat. Living Resour. 2011, 24, 107–112. [Google Scholar] [CrossRef]
  30. Torisawa, S.; Komeyama, K.; Takagi, T. A Technique of Three-Dimensional Monitoring for Free-Swimming Pacific Bluefin Tuna 71hunnusOrientaliCsulturedin a Net Cage Using a Digital Stereo-Video Camera System. Fish. Eng. 2012, 49, 13–20. [Google Scholar]
  31. Ikeya, K.; Torisawa, S.; Yamane, H.; Mitsunaga, Y. Estimating the total length of Mekong giant catfish, Pangasianodon gigas, in an aquarium via stereo-video shooting and direct linear transformation. Zoo Biol. 2022, 41, 554–559. [Google Scholar] [CrossRef]
  32. Boutros, N.; Shortis, M.R.; Harvey, E.S. A comparison of calibration methods and system configurations of underwater stereo-video systems for applications in marine ecology. Limnol. Oceanogr. Methods 2015, 13, 224–236. [Google Scholar] [CrossRef]
  33. Mitsunaga, Y.; Shimizu, T.; Suzuki, K.; Yamane, T. Convenient Analysis of Swimming Mechanism of Largemouth Bass Using Digital Video Cameras. Fish. Eng. 2005, 41, 245–250. [Google Scholar]
  34. Fukuda, S.; Kang, I.J.; Moroishi, J.; Nakamura, A. The application of entropy for detecting behavioral responses in Japanese medaka (Oryzias latipes) exposed to different toxicants. Environ. Toxicol. 2010, 25, 446–455. [Google Scholar] [CrossRef]
  35. Bishop, B.H.; Spence-Chorman, N.; Gahtan, E. Three-dimensional motion tracking reveals a diving component to visual and auditory escape swims in zebrafish larvae. J. Exp. Biol. 2016, 219, 3981–3987. [Google Scholar] [CrossRef]
  36. Tanaka, T.; Ikeda, R.; Yuta, Y.; Tsurukawa, K.; Nakamura, S.; Yamaguchi, T.; Komeyama, K. Annual monitoring of growth of red sea bream by multi-stereo-image measurement. Fish. Sci. 2019, 85, 1037–1043. [Google Scholar] [CrossRef]
  37. Hartley, R.; Zisserman, A. Multiple View Geometry in Computer Vision, 2nd ed.; Cambridge University Press: Cambridge, UK, 2003. [Google Scholar]
Figure 1. The left panel (a) shows a multi-stereo camera that comprises four cameras. Each camera is approximately 60 cm apart. The right panel (b) shows the multi-stereo camera suspended in the tank with ropes.
Fishes 10 00513 g001
Figure 2. The mean fork length (FL) of the whale shark estimated using two, three, and four cameras. Red, green, and blue boxes show the mean FL of whale shark estimated with two, three, and four cameras, respectively. The asterisks denote statistically significant differences.
Fishes 10 00513 g002
Figure 3. The relationship between the distance from the camera to the target and the error ratio. Red circles, green triangles, and blue squares indicate the error ratio of 2, 3, and 4 cameras, respectively.
Fishes 10 00513 g003
Figure 4. The relationship between the distance from the camera to the target and the Mean Absolute Percentage Error (MAPE) Red circles, green triangles, and blue squares indicate the MAPE of 2, 3, and 4 cameras, respectively.
Fishes 10 00513 g004
Table 1. Correlation test results between the distance from the camera to the target and Error ratio, the Mean Absolute Percentage Error (MAPE) for using 2, 3, and 4 cameras.
Error RatioMAPE
t Valuedfp ValuerRegression Linet Valuedfp ValuerRegression Line
2 cameras1.900180.0760.410y = 0.12x + 0.183.8180.00130.67y = 3.4x − 19
3 cameras0.390180.7000.092y = 0.034x + 0.372.8180.01100.56y = 1.0x − 3.6
4 cameras0.017180.9900.004y = 0.00050x + 0.514.2180.00060.70y = 1.6x − 8.0
Disclaimer/Publisher’s Note: The statements, opinions and data contained in all publications are solely those of the individual author(s) and contributor(s) and not of MDPI and/or the editor(s). MDPI and/or the editor(s) disclaim responsibility for any injury to people or property resulting from any ideas, methods, instructions or products referred to in the content.