Optimization of a Digestion Method to Determine Total Mercury in Fish Tissue by Cold Vapor Atomic Fluorescence Spectrophotometry

 , ,
, ,
Abstract

1. Introduction
2. Materials and Methods
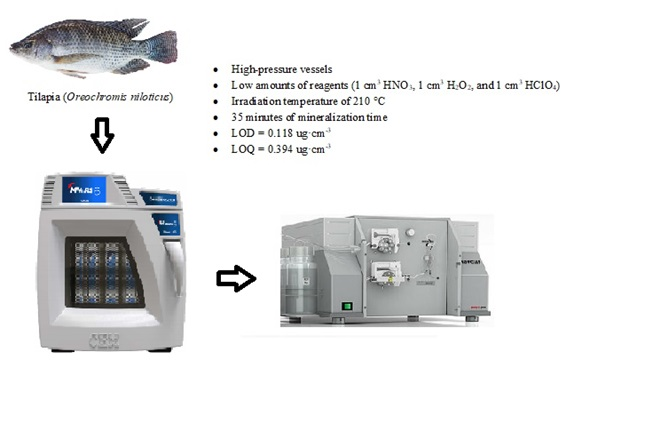
2.1. Instrumentation
2.2. Chemical and Reagents
2.3. Methodology
2.4. Analytical Quality Assurance
3. Results and Discussion
3.1. Optimization of the Microwave-Assisted Digestion Method
3.2. Analytical Features of the Proposed Method
3.3. Applications
4. Conclusions
Author Contributions
Funding
Acknowledgments
Conflicts of Interest
References
- Eqani, S.A.M.A.S.; Bhowmik, A.K.; Qamar, S.; Shah, S.T.A.; Sohail, M.; Mulla, S.I.; Fasola, M.; Shen, H. Mercury contamination in deposited dust and its bioaccumulation patterns throughout Pakistan. Sci. Total Environ. 2016, 569–570, 585–593. [Google Scholar] [CrossRef]
- Liu, C.-B.; Hua, X.-B.; Liu, H.-W.; Yu, B.; Mao, Y.-X.; Wang, D.-Y.; Yin, Y.-G.; Hu, L.-G.; Shi, J.-B.; Jiang, G.-B. Tracing aquatic bioavailable Hg in three different regions of China using fish Hg isotopes. Ecotoxicol. Environ. Saf. 2018, 150, 327–334. [Google Scholar] [CrossRef]
- Boerleider, R.Z.; Roeleveld, N.; Scheepers, P.T.J. Human biological monitoring of mercury for exposure assessment. AIMS Environ. Sci. 2017, 4, 251–276. [Google Scholar] [CrossRef]
- United Nations Environment Programme [UNEP]. Global Mercury Assessment 2018. Available online: https://wedocs.unep.org/bitstream/handle/20.500.11822/27579/GMA2018.pdf?sequence=1&isAllowed=y (accessed on 29 October 2019).
- Selin, N.E. Global Biogeochemical Cycling of Mercury: A Review. Annu. Rev. Environ. Resour. 2009, 34, 43–63. [Google Scholar] [CrossRef]
- Selin, N.E.; Jacob, D.J.; Yantosca, R.M.; Strode, S.; Jaeglé, L.; Sunderland, E.M. Global 3-D land-ocean-atmosphere model for mercury: Present-day versus preindustrial cycles and anthropogenic enrichment factors for deposition. Glob. Biogeochem. Cycles 2008, 22, 1–13. [Google Scholar] [CrossRef]
- Streets, D.G.; Devane, M.K.; Lu, Z.; Bond, T.C.; Sunderland, E.M.; Jacob, D.J. All-time releases of mercury to the atmosphere from human activities. Environ. Sci. Technol. 2011, 45, 10485–10491. [Google Scholar] [CrossRef]
- World Health Organization [WHO]. Guidance for Identifying Populations at Risk form Mercury Exposure. Available online: https://www.who.int/foodsafety/publications/risk-mercury-exposure/en/ (accessed on 29 October 2019).
- Harayashiki, C.A.Y.; Reichelt-Brushett, A.; Cowden, K.; Benkendorff, K. Effects of oral exposure to inorganic mercury on the feeding behaviour and biochemical markers in yellowfin bream (Acanthopagrus australis). Mar. Environ. Res. 2018, 134, 1–15. [Google Scholar] [CrossRef]
- Colin, Y.; Gury, J.; Monperrus, M.; Gentes, S.; Borda, P.A.; Goni-Urriza, M.; Guyoneaud, R. Biosensor for screening bacterial mercury methylation: Example within the Desulfobulbaceae. Res. Microbiol. 2018, 169, 44–51. [Google Scholar] [CrossRef] [PubMed]
- Lu, X.; Liu, Y.; Johs, A.; Zhao, L.; Wang, T.; Yang, Z.; Lin, H.; Elias, D.A.; Pierce, E.M.; Liang, L.; et al. Anaerobic Mercury Methylation and Demethylation by Geobacter bemidjiensis Bem. Environ. Sci. Technol. 2016, 50, 4366–4373. [Google Scholar] [CrossRef] [PubMed]
- Zeng, L.; Luo, G.; He, T.; Guo, Y.; Qian, X. Effects of sulfate-reducing bacteria on methylmercury at the sediment–water interface. J. Environ. Sci. (China) 2016, 46, 214–219. [Google Scholar] [CrossRef] [PubMed]
- Motta, L.C.; Blum, J.D.; Johnson, M.W.; Umhau, B.P.; Popp, B.N.; Washburn, S.J.; Drazen, J.C.; Benitez-Nelson, C.R.; Close, C.C.S.H.H.G.; Lamborg, C.H. Mercury cycling in the North Pacific Subtropical Gyre as revealed by mercury stable isotope ratios. Glob. Biogeochem. Cycles 2019, 33, 777–794. [Google Scholar] [CrossRef]
- Naïja, A.; Kestemont, P.; Chénais, B.; Haouas, Z.; Blust, R.; Helal, A.N.; Marchand, J. Effects of Hg sublethal exposure in the brain of peacock blennies Salaria pavo: Molecular, physiological and histopathological analysis. Chemosphere 2018, 193, 1094–1104. [Google Scholar] [CrossRef] [PubMed]
- Okpala, C.O.R.; Sardo, G.; Vitale, S.; Bono, G.; Arukwe, A. Hazardous properties and toxicological update of mercury: From fish food to human health safety perspective. Crit. Rev. Food Sci. Nutr. 2018, 58, 1986–2001. [Google Scholar] [CrossRef] [PubMed]
- Branco, V.; Caito, S.; Farina, M.; da Rocha, J.T.; Aschner, M.; Carvalho, C. Biomarkers of mercury toxicity: Past, present, and future trends. J. Toxicol. Environ. Heal. Part B 2017, 20, 119–154. [Google Scholar] [CrossRef]
- Liu, Y.; Buchanan, S.; Anderson, H.A.; Xiao, Z.; Persky, V.; Turyk, M.E. Association of methylmercury intake from seafood consumption and blood mercury level among the Asian and Non-Asian populations in the United States. Environ. Res. 2018, 160, 212–222. [Google Scholar] [CrossRef]
- Vigeh, M.; Nishioka; Ohtani, K.; Omori, Y.; Matsukawa, T.; Koda, S.; Yokoyama, K. Prenatal mercury exposure and birth weight. Reprod. Toxicol. 2018, 76, 78–83. [Google Scholar] [CrossRef]
- de Carvalho, G.G.A.; Feres, M.A.; Ferreira, J.R.; Kennedy, V.H. Total and inorganic mercury determination in fish tissue by flow injection cold vapour atomic fluorescence spectrometry. Int. J. Environ. Anal. Chem. 2010, 90, 686–696. [Google Scholar] [CrossRef]
- Beckers, F.; Rinklebe, J. Cycling of mercury in the environment: Sources, fate, and human health implications: A review. Crit. Rev. Environ. Sci. Technol. 2017, 47, 693–794. [Google Scholar] [CrossRef]
- Rua-Ibarz, A.; Bolea-Fernandez, E.; Maage, A.; Frantzen, S.; Sanden, M.; Vanhaecke, F. Tracing Mercury Pollution along the Norwegian Coast via Elemental, Speciation, and Isotopic Analysis of Liver and Muscle Tissue of Deep-Water Marine Fish (Brosme brosme). Environ. Sci. Technol. 2019, 53, 1776–1785. [Google Scholar] [CrossRef]
- Liu, J.; Cao, L.; Dou, S. Trophic transfer, biomagnification and risk assessments of four common heavy metals in the food web of Laizhou Bay, the Bohai Sea. Sci. Total Environ. 2019, 670, 508–522. [Google Scholar] [CrossRef]
- Birch, R.J.; Bigler, J.; Rogers, J.W.; Zhuang, Y.; Clickner, R.P. Trends in Blood Mercury Concentrations and Fish Consumption Among U.S. Women of Childbearing Age NHANES, 1999–2010. Environ. Res. 2014, 133, 431–438. [Google Scholar] [CrossRef] [PubMed]
- Cyr, A.; López, J.A.; Rea, L.; Wooller, M.J.; Loomis, T.; Mcdermott, S.; O’Hara, T.M. Mercury concentrations in marine species from the Aleutian Islands: Spatial and biological determinants. Sci. Total Environ. 2019, 664, 761–770. [Google Scholar] [CrossRef] [PubMed]
- Shao, D.; Kang, Y.; Cheng, Z.; Wang, H.; Huang, M.; Wu, S.; Chen, K.; Wong, M.H. Hair mercury levels and food consumption in residents from the Pearl River Delta: South China. Food Chem. 2013, 136, 682–688. [Google Scholar] [CrossRef] [PubMed]
- Ruelas-Inzunza, J.; Hernández-Osuna, J.; Páez-Osuna, F. Total and organic mercury in ten fish species for human consumption from the Mexican Pacific. Bull. Environ. Contam. Toxicol. 2011, 86, 679–683. [Google Scholar] [CrossRef] [PubMed]
- Mei, N.; Lai, B.; Liu, J.; Mao, X.; Chen, G. Speciation of trace mercury impurities in fish oil supplements. Food Control 2018, 84, 221–225. [Google Scholar] [CrossRef]
- USEPA (United States Environmental Protection Agency). Guidance for Assessing Chemical Contaminant Data for Use in Fish Advisories, Risk Assessment and Fish Consumption Limits. 2000. Available online: https://www.epa.gov/sites/production/files/2015-06/documents/volume2.pdf (accessed on 29 October 2019).
- Silva, D.L.F.d.; da Costa, M.A.P.; Silva, L.O.B.; Santos, W.N.L.d. Simultaneous determination of mercury and selenium in fish by CVG AFS. Food Chem. 2019, 273, 24–30. [Google Scholar] [CrossRef]
- Korn, M.d.G.A.; Morte, E.S.d.; Santos, D.C.M.B.d.; Castro, J.T.; Barbosa, J.T.P.; Teixeira, A.P.; Fernandes, A.P.; Welz, B.; Santos, W.P.C.d.; Santos, E.B.G.N.d.; et al. Sample preparation for the determination of metals in food samples using spectroanalytical methods—A review. Appl. Spectrosc. Rev. 2008, 43, 67–92. [Google Scholar] [CrossRef]
- Hight, S.C.; Cheng, J. Determination of total mercury in seafood by cold vapor-atomic absorption spectroscopy (CVAAS) after microwave decomposition. Food Chem. 2005, 91, 557–570. [Google Scholar] [CrossRef]
- Ferreira, S.L.C.; Lemos, V.A.; Silva, L.O.B.; Queiroz, A.F.S.; Souza, A.S.; da Silva, E.G.P.; Santos, W.N.L.d.; Virgens, C.F.d. Analytical strategies of sample preparation for the determination of mercury in food matrices—A review. Microchem. J. 2015, 121, 227–236. [Google Scholar] [CrossRef]
- Esposito, M.; de Roma, A.; la Nucara, R.; Picazio, G.; Gallo, P. Total mercury content in commercial swordfish (Xiphias gladius) from different FAO fishing areas. Chemosphere 2018, 197, 14–19. [Google Scholar] [CrossRef]
- Galvão, R.C.F.; Holanda, I.B.B.; de Carvalho, D.P.; Almeida, R.; Souza, C.M.M.; Lacerda, L.D.; Bastos, W.R. Freshwater shrimps (Macrobrachium depressimanum and Macrobrachium jelskii) as biomonitors of Hg availability in the Madeira River Basin, Western Amazon. Environ. Monit. Assess. 2018, 190. [Google Scholar] [CrossRef]
- Ordiano-Flores, A.; Galván-Magaña, F.; Rosiles-Martínez, R. Bioaccumulation of mercury in muscle tissue of yellowfin tuna, Thunnus albacares, of the eastern Pacific Ocean. Biol. Trace Elem. Res. 2011, 144, 606–620. [Google Scholar] [CrossRef]
- Rodríguez, M.; Gutiérrez, Á.J.; Rodríguez, N.; Rubio, C.; Paz, S.; Martín, V.; Revert, C.; Hardisson, A. Assessment of mercury content in Panga (Pangasius hypophthalmus). Chemosphere 2018, 196, 53–57. [Google Scholar] [CrossRef]
- Fathabad, A.E.; Shariatifar, N.; Moazzen, M.; Nazmara, S.; Fakhri, Y.; Alimohammadi, M.; Azari, A.; Khaneghah, A.M. Determination of heavy metal content of processed fruit products from Tehran’s market using ICP- OES: A risk assessment study. Food Chem. Toxicol. 2018, 115, 436–446. [Google Scholar] [CrossRef] [PubMed]
- Popovic, A.R.; Djinovic-Stojanovic, J.M.; Djordjevic, D.S.; Relic, D.J.; Vranic, D.V.; Milijasevic, M.P.; Pezo, L.L. Levels of toxic elements in canned fish from the Serbian markets and their health risks assessment. J. Food Compos. Anal. 2018, 67, 70–76. [Google Scholar] [CrossRef]
- Nicklisch, S.C.T.; Bonito, L.T.; Sandin, S.; Hamdoun, A. Mercury levels of yellowfin tuna (Thunnus albacares) are associated with capture location. Environ. Pollut. 2017, 229, 87–93. [Google Scholar] [CrossRef]
- Webb, J.; Mainville, N.; Mergler, D.; Lucotte, M.; Betancourt, O.; Davidson, R.; Cueva, E.; Quizhpe, E. Mercury in Fish-eating Communities of the Andean Amazon, Napo River Valley, Ecuador. Ecohealth 2004, 1, 59–71. [Google Scholar] [CrossRef]
- Łuczyńska, J.; Paszczyk, B.; Łuczyński, M.J. Fish as a bioindicator of heavy metals pollution in aquatic ecosystem of Pluszne Lake, Poland, and risk assessment for consumer’s health. Ecotoxicol. Environ. Saf. 2018, 153, 60–67. [Google Scholar] [CrossRef] [PubMed]
- Murillo-Cisneros, D.A.; O´Hara, T.M.; Castellini, J.M.; Sánchez-González, A.; Elorriaga-Verplancken, F.R.; Marmolejo-Rodríguez, A.J.; Marín-Enríquez, E.; Galván-Magaña, F. Mercury concentrations in three ray species from the Pacific coast of Baja California Sur, Mexico: Variations by tissue type, sex and length. Mar. Pollut. Bull. 2018, 126, 77–85. [Google Scholar] [CrossRef] [PubMed]
- AOAC. AOAC Official Method 2015.01 Heavy Metals in Food Inductively Coupled Plasma—Mass Spectrometry First Action 2015. AOAC Int. 2015, 96. [Google Scholar] [CrossRef]
- Adel, M.; Copat, C.; Saeidi, M.R.; Conti, G.O.; Babazadeh, M.; Ferrante, M. Bioaccumulation of trace metals in banded Persian bamboo shark (Chiloscyllium arabicum) from the Persian Gulf: A food safety issue. Food Chem. Toxicol. 2018, 113, 198–203. [Google Scholar] [CrossRef] [PubMed]
- Qin, D.; Chen, Z.; Wang, H.; Zhao, J.; Mou, Z. Determination of total mercury in fish from Amur and Ussuri River of China by microwave digestion-ICP/MS method. Asian J. Chem. 2013, 25, 3665–3667. [Google Scholar] [CrossRef]
- Fernández, Z.H.; Rojas, L.A.V.; Álvarez, A.M.; Álvarez, J.R.E.; Santos, J.A.d.; González, I.P.; González, M.R.; Macias, N.A.; Sánchez, D.L.; Torres, D.H. Application of Cold Vapor-Atomic Absorption (CVAAS) Spectrophotometry and Inductively Coupled Plasma-Atomic Emission Spectrometry methods for cadmium, mercury and lead analyses of fish samples. Validation of the method of CVAAS. Food Control 2015, 48, 37–42. [Google Scholar] [CrossRef]
- Horvat, M.; Degenek, N.; Lipej, L.; Tratnik, J.S.; Faganeli, J. Trophic transfer and accumulation of mercury in ray species in coastal waters affected by historic mercury mining (Gulf of Trieste, northern Adriatic Sea). Environ. Sci. Pollut. Res. 2014, 21, 4163–4176. [Google Scholar] [CrossRef] [PubMed]
- Shah, A.Q.; Kazi, T.G.; Baig, J.A.; Afridi, H.I.; Arain, M.B. Simultaneously determination of methyl and inorganic mercury in fish species by cold vapour generation atomic absorption spectrometry. Food Chem. 2012, 134, 2345–2349. [Google Scholar] [CrossRef]
- de Paz, L.A.; Alegría, A.; Barberá, R.; Farré, R.; Lagarda, M.J. Determination of mercury in dry-fish samples by microwave digestion and flow injection analysis system cold vapor atomic absorption spectrometry. Food Chem. 1997, 58, 169–172. [Google Scholar] [CrossRef]
- Pozebon, D.; Scheffler, G.L.; Dressler, V.L. Elemental hair analysis: A review of procedures and applications. Anal. Chim. Acta 2017, 992, 1–23. [Google Scholar] [CrossRef]

| Original Features of the References | Modifications | |||||||||
|---|---|---|---|---|---|---|---|---|---|---|
| Digestion Technique | Sample Amount (g) | Reagents for Digestion | Temperature (°C) | Ramp Time (min) | Holding Time (min) | Power (W) | Pressure (psi) | Recovery Obtained (%) | Reference | |
| Microwave-assisted digestion | 0.25 | 4 cm3 HNO3 1 cm3 H2O2 0.1 cm3 of 50 mg·dm−3 Au + Lu solution | 190 | 20 | 10 | No power value described | No pressure value described | 54.5 | [43] | 0.3 g of sample amount was used. No addition of 0.1 cm3 of the 50 mg·dm−3 Au + Lu solution to each digestion vessel. Power set to 1440 W. Pressure not applied. MARSXpress vessels were used. |
| Wet ashing, hot plate | 0.3 | 5 cm3 HNO3 4 cm3 H2O2 1 cm3 HClO4 | 200 | --- | --- | --- | --- | 55.7 | [44] | 0.3 g of sample amount was used. No addition of 45 mg of V2O5 to samples and no dilution to 50 cm3 with 20 cm3 distilled water and K2Cr2O7 (% 2). Pressure not applied. |
| Microwave-assisted digestion | 0.5 g 1.0 g 2.0 g | 1.0 ± 0.01 cm3 NaCl 1% (w/v) 5.0 ± 0.1 cm3 HNO3 | 130 | 10 | --- | 300 | No pressure value described | 49.3 | [31] | 0.3 g of sample amount was used. Ramp temperature was modified from 5 to 10 min for heating from ambient to 130 °C. No dilution to 50 cm3 adding 3.5 ± 0.1 cm3 HCl. Pressure not applied. MARSXpress vessels were used. |
| --- | 20 | 1200 | ||||||||
| Microwave-assisted digestion | 0.5 | 5 cm3 HNO3 2 cm3 H2O2 | 110 | 5 | 3 | 1600 | No pressure value described | 60.2 | [45] | 0.3 g fish muscle was used. Power at 100% for the equipment used by the reference authors was 1600 W; we used 1800 W as per the CEM MARS 6 specifications. Pressure not applied. MARSXpress vessels were used. |
| 150 | 4 | 8 | 1600 | |||||||
| 180 | 3 | 25 | 1600 | |||||||
| Microwave-assisted digestion | 0.2 | 8 cm3 HNO3 2 cm3 H2O2 | 180 | 20 | 50 | No power value described | No pressure value described | 66.7 | [46] | 0.3 g fish muscle was used. Power set at 1600 W. Pressure not applied. MARSXpress vessels were used. |
| Wet ashing, hot plate | 0.5 | 3 cm3 HNO3 1 cm3 HClO4 5 cm3 H2SO4 | 230 | --- | --- | --- | --- | 90.3 | [47] | Method not modified at CESAQ-PUCE. |
| Microwave-assisted digestion | 0.5 | 5 cm3 HNO3 2 cm3 H2O2 | 110 | 15 | 3 | 1600 | No pressure value described | 77.1 | [45] | 0.3 g fish muscle was used. Addition of 1 cm3 of HClO4 to each vessel. Pressure set at 800 psi. Power at 100% for the equipment used by the reference authors was 1600 W; we used 1800 W as per the CEM MARS 6 specifications. MARSEasyPrep vessels were used. |
| 150 | 4 | 8 | 1600 | |||||||
| 180 | 3 | 25 | 1600 | |||||||
| Microwave-assisted digestion | 0.2 | 1 cm3 HNO3 1 cm3 H2O2 | No temperature value described | Microwave heating program for 2–3 min. | 80% of total power (900 W) | No pressure value described | 65.2 | [48] | 0.3 g fish muscle was used. Power and pressure set at 1400 W and 800 psi, respectively. Temperature set at 210 °C, ramp time: 20 min, holding time: 15 min. No dilution to 25 cm3 of volumetric flask with 0.1 M HCl. MARSEasyPrep vessels were used. | |
| Type of Vessel | Sample Amount (g) | Reagents for Digestion | Temperature (°C) | Ramp Time (min) | Holding Time (min) | Power (W) | Pressure (psi) | Recovery (%) |
|---|---|---|---|---|---|---|---|---|
| MARSXpress | 0.3 | 4 cm3 HNO3 1 cm3 H2O2 | 190 | 20 | 10 | 1440 | no pressure control used | 70.5 |
| MARSXpress | 0.3 | 5 cm3 HNO3 4 cm3 H2O2 1 cm3 HClO4 | 200 | 20 | 10 | 1440 | no pressure control used | 68.3 |
| MARSXpress | 0.3 | 5 cm3 HNO3 4 cm3 H2O2 1 cm3 HClO4 | 180 | 10 | 15 | 1800 | no pressure control used | 62.9 |
| MARSXpress | 0.3 | 5 cm3 HNO3 4 cm3 H2O2 1 cm3 HClO4 | 180 | 25 | 15 | 1800 | no pressure control used | 64.3 |
| MARSXpress | 0.3 | 5 cm3 HNO3 4 cm3 H2O2 1 cm3 HClO4 | 180 | 25 | 30 | 1800 | no pressure control used | 66.5 |
| MARSXpress | 0.3 | 5 cm3 HNO3 4 cm3 H2O2 1 cm3 HClO4 | 200 | 25 | 20 | 1800 | no pressure control used | 67.9 |
| MARSXpress | 0.3 | 5 cm3 HNO3 4 cm3 H2O2 1 cm3 HClO4 | 190 | 25 | 20 | 1800 | no pressure control used | 71.0 |
| MARSXpress | 0.3 | 5 cm3 HNO3 4 cm3 H2O2 1 cm3 HClO4 | 200 | 25 | 25 | 1200 | no pressure control used | 65.2 |
| MARSXpress | 0.3 | 5 cm3 HNO3 4 cm3 H2O2 1 cm3 HClO4 | 200 | 25 | 25 | 1400 | no pressure control used | 61.0 |
| MARSXpress | 0.3 | 5 cm3 HNO3 4 cm3 H2O2 1 cm3 HClO4 | 130 | 10 | 300 | no pressure control used | 52.6 | |
| 20 | 600 | |||||||
| MARSXpress | 0.3 | 1 cm3 HNO3 1 cm3 HClO4 5 cm3 H2SO4 | 200 | 20 | 35 | 1800 | no pressure control used | 69.3 |
| MARSEasyPrep | 0.3 | 5 cm3 HNO3 4 cm3 H2O2 1 cm3 HClO4 | 200 | 15 | 15 | 1400 | 800 | 79.8 |
| MARSEasyPrep | 0.3 | 5 cm3 HNO3 4 cm3 H2O2 1 cm3 HClO4 | 200 | 25 | 25 | 1400 | 800 | 73.5 |
| MARSEasyPrep | 0.3 | 5 cm3 HNO3 4 cm3 H2O2 1 cm3 HClO4 | 200 | 25 | 25 | 1400 | 800 | 84.1 |
| MARSEasyPrep | 0.3 | 1 cm3 HNO3 1 cm3 H2O2 1 cm3 HClO4 | 200 | 15 | 15 | 1400 | 800 | 86.9 |
| MARSEasyPrep | 0.3 | 1 cm3 HNO3 1 cm3 H2O2 1 cm3 HClO4 | 220 | 20 | 15 | 1400 | 800 | 94.4 |
| MARSEasyPrep | 0.3 | 1 cm3 HNO3 1 cm3 H2O2 1 cm3 HClO4 | 210 | 20 | 15 | 1400 | 800 | 95.2 |
| Step | Temperature (°C) | Ramp Time (min) | Holding Time (min) | Power (watts) | Pressure (psi) |
|---|---|---|---|---|---|
| 1 | 210 | 20 | 15 | 1400 | 800 |
| Concentration Expected (mg·kg−1) | Concentration Found a (mg·kg−1) | Highest Repeatability Precision RSD a (%) | Intermediate Precision RSD a (%) | Recovery (%) |
|---|---|---|---|---|
| 0.167 | 0.174 | 3.0 | 4.2 | 104.3 |
| 0.500 | 0.498 | 1.5 | 1.7 | 99.5 |
| 0.833 | 0.819 | 2.7 | 3.4 | 98.3 |
© 2020 by the authors. Licensee MDPI, Basel, Switzerland. This article is an open access article distributed under the terms and conditions of the Creative Commons Attribution (CC BY) license (http://creativecommons.org/licenses/by/4.0/).
Share and Cite
Yánez-Jácome, G.S.; Romero-Estévez, D.; Navarrete, H.; Simbaña-Farinango, K.; Vélez-Terreros, P.Y. Optimization of a Digestion Method to Determine Total Mercury in Fish Tissue by Cold Vapor Atomic Fluorescence Spectrophotometry. Methods Protoc. 2020, 3, 45. https://doi.org/10.3390/mps3020045
Yánez-Jácome GS, Romero-Estévez D, Navarrete H, Simbaña-Farinango K, Vélez-Terreros PY. Optimization of a Digestion Method to Determine Total Mercury in Fish Tissue by Cold Vapor Atomic Fluorescence Spectrophotometry. Methods and Protocols. 2020; 3(2):45. https://doi.org/10.3390/mps3020045
Chicago/Turabian StyleYánez-Jácome, Gabriela S., David Romero-Estévez, Hugo Navarrete, Karina Simbaña-Farinango, and Pamela Y Vélez-Terreros. 2020. "Optimization of a Digestion Method to Determine Total Mercury in Fish Tissue by Cold Vapor Atomic Fluorescence Spectrophotometry" Methods and Protocols 3, no. 2: 45. https://doi.org/10.3390/mps3020045
APA StyleYánez-Jácome, G. S., Romero-Estévez, D., Navarrete, H., Simbaña-Farinango, K., & Vélez-Terreros, P. Y. (2020). Optimization of a Digestion Method to Determine Total Mercury in Fish Tissue by Cold Vapor Atomic Fluorescence Spectrophotometry. Methods and Protocols, 3(2), 45. https://doi.org/10.3390/mps3020045