1. Introduction
Radiation therapy using charged particles has gained lots of attraction in the battle against cancer. In recent comparisons between conventional and proton radiation therapy techniques, it was found that proton irradiations would lead to a lesser dispersed dose to non-targeted organs [
1], given that the ultimate goal of radiation therapy would be to eradicate cancer cells while keeping healthy and normal cells intact. Using charged particles such as protons in radiation therapy, it would be possible to achieve a rather high dose conformity by exploiting the Bragg peak [
2], which is the location that charged particles would deposit highest amount of dose in the target. The location of Bragg peak has a particular importance mainly due to the sharp increase of dose deposition in the target material. Therefore, it is pertinent to determine this location (i.e., Bragg peak) rather precisely, to enhance killing of cancer cells and limiting the dose to normal healthy cells.
Considering the spatial sensitivity of the Bragg peak location and in turn variations in the maximum dose deposition, geometrical and chemical inhomogeneities play an important role in these variations [
3,
4,
5,
6,
7,
8]. An example of such inhomogeneous targets is organs in the human body. In fact, the human body is composed of many organs, each having distinct geometrical features and chemical compositions. Therefore, such geometrical and chemical variations at the interface of tissues or organs would alter the dose distribution of protons; this would in turn lead to changes in the Bragg peak location and make the proton range monitoring and verification tedious. Several techniques for proton range monitoring were proposed, including: proton radiography and tomography [
9]; ionoacoustics [
10]; Secondary Electron Bremsstrahlung (SEB) [
11]; and Prompt Gamma Imaging (PGI) [
12]. In addition to these methods, auto-activation Positron Emission Tomography (PET) [
13,
14] technique is another notable technique, mainly explored after the imaging of proton induced positron emitting target fragments [
15]. This method is non-invasive, which would be highly desirable for realistic clinical applications. The deposited dose in a target element (i.e., volume) could be measured by detecting annihilation radiation emitted as a result of generated positron emitting radionuclides (such as
15O,
11C and
13N) produced through nuclear reactions between protons and elements in the target [
16].
One particularly important positron emitting radionuclide is
13N that is mainly produced through
16O(p,2p2n)
13N nuclear reaction, with a low threshold energy of 5.660 MeV. Considering the low threshold and rather substantial yield of
13N producing nuclear reaction, it was found to be useful for proton range monitoring and verification [
17]. Previously, we have investigated the use of this nuclear reaction and the generated
13N peak for proton range monitoring and verification in homogeneous targets both numerically [
18] and experimentally [
19]. In our previous works, we have also developed a spectral analysis (SA) approach to detect
13N production from dynamic PET data and succeeded in rendering
13N distribution proximal to the Bragg peak in homogenous phantom targets. Considering the effect of inhomogeneities on the proton range monitoring and verification, it would be pertinent to investigate the feasibility of using
13N for proton range monitoring and verification in inhomogeneous targets.
In the present work, we have extended our previously developed tools [
18,
19] for investigating the feasibility of using
13N for proton range monitoring and verification in inhomogeneous target phantoms. The Particle and Heavy Ion Transport code System (PHITS) (
https://phits.jaea.go.jp/ (accessed on 14 September 2022)) Monte Carlo (MC) package was used. Two different phantom types, namely, (1) ordinary slab and (2) MIRD anthropomorphic human models, were used. The employment of such highly inhomogeneous targets would provide useful information on the actual effectiveness and feasibility of using
13N peak for proton range monitoring and verification. We strongly believe the developed tools, as well as the obtained results, would be useful for future developments in the field of proton range monitoring using PET-based systems.
3. Results and Discussion
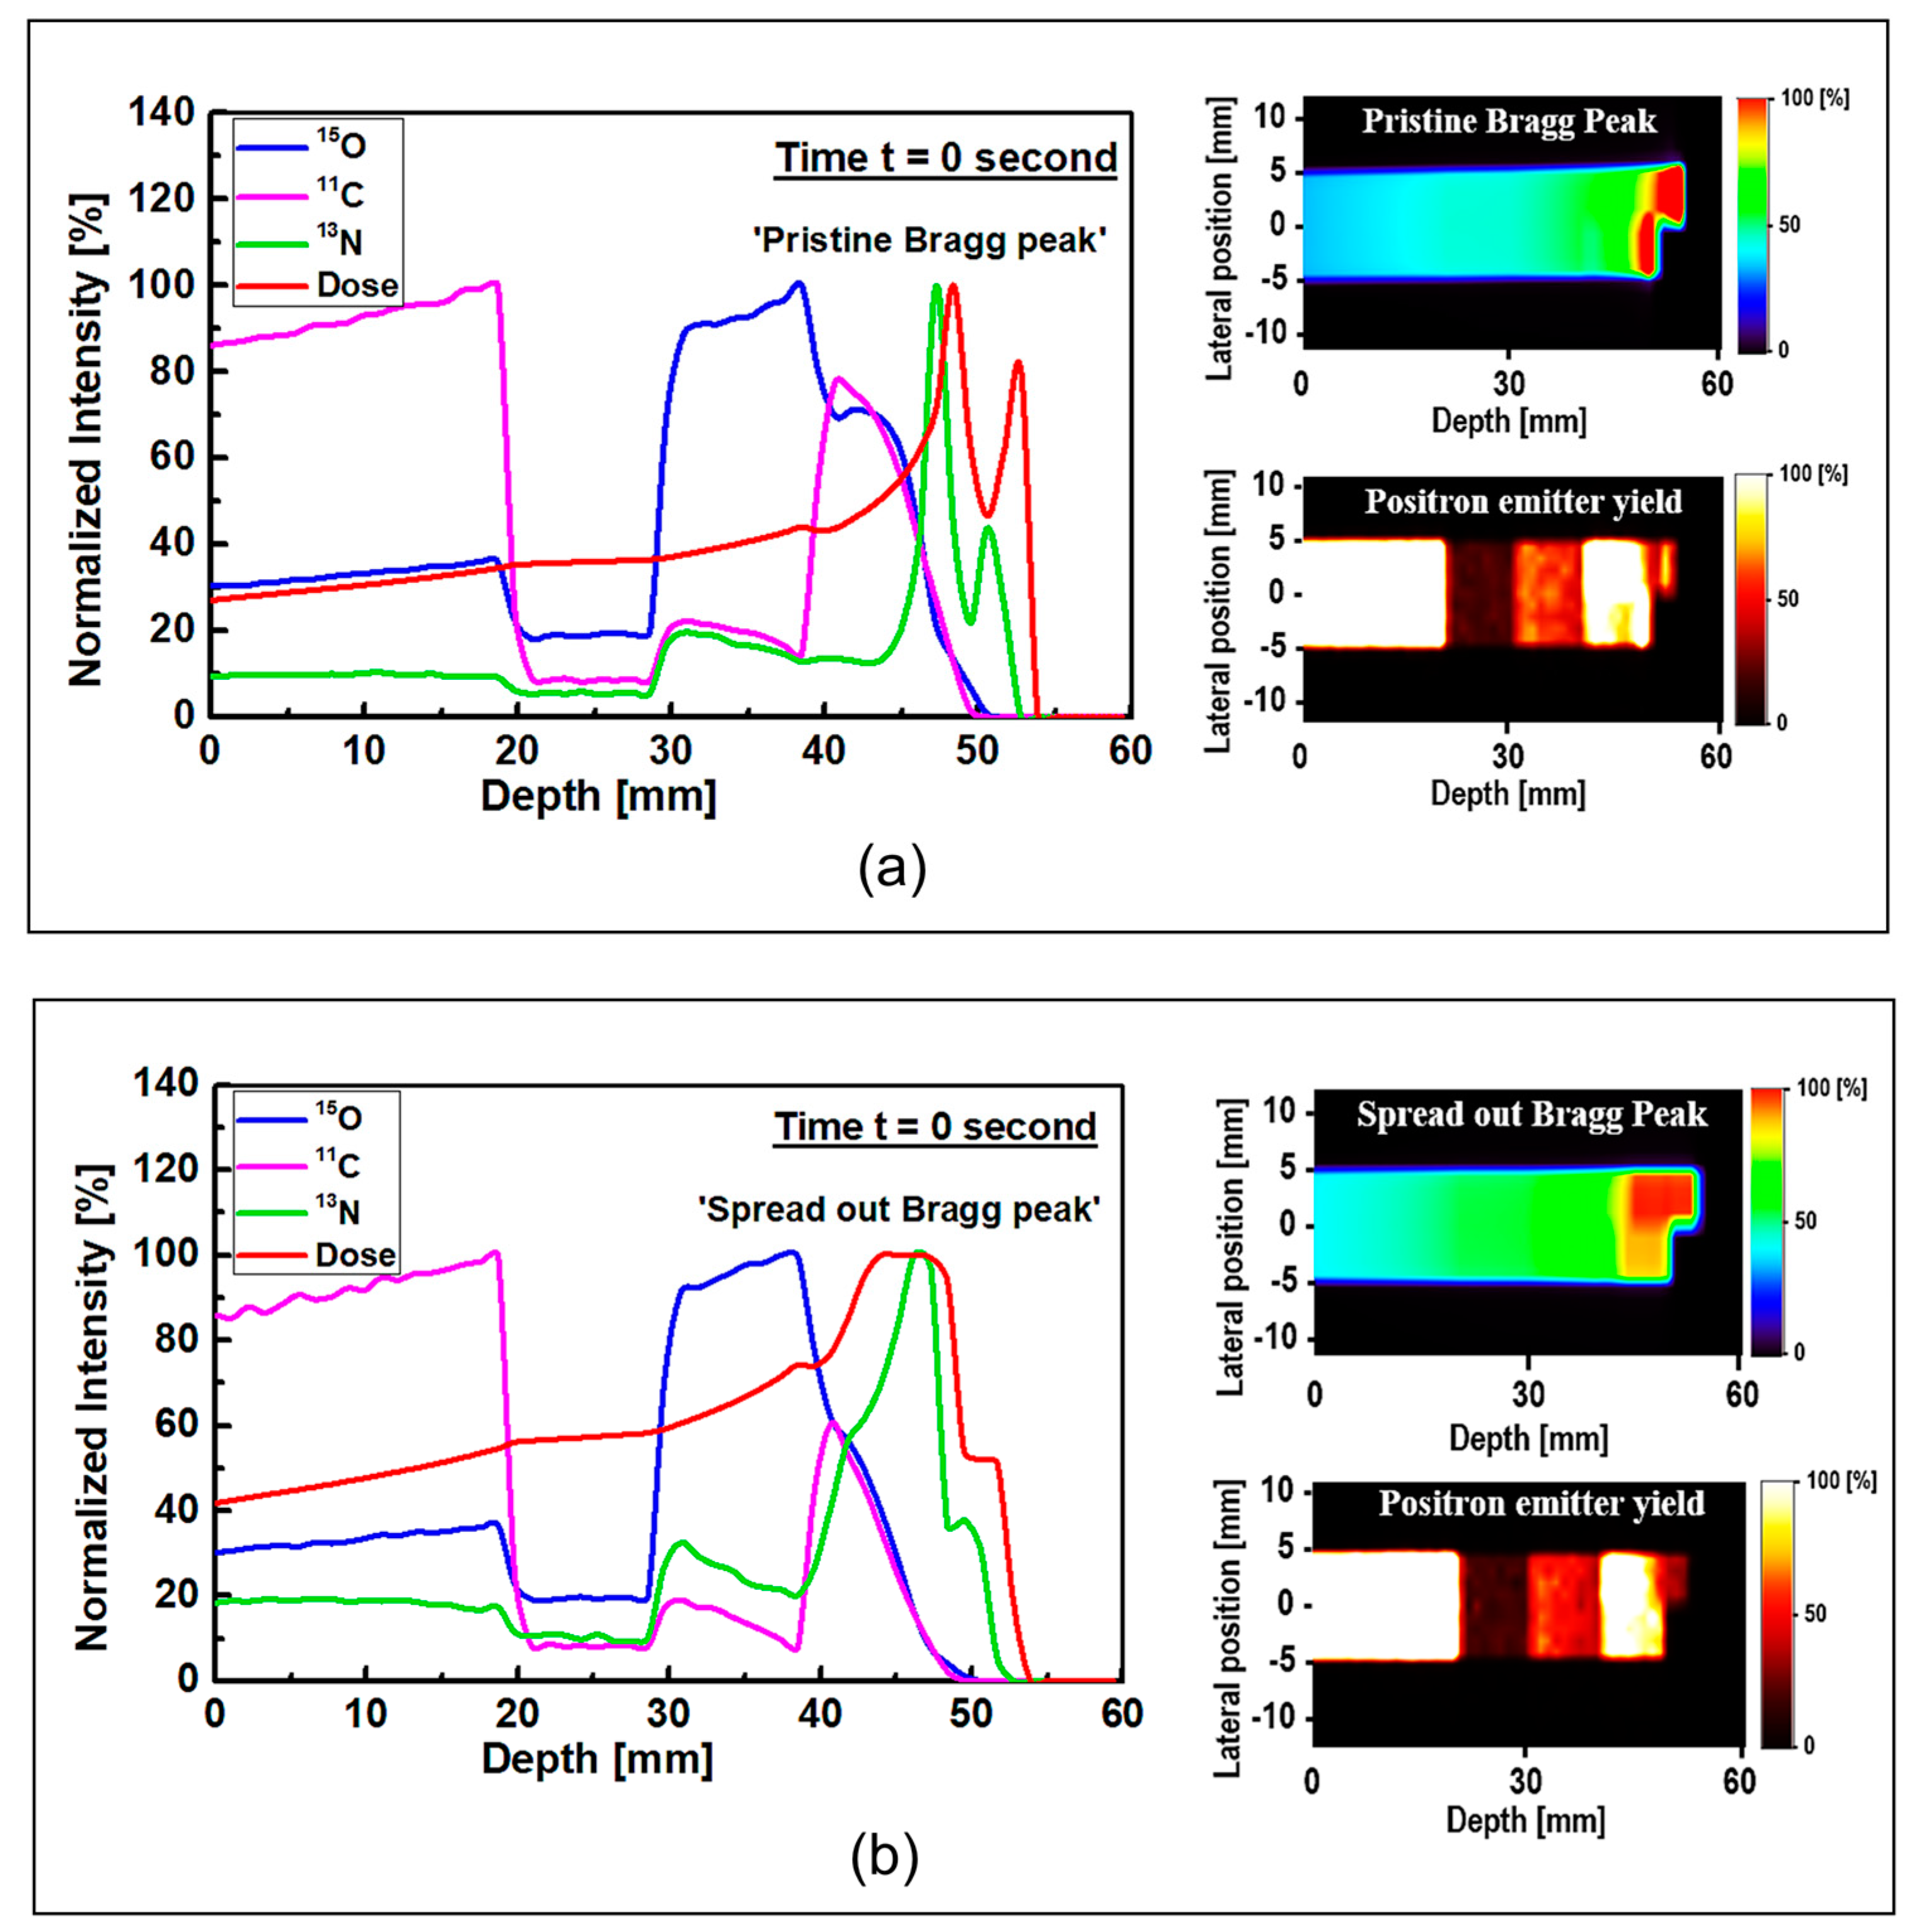
The results of 1D and 2D dose versus depth and production of positron emitting radionuclides in ordinary slab phantom are shown in
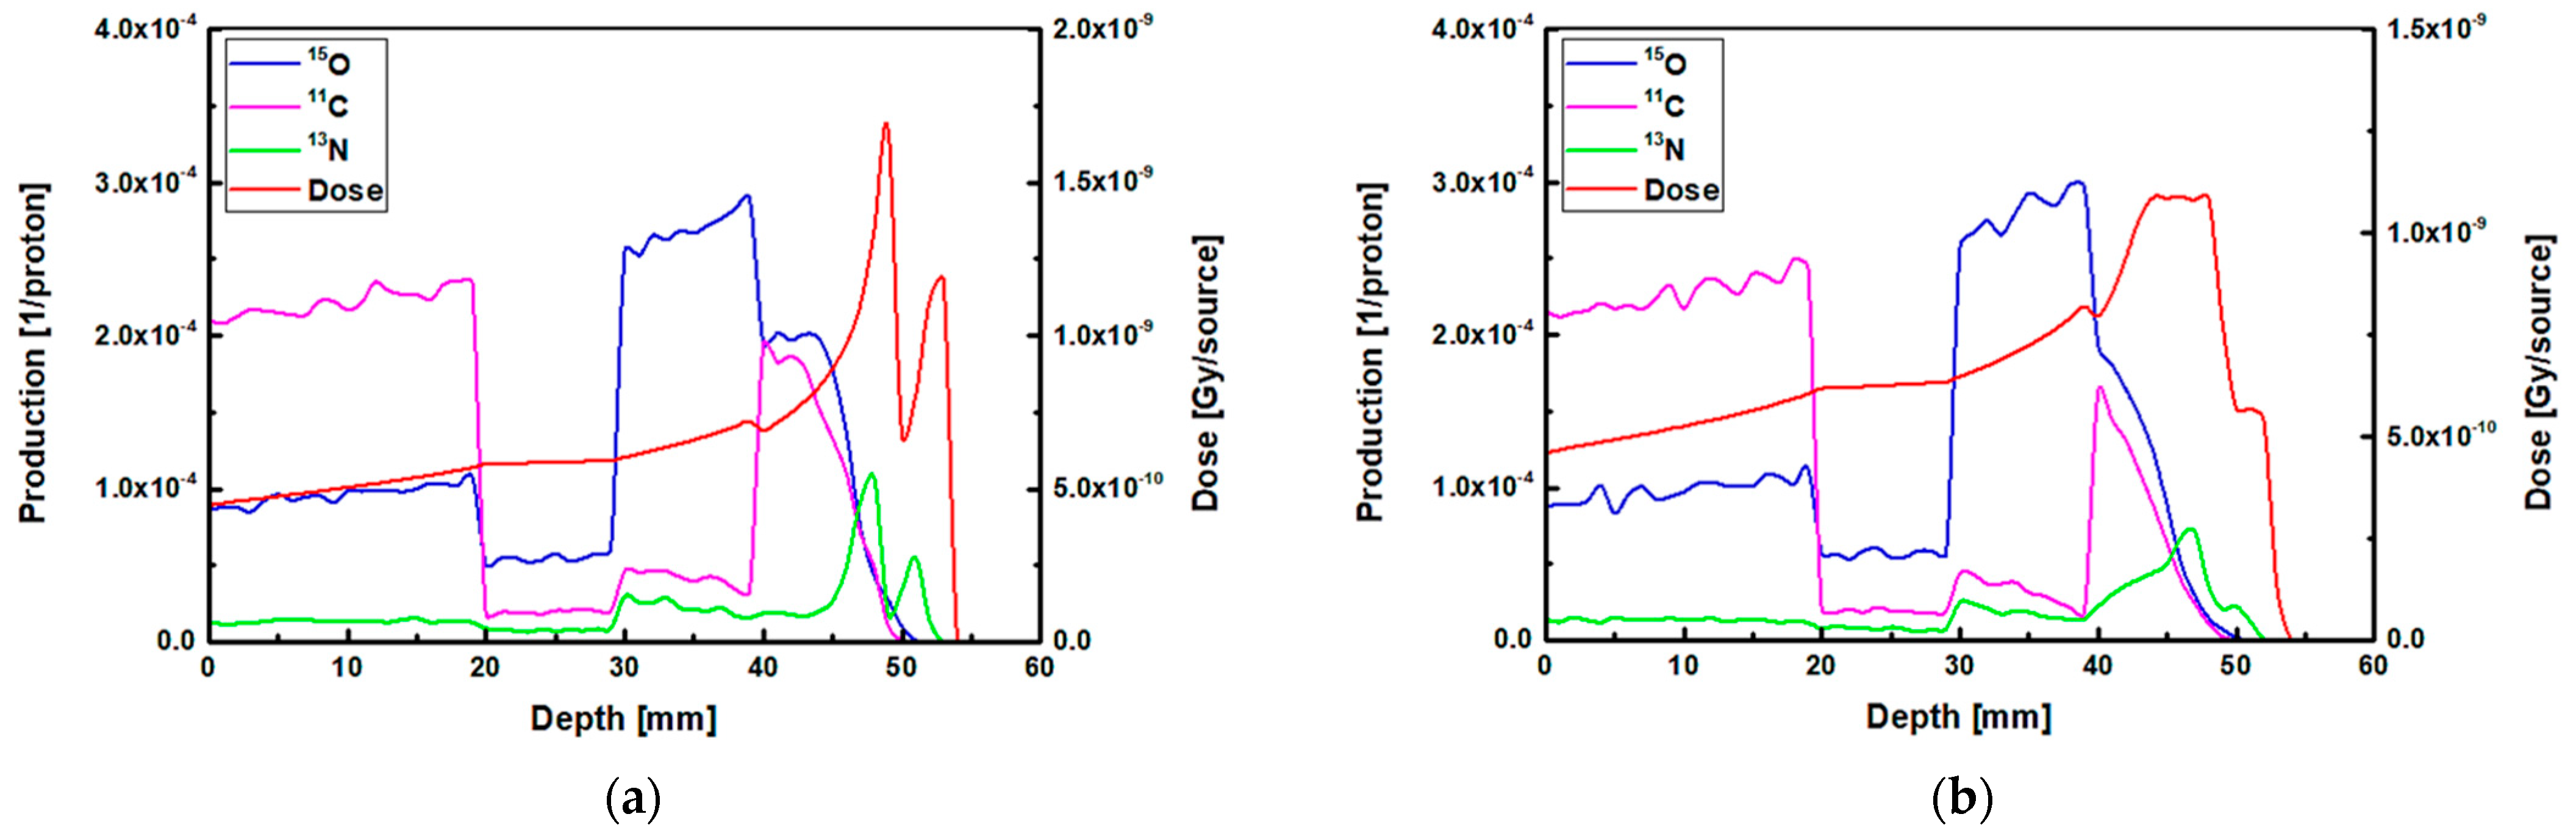
Figure 4. The results from pristine and SOBP proton beams were shown. The results were normalized so the comparison between the dose-depth profile and profile from positron emitting radionuclides can be seen clearly. From the results in
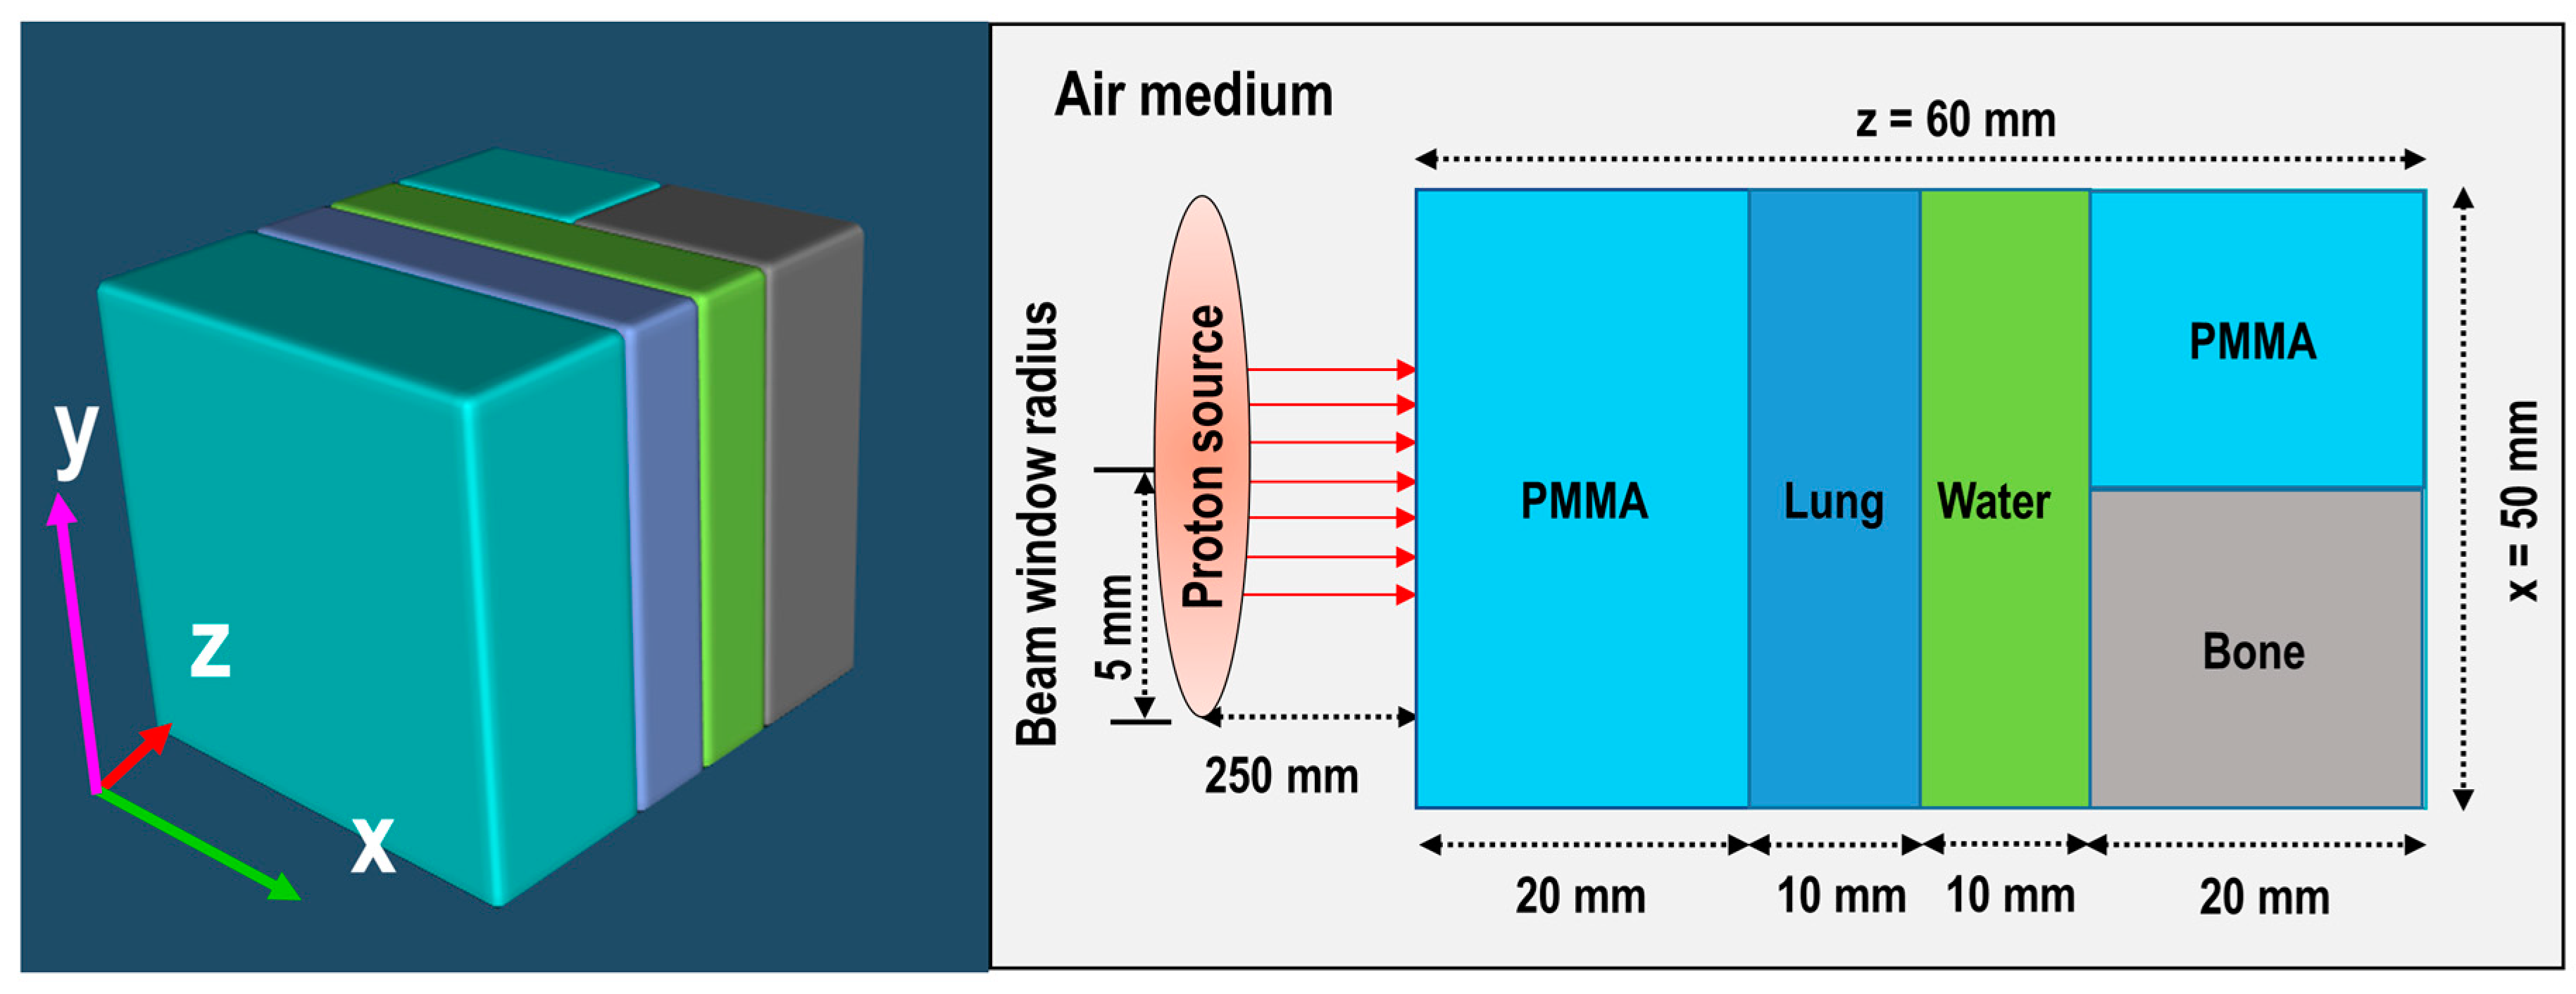
Figure 4, it can be seen that the Bragg peak sharply splits into two peaks; this is due to the interface between the PMMA and bone equivalent materials placed at the end of ordinary slab phantom (see
Figure 1). The difference between the stopping power of protons in PMMA and bone equivalent material is the main reason for observing this phenomenon. The projected range of protons at the material interface, which has two different chemical compositions, will change based on the changes in the stopping power of protons. A denser medium, such as bone material that has higher stopping power, would lead to lower proton range and for the case of PMMA, the proton range would be higher than that of bone material. On the contrary, for the SOBP proton beam, the splitting of the Bragg peak (i.e., the Bragg peak formation at the interface between PMMA and bone material) is not notably sharp mainly due to the extended Bragg peak region as the result of spreading, which essentially resembles multiple Bragg peaks. Interestingly, for both pristine and SOBP incident proton beams, the effect of material interface and changes in its chemical composition on the projected range of protons can be clearly seen, as shown in 2D contour plots in
Figure 4. From the dose shown in the results in
Figure 4, these values are normalized according to the maximum value. In addition, the SOBP was modelled using energy modulation at which energy bin having similar energy as of pristine beam would have lower number of protons (i.e., lower fluence) as that of pristine beam; this mixture of incident proton energies, the energy deposition and fluence of protons in entire PMMA and bone domain will not be the same, given that proton would stop at a lower depth in bone, mainly due to its composition and density which leads to a higher stopping power of protons when compared to PMMA. Considering these, the relative dose in bone would be lower than that of PMMA. The 1D profiles were obtained along the modelled inhomogeneous target. In realistic scenarios, the measurements would be performed over all regions and cannot be only limited to only one single region with specific material.
Considering the generated positron emitting radionuclides, the generated
15O positron emitting radionuclides was found to be higher in the water filled region of the modelled ordinary slab phantom, which is located at ~30–40 mm depth (see
Figure 4). The production of
15O radionuclides is through the
16O(p,pn)
15O nuclear reaction channel, which has a threshold of 16.79 MeV. It needs to be noted that the interaction of protons with
16O also has the ability to undergo
16O(p,3p3n)
11C nuclear reaction, which has the threshold of 27.50 MeV. Considering the location of the water filled region in the ordinary slab phantom and energy loss of protons after passing through multiple different regions before reaching water filled region, the production of
11C positron emitting radionuclides in the water filled region is not a dominant nuclear reaction channel. Therefore, the amount of
15O radionuclides would be higher compared to
11C radionuclides in the water filled region; this can be seen from the unnormalized results shown in
Appendix A.
The production of
11C radionuclide in the PMMA filled region was found to be higher than other regions in the modelled ordinary slab phantom for both pristine and SOBP proton beams. The generation of
11C radionuclide is mainly through the
12C(p,pn)
11C nuclear reaction channel which has a relatively higher threshold energy of 20.61 MeV. The PMMA filled region has relatively higher
12C content and is located in a location closest to the incident proton beam. Therefore, the chemical composition of PMMA and higher energy of protons in the PMMA filled region would enhance the production of
11C positron emitting radionuclides, hence a dominant peak can be observed in the obtained results shown in
Figure 4.
The most important positron emitting radionuclide that is found to be generated in the modelled phantoms is
13N. The
13N positron emitting radionuclides would be generated as a result of
14N(p,pn)
13N and
16O(p,2p2n)
13N nuclear reactions having threshold energy of 11.44 and 5.660 MeV, respectively. Furthermore, considering the energy loss of protons as the results of their propagation through target material, the energy of protons decreases with depth. Considering the presence of lower energy protons at higher depths and the presence of
14N and
16O elements in the modelled ordinary slab phantom, more
13N radionuclides would be generated at higher depths along the path of incident protons; this can be seen in the results shown in
Figure 4. The
16O(p,2p2n)
13N nuclear reaction is inclusive of
16O(p,α)
13N [
16].
The
13N peak would be located behind the Bragg peak; this is due to the energy threshold of
16O(p,2p2n)
13N nuclear reaction that prevent the generation of
13N radionuclides when proton energy decreases significantly at locations adjacent (i.e., very close) to the Bragg peak. Comparing the offset distance between the Bragg peak and the
13N peak, an offset distance of ~1 mm was obtained for both peaks shown in
Figure 4a. The obtained offset value is in a good agreement with our previous work on irradiation of homogeneous phantoms [
18]. For the SOBP proton beam results shown in
Figure 4b, the 13N peak is within the same ~1 to ~2 mm offset distance that we have previously reported [
18]. However, since the SOBP is broad, the
13N peak would be inside the SOBP region, see
Figure 4b. Interestingly, the generated
13N peak in the SOBP region (see
Figure 4b) is broader than that of pristine Bragg peak (see
Figure 4a), mainly due to the proton beam energy modulation that was used to achieve a spread-out Bragg peak. Since the production positron emitting radionuclides are highly dependent on the incident energy of primary radiation (i.e., protons), it would be safe to conclude that changes in the beam shape through energy modulation is strongly correlated to the production and distribution of positron emitting radionuclides. The stopping power of protons in bone is higher than that of PMMA and, therefore, protons would have a longer travel path in PMMA when compared to bone material; this leads to a broader distribution of energy in PMMA material and in turn the distribution of
13N would get broader. Considering these, a higher difference between the Bragg peak and the generated
13N peak is observed in PMMA. This phenomenon is in fact important when dealing with inhomogeneous targets.
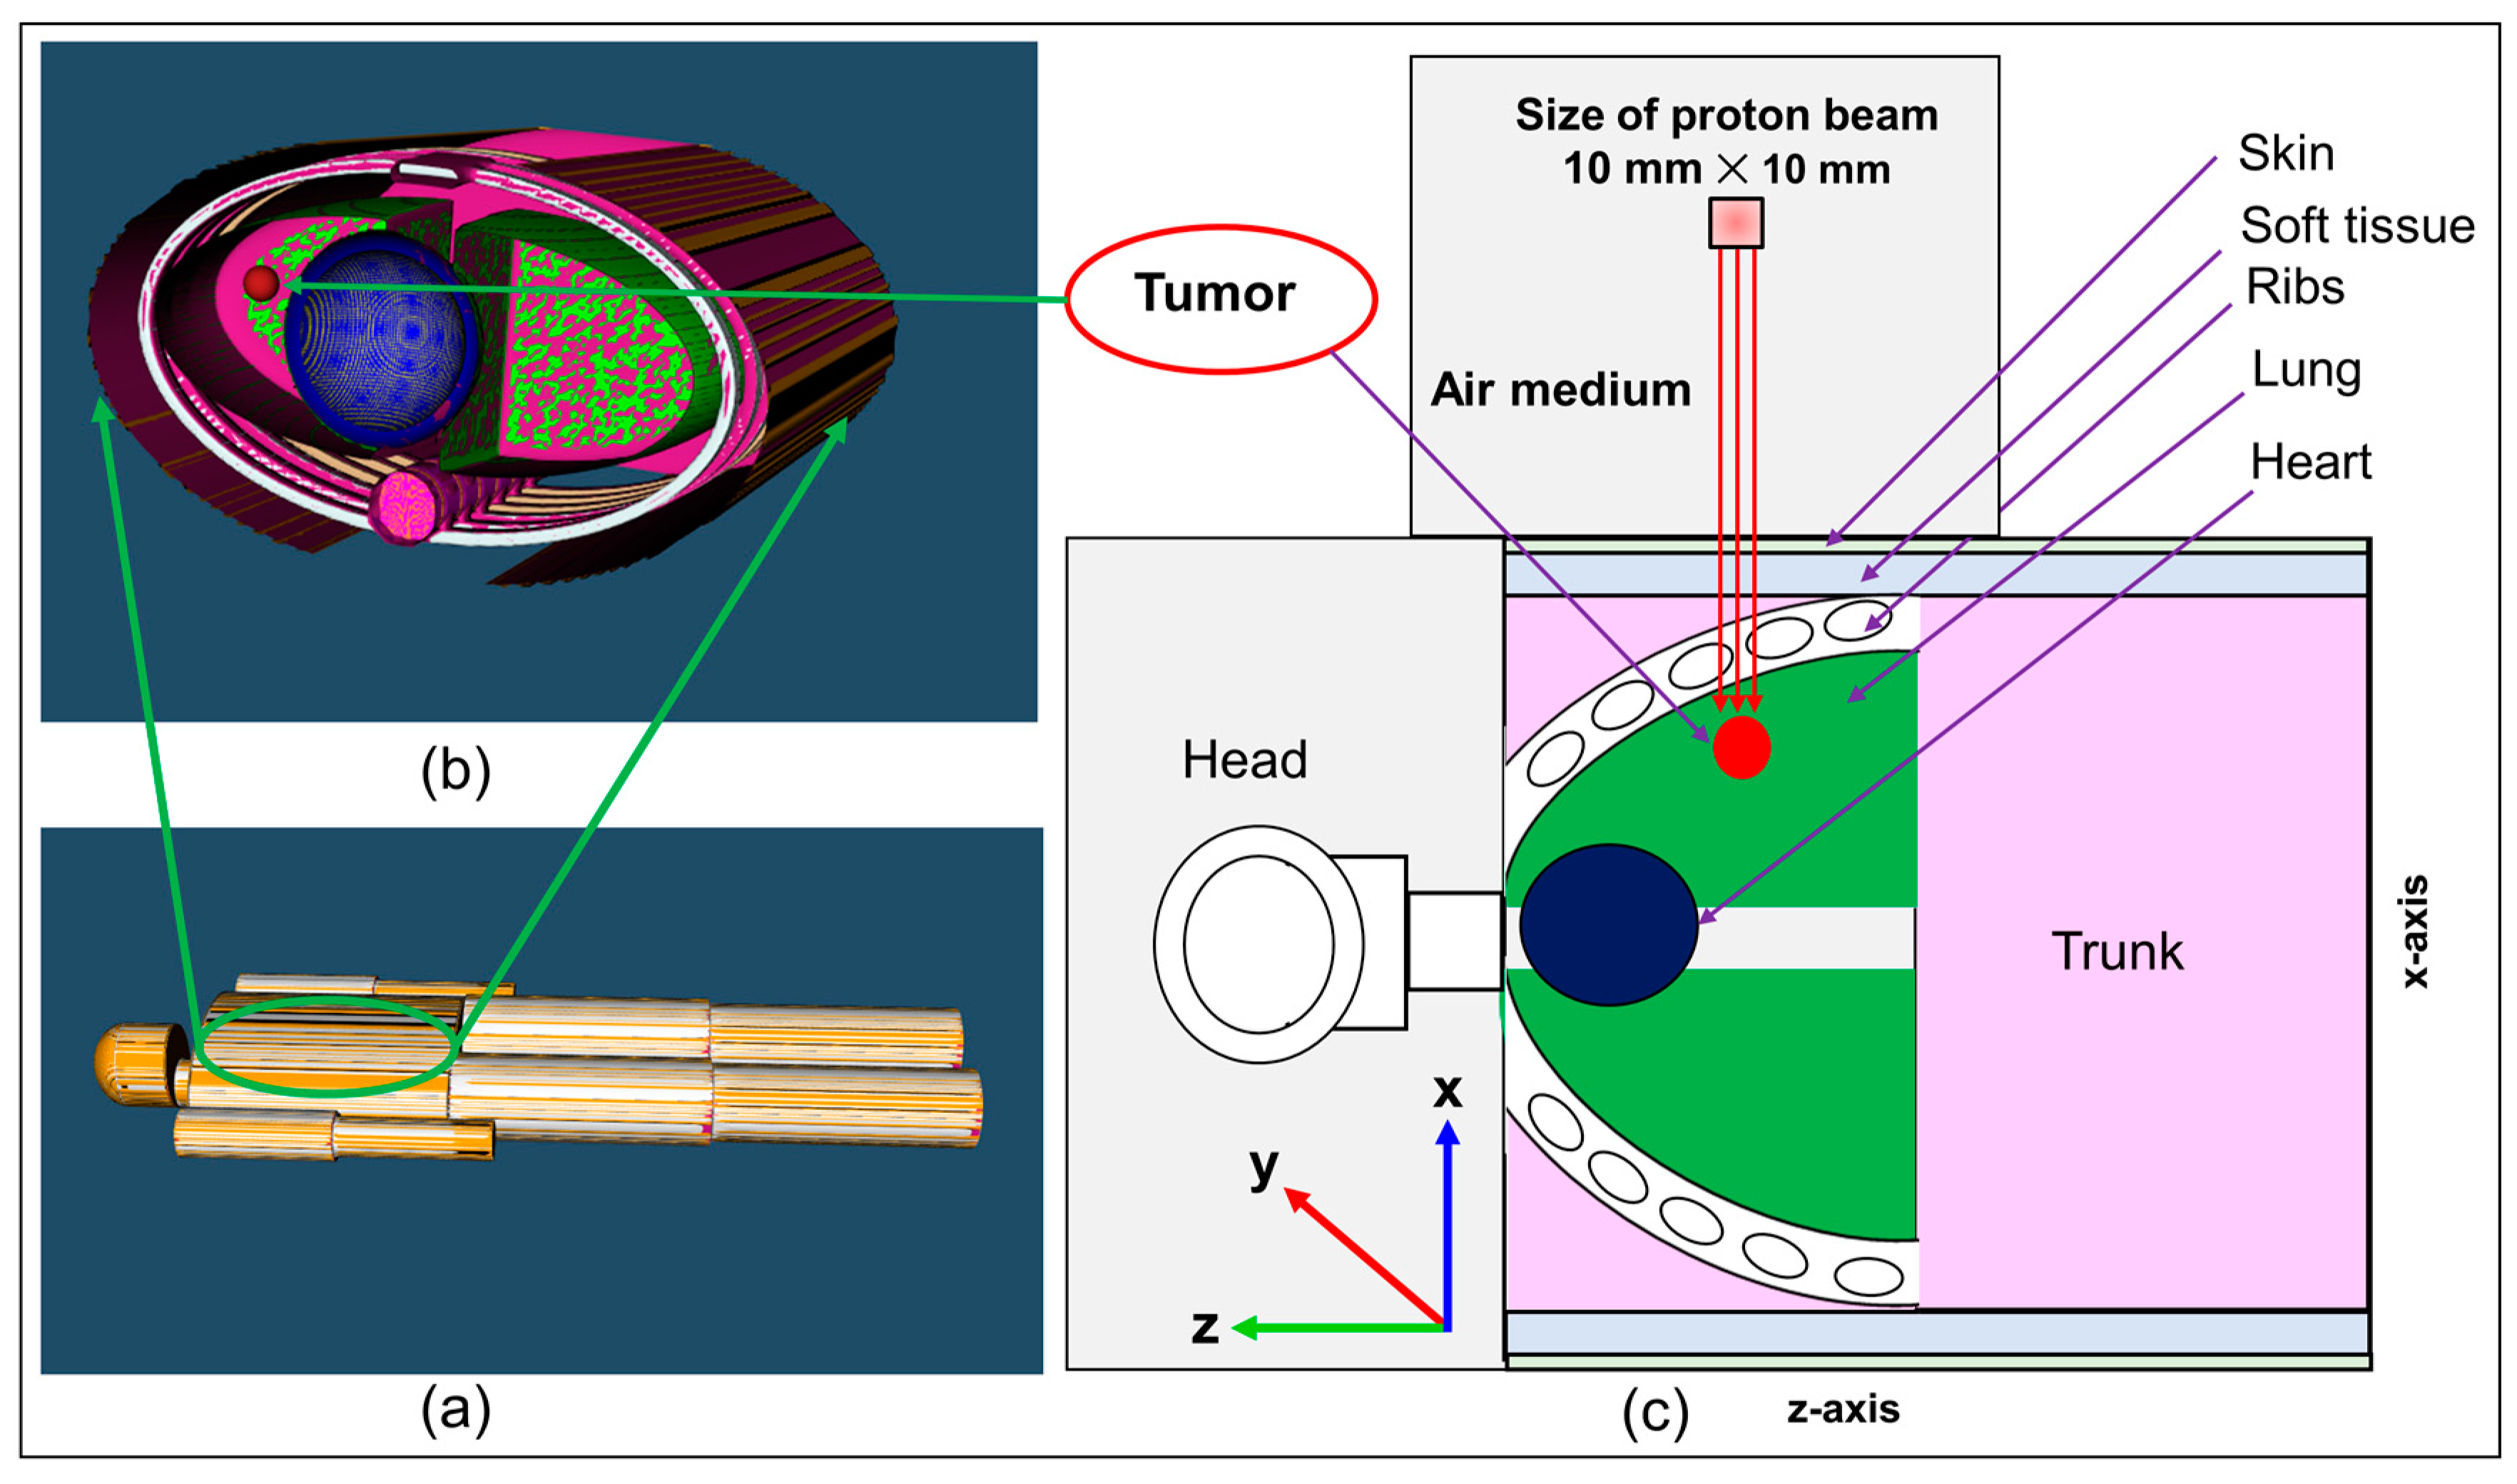
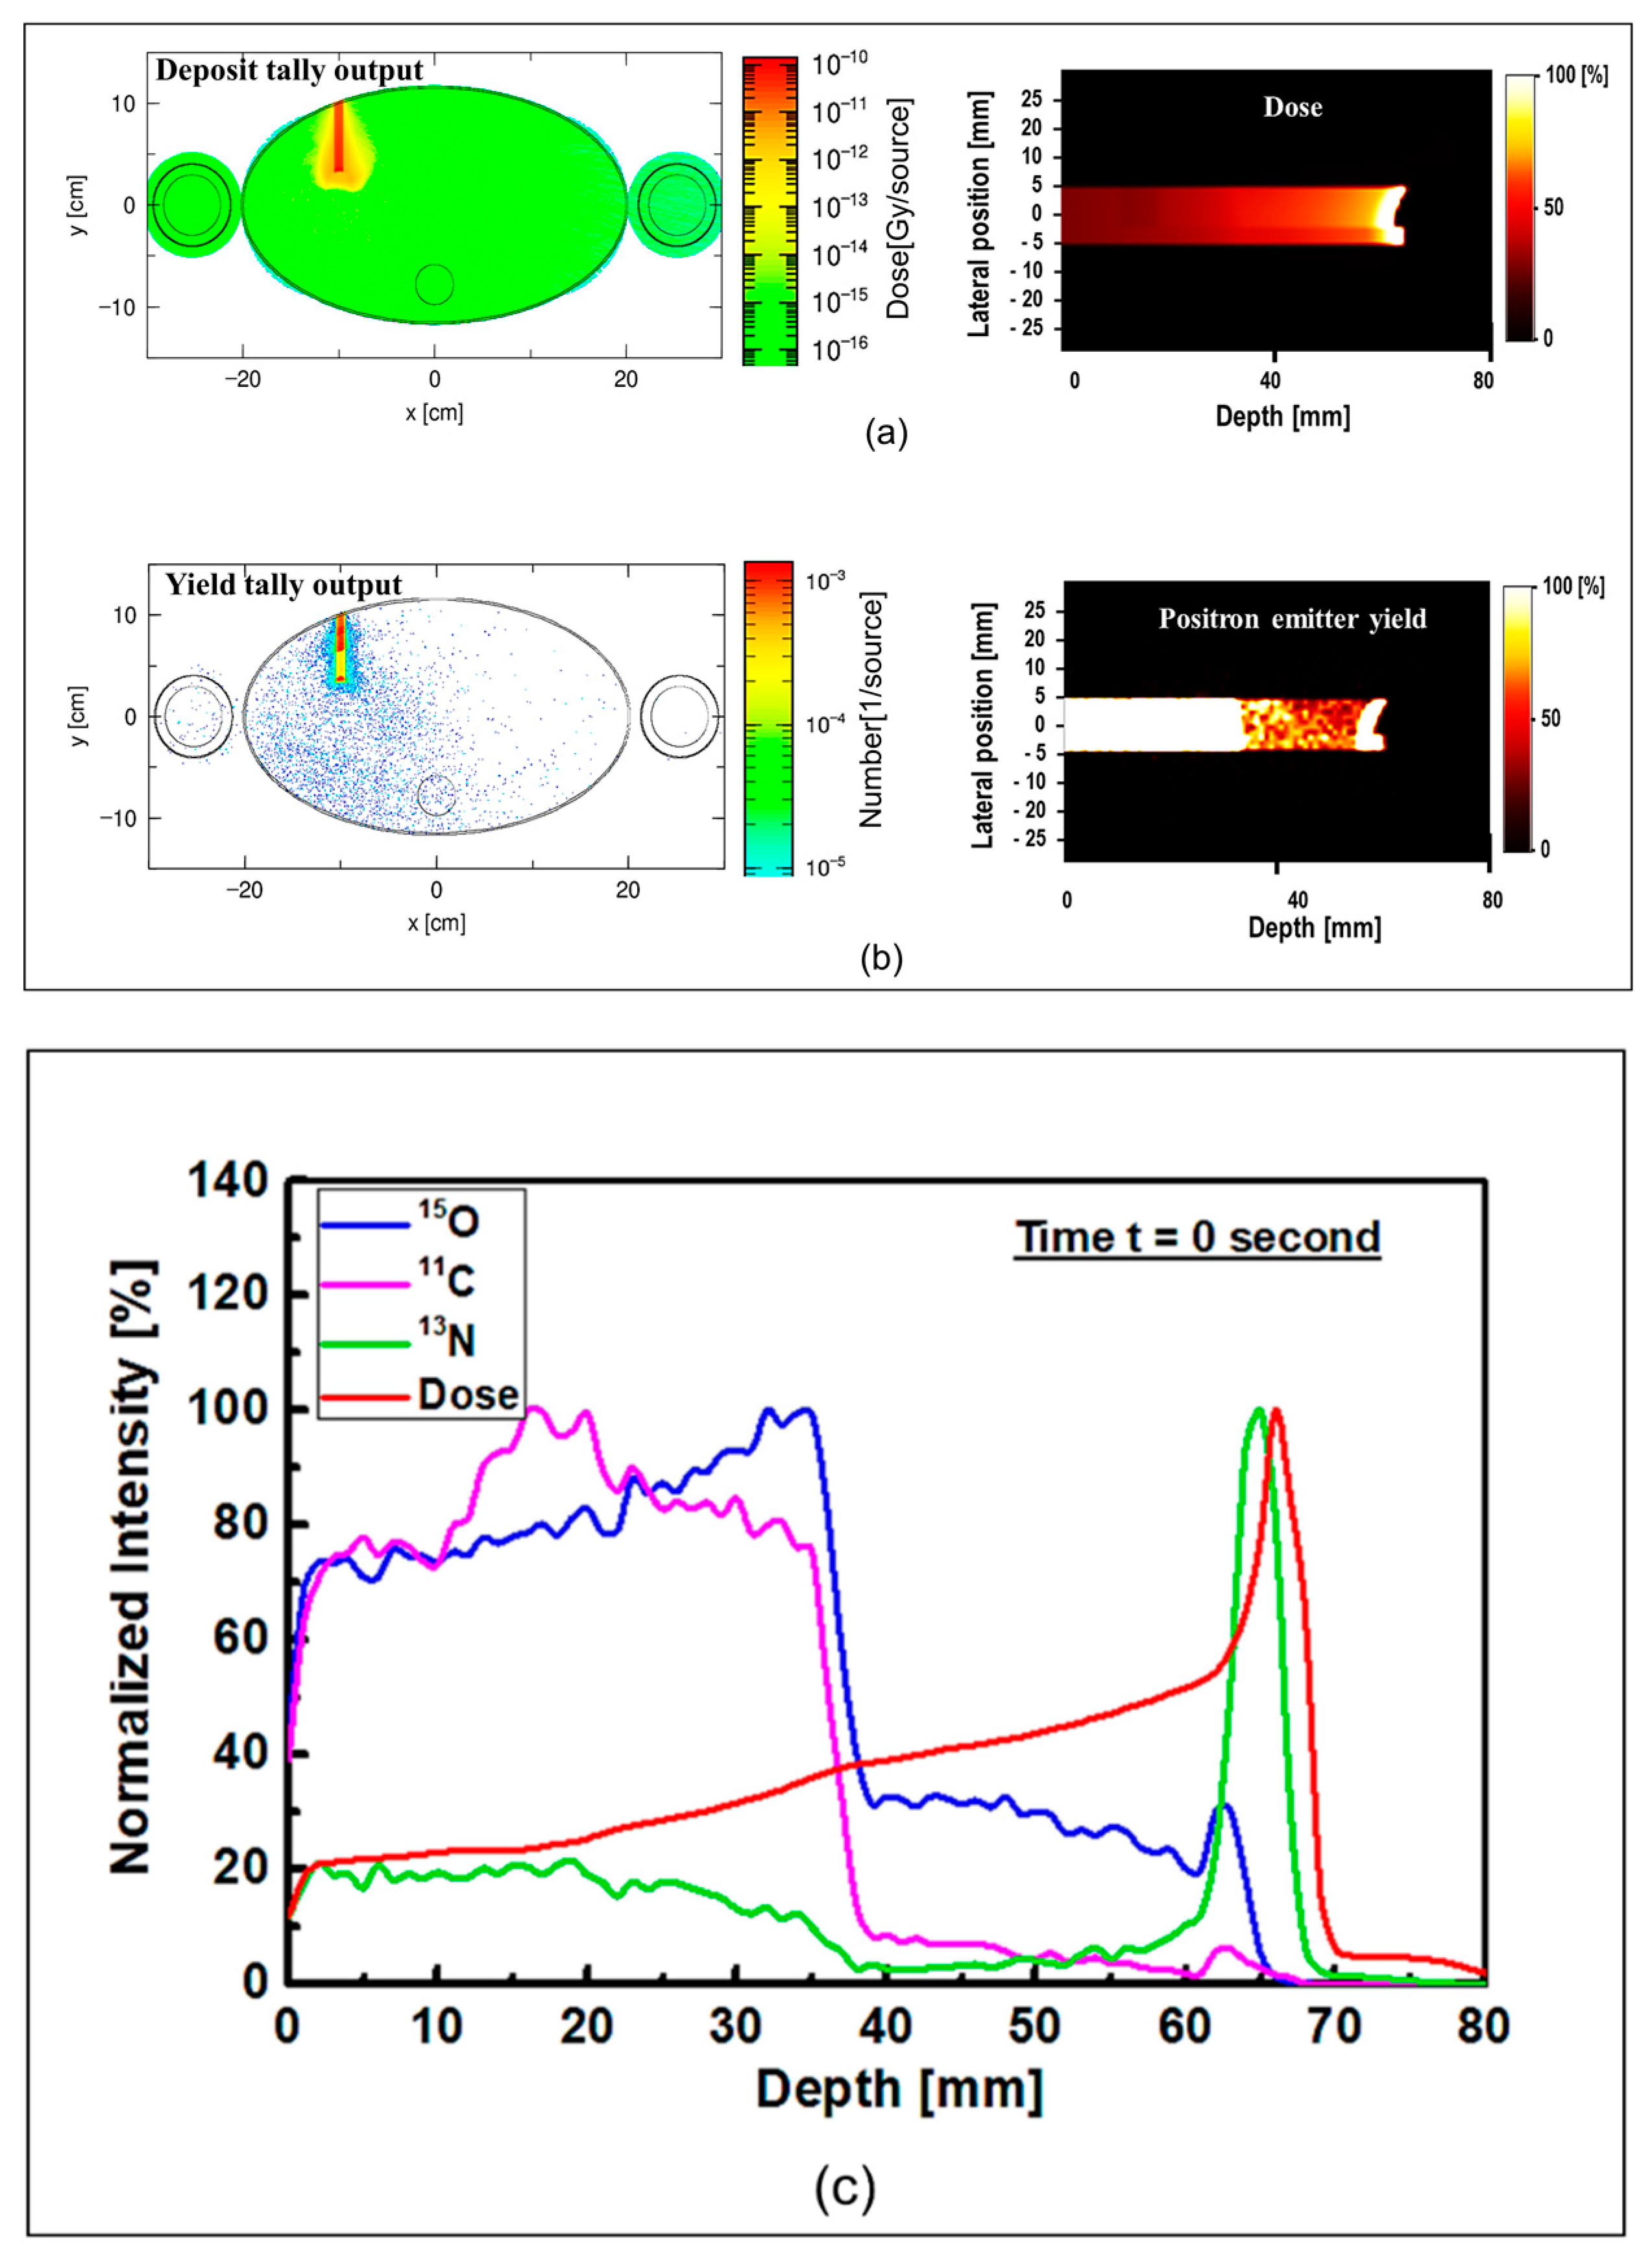
The results of the proton dose deposition and production of positron emitting radionuclides (
15O,
11C, and
13N) in the modelled MIRD anthropomorphic phantom are shown in
Figure 5. The distribution of deposited dose and positron emitting radionuclides along the incident proton beam within the body of anthropomorphic phantom were visualized (see
Figure 5). The 2D contour plot of dose and positron emitting radionuclides were obtained and shown in
Figure 5a,b. The 1D distribution of deposited dose and positron emitting radionuclides versus depth in the body of MIRD anthropomorphic phantom is shown in
Figure 5c.
The dose deposition and production of positron emitting radionuclides in the body of MIRD anthropomorphic phantom (see
Figure 5) shows the fact protons interact along the beamline toward the tumor region. As a result of proton interaction and subsequent production of positron emitting radionuclides through nuclear interaction, positron emitting radionuclides would be generated. The number of these generated radionuclides found to be highest along the proton beam, mainly due to higher number of nuclear interactions induced by protons. Interestingly, some of these generated radionuclides would be dispersed in other regions of modelled MIRD anthropomorphic phantom.
The 2D contour plot of deposited proton dose and positron emitting radionuclides shown in
Figure 5a,b, respectively, proves the fact that protons would produce positron emitting radionuclides along their path in the modelled MIRD anthropomorphic phantom. The offset in the final part of the 2D distribution shows the effect of beam interaction with spherical tumor, as can be seen from the curved end of simulated dose (see
Figure 5a) and positron emitter yield (see
Figure 5b). The results of the positron emitting radionuclides obtained in the body of modelled MIRD anthropomorphic phantom and 2D contour plots (i.e.,
Figure 5b) represent the total production of all positron emitting radionuclides (
15O,
11C, and
13N).
In order to distinguish the contribution of each positron emitting radionuclide, the distribution of deposited dose by incident protons and individual tallied positron emitting radionuclide versus depth were obtained and shown in
Figure 5c. The distribution of
15O and
11C positron emitting radionuclides was found to be highest at lower depths, mainly due to higher
16O and
12C contents in the soft tissue and lungs which enhances the
16O(p,pn)
15O,
16O(p,3p3n)
11C, and
12C(p,pn)
11C nuclear reactions. Another important reason would be proton energy, which would be higher at lower depth and in turn satisfy the energy threshold for
15O and
11C producing nuclear reactions. The produced
13N peak is close to the Bragg peak (~1 mm) mainly due to its low energy threshold. The offset between the Bragg peak and the generated
13N peak was found to be about ~1 mm, where the Bragg peak and the generated
13N peak are located at 66 and 65 mm, respectively. As discussed previously, the obtained offset value is in good agreement with our previously reported data [
18].
The ultimate goal of the present feasibility study is to apply the developed methods for realistic PET data obtained after proton irradiations. In realistic PET measurements of the signal produced by the positron emitting radionuclides (15O, 11C, and 13N), the detected signal will originate from different radionuclides. In addition, the inhomogeneities of the target could in fact complicate the task of separating the signals from different positron emitting radionuclides. Therefore, it would be pertinent to deconvolute these to obtain the 13N peak for proton range monitoring and verification. To achieve this, the SA technique was applied to the simulated data for ordinary slab and MIRD anthropomorphic phantoms.
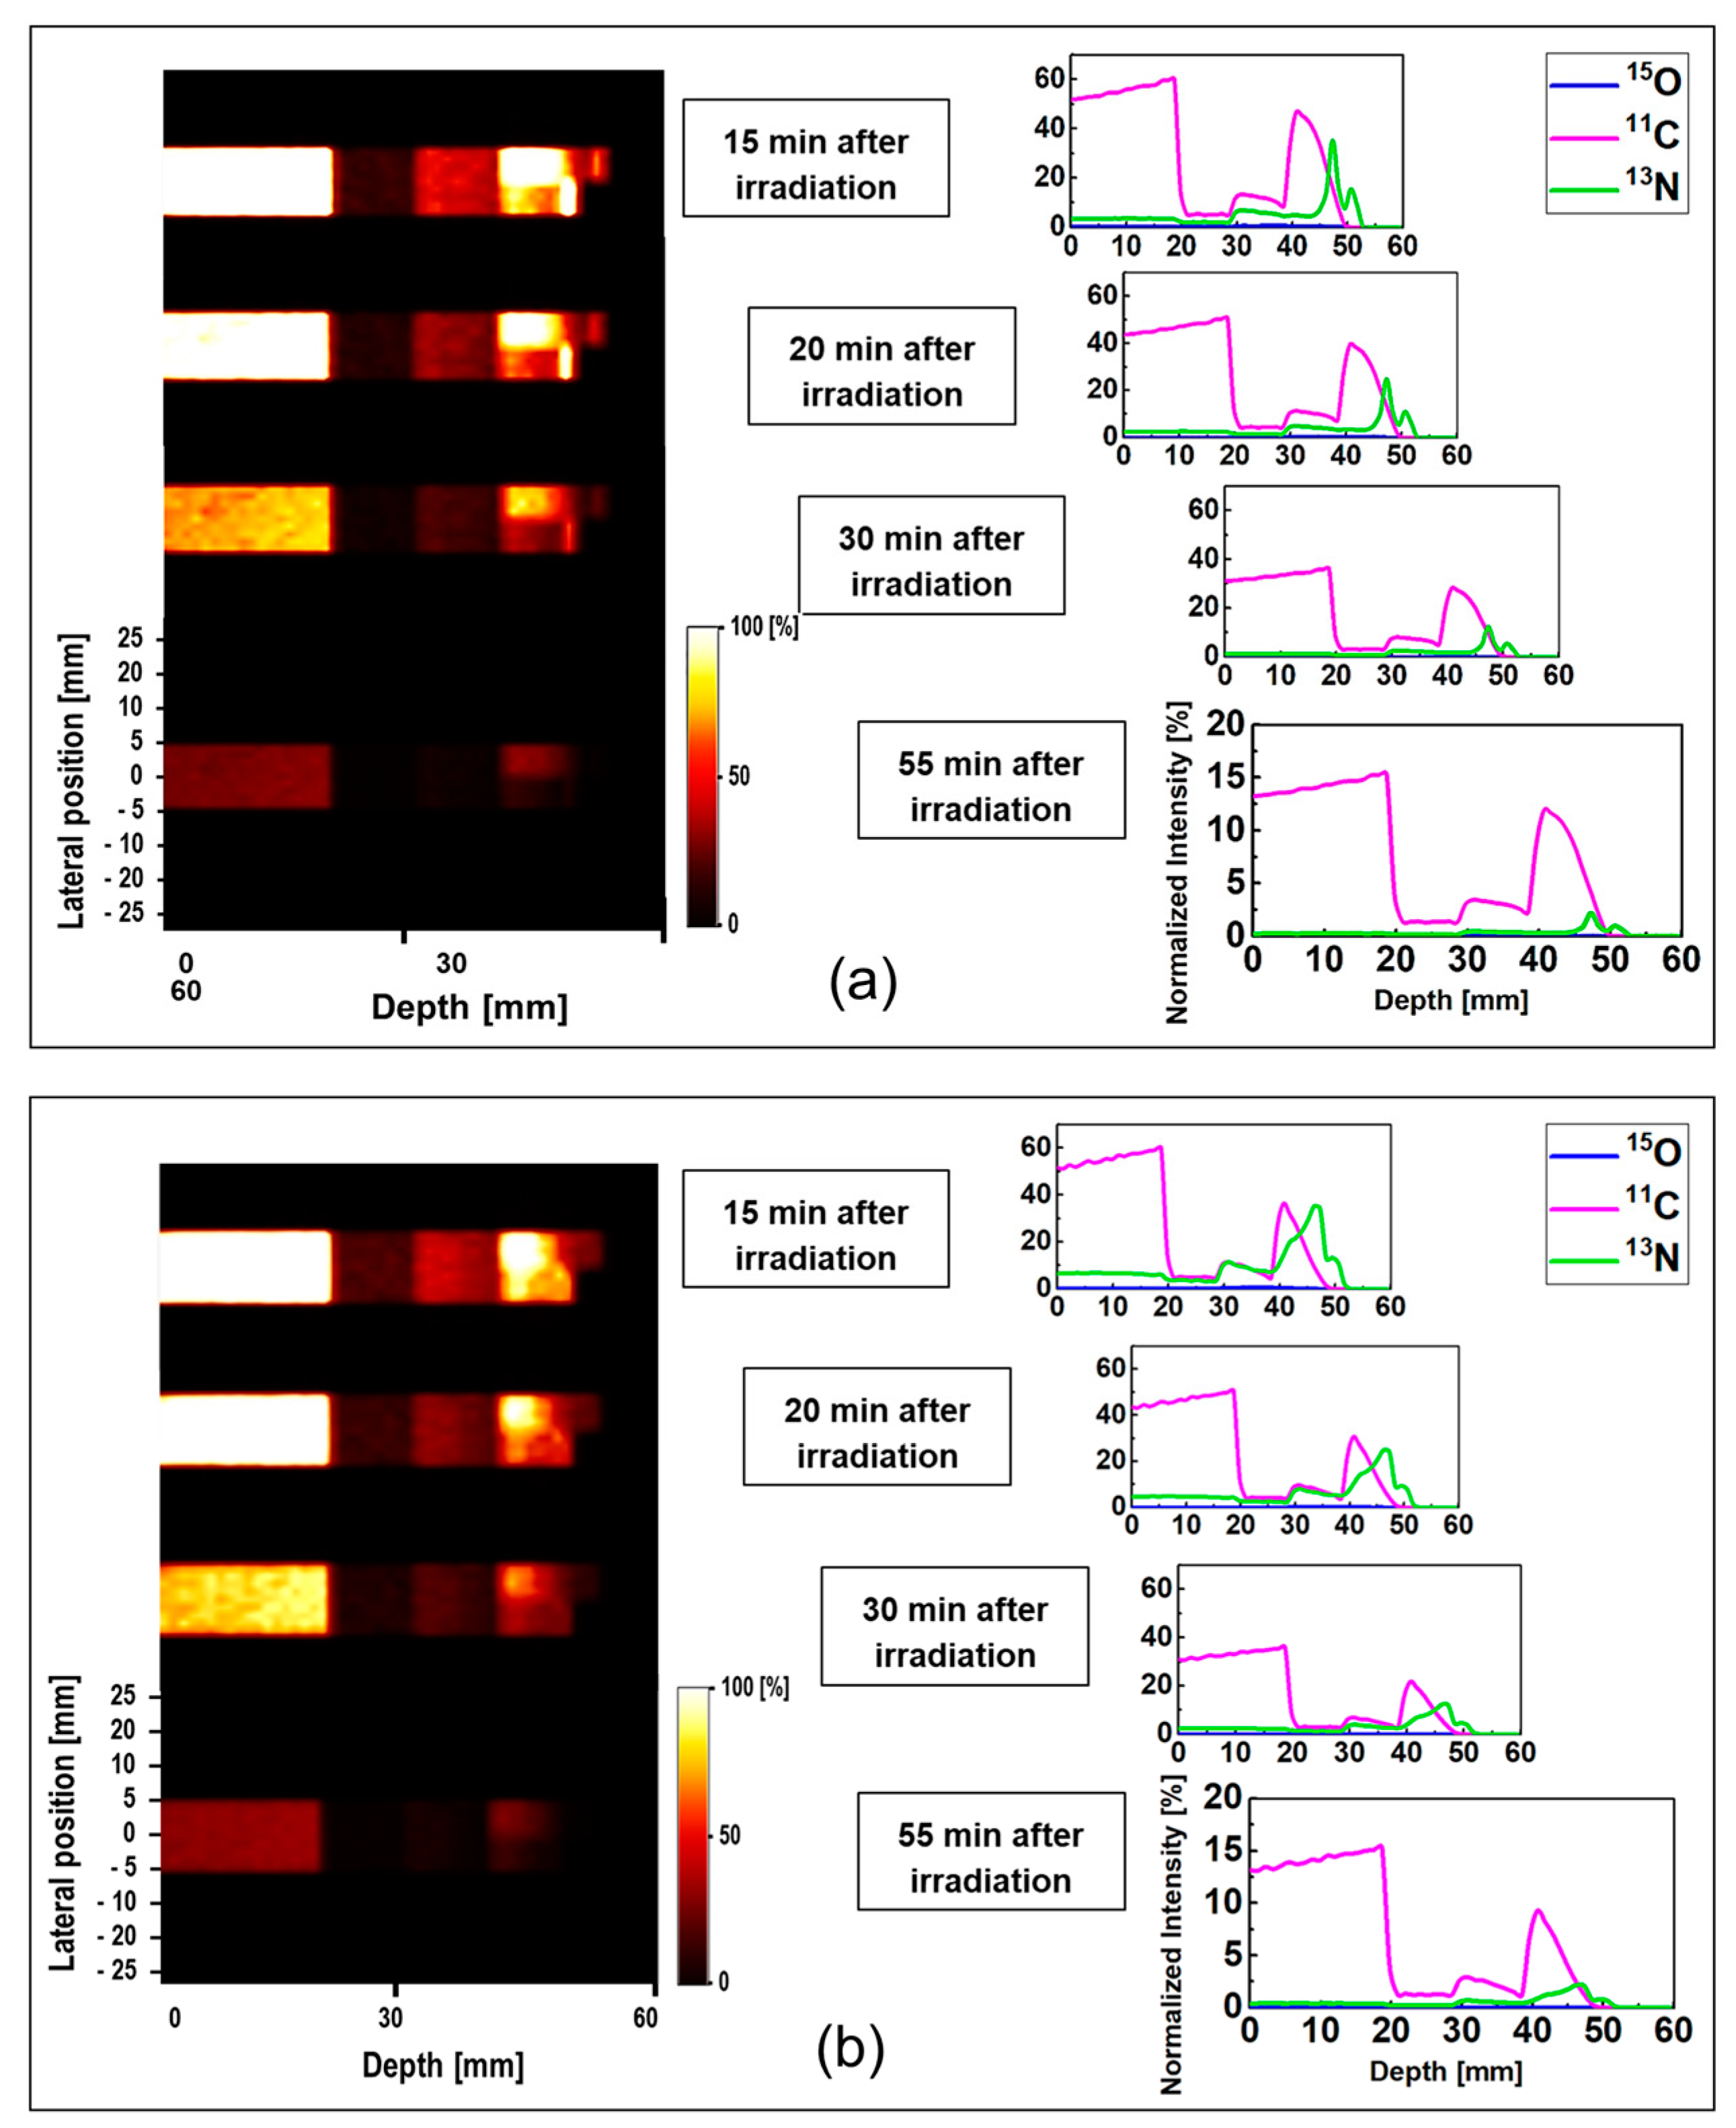
The obtained data for ordinary slab and MIRD anthropomorphic phantoms was converted into time-course images; this can be helpful for lengthy data acquisition process in realistic PET experiments. The 1D and 2D time-course activity in the time range of 15 to 55 min for
15O,
11C, and
13N positron emitting radionuclides in the ordinary slab phantom is shown in
Figure 6. The results for the pristine and SOBP beams are shown in
Figure 6a,b. The
y-axis of the 1D profiles was labeled as the relative intensity. Similar scaling factors as shown in
Figure 4 and
Figure 5 were used. In the time-course profile data of both pristine and SOBP beams, the relatively short-lived
15O spectrum with half-life of 2.03 min almost disappeared. The spectrum of
11C radionuclide was found to be dominant in both pristine and SOBP beams in the considered time frame of 15 to 55 min; this is mainly due to its long half-life of 20.33 min which would in fact remain detectable for rather a long time. The spectrum of
13N was found to be visible at higher depths and stayed detectable even up to 55 min after the proton irradiation. The
13N radionuclide has a half-life of 9.93 min which makes it detectable for quite some time after it fully decays.
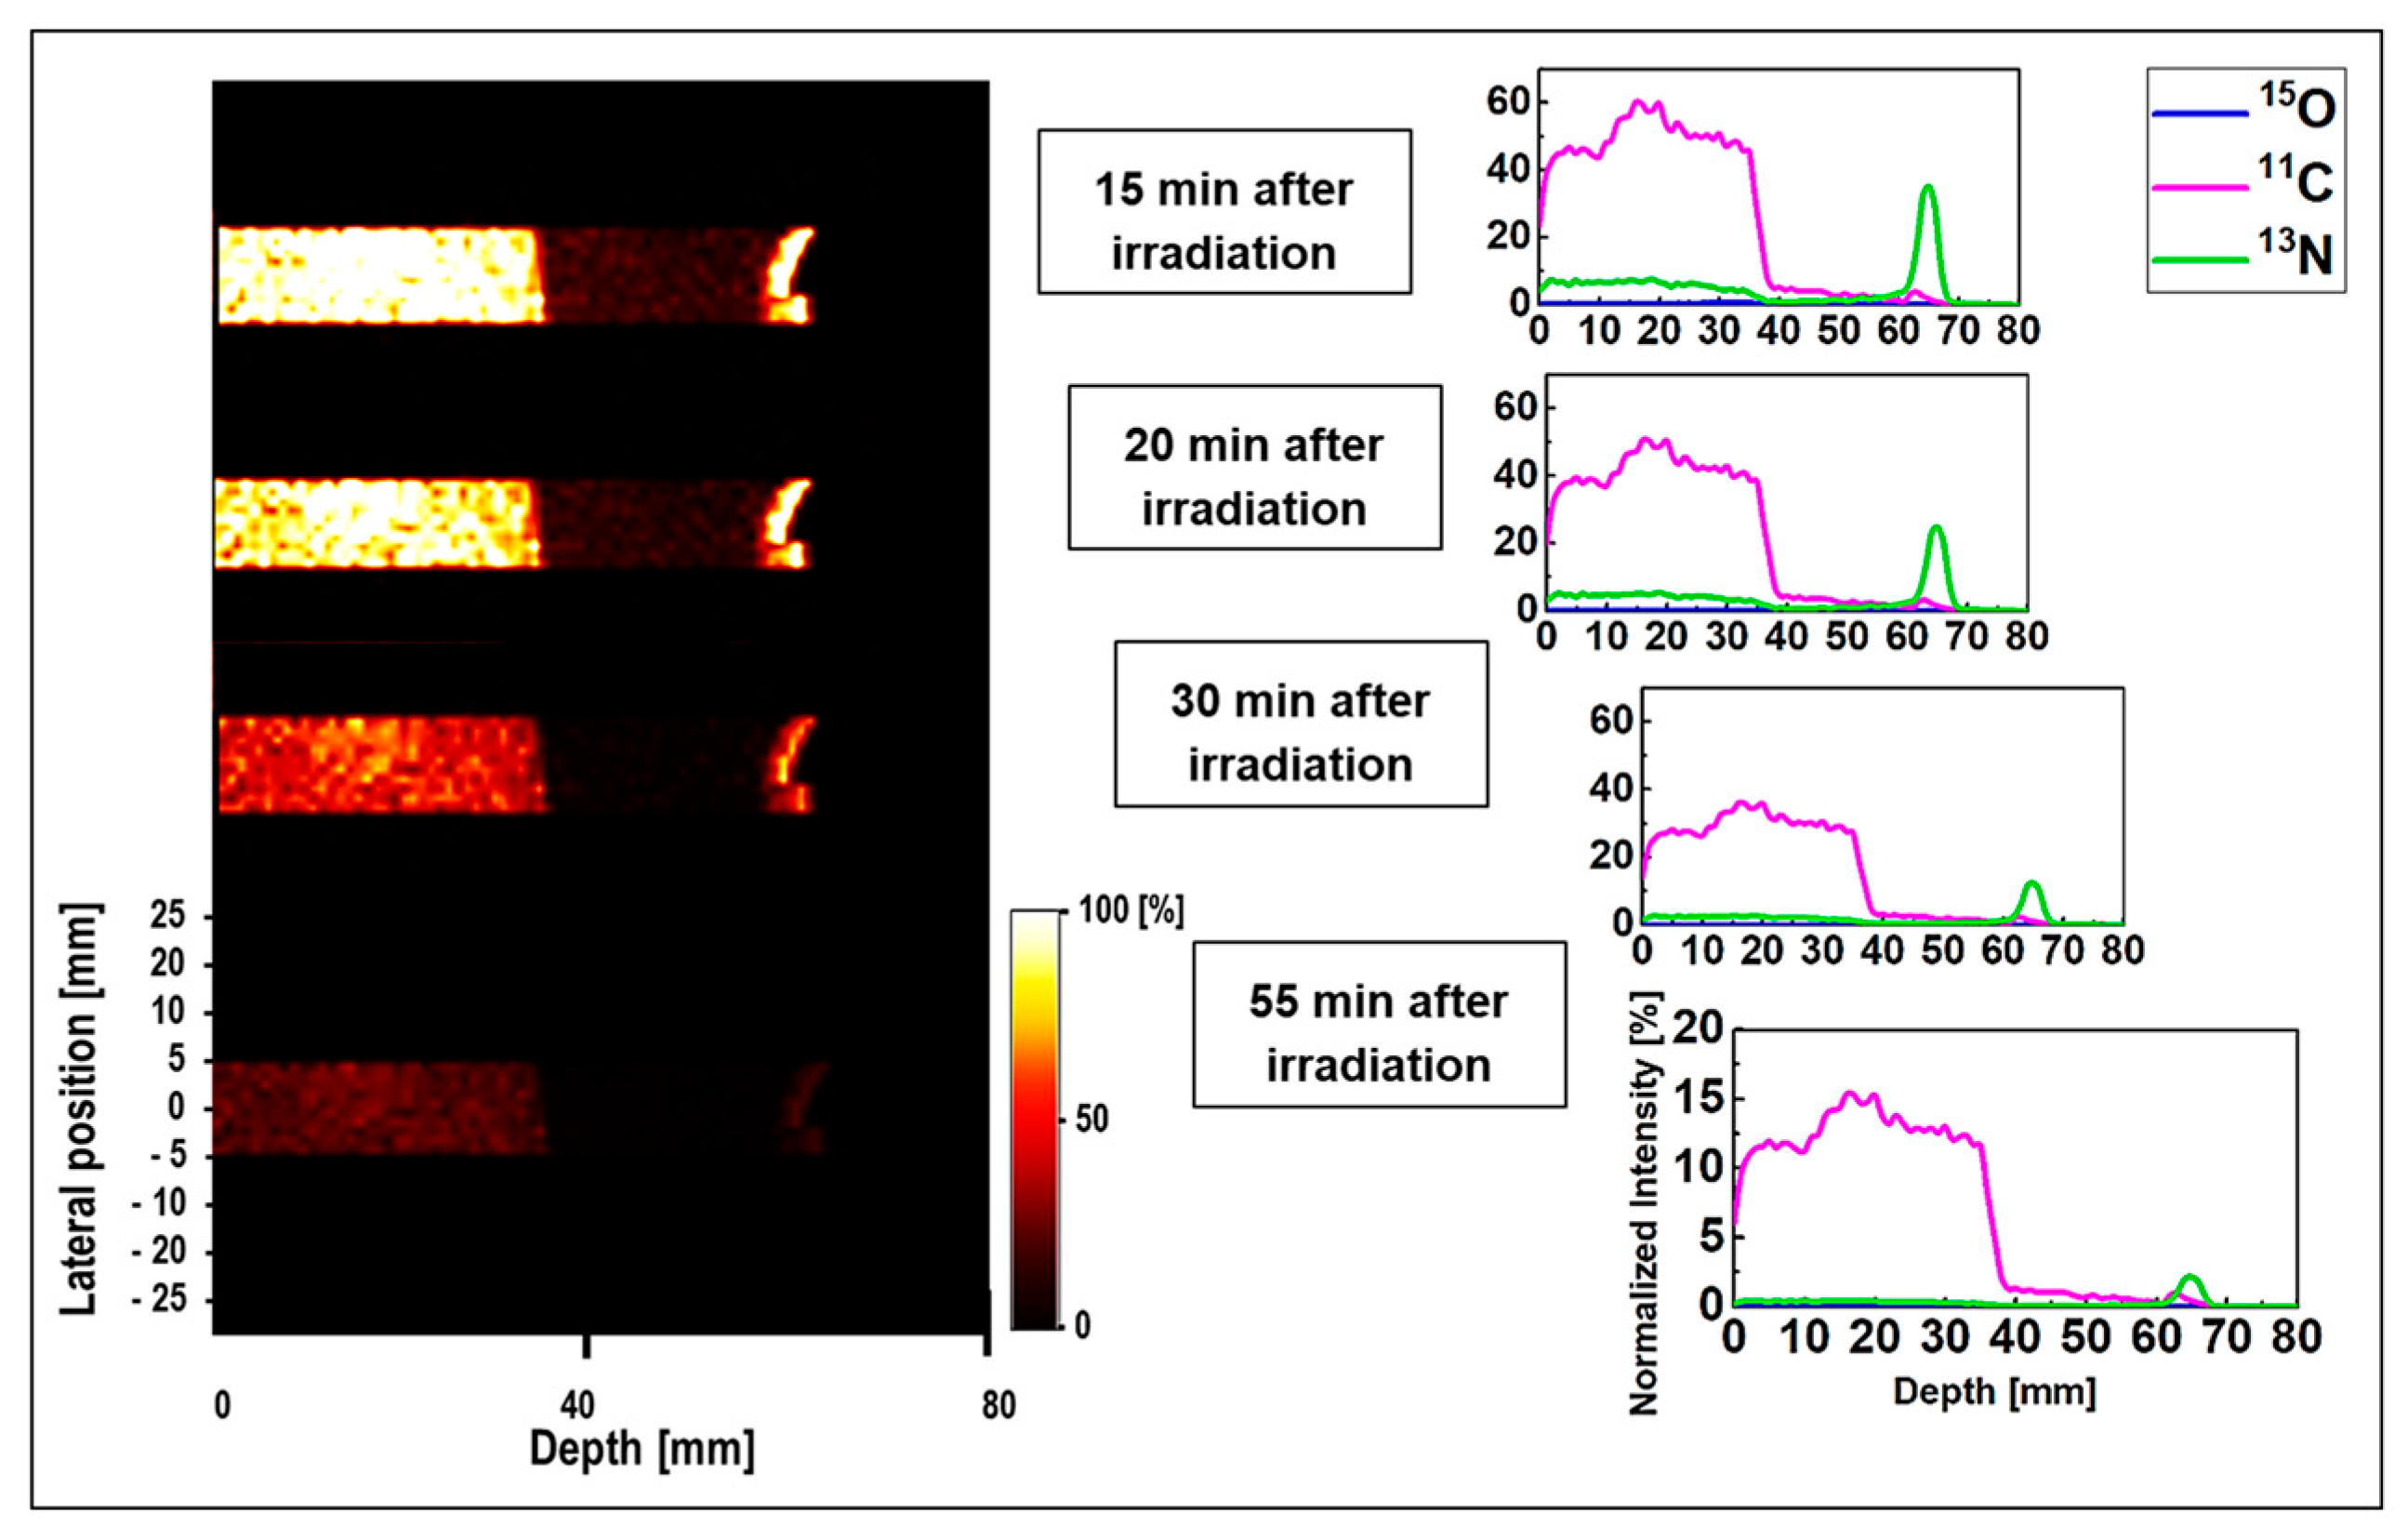
The 1D and 2D time-course activity in the time range of 15 to 55 min for
15O,
11C, and
13N positron emitting radionuclides in the MIRD anthropomorphic phantom is shown in
Figure 7. The
y-axis of the 1D profiles was labeled as the relative intensity. Similar scaling factors as shown in
Figure 4 and
Figure 5 were used. Similar to the time-course activity of ordinary slab phantom shown in
Figure 6, the relatively short-lived
15O positron emitting radionuclides were vanished 15 min after the irradiation and was not visible for longer time frames (i.e.,
t > 15 min). The spectrum of
11C radionuclide was also found to be dominant in MIRD anthropomorphic phantom, as discussed this is mainly due to its long half-life of 20.33 min. However, the interesting difference in the spectrum of
11C in ordinary slab and MIRD anthropomorphic phantoms is the shape of this spectrum. The shape of
11C spectrum is rather more complex in the ordinary slab phantom mainly due to presence of multiple domains with different sizes and material compositions. However, for the MIRD anthropomorphic phantom, the geometrical changes along the incident proton beam in more subtle given that protons experience lesser geometrical and chemical composition changes along their track when passing through thin layer of skin, soft tissue, and ribs, to reach the tumor region. Similarly, the spectrum of
13N was found to be visible at higher depths and stayed detectable up to 55 min after the proton irradiation (see
Figure 7). These results show that it would be possible to detect
13N peak for proton range verification in realistic clinical applications by deconvoluting signals from different positron emitting radionuclides using our proposed SA technique.
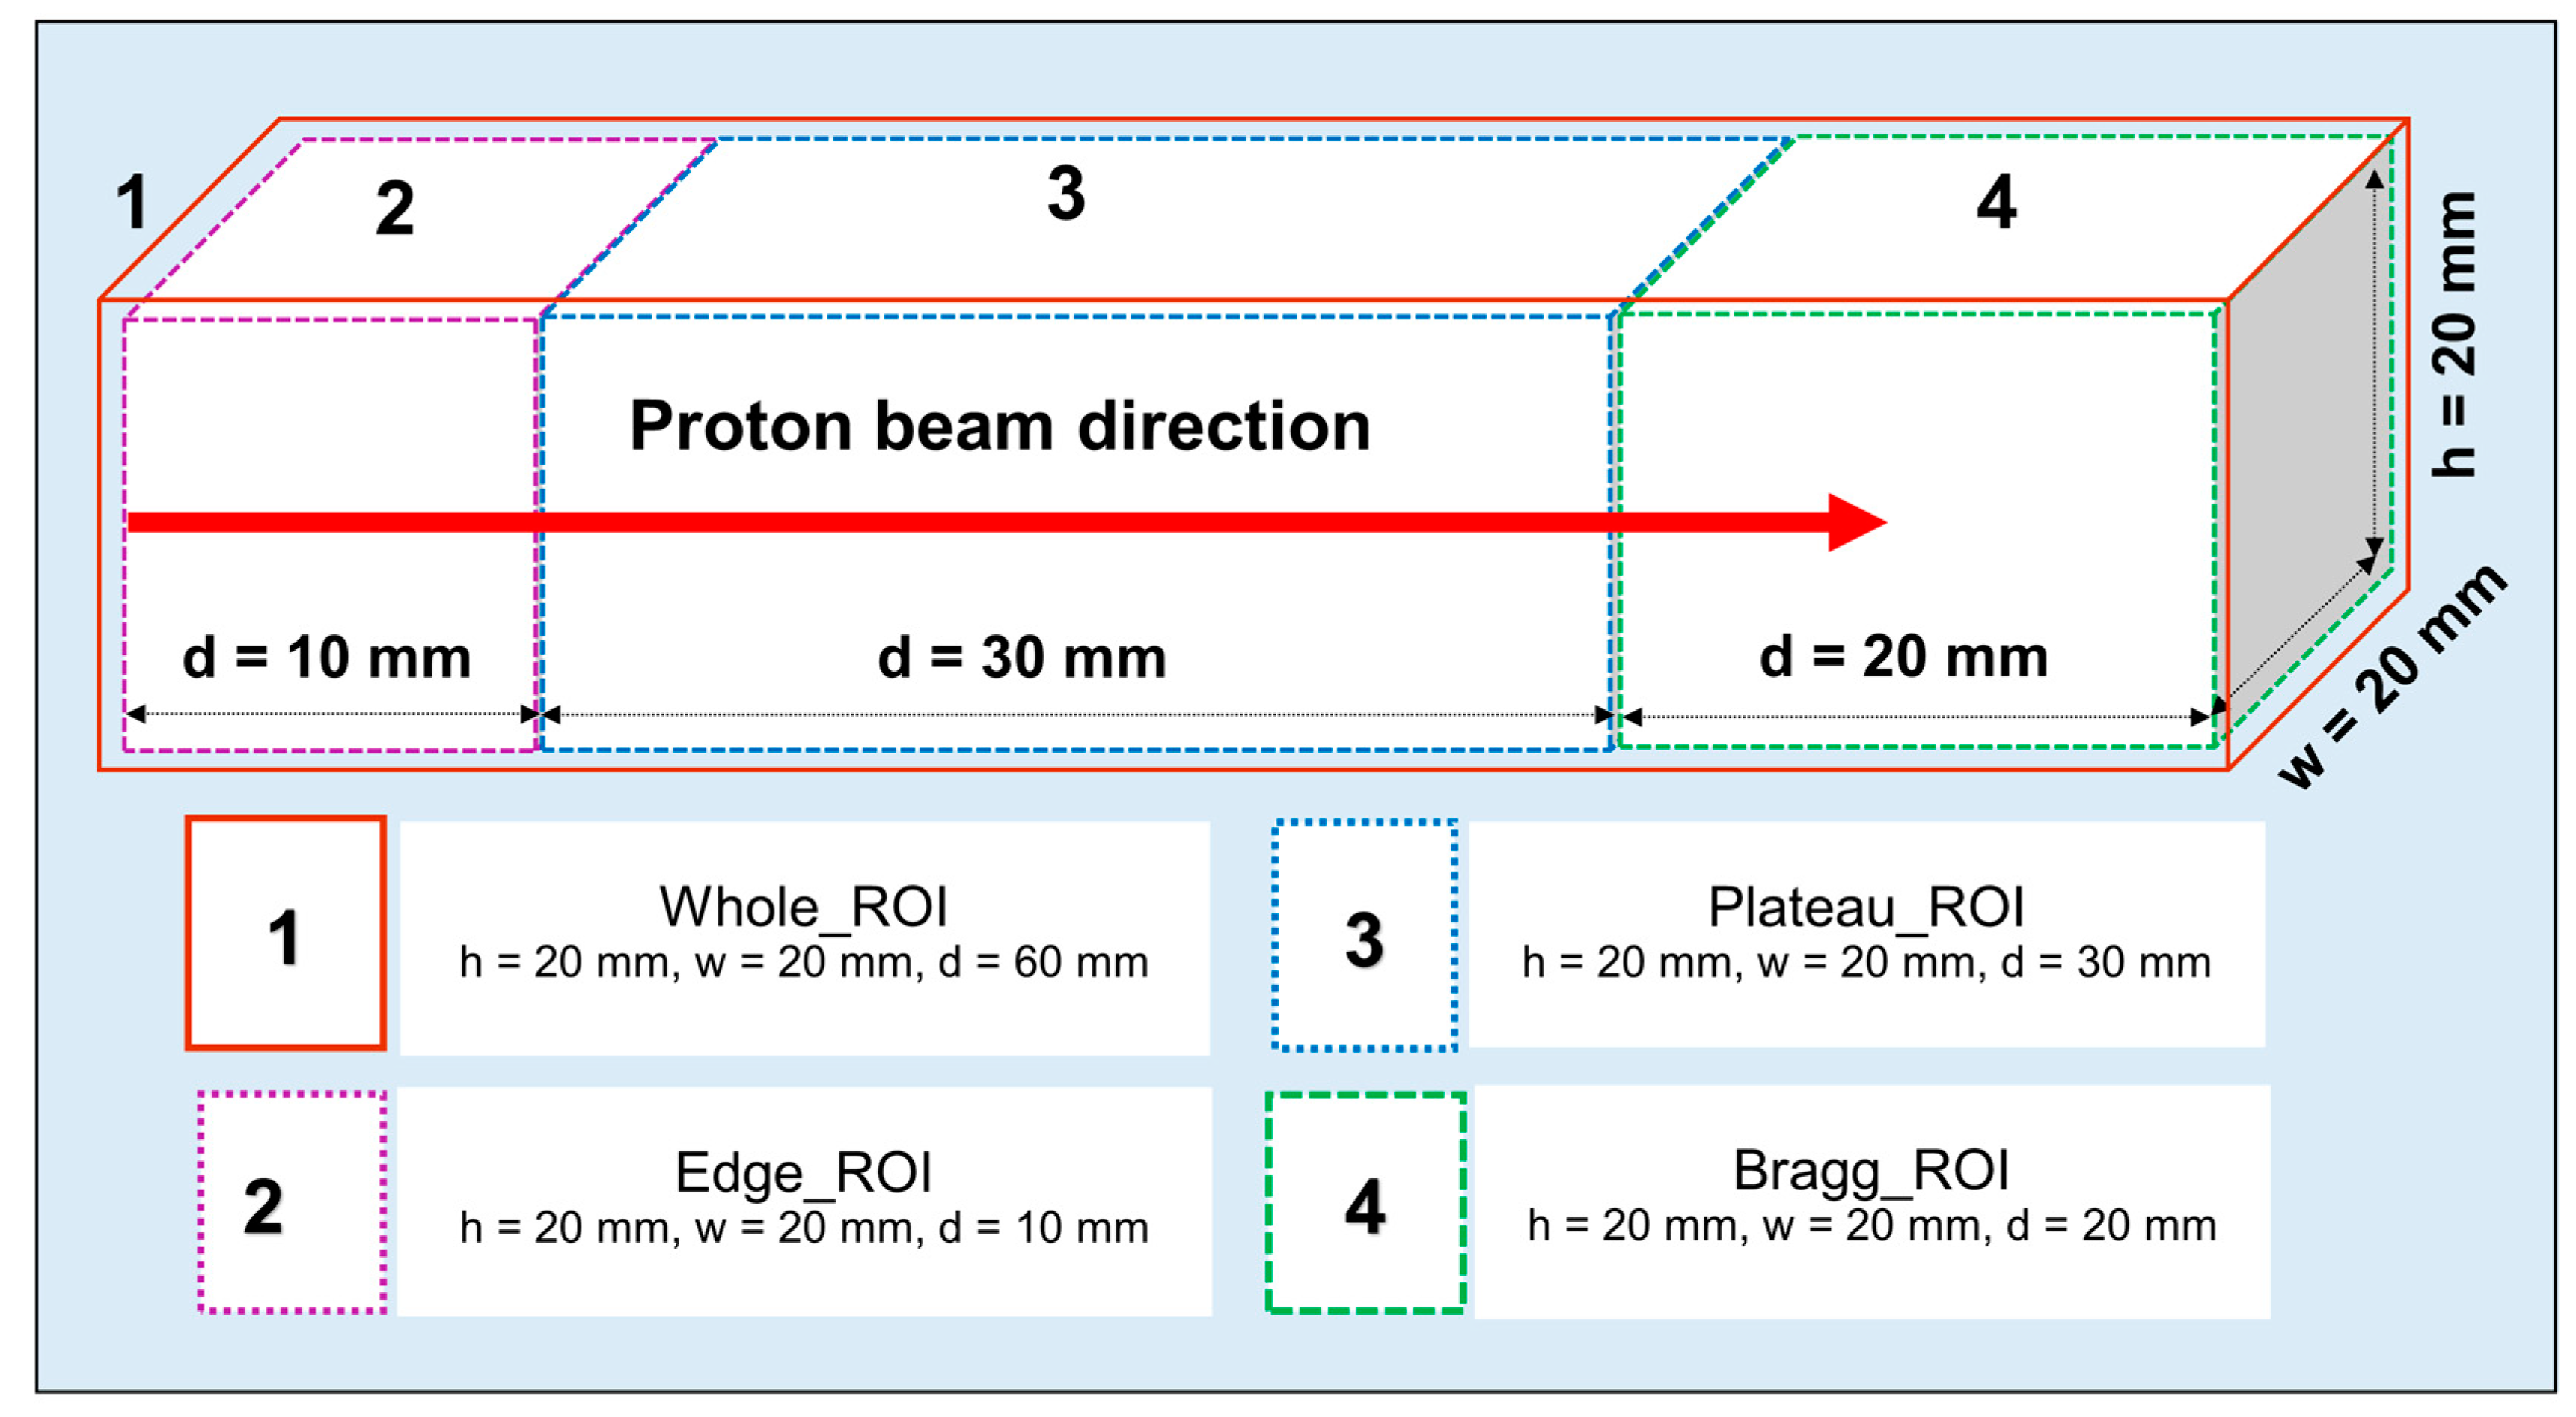
The SA technique was applied to the time-course dataset (from 15 to 55 min after irradiation) to predict the half-life of each positron emitting radionuclides present in the realistic PET measurements; this would be particularly useful for experimental investigations to identify and distinguish different radionuclides generated as a result of proton irradiation. The obtained results from the SA approach at different ROIs introduced in
Figure 3 are shown in
Figure 8a–c. The
x- and
y-axis, shown in
Figure 8, represent the extracted half-life and normalized counts, respectively. The contribution from
11C positron emitting radionuclides that have relatively longer half-life compared to other generated radionuclides, found to be dominant in whole, edge, and plateau regions. The contribution from
15O and
13N radionuclides in whole, edge, and plateau regions, were found to be smaller than that of
11C. However, the contribution from
13N positron emitting radionuclides in the Bragg peak ROI was found to be dominant. This trend was observed for both ordinary slab (for both pristine and SOBP beams) and MIRD anthropomorphic phantoms. The present method is not only limited to the ROIs shown in
Figure 3; in fact, users can apply this technique to any desired region in their offline PET experiments. The distribution was calculated using value of each voxel present in the considered region. The component of zero half-life implies background count or offset and does not represent any realistic radionuclides.
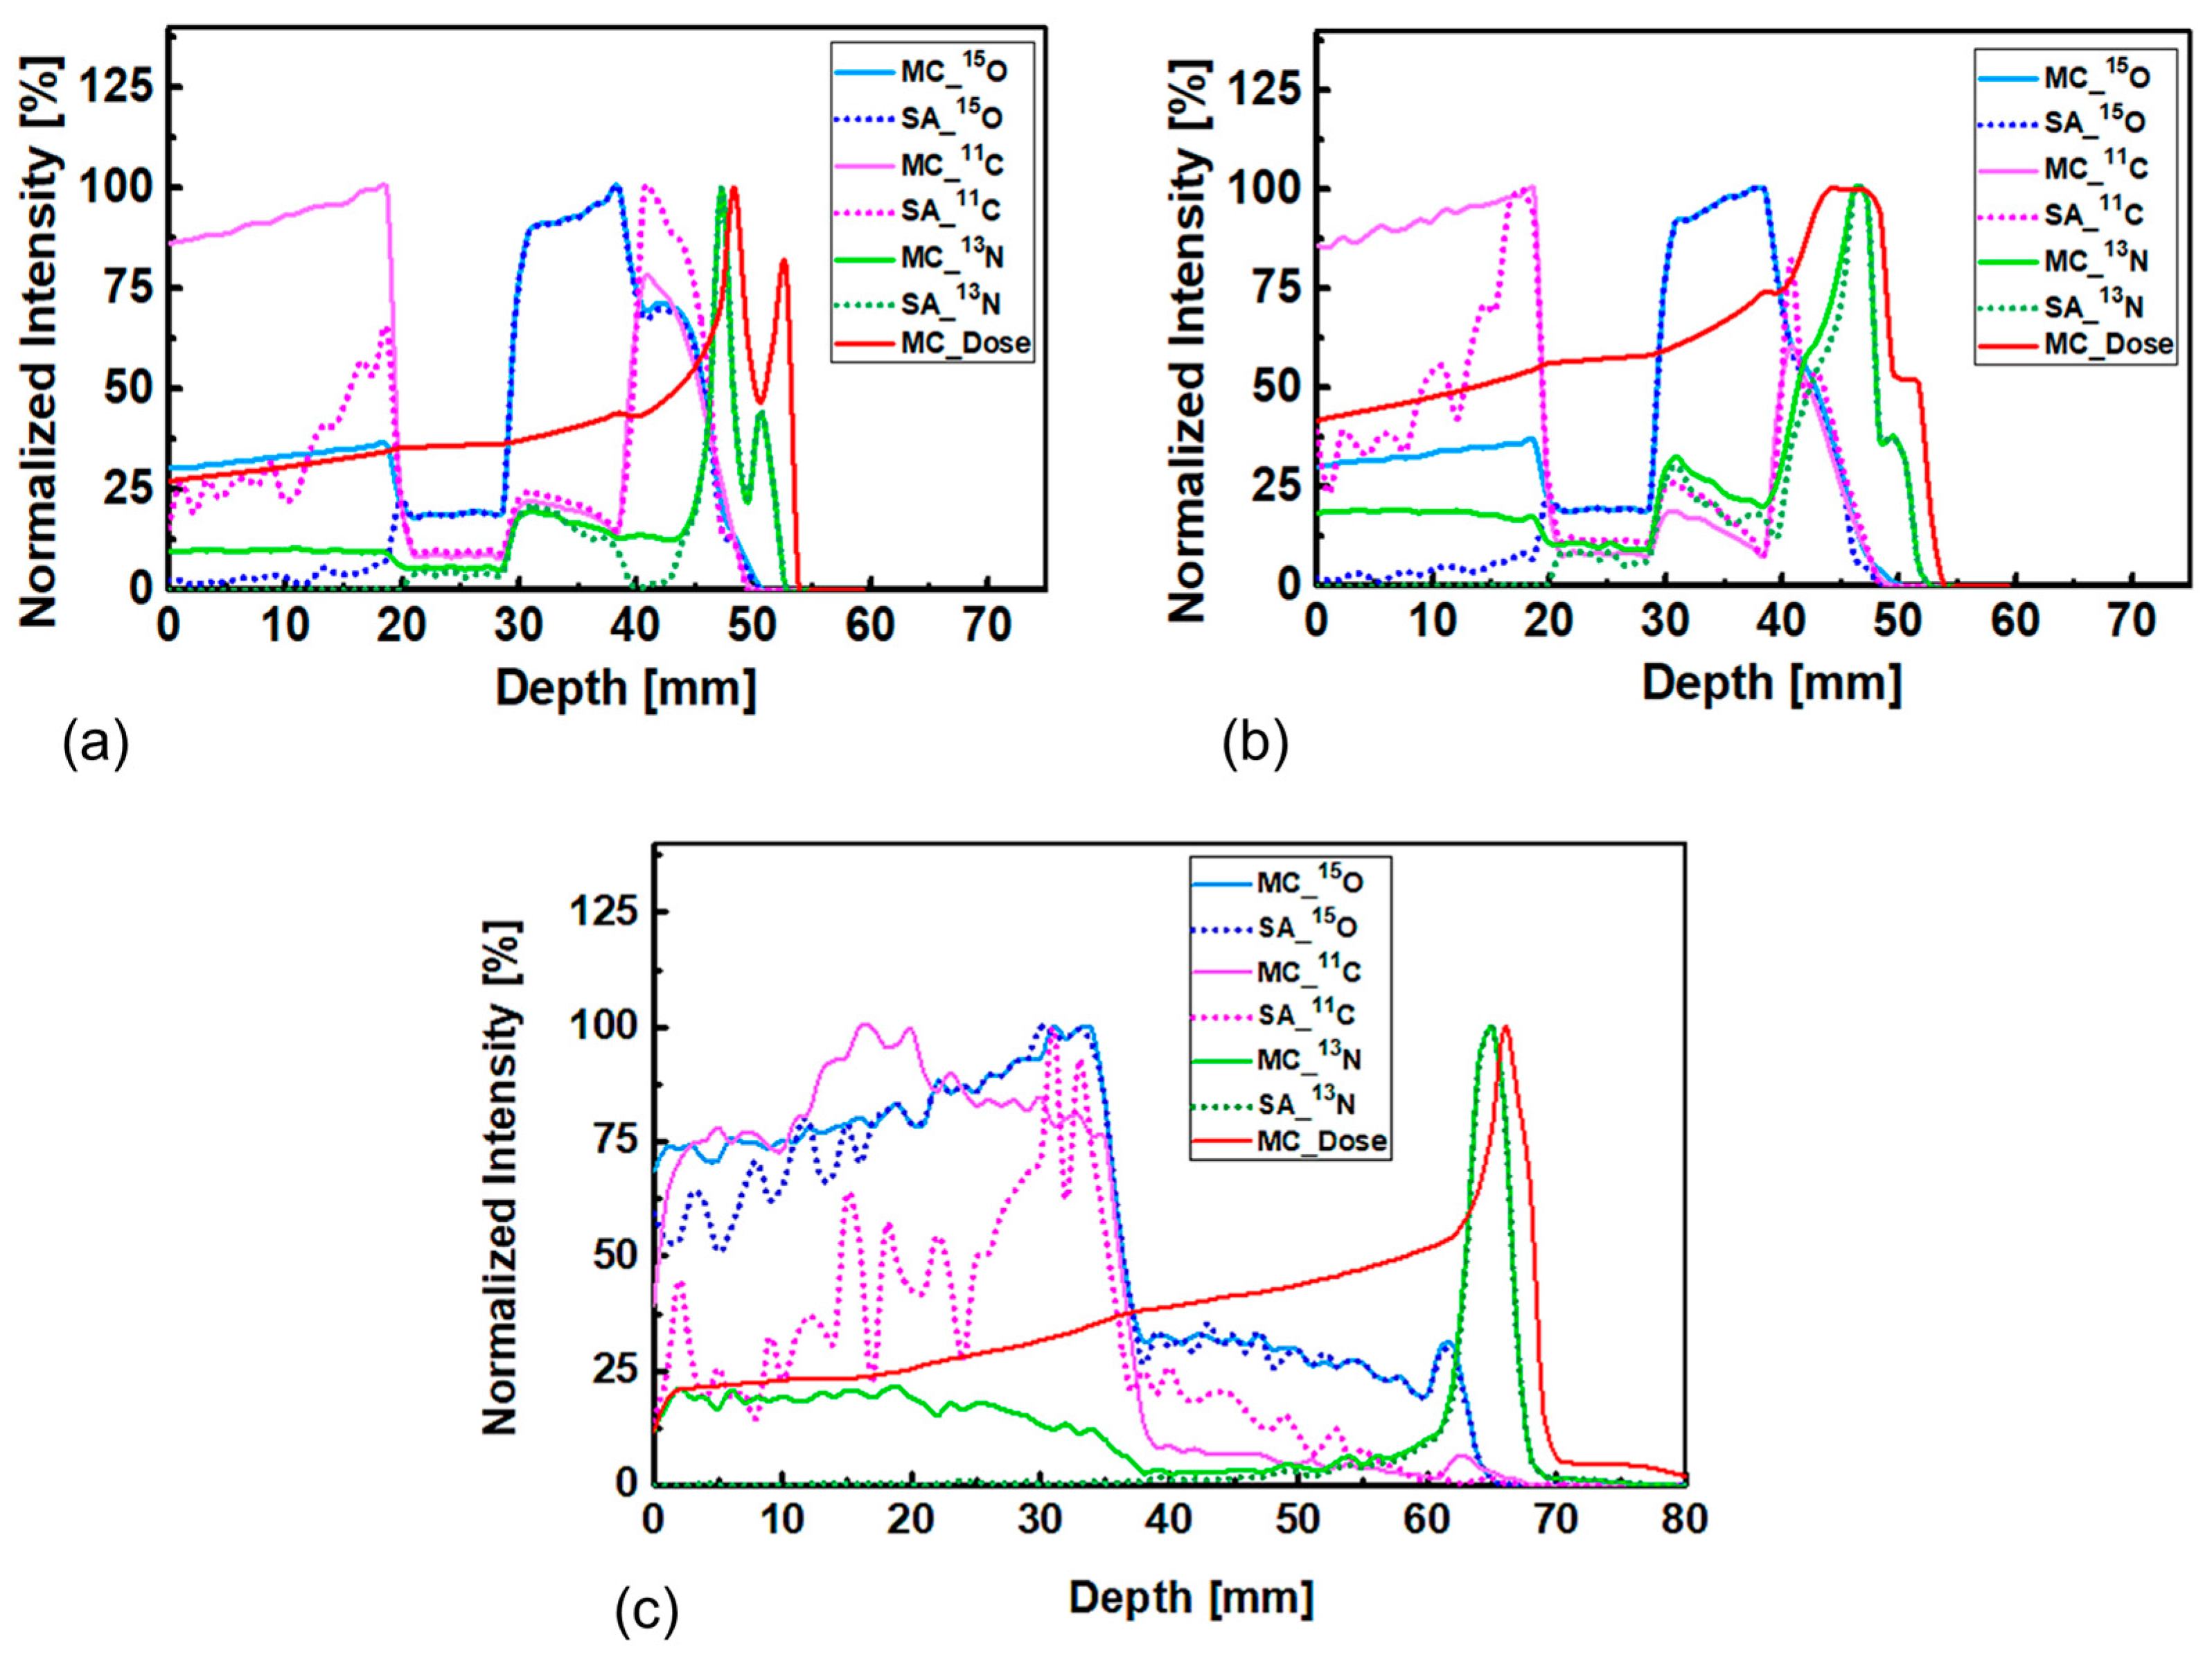
The results shown in
Figure 9a,c show the comparison between the activity of positron emitting radionuclides obtained from MC and SA methods. The comparison between the pristine and SOBP beams for ordinary slab phantom is shown in
Figure 9a,b, respectively. This comparison between the activity of positron emitting radionuclides obtained from the MC and SA methods for MIRD anthropomorphic phantom is shown in
Figure 9c. The estimated results from the MC and SA methods are in good agreement, particularly for the
13N positron emitting radionuclide that would be used for proton range monitoring and verification. Some degree of discrepancies between the activity of positron emitting radionuclides obtained from the MC and SA methods can be observed at lower depths; this is mainly due to very close contribution from positron emitting radionuclides (
15O,
11C, and
13N) at the entrance region where incident proton beam initially interacts. The SA method experiences difficulties in accurately separating these at the entrance region, however the estimations from the SA approach improve at higher depths. From the results shown in
Figure 9, it can be concluded that the predicted
13N radionuclide peak using the SA method is close to the peak determined by the MC method, which in turn would be close to the actual Bragg peak (~1 mm). Therefore, the SA method found to be feasible to predict activity distribution of positron emitting radionuclides when applied to the ordinary slab and MIRD anthropomorphic phantoms.
The average relative error obtained from our MC computations for deposited proton dose in ordinary slab phantom and MIRD anthropomorphic phantom found to be less than 0.002 and 0.006, respectively. The average relative error for obtained 13N production found to be less than 0.0835 and 0.17 in ordinary slab phantom and MIRD anthropomorphic, respectively.
It is important to note that different radionuclides would have a different range in tissues, and this could in fact influence real PET measurements. In addition, at the interface zone between two different materials, the PET system with higher resolutions would be useful when trying to determine the emission from different positron emitting radionuclides. The optimal PET system for the range monitoring of proton therapy must have: (1) high sensitivity to detect activated positron emitters; (2) handling dynamic data to process using the SA; (3) flexible geometry to position PET detectors near to any irradiated areas; and (4) resistance against high radiation background. The dual-head positron emission mammography system is one candidate to fulfill these conditions.


 ,
, 


