Article

Assessment of Aircraft Engine Blade Inspection Performance Using Attribute Agreement Analysis

Department of Mechanical Engineering, University of Canterbury, Christchurch 8041, New Zealand
*
Author to whom correspondence should be addressed.
Safety 2022, 8(2), 23; https://doi.org/10.3390/safety8020023
Submission received: 31 December 2021 / Revised: 22 March 2022 / Accepted: 25 March 2022 / Published: 29 March 2022

Abstract

:
Background—Visual inspection is an important element of aircraft engine maintenance to assure flight safety. Predominantly performed by human operators, those maintenance activities are prone to human error. While false negatives imply a risk to aviation safety, false positives can lead to increased maintenance cost. The aim of the present study was to evaluate the human performance in visual inspection of aero engine blades, specifically the operators’ consistency, accuracy, and reproducibility, as well as the system reliability. Methods—Photographs of 26 blades were presented to 50 industry practitioners of three skill levels to assess their performance. Each image was shown to each operator twice in random order, leading to N = 2600 observations. The data were statistically analysed using Attribute Agreement Analysis (AAA) and Kappa analysis. Results—The results show that operators were on average 82.5% consistent with their serviceability decision, while achieving an inspection accuracy of 67.7%. The operators’ reproducibility was 15.4%, as was the accuracy of all operators with the ground truth. Subsequently, the false-positive and false-negative rates were analysed separately to the overall inspection accuracy, showing that 20 operators (40%) achieved acceptable performances, thus meeting the required standard. Conclusions—In aviation maintenance the false-negative rate of <5% as per Aerospace Standard AS13100 is arguably the single most important metric since it determines the safety outcomes. The results of this study show acceptable false-negative performance in 60% of appraisers. Thus, there is the desirability to seek ways to improve the performance. Some suggestions are given in this regard.

Graphical Abstract

1. Introduction

Although the number of aircraft accidents declined over the last 50 years, operational safety and aircraft reliability remain a major concern. Maintenance plays a crucial role in assuring safe aircraft operation. It contributes to 27.4% of fatalities and 6.8% of incidents according to the Federal Aviation Authority (FAA) [1], with increasing tendency [2]. The International Air Transport Association (IATA) stated that maintenance errors are among the top three causes for aircraft accidents [1,3]. This aligns to the findings of Allan and Marx [4], who reported maintenance errors as the second largest contributor to fatal accidents. Marais [1] stated that 31% of maintenance component failures involved the engine, which is supported by two UK Civil Aviation Authority (CAA) studies [5,6] that found that powerplant (engine) failures were the second most common area for maintenance error. A recent study by Insley and Turkoglu [7] on maintenance-related accidents and incidents found that loss of thrust, engine cowling separation, engine fire, uncontained engine failure, and engine separation from aircraft are among the top ten causes for such events. Hence, aero engines undergo regular maintenance, repair and overhaul (MRO) to detect any defects at the earliest stage before they can propagate and cause negative outcomes. The most critical and rejected parts during maintenance are engine blades [8], as they are exposed to high rotational speeds, vibrations, high temperatures (turbine section), and foreign object damage (compressor section) [9,10,11,12].
The first and most important mean of blade assessment in engine maintenance is by visual inspection, which accounts for 90% of all inspections [13]. Operators inspect each part for anomalies and make a serviceability decision whether the blade conforms to the specification, i.e., whether the blade is acceptable or must be removed from service. Visual inspection can be highly repetitive and tedious, but complex and difficult to perform at the same time, due to the inspection environment and variety of defects [14,15]. Since the inspection is predominantly performed by inspectors, it is prone to human error and entails the risks of slips, lapses and mistakes [16,17].
There are two types of incorrect serviceability decision in inspection: (a) rejecting a serviceable, non-defective part (false positive), and (b) accepting an unserviceable, defective part (false negative). False positives, while not desirable, have generally no negative effect on safety, but can introduce a financial burden for committing an engine to a costly tear-down and removing a good part from service, undergoing unnecessary repair work [18], see also [19] for avionics. Raza and Ulansky [19] state that the false-alarm rate in aviation can reach up to 30%. False negatives, on the other hand, have grave implications for flight safety, i.e., a missed defect can propagate towards part failure and cause severe damage to the engine and aircraft, and harm to passengers [10,20,21,22]. Inadequate inspection was the second most common maintenance error and caused 18.1% of maintenance-related accidents and serious incidents [7]. More specifically, in 7.2% of the cases the inspector missed the defect (search error), while in 4.5% of the time the inspection carried out was insufficient. The third most common maintenance error, accounting for 4.1%, was the release of a non-airworthy part back to service (decision error). In 2.3% of the time, the inspection was not undertaken. False negatives can also impose a significant financial cost to airlines, since it is estimated that maintenance errors cause 50% of flight delays and cancellations due to engine problems [22,23]. Thus, the aircraft MRO system generally aspires to vigilance against false negatives on safety grounds, while accepting that there may be a slightly heightened rate of false positives as a consequence.
Hence, there is a need to better understand the reliability of the inspection system, specifically of the human operator. Previous studies showed system reliabilities of 36.7% to 83.3% and Kappa values of 0.45 to 0.91 [24,25,26,27]. However, the inherent variability of inspection systems in a maintenance environment has yet not been quantified. This paper aims to assess the human performance in terms of inspection accuracy, consistency, reproducibility, and reliability, applying Measurement System Analysis (MSA) for statistical assessment of the data. Inspection accuracy measures the correctness of the serviceability decision, i.e., does the operator find all defects, while accepting all airworthy parts? The inspection consistency describes the operator’s ability to make the same serviceability decision when inspecting the same part twice. The reproducibility of the inspection system refers to the unified agreement between two or more operators when inspecting the same part. The agreement of all operators with the ground truth is defined by the system reliability. All four measures are important for the assessment of the inspection system as they can identify any inherent problems that must be addressed. It might be used as a baseline for assessing the effectiveness of future improvement efforts, such as better training, enhanced processes, and implementation of advanced technologies to assist the human operator [28].

2. Literature Review

A variety of quality systems exist in aviation maintenance [29]. A key principle in all quality systems is a factual approach to decision making, and this requires measurement and instrumentation [30]. Moreover, consistency of processes is always essential, and this is complicated by human processes, especially where decisions require an element of judgement. These requirements need to be satisfied in a systematic way. Measurement System Analysis (MSA) is a structured procedure that is widely applied to assess the quality of measurement and inspection systems [31]. A measurement system is defined as “combination of people, equipment, materials, methods and environment involved in obtaining measurements” [31]. In MSA, the people under examination are commonly referred to as appraisers, assessors, inspectors, or operators [32,33,34].
The two main MSA methods are (a) Gauge Repeatability & Reproducibility (Gauge R&R) study and (b) Attribute Agreement Analysis (AAA), also known as Pass/Fail study or Agreement between Assessors (AbA) [35]. Both approaches aim to assess the consistency (agreement within appraisers), accuracy (appraiser agreement with ground truth), reproducibility (agreement between appraisers), and overall accuracy (agreement of all appraisers with ground truth) [35,36]. Gauge R&R is used when the measurement is a numerical value on a continuous scale such as time, weight, dimensions, pressures, or temperatures. Attribute Agreement Analysis in contrast is applied when the scale is discrete and has two or more categories, e.g., in the case of go/no-go or pass/fail decisions.
Traditionally, MSA has been applied to manufacturing to assess any variation in the measurement system, including operators [25,26,37], machines and equipment [38,39], and procedures [27]. However, the general principles of MSA are not limited to manufacturing but can also be applied to many other domains such as healthcare. In the latter, MSA has predominantly been used to assess the reliability of the medical instrumentation rather than the decision making of the medical doctor [32,34,40,41,42]. Furterer and Hernandez [32] applied AAA to assess the accuracy of pressure ulcer detection.
In the last decade, MSA has found versatile application in the aviation industry, from aircraft tyre pressure assessment [43] to assembly checks of aircraft engine exhaust nozzles [44]. However, all of the reviewed studies in aviation applied Gauge R&R [43,44,45,46,47,48] as opposed to Attribute Agreement Analysis, except for [49], which will be discussed later. Barbosa et al. compared the reliability of laser technology to the manual measurement of gaps in aircraft assemblies [45]. A study by Hawary et al. assessed the repeatability and reproducibility of a self-developed inspection system measuring the lead length of semiconductors [50]. The results showed a significant variance between different operators using the same equipment in the same operational environment. The potential sources for such variances and measurement errors were studied by Wang et al., who applied MSA to assess the reliability of crystal oscillators used in quality assurance of aerospace parts [48]. An interesting application of Gauge R&R is provided in the work of Fyffe et al. [46], who analysed variations in ignition performance and flame stability of several alternative jet fuels and compared the results to the performance of conventional jet fuel. This example shows that not only appraisers can be compared using MSA, but any ‘agents’ or options (in [46]: different types of jet fuel). Furthermore, the performance is not limited to measurement or inspection accuracy, but can assess any measurable performance such as flame stability [46].
Cotter and Yesilbas were the only researchers that applied Attribute Assessment Analysis to aviation to determine the classification reliability of pilots rating aircraft accidents [49]. The authors assessed the effect of training on the assessors’ performance and concluded that AAA might be a viable method for providing feedback. Outside the aviation industry, previous studies evaluated the reliability of inspection systems in manufacturing using AAA, e.g., for inspection of electronic circuit boards and chips [33,37], tablets [38], steel chains [26], car lights [27], and airbags [25]. In specific ways, there may be differences between manufacturing and maintenance inspections. Specifically, in manufacturing, the parts are in new condition and inspected for manufacturing defects, thus one part resembles the other. This is different to a maintenance environment, specifically aviation MRO, where engine parts are in various conditions, e.g., different levels of dirtiness depending on the operating environment and airborne particles. Moreover, there is a variety of different defect types and manifestations thereof that can occur, with no defect looking like the other. In manufacturing the defects are much more in control, and likely to occur in predictable locations, compared to maintenance.
The literature review identified several gaps in the body of knowledge. First, no work was found that applied AAA to maintenance activities. We speculate that the lack of application of AAA to maintenance may be due to manufacturing having need for a measurement, whereas the maintenance perspective seeks to categorise defects. Furthermore, the reliability of visual inspection was previously assessed in other sectors such as the automotive industry, e.g., for inspection of car lights. In aviation however, the safety implications of inspections might be different. Thus, there was a need to understand the reliability, repeatability and consistency that can be expected in high reliability organisations such as aviation, where human operators know the adverse consequences their decision could have. Finally, the effect of the study size (number of appraisers) on the attribute agreement results was not analysed previously. This could be useful for researchers and industry practitioners when designing future AAA studies, independent of the area under examination. This paper contributes towards a better understanding of the human performance, specifically in maintenance and visual inspection, by addressing the identified gaps.

3. Materials and Methods

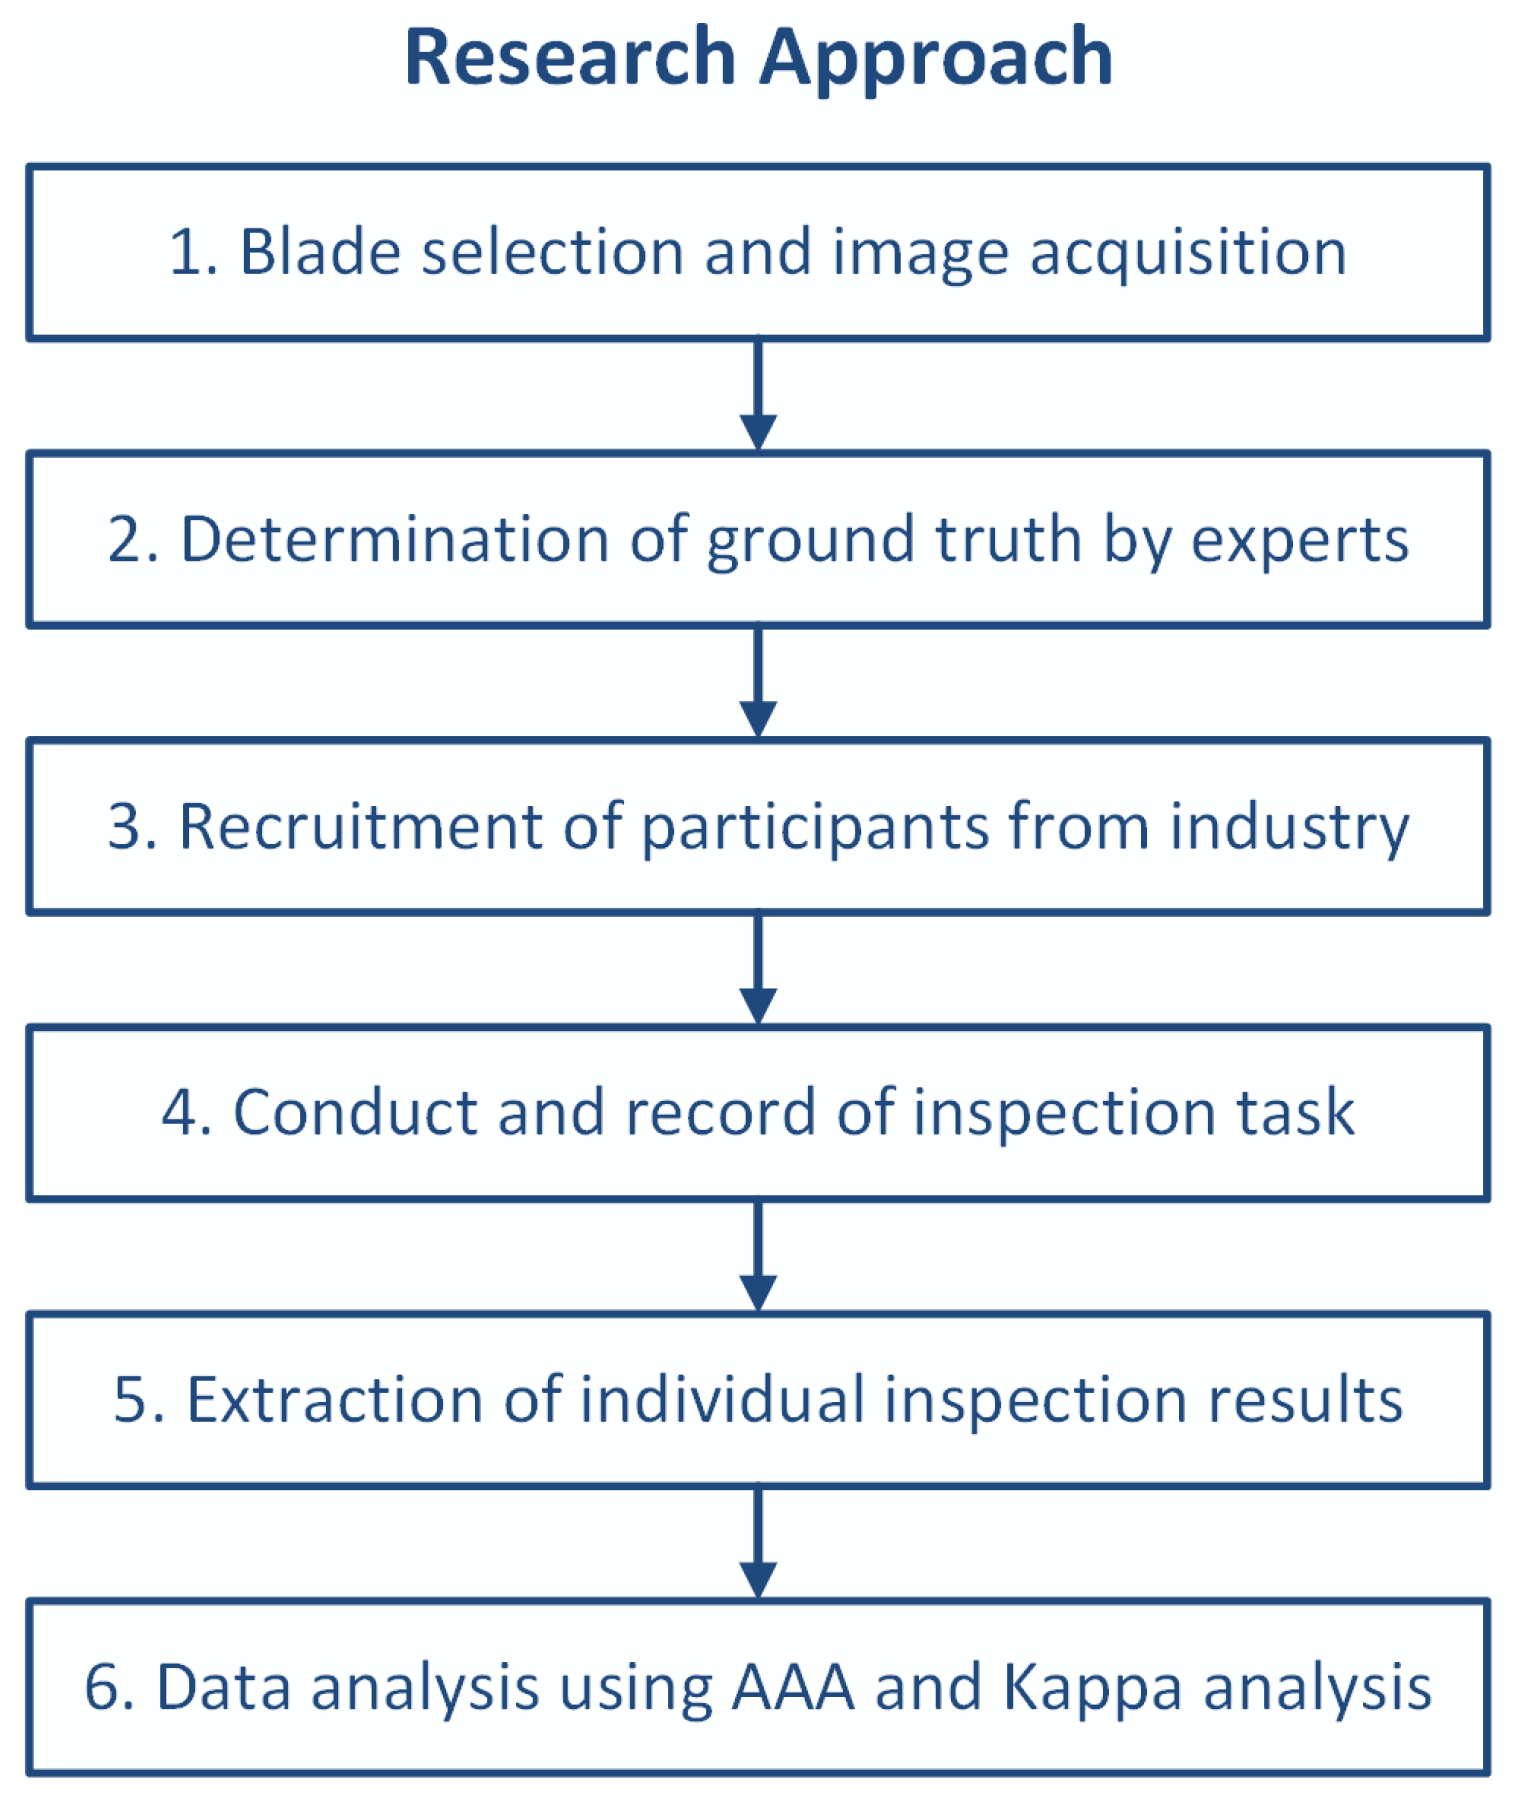
3.1. Research Objective and Methodology

The purpose of this research was to assess the human performance in the visual inspection of aero engine blades. Specifically, discussions with industry identified the need to understand how reliable the current inspection system is and how accurate the serviceability decisions are. The four research questions were:
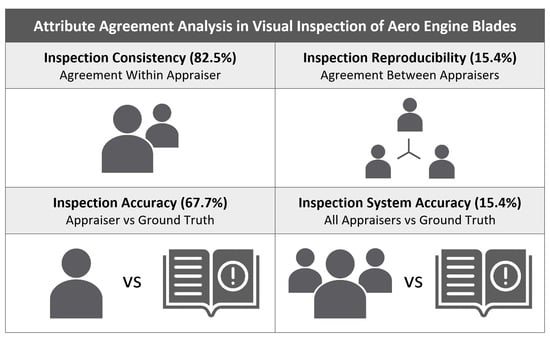
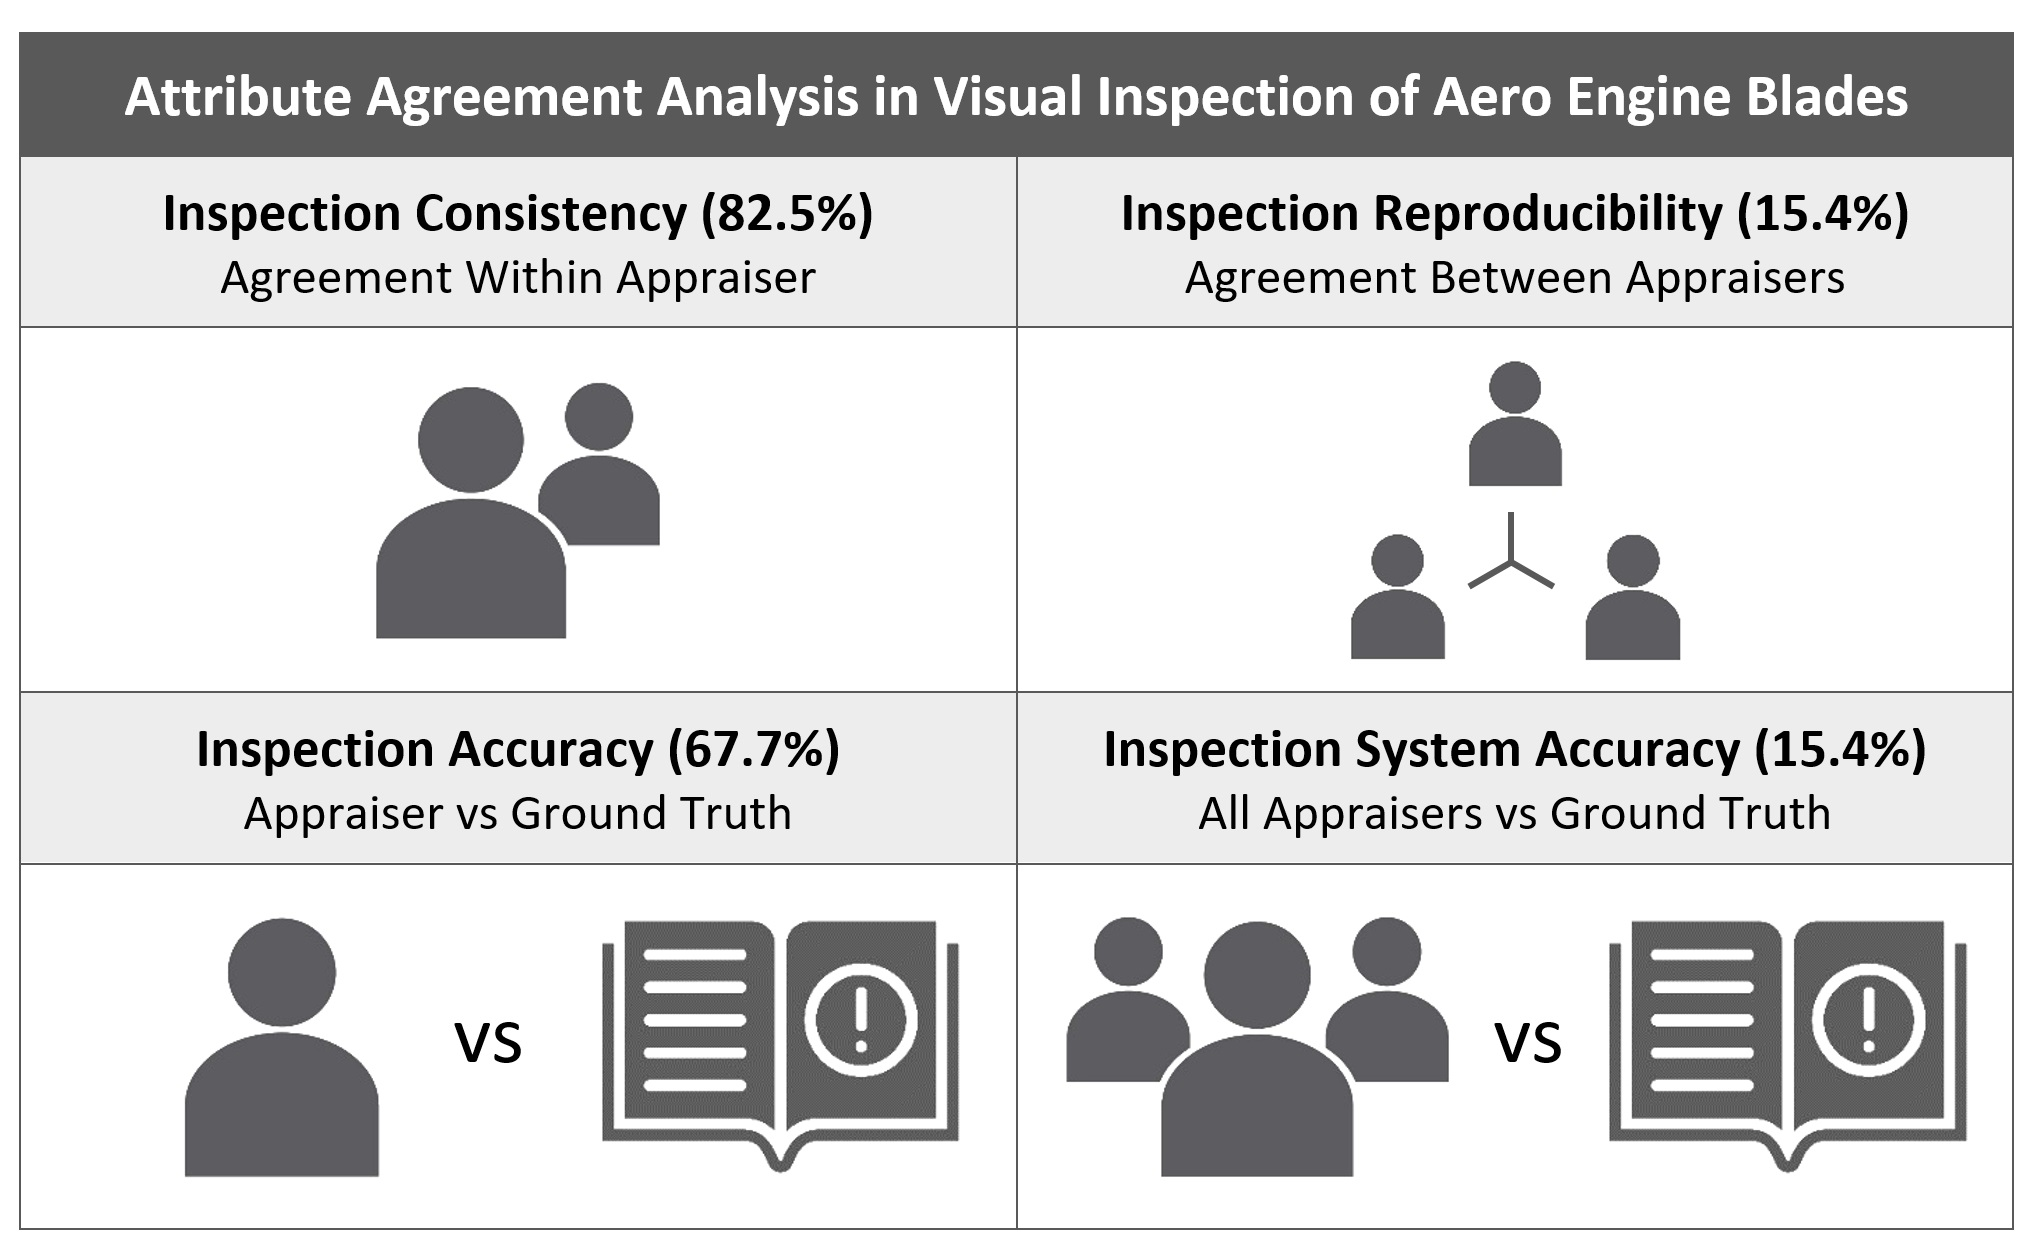
  • How accurately is each operator making a serviceability decision, i.e., do they detect all defects, and do they know the difference between a defect and a condition?
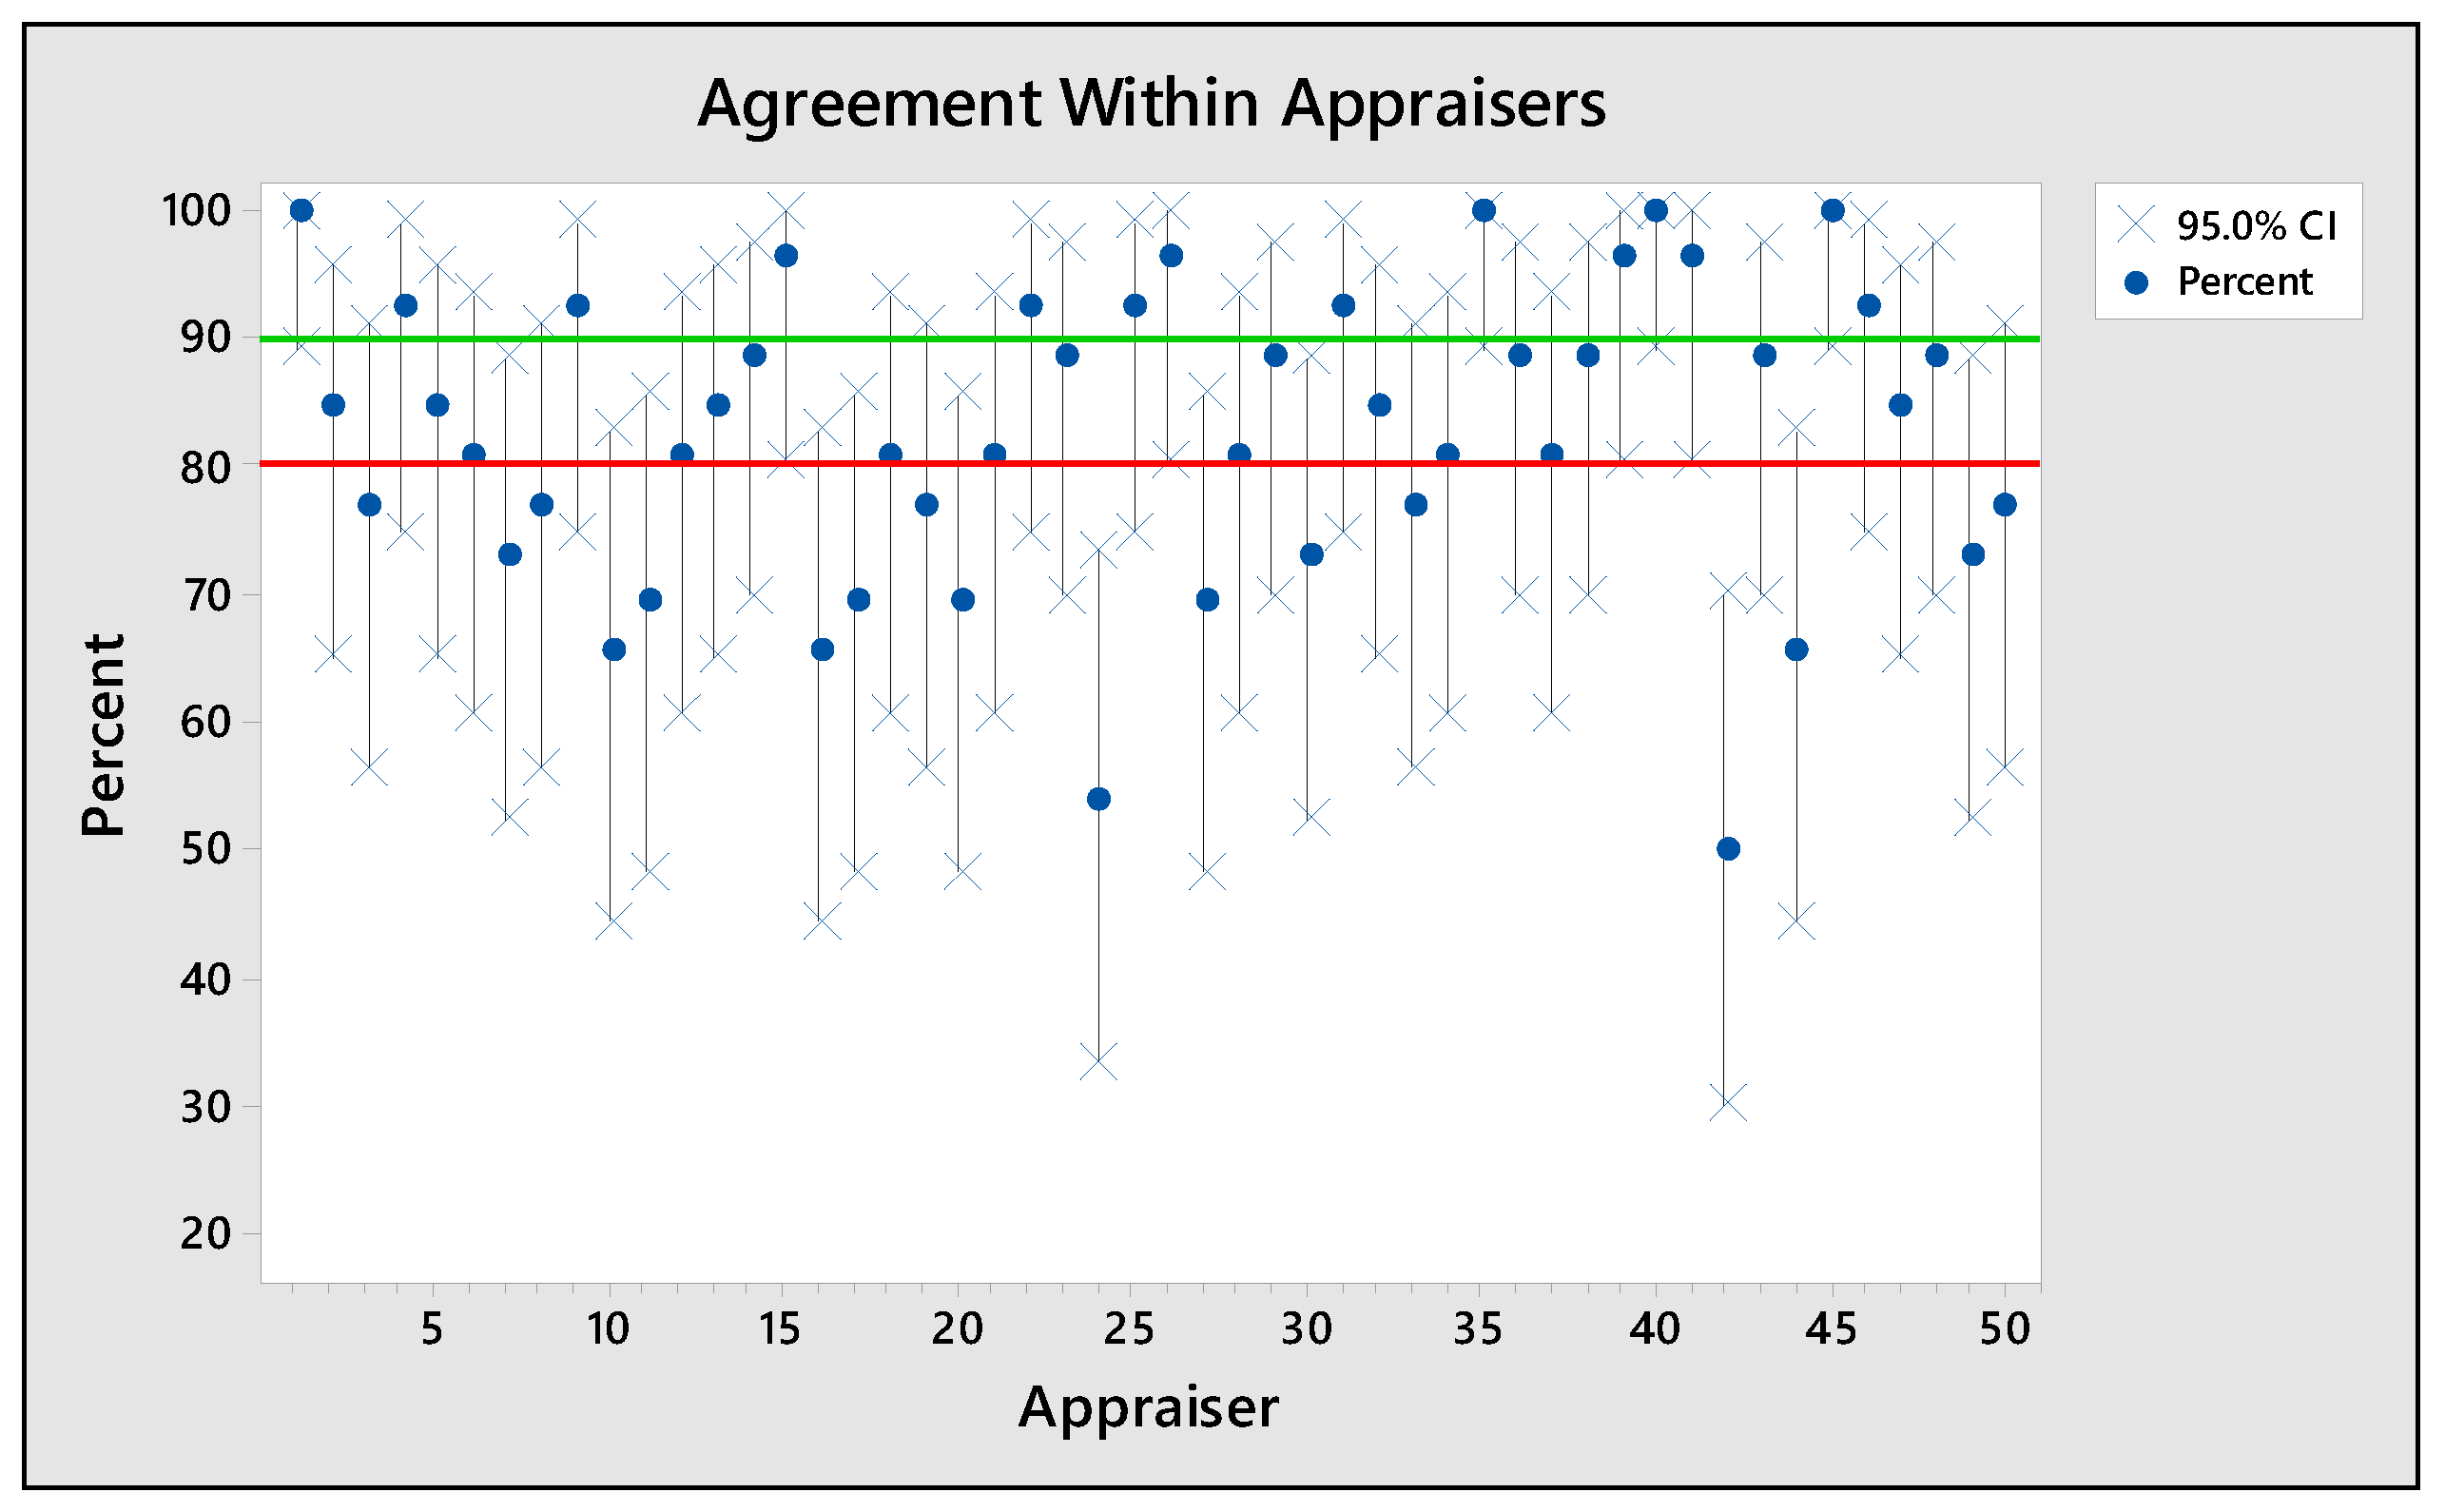
  • How consistently do operators inspect blades, i.e., do they come to the same serviceability decision when inspecting the same blade twice?
  • How reproducible are the inspection results, i.e., do different operators make the same serviceability decision when inspecting the same blade?
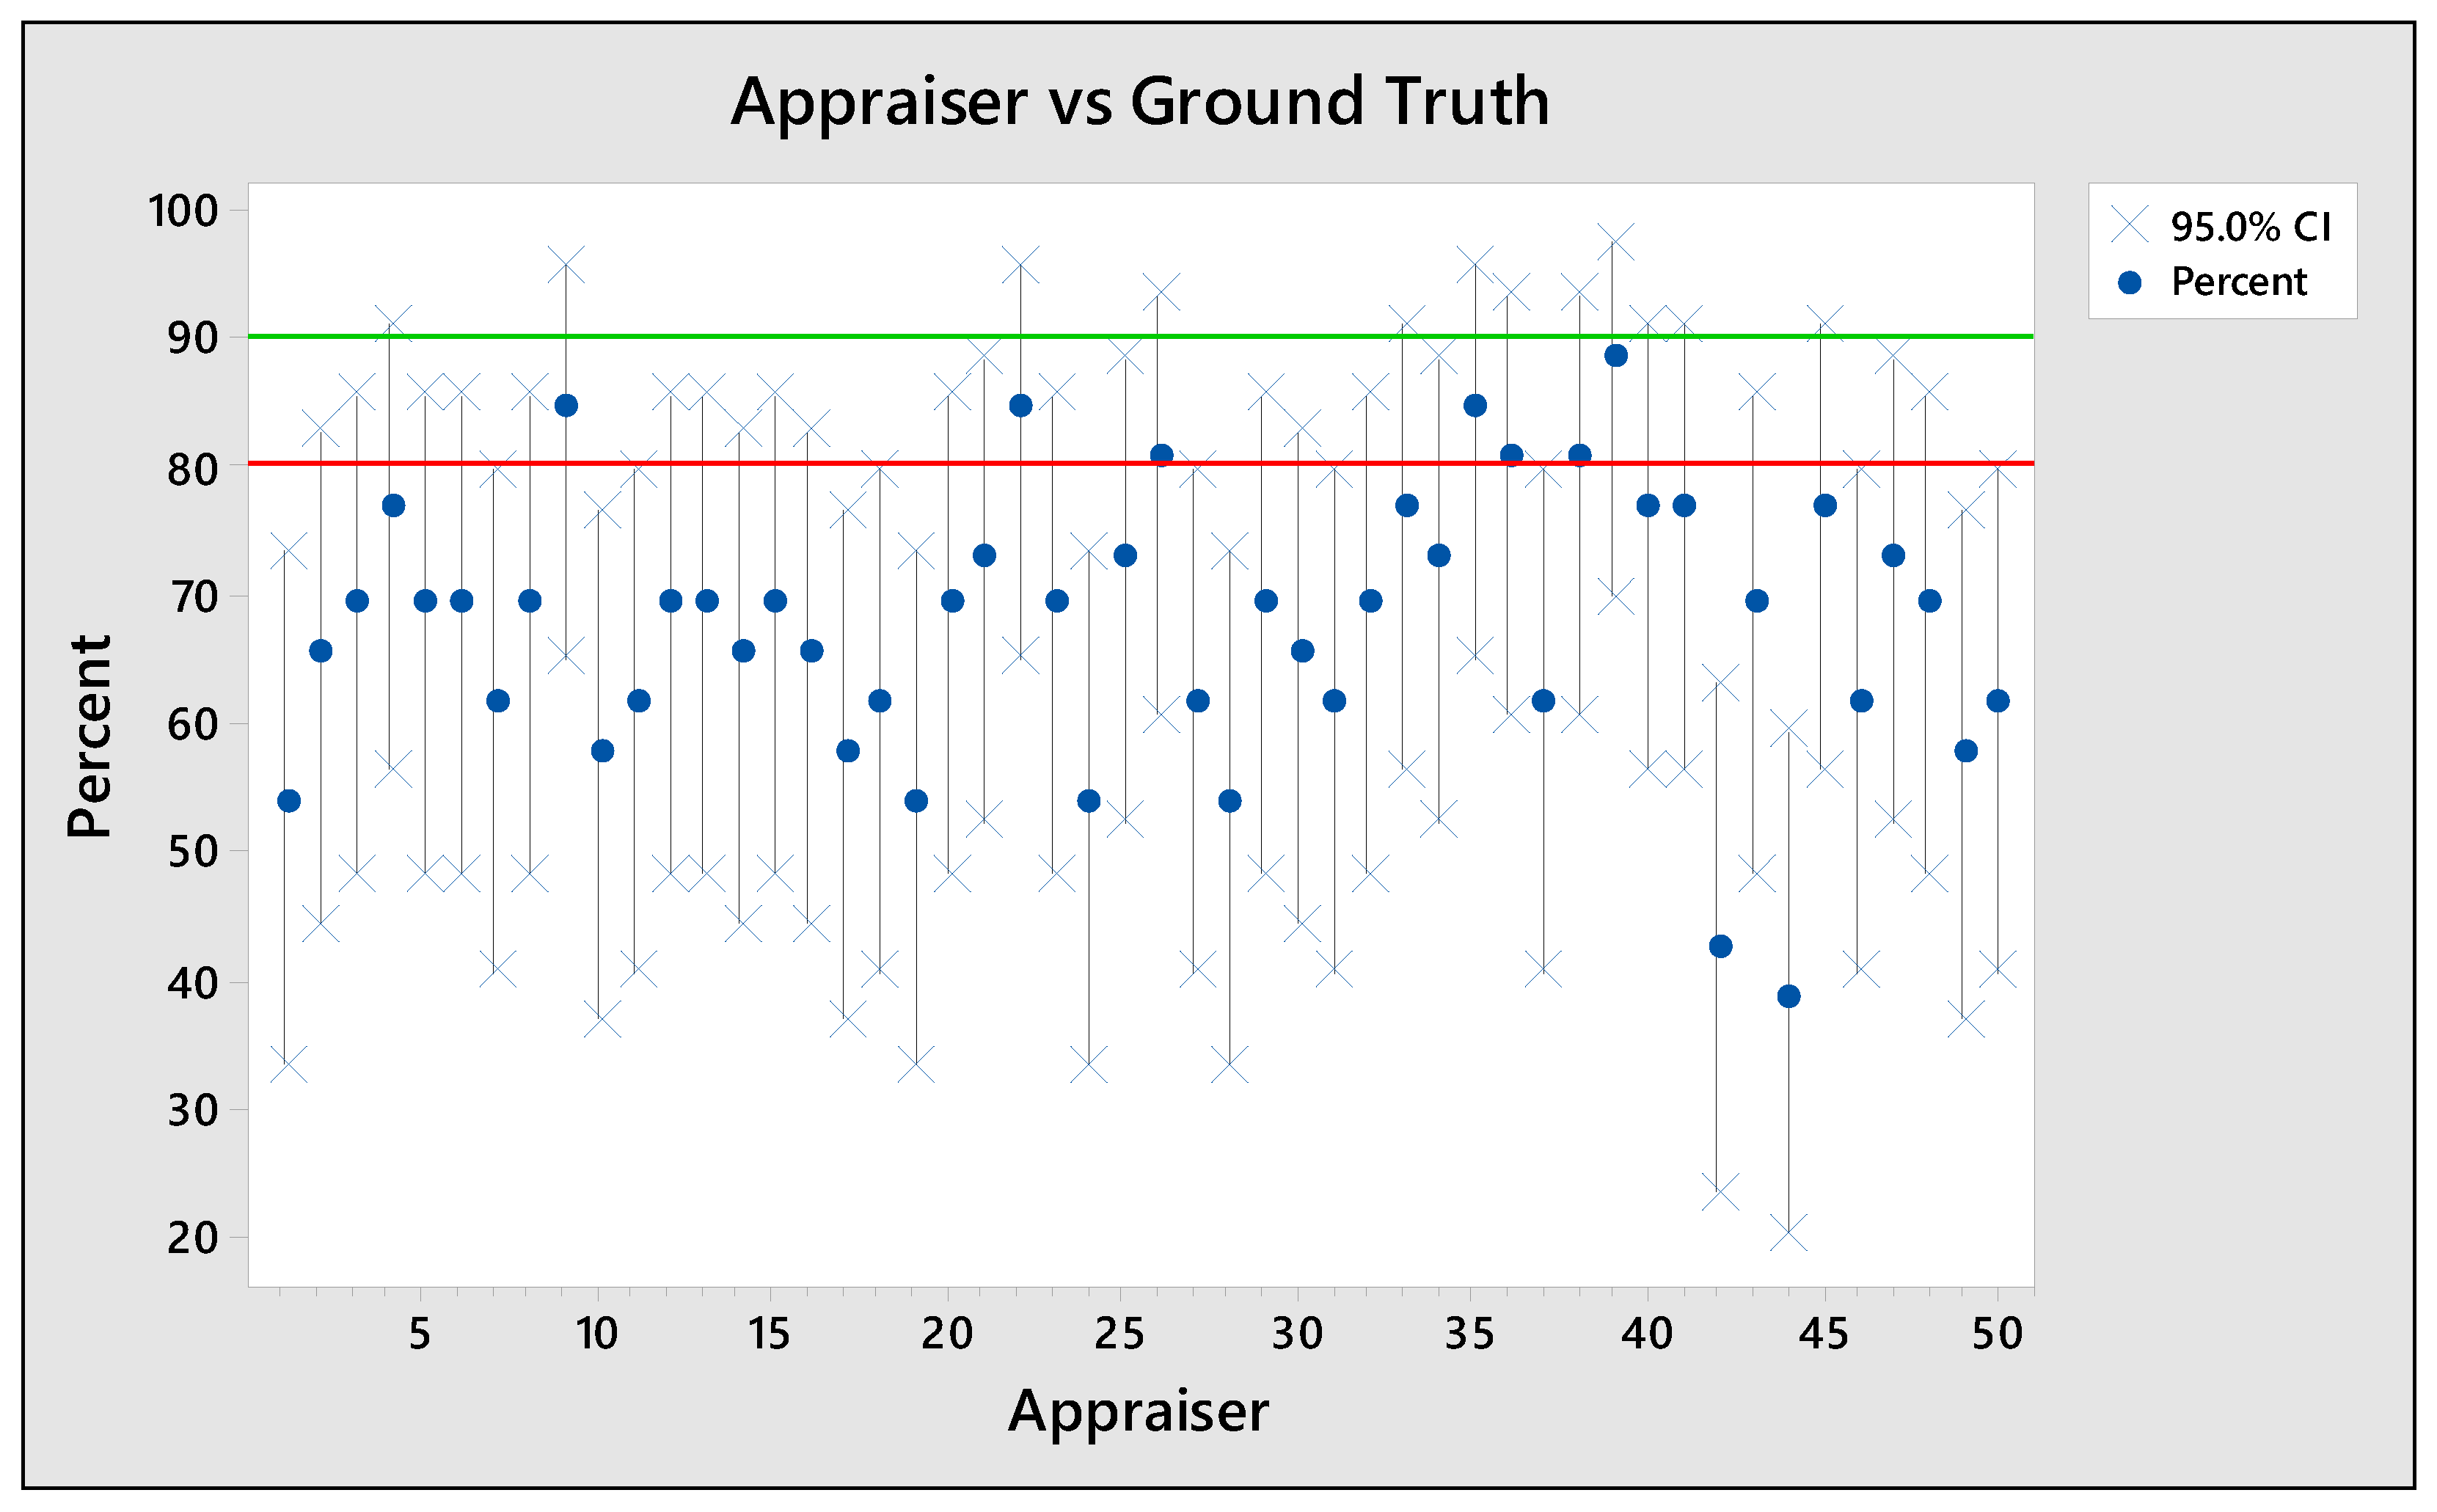
  • How accurate is the inspection system, i.e., do all operators’ agreeing decisions align to the ground truth?
The research approach to answer those questions is outlined in Figure 1 and will be further discussed in the following sections.

3.2. Research Sample

For this study, photographs of 26 high-pressure compressor (HPC) blades of V2500 jet engines were acquired, representing on-bench inspection (see Figure 2 for sample blades and refer to [51,52] for photographic setup and image acquisition). The images with a resolution of 24.1 mega pixels were shown to 50 appraisers twice (inspection trial A and B) in random order, resulting in 2600 serviceability decisions. This dataset was statistically analysed using Attribute Agreement Analysis (AAA) and Kappa Analysis.
There is a variety of different defect types and manifestations thereof that can occur. Examples include nicks, dents, bents and airfoil dents. Since no defect resembles another, it is possible that a memory effect could occur in a repeated measure study, which would falsify the results [33]. To counteract this effect, the 26 blades of the present study were mixed with a larger dataset of 137 blades used in [52]. While this may compensate the memory effect, we acknowledge that the repeated samples for the AAA was just short of the minimum recommended sample size of 30 to 50 parts [35]. This would have otherwise resulted in a much bigger study, which was not feasible due to operational constraints.
Before the study commenced, an expert with 34 years of work experience in aviation and 21 years in visual inspection determined the correct serviceability decision for each part. To avoid any mistake or bias of the expert, a second independent inspector with 27 years in aviation and 12 years in inspection was asked to confirm the serviceability decision. In the case of any disagreement between the two, the physical parts were inspected under optimal lighting and with the ability to use additional aids such as magnification glasses (as required). This formed the ground truth of the study. The two operators were then excluded from the subsequent experiment.

3.3. Research Population

This study included the same research population participating in [51,52]. The 50 participants were industry practitioners from a maintenance, repair and overhaul (MRO) shop for aircraft engines and had 1.5 to 35 years of experience in MRO operations M E x p . = 17.7   years ;   S D E x p . = 9.4   years . A detailed list of their demographics can be found in Table 1 in [51]. There was an interest to understand how different skill levels affect the reliability and consistency of the blade inspection. Therefore, three levels of expertise were included in this study, namely: inspectors (experts), engineers (proficient), and assembly operators (competent). Participants of AAA studies are often referred to as Appraisers, Assessors, or Raters [34,36,40]. In the present work, the term ‘Appraiser’ will be used. This research received ethics approval from the Human Ethics Committee of the University of Canterbury (HEC 2020/08/LR-PS).

3.4. Experimental Setup and Data Collection

Since the present study was part of a bigger study involving eye tracking technology [52,53], it was inevitable to use a screen-based setup. This included an office desk, chair, desktop computer, monitor, mouse and keyboard (refer to Figure 3 in [51]). Blade images were presented in PowerPoint on a 24.8-inch LED monitor (EIZO FlexScan EV2451). Participants were asked to navigate through the presentation in their own pace. There were no time limits, neither for individual blade inspections nor for the inspection task as a whole. If they found a defect, they were asked to mark their findings by drawing a circle around it using the mouse cursor. Each participant had their own presentation with their individual inspection results (markings), which were subsequently extracted and collected in an Excel spreadsheet (defect marking = 1, no defect marking = 0). The individual findings were then compared to the ground truth and the data were statistically analysed. Participants did not see their results and no feedback was provided that could have influenced their performance.
The experiment was conducted in a meeting room with the participant and the lead author being the only attendees. This was done for several reasons. First, it avoided participants being distracted by other operators on the shop floor. Vice versa, operators were not distracted by the study, thus avoiding any negative impact of the study on the industry operations. Furthermore, the lead author was the only person seeing the individual performances, which was important to ensure confidentiality compliance. Finally, other environmental conditions such as lighting could be controlled and kept consistent throughout the study.
For logistical reasons and to minimise the impact on our industry partner’s operations, the study was conducted over a period of two weeks and during both shifts. Thus, the factor concerning the time of the day could not be eliminated. However, since the participants of the three expertise groups were randomly distributed across both shifts, the effect (if any) was equal for all three groups.
All participants had a five-minute break before the study commenced, in which the researcher prepared the study. Subsequently, the participants were asked to fill in a questionnaire and sign the consent form. Once completed, instructions were given, and the study commenced.

3.5. Attribute Agreement Analysis

The participants were asked to inspect engine blades for operational damage and to make a serviceability decision as to whether the blade is defective (unserviceable) or non-defective (serviceable). Hence, the collected data were of categorical nature and Attribute Agreement Analysis was the appropriate method to evaluate the inspection system [35]. The data were analysed statistically in Minitab software, version 18.1 (developed by Minitab LLC, State College, PA, USA) to answer the research questions in Section 3.1 concerning the inspection consistency, repeatability, reproducibility, and reliability. We applied the AAA metrics (Equations (1)–(4)) and agreement limits (Table 1) outlined in the Reference Manual RM13003 for Measurement Systems Analysis (MSA) from the Aerospace Engine Supplier Quality (AESQ) Strategy Group [35], which aligns to the Aerospace Standard AS1310 [54].
With respect to the nomenclatures used in Equations (1)–(6), the serviceability decision of Appraiser 1 in Inspection Trial A is abbreviated to 1A. The same appraiser’s repeated serviceability decision in Inspection Trial B is referred to 1B. The same principles apply to Appraiser 2, i.e., inspections 2A and 2B. The standard against which the individual results are compared with is abbreviated to ‘GT ’for ground truth.
A p p r a i s e r   C o n s i s t e n c y = N u m b e r   o f   b l a d e s   w h e r e   1 A = 1 B T o t a l   n u m b e r   o f   b l a d e s
A g r e e m e n t   b e t w e e n   A p p r a i s e r s = N u m b e r   o f   b l a d e s   w h e r e   1 A = 1 B = 2 A = 2 B T o t a l   n u m b e r   o f   b l a d e s
A p p r a i s e r   A g r e e m e n t   w i t h   G r o u n d   T r u t h = N u m b e r   o f   b l a d e s   w h e r e   1 A = 1 B = G T T o t a l   n u m b e r   o f   b l a d e s
A l l   A p p r a i s e r s   w i t h   G r o u n d   T r u t h = N u m b e r   o f   b l a d e s   w h e r e   1 A = 1 B = 2 A = 2 B = G T T o t a l   n u m b e r   o f   b l a d e s
In aviation, as in any other high-reliability organisation, it is more critical if a defect stays undetected and the defective part is released back into service (false negative), than a non-defective part being removed from service for detailed inspection and overhaul (false positive). Therefore, the Aerospace Standard AS13100 outlines a second set of agreement metrics (Equations (5) and (6)) and associated limits (Table 2). Those can be applied to determine the percent agreement of appraisers with the ground truth taking into account the false positives (Equation (5)) and false negatives (Equation (6)) separately.
F P   A g r e e m e n t = N u m b e r   o f   b l a d e s   w h e r e   1 A = 1 B = G T + N u m b e r   o f   G T = 1   b l a d e s   w h e r e   1 A = 1 B G T T o t a l   n u m b e r   o f   b l a d e s  
F N   A g r e e m e n t = N u m b e r   o f   b l a d e s   w h e r e   1 A = 1 B = G T + N u m b e r   o f   G T = 0   b l a d e s   w h e r e   1 A = 1 B G T T o t a l   n u m b e r   o f   b l a d e s

3.6. Kappa Analysis

Kappa analysis provides a way to assess the agreement reliability by taking into account the possibility of agreement occurring by chance [35]. The Kappa value (κ) is considered more robust than the percent agreement of the AAA [35,55]. At the same time, Kappa is sensitive to the sample distribution and hence is often not comparable across studies [56]. Moreover, the Kappa value might not be well understood by industry practitioners, while inspection accuracy (agreement with ground truth) is a commonly used metric. For completeness, the results of both analyses are reported in this paper.
Kappa values (κ) can range from −1 to 1, whereby κ = 1 means perfect agreement, κ = 0 shows that the agreement is the same as expected by chance, and a negative Kappa value indicates an agreement weaker than expected by chance. A detailed overview of the Kappa values and equivalent agreement classes is shown in Table 3.

4. Results

4.1. Appraiser Consistency and Reproducibility

First, the ‘agreement within appraisers’ was analysed. The results are summarised in Table A1 (Appendix A) and visualised in Figure 3. The consistency of each appraiser is indicated by the blue dot together with the 95% confidence intervals (blue crosses). The results show that mean self-agreement ranged from 50% to 100%.
The highest consistency was measured for four appraisers with 100% self-agreement each. On average, all appraisers agreed in 82.5% of the time with themselves, with a 95% confidence interval of 79.3% to 85.8%, which is an acceptable agreement result (refer to agreement limits in Table 1). However, the individual repeatability results of one-third (17 of 50 appraisers) were below the 80% agreement limit (red line in Figure 3) and returned a poor to moderate agreement (κ ≤ 0.49). Fourteen of the 50 appraisers (28%) showed excellent agreement above 90% (indicated by green line in Figure 3), with almost perfect Fleiss’ kappa values (κ ≥ 0.84). The remaining 19 appraisers (38%) showed a substantial agreement (0.77 ≥ κ > 0.61).
It might seem concerning that even the means and upper limit of the confidence interval of some appraisers were below the acceptable threshold of 80%. However, it must be borne in mind that the design of the study limited the medium to static photography, whereas in practice appraisers would have access to visualise the real blade with their own eyes (considering also that eye-wear may be better optimised for physical inspection rather than viewing photographs on a computer screen), the ability to turn the blade (change the perspective and the lighting relative to the surfaces), and to subject it to tactile inspection (including feeling the edges). There is reason to believe from [51] on a different study design that perspective contributes about an additional 5.4%, and tactile another 7.1%. Hence, there is no reason to be alarmed by the present results. Additionally, note that the data presented here are for a portfolio of defects, which have different degrees of severity of consequences. The severity topic has been addressed elsewhere [58].
Non-defective blades were correctly classified as serviceable in 67–81% of the time. Nicks and bents showed the highest inspection accuracies of 95–100%, thus being easiest to detect. Airfoil dents on the other hand were the most difficult defect type to detect with 34–39% accuracy. This aligns to previous findings [51,52,53].
Next, the ‘agreement between appraisers’ (reproducibility) was assessed. Figure 4 shows that all appraisers agreed with each other on the serviceability decision for four blades (indicated by single-colour columns), i.e., blades number 1, 5, 14 and 23. This results in a reproducibility rate of 15.4% and a moderate Kappa value of κ = 0.34 (p < 0.001). This highlights the variability and inconsistency of the inspection system.

4.2. Appraiser and Inspection System Accuracy

The inspection accuracy (agreement with ground truth) is arguably the most common AAA metric used to communicate the performance of an inspection system. The results in Figure 5 and Table A2 (Appendix A) show an average inspection accuracy of 67.7% and a Kappa value of 0.45 across all appraisers. The individual accuracy ranged from 38.5% for Appraiser 44 to 88.5% for Appraiser 39. Therefore, the majority of the appraisers’ inspection accuracy would be unacceptable (<80%) if the whole inspection were to rely on static photography, with Kappa values below 0.6. Only seven individuals (14%) showed acceptable results and no appraiser achieved excellent accuracy (>90%).
The Aerospace Standard AS13100 [54] suggests differentiating between poor accuracies caused by false positives (FP) and the ones due to false negatives (FN). Two different acceptance limits of 25% and 5% were introduced for false positive and false negatives, respectively (Table 2). In Minitab software, this is referred to as ‘Assessment Disagreement’. It is evident from the results in Table A3 that 11 appraisers (22%) showed a false-positive rate above 25%, with 66% being the highest. Furthermore, the false-negative rate of 20 appraisers (40%) exceeded the 5% limit, with appraiser number 15 having missed 87.5% of all defects. This leaves 20 appraisers (40%) with an acceptable false-positive and false-negative rate, thus meeting the required standard. The ‘Mixed’ column in Table A3 indicates the number of inconsistent decisions made across the inspection trials. The proportion of the inconsistent decisions and the total number of inspected blades is called ‘inconsistency’ or ‘imprecision’ and equals 1 minus the inspection consistency. The appraisers of this study on static photography showed an average inconsistency of 17.5%.
The last metric analysed was the agreement between all appraisers and the ground truth. The results are shown in Figure 4 and Table A5. In this study, the ‘agreement between appraisers’ and the ‘all appraisers vs. ground truth’ accuracies were identical, since all the appraisers’ agreeing decisions were correct. The accuracy of the inspection system was 15.4% and κ = 0.34 (p < 0.001).

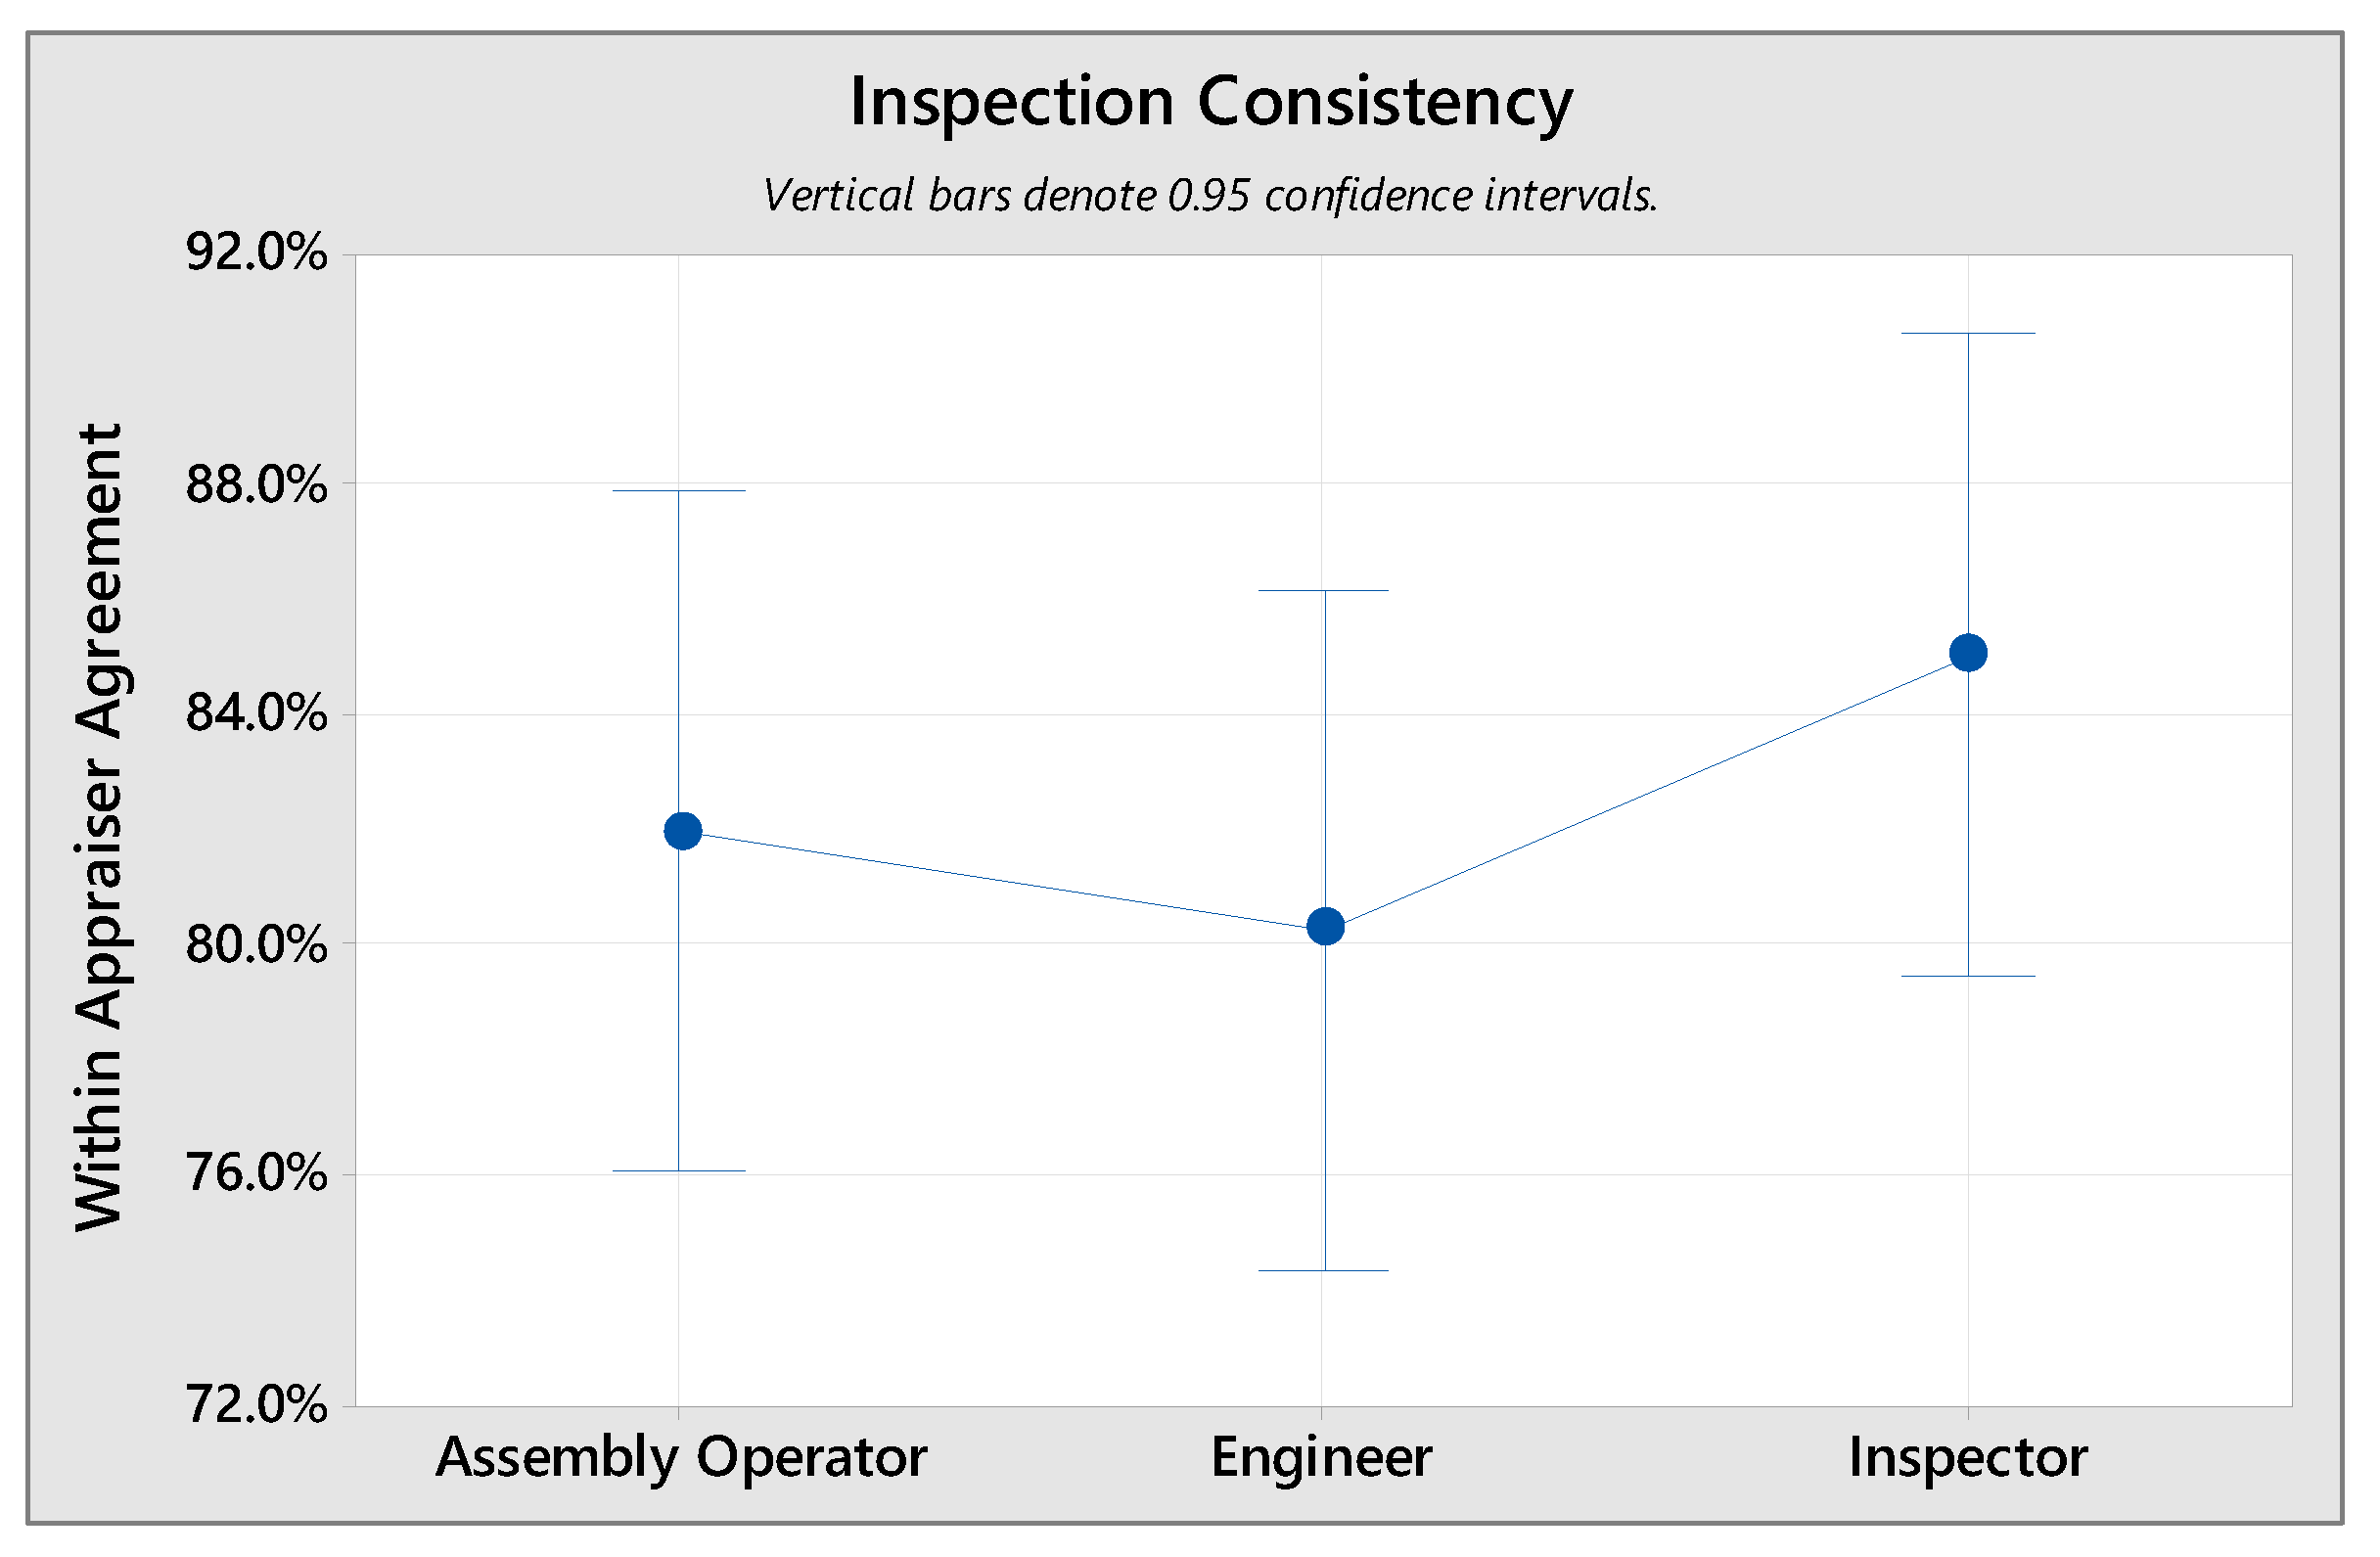
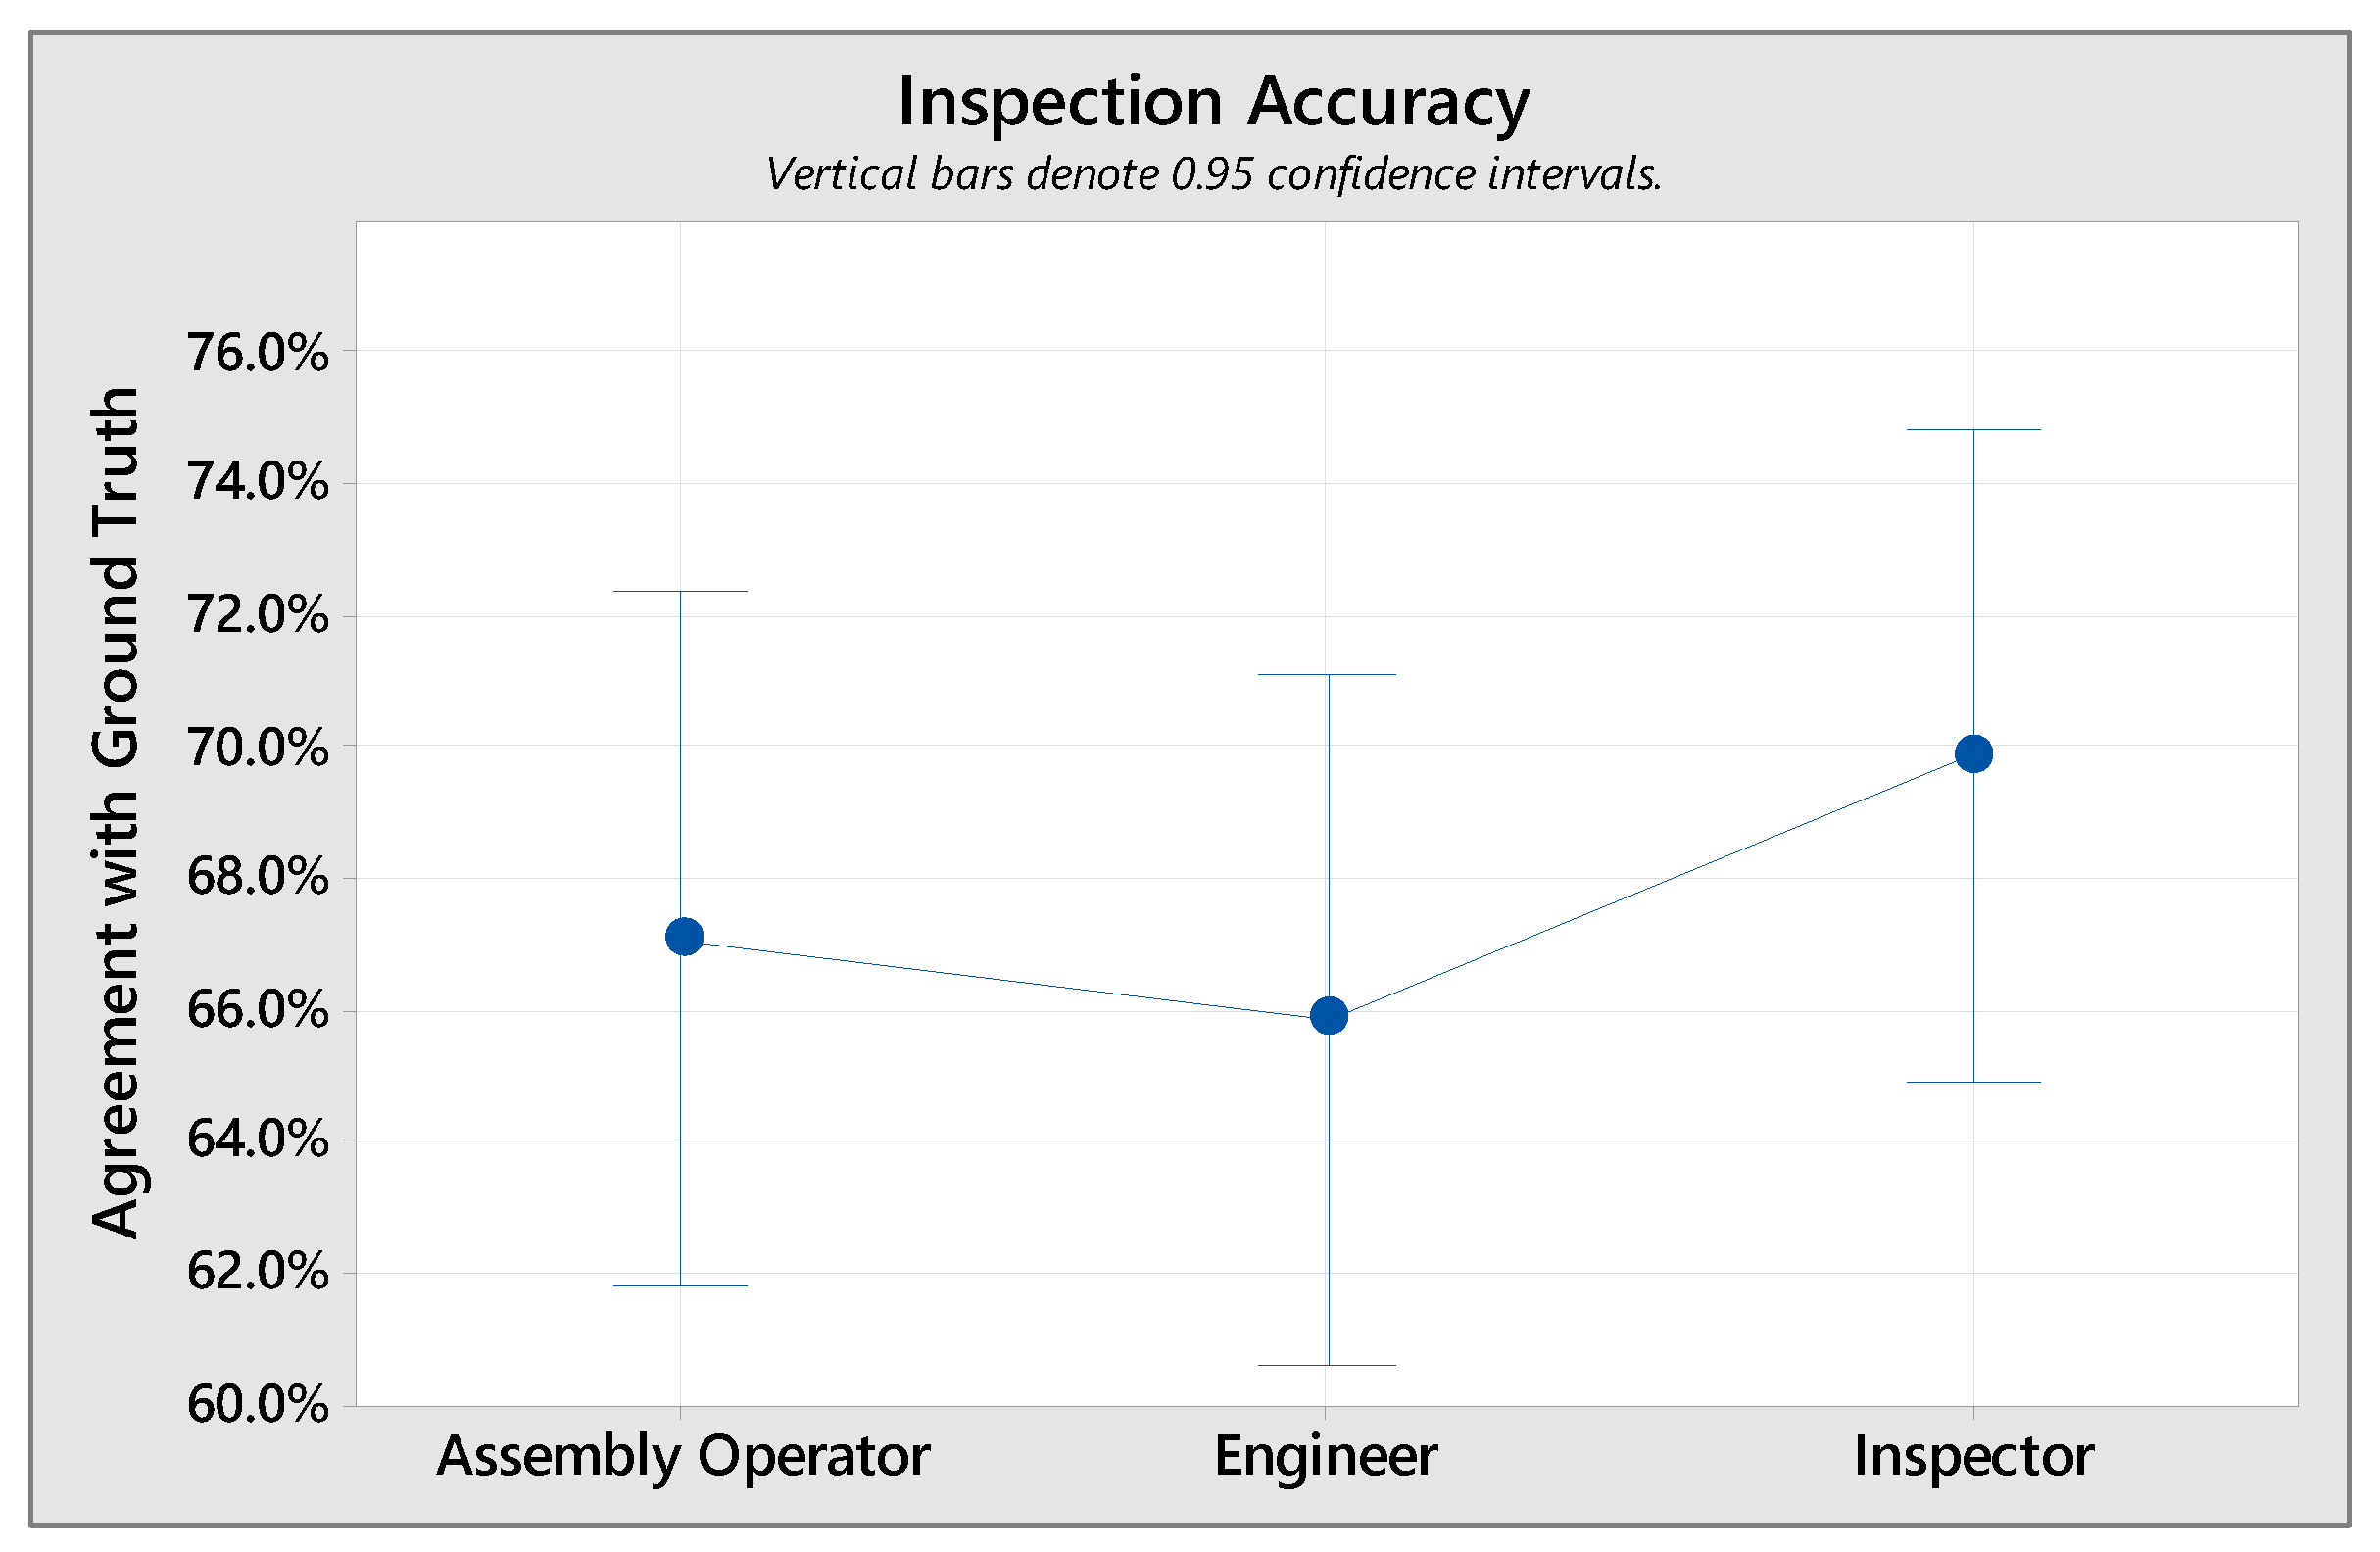
4.3. Assessment of the Expertise Factor

The effect of expertise on the inspection performances may be analysed using One-way ANOVA—one with Inspection Consistency (agreement with themselves) as the dependent variable, and one with Inspection Accuracy (agreement with ground truth). The categorical factor in both analyses was Expertise. The first analysis shows that there was no significant difference in inspection consistency between the different groups of expertise, F(2, 47) = 0.717, p = 0.494 (see Figure 6).
Likewise, the second analysis around inspection accuracy showed no correlation between expertise and inspection accuracy, F(2, 47) = 0.666, p = 0.519 (see Figure 7). While not being significant, there was a tendency that the inspectors’ agreement with themselves and with the ground truth was on average slightly higher than for the other two groups.

5. Discussion

5.1. Summary of Results and Comparison to Other Studies

5.1.1. Attribute Agreement Results

The purpose of this study was to assess the human performance in aviation maintenance, specifically in engine blade inspection. The findings are summarised in Table 4 and compared with other studies in the field of visual inspection. On average, appraisers agreed 82.5% of the time with themselves when inspecting the same blade twice. This is comparable to the appraiser consistencies reported in previous research, which ranged from 85.6% to 97.0% [25,26,27,37]. The inspection accuracy of each appraiser, i.e., the ‘agreement with the ground truth’, was on average 67.7% and aligns to other studies. For example, the inspection of car lights, airbags, steel chains, and circuit boards led to inspection accuracies of 68.9%, 84.0%, 92.2% and 94.1%, respectively [25,26,27,37]. However, it should be noted that the risk of a missed defect in e.g., car light inspection is different to aviation, where it can lead to adverse consequence and affect flight safety. The ‘agreement between assessors’ in the present work was 15.4%, which is lower than previously reported reproducibility rates of 36.7% to 83.3% [25,26,27,37]. Since the 15.4% of inspections where all appraisers agreed with each other were also correct and aligned to the ground truth, the overall ‘agreement of all appraisers with the ground truth’ was also 15.4%. The agreement rates reported in the literature are higher and range from 36.7% to 83.3% [25,26,27]. It should be noted that the participants of the present study were presented with images of the parts rather than the physical parts themselves. Moreover, the research population of the present study (N = 50) was much larger than in other studies (further discussed below). This could explain the lower performance compared to previous studies.
Differentiating between false positive and false negative agreements provides a better understanding of what inspection errors occur. While false positives may imply additional costs for the maintenance operator and engine owner, it has no negative effect on the flight safety. Contrarily, false negatives imply a high risk, and a missed defect can have a direct effect on the safety status of the aircraft. Thus, it is not surprising that there was a tendency towards false positives, which highlights the necessary conservative approach of the operators. The insights gained may allow for targeted improvement attempts, such as customised training and framing. The results are summarised in Figure 8, which puts the appraiser consistency and appraiser accuracy into relation. The three different agreement levels (a) unacceptable, (b) acceptable, and (c) excellent are highlighted in red, yellow and green colour, respectively.
This study found that expertise had no statistically significant effect on the inspection accuracy. This supports previous research [52,53,59,60,61,62] that found that there might be a natural limit to human performance. Furthermore, the present study found that there was no correlation between expertise and appraiser consistency. Since no previous study has assessed this effect, no comparison could be made. It appears that level of expertise, and by implication training, is not associated with improved consistency. This is an interesting question in its own right, because it suggests that the ‘judgement’ faculty has not been improved by the training even if the ‘skill’ activity has. This is consistent with the visual inspection framework [52] and implies that in the present study appraisers may have been successful in search, but may have made errors in recognition of defect type, or decision.

5.1.2. Kappa Results

The data were also analysed using Kappa statistics. The distribution of the achieved ‘agreement with themselves’ and ‘agreement with ground truth’ are summarised in Table 5. Overall, it can be concluded that the ‘agreement within appraisers’ is substantial to almost perfect in 52% of the cases. In terms of inspection accuracy, a substantial agreement was achieved in 22% of the time, while none of the appraisers showed almost perfect agreement with the ground truth. All appraisers agreed with each other on 4 of 26 blades (15.4%). This returned a Kappa value of κ = 0.344 (p < 0.001). All appraisers’ assessment also agreed with the ground truth for four blades (15.4%) with a Kappa value of κ = 0.450 (p < 0.001). Low Kappa values indicate low agreement and thus the greatest potential for improvement. Since Kappa is sensible to the sample size and distribution [56], the results cannot be compared to other studies.

5.1.3. False Negative Results

In the case of aviation MRO, the false-negative rate is arguably the single most important metric since it determines the safety outcomes (false positives only have cost implications). The results of this study show acceptable false-negative performance in 60% of appraisers. While this might seem alarming, it should be noted that there are a number of moderating effects.
First, there is variability in the defect type and size (samples shown in Figure 2), which affects the criticality of the detection. In particular, only very small defects are permitted on leading edges of blades, and these can be challenging to detect with the naked eye, even when the part is held in the hand. Other types of defects, such as minor dents or scratches to the airfoil section, are less critical from a safety perspective. They might decrease the fuel efficiency of the engine but are highly unlikely to cause any damage to the engine. Second, photographs were used in the present study, which is consistent with how borescope results are presented in practice, but for on-bench inspections, the operators would ordinarily have physical access to the blade and have lighting and magnification available. Third, the regular inspections provide another barrier to accident causation. Even in the case of leading-edge defects, a small defect that is missed will not necessarily propagate to complete fracture, because there is an opportunity to detect it at the next regular inspection interval.
For these reasons, the sub-optimal false-negative performance is not necessarily a failure of the MRO system. From a Bowtie perspective, the results can be interpreted as an indication of the effectiveness of the visual inspection barrier, and the desirability to seek ways to improve the performance. We return to this matter in Section 5.2 below.

5.1.4. Effect of Appraiser Number on the AAA Results

This paper included a large number of N = 50 appraisers inspecting the same set of blades twice. Typically, the number of assessors in other AAA studies has been three: Two operators and one expert who is considered as being the ground truth [25,26,27,35]. This small number of appraisers could possibly be explained by the nature of most inspection being single-opportunity detections, i.e., the parts are only inspected once by one operator. However, in sequential inspections whereby two or more operators inspect a part independently of each other, the ‘agreement between appraisers’ is even more important. At the same time, the more appraisers are included (each with their own inconsistency) the smaller the likelihood of ‘agreement between each other and the ground truth’. This could explain the relatively lower ‘agreement between appraisers’ and ‘agreement of all appraisers vs. ground truth’ in the results section.
To understand the effect of the appraiser size on the agreement results, the AAA was repeated with 2, 5, 10, 15, 20 and 30 randomly selected appraisers and compared to the agreements achieved by the 50 operators. The results are summarised Table 6. Based on the assumption that the results of 50 appraisers is a better representation of the truth, it can be said that the agreements of only two appraisers differ to the ones of 50 appraisers. More precisely, the appraiser consistency and appraiser accuracy were 6.8% lower in each case. A much bigger difference was noted for appraiser reproducibility and ‘agreement of all appraisers with the ground truth’. While two appraisers achieved a reproducibility accuracy of 65.4%, the agreement between the 50 appraisers was only 15.4% (over four times lower). Similarly, the ‘agreement between appraisers and the ground truth’ was 57.7% and 15.4% for 2 and 50 appraisers, respectively. This shows that while it is common to include two appraisers and compare their agreements to the ground truth, the results might not represent the performance of the inspection system. At the same time, it might not always be feasible to include 50 participants due to operational constraints, for instance, when the task is only performed by a few operators, or when the time to perform the AAA is limited. Thus, the intermediate appraiser numbers might be of interest. While the appraiser consistency and accuracy did not vary much between the different number of appraisers, the results show three ‘drops’ in appraiser reproducibility and all appraisers accuracy. The first one is between two and five appraisers, where the reproducibility and ‘all appraiser agreement vs. ground truth’ halved. The next drop occurred between five and ten appraisers, where both metrics decreased further by 25%. The numbers remained consistent from 10–20 appraisers before they decreased again by a third for 30 appraisers. Based on those observations we would recommend including at least 5, preferably 10 appraisers in AAA studies. More appraisers will always be beneficial but will not necessarily provide additional insights.
An additional factor for consideration is that the assessment process tends to exclude blades from circulation at each inspection stage, i.e., decisions are conservative rather than a voting process. Hence, having more appraisers in a series arrangement of inspections has the potential to raise the reliability of the process as a whole. Per 4.1, even one level of inspection has the potential to have a relatively high level of exclusion of defective blades but has a high dependency on the personal variability of the appraiser.

5.2. Implications for Practitioners

This study provides insights into the inspection process that might be relevant to other organisations performing maintenance inspection of used parts with operational damages. The part condition (e.g., dirtiness) has a significant effect on the performance [53] and thus previous findings from the manufacturing industry may not provide a reliable indication of the achievable inspection performance in maintenance activities. This work fills that gap and provides an understanding of human performance and capabilities in maintenance inspection. It shows what an employer and ultimately the aviation authorities can expect from an operator when mandating a visual inspection performed solely by the naked eye, at least in image-based inspections as here. This may support reconsideration of the existing inspection policies and procedures. Furthermore, it might be worthwhile assessing the FP and FN rates separately and applying different limits, which might be more appropriate for high reliability organisations.
The Attribute Agreement Analysis can help identifying the specific defects the operators struggled with by looking at the appraisers’ accuracy. Furthermore, the parts with the highest disagreement and inconsistency can be identified and the inspection training adjusted accordingly to specifically target those challenging defects. This could be done e.g., by including a standardised set of blades with representative defects as part of the classroom training. Feedback could be provided during such training to sensitise the operators to what defect types and severities must be detected and ultimately rejected. The visual inspection framework [52] may be useful at this point, particularly the concept of recognition error and decision error [53]. This because results of the present paper show no statistically significant association between expertise and inspection accuracy. This implies that the higher levels of training associated with expertise had not developed the decision faculty (and perhaps recognition) to the level that might be expected. Possibly training might need to consider the decision activity more explicitly. This has the potential to guide an organisation’s continuous improvement efforts through informed decision-making. The effectiveness of such changes can be easily assessed using Attribute Agreement Analysis. Thus, AAA provides a useful tool for Lean Six Sigma approaches such as DMAIC [63,64].
Moreover, AAA provides the opportunity of being used as part of the proficiency evaluation and certification process to ensure that operators meet the required performance standard. It might even be possible to use it for assessing the operator’s performance early in the application process and selecting the best candidate for the role based on their natural or pre-existing inspection skills.
Investing in advanced technologies such as Automated Visual Inspection Systems (AVIS) including artificial intelligence and 3D scanning [65,66,67,68] might offer an opportunity to overcome some of the limitations due to human factors. For the moment, it is unlikely that the human operator will be replaced entirely due to the strong cognitive capabilities and subjective judgement required in visual inspection [26]. Thus, future research could evaluate the opportunities and risks of each inspection agent (human or otherwise) and assess a possible integration and interaction with the human operator. An interesting finding of the present study is that inspection accuracy was, for many appraisers, less than ideal when photographs were the only mode of input. In real industrial practice, appraisers have additional modes of input, such as being able to change viewing angle, lighting, magnification, video, and tactile feedback, and these augment the pure visual inspection. However, advanced technologies such as artificial intelligence (AI) are often limited to static photographs (even videos tend to be reduced to analysis of individual frames), and hence may show similar limitations in certain situations. Possibly, different types of inspection (human, AI, 3D scanning, etc.) may be better for certain tasks than others, but if so, these contingency variables are still poorly understood. Herein lies the potential of advancing the operators’ performance, thus improving the inspection quality and reliability, which ultimately contributes to flight safety. However, these technologies come with their own limitations. Thus, a case-specific assessment should be performed before investing in new technology.
Furthermore, this study provides a recommendation regarding the number of appraisers, which might be helpful for the study design of future Attribute Agreement Analyses. This has the potential to make such studies more economical and hence more readily implemented.

5.3. Limitations

There are several limitations in this study. First, the actual inspection performance in MRO is likely to be better than in the present study due to the limitations arising from the study design. That is, the inspection was based on photographs of the blades rather than the actual ‘physical’ parts themselves. Allowing operators to hold the blades in their own hands, to inspect them from any arbitrary angle, to control the lighting, and to use their fingertips to feel the blade (tactile sense) could have limited their inspection ability and caused lower inspection accuracies, as further explored in [51]. Contrarily, it might also be possible that the inconsistency and reliability of the inspection system would remain unchanged due to the nature of the operations being dependent on the human operators and thus prone to human error regardless of the inspection mode.
While there was a concern regarding a potential memory effect due to the unique shape and manifestation of each defect, the results indicate that this effect was of no consequence, i.e., even if the appraisers might have remembered having seen the blade before, the results show low consistencies (agreement within appraisers).
Another limitation was the sample size being slightly below the recommended number of 30 to 50 parts [35]. This could have influenced the statistical analysis. Future work could repeat the study with a larger sample size and more time between the inspection trials (on different days) to avoid a memory effect.
The effect the number of appraisers has on the inspection performance was assessed and the results show that the reproducibility and the ‘appraiser agreement with the ground truth’ decreased with increasing appraiser numbers. Hence, the comparison of the performance results of the present study (50 appraisers) with other studies in the field might have not been fully valid and were in favour of studies with lower appraiser numbers [25,26,27].
In the present study, we presented a representative portfolio of defects to the participants. In principle, the AAA and other metrics might be determined for each type of defect and size thereof, but that would be a much larger study than the present one.
Finally, recommendations towards an ideal number of appraisers were made based on a semi-qualitative analysis of the inspection results reported in this paper. There was no methodological or statistical evaluation of this concern, which provides great potential for future research.

5.4. Future Work

Some recommendations for future work have already been addressed previously and are not repeated here.
Future work could repeat the study with physical parts as opposed to images thereof and assess any differences in performance. We would expect the appraiser accuracy to increase based on previous findings [51]. However, it remains unclear whether the ability to inspect the actual parts and using the tactile sense will affect the appraiser consistency and reproducibility. It might be possible that inspection consistency and reliability are independent of whether humans inspect images or physical parts.
There is an opportunity to research training approaches that might help to improve the human performance and ultimately lead to higher consistency, accuracy and reproducibility. Previous studies showed that Attribute Agreement Analysis is a suitable method to measure and evaluate the effect of continuous training and feedback by tracking the individual and system performance, and adjust the training needs each time based on the results [27,33].
It might be further possible to introduce a training and certification programme that requires each inspector to assess a certain number of blades on a regular basis. The results could be analysed using Attribute Agreement Analysis. They could also be used to train an AI-based inspection system. This could allow tracking the personal performance of each inspector, while training the algorithm of the AVIS at the same time.

6. Conclusions

This study makes several novel contributions to the field. First, the operators’ consistency, repeatability, reproducibility, and reliability were assessed, applying Attribute Agreement Analysis and Kappa analysis. This was the first study using those methods to analyse the operator performance in a maintenance environment, specifically in visual inspection of engine blades. This was different to quality assurance processes in a production environment since the parts were in used condition and with operational defects as opposed to manufacturing defects.
Second, the human performance in inspection was evaluated considering the false-positive rate and false-negative rate separately, in addition to the generic inspection accuracy metric. This included applying different agreement limits based on the type of inspection error and the associated risk on operational safety. In the case of aviation maintenance, the false-negative rate is arguably the single most important metric since it determines the safety outcomes (false positives only have cost implications). The results of this study show acceptable false-negative performance in 60% of appraisers. This sub-optimal false-negative performance is not necessarily a failure of the MRO system. From a Bowtie perspective, the results can be interpreted as an indication of the effectiveness of the visual inspection barrier, and the desirability to seek ways to improve the performance. Some suggestions are given in this regard.
Third, the present study was the biggest Attribute Agreement Analysis published in the literature in terms of the size of the research population. This allowed us to analyse the effect of the number of appraisers on the AAA metrics. Recommendations towards a somewhat optimal research population were made.
Several future work directions were recommended with the potential to overcome the limitations of the human operator and improve the inspection consistency, accuracy and reproducibility. This might contribute towards better inspection quality and reliability, and ultimately, lead to improved aviation safety.
Attribute Agreement Analysis has an important place in the wider safety processes, since it relates to the human reliability of the inspection process, and hence in the removal of defects from technical systems.

Author Contributions

Conceptualization, J.A.; methodology, J.A.; validation, J.A.; formal analysis, J.A.; investigation, J.A.; resources, D.P.; data curation, J.A.; writing—original draft preparation, J.A.; writing—review and editing, J.A. and D.P.; visualization, J.A.; supervision, D.P.; project administration, D.P.; funding acquisition, D.P. All authors have read and agreed to the published version of the manuscript.

Funding

This research project was funded by the Christchurch Engine Centre (CHCEC), a maintenance, repair and overhaul (MRO) facility based in Christchurch and a joint venture between the Pratt and Whitney (PW) division of Raytheon Technologies Corporation (RTC) and Air New Zealand (ANZ).

Institutional Review Board Statement

The study was conducted according to the guidelines of the Declaration of Helsinki and approved by the Human Ethics Committee of the University of Canterbury (HEC 2020/08/LR-PS approved on the 2 March 2020; HEC 2020/08/LR-PS Amendment 1 approved on the 28 August 2020).

Informed Consent Statement

Informed consent was obtained from all subjects involved in the study prior to experiment commencement.

Data Availability Statement

The authors confirm that the data supporting the findings of this study are available within the article and its appended materials. Any other data are not publicly available due to commercial sensitivity and data privacy.

Acknowledgments

We sincerely thank all staff from the Christchurch Engine Centre for participating in this study. We further thank everyone who supported this research in any form. In particular, we want to thank Ross Riordan and Marcus Wade.

Conflicts of Interest

J.A. was funded by a Ph.D. scholarship through this research project. The authors declare no other conflict of interest.

Appendix A

The individual inspection results are presented in Table A1, Table A2, Table A3, Table A4 and Table A5. Each table shows the number of inspected and matched blades, the agreement percentage (number of blades matched divided by the number of blades inspected) and the related 95% confidence interval (95% CI). Table A3 further shows the number of false positives (FP) and false negatives (FN) together with the resulting FP and FN rates. The ‘Mixed’ and ‘Imprecision’ columns show the number and proportion of inconsistent decisions, respectively.
Table A1. Summary of Inspection Consistency (Agreement within Appraiser).
AppraiserNumber
Inspected
Number
Matched
Agreement
Percentage
95% CI
12626100.00(89.12, 100.00)
2262284.62(65.13, 95.64)
3262076.92(56.35, 91.03)
4262492.31(74.87, 99.05)
5262284.62(65.13, 95.64)
6262180.77(60.65, 93.45)
7261973.08(52.21, 88.43)
8262076.92(56.35, 91.03)
9262492.31(74.87, 99.05)
10261765.38(44.33, 82.79)
11261869.23(48.21, 85.67)
12262180.77(60.65, 93.45)
13262284.62(65.13, 95.64)
14262388.46(69.85, 97.55)
15262596.15(80.36, 99.90)
16261765.38(44.33, 82.79)
17261869.23(48.21, 85.67)
18262180.77(60.65, 93.45)
19262076.92(56.35, 91.03)
20261869.23(48.21, 85.67)
21262180.77(60.65, 93.45)
22262492.31(74.87, 99.05)
23262388.46(69.85, 97.55)
24261453.85(33.37, 73.41)
25262492.31(74.87, 99.05)
26262596.15(80.36, 99.90)
27261869.23(48.21, 85.67)
28262180.77(60.65, 93.45)
29262388.46(69.85, 97.55)
30261973.08(52.21, 88.43)
31262492.31(74.87, 99.05)
32262284.62(65.13, 95.64)
33262076.92(56.35, 91.03)
34262180.77(60.65, 93.45)
352626100.00(89.12, 100.00)
36262388.46(69.85, 97.55)
37262180.77(60.65, 93.45)
38262388.46(69.85, 97.55)
39262596.15(80.36, 99.90)
402626100.00(89.12, 100.00)
41262596.15(80.36, 99.90)
42261350.00(29.93, 70.07)
43262388.46(69.85, 97.55)
44261765.38(44.33, 82.79)
452626100.00(89.12, 100.00)
46262492.31(74.87, 99.05)
47262284.62(65.13, 95.64)
48262388.46(69.85, 97.55)
49261973.08(52.21, 88.43)
50262076.92(56.35, 91.03)
Average2621.582.54(79.29, 85.79)
Table A2. Summary of Inspection Accuracy (Appraiser Agreement with Ground Truth).
AppraiserNumber
Inspected
Number
Matched
Agreement
Percentage
95% CI
1261453.85(33.37, 73.41)
2261765.38(44.33, 82.79)
3261869.23(48.21, 85.67)
4262076.92(56.35, 91.03)
5261869.23(48.21, 85.67)
6261869.23(48.21, 85.67)
7261661.54(40.57, 79.77)
8261869.23(48.21, 85.67)
9262284.62(65.13, 95.64)
10261557.69(36.92, 76.65)
11261661.54(40.57, 79.77)
12261869.23(48.21, 85.67)
13261869.23(48.21, 85.67)
14261765.38(44.33, 82.79)
15261869.23(48.21, 85.67)
16261765.38(44.33, 82.79)
17261557.69(36.92, 76.65)
18261661.54(40.57, 79.77)
19261453.85(33.37, 73.41)
20261869.23(48.21, 85.67)
21261973.08(52.21, 88.43)
22262284.62(65.13, 95.64)
23261869.23(48.21, 85.67)
24261453.85(33.37, 73.41)
25261973.08(52.21, 88.43)
26262180.77(60.65, 93.45)
27261661.54(40.57, 79.77)
28261453.85(33.37, 73.41)
29261869.23(48.21, 85.67)
30261765.38(44.33, 82.79)
31261661.54(40.57, 79.77)
32261869.23(48.21, 85.67)
33262076.92(56.35, 91.03)
34261973.08(52.21, 88.43)
35262284.62(65.13, 95.64)
36262180.77(60.65, 93.45)
37261661.54(40.57, 79.77)
38262180.77(60.65, 93.45)
39262388.46(69.85, 97.55)
40262076.92(56.35, 91.03)
41262076.92(56.35, 91.03)
42261142.31(23.35, 63.08)
43261869.23(48.21, 85.67)
44261038.46(20.23, 59.43)
45262076.92(56.35, 91.03)
46261661.54(40.57, 79.77)
47261973.08(52.21, 88.43)
48261869.23(48.21, 85.67)
49261557.69(36.92, 76.65)
50261661.54(40.57, 79.77)
Average2617.667.69(64.82, 70.56)
Table A3. Summary of Inspection Errors (Disagreement with Ground Truth).
AppraiserFalse Positives (FP)FP RateFalse Negatives (FN)FN RateMixedImprecision
11266.6700.0000.00
2527.7800.00415.38
3211.1100.00623.08
4422.2200.0027.69
500.00450.00415.38
6316.6700.00519.23
715.56225.00726.92
8211.1100.00623.08
9211.1100.0027.69
1000.00225.00934.62
1100.00225.00830.77
12316.6700.00519.23
1315.56337.50415.38
14633.3300.00311.54
1500.00787.5013.85
1600.0000.00934.62
17316.6700.00830.77
18527.7800.00519.23
19422.22225.00623.08
2000.0000.00830.77
2100.00225.00519.23
22211.1100.0027.69
23527.7800.00311.54
2400.0000.001246.15
25211.11337.5027.69
2600.00450.0013.85
27211.1100.00830.77
28316.67450.00519.23
2900.00562.50311.54
3000.00225.00726.92
31844.4400.0027.69
3200.00450.00415.38
3300.0000.00623.08
34211.1100.00519.23
35422.2200.0000.00
36211.1100.00311.54
37527.7800.00519.23
38211.1100.00311.54
39211.1100.0013.85
40633.3300.0000.00
4100.00562.5013.85
42211.1100.001350.00
43527.7800.00311.54
44527.78225.00934.62
45422.22225.0000.00
46844.4400.0027.69
4715.56225.00415.38
48211.11337.50311.54
49422.2200.00726.92
5000.00450.00623.08
Average2.5814.331.2816.004.5417.46
Table A4. Inspection Reproducibility (Agreement between Appraisers).
AppraiserNumber
Inspected
Number
Matched
Agreement
Percentage
95% CI
All26415.4%(4.36, 34.87)
Table A5. Inspection System Accuracy (All Appraisers vs. Ground Truth).
AppraiserNumber
Inspected
Number
Matched
Agreement
Percentage
95% CI
All26415.4%(4.36, 34.87)

References

  1. Marais, K.; Robichaud, M. Analysis of trends in aviation maintenance risk: An empirical approach. Reliab. Eng. Syst. Saf. 2012, 106, 104–118. [Google Scholar] [CrossRef]
  2. Reason, J.; Hobbs, A. Managing Maintenance Error: A Practical Guide; CRC Press: Boca Raton, FL, USA, 2017. [Google Scholar]
  3. Rankin, W.L.; Shappell, S.; Wiegmann, D. Error and Error Reporting Systems. Human Factors Guide for Aviation Maintenance and Inspection. 2003. Available online: https://www.faa.gov/about/initiatives/maintenance_hf/training_tools/media/hf_guide.pdf (accessed on 13 November 2021).
  4. Allen, J.; Marx, D. Maintenance Error Decision Aid Project (MEDA). In Proceedings of the Eighth Federal Aviation Administration Meeting on Human Factors Issues in Aircraft Maintenance and Inspection, Washington, DC, USA, 16–17 November 1993. [Google Scholar]
  5. UK CAA. CAP 1367–Aircraft Maintenance Incident Analysis. 2016. Available online: https://publicapps.caa.co.uk/modalapplication.aspx?appid=11&mode=detail&id=7185 (accessed on 14 November 2021).
  6. UK CAA. Aircraft Maintenance Incident Analysis. 2009. Available online: http://publicapps.caa.co.uk/modalapplication.aspx?appid=11&mode=detail&id=3609 (accessed on 14 November 2021).
  7. Insley, J.; Turkoglu, C. A Contemporary Analysis of Aircraft Maintenance-Related Accidents and Serious Incidents. Aerospace 2020, 7, 81. [Google Scholar] [CrossRef]
  8. Carter, T.J. Common failures in gas turbine blades. Eng. Fail. Anal. 2005, 12, 237–247. [Google Scholar] [CrossRef]
  9. Kumari, S.; Satyanarayana, D.; Srinivas, M. Failure analysis of gas turbine rotor blades. Eng. Fail. Anal. 2014, 45, 234–244. [Google Scholar] [CrossRef]
  10. Dewangan, R.; Patel, J.; Dubey, J.; Prakash, K.; Bohidar, S. Gas turbine blades–A critical review of failure at first and second stages. Int. J. Mech. Eng. Robot. Res. 2015, 4, 216–223. Available online: www.ijmerr.com/v4n1/ijmerr_v4n1_24.pdf (accessed on 13 November 2021).
  11. Rao, N.; Kumar, N.; Prasad, B.; Madhulata, N.; Gurajarapu, N. Failure mechanisms in turbine blades of a gas turbine Engine-an overview. Int. J. Eng. Res. Dev. 2014, 10, 48–57. [Google Scholar] [CrossRef]
  12. Rani, S. Common Failures in Gas Turbine Blade: A critical Review. Int. J. Eng. Sci. Res. Technol. 2018, 7, 799–803. [Google Scholar] [CrossRef]
  13. Latorella, K.; Prabhu, P. A review of human error in aviation maintenance and inspection. Int. J. Ind. Ergon. 2000, 14653, 133–161. [Google Scholar] [CrossRef]
  14. Gallwey, T.J. Evaluation and control of industrial inspection: Part I–Guidelines for the practitioner. In Ergonomics Guidelines and Problem Solving; Elsevier Ergonomics Book Series; Elsevier: Amsterdam, The Netherlands, 2000; Volume 1, pp. 301–312. [Google Scholar]
  15. Gallwey, T.J. Evaluation and control of industrial inspection: Part II–The scientific basis for the guide. In Ergonomics Guidelines and Problem Solving; Elsevier Ergonomics Book Series; Elsevier: Amsterdam, The Netherlands, 2000; Volume 1, pp. 313–327. [Google Scholar]
  16. Gramopadhye, A.K.; Drury, C.G. Human factors in aviation maintenance: How we got to where we are. Int. J. Ind. Ergon. 2000, 26, 125–131. [Google Scholar] [CrossRef]
  17. Civil Aviation Authority (CAA). CAP 715-An Introduction to Aircraft Maintenance Engineering Human Factors for JAR 66. 2002. Available online: https://publicapps.caa.co.uk/docs/33/CAP715.PDF (accessed on 17 November 2021).
  18. Webber, L.; Wallace, M. Quality Control for Dummies; John Wiley & Sons: Hoboken, NJ, USA, 2011. [Google Scholar]
  19. Raza, A.; Ulansky, V. Modelling of false alarms and intermittent faults and their impact on the maintenance cost of digital avionics. Procedia Manuf. 2018, 16, 107–114. [Google Scholar] [CrossRef]
  20. National Transportation Safety Board (NTSB). Southwest Airlines flight 1380 engine accident. Available online: https://www.ntsb.gov/investigations/Pages/DCA18MA142.aspx (accessed on 3 November 2018).
  21. National Transportation Safety Board (NTSB). United Airlines Flight 232 McDonnell Douglas DC-10-10. Available online: https://www.ntsb.gov/investigations/accidentreports/pages/AAR9006.aspx (accessed on 18 December 2018).
  22. Hobbs, A. An Overview of Human Factors in Aviation Maintenance. 2008. Available online: https://www.atsb.gov.au/media/27818/hf_ar-2008-055.pdf (accessed on 23 November 2021).
  23. Rankin, W. MEDA Investigation Process. In Boeing Commercial Aero; Boeing: Chicago, IL, USA, 2007; Available online: https://www.boeing.com/commercial/aeromagazine/articles/qtr_2_07/AERO_Q207_article3.pdf (accessed on 17 November 2021).
  24. Guerra, A.-S.; Pillet, M.; Maire, J.-L. Control of variability for man measurement. In Proceedings of the 12th IMEKO TC1 & TC7 Joint Symposium on Man Science & Measurement, Annecy, France, 3–5 September 2008. [Google Scholar]
  25. Simion, C. Evaluation of an attributive measurement system in the automotive industry. IOP Conf. Ser. Mater. Sci. Eng. 2016, 145, 052005. [Google Scholar] [CrossRef] [Green Version]
  26. Simion, C. Assessment of Human Capability, An Effective Tool to Obtain Confidence in the Visual Inspection Process. Acta Univ. Cibiniensis. Tech. Ser. 2018, 70, 1–6. [Google Scholar] [CrossRef] [Green Version]
  27. Simion, C. Measurement system analysis by attribute, an effective tool to ensure the quality of the visual inspection process within an organization. MATEC Web Conf. 2019, 290, 05004. [Google Scholar] [CrossRef]
  28. Aust, J.; Pons, D. Comparative Analysis of Human Operators and Advanced Technologies in the Visual Inspection of Aero Engine Blades. Appl. Sci. 2022, 12, 2250. [Google Scholar] [CrossRef]
  29. Gališanskis, A. Aspects of quality evaluation in aviation maintenance. Aviation 2004, 8, 18–26. [Google Scholar] [CrossRef]
  30. International Organization for Standardization. Quality Management Principles. 2015. Available online: https://www.iso.org/iso/pub100080.pdf (accessed on 18 March 2022).
  31. Rolls-Royce. Measurement System Analysis: How-to Guide. Version 6.1. 2013. Available online: https://suppliers.rolls-royce.com/GSPWeb/ShowProperty?nodePath=/BEA%20Repository/Global%20Supplier%20Portal/Section%20DocLink%20Lists/SABRe_2/Main/Column%201/SABRe%20Supplier%20Requirements_intro/Documents/SABRe2//file (accessed on 27 October 2021).
  32. Furterer, S.; Hernandez, E. Improving the Healthcare Quality Measurement System Using Attribute Agreement Analysis Assessing the Presence and Stage of Pressure Ulcers. Int. J. Stat. Probab. 2019, 8, 47. [Google Scholar] [CrossRef]
  33. Marques, C.; Lopes, N.; Santos, G.; Delgado, I.; Delgado, P. Improving operator evaluation skills for defect classification using training strategy supported by attribute agreement analysis. Measurement 2018, 119, 129–141. [Google Scholar] [CrossRef]
  34. Jarvis, H.L.; Nester, C.J.; Jones, R.K.; Williams, A.; Bowden, P.D. Inter-assessor reliability of practice based biomechanical assessment of the foot and ankle. J. Foot Ankle Res. 2012, 5, 14. [Google Scholar] [CrossRef] [Green Version]
  35. Aerospace Engine Supplier Quality (AESQ) Strategy Group. RM13003-Measurement Systems Analysis 2021, RM13003. Available online: https://www.sae.org/standards/content/aesqrm003202105/ (accessed on 29 October 2021).
  36. Wojtaszak, M.; Biały, W. Measurement system analysis of attribute or continuous data, as a one of the first steps in Lean Six Sigma projects. In Systems Supporting Production Engineering; Kaźmierczak, J., Ed.; PA NOVA: Gliwice, Poland, 2013; pp. 144–162. [Google Scholar]
  37. Schoonard, J.W.; Gould, J.D.; Miller, L.A. Studies of visual inspection. Ergonomics 1973, 16, 365–379. [Google Scholar] [CrossRef]
  38. Santiago, N.; Jorge, L. Attribute Data Treatment of Automated Inspection Vision System For Product Mix-Up Detection. Manufacturing Engineering. 2012. Available online: http://prcrepository.org:8080/xmlui/handle/20.500.12475/518 (accessed on 24 March 2022).
  39. Liu, D.; Zhu, M. Study on Repeatability Evaluation Method of Precision Automatic Inspecting Machine of Aviation Coupling Based on Independent Sub-Sample. In Proceedings of the International Conference on E-Product E-Service and E-Entertainment (ICEEE), Henan, China, 7–9 November 2010. [Google Scholar]
  40. Schneider, G.M.; Jull, G.; Thomas, K.; Smith, A.; Emery, C.; Faris, P.; Schneider, K.; Salo, P. Intrarater and interrater reliability of select clinical tests in patients referred for diagnostic facet joint blocks in the cervical spine. Arch. Phys. Med. Rehabil. 2013, 94, 1628–1634. [Google Scholar] [CrossRef]
  41. Elveru, R.A.; Rothstein, J.M.; Lamb, R.L. Goniometric reliability in a clinical setting. Subtalar and ankle joint measurements. Phys. Ther. 1988, 68, 672–677. [Google Scholar] [CrossRef] [PubMed]
  42. Keenan, A.-M.; Bach, T.M. Clinicians’ Assessment of the Hindfoot: A Study of Reliability. Foot Ankle Int. 2006, 27, 451–460. [Google Scholar] [CrossRef] [PubMed]
  43. Makrygianni, M. Aircraft accident evaluation using quality assessment tools. Aviation 2018, 22, 67–76. [Google Scholar] [CrossRef]
  44. Vassilakis, E.; Besseris, G. An application of TQM tools at a maintenance division of a large aerospace company. J. Qual. Maint. Eng. 2009, 15, 31–46. [Google Scholar] [CrossRef]
  45. Barbosa, G.F.; Peres, G.F.; Hermosilla, J.L.G. R&R (repeatability and reproducibility) gage study applied on gaps’ measurements of aircraft assemblies made by a laser technology device. Prod. Eng. 2014, 8, 477–489. [Google Scholar] [CrossRef]
  46. Fyffe, D.; Moran, J.; Kannaiyan, K.; Sadr, R.; Al-Sharshani, A. Effect of GTL-Like Jet Fuel Composition on GT Engine Altitude Ignition Performance: Part I—Combustor Operability. In Proceedings of the ASME 2011 Turbo Expo: Turbine Technical Conference and Exposition, Vancouver, BC, Canada, 6–10 June 2011; pp. 485–494. [Google Scholar]
  47. Elkady, A.M.; Herbon, J.; Kalitan, D.M.; Leonard, G.; Akula, R.; Karim, H.; Hadley, M. Gas Turbine Emission Characteristics in Perfectly Premixed Combustion. J. Eng. Gas Turbines Power 2012, 134, 061501. [Google Scholar] [CrossRef]
  48. Wang, Y.; Zhang, D.; Zhang, S.; Jia, Q.; Zhang, H. Quality Confirmation of Electrical Measurement Data for Space Parts Based on MSA Method; Springer: Singapore, 2020; pp. 344–351. [Google Scholar]
  49. Cotter, T.S.; Yesilbas, V. An Attribute Agreement Analysis Method for HFACS Inter-Rater Reliability Assessment. In Proceedings of the International Annual Conference of the American Society for Engineering Management (ASEM), Huntsville, AL, USA, 17–20 October 2018; pp. 1–12. [Google Scholar]
  50. Hawary, A.F.; Hoe, Y.H.; Bakar, E.A.; Othman, W.A.F.W. A Study of Gauge Repeatability and Reproducibility of The Back-End Semiconductor Lead Inspection System. ROBOTIKA 2019, 1, 1–6. Available online: http://www.technical-journals.org/index.php/ROBOTIKA/article/view/35 (accessed on 7 December 2021).
  51. Aust, J.; Mitrovic, A.; Pons, D. Comparison of Visual and Visual–Tactile Inspection of Aircraft Engine Blades. Aerospace 2021, 8, 313. [Google Scholar] [CrossRef]
  52. Aust, J.; Pons, D.; Mitrovic, A. Evaluation of Influence Factors on the Visual Inspection Performance of Aircraft Engine Blades. Aerospace 2022, 9, 18. [Google Scholar] [CrossRef]
  53. Aust, J.; Mitrovic, A.; Pons, D. Assessment of the Effect of Cleanliness on the Visual Inspection of Aircraft Engine Blades: An Eye Tracking Study. Sensors 2021, 21, 6135. [Google Scholar] [CrossRef]
  54. AS13100; AESQ Quality Management System Requirements for Aero Engine Design and Production Organizations. SAE International: Warrendale, PA, USA, 2021; p. 84. [CrossRef]
  55. Hunt, R.J. Percent agreement, Pearson’s correlation, and kappa as measures of inter-examiner reliability. J. Dent. Res. 1986, 65, 128–130. [Google Scholar] [CrossRef] [PubMed]
  56. Viera, A.J.; Garrett, J.M. Understanding interobserver agreement: The kappa statistic. Fam. Med. 2005, 37, 360–363. [Google Scholar] [PubMed]
  57. Landis, J.R.; Koch, G.G. The Measurement of Observer Agreement for Categorical Data. Biometrics 1977, 33, 159–174. [Google Scholar] [CrossRef] [PubMed] [Green Version]
  58. Aust, J.; Pons, D. Methodology for Evaluating Risk of Visual Inspection Tasks of Aircraft Engine Blades. Aerospace 2021, 8, 117. [Google Scholar] [CrossRef]
  59. Spencer, F.W. Visual Inspection Research Project Report on Benchmark Inspections; Aging Aircraft NDI Validation Center (AANC), Sandia National Labs.: Albuquerque, NM, USA, 1996.
  60. Waite, S. Defect Types and Inspection. In Proceedings of the MIL17 Maintenance Workshop, Chicago, IL, USA, 19–21 July 2006. [Google Scholar]
  61. Brunyé, T.T.; Drew, T.; Weaver, D.L.; Elmore, J.G. A review of eye tracking for understanding and improving diagnostic interpretation. Cogn. Res. Princ. Implic. 2019, 4, 7. [Google Scholar] [CrossRef] [PubMed]
  62. Hrymak, V.; Codd, P. Improving Visual Inspection Reliability in Aircraft Maintenance. In Proceedings of the ESREL2021: 31st European Safety and Reliability Conference, Angers, France, 19–23 September 2021; pp. 1355–1362. [Google Scholar]
  63. Shankar, R. Process Improvement Using Six Sigma: A DMAIC Guide; ASQ Quality Press: Milwaukee, WI, USA, 2009. [Google Scholar]
  64. Al-Mishari, S.T.; Suliman, S. Integrating Six-Sigma with other reliability improvement methods in equipment reliability and maintenance applications. J. Qual. Maint. Eng. 2008, 14, 59–70. [Google Scholar] [CrossRef]
  65. Prabuwono, A.S.; Usino, W.; Yazdi, L.; Basori, A.H.; Bramantoro, A.; Syamsuddin, I.; Yunianta, A.; Allehaibi, K.; Allehaibi, S. Automated Visual Inspection for Bottle Caps Using Fuzzy Logic. TEM J. 2019, 8, 107–112. [Google Scholar] [CrossRef]
  66. Ebadi, M.; Bagheri, M.; Lajevardi, M.S.; Haas, B. Defect Detection of Railway Turnout Using 3D Scanning; Springer International Publishing: Cham, Switzerland, 2019; pp. 1–18. [Google Scholar]
  67. Huang, S.-H.; Pan, Y.-C. Automated visual inspection in the semiconductor industry: A survey. Comput. Ind. 2015, 66, 1–10. [Google Scholar] [CrossRef]
  68. Chin, R.T.; Harlow, C.A. Automated Visual Inspection: A Survey. IEEE Trans. Pattern Anal. Mach. Intell. 1982, PAMI-4, 557–573. [Google Scholar] [CrossRef]
Figure 1. Research approach.
Safety 08 00023 g001
Figure 2. Sample blades: (a) airfoil dent, (b) nick on leading edge, (c) non-defective.
Safety 08 00023 g002
Figure 3. Agreement within appraiser graph. There are two agreement thresholds, namely acceptable agreement and excellent agreement indicated by the red and green line respectively. Data for static images only, without the usual ability to view the blade from different perspectives and tactile feeling of the blade.
Safety 08 00023 g003
Figure 4. Agreement between appraisers by decision correctness. Data for static images only, without the usual ability to view the blade from different perspectives and tactile feeling of the blade.
Safety 08 00023 g004
Figure 5. Appraiser agreement with ground truth. There are two agreement thresholds, namely acceptable agreement and excellent agreement indicated by the red and green line respectively. Data for static images only, without the usual ability to view the blade from different perspectives and tactile feeling of the blade.
Safety 08 00023 g005
Figure 6. Effect of expertise on inspection consistency. Data for static images only, without the usual ability to view the blade from different perspectives and tactile feeling of the blade.
Safety 08 00023 g006
Figure 7. Effect of expertise on inspection accuracy. Data for static images only, without the usual ability to view the blade from different perspectives and tactile feeling of the blade.
Safety 08 00023 g007
Figure 8. Appraiser Accuracy vs. Appraiser Consistency with agreement limits. Data for static images only, without the usual ability to view the blade from different perspectives and tactile feeling of the blade.
Safety 08 00023 g008
Table 1. Agreement acceptance limits as per AS13100 [54].
Attribute AgreementExcellentAcceptableUnacceptable
Appraiser Consistency>90%80–90%<80%
Agreement between Appraisers>90%80–90%<80%
Appraiser Agreement with Ground Truth>90%80–90%<80%
All Appraisers with Ground Truth>90%80–90%<80%
Table 2. Agreement acceptance limits for false positives (FP) and false negatives (FN) as per AS13100 [54].
Attribute MetricsFalse PositiveFalse Negative
Appraiser Agreement with Ground Truth>75%>95%
Table 3. Kappa values and interpretation [57].
Kappa ValuesAgreement Class
κ > 0.80Almost perfect agreement
0.80 ≥ κ > 0.60Substantial agreement
0.60 ≥ κ > 0.40Moderate agreement
0.40 ≥ κ > 0.20Fair agreement
0.20 ≥ κ > 0Slight agreement
κ ≤ 0Poor agreement
Table 4. Summary of Attribute Agreement Analysis results.
MetricPercent Agreement (95% CI)
Appraiser Consistency82.5 (79.3, 85.8)
Appraiser Accuracy67.7 (64.8, 70.6)
Appraiser Reproducibility15.4 (4.36, 34.87)
All Appraisers Agreement with Ground Truth15.4 (4.36, 34.87)
Table 5. Summary of Kappa values by agreement metrics.
Kappa ValueAgreement LevelDistribution of Achieved ‘Agreement with Themselves’Distribution of Achieved
‘Agreement with Ground Truth’
1.00 ≥ κ > 0.80Almost perfect agreement12 (24%)0 (0%)
0.80 ≥ κ > 0.60Substantial agreement14 (28%)11 (22%)
0.60 ≥ κ > 0.40Moderate agreement11 (22%)22 (44%)
0.40 ≥ κ > 0.20Fair agreement7 (14%)12 (24%)
0.20 ≥ κ > 0.00Slight agreement0 (0%)4 (8%)
κ ≤ 0.00Poor agreement6 (12%)1 (2%)
Table 6. Repeated AAA with varying appraiser numbers.
Number of AppraisersAppraiser
Consistency
Appraiser
Accuracy
Appraiser
Reproducibility
All Appraisers vs. Ground Truth
276.9%63.1%65.4%57.7%
581.5%63.9%30.8%30.8%
1082.7%66.2%23.1%23.1%
1579.2%64.9%23.1%23.1%
2080.0%69.5%23.1%23.1%
3080.8%69.2%15.4%15.4%
5082.5%67.7%15.4%15.4%
Publisher’s Note: MDPI stays neutral with regard to jurisdictional claims in published maps and institutional affiliations.

