Article

Air Force Pilot Expertise Assessment during Unusual Attitude Recovery Flight

1
Department of Molecular Medicine, Sapienza University of Rome, Piazzale Aldo Moro 5, 00185 Rome, Italy
2
BrainSigns Srl, Lungotevere Michelangelo 9, 00192 Rome, Italy
3
Department of Anatomical, Histological, Forensic and Orthopaedic Sciences, Sapienza University of Rome, Piazzale Aldo Moro 5, 00185 Rome, Italy
4
Italian Air Force, Operations Group Division, Via Ponte Rosso, 44028 Poggio Renatico, Italy
5
Italian Air Force, Operations Group Division, Via Pratica di Mare 45, 00071 Pomezia, Italy
6
Italian Air Force, Aerospace Test Division, Aerospace Medicine Department, Pratica di Mare AFB, Via Pratica di Mare 45, 00040 Pomezia, Italy
7
Italian Air Force Health Service, Viale Piero Gobetti, 2, 00185 Rome, Italy
8
Brainy Solutions Enterprise Srl, piazza Lorenzo Lotto 11, 00147 Rome, Italy
9
College of Computer Science and Technology, Hangzhou Dianzi University, Hangzhou 310005, China
*
Author to whom correspondence should be addressed.
Safety 2022, 8(2), 38; https://doi.org/10.3390/safety8020038
Submission received: 22 January 2022 / Revised: 14 April 2022 / Accepted: 11 May 2022 / Published: 13 May 2022

Abstract

:
Pilot training and expertise are key aspects in aviation. A traditional way of evaluating pilot expertise is to measure performance output. However, this approach provides a narrow view of the pilot’s capacity, especially with regard to mental and emotional profile. The aim of this study is hence to investigate whether neurophysiological data can be employed as an additional objective measure to assess the expertise of pilots. In this regard, it has been demonstrated that mental effort can be used as an indirect measure of operator expertise and capacity. An increase in mental effort, for instance, can automatically result in a decrease in the remaining capacity of the operator. To better investigate this aspect, we ask two groups of Italian Air Force pilots, experienced (Experts) and unexperienced (Novices), to undergo unusual attitude recovery flight training simulations. Their behavioral (unusual attitude recovery time), subjective (mental effort demand perception) and neurophysiological data (Electroencephalogram, EEG; Electrocardiogram, ECG) are collected during the entire flight simulations. Although the two groups do not exhibit differences in terms of unusual attitude recovery time and mental effort demand perception, the EEG-based mental effort index shows how Novices request significantly higher mental effort during unusual conditions.

1. Introduction

When flight training simulations are used to evaluate and compare the utility of tactical operating procedures, the competence and expertise of the pilots are essential. Military pilots are often required to constantly make quick decisions in a rapidly changing environment and to perform cognitively challenging tasks under immense temporal pressure [1,2,3]. Flight training simulations are therefore crucial to their ability to perform and deal with emergencies and unexpected situations. Flight training is characterized by a mixture of factors, such as training content, training environment, use of tools, procedures and decision making, which increase the complexity of training and entail many cognitive processes [4,5,6,7]. Pilot expertise can be measured through several tools.
Conventional methods to gather information about pilots’ psychophysical and operational status and to evaluate their expertise are typically based on expert supervision (briefing and de-briefing), self-reports or performance statistics [8,9]. For example, a conventional metric for evaluating pilot experience and capacity is the number of hours flown (NHF). This is a good and valuable parameter for understanding these aspects, but it does not provide any insight about the mental effort requested by the pilot while performing specific flight phases. For example, a pilot can have a high NHF, but in a specific moment or situation, due to intense work shift or schedule or personal reasons (e.g., bad arguments or stressful events right before the flight), a standard and simple flight may be very demanding. From this perspective, it is clear how the NHF cannot provide any information about a pilot’s capacity. Furthermore, these measurements are highly operator-dependent (who may be prone to personal experiences and cognitive and emotional biases), require interrupting the execution of tasks (invasiveness and low temporal resolution) and do not include information related to teamwork (paucity of user’s insights). It is therefore clear how these measurements alone cannot be used to accurately and properly assess a pilot’s expertise. Neurophysiological measures (e.g., Electroencephalogram, EEG; Electrocardiogram, ECG) have gained momentum in different research and operative areas and represent an objective, unobtrusive and powerful tool to determine a user’s affective–cognitive state on the basis of mind–body relations [10,11].
In this regard, Human Factors (HFs) and Crew Resource Management (CRM) refer to psychological concepts linked to cognitive and emotional processes, such as Mental Effort, characterizing and affecting individual behavior [12]. Mental effort represents the amount of cognitive resources involved in performing a task [13,14,15,16,17,18]. It is seen as a combination of perceived demand characteristics, depth of information processing and personal expertise [13,15]. Perceived demand characteristics mainly depend on the inherent complexity of the task content, which is related to the degree of interaction between various information elements [15]. In other words, mental effort can be used as an indirect measure of operator capacity. An increase in mental effort, for instance, can automatically result in a decrease in the remaining cognitive capacity of an operator (spare cognitive capacity) [19]. In this regard, recent advances in neuroimaging techniques, such as functional Magnetic Resonance Imaging (fMRI), Regional Cerebral Blood Flow (rCBF), Positron Emission Tomography (PET), Magnetoencephalogram (MEG) and Electroencephalogram (EEG) allow cognitive processing and its neural correlates to be studied noninvasively in humans. For example, efforts have been made to use these techniques to examine brain regions involved in calculation [20,21], long term potentiation [22], encoding of new information [23,24], successful maintenance of information in memory [25], performance monitoring [26,27,28,29], attention [30,31,32] and working memory [33,34,35,36,37,38,39,40]. All these aspects are linked to mental effort. These studies suggest and discuss the roles of the dominant brain hemisphere and of different cortical areas in these mental functions. In particular, rCBF, fMRI and PET studies showed increased blood flow in the prefrontal cortex, specifically in the Anterior Cingulate Cortex (ACC) [41,42,43,44]. EEG results showed increased frontal EEG activity in theta band (4–8 Hz) associated with the performance of various mental tasks [3,27,29,36,38,45,46]. In other words, increases in EEG theta activity with task difficulty suggest that this brain activity is related to the mental load allocated to task performance. This effect is present regardless of task modality [47]. Furthermore, MEG studies localized the electrical current dipoles responsible for the magnetic frontal theta wave [42,48]. The current dipole of the frontal theta wave is found not necessarily in the midline part but is distributed in relatively wide areas of the frontal lobes of both left and right hemispheres. Moreover, it was always found that the current dipoles for the frontal theta wave dynamically move around in the frontal lobes of both left and right hemispheres during mental activities. Such findings can be explained by a vector summation of the multiple electrical current dipoles scattered in the left and right frontal lobes. Possibly many current dipoles successively occur in wide areas of the frontal lobes on both sides, and some of them may be synchronized in phase [42,48]. These studies have hence shown that the frontal brain areas and theta activity are reliable indicators of mental effort elicited by tasks of varying complexity. Among the mentioned techniques, in our study, we employed the EEG because of its time resolution, portability and usability in real settings. Moreover, other physiological measures have been shown to be sensitive to mental effort. Heart rate variability (HRV) in studies with military populations, for instance, was found to increase with an increase in mental effort [49,50]. Higher levels of resting vagally mediated HRV are linked to the performance of executive functions, such as attention and emotional processing by the prefrontal cortex [51]. Afferent information processing by the intrinsic cardiac nervous system can modulate frontal-cortical activity and impact higher-level functions [52].
The computation of a synthetic neurophysiological index can therefore radically change the entire field of pilot expertise assessment and comparison with respect to a population of experienced ones. In fact, the capability of having a reference value (threshold) that estimates how much each pilot deviates would be very useful for training program management.
With these challenges in mind, this work aimed at investigating the benefit of employing neurophysiological measures (EEG and ECG), in combination with the conventional ones, to provide an additional and objective measure for more accurate pilot expertise assessment and comparison. In this regard, as mentioned above, the number of hours flown (NHF) represents overall information about the flight experience of a pilot, but it does not provide the instructor with any online information while dealing with flight simulations in order to, for example, identify mental effort peaks corresponding to particular procedures, maneuvers or conditions so the instructor can better tailor the training program, nor does the NHF provide any insight related to the amount of cognitive resources requested by the pilots to handle such flight situations. In this regard, we gathered neurophysiological, behavioral and subjective data from Expert and Novice pilots while performing the same flight training simulation, evaluated the results derived from the different measures and finally proposed a metric by which to quantify the expertise of Novices with respect to Experts regarding mental effort requested.

2. Materials and Methods

2.1. Experimental Subjects

A total of 13 pilots from the 61° Stormo of the Italian Air Force base in Galatina (Lecce, Italy) took part in the study. The pilots were selected on the basis of their rank and flight experience, and then they were divided into two groups according to the latter parameters. A group of 6 Expert pilots (mean age: 34 ± 3 y, mean flight experience: 1450 NHF, 467 h on the MB339) and a group of 7 Novice pilots (mean age: 26 ± 1 y, mean flight experience: 157 NHF, 37 h on the MB339 airplane). The flight simulations were conducted with the flight simulator of the MB339, an alpha airplane. Figure 1 shows the experimental setup in the Italian Air Force simulator facility. The experiments were conducted following the principles outlined in the Declaration of Helsinki of 1975, as revised in 2000. The experiments were approved by the Ethical Committee of the Sapienza University of Rome (protocol code 1211/2014). Informed consent was obtained from each subject on paper after the study explanation, and all the data were pseudonymized to prevent any association with subject identity.

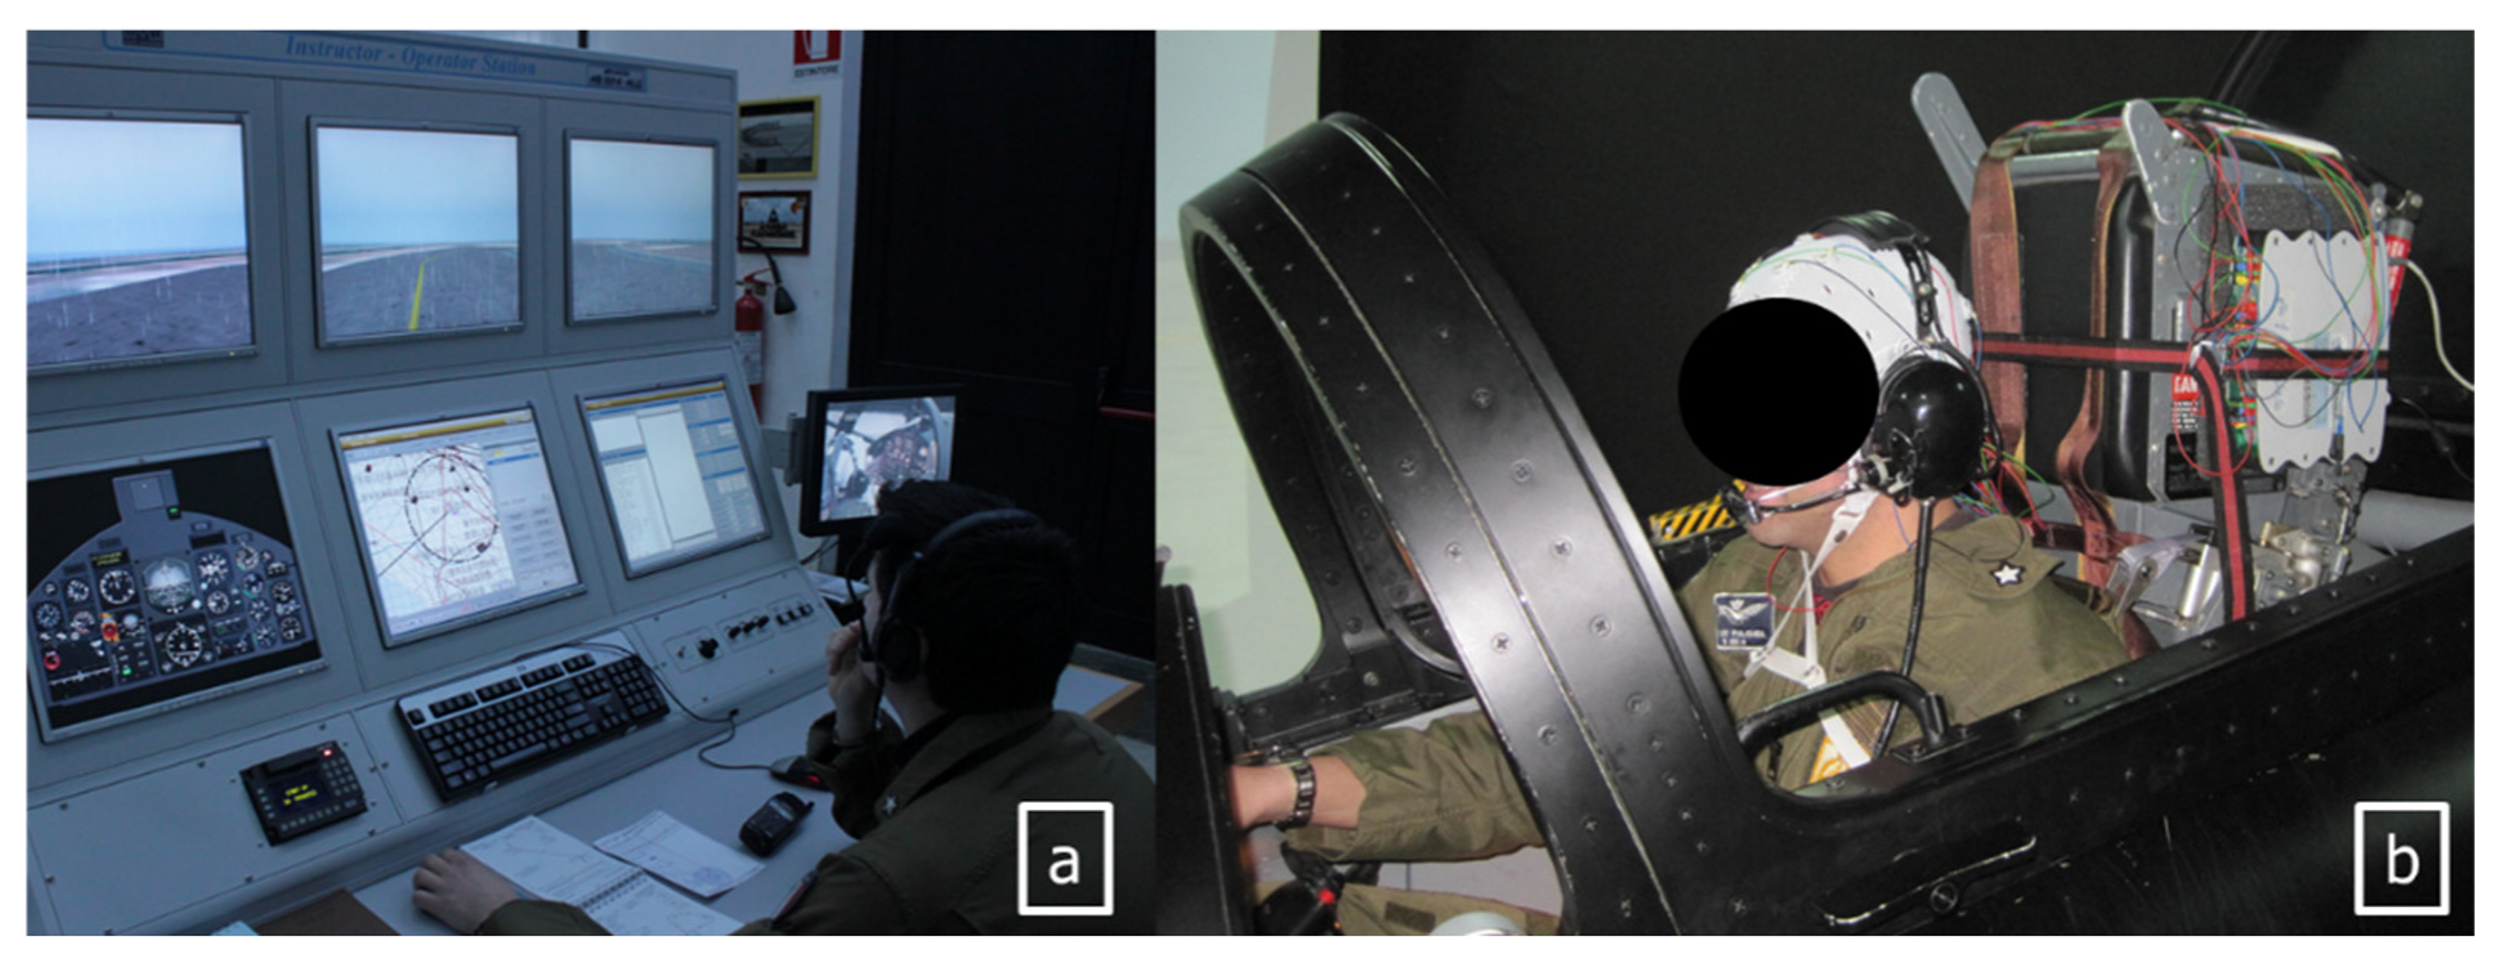
2.2. Flight Simulation

The flight simulations consisted of training on recovery from unusual attitudes. The pilots took off from the 61° Stormo Base in Galatina (TOFF), climbed to the flight level specified (CLIMB) and then reached the training area. Once there, the pilots were asked to read some information on the Flight Information Publication (FIP) book while the instructor was taking the airplane to the unusual attitude from the remote-control station (Figure 1a). In particular, the three unusual attitude conditions were Nose-Down (UPSET_1), Nose-Up (UPSET_2) and Spin (UPSET_3), and they were initiated only after the pilots recovered the airplane attitude. The time for recovering each of these unusual attitudes (URT) was considered a behavioral measure. The flight simulation scenario also included two failures. The first one (FAIL_E) occurred during the taxi phase (TAXI) and consisted of an electrical problem with the gear, and the second one was the AC Essential Bus failure (FAIL_AC), which was induced a couple of minutes after the end of the recovery training phase. After the pilots solved the FAIL_AC, they headed back to the base for landing (LAND).

2.3. Neurophysiological Signal Recording

For this experiment, a standard 10–20 EEG cap with 16 gel-based passive Ag/AgCl electrodes and a g.USBAMP EEG amplifier (g-tec GmbH, Schiedlberg, Austria) were used to acquire the pilots’ neurophysiological signals. In particular, the EEG signals were recorded with a sampling frequency of 256 Hz through 15 channels referenced to both the earlobes, and the investigated scalp positions were Fpz, AF3, AF4, F3, Fz, F4, C3, Cz, C4, T7, T8, P3, Pz, P4 and POz. The pilots’ heart activity (ECG signal) was recorded synchronously with the EEG and with the same sampling frequency from the 16th electrode placed on the pilots’ chest. The impedances of the electrodes were kept below 10 kΩ. Due to technical issues during the experiments, two of the Novice datasets were discarded. After equipment and pilot preparation, the flight simulation started, and it lasted about 1 h and 30 min on average.

2.4. Subjective Assessment: Likert Scale

At the end of the flight simulation, the pilots filled in a 5-point Likert scale to obtain a subjective measure of the pilots’ mental effort demand perception throughout the different phases of the flight simulation [53,54]. The Likert scale consisted of a 5-point scale, where the value “1” means “very easy” and “5” is “very demanding”. The question “how demanding was the X phase”, where X = READY; TAXI; FAIL_E; TOFF; CLIMB; UPSET#1; UPSET#2; UPSET#3; FAIL_AC; LAND, was listed for each flight phase on a paper sheet, and the pilots and SME had to provide their score (from 1 to 5) next to the different items. The Likert scale was filled at the end of the simulation to avoid any interference during the experiment and to keep the flight simulation as realistic as possible. The instructor (Subject Matter Expert, SME) also provided a unique subjective assessment of the different flight phases.

2.5. Mental Effort (MEF) Index Estimation

The EEG signal was firstly band-pass filtered with a 5th-order Butterworth filter in an interval of 2–30 Hz. The blink artifacts were detected by the Reblinca method [55] and were corrected by leveraging the ocular component estimated through a multi-channel Wiener Filter (MWF) [56]. Since the EEG is a non-stationary signal [57,58] for the estimation of any temporal (mean, median, standard deviation) or frequency (Power Spectral Density, PSD; Global Field Power, GFP) parameter, it is necessary to satisfy some preliminary criteria of stationarity. One of the most common ways for making the EEG stationary is to segment it into epochs of 1 or 2 s. In fact, it has been widely demonstrated that, within such a period of time, the EEG can be considered stationary [58,59]; therefore, the estimation of the temporal and frequency parameters are reliable. From this perspective, the EEG signals were then segmented into epochs of 1 s. From this perspective, the EEG signals were then segmented into epochs of 1 s, and if the EEG signal amplitude exceeded ±80 μV, the corresponding epoch was marked as an artifact (threshold criterion). From the artifact-free EEG, the Global Field Power (GFP) [60,61] was calculated for the EEG frequency band of interest, which is the theta band.
This band was defined accordingly with the Individual Alpha Frequency (IAF) value [24]. Since the alpha peak is mainly prominent during rest conditions, the pilots were asked to rest and keep their eyes open for a minute before starting the flight simulation (EC condition). Such a condition was then used to estimate the IAF value specifically for each pilot. Consequently, the EEG theta band was defined as [(IAF−6) ÷ (IAF−2)] Hz. Among the EEG channels and based on the objective of this work, only the frontal ones (AF3, AF4, Fz, F3 and F4) were considered. In fact, as described previously, it has been widely demonstrated that brain activity in the theta (ϑ) frequency band estimated over the frontal channels is linked to mental effort changes. We have therefore calculated the GFP in the theta band over the frontal channels, and then we averaged these values to provide a synthetic Mental Effort Index (MEF) for each pilot and within each flight phase. In particular, the MEF index was defined according to the literature and previous results as:
M E F = G F P ϑ A F 3 ,   A F 4 ,   F z ,   F 3 ,   F 4 = 1 N   1 N x ϑ ,   i 2 t
where the average of the squared EEG signals (x) was filtered in the theta band (ϑ) over the frontal brain areas (N = 5 electrodes) [62]. As demonstrated by the studies mentioned previously, we expected to find an increase in the pilots’ MEF index, with an increase in the mental effort demand of the flight phases.

2.6. Heart Rate Variability (HRV) Estimation

The ECG was filtered using a 5th-order Butterworth band-pass filter (high-pass filter: cut-off frequency fc = 5 Hz; low-pass filter: cut-off frequency fc = 15 Hz) to reject the continuous component and the high-frequency interferences, such as that which was related to the main power source.
The following step consisted of measuring the distance between consecutive R peaks (each R peak corresponds to a heartbeat) of the ECG signal to estimate heart rate (HR) values and thus the tachogram. In this regard, the Pan–Tompkins algorithm [63] was employed. Other artifacts of the HR signal were automatically corrected using the HRVAS suite [64]. Finally, a spectral analysis of the HR signal was performed to estimate the HRV using the Lomb–Scargle periodogram. This method has been demonstrated to produce much more accurate estimates of the Power Spectral Density (PSD) than Fast Fourier Transform (FFT) methods for typical HR data [65]. Since the HR data are unevenly sampled, another advantage of the Lomb–Scargle method is that it can be used without the need to resample and de-trend the RR data [66] in contrast with FFT-based methods.
Thirty-second windows were considered to obtain a frequency resolution of 0.033 Hz and to allow the analysis of the characteristic HRV frequency sub-bands. In particular, in line with the scientific literature [67], the PSD of the HR signal was computed. Among the frequency components, low (LF: 0.04 ÷ 0.15 Hz) and high frequencies (HF: 0.15 ÷ 0.4 Hz) were considered, and the LF–HF index was defined according to the literature as:
L F H F = L F H F
The LF–HF estimates the ratio between sympathetic nervous system (SNS) and parasympathetic nervous system (PNS) activity under controlled conditions. The assumptions underlying the LF/HF ratio are that LF power may be generated by the SNS and that HF power is produced by the PNS. In this model, a low LF/HF ratio reflects parasympathetic dominance. This is seen when we conserve energy and engage in tend-and-befriend behaviors. In contrast, a high LF/HF ratio indicates sympathetic dominance, which occurs when we engage in fight-or-flight behaviors or parasympathetic withdrawal [68,69]. In other words, we expected to see an increase in the LF–HF index when the mental effort demand increased.

2.7. Statistical and Correlation Analyses

The MEF, LF–HF and LIK scores were normalized for each pilot to obtain comparable values and to perform group statistics. In particular, the MEF and LF–HF of each pilot was normalized by using the mean and standard deviation of the corresponding resting condition (EC) distribution. These parameters were then used to calculate the z-score [70,71,72] values of the remaining experimental conditions.
The LIK score values were normalized within the [0 ÷ 1] range by the following formula:
N o r m a l i s e d   L I K   s c o r e =   L I K   s c o r e min L I K   s c o r e ( max L I K   s c o r e min L I K   s c o r e ,
where min(LIK score) is the minimum, and max(LIK score) is the maximum value of the LIK score distribution of the pilot that was considered. Group statistics were performed on the normalized parameters. In particular, the Wilcoxon signed-rank test was employed to compare the different parameters of the two groups with a statistical significance of α = 0.05. Due to the small sample size, we could not perform repeated-measures analysis. However, we wanted to perform statistics to provide preliminary and useful evidence to assess pilot expertise. We therefore employed only pairwise tests on the average values of each specific flight condition between the two groups (Experts vs. Novices), where no multiple comparison correction (i.e., Bonferroni correction) was necessary.
Furthermore, Pearson’s correlation analyses were performed among the LIK scores of the Experts, Novices and SME to investigate how mental effort perception may differ based on expertise and user perspective (user dealing with the task vs. external supervisor).
Finally, Pearson’s correlation analyses were performed between the LIK score of the pilots and the corresponding EEG-based MEF index values to evaluate coherence between subjective and neurophysiological measures. Since the degrees of freedom (df) for correlation analysis are the total number of score pairs (N: number of flight phases = 10) minus 2, for our analyses, the degrees of freedom of the correlation analyses performed in our study are df = 10 − 2 = 8.

3. Results

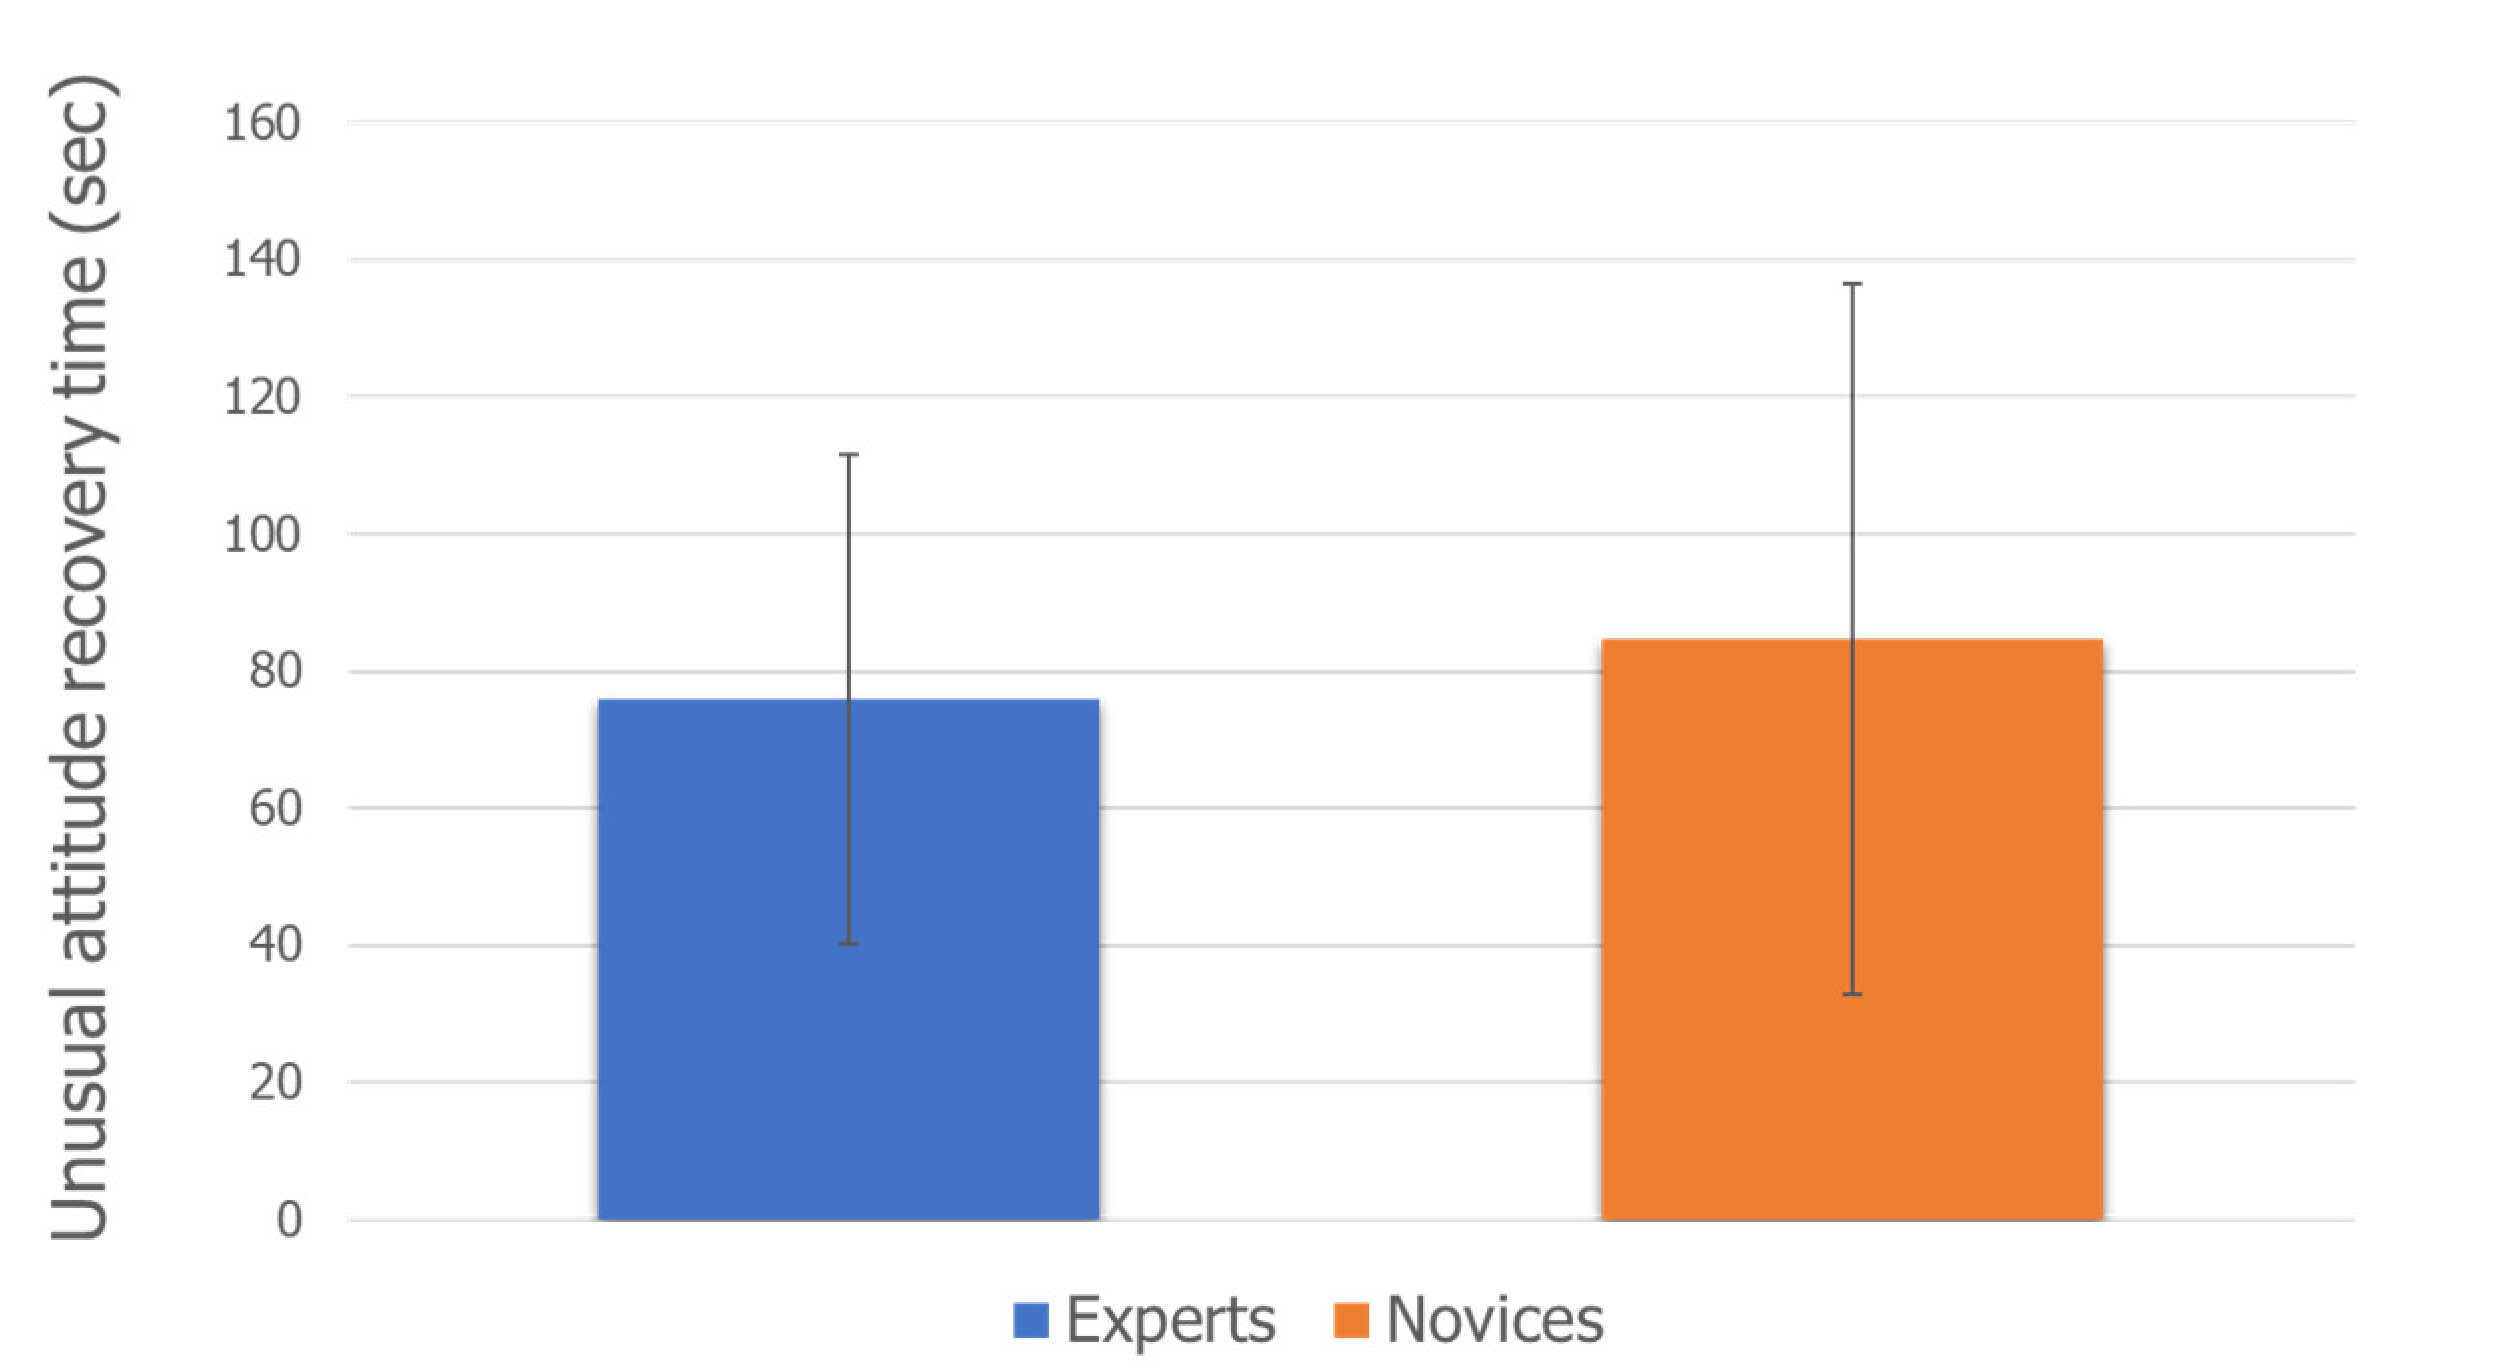
3.1. Recovery Time of the Unusual Attitude Conditions

The Wilcoxon signed-rank test between the unusual attitude recovery time (URT) of the Experts (blue bar) and Novices (orange bar) did not report any significant (p = 0.73) difference (Figure 2). In other words, the behavioral measures of the two groups during the unusual attitude conditions, which are the time to realize that the aircraft had entered an unusual attitude, take back the aircraft control, understand the situation and apply the right procedure to recover aircraft attitude, did not differ significantly. In particular, the median URT to deal with the unusual attitude conditions for the Experts was 78 s, whereas the median URT for the Novices was 76 s.

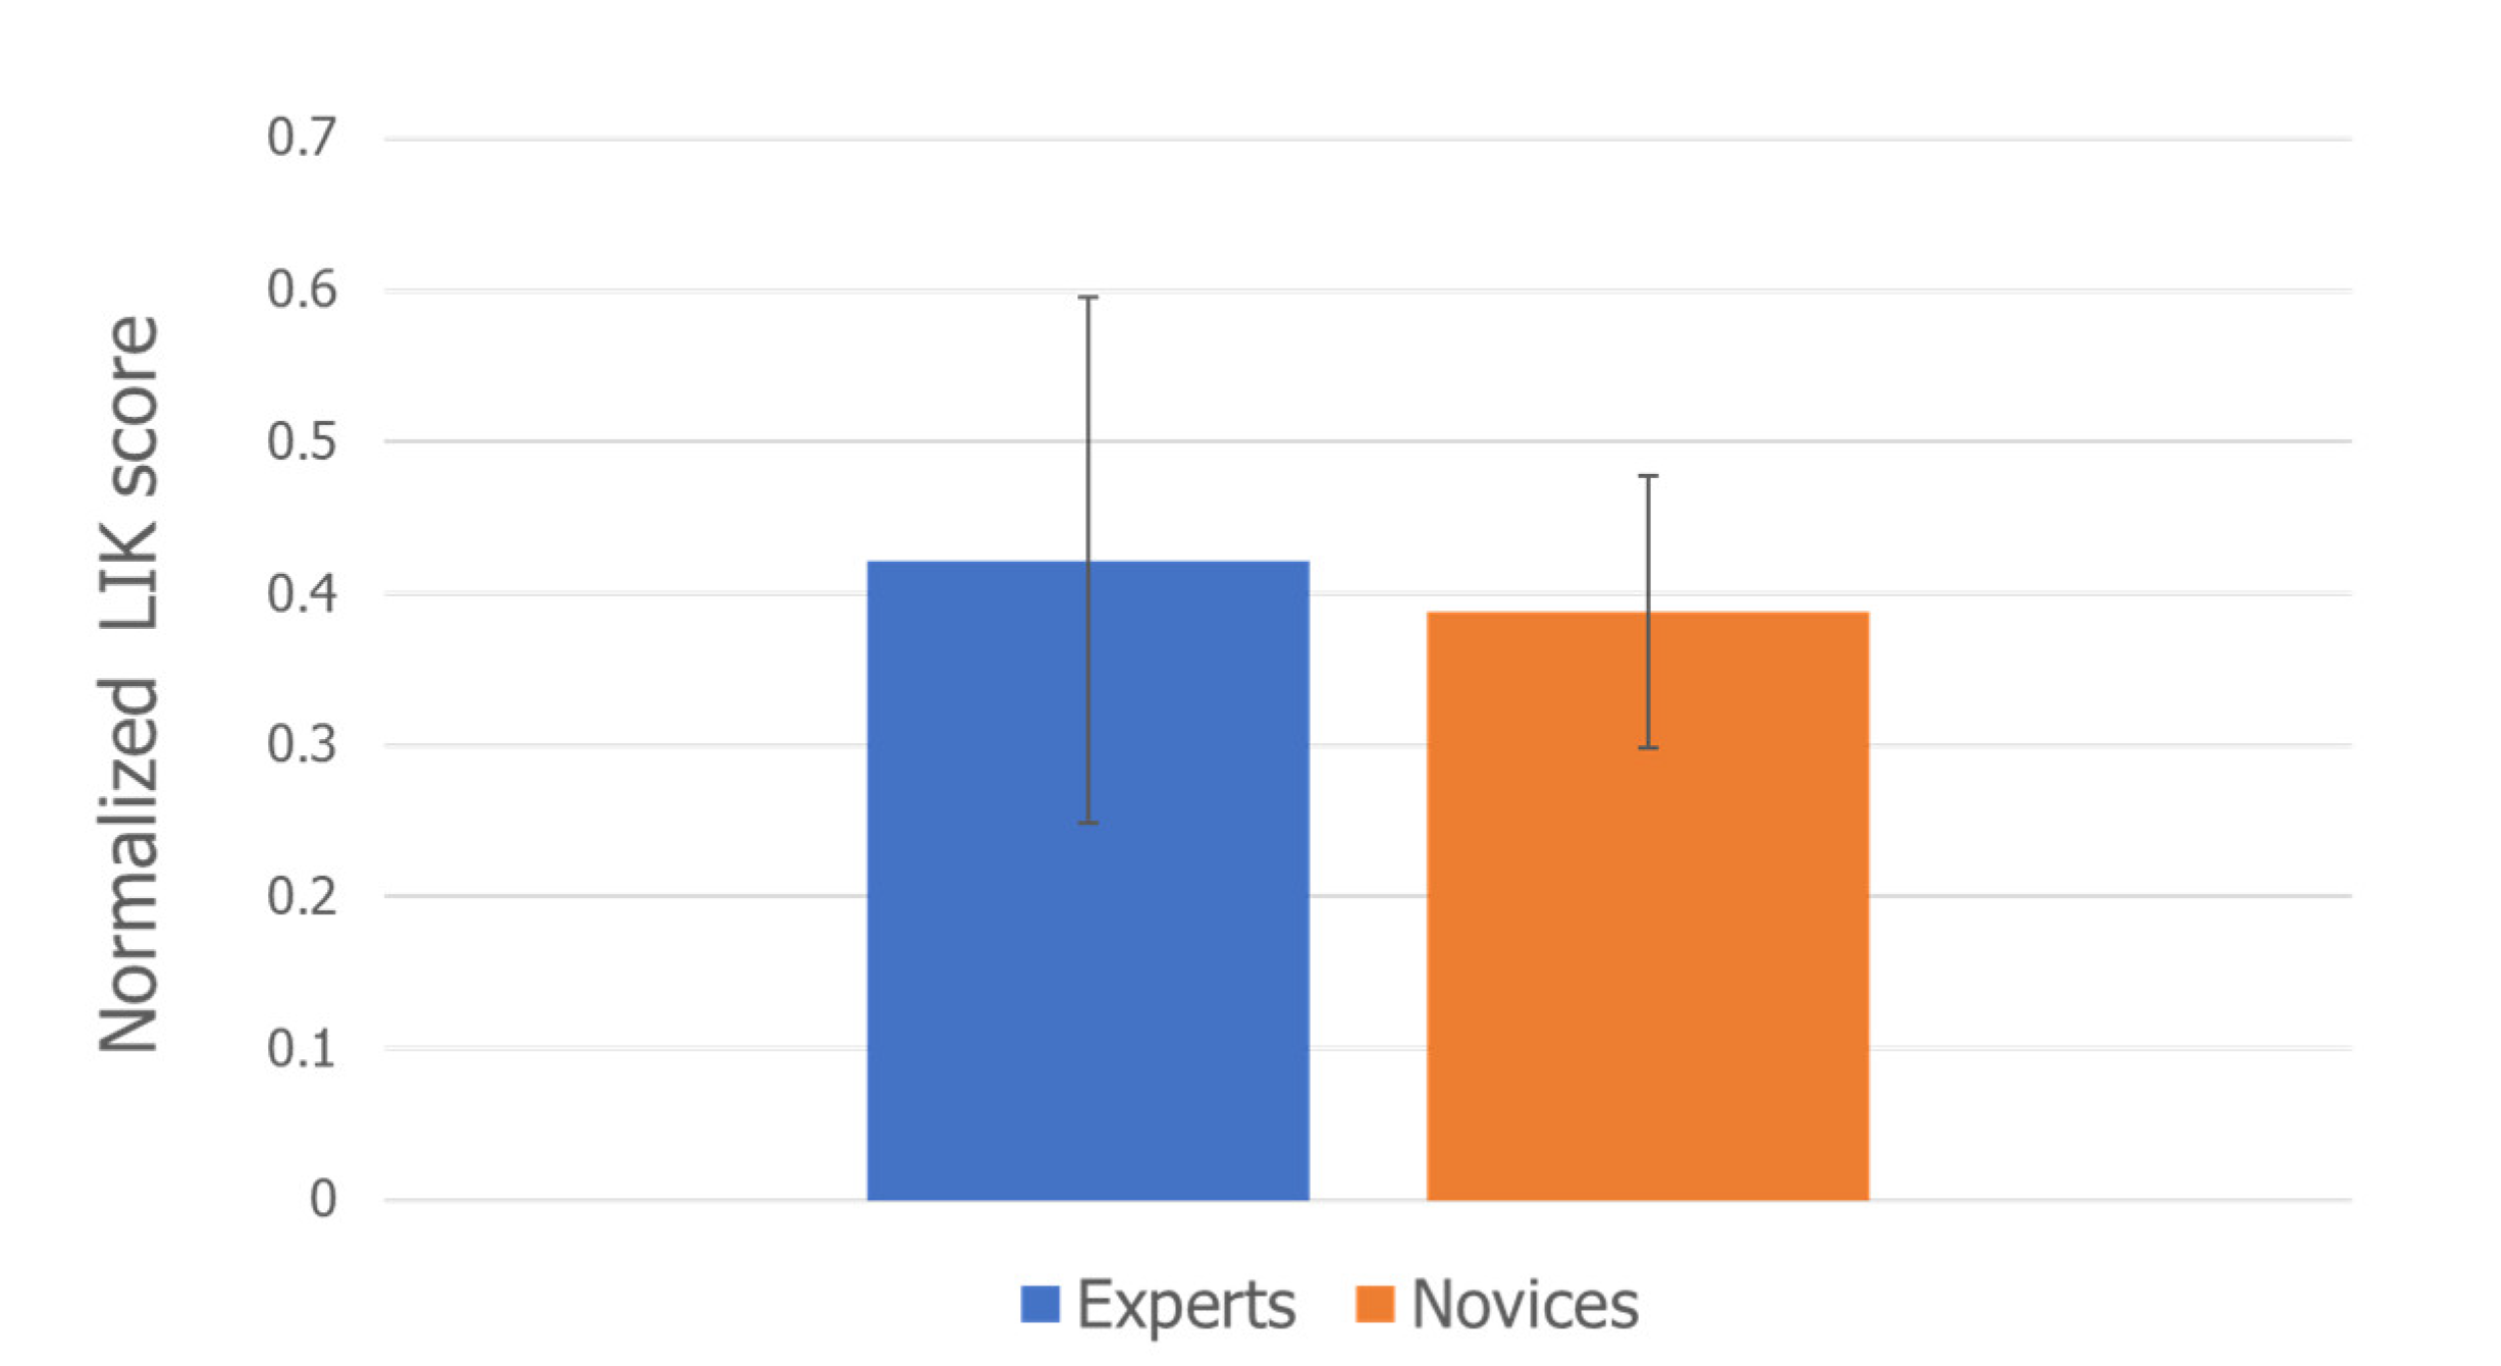
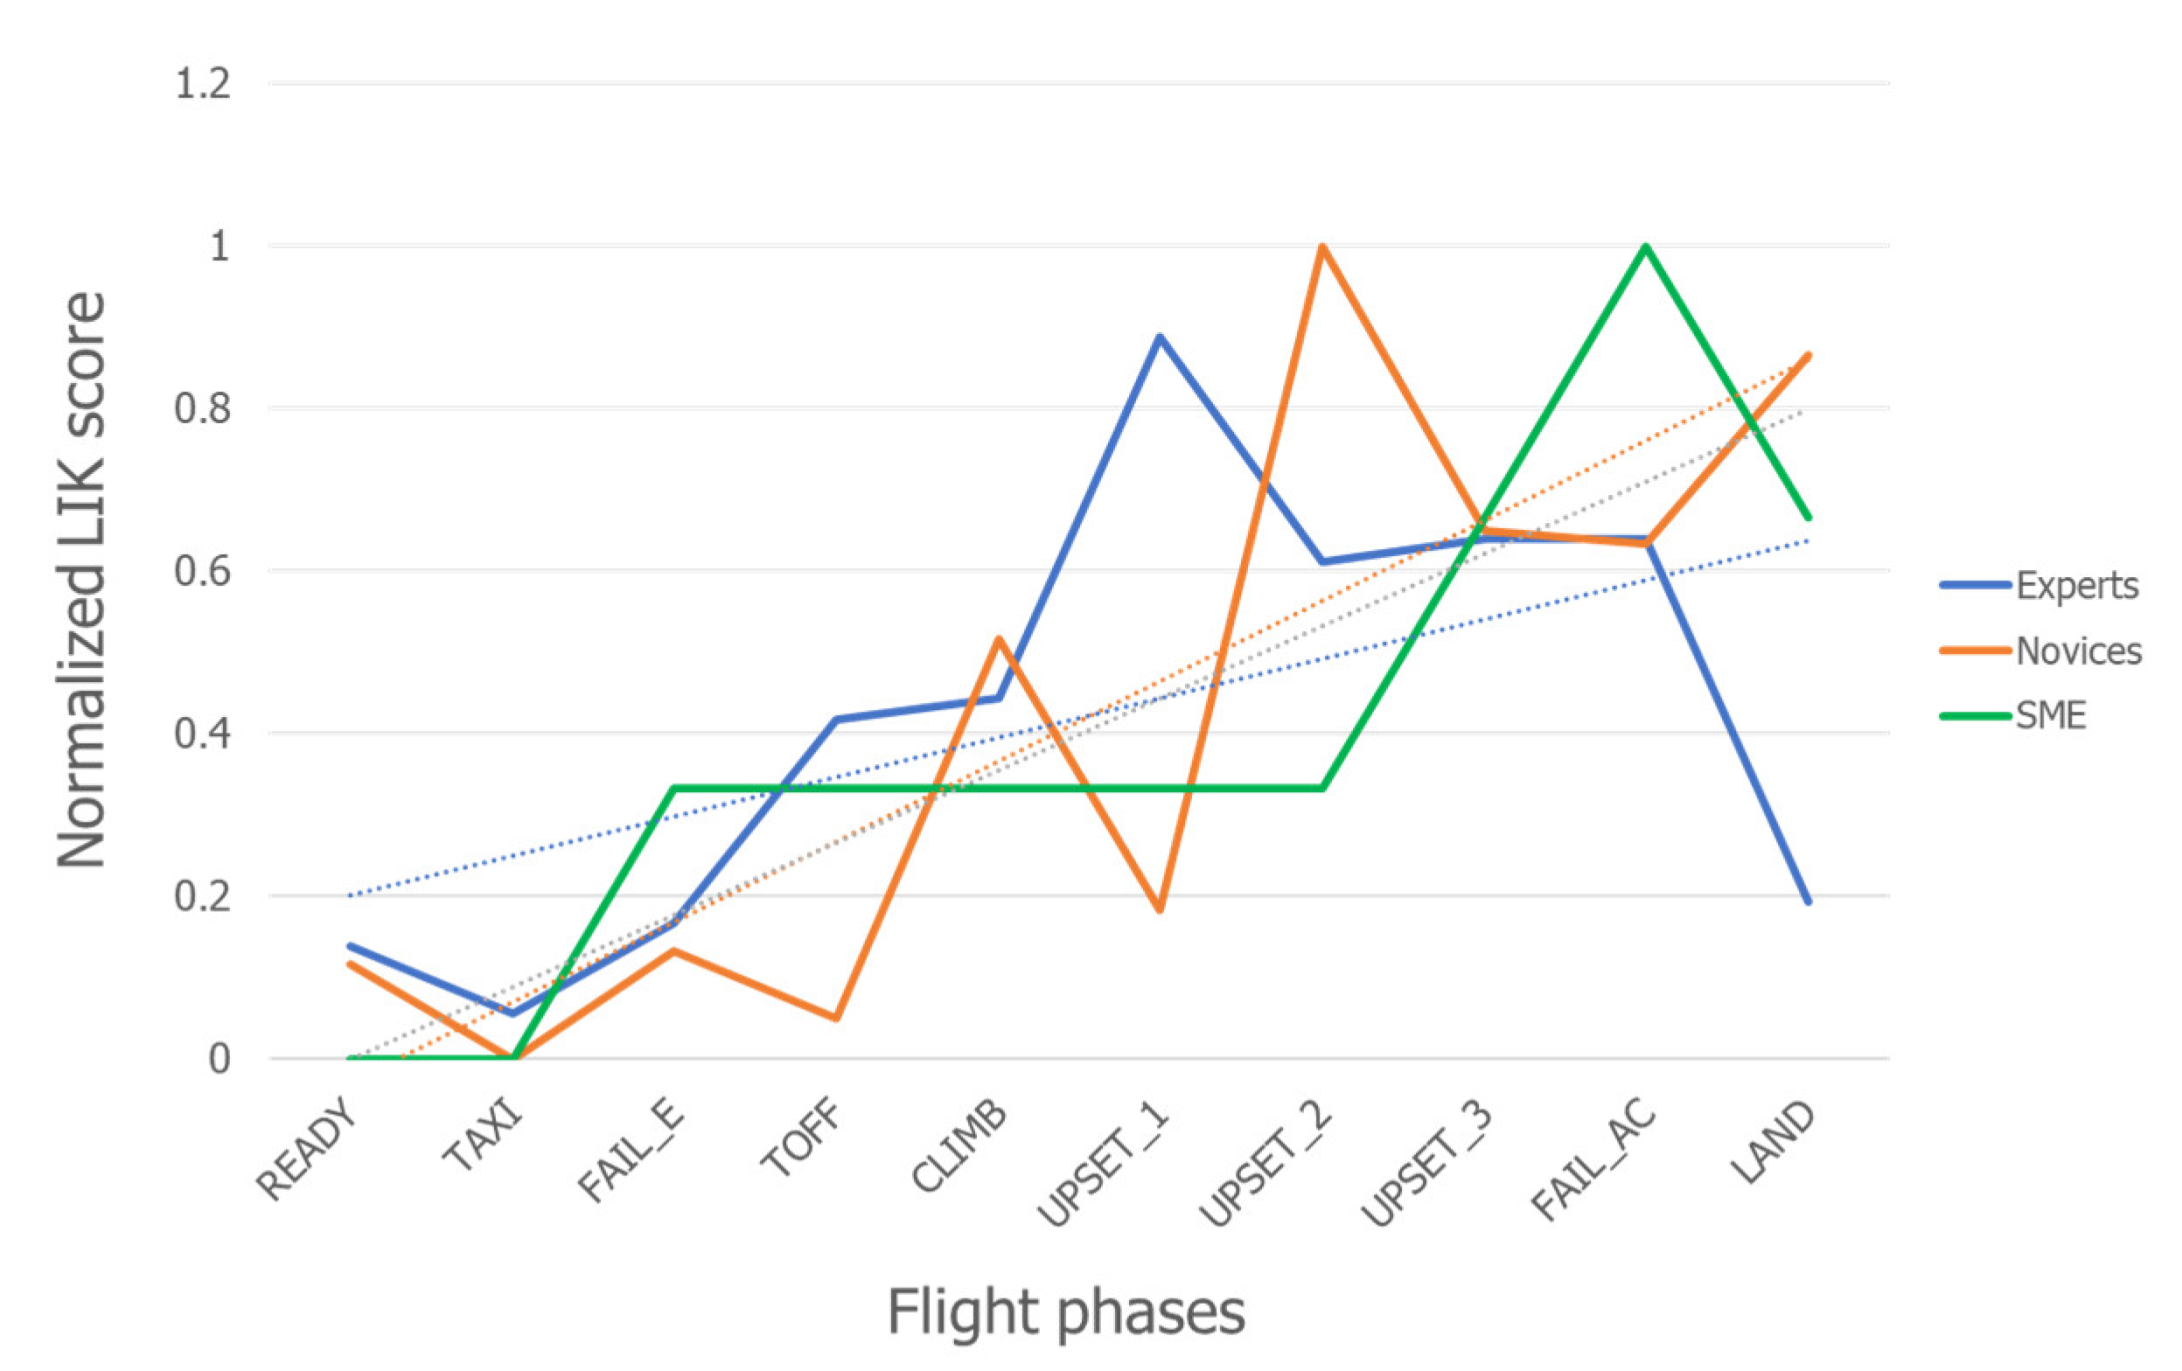
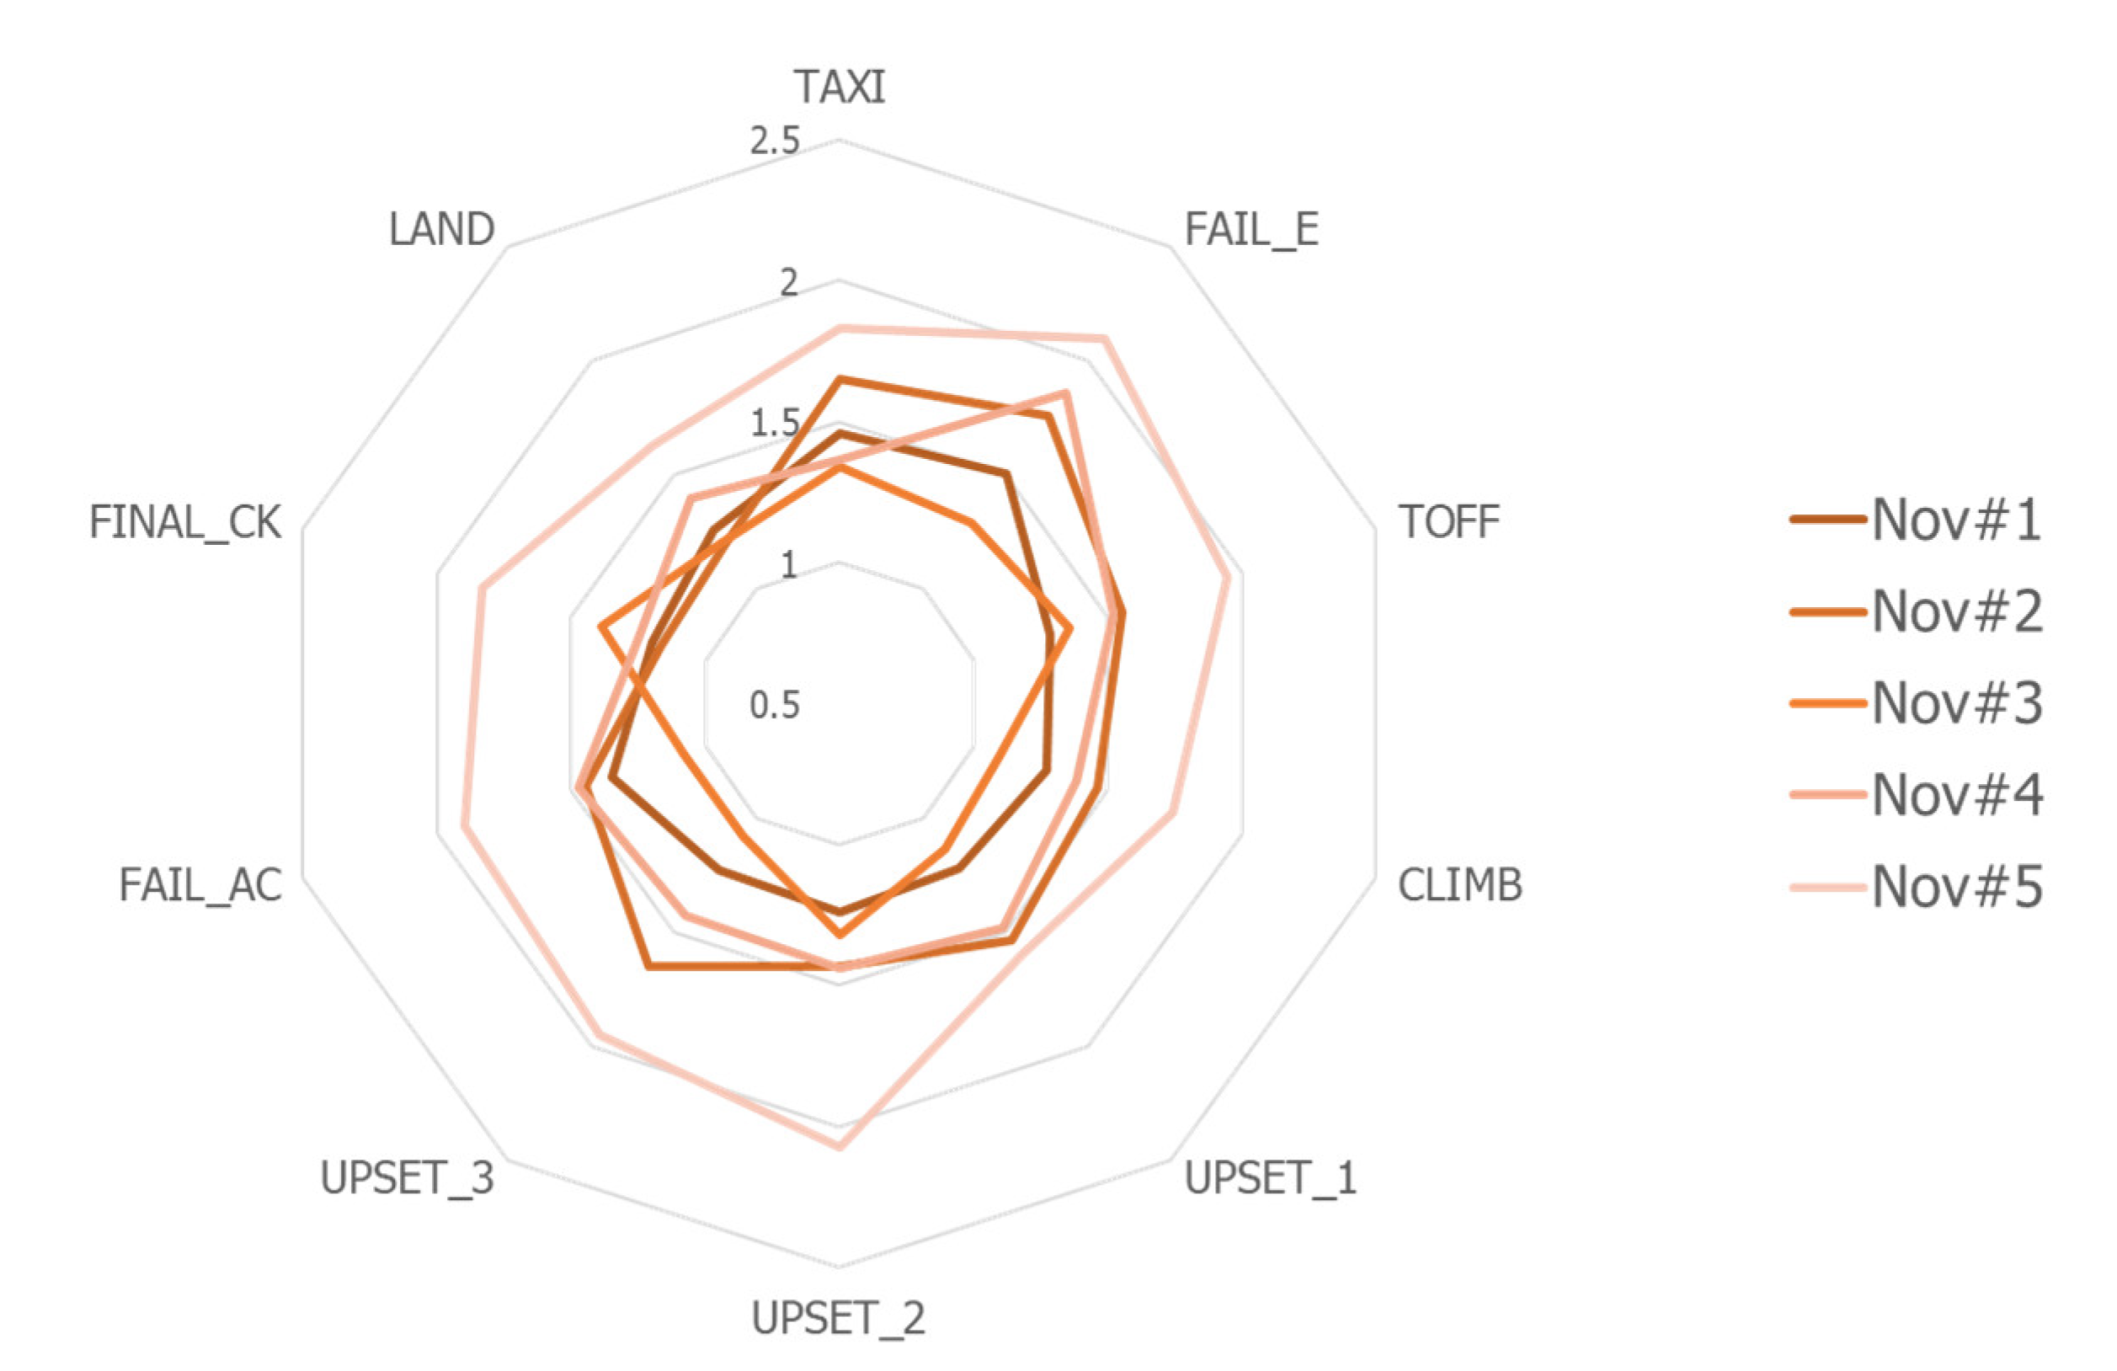
3.2. Self-Reported Mental Effort
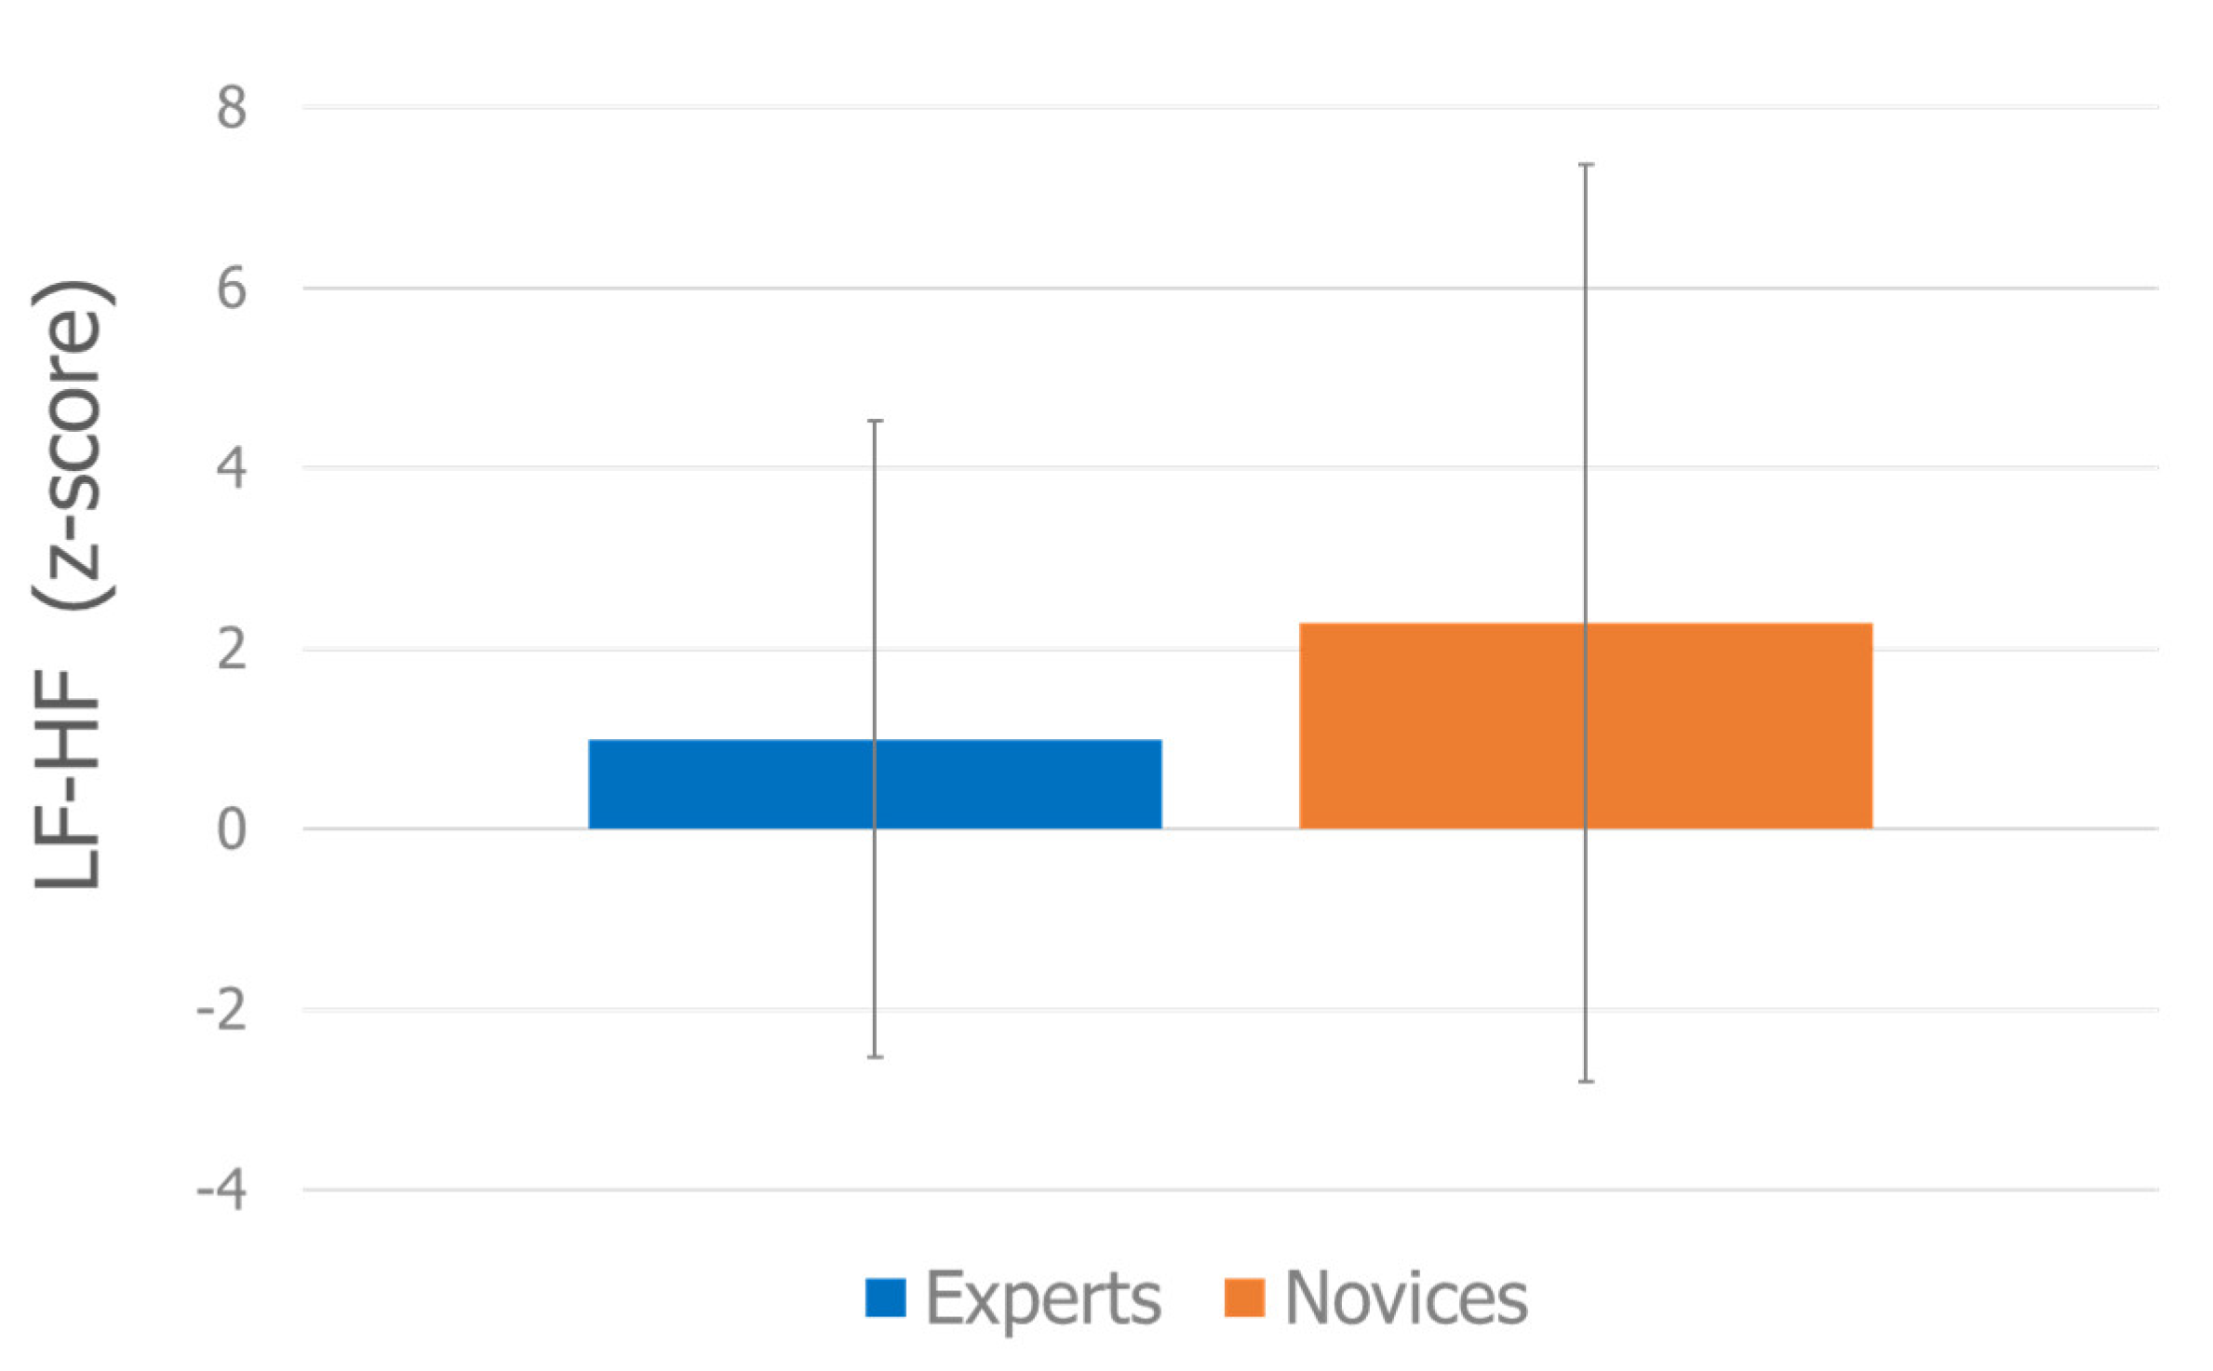
Similar to the previous result, the Wilcoxon signed-rank test on the mental demand perception (LIK score) of the Experts (blue bar) and Novices (orange bar) did not differ significantly (p = 0.73). This means that the two groups perceived the mental effort demand of the different flight phases, failures and unusual attitude recovery conditions in a similar way (Figure 3).
However, Pearson’s correlation analysis between the LIK scores of the two groups returned a low (R = 0.35) and not significant (p = 0.32) correlation. In other words, the ratings of the Experts and the Novices do not have the same trend; therefore, they perceived mental effort demand differently across the different flight conditions. Pearson’s correlation analyses were also performed between the LIK scores of each group (Experts: blue line, Novices: orange line) and the ones provided by the SME (green line in Figure 4). The results show moderate and not significant correlations for both the Experts (R = 0.47; p = 0.16) and the Novices (R = 0.61; p = 0.06) with the SME’s mental effort demand perception. Table 1 reports the results of the different Pearson’s correlation analyses.

3.3. HRV Results

The result derived from the Wilcoxon signed-rank test on the LF–HF values of the Experts (blue bar) and Novices (orange bar) did not exhibit any significant (p = 0.6) difference between the two groups (Figure 5). This evidence shows that the information processing of frontal-cortical brain activity modulated by the intrinsic cardiac nervous system does not differ between the two pilot groups.

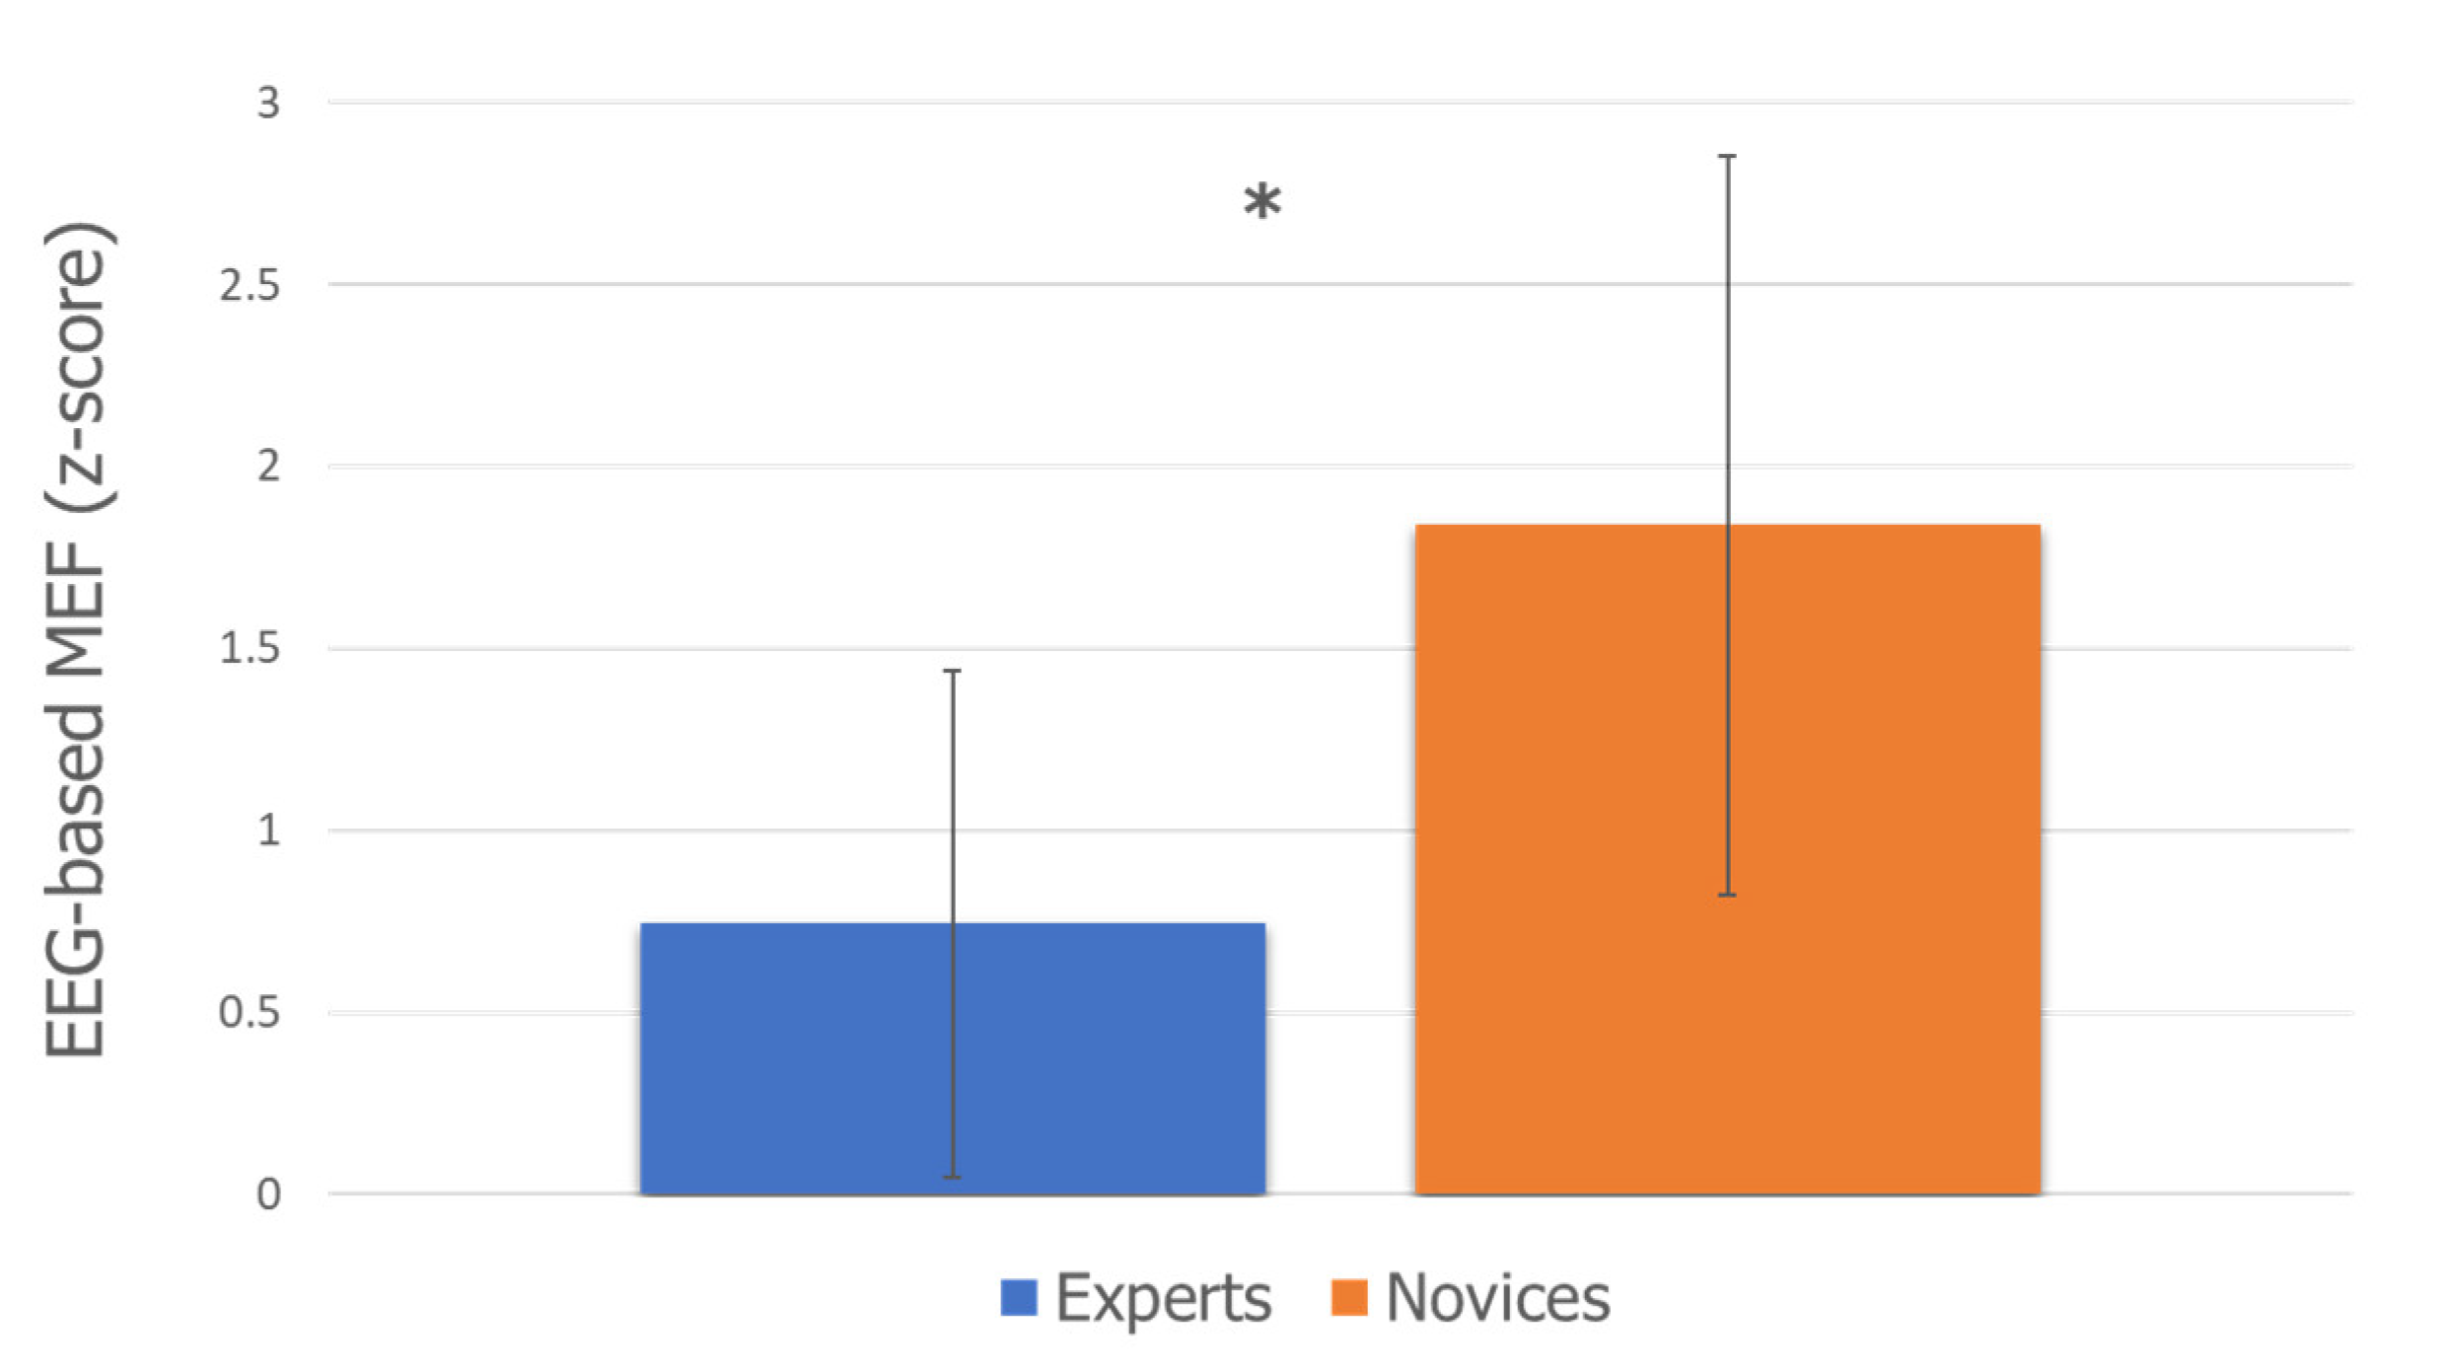
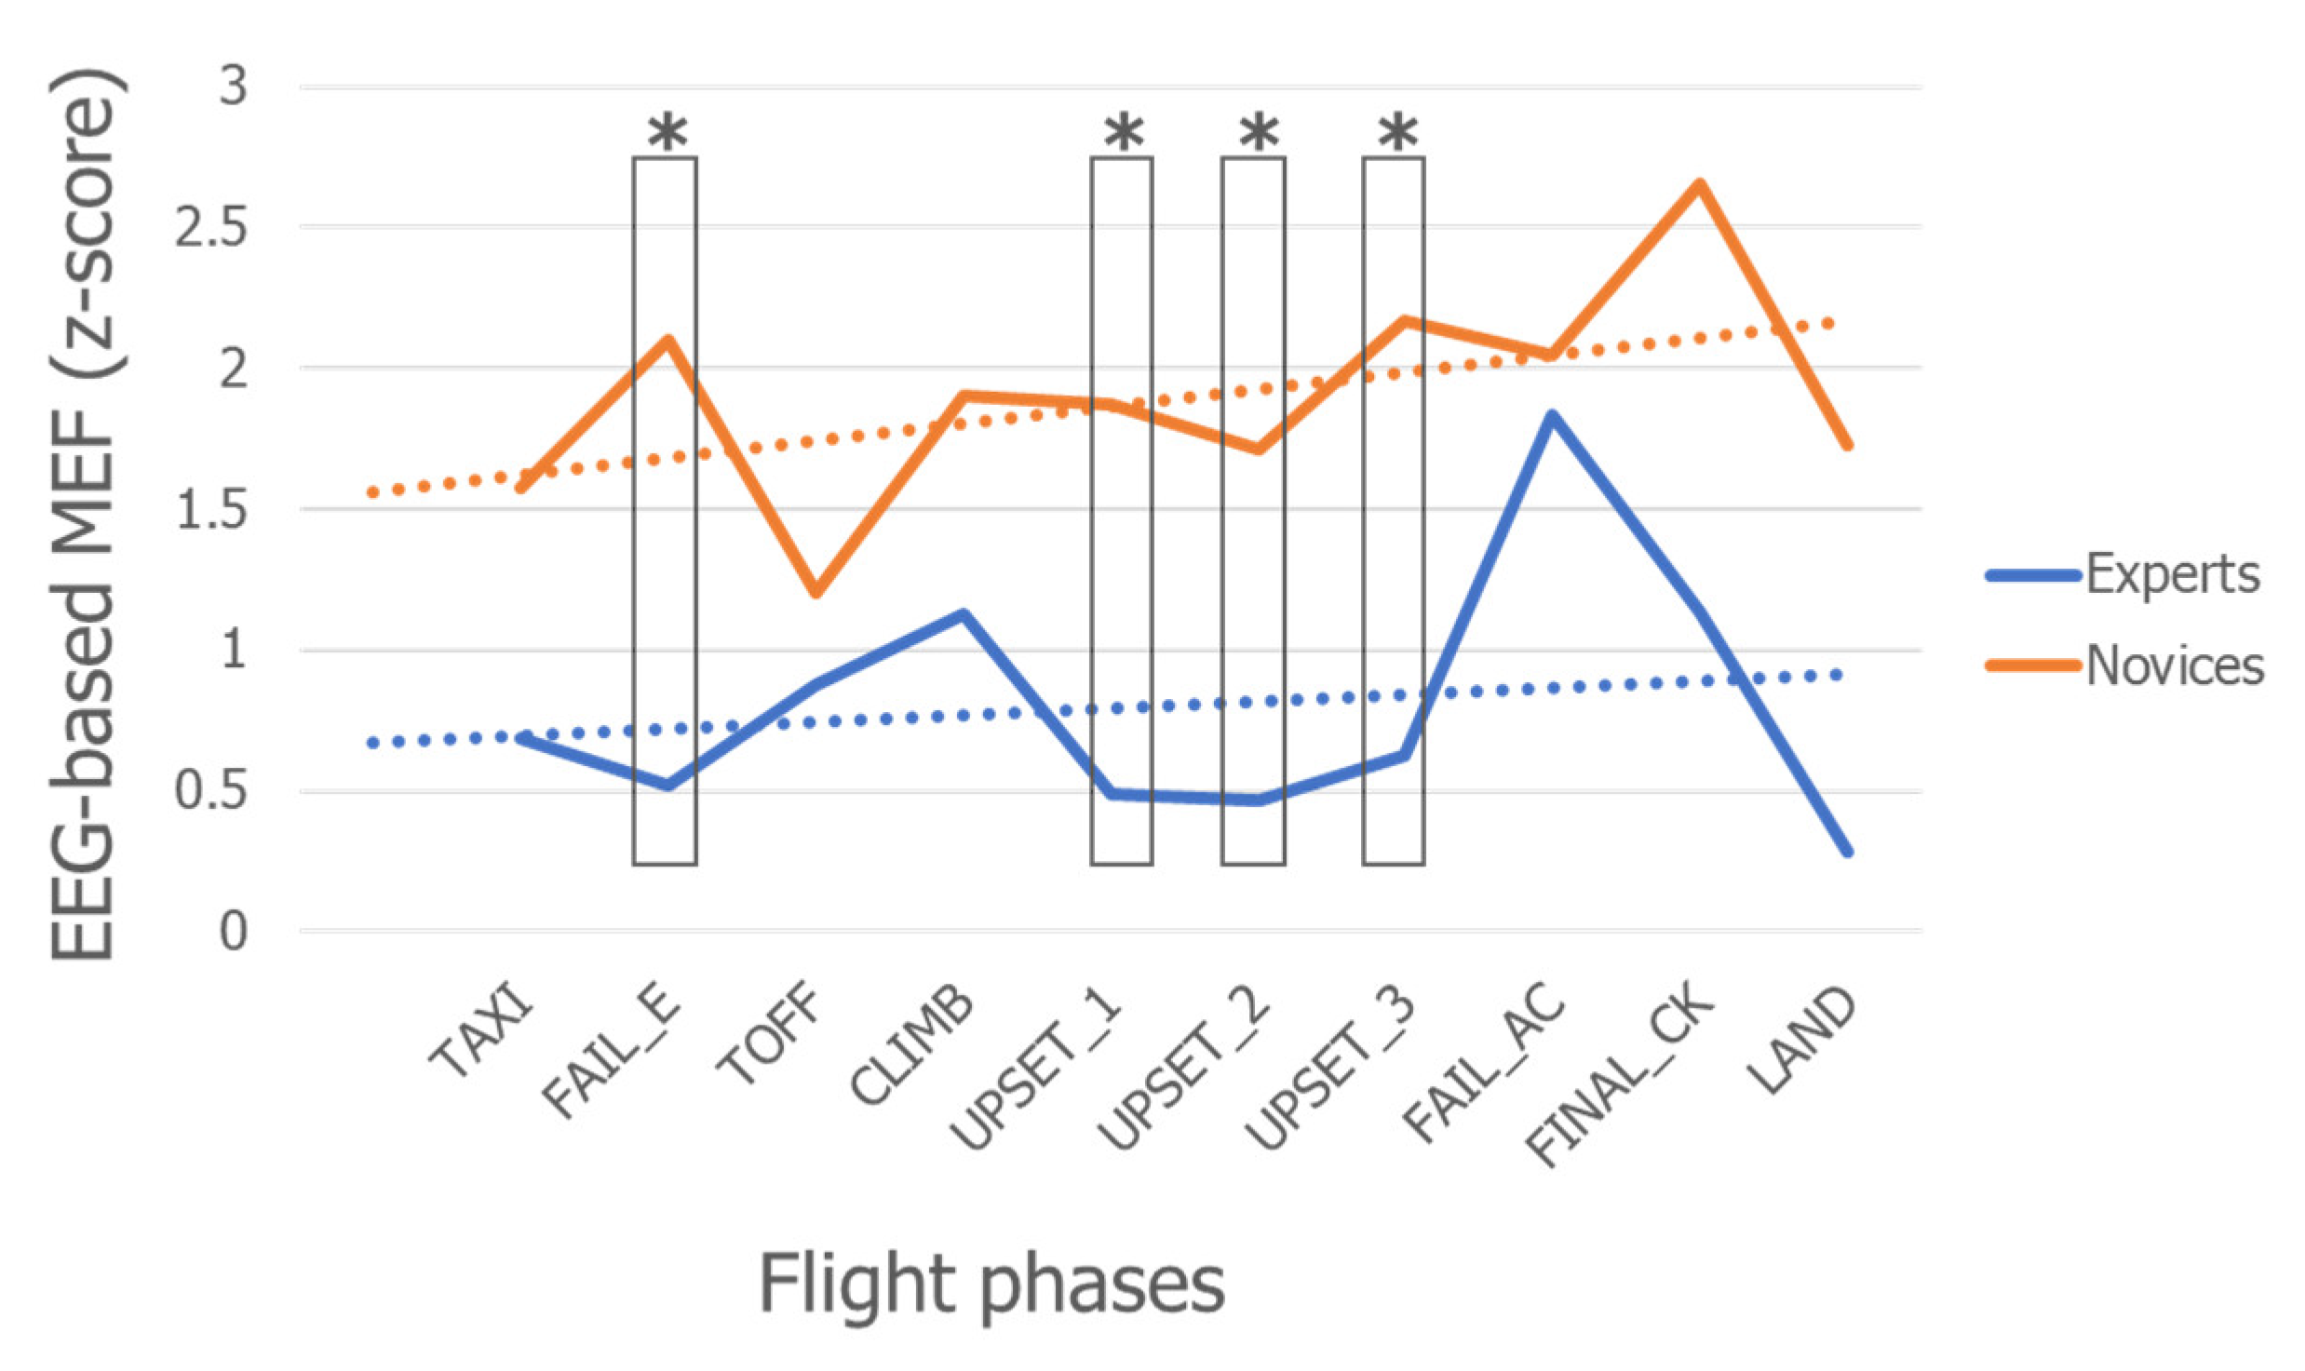
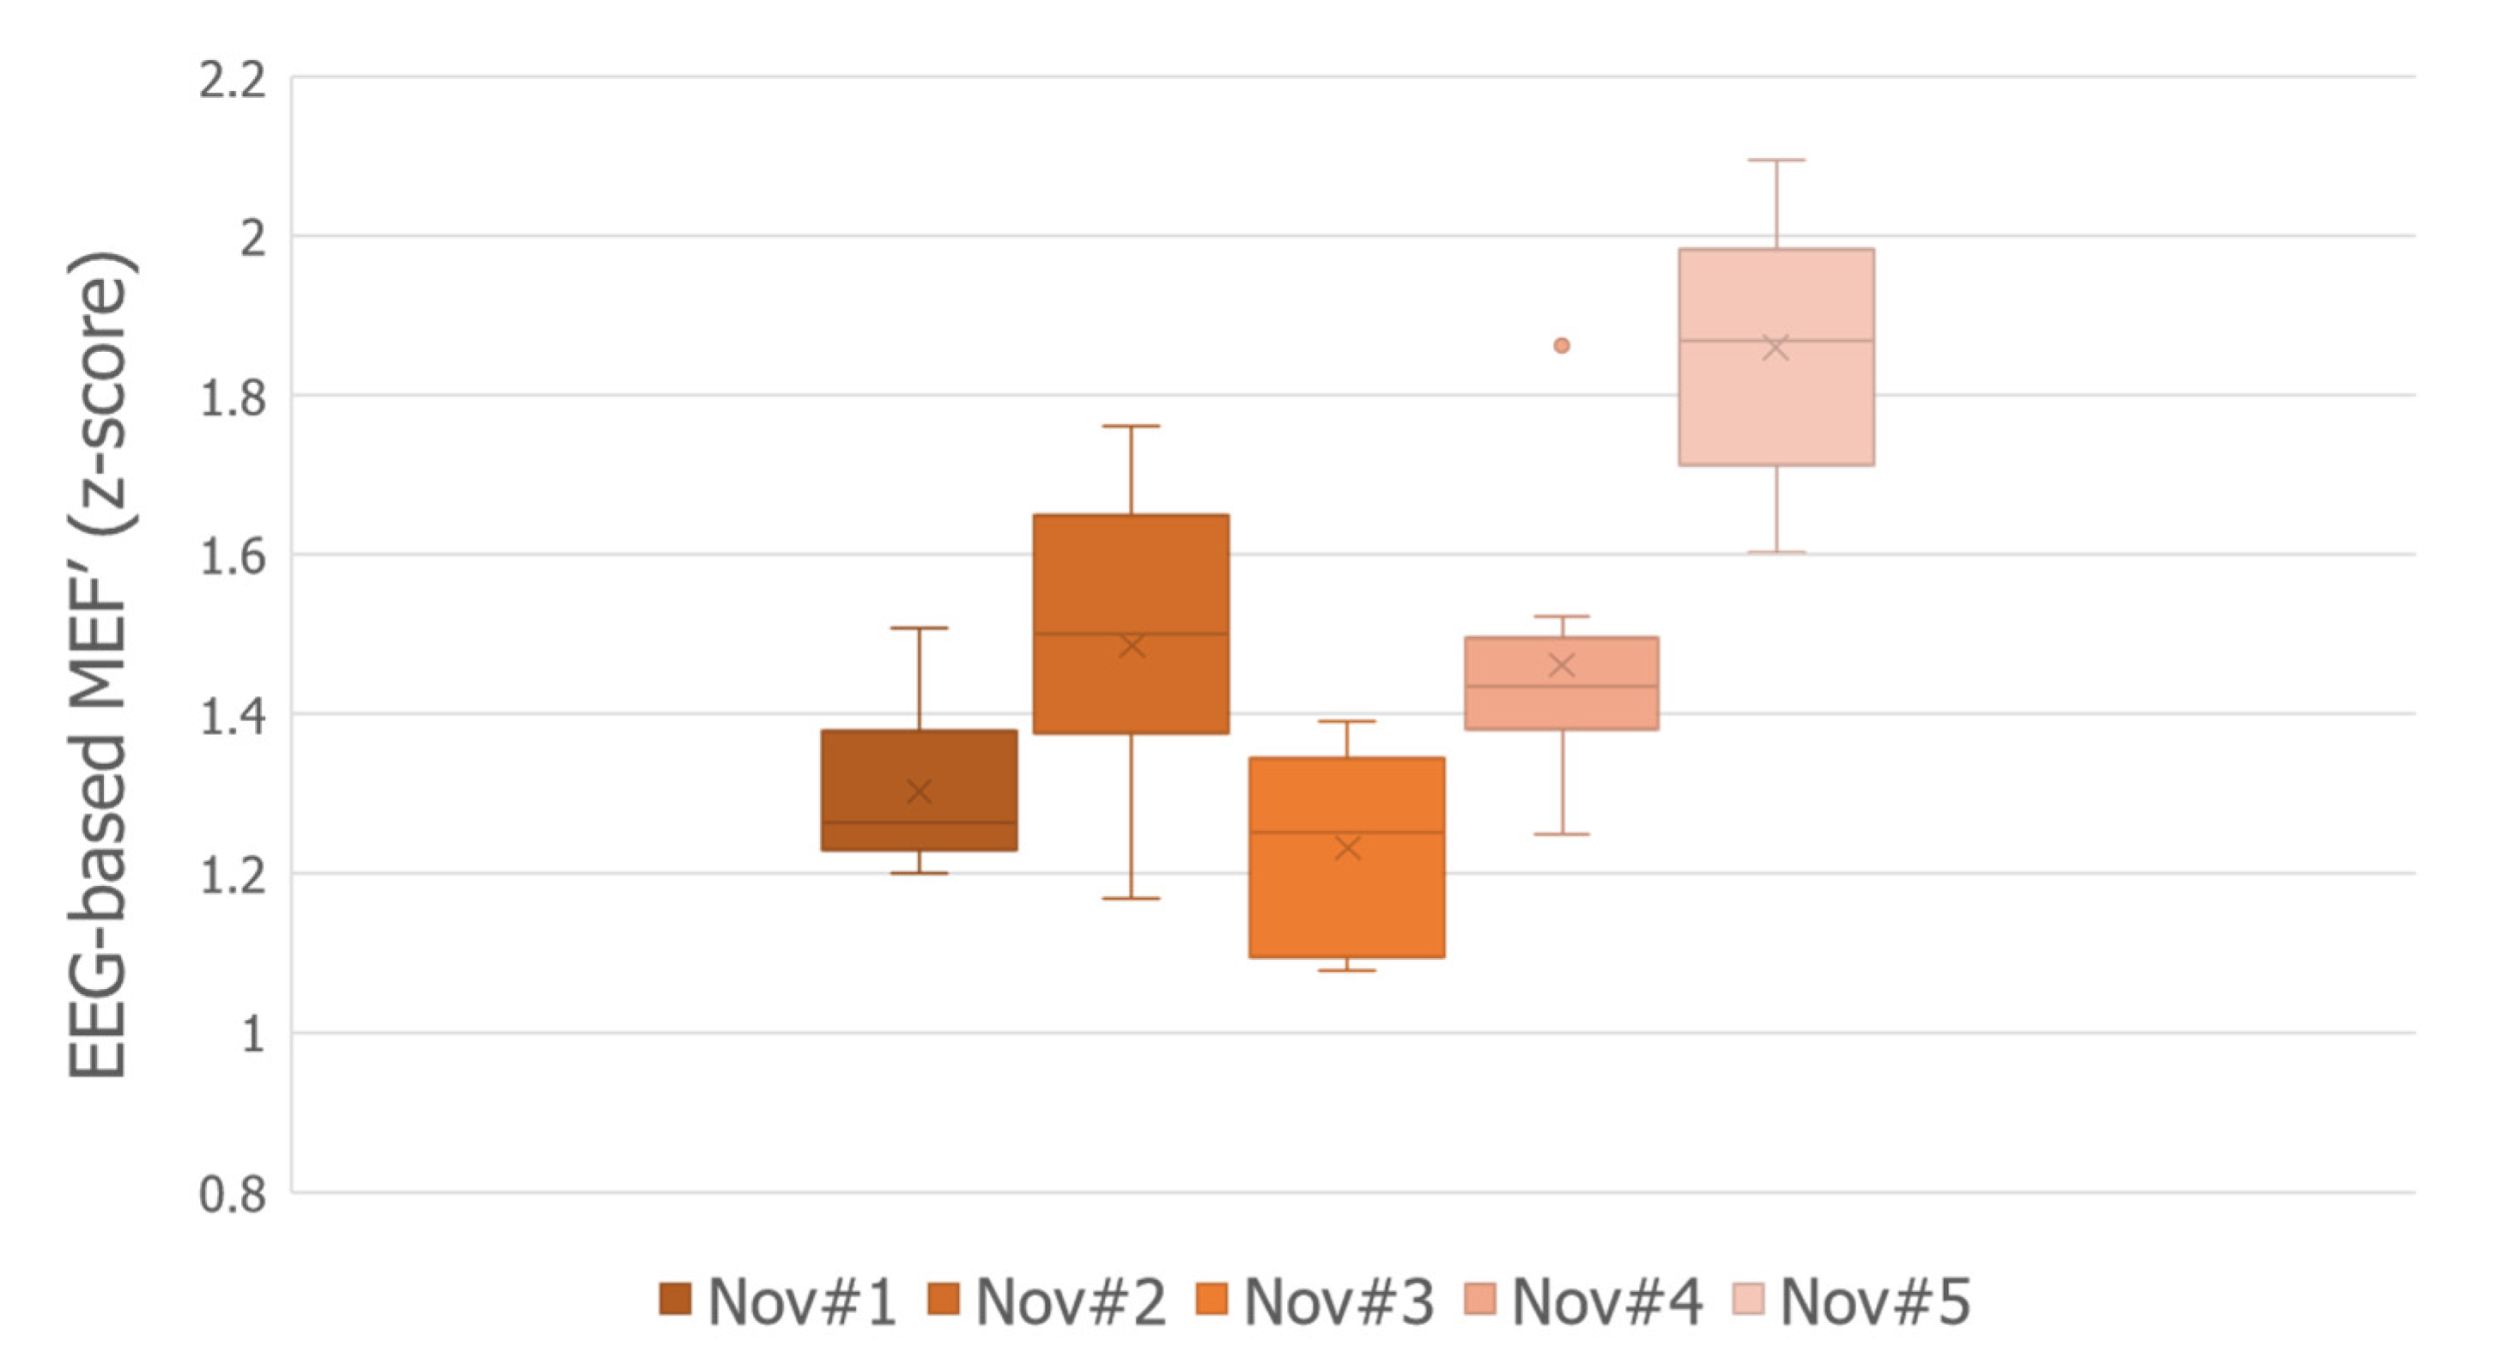
3.4. EEG-Based Mental Effort (MEF) Index

The results derived from the Wilcoxon signed-rank test on the EEG-based MEF index of the Experts (blue bar) and Novices (orange bar) report a significant difference (p = 0.035) between the two groups (Figure 6). This result shows how the Novices required significantly higher mental effort to complete the flight simulation.
Furthermore, replicating the statistics on the MEF index within each different flight phase of the simulation, the results highlight a very interesting aspect (Figure 7). Regardless of whether the flight phase was a standard one such as taxi (TAXI), takeoff (TOFF) or landing (LAND), the two groups required a similar (p > 0.05) amount of mental effort. However, during unusual conditions such as the resolution of the first failure (FAIL_E) and the recoveries from the unusual attitudes (UPSET_1, UPSET_2, UPSET_3), the Novices (orange line) exhibited significantly higher mental effort requests than the Experts (blue line).
The Pearson’s correlation analyses between the MEF index of each group, their mental effort demand perceptions (LIK score) and the SME’s subjective measure (ILIKSA score) returned the results in Table 2. Only a moderate (R = 0.61) but not significant (p = 0.06) correlation can be noticed for the Novices.

3.5. Comparison with Respect to the Expert Population

Since the Experts and Novices reported the same operational behavior (no statistical differences from the behavioral and subjective measures), we wanted to propose a method by which to quantify how much of the expertise of each Novice deviates from the Expert population with respect to mental effort requested. In this regard, we applied a z-score transformation by firstly calculating the mean (mu_Experts) and standard deviation (std_Experts) of the Expert MEF value population and then used these parameters to calculate the z-score values of each Novice’s MEF index (named MEF’) over the different flight simulation conditions, as reported in the following formula:
M E F i , j = M E F i , j   m u _ E x p e r t s s t d _ E x p e r t s ,                    i = 1 ÷ 5 ;    j = 1 ÷ 10
where the normalized mental effort index (MEF’) for each ith Novice and jth flight simulation phase was calculated with respect to the Expert population.
Based on the MEF’ values of each Novice assumed during the flight training simulation, we were able to quantify how much each Novice deviated from the Expert population with respect to the overall mental effort requested. For example, in Figure 8, it is possible to see how all the Novices requested higher overall mental effort with respect to the Experts (all z-score values are positive). In addition, this analysis highlights how Novice #5 had an overall mental effort request that was higher than those of the other Novices.
Finally, we also reported the MEF’ index values throughout each flight phase (Figure 9) to identify the conditions where each Novice deviated more, both from the other Novices and from the Expert population. For example, the “FAIL_E” failure resolution and “UPSET_3” unusual attitude recovery conditions should be further trained for Novice #2, Novice #4 and Novice #5, as they exhibited higher MEF’ values than the others.

4. Discussion

The objective of our work was to demonstrate how neurophysiological measurements can provide objective and useful information in addition to conventional ones (self-reports and external observations) for more accurate assessments of pilot expertise and skill. From this perspective, we recruited two groups of air force pilots, namely Experts and Novices, having different expertise with respect to rank and number of hours flown (NHF). The two groups were asked to perform the same unusual attitude recovery training simulations, where a couple of electrical failures were inserted without informing them.
The time to recover the aircraft from unusual attitudes (URT), the subjective perception of the mental effort demand (LIK score) and the pilots’ brain and heart activity were gathered throughout the entire simulation, and they finally analyzed to compare the two groups (Figure 1).
The results derived from the behavioral data (URT: Figure 2) and subjective perception (LIK score: Figure 3) do not indicate any significant difference between the Experts and Novices (all p > 0.05). In other words, by the conventional approach of evaluating how well the pilots dealt with the different flight conditions, the two groups did not differ. Therefore, these subjective measures [73] did not return any significant differences.
On the other hand, the EEG-based MEF indexes revealed that the Novices requested significantly higher (p = 0.035) mental effort than the Experts (Figure 6). This difference was particularly evident during unusual flight phases, such as the resolution of the first failure (FAIL_E) and the three unusual attitude recoveries (Figure 7). This evidence highlights how, during standard flight phases such as takeoff (TOFF), climbing (CLIMB) or landing (LAND), Novices and Experts did not differ significantly. However, when something unexpected happened (electrical failure) or during unusual conditions (unusual attitude recovery), the Novices required higher mental effort.
Looking in detail at the MEF values throughout the flight phases of the two groups (Figure 7), especially the dashed lines representing the linear trend of the MEFs, it is quite clear how the mental effort experienced by the Experts (blue line) was almost the same across the entire flight mission. However, we noticed an increase during the second failure (FAIL_AC). This can be explained by the fact that FAIL_AC is an electrical failure that may cause the loss of all the electrical equipment of the aircraft; therefore, they had to analyze the situation carefully and apply corresponding procedures to solve it. The trend of the overall Novices’ MEF (orange line) increased during the flight simulations (as reported by the LIK scores), particularly in some phases such as FAIL_E, UPSET_1, UPSET_2, UPSET_3 and FAIL_AC with respect to standard phases such as TAXI or TOFF. Additionally, there is a consideration for the Novices in the FINAL_CK condition. As described previously, the FAIL_AC failure can have important consequences on the electrical system, such as the eventual loss of the aircraft control. For this reason and due to poor experience in facing and dealing with this kind of situation, the Novices kept checking the instruments to ensure that nothing was becoming worse before the landing; therefore, their MEF increased up to the final checklist (FIANL_CK) and decreased only when landing.
In other words, during the resolution of failures and unusual attitude recoveries, the spare cognitive capacity of the Novices was lower than that of the Experts, which indicates that there were less cognitive resources available for dealing with more unexpected or demanding events. In this regard, we considered the Experts’ MEF indexes as a reference population from which to normalize the Novices’ MEF. We z-score normalized the Novices’ MEF values by using the mean and standard deviation of the Experts’ MEF value population to define a metric (MEF’) to quantify the deviation of each Novice regarding the mental effort requested, with respect to the Expert population. This metric (MEF’) allowed us to identify the Novices and flight phases which deviated more from the Expert population (Figure 8 and Figure 9).
The capability to objectively measure a Novice’s mental effort during flight simulation training is therefore very important. In fact, this aspect can allow for better assessment of a Novice’s progress throughout the training sessions, for identifying which flight phases were particularly critical for each of them and finally for tailoring training sessions based on each Novice’s attitude and skill [74,75,76].
Regarding Pearson’s correlation analysis, we aimed at:
  • Evaluating the similarity between the Experts and Novices with respect to mental effort perception (LIK score).
  • Evaluating the similarity between the EEG-based mental effort index (MEF) and the subjective mental effort perception (LIK score) between the Experts and Novices.
The main results derived from these correlation analyses show that there is no correlation between the Experts and the Novices and no correlation between the EEG-based MEF index and the LIK score. In other words, these results demonstrate that (1) the mental effort perception of experienced operators (Experts) differ from non-experienced operators (Novices), and this aspect may likely depend on the different skills and experiences of the pilots; and that (2) subjective measures (self-reports) represent the perception of what the user is feeling and not an objective measure of what the user is doing or experiencing regarding cognitive demand. The non-significant correlation between the MEF and LIK score shows therefore that neurophysiological-based measures can provide a more objective and direct measurement of what a user requires with respect to mental effort demand. To summarize, the results without a correlation emphasize the objective of our work, which is demonstrating how the employment of neurophysiological measures can provide an additional and useful measure to assess pilot expertise and skill. Furthermore, there are only moderate correlations between the Novices’ MEF and the LIK score provided by them and the SME. This result highlights also how subjective measures can potentially differ if provided as an external supervisor (SME) or as the user dealing with the task (pilots). In this regard, Veltman and Gaillard [77] already demonstrated how participants may have difficulty in distinguishing task demands from invested effort, and hence this may be a potential limitation of the subjective measures.
Although we were able to perform realistic flight simulations, recruit qualified personnel and provide interesting results, the evidence described in this work must be considered as a suggestion and preliminary result for further studies. In this regard, some limitations must be considered. Firstly, the number of pilots within each group should be increased [78]. In fact, due to the pilots’ scheduling and time available for running the experiments, we could not collect a larger sample size. In the next study, we will therefore enlarge the number of both Expert and Novice pilots to obtain a proper sample size, as demonstrated by Vozzi et al. [78], for making our results and conclusions more robust. Secondly, the subjective rating should be performed along with the flight simulation, for example, by asking both the pilots and the SME to rate the phenomenon considered (mental effort) via radio, to have more reliable scores rather than at the end of the simulation. In this regard, we preferred to keep the flight simulation as realistic as possible, and we did not interfere in any way and time with the main task execution. Thirdly, since we wanted to investigate whether neurophysiological measures can provide benefits to assess pilot expertise in combination with the conventional ones, i.e., behavioral (URT), subjective (ISA) and flight experience (NHF), we may have performed correlation analyses between these measurements. Due to limited points of measurement (three recoveries) and a unique value of NHF per pilot, we could not address this aspect. In fact, for accurately investigating the correlations among these measurements, a repeated-measures correlation analysis [79] between pairs of different parameters (MEF vs. NHF vs. URT) must be performed; therefore, we can assess if high and significant correlations occur at the single-subject level (as we are interested in evaluating each pilot’s expertise) and not at the group level. In this regard, a higher number of recovery maneuvers will be inserted in the next experimental protocol to obtain a proper number of observations and to be able to evaluate correlations between URTs and other parameters, such as the MEF (neurophysiological data) and LIK scores (subjective data). Finally, additional neurophysiological signals, such as a pilot’s Electrodermal activity (EDA), can be collected for considering more mental (Mental Fatigue [80,81,82,83], Stress [68], Attention [32], cognitive control behavior [76]) and emotional aspects [84,85] when comparing Expert and Novice pilots.

5. Conclusions

This study involved qualified military pilots, Experts and Novices, who performed the same flight simulations. Due to some limitations in recruiting the pilots, the final sample size was not very big, and therefore the results described in this work should be considered as suggestions and preliminary evidence for further investigation.
This study describes how the employment of diverse and complementary measures can provide a more accurate approach to compare and assess Novice pilots’ expertise and competencies. In fact, by considering only conventional measures such as operational behavior (how well the user performed the task considered), and subjective data (difficulty perception), we did not find any significant differences between the two pilot groups.
On the other hand, the EEG-based Mental Effort index (objective measure) demonstrates how the Novices requested a significantly higher mental effort than the Experts, especially during unusual flight conditions.
We can therefore state that neurophysiological measures can be employed as additional and objective measures to support the instructors in better assessing pilots’ progress with respect to a reference (Expert population), identifying flight phases which may require additional training for each different Novice, and tailoring training sessions based on the different outcomes of each Novice.
In this regard, as a result of the progress of wearable technology, neurophysiological signals can already be potentially used in operational environments as real-time measures of monitoring pilot mental states without requiring filling in questionnaires (secondary task) and interrupting the execution of the flight simulation.

Author Contributions

Conceptualization, G.B., F.B. and R.I.; methodology, G.B., P.A., G.D.F. and N.S.; formal analysis, G.B.; investigation, G.B., P.A., G.D.F. and N.S.; resources, C.C., S.S., P.V. and A.L.; data curation, G.B., V.R. and A.G.; writing—original draft preparation, G.B.; writing—review and editing, G.B., V.R., A.G., C.C., S.S., P.V. and A.L.; supervision, F.B.; project administration, F.B. and R.I; funding acquisition, F.B. and R.I. All authors have read and agreed to the published version of the manuscript.

Funding

This work was co-financed by the European Commission by Horizon 2020 projects “MINDTOOTH: Wearable device to decode human mind by neurometrics for a new concept of smart interaction with the surrounding environment” (GA n. 950998). H2020-SESAR-2019-2 projects: Transparent artificial intelligence and automation to air traffic management systems, “ARTIMATION,” (GA n. 894238); “WORKINGAGE: Smart Working environments for all Ages” (GA n. 826232); “FITDRIVE: Monitoring devices for overall FITness of Drivers” (GA n. 953432); “SAFEMODE: Strengthening synergies between Aviation and maritime in the area of human Factors towards achieving more Efficient and resilient MODE of transportation” (GA n. 814961), “BRAINSAFEDRIVE: A Technology to detect Mental States during Drive for improving the Safety of the road” (Italy–Sweden collaboration) with a grant of Ministero dell’Istruzione dell’Università e della Ricerca della Repubblica Italiana.

Institutional Review Board Statement

This study was conducted according to the guidelines of the Declaration of Helsinki and was approved by the Institutional Review Board (or Ethics Committee) of the Sapienza University of Rome (protocol code 1211/2014 and approved on the 12 November 2014).

Informed Consent Statement

Informed consent was obtained from all subjects involved in the study.

Acknowledgments

The authors sincerely acknowledge and thank the Italian Air Force and the 61° Stormo (Galatina, Lecce, Italy) for their availability, support and effort in recruiting the pilots and developing the experimental protocol to address all the experimental questions of the study.

Conflicts of Interest

The authors declare no conflict of interest.

References

  1. Abujelala, M.; Karthikeyan, R.; Tyagi, O.; Du, J.; Mehta, R.K. Brain activity-based metrics for assessing learning states in vr under stress among firefighters: An explorative machine learning approach in neuroergonomics. Brain Sci. 2021, 11, 885. [Google Scholar] [CrossRef] [PubMed]
  2. Krasuski, A.; Jankowski, A.; Skowron, A.; Ślȩzak, D. From sensory data to decision making: A perspective on supporting a fire commander. In Proceedings of the IEEE/WIC/ACM International Joint Conferences on Web Intelligence (WI) and Intelligent Agent Technologies (IAT), Atlanta, GA, USA, 17–20 November 2013; pp. 229–236. [Google Scholar] [CrossRef]
  3. Zhou, L.; Wu, X.; Xu, Z.; Fujita, H. Emergency decision making for natural disasters: An overview. Int. J. Disaster Risk Reduct. 2018, 27, 567–576. [Google Scholar] [CrossRef]
  4. Jones, R.M.; Laird, J.E.; Nielsen, P.E.; Coulter, K.J.; Kenny, P.; Koss, F.V. Automated Intelligent Pilots for Combat Flight Simulation. AI Mag. 1999, 20, 27. [Google Scholar] [CrossRef]
  5. Novak, A.; Mrazova, M. Research of Physiological Factors Affecting Pilot Performance in Flight Simulation Training Device. Commun.-Sci. Lett. Univ. Zilina 2015, 17, 103–107. [Google Scholar] [CrossRef]
  6. Jeon, S.; Paik, S.; Yang, U.; Shih, P.C.; Han, K. The More, the Better? Improving VR Firefighting Training System with Realistic Firefighter Tools as Controllers. Sensors 2021, 21, 7193. [Google Scholar] [CrossRef]
  7. Allerton, D.J. The impact of flight simulation in aerospace. Aeronaut. J. 2010, 114, 747–756. [Google Scholar] [CrossRef]
  8. Stevens, R.H.; Galloway, T.L.; Willemsen-Dunlap, A. Neuroergonomics: Quantitative Modeling of Individual, Shared, and Team Neurodynamic Information. Hum. Factors 2018, 60, 1022–1034. [Google Scholar] [CrossRef] [Green Version]
  9. Gorman, J.C.; Grimm, D.A.; Stevens, R.H.; Galloway, T.; Willemsen-Dunlap, A.M.; Halpin, D.J. Measuring Real-Time Team Cognition During Team Training. Hum. Factors 2020, 62, 825–860. [Google Scholar] [CrossRef]
  10. Scerbo, M.W.; Freeman, G.F.; Mikulka, P.J.; Parasuraman, R.; Di Nocero, F.; Prinzel, L.J., III. The Efficacy of Psychophysiological Measures for Implementing Adaptive Technology; NASA Langley Research Center: Hampton, VA, USA, 2001. [Google Scholar]
  11. Hancock, P.A.; Jagacinski, R.J.; Parasuraman, R.; Wickens, C.D.; Wilson, G.F.; Kaber, D.B. Human-Automation Interaction Research Past, Present, and Future. Ergon. Des. Q. Hum. Factors Appl. 2013, 21, 9–14. [Google Scholar] [CrossRef] [Green Version]
  12. Parasuraman, R.; Rizzo, M. Neuroergonomics: The Brain at Work, 1st ed.; Oxford University Press: New York, NY, USA, 2008; ISBN 978-0-19-536865-9. [Google Scholar]
  13. Kirschner, P.A.; Kirschner, F. Mental Effort. In Encyclopedia of the Sciences of Learning; Seel, N.M., Ed.; Springer: Boston, MA, USA, 2012. [Google Scholar] [CrossRef] [Green Version]
  14. Zammouri, A.; Ait Moussa, A.; Mebrouk, Y. Brain-computer interface for workload estimation: Assessment of mental efforts in learning processes. Undefined 2018, 112, 138–147. [Google Scholar] [CrossRef]
  15. Van Merriënboer, J.J.G.; Sweller, J. Cognitive Load Theory and Complex Learning: Recent Developments and Future Directions. Educ. Psychol. Rev. 2005, 17, 147–177. [Google Scholar] [CrossRef]
  16. Krell, M. Evaluating an instrument to measure mental load and mental effort considering different sources of validity evidence. Cogent Educ. 2017, 4, 1280256. [Google Scholar] [CrossRef]
  17. Causse, M.; Chua, Z.; Peysakhovich, V.; Del Campo, N.; Matton, N. Mental workload and neural efficiency quantified in the prefrontal cortex using fNIRS. Sci. Rep. 2017, 7, 5222. [Google Scholar] [CrossRef] [PubMed]
  18. Sciaraffa, N.; Germano, D.; Giorgi, A.; Ronca, V.; Vozzi, A.; Borghini, G.; Di Flumeri, G.; Babiloni, F.; Arico, P. Mental Effort Estimation by Passive BCI: A Cross-Subject Analysis. In Proceedings of the 43rd Annual International Conference of the IEEE Engineering in Medicine & Biology Society, Guadalajara, Mexico, 1–5 November 2021; pp. 906–909. [Google Scholar] [CrossRef]
  19. De Rivecourt, M.; Kuperus, M.N.; Post, W.J.; Mulder, L.J.M. Cardiovascular and eye activity measures as indices for momentary changes in mental effort during simulated flight. Ergonomics 2008, 51, 1295–1319. [Google Scholar] [CrossRef] [PubMed] [Green Version]
  20. Zhu, Y.; Wang, Q.; Zhang, L. Study of EEG characteristics while solving scientific problems with different mental effort. Sci. Rep. 2021, 11, 23783. [Google Scholar] [CrossRef]
  21. Sammer, G.; Blecker, C.; Gebhardt, H.; Bischoff, M.; Stark, R.; Morgen, K.; Vaitl, D. Relationship between regional hemodynamic activity and simultaneously recorded EEG-theta associated with mental arithmetic-induced workload. Hum. Brain Mapp. 2007, 28, 793–803. [Google Scholar] [CrossRef]
  22. Hölscher, C.; Anwyl, R.; Rowan, M.J. Stimulation on the Positive Phase of Hippocampal Theta Rhythm Induces Long-Term Potentiation That Can Be Depotentiated by Stimulation on the Negative Phase in Area CA1 In Vivo. J. Neurosci. 1997, 17, 6470–6477. [Google Scholar] [CrossRef]
  23. Hasselmo, M.E. The Role of Acetylcholine in Learning and Memory. Curr. Opin. Neurobiol. 2006, 16, 710–715. [Google Scholar] [CrossRef] [Green Version]
  24. Klimesch, W. EEG alpha and theta oscillations reflect cognitive and memory performance: A review and analysis. Brain Res. Brain Res. Rev. 1999, 29, 169–195. [Google Scholar] [CrossRef]
  25. Itthipuripat, S.; Wessel, J.R.; Aron, A.R. Frontal theta is a signature of successful working memory manipulation. Exp. Brain Res. 2013, 224, 255–262. [Google Scholar] [CrossRef] [Green Version]
  26. Cavanagh, J.F.; Zambrano-Vazquez, L.; Allen, J.J.B. Theta lingua franca: A common mid-frontal substrate for action monitoring processes. Psychophysiology 2012, 49, 220–238. [Google Scholar] [CrossRef] [PubMed] [Green Version]
  27. Mansikka, H.; Virtanen, K.; Harris, D.; Jalava, M. Measurement of team performance in air combat—Have we been underperforming? Theor. Issues Ergon. Sci. 2020, 22, 338–359. [Google Scholar] [CrossRef]
  28. Sheikholeslami, C.; Yuan, H.; He, E.J.; Bai, X.; Yang, L.; He, B. A high resolution EEG study of dynamic brain activity during video game play. In Proceedings of the 29th Annual International Conference of the IEEE Engineering in Medicine and Biology Society, Lyon, France, 22–26 August 2007; pp. 2489–2491. [Google Scholar] [CrossRef]
  29. Mansikka, H.; Virtanen, K.; Harris, D. Dissociation between mental workload, performance, and task awareness in pilots of high performance aircraft. IEEE Trans. Hum.-Mach. Syst. 2019, 49, 1–9. [Google Scholar] [CrossRef]
  30. Anzolin, A.; Mattia, D.; Toppi, J.; Pichiorri, F.; Riccio, A.; Astolfi, L. Brain connectivity networks at the basis of human attention components: An EEG study. In Proceedings of the 39th Annual International Conference of the IEEE Engineering in Medicine and Biology Society (EMBC), Jeju, Korea, 11–15 July 2017; pp. 3953–3956. [Google Scholar] [CrossRef]
  31. Toppi, J.; Astolfi, L.; Risetti, M.; Anzolin, A.; Kober, S.E.; Wood, G.; Mattia, D. Different topological properties of EEG-derived networks describe working memory phases as revealed by graph theoretical analysis. Front. Hum. Neurosci. 2018, 11, 637. [Google Scholar] [CrossRef] [Green Version]
  32. Sciaraffa, N.; Borghini, G.; Di Flumeri, G.; Cincotti, F.; Babiloni, F.; Aricò, P. Joint Analysis of Eye Blinks and Brain Activity to Investigate Attentional Demand during a Visual Search Task. Brain Sci. 2021, 11, 562. [Google Scholar] [CrossRef]
  33. Mansouri, F.A.; Tanaka, K.; Buckley, M.J. Conflict-induced behavioural adjustment: A clue to the executive functions of the prefrontal cortex. Nat. Rev. Neurosci. 2009, 10, 141–152. [Google Scholar] [CrossRef]
  34. Klimesch, W.; Schack, B.; Sauseng, P. The functional significance of theta and upper alpha oscillations. Exp. Psychol. 2005, 52, 99–108. [Google Scholar] [CrossRef]
  35. Jensen, O.; Tesche, C.D. Frontal theta activity in humans increases with memory load in a working memory task. Eur. J. Neurosci. 2002, 15, 1395–1399. [Google Scholar] [CrossRef]
  36. Onton, J.; Delorme, A.; Makeig, S. Frontal midline EEG dynamics during working memory. Neuroimage 2005, 27, 341–356. [Google Scholar] [CrossRef] [Green Version]
  37. Scheeringa, R.; Petersson, K.M.; Oostenveld, R.; Norris, D.G.; Hagoort, P.; Bastiaansen, M.C.M. Trial-by-trial coupling between EEG and BOLD identifies networks related to alpha and theta EEG power increases during working memory maintenance. Neuroimage 2009, 44, 1224–1238. [Google Scholar] [CrossRef] [Green Version]
  38. Gevins, A.; Smith, M.E.; McEvoy, L.; Yu, D. High-resolution EEG mapping of cortical activation related to working memory: Effects of task difficulty, type of processing, and practice. Cereb. Cortex 1997, 7, 374–385. [Google Scholar] [CrossRef] [PubMed] [Green Version]
  39. Hsieh, L.T.; Ranganath, C. Frontal midline theta oscillations during working memory maintenance and episodic encoding and retrieval. Neuroimage 2014, 85, 721–729. [Google Scholar] [CrossRef] [PubMed] [Green Version]
  40. Maurer, U.; Brem, S.; Liechti, M.; Maurizio, S.; Michels, L.; Brandeis, D. Frontal midline theta reflects individual task performance in a working memory task. Brain Topogr. 2015, 28, 127–134. [Google Scholar] [CrossRef] [PubMed] [Green Version]
  41. Newberg, A.; Alavi, A.; Baime, M.; Pourdehnad, M.; Santanna, J.; D’Aquili, E. The measurement of regional cerebral blood flow during the complex cognitive task of meditation: A preliminary SPECT study. Psychiatry Res. 2001, 106, 113–122. [Google Scholar] [CrossRef] [Green Version]
  42. Sasaki, K.; Tsujimoto, T.; Nambu, A.; Matsuzaki, R.; Kyuhou, S. Dynamic activities of the frontal association cortex in calculating and thinking. Neurosci. Res. 1994, 19, 229–233. [Google Scholar] [CrossRef]
  43. Pizzagalli, D.A.; Oakes, T.R.; Davidson, R.J. Coupling of theta activity and glucose metabolism in the human rostral anterior cingulate cortex: An EEG/PET study of normal and depressed subjects. Psychophysiology 2003, 40, 939–949. [Google Scholar] [CrossRef] [PubMed]
  44. Gevins, A.; Smith, M.E. Neurophysiological measures of cognitive workload during human-computer interaction. Theor. Issues Ergon. Sci. 2010, 4, 113–131. [Google Scholar] [CrossRef]
  45. Borghini, G.; Arico, P.; Astolfi, L.; Toppi, J.; Cincotti, F.; Mattia, D.; Cherubino, P.; Vecchiato, G.; Maglione, A.G.; Graziani, I.; et al. Frontal EEG theta changes assess the training improvements of novices in flight simulation tasks. In Proceedings of the 35th Annual International Conference of the IEEE Engineering in Medicine and Biology Society (EMBC), Osaka, Japan, 3–7 July 2013; pp. 6619–6622. [Google Scholar] [CrossRef]
  46. Shou, G.; Ding, L. Frontal theta EEG dynamics in a real-world air traffic control task. In Proceedings of the 35th Annual International Conference of the IEEE Engineering in Medicine and Biology Society (EMBC), Osaka, Japan, 3–7 July 2013; pp. 5594–5597. [Google Scholar] [CrossRef]
  47. Zakrzewska, M.Z.; Brzezicka, A. Working memory capacity as a moderator of load-related frontal midline theta variability in Sternberg task. Front. Hum. Neurosci. 2014, 8, 399. [Google Scholar] [CrossRef] [Green Version]
  48. Seymour, R.A.; Wang, H.; Rippon, G.; Kessler, K. Oscillatory networks of high-level mental alignment: A perspective-taking MEG study. Neuroimage 2018, 177, 98–107. [Google Scholar] [CrossRef] [Green Version]
  49. Bustamante-Sánchez, Á.; Tornero-Aguilera, J.F.; Fernández-Elías, V.E.; Hormeño-Holgado, A.J.; Dalamitros, A.A.; Clemente-Suárez, V.J. Effect of Stress on Autonomic and Cardiovascular Systems in Military Population: A Systematic Review. Cardiol. Res. Pract. 2020, 2020, 7986249. [Google Scholar] [CrossRef]
  50. Fuentes-García, J.P.; Clemente-Suárez, V.J.; Marazuela-Martínez, M.Á.; Tornero-Aguilera, J.F.; Villafaina, S. Impact of Real and Simulated Flights on Psychophysiological Response of Military Pilots. Int. J. Environ. Res. Public Health 2021, 18, 787. [Google Scholar] [CrossRef] [PubMed]
  51. McCraty, R.; Shaffer, F. Heart Rate Variability: New Perspectives on Physiological Mechanisms, Assessment of Self-regulatory Capacity, and Health risk. Glob. Adv. Health Med. 2015, 4, 46–61. [Google Scholar] [CrossRef] [PubMed] [Green Version]
  52. Scheuer, C.; Boot, E.; Carse, N.; Clardy, A.; Gallagher, J.; Heck, S.; Marron, S.; Martinez-Alvarez, L.; Masarykova, D.; Mcmillan, P.; et al. Activity in medial prefrontal cortex correlates with vagal component of heart rate variability during emotion. Brain Cogn. 2001, 47, 97–100. [Google Scholar] [CrossRef]
  53. Nemoto, T.; Beglar, D. Developing Likert-Scale Questionnaires Campus Reference Data. In Proceedings of the JALT 2013 Conference Proceedings, Tokyo, Japan, August 2014. [Google Scholar]
  54. Albaum, G. The Likert Scale Revisited. Mark. Res. Soc. J. 1997, 39, 331–348. [Google Scholar] [CrossRef]
  55. Di Flumeri, G.; Aricò, P.; Borghini, G.; Colosimo, A.; Babiloni, F. A new regression-based method for the eye blinks artifacts correction in the EEG signal, without using any EOG channel. In Proceedings of the 38th Annual International Conference of the IEEE Engineering in Medicine and Biology Society (EMBC), Orlando, FL, USA, 16–20 August 2016; pp. 3187–3190. [Google Scholar] [CrossRef]
  56. Somers, B.; Francart, T.; Bertrand, A. A generic EEG artifact removal algorithm based on the multi-channel Wiener filter. J. Neural Eng. 2018, 15, 36007. [Google Scholar] [CrossRef]
  57. Krystal, A.D.; Prado, R.; West, M. New methods of time series analysis of non-stationary EEG data: Eigenstructure decompositions of time varying autoregressions. Clin. Neurophysiol. 1999, 110, 2197–2206. [Google Scholar] [CrossRef]
  58. Elul, R. Gaussian Behavior of the Electroencephalogram: Changes during Performance of Mental Task. Science 1969, 164, 328–331. [Google Scholar] [CrossRef]
  59. Gonen, F.F.; Tcheslavski, G.V. Techniques to Assess Stationarity and Gaussianity of EEG: An Overview. Int. J. Bioautom. 2012, 16, 135–142. [Google Scholar]
  60. Skrandies, W. Global field power and topographic similarity. Brain Topogr. 1990, 3, 137–141. [Google Scholar] [CrossRef]
  61. Di Flumeri, G.; Arico, P.; Borghini, G.; Sciaraffa, N.; Maglione, A.G.; Rossi, D.; Modica, E.; Trettel, A.; Babiloni, F.; Colosimo, A.; et al. EEG-based Approach-Withdrawal index for the pleasantness evaluation during taste experience in realistic settings. In Proceedings of the 39th Annual International Conference of the IEEE Engineering in Medicine and Biology Society (EMBC), Jeju, Korea, 11–15 July 2017. [Google Scholar]
  62. Cartocci, G.; Modica, E.; Rossi, D.; Cherubino, P.; Maglione, A.G.; Colosimo, A.; Trettel, A.; Mancini, M.; Babiloni, F. Neurophysiological Measures of the Perception of Antismoking Public Service Announcements Among Young Population. Front. Hum. Neurosci. 2018, 12, 231. [Google Scholar] [CrossRef]
  63. Pan, J.; Tompkins, W.J. A real-time QRS detection algorithm. IEEE Trans. Biomed. Eng. 1985, 32, 230–236. [Google Scholar] [CrossRef] [PubMed]
  64. Ramshur, J.T. Design, Evaluation, and Application of Heart Rate Variability Analysis Software (HRVAS). Ph.D. Dissertation, University of Memphis, Memphis, TN, USA, 2010. [Google Scholar]
  65. Ruf, T. The Lomb-Scargle Periodogram in Biological Rhythm Research: Analysis of Incomplete and Unequally Spaced Time-Series. Biol. Rhythm Res. 1999, 30, 178–201. [Google Scholar] [CrossRef]
  66. Clifford, G.D.; Tarassenko, L. Quantifying errors in spectral estimates of HRV due to beat replacement and resampling. IEEE Trans. Biomed. Eng. 2005, 52, 630–638. [Google Scholar] [CrossRef] [PubMed] [Green Version]
  67. Sloan, R.P.; Shapiro, P.A.; Bagiella, E.; Boni, S.M.; Paik, M.; Bigger, J.T.; Steinman, R.C.; Gorman, J.M. Effect of mental stress throughout the day on cardiac autonomic control. Biol. Psychol. 1994, 37, 89–99. [Google Scholar] [CrossRef]
  68. Borghini, G.; Di Flumeri, G.; Aricò, P.; Sciaraffa, N.; Bonelli, S.; Ragosta, M.; Tomasello, P.; Drogoul, F.; Turhan, U.; Acikel, B.; et al. A multimodal and signals fusion approach for assessing the impact of stressful events on Air Traffic Controllers. Sci. Rep. 2020, 10, 8600. [Google Scholar] [CrossRef]
  69. Shaffer, F.; Ginsberg, J.P. An Overview of Heart Rate Variability Metrics and Norms. Front. Public Health 2017, 5, 258. [Google Scholar] [CrossRef] [Green Version]
  70. Jain, A.; Nandakumar, K.; Ross, A. Score normalization in multimodal biometric systems. Pattern Recognit. 2005, 38, 2270–2285. [Google Scholar] [CrossRef]
  71. Fei, N.; Gao, Y.; Lu, Z.; Xiang, T. Z-Score Normalization, Hubness, and Few-Shot Learning. In Proceedings of the IEEE/CVF International Conference on Computer Vision (ICCV), Montreal, QC, Canada, 10–17 October 2021; pp. 142–151. [Google Scholar]
  72. Kappal, S. Data Normalization using Median & Median Absolute Deviation (MMAD) based Z-Score for Robust Predictions vs. Min-Max Normalization. Lond. J. Res. Sci. Nat. Form. 2019, 19, 37–46. [Google Scholar]
  73. Di Flumeri, G.; Borghini, G.; Aricò, P.; Colosimo, A.; Pozzi, S.; Bonelli, S.; Golfetti, A.; Kong, W.; Babiloni, F. On the Use of Cognitive Neurometric Indexes in Aeronautic and Air Traffic Management Environments; Blankertz, B., Jacucci, G., Gamberini, L., Spagnolli, A., Freeman, J., Eds.; Springer International Publishing: Cham, Germany, 2015; Volume 9359, pp. 45–56. [Google Scholar]
  74. Dey, A.; Chatourn, A.; Billinghurst, M. Exploration of an EEG-based cognitively adaptive training system in virtual reality. In Proceedings of the IEEE Conference on Virtual Reality and 3D User Interfaces (VR), Osaka, Japan, 23–27 March 2019; pp. 220–226. [Google Scholar] [CrossRef]
  75. Borghini, G.; Aricò, P.; Di Flumeri, G.; Sciaraffa, N.; Colosimo, A.; Herrero, M.-T.; Bezerianos, A.; Thakor, N.V.; Babiloni, F. A new perspective for the training assessment: Machine learning-based neurometric for augmented user’s evaluation. Front. Neurosci. 2017, 11, 325. [Google Scholar] [CrossRef]
  76. Borghini, G.; Aricò, P.; Di Flumeri, G.; Cartocci, G.; Colosimo, A.; Bonelli, S.; Golfetti, A.; Imbert, J.-P.; Granger, G.; Benhacene, R.; et al. EEG-Based Cognitive Control Behaviour Assessment: An Eco-logical study with Professional Air Traffic Controllers. Sci. Rep. 2017, 7, 547. [Google Scholar] [CrossRef]
  77. Veltman, J.A.; Gaillard, A.W. Physiological indices of workload in a simulated flight task. Biol. Psychol. 1996, 42, 323–342. [Google Scholar] [CrossRef]
  78. Vozzi, A.; Ronca, V.; Aricò, P.; Borghini, G.; Sciaraffa, N.; Cherubino, P.; Trettel, A.; Babiloni, F.; Di Flumeri, G. The Sample Size Matters: To What Extent the Participant Reduction Affects the Outcomes of a Neuroscientific Research. A Case-Study in Neuromarketing Field. Sensors 2021, 21, 6088. [Google Scholar] [CrossRef] [PubMed]
  79. Bakdash, J.Z.; Marusich, L.R. Repeated measures correlation. Front. Psychol. 2017, 8, 456. [Google Scholar] [CrossRef] [PubMed] [Green Version]
  80. Kong, W.; Lin, W.; Babiloni, F.; Hu, S.; Borghini, G. Investigating Driver Fatigue versus Alertness Using the Granger Causality Network. Sensors 2015, 15, 19181–19198. [Google Scholar] [CrossRef] [PubMed] [Green Version]
  81. Kong, W.; Zhou, Z.; Jiang, B.; Babiloni, F.; Borghini, G. Assessment of driving fatigue based on intra/inter-region phase synchronization. Neurocomputing 2017, 219, 474–482. [Google Scholar] [CrossRef]
  82. Borghini, G.; Astolfi, L.; Vecchiato, G.; Mattia, D.; Babiloni, F. Measuring neurophysiological signals in aircraft pilots and car drivers for the assessment of mental workload, fatigue and drowsiness. Neurosci. Biobehav. Rev. 2014, 44, 58–75. [Google Scholar] [CrossRef]
  83. Zhao, Y.; Dai, G.; Borghini, G.; Zhang, J.; Li, X.; Zhang, Z.; Aricò, P.; Di Flumeri, G.; Babiloni, F.; Zeng, H. Label-Based Alignment Multi-Source Domain Adaptation for Cross-Subject EEG Fatigue Mental State Evaluation. Front. Hum. Neurosci. 2021, 15, 546. [Google Scholar] [CrossRef]
  84. Giorgi, A.; Ronca, V.; Vozzi, A.; Sciaraffa, N.; di Florio, A.; Tamborra, L.; Simonetti, I.; Aricò, P.; Di Flumeri, G.; Rossi, D.; et al. Wearable Technologies for Mental Workload, Stress, and Emotional State Assessment during Working-Like Tasks: A Comparison with Laboratory Technologies. Sensors 2021, 21, 2332. [Google Scholar] [CrossRef]
  85. Ronca, V.; Giorgi, A.; Rossi, D.; Di Florio, A.; Di Flumeri, G.; Aricò, P.; Sciaraffa, N.; Vozzi, A.; Tamborra, L.; Simonetti, I.; et al. A Video-Based Technique for Heart Rate and Eye Blinks Rate Estimation: A Potential Solution for Telemonitoring and Remote Healthcare. Sensors 2021, 21, 1607. [Google Scholar] [CrossRef]
Figure 1. Flight simulator facility at the 61° Stormo in Galatina (Italy): (a) the MB339 alpha simulator platform allowed the instructors to monitor and communicate with the pilots and to interact with the aircraft for inducing three unusual attitudes; (b) the pilots’ brain (EEG) and heart (ECG) activity was acquired for the entire flight simulation.
Safety 08 00038 g001
Figure 2. Median time (in sec) of the Experts (blue bar) and Novices (orange bar) in realizing and recovering the three unusual attitudes (nose-down, nose-up, and spin). No statistical difference (p = 0.73) was found between the two groups.
Safety 08 00038 g002
Figure 3. Median LIK score of the Experts (blue bar) and Novices (orange bar) related to the perceived mental effort demand across different flight phases. No statistical difference (p = 0.73) was found between the two groups.
Safety 08 00038 g003
Figure 4. LIK score values throughout the flight phases of the Experts (blue line), Novices (orange line) and SME (green line) related to perceived mental effort demand. The corresponding dotted lines are the interpolated linear trends.
Safety 08 00038 g004
Figure 5. Median LF–HF values of the Experts (blue bar) and Novices (orange bar) across the entire flight simulation. No statistical difference (p = 0.6) was found between the two groups.
Safety 08 00038 g005
Figure 6. Median MEF index of the Experts (blue bar) and Novices (orange bar) estimated from their brain activity across the different flight phases. Significant difference (p = 0.035) was found between the two groups. The asterisk means that the differences were statistically significant (p < 0.05).
Safety 08 00038 g006
Figure 7. Median EEG-based mental effort (MEF) index values throughout the flight phases of the Experts (blue line) and Novices (orange line). The corresponding dotted lines are the interpolated linear trends. Significant differences (all p < 0.05) were found for the resolution of the FAIL_E and recovery of UPSET_1, UPSET _2 and UPSET _3 conditions. The black boxes group the conditions exhibiting statistical differences, while the asterisk means that the differences were statistically significant (p < 0.05).
Safety 08 00038 g007
Figure 8. Median MEF’ distributions of the Novices. The MEF’ allowed for quantifying how much each Novice differed from the Expert population regarding mental effort requested during the flight simulation. The colored dots represent outliers within the corresponding data distribution.
Safety 08 00038 g008
Figure 9. Reporting the MF’ values for each flight phase and pilot allowed for the identification of the condition(s) and pilot(s) who deviated more with respect to the Expert population.
Safety 08 00038 g009
Table 1. Results of the Pearson’s correlations analyses on subjective mental effort perceptions.
ComparisonRp
Experts–SME0.470.16
Novices–SME0.610.06
Experts–Novices0.340.32
Table 2. Correlations between the MEF and LIK values of the pilots.
GroupRp
Experts0.230.52
Novices0.410.23
Experts–SME0.470.16
Novices–SME0.610.06
Publisher’s Note: MDPI stays neutral with regard to jurisdictional claims in published maps and institutional affiliations.

