1. Introduction
Traffic-related deaths and serious injuries represent a major public health issue, with direct impacts on transportation systems, urban mobility, and the economy, as well as resulting in irreparable human losses [
1,
2,
3]. It is estimated that traffic crashes cause between 20 and 50 million injuries and approximately 1.19 million deaths worldwide each year, remaining the leading cause of death among individuals aged 5 to 29 years [
4]. In Brazil, this scenario is reflected in the 34,881 deaths recorded from land transport in 2023 [
5].
Although frequent, traffic crashes should not be regarded as inevitable or intrinsic to the road system. According to the World Health Organization [
6], road safety should be treated as a priority. However, understanding the causes of such events is a complex challenge, since they result from failures in one or more system components (human, vehicle, and environment) and are associated with multiple risk factors, whose intensity and impact may vary depending on local context and changes in public transport policies [
7,
8].
It is also worth noting that the effectiveness of public road safety policies strongly depends on the availability of accurate and detailed crash data. Technical aspects such as road infrastructure and vehicle safety are more easily monitored by authorities, whereas human behavior remains a persistent challenge due to its temporal and spatial variability [
8,
9]. Among the most recognized risk factors are speeding, alcohol consumption, mobile phone use while driving, and the lack of protective equipment [
10].
In the Brazilian context, the city of Rio de Janeiro faces additional challenges, such as urban violence, which influences driver behavior and may alter crash patterns [
11]. Moreover, the fragmented action of involved agencies—where the Fire Department is responsible for assisting victims while official records fall under the jurisdiction of the Civil Police—-hinders the consolidation of comprehensive and up-to-date municipal-level databases. This limitation affects the planning of effective interventions, especially in areas marked by significant regional disparities. Nonetheless, even with information gaps, it is possible to employ statistical models that account for the heterogeneity of risk factors and generate more refined analyses of crash occurrence and severity.
Therefore, the present study aims to investigate the correlation between factors associated with the occurrence (victim occurrence rate) and fatality (fatality rate) of traffic crashes and the historical patterns of injuries and deaths in the city of Rio de Janeiro. It is worth noting that the present study focuses primarily on passenger cars and motorcycles. The goal is to develop statistical models capable of predicting the number of victims in specific areas of the city based on the frequency of such factors, thereby supporting the formulation of more effective municipal road safety policies.
This study contributes to the literature by proposing a realistic methodological approach tailored to the constraints of large Brazilian cities, which reflect the reality of many cities in developing countries, supporting evidence-based public policies and more effective, context-sensitive road safety interventions.
To this end, this paper is based on data collected during an observational study conducted in 2024 and coordinated by the Rio de Janeiro Traffic Engineering Company (CET-Rio), the municipal agency responsible for traffic management in the city. The study monitored all stages of the investigation on the use of seatbelts, helmets, and driving distractions in automobiles and motorcycles. The information gathered was used to build statistical models for analyzing and forecasting crash occurrence and severity, directly contributing to the planning of municipal road safety policies.
In addition to this introduction, our study is structured as follows.
Section 2 presents the literature review on the main risk factors associated with the occurrence and severity of traffic crashes, as well as the methodological approaches used in related studies.
Section 3 describes the methodology employed in this study, detailing the data collection procedures and the construction of statistical models.
Section 4 presents the results obtained, highlighting the correlation analyzes and statistical parameters of the proposed models, and
Section 5 shows the limitations of the study. Finally,
Section 6 discusses the conclusions of the research and points to directions for future studies.
2. Literature Review
Several studies indicate that, despite the multiplicity of factors involved, human behavior still plays a predominant role in the origin of crashes. It is estimated that approximately 90% of occurrences are related to human error [
12,
13,
14]. A traffic crash occurs when the system—composed of the human being, the vehicle, and the environment—becomes unbalanced due to the overload of a risk factor, surpassing users’ abilities and the demands imposed [
13].
The panorama of crashes in Brazil highlights the vulnerability of different road user groups, especially those not protected by vehicle bodies. According to data from the Brazilian Ministry of Health [
5], motorcycle occupants accounted for about 60% of hospitalizations and 36% of deaths caused by traffic crashes in the country in 2023. Pedestrians and cyclists are also among the most affected, representing a significant share of hospital admissions. In contrast, occupants of cars and pickup trucks accounted for 22% of fatal victims, reinforcing the need for broad preventive measures that consider all modes and user profiles.
In this regard, there has been a growing emphasis in both international and national literature on the adoption of the Safe System approach, which is based on the premise of human fallibility and seeks to reduce the impacts of users’ inevitable errors. Unlike the traditional approach (centered on individual accountability), the Safe System proposes a shared responsibility among different actors (such as engineers, planners, public managers, and citizens) and advocates for systemic interventions, such as road redesign, appropriate speed control, and safer vehicles [
3,
4,
15]. This perspective has been incorporated into public policies such as the National Plan for the Reduction of Traffic Deaths and Injuries (PNATRANS) and the Road Safety Plan of the City of Rio de Janeiro (PSV-Rio), which aim to halve road deaths and ensure accessible and safe transport systems for all.
It should also be emphasized that, in addition to human and behavioral factors, the technical literature considers environmental and vehicular factors as determinants of crash severity. Roads with inadequate geometry, poor pavement conditions, deficient signage, and poor lighting are examples of elements that can significantly increase the risk of severe occurrences [
15,
16]. Regarding vehicles, the lack of maintenance, absence of periodic technical inspection, and low safety standards, especially in low- and middle-income countries, make fleets more susceptible to failures that result in crashes with high injury potential [
15].
However, effective monitoring of these parameters requires the integration of cross-sector databases, which remains one of the main structural barriers faced by cities [
9]. This limitation directly impacts public managers’ ability to plan evidence-based interventions. Faced with this challenge, several authors recommend the development of statistical models that combine observational factors with spatial and sociodemographic indicators. Ahmad et al. [
17] argue that correlation analysis between variables can provide a solid basis for more targeted public policies. This approach not only enables a better understanding of the spatial distribution of accidents but also allows for the anticipation of areas with a higher risk of fatalities, an essential tool for urban planning in large metropolises such as Rio de Janeiro.
From this multi-causal understanding, the literature has begun to systematize the risk factors associated with the occurrence and severity of traffic crashes, categorizing them according to their nature: human, environmental, or vehicular. This systematization expands the understanding of the elements involved in traffic events and provides a solid basis for building more robust predictive models capable of supporting specific interventions in critical areas.
Table 1 summarizes the different risk factors of traffic crashes described in the literature.
Despite the wide diversity of risk factors identified, the statistical models applied to analyze the occurrence and severity of traffic crashes vary considerably in terms of complexity and data availability. Wang and Kim [
18] compared two models, a multinomial logistic regression and a random forest model, using variables related to drivers, vehicles, and environmental conditions. The model results identify key contributors to crash severity, including collision type, occupant age, and speed limit. Similarly, Kwon et al. [
1] applied the random forest model and compared it with the Naive Bayes classifier, a supervised machine learning algorithm used for classification tasks, both applied to comprehensive crash datasets. The results indicate that a limited set of risk factors predominantly influences severity levels, and that accounting for interdependencies among these key factors is essential for accurate analysis.
Table 1.
Risk factors according to the literature.
Table 1.
Risk factors according to the literature.
| Human Factor | Authors |
|---|
| Distraction | [2,4,12,13,14,19,20,21,22,23] |
| Speeding | [2,4,7,9,10,12,14,15,20,22,24,25] |
| Psychoactive substances | [2,4,10,12,13,14,22,24] |
| Fatigue | [13,14,22] |
| Aggressive driving | [3,12,13,14] |
| Lack of skill | [3,7,13,14,24] |
| Safety equipment | [2,4,10,13,14,22,24] |
| Road/Environment Factor | Authors |
| Adverse weather conditions | [9,16,22] |
| Poor pavement quality | [9,13,16] |
| Inadequate geometry | [9,16,22] |
| Deficient signage | [3,7] |
| Poor lighting | [7,9] |
| Obstacles | [9] |
| Vehicle Factor | Authors |
| Inadequate maintenance | [15,22] |
| Vehicle instability | [15] |
| Mechanical failure | [15] |
Analyses of risk factors have also employed regression models. Ahmad et al. [
17], Luan et al. [
22], and Nasri et al. [
26] highlight the usefulness of regression to understand correlations between socio-spatial variables and severity indicators. In the study by Bambey et al. [
20], two models were developed: a linear regression model to estimate the influence of different types of distraction on driving speed, and a logistic regression model to assess the relationship between these distractions and the probability of crashes occurring.
In a context where detailed information on each traffic event, such as location, dynamics, and victim profiles, is not publicly available, the work by Pfitscher et al. [
27] sought to correlate seatbelt and helmet use rates across the nine sub-prefectures of the City of Rio de Janeiro, collected in a study carried out in 2023, with the historical percentage of fatalities of traffic victims in these areas. The authors built linear regression models that proved satisfactory but acknowledged the need to evaluate a larger number of regions and include other possible risk factors that could make the results more explanatory.
Given these informational constraints, the present study adopts statistical tools of lower complexity and greater accessibility, compatible with the limited availability of detailed data on traffic crashes in the municipality of Rio de Janeiro. To this end, Pearson correlation is employed, followed by simple and multiple linear regression models, to generate models with different combinations of variables and evaluate which ones produce the best statistical parameters.
Thus, this study seeks to contribute to the literature by proposing a realistic methodological approach adapted to the limitations faced by large Brazilian cities. The research represents an advance in the field of road safety and reinforces the urgency of evidence-based public policies aimed at preserving life in traffic. The knowledge generated may support more targeted, effective, and locally sensitive interventions by public authorities.
Although
Table 1 lists sixteen potential risk factors identified in the literature, this study focuses on three selected risk factors (distraction, speeding, and use of safety equipment) based on their relevance and availability in the traffic victim dataset. As the main hypothesis, this study assumes that these selected factors, combined with additional indicators such as violent crime rates, illiteracy rates, and enforcement points per kilometer, can help explain accident occurrence as reflected in traffic victim data. It is assumed that areas characterized by higher levels of violence, lower compliance with traffic regulations, and lower literacy levels tend to present a higher incidence of traffic crashes.
3. Methodology
Considering that the traffic system is susceptible to failures in the tripod formed by human factors, vehicles, and the road environment, this study adopts an epidemiological approach to correlate the occurrence and fatality of crashes with the presence of risk factors. According to Shinar [
14], this approach was developed to avoid interpretations based solely on historical explanations, seeking instead to identify causal relationships by comparing groups exposed and not exposed to specific risk factors.
Assailly [
12] emphasizes that behaviors such as speeding, dangerous crossings, and drunk driving can be measured through structured surveys, which serve as a basis for comparative analyses. With this information, it is possible to build statistical models that estimate the influence of one or more factors on the occurrence and fatality of traffic victims [
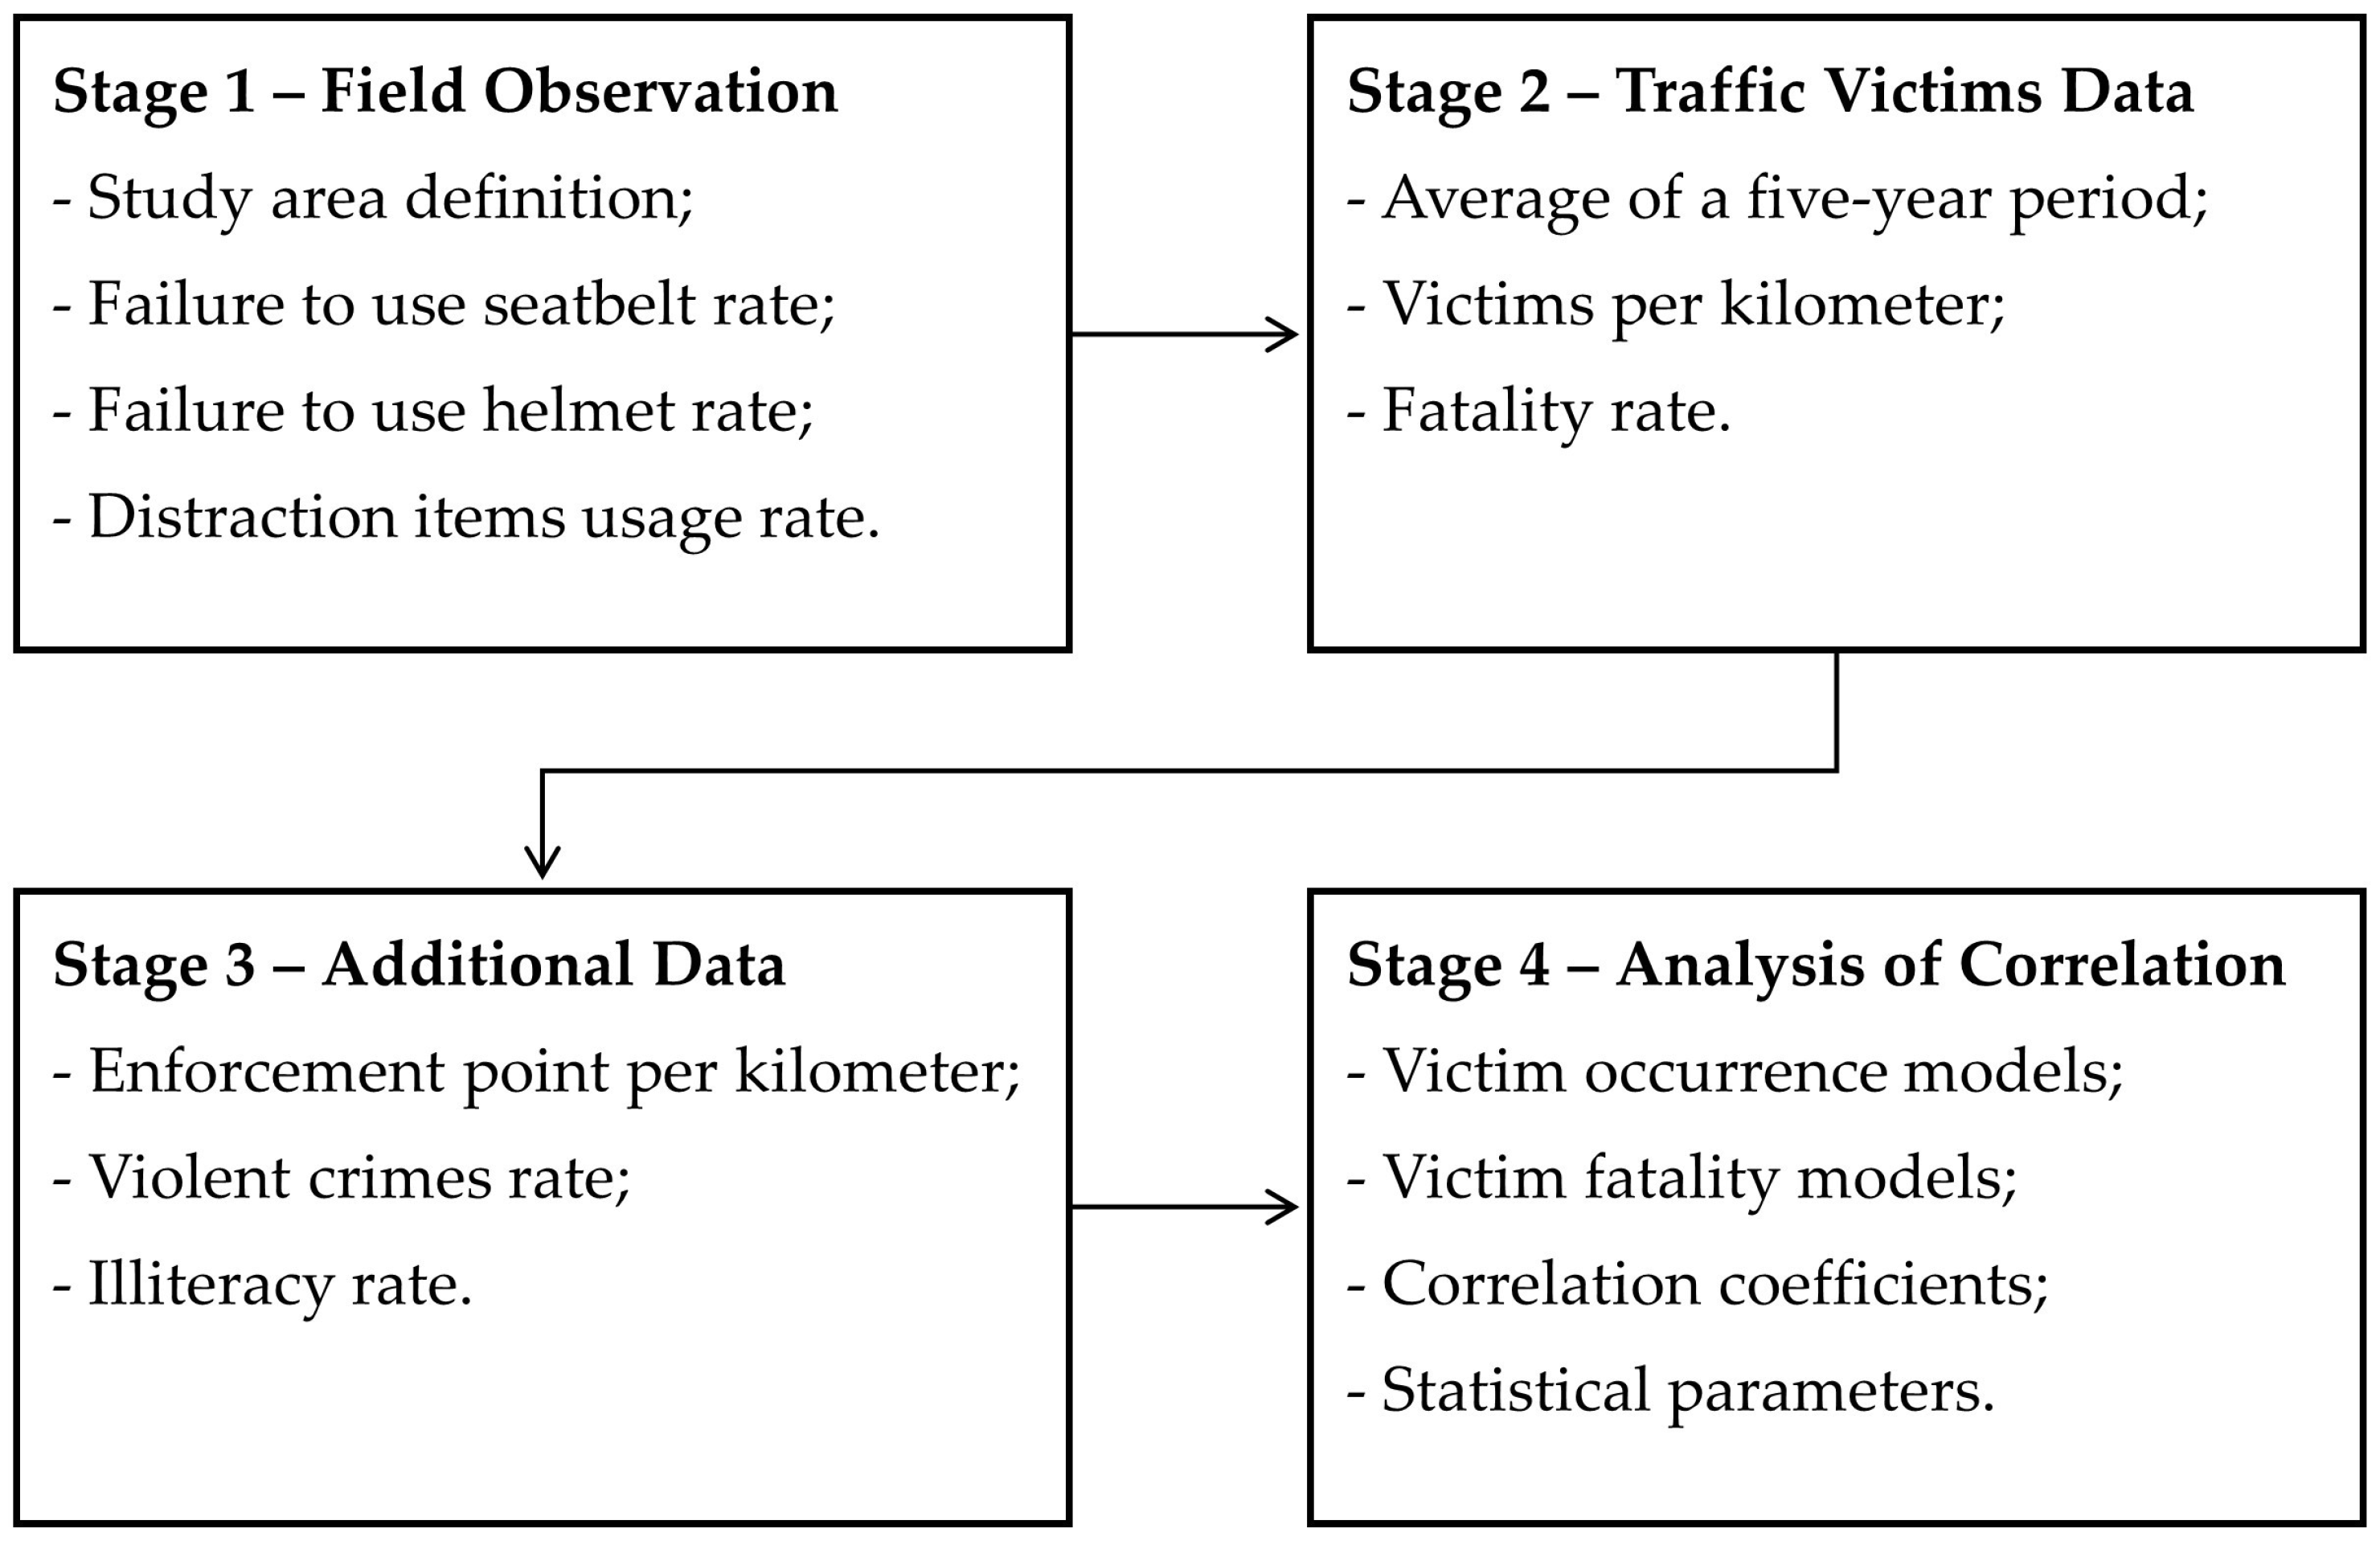
8]. The methodological steps adopted in this study are presented in
Figure 1.
This research followed four complementary procedures: (i) surveying behavioral risk factors through field observations; (ii) collecting historical data on traffic victims; (iii) integrating contextual variables such as electronic enforcement, crime, and education; and (iv) applying statistical techniques to develop mathematical models.
Stage 1 used a non-participant observational method to identify behavioral risk factors, such as the use of safety equipment (seatbelt, helmet, and child restraint device) and the presence of distractions (cell phone, cigarette, and food). The procedure consisted of observing the use of these items by all vehicle occupants (cars and motorcycles) stopped at the traffic light in order of arrival, without any interaction, to avoid intentional changes in behavior.
The use of cell phones, cigarettes, food, or drinks while driving was recorded only when actually observed, even if the vehicle was stopped. The presence of a visible cell phone, without handling, was not considered a distraction. For motorcycles, incorrect helmet use was recorded according to the criteria of Brazilian National Traffic Council Resolution No. 940/2022 [
28], including excessive looseness or an inappropriate model.
Separate paper forms were used for cars/light vehicles and for motorcycles, containing fields to record location, date, weather conditions, occupied seats, occupants’ age group and use of safety devices, as well as the driver’s gender and distracting items used.
In order to ensure that the results reliably represent both the resident population and the registered vehicle fleet within the study area, minimum sample sizes for occupants and vehicles were calculated using Equation (
1). After determining each sample size, a design effect correction factor (
) was applied. This parameter quantifies the extent to which the expected sampling error under the adopted sampling design deviates from the error associated with a simple random sampling procedure.
In Equation (
1),
A denotes the minimum required sample size,
N represents the population size,
z is the critical value associated with the desired confidence level,
p corresponds to the population homogeneity parameter (expressed in decimal form), and
e is the admissible margin of error (also expressed in decimal form).
The minimum sample sizes (
A) for occupants and vehicles were computed considering as population data (
N) the total number of residents and the registered fleet of four- and two-wheeled vehicles in the municipality in 2022. A 95% confidence level was adopted, corresponding to a critical value (
z) of 1.96. The population homogeneity parameter (
p) was set at 0.5, assuming maximum variability in the population, and the admissible margin of error (
e) was defined as 0.02. Finally, the resulting sample sizes were adjusted by applying a design effect (
) of 1.2 to account for potential deviations from simple random sampling. The final minimum sample sizes are presented in
Table 2.
Data collection occurred over three weeks, starting on 7 October 2024. Each Observation Point (OP) was observed on two alternating weekdays, during two periods (morning and afternoon), for one hour for each type of vehicle.
Stage 2 involved the collection of official data on injured and fatal traffic victims in the regions covered by Stage 1. Considering the lack of a standardized and integrated data collection system for all Brazilian municipalities, as well as the absence of detailed information on crash dynamics [
29], aggregated regional data were used, and the annual average number of victims was calculated over a five-year period.
Data on injured and deceased traffic victims were obtained from the Rio de Janeiro Public Security Institute (ISP). However, the data provided do not include crash dynamics, such as pedestrian collisions or falls, nor the modes of transport involved. Therefore, in this research, it was not possible to restrict the events to only automobiles and motorcycles. In addition to traffic-related crimes, data on violent crime were extracted, including intentional homicide, bodily injury followed by death, robbery followed by death, among others. Crime rates were calculated based on the resident population in each Integrated Public Security Circumscription (CISP), which is the smallest geographical unit used for calculating crime indicators, using data from the 2022 Census [
30].
To assess the occurrence of traffic crashes, the annual average number of victims in each area was calculated for the analyzed period and divided by the length of its road network. This provided the annual traffic victim rates per 100 km of road in the studied regions. Additionally, the fatality rate was calculated, defined as the ratio between the number of fatal victims and the total number of victims. The use of the resident population as a denominator was not adopted to avoid potential distortions in central areas, which, although sparsely populated, have high flows of people and vehicles during business hours.
In addition to the variables collected in Stage 1, Stage 3 consisted of searching for other indicators using official online databases. Based on the location of electronic speed enforcement, red-light running, and bus lane violation equipment, the density of traffic enforcement cameras per kilometer of road network was calculated. This value indicates the level of control exercised by authorities over unsafe behaviors and may influence both the occurrence and severity of crashes.
Urban violence can influence driver behavior, leading to more aggressive attitudes in traffic and, consequently, increasing crash risk [
11]. Therefore, annual rates of violent crimes per capita were calculated over the same five years considered in the analysis of traffic victims.
Moreover, the lack of knowledge of traffic laws and the risks associated with human factors can negatively affect the use of personal protective equipment (such as seatbelts and helmets) and favor distractions and the use of psychoactive substances. To capture this aspect, illiteracy rates obtained from census data were used.
The extension of roads within the selected areas was calculated in QGIS 3.42 Münster software, using the street database provided by the municipality [
31], by summing the length of each road segment located within the polygons of the selected CISPs. For the analysis of traffic enforcement camera density in the study areas, official data from the Rio de Janeiro City Hall on the location of operational equipment were used. The addresses were obtained from the list provided by the Municipal Transport Department of Rio de Janeiro [
32] and georeferenced in QGIS to account for enforcement points within each CISP.
Finally, data on the illiteracy rate of the population over 15 years of age in each CISP were obtained from the 2022 Census [
30]. The city’s census tract map, provided by the municipality [
33], was cross-referenced with the CISP boundaries in QGIS, allowing us to identify the number of literate and illiterate residents in each region. The total resident population was also calculated to determine the incidence of violent crime.
Due to the absence of detailed data on each traffic event, it was not possible to apply complex models such as those of Ahmad et al. [
17], Kwon et al. [
1], and Wang and Kim [
18], which are based on large datasets. Thus, in Stage 4, the correlation between aggregated victim data and risk factors in homogeneous regions was assessed using multiple linear regression in Microsoft Excel.
Initially, correlation coefficients between the variables were calculated to verify linear relationships between them. Correlation between dependent and independent variables indicates the explanatory potential of the latter. Correlation among independent variables makes it possible to assess collinearity, i.e., whether two or more variables explain the same phenomenon. Two sets of statistical models were then built depending on the analysis objective:
Victim occurrence models: the dependent variable was the rate of total victims per kilometer of road network in each region. Fifteen models were developed—four with individual independent variables and the others with different combinations of: (i) driver distraction rates; (ii) traffic enforcement camera density; (iii) violent crime per capita; and (iv) illiteracy rate.
Fatality models: the dependent variable was the fatality rate of the victims. Fifteen models were also tested: four with individual variables and eleven with combinations of: (i) seatbelt non-use rate; (ii) helmet non-use rate; (iii) traffic enforcement camera density; and (iv) illiteracy rate.
For all models, the coefficients of determination (R
2), which indicate the goodness of fit and the explanatory power of the model, and the significance values (
p-values) of the independent variables were analyzed. Since R
2 tends to increase with the inclusion of additional variables, its use was limited to individual models with a single independent variable. In models with two or more variables, the adjusted R
2 was applied, which corrects this tendency and reduces the resulting value when the additional variables do not improve the model [
34].
Models with R2 or adjusted R2 equal to or greater than 0.5 were sought. However, the highest value of these coefficients does not necessarily guarantee a statistically better model, since the variables may have p-values greater than 0.05, meaning that the null hypothesis cannot be rejected. Therefore, the mathematical formulation with the best statistical parameters was ultimately chosen for each approach, and the influence of its variables on road safety was discussed.
The use of linear regression in this context is justified by the exploratory nature of the study, the continuous formulation of the dependent variables, the limited number of spatial units, and the severe constraints in data availability. The models are intended to reveal general patterns and support diagnostic insights rather than establish causal relationships, serving as a first analytical step in a context where more sophisticated approaches are currently infeasible.
4. Results
This section first presents the case study, followed by an overview of the data and an analysis of the results obtained from the statistical models for crash occurrence and severity.
4.1. Case Study
Rio de Janeiro is the second most populous city in Brazil, with 6,211,223 inhabitants according to the 2022 Census [
30]. The municipality also has the second largest vehicle fleet in the country, with 3,320,194 registered vehicles in 2022 [
35], of which 82% are light four-wheeled vehicles and 14% are two-wheeled vehicles, including motorcycles, scooters, and mopeds.
In terms of administrative organization, the municipality is divided into five planning areas, nine sub-prefectures, 16 planning regions and 165 neighborhoods. For public security purposes, the territory is segmented into 41 CISPs [
36,
37].
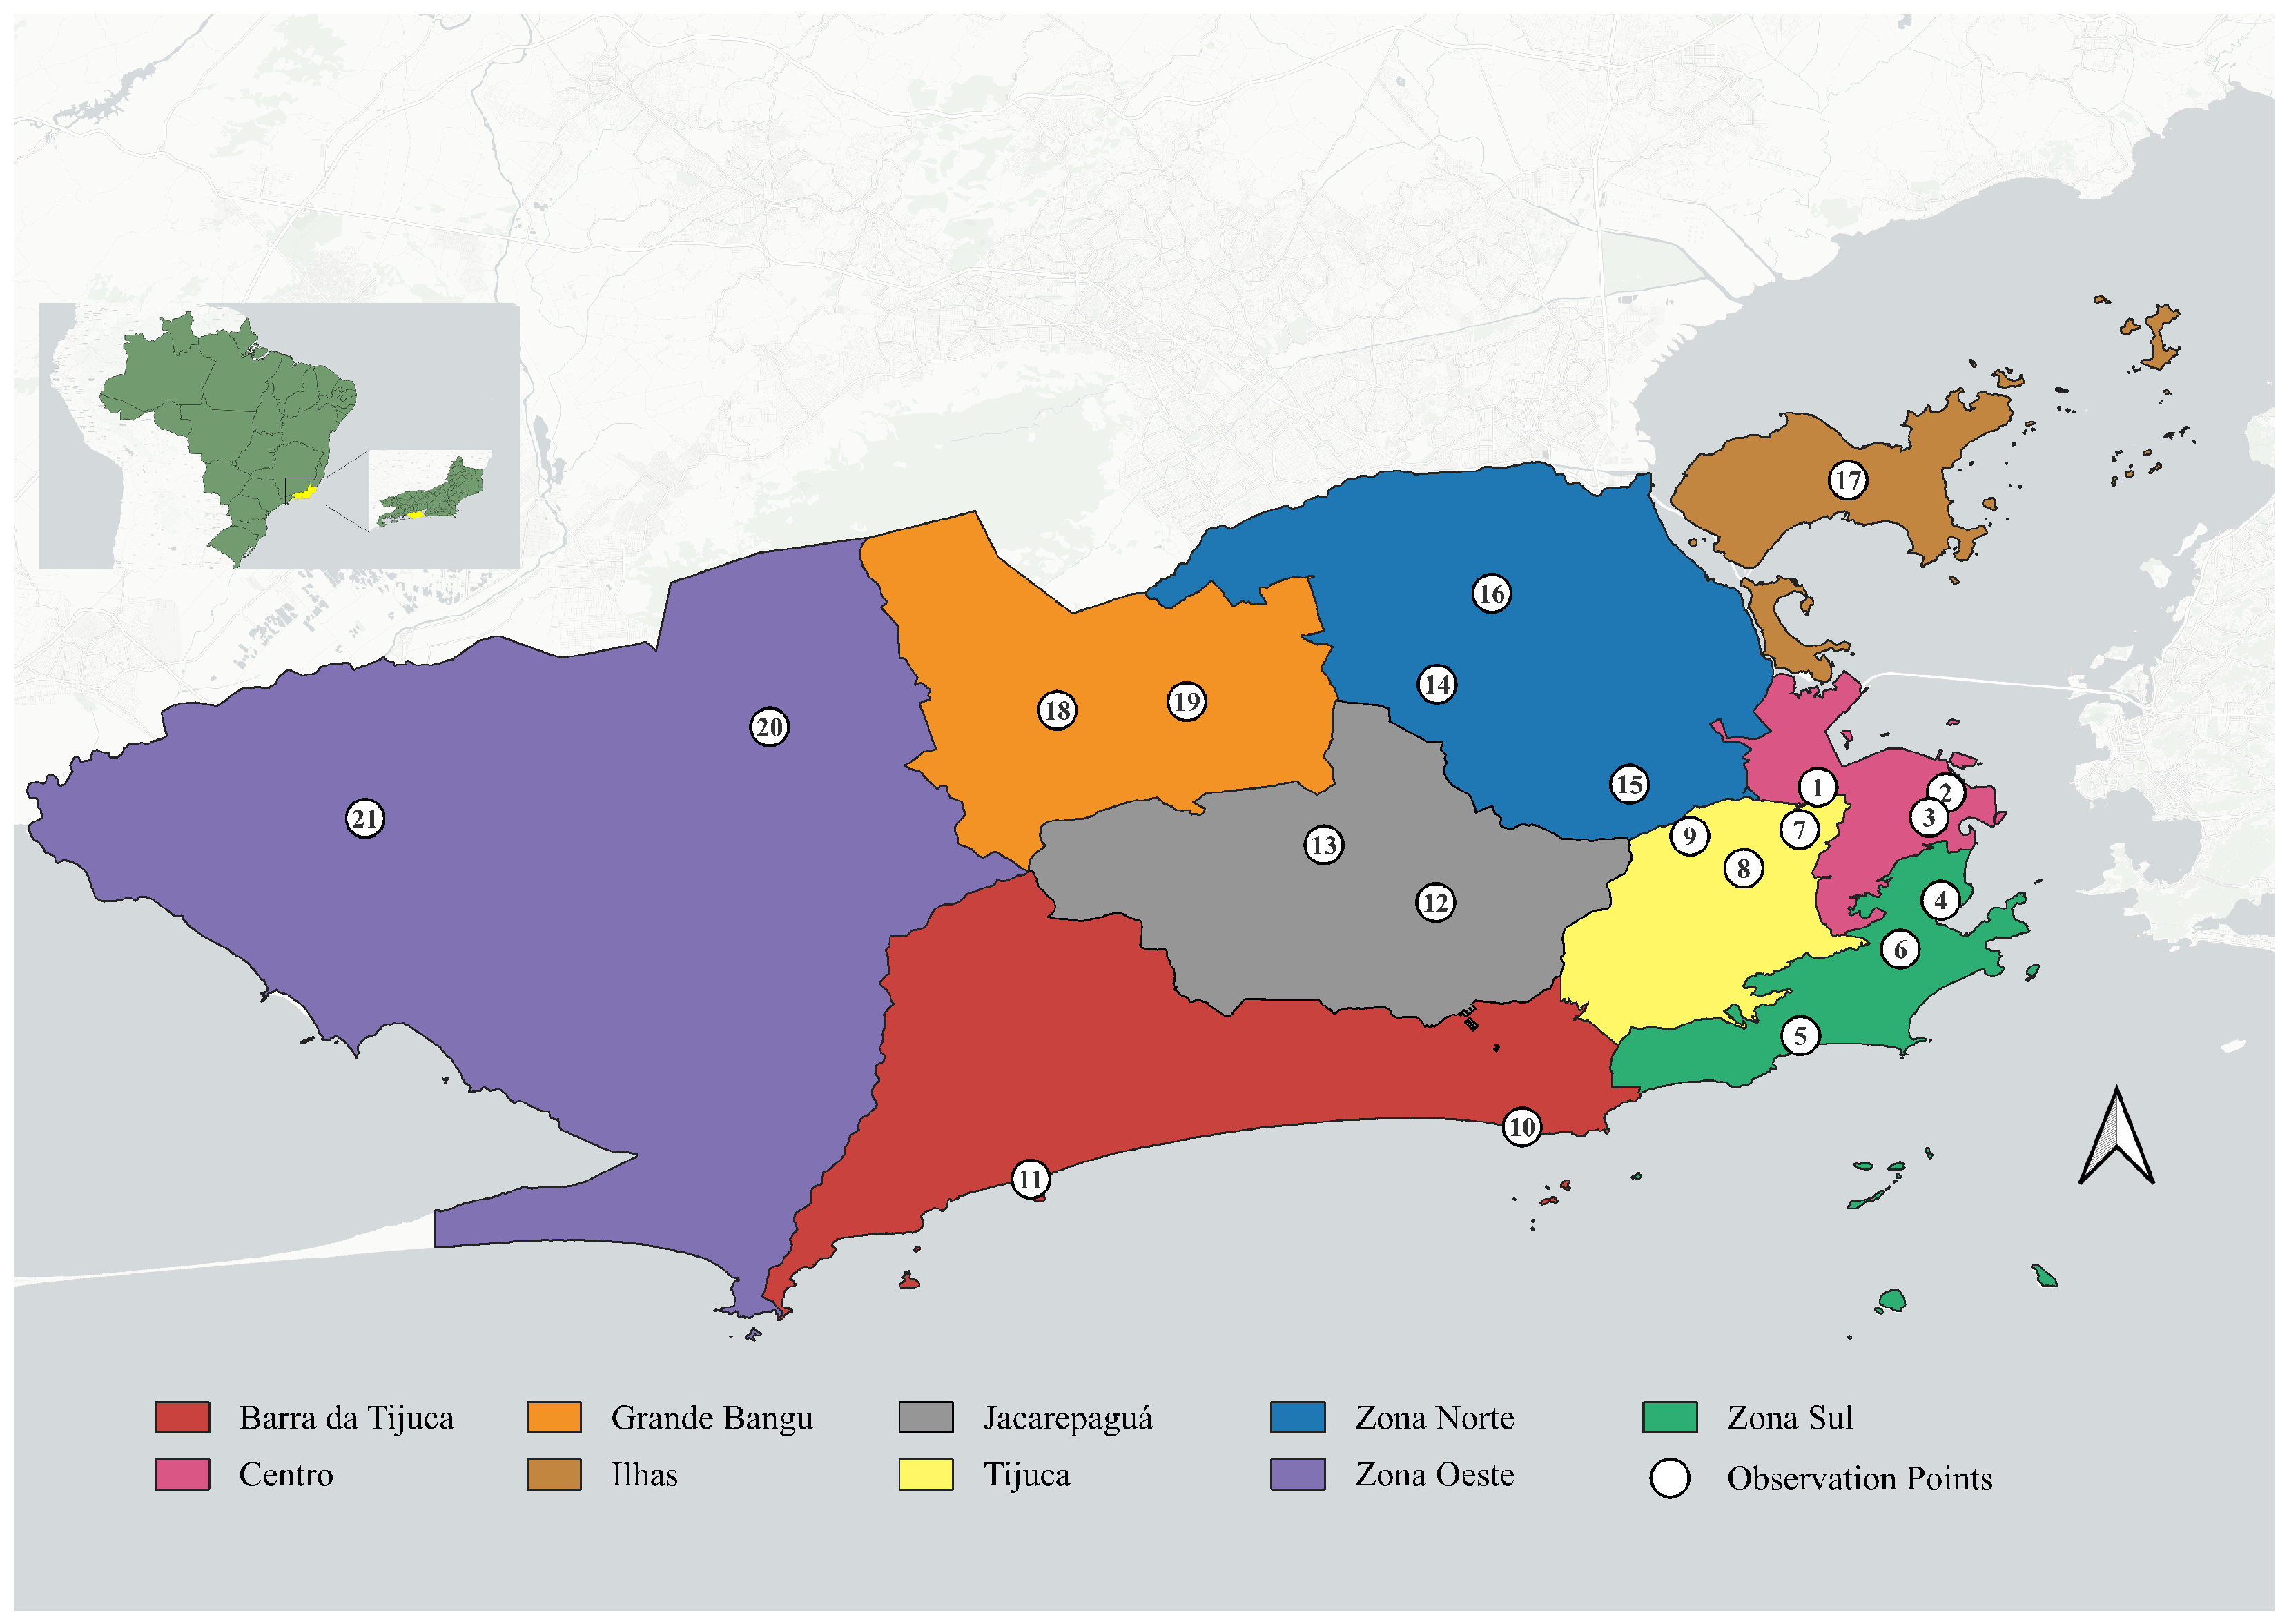
For this study, 21 OPs were defined in partnership with CET-Rio, distributed across the city’s sub-prefectures and selected according to logistical, topographical, and public safety constraints (
Figure 2). These points represent markedly different regions of the city in terms of population density, average income, and transport infrastructure.
4.2. Sample and Data Overview
This subsection presents a detailed overview of the collected data, organized into the main topics analyzed: use of safety equipment, use of distraction items, history of traffic crash victims, enforcement cameras, crime, and sociodemographic indicators.
As a result of the observational survey, 3999 cars and 4523 motorcycles were recorded, values higher than the minimum sample size required for each category (2879 and 2867 vehicles, respectively). Among these vehicles, 12,103 occupants were registered, which is 4.2 times greater than the minimum sample size of 2881 people. The majority of drivers were male, both among car drivers (82.6%) and motorcycle riders (96.1%).
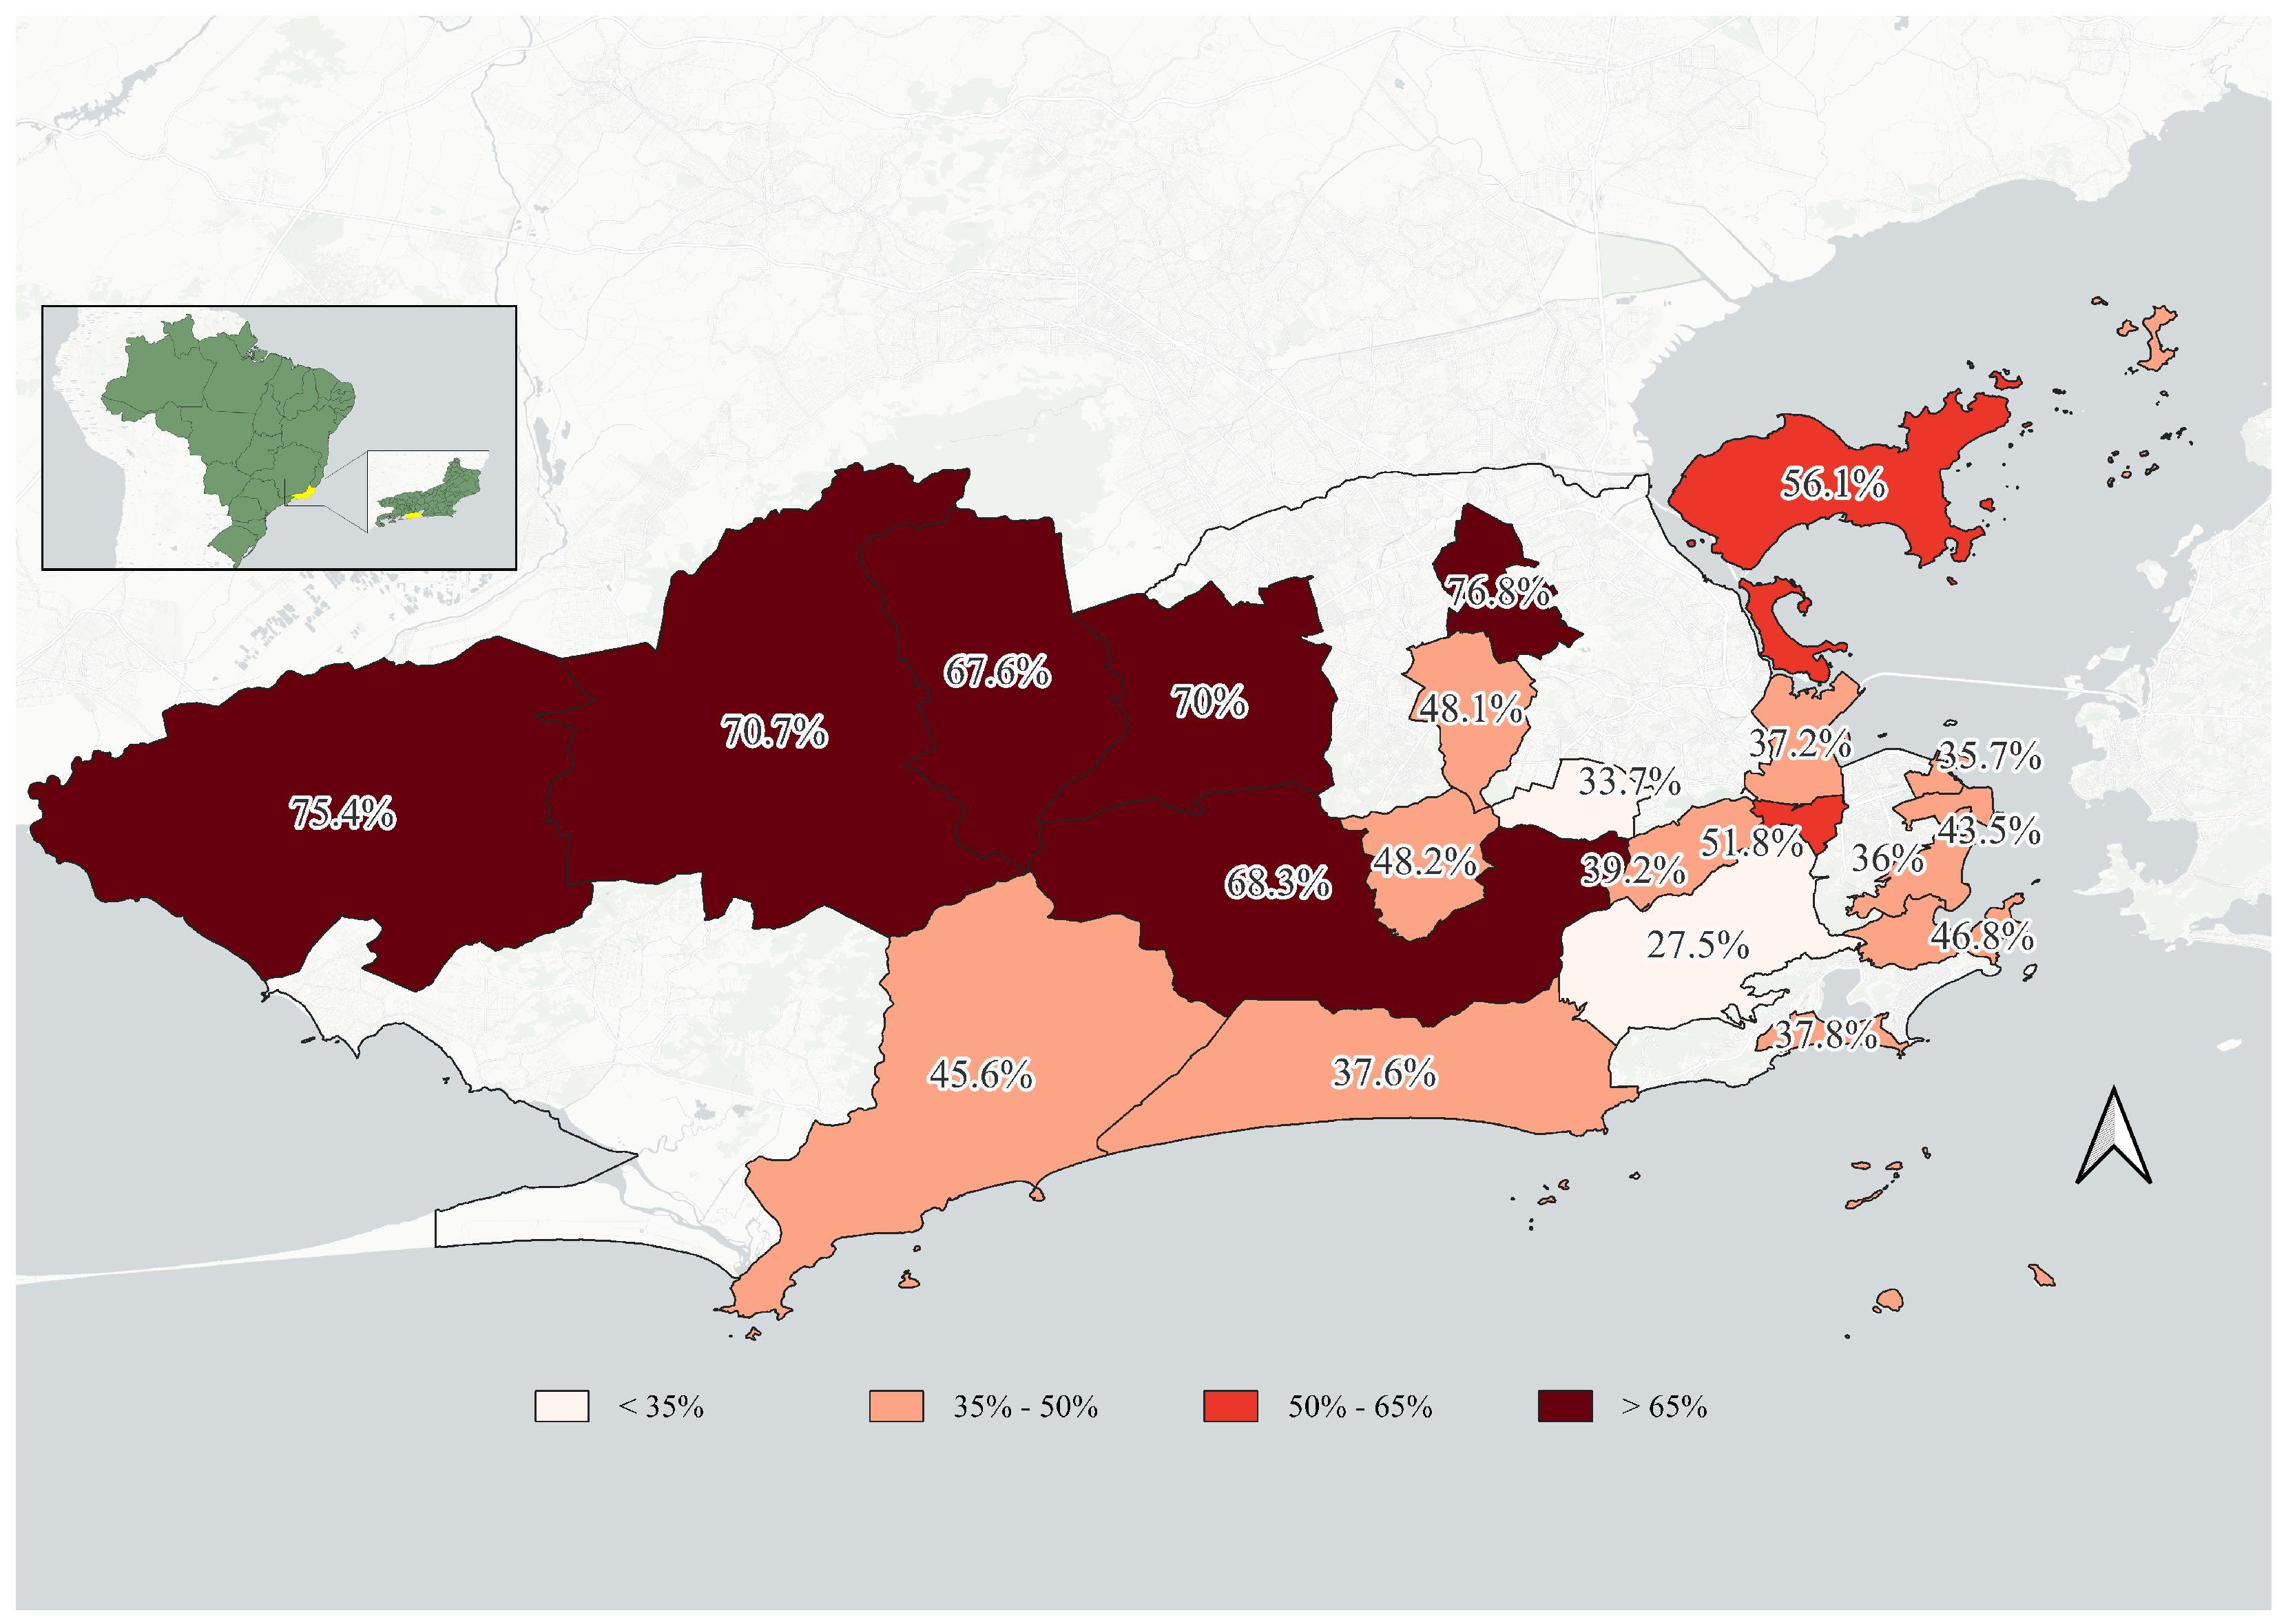
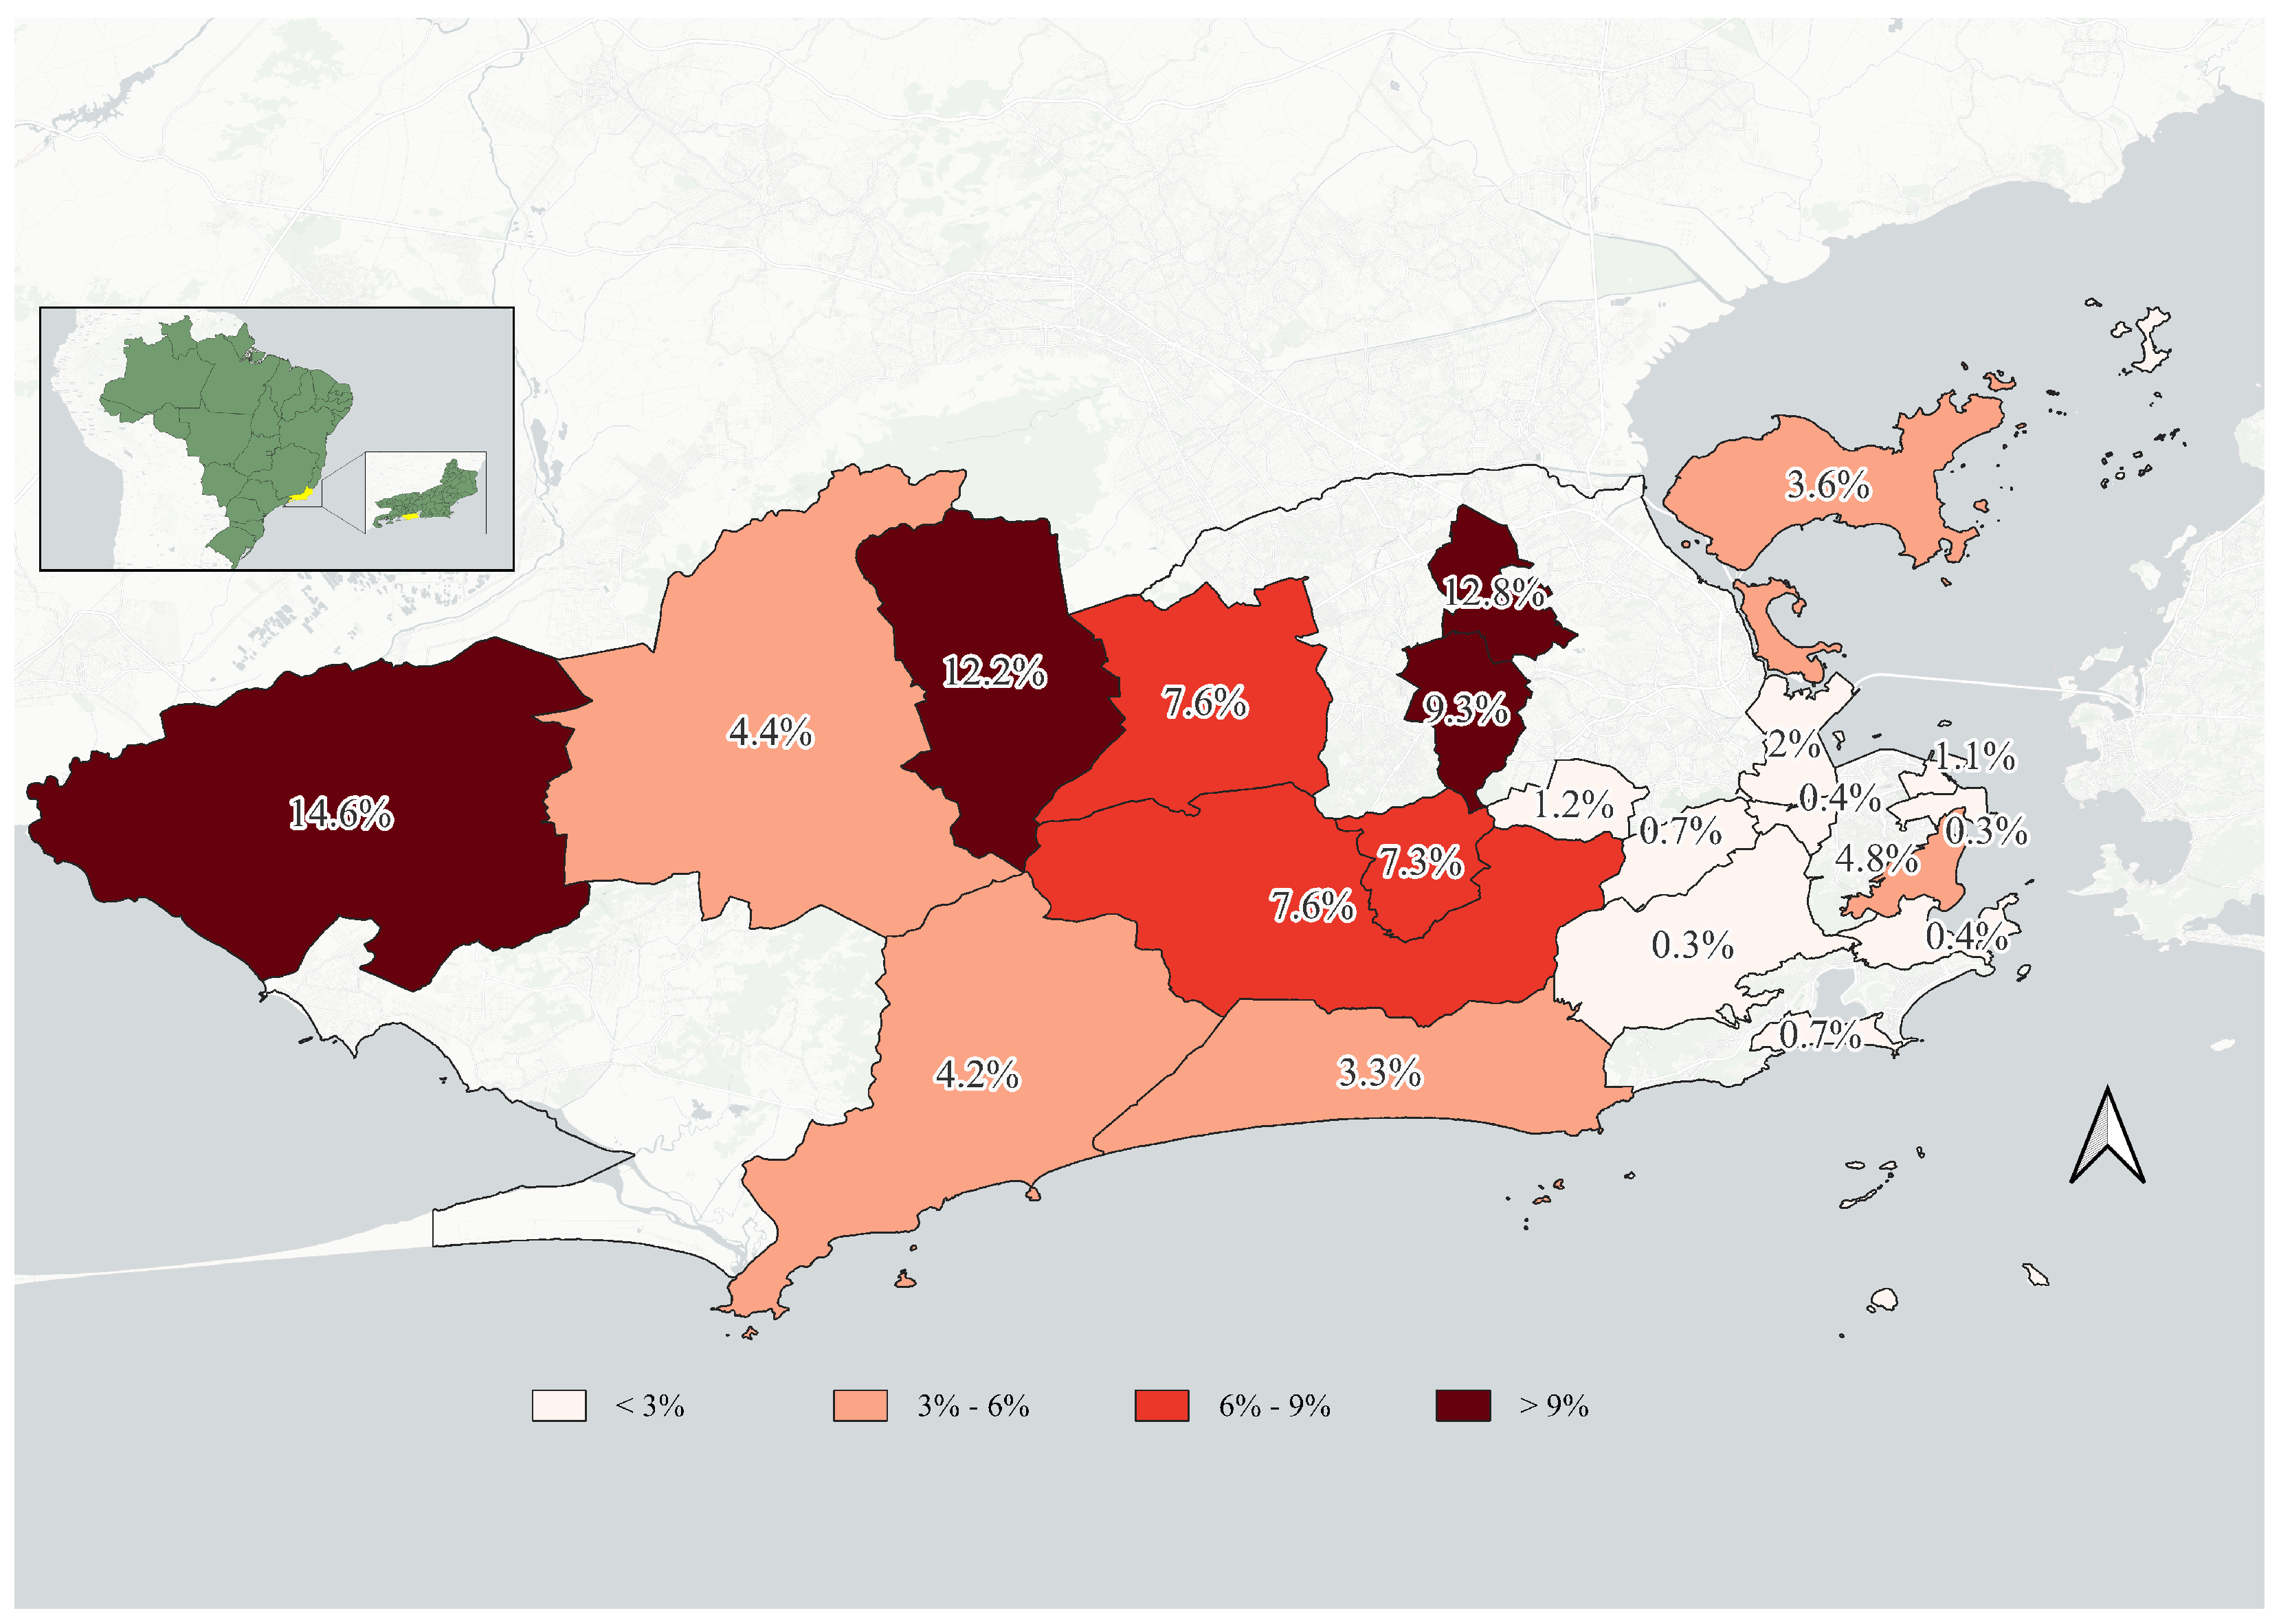
Regarding the use of safety equipment, seatbelts were used, on average, by 49.4% of car occupants in the city of Rio de Janeiro, indicating a concerning scenario for road safety. Seatbelt usage rates varied significantly across the territory, possibly related to socioeconomic characteristics, crime levels, and the intensity of enforcement (
Figure 3). The lowest usage rates were observed in the most peripheral regions, shown in dark red (Zona Norte, Zona Oeste, and Grande Bangu).
Helmet use among motorcycle riders was much higher than seatbelt use (
Figure 4), with an average rate of 95.3%, of which 88.2% represented correct use—that is, with the chin strap fastened and without slack up to the jaw. This rate indicates that helmet use is approximately 1.93 times higher than seatbelt use, which may suggest a greater understanding of the importance of this equipment for the physical integrity of motorcyclists, who do not have the structural protection provided by vehicles.
As with seatbelts, helmet use also varies across the territory, possibly influenced by socioeconomic conditions, urban violence, and the intensity of enforcement carried out by public authorities—factors that also affect seatbelt usage rates.
Regarding distraction items, 80.1% of car drivers did not use any distracting objects while stopped at a red traffic light. The most common distraction was cell phone use, observed in 17.8% of drivers, followed by smoking (1.4%) and eating or drinking (0.9%). Among motorcyclists, 86.5% showed no distraction, with the cell phone being the main item used (12.8%), while smoking and eating or drinking were rare, at 0.6% and 0.2%, respectively.
The territorial differences observed in distraction rates may be related both to purchasing power for acquiring smartphones and to greater economic activity involving transportation and delivery apps, as well as the impact of urban violence, which may inhibit cell phone use while driving (
Figure 5).
Although the number of people injured (12,917) and killed (706) in traffic in the city of Rio de Janeiro in 2024 is considered high [
37], the decision was made to analyze the annual average of victims in the studied areas. For this purpose, data on injuries and deaths in traffic over a five-year period (2020–2024) were collected from the Public Security Institute website. In the CISPs covering the 21 OPs, there were 29,587 injuries and 1900 deaths, representing approximately 61% of the victims in the municipality.
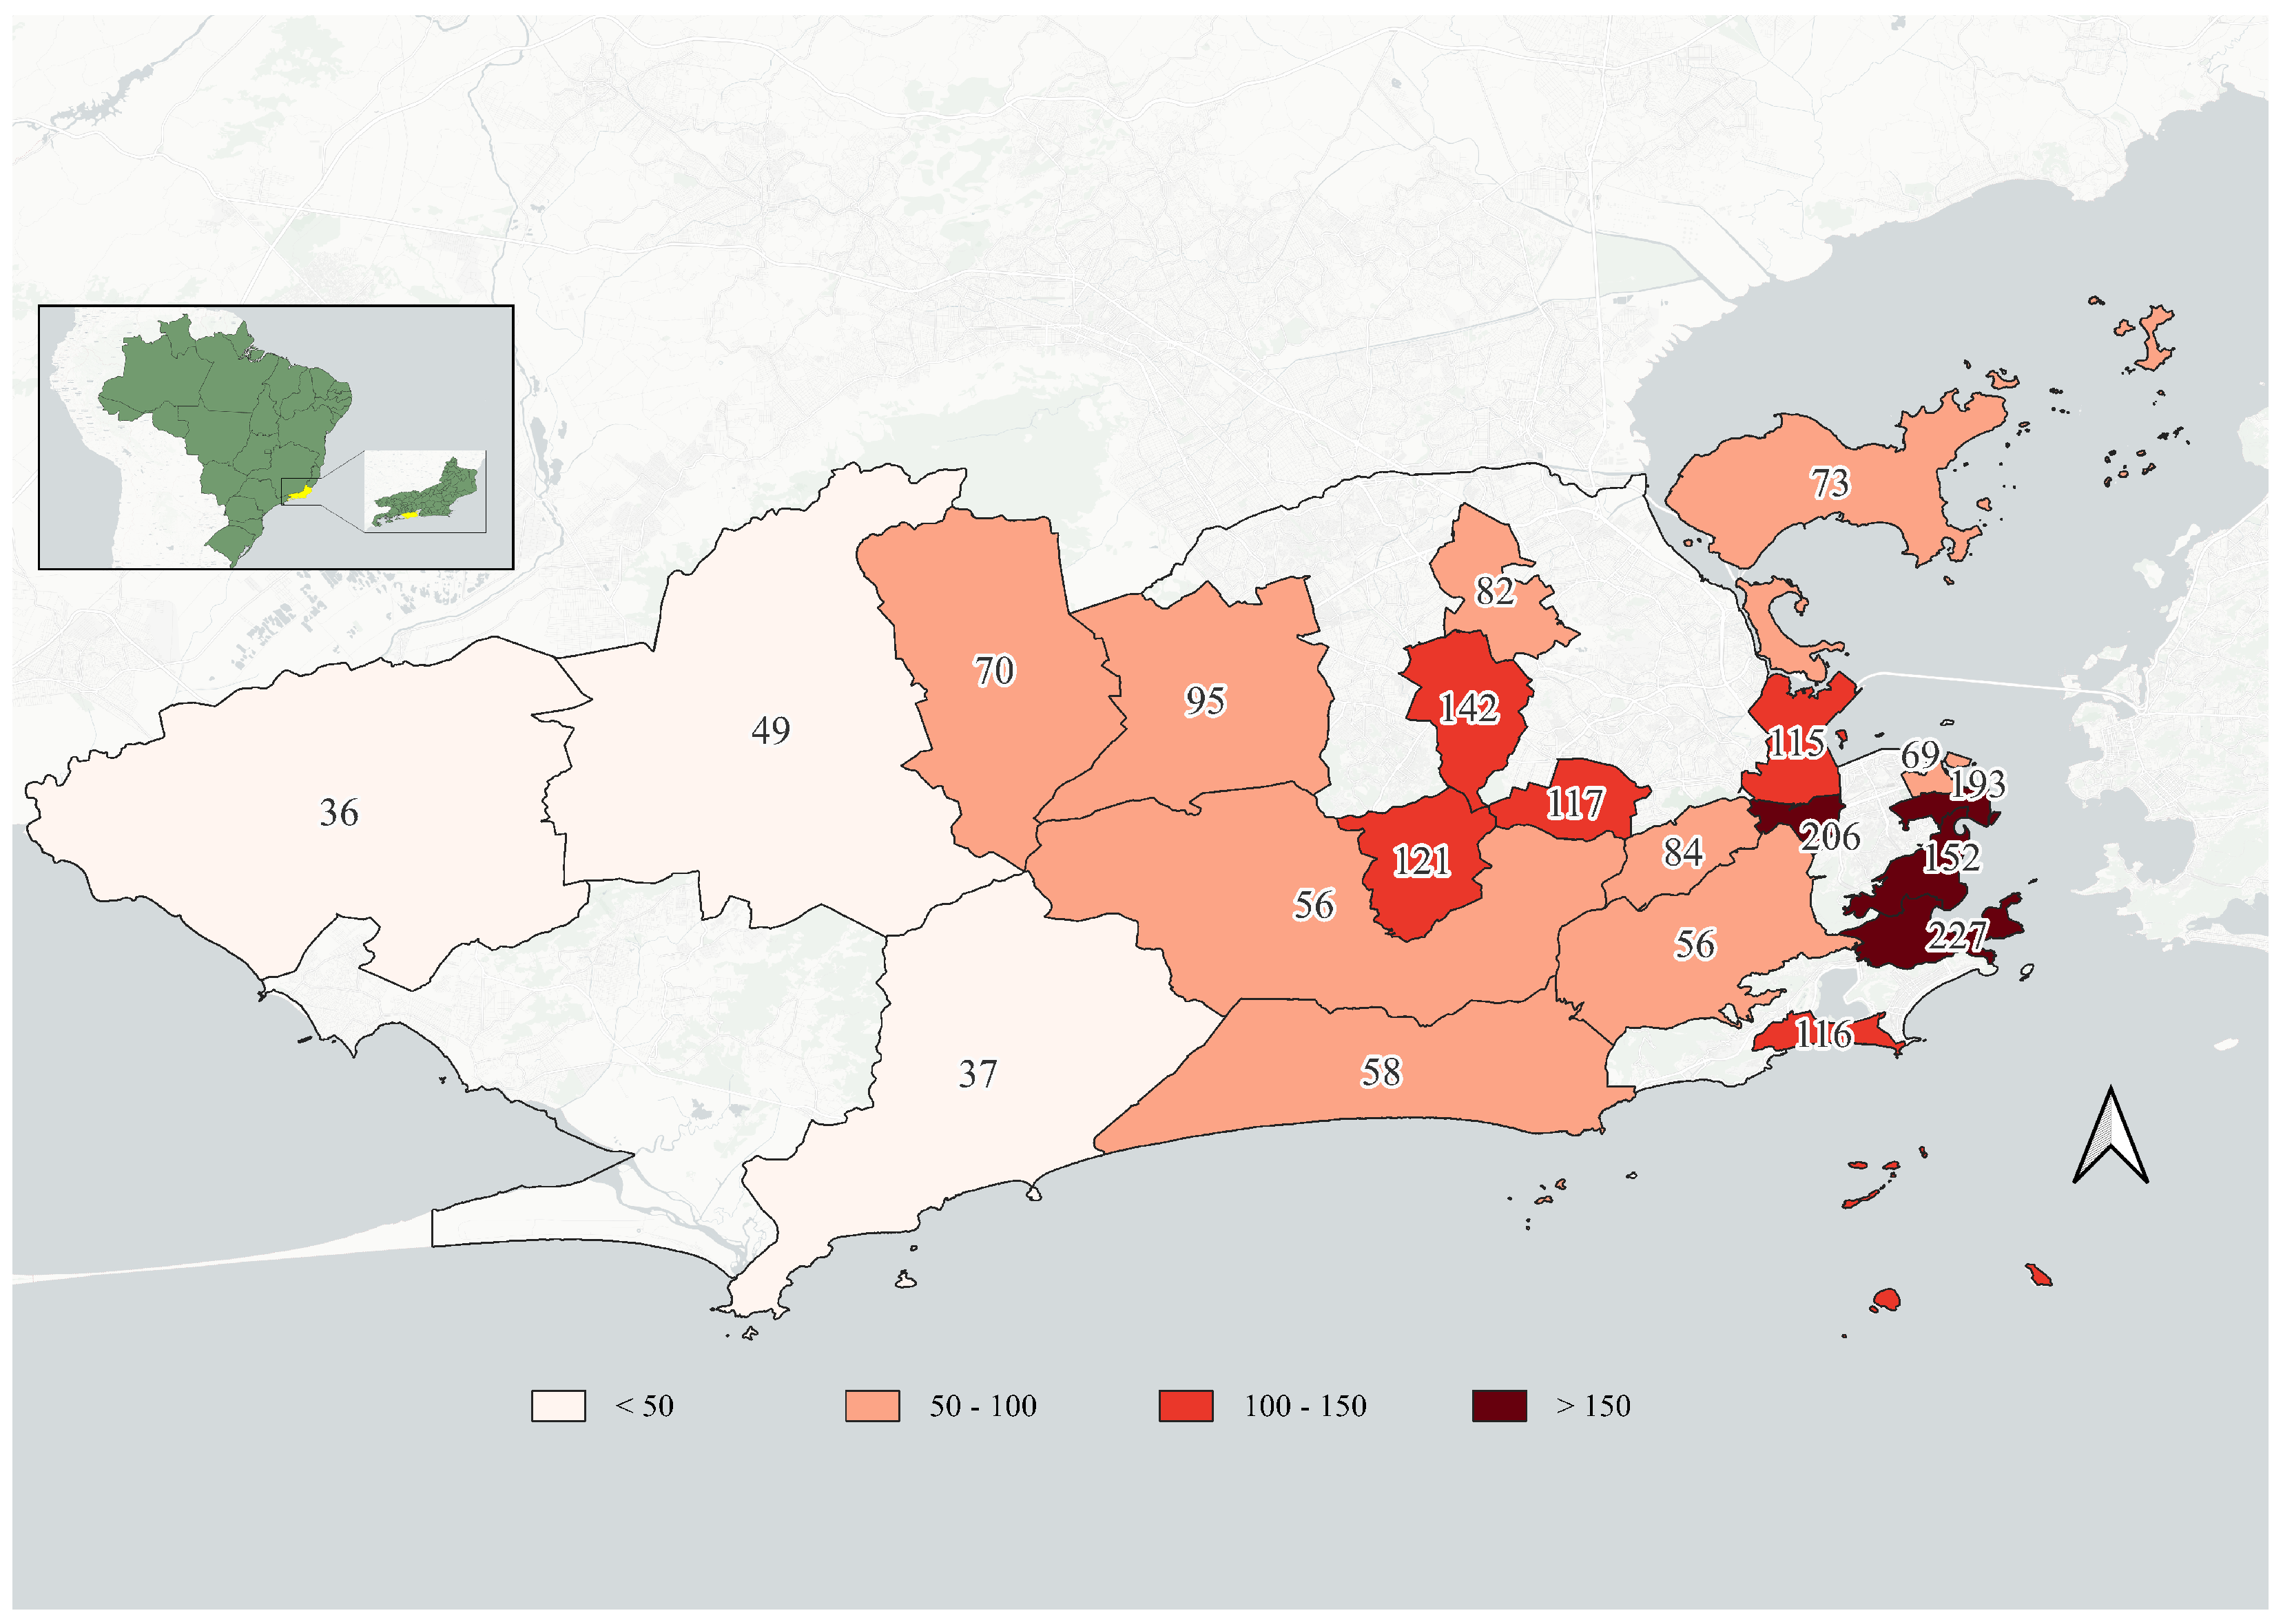
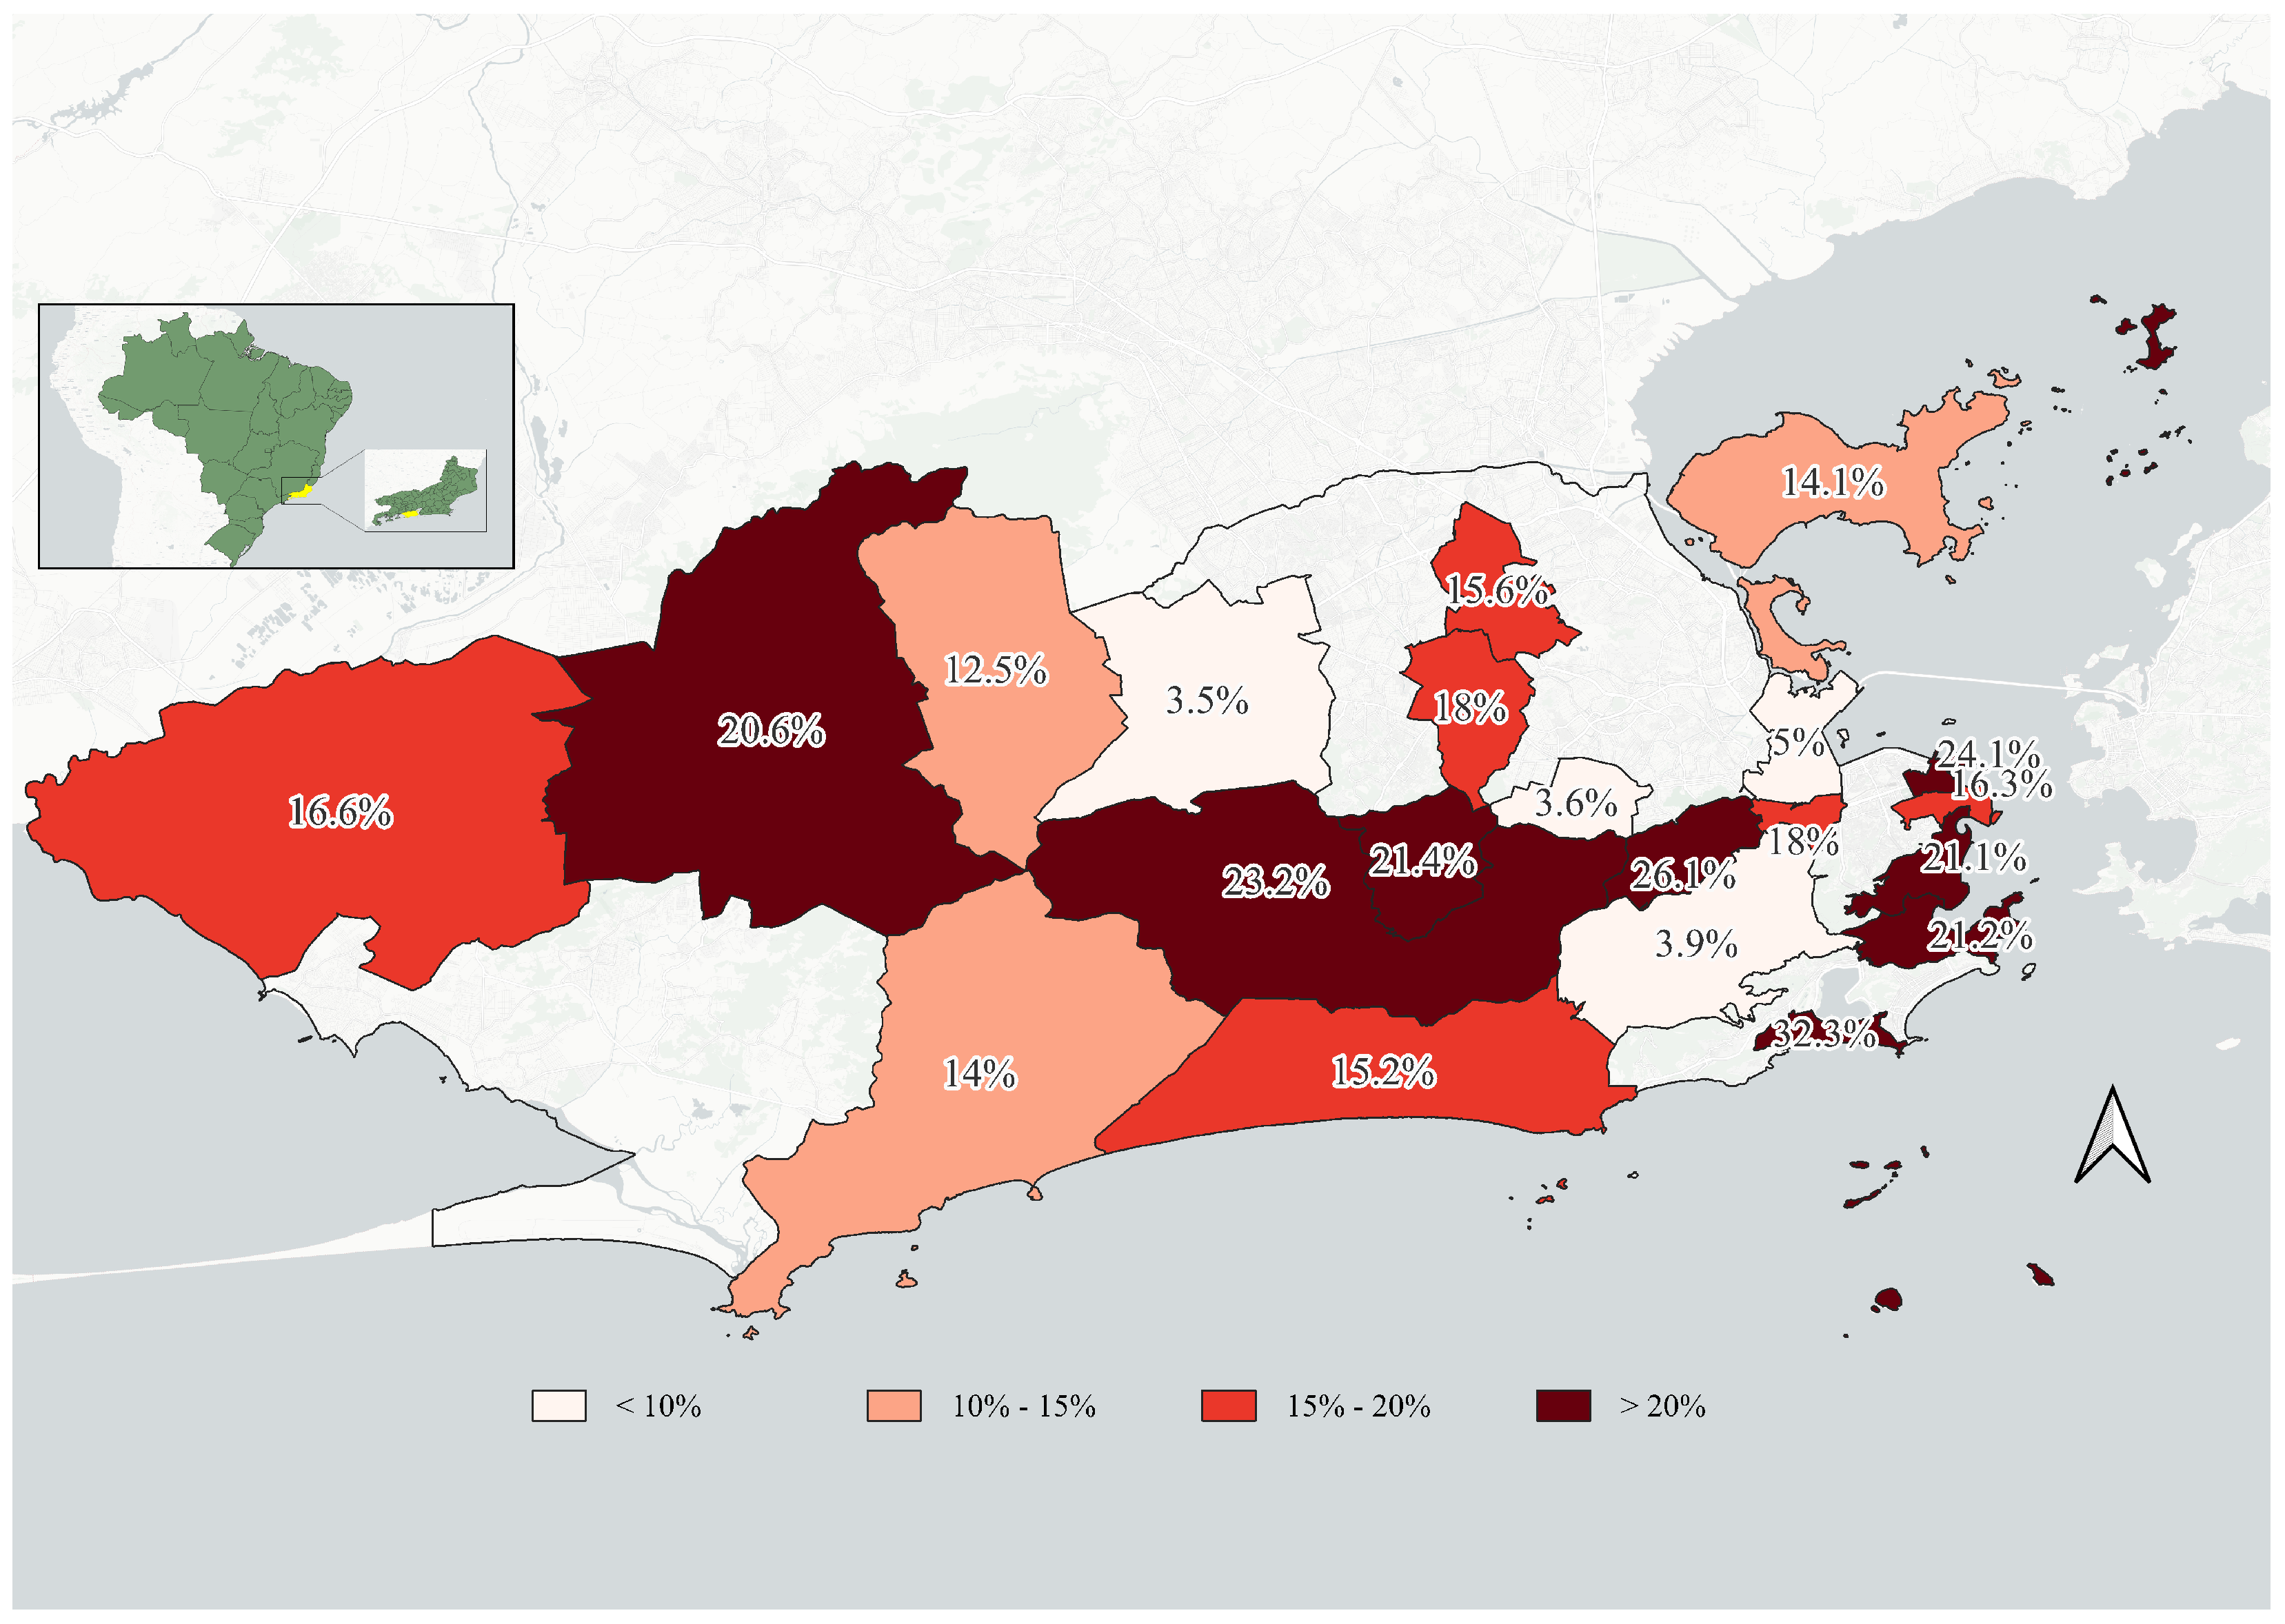
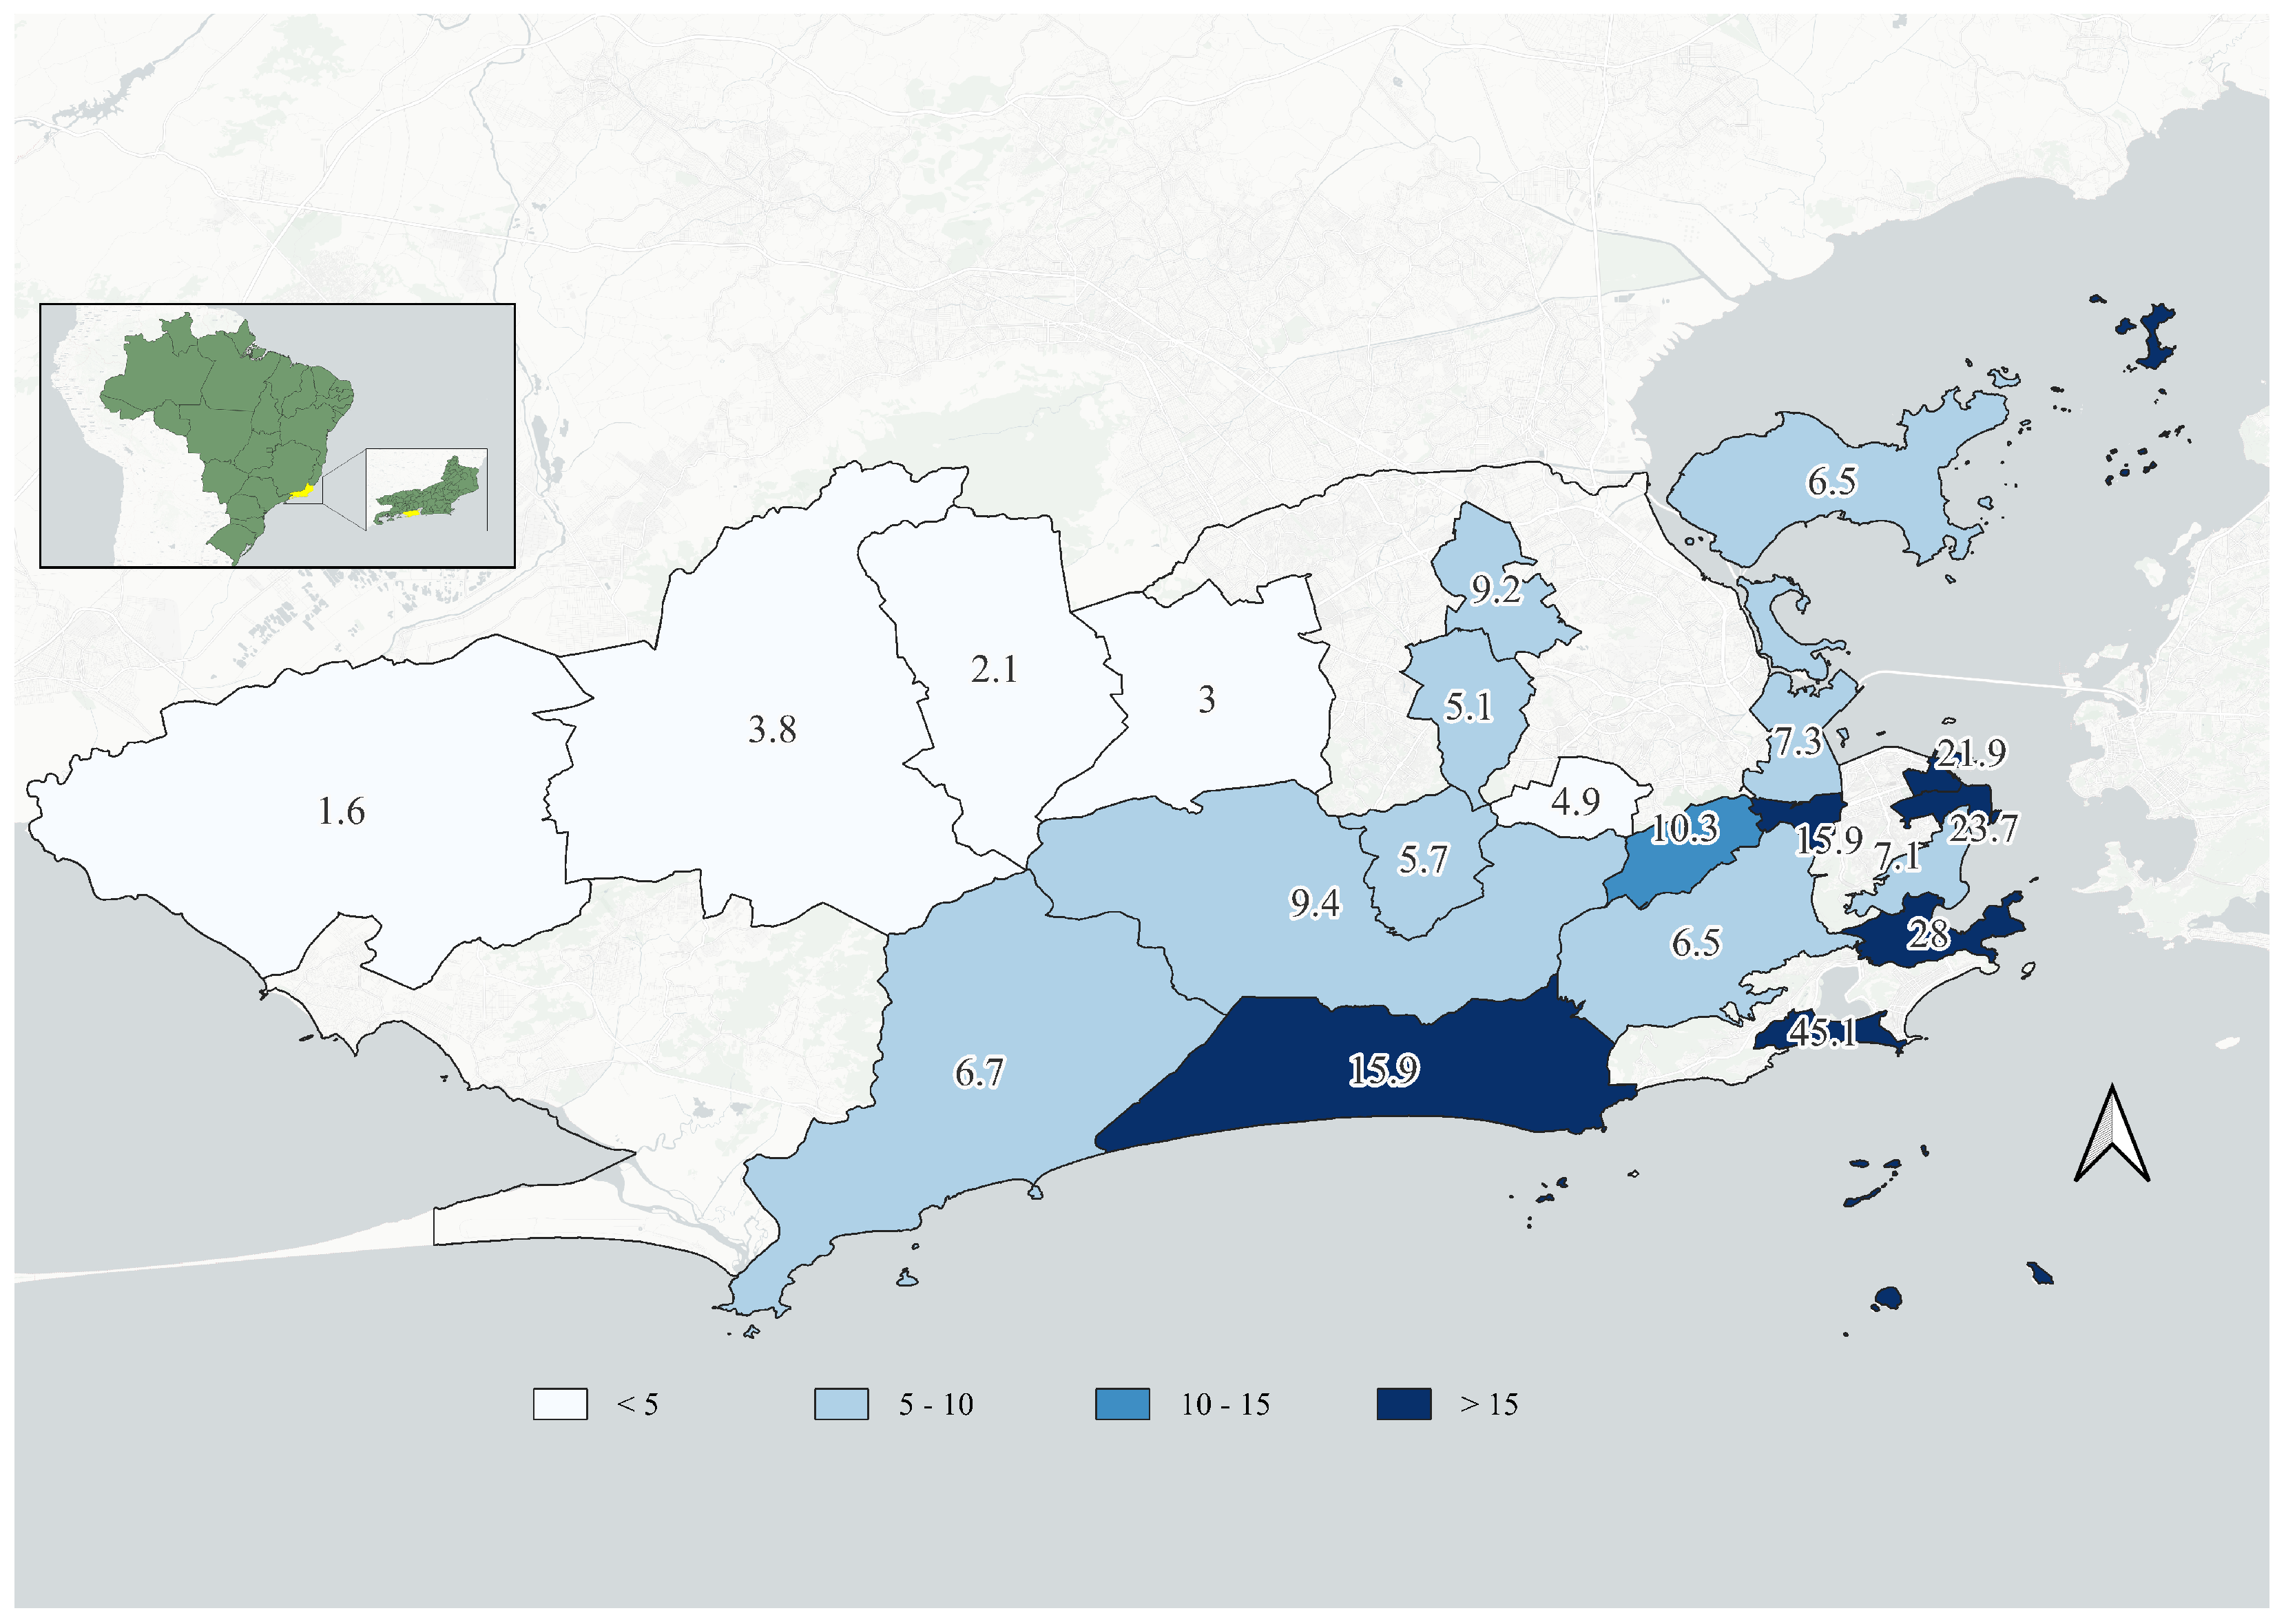
Figure 6 shows that the highest annual victim rates are concentrated in the Centro and Zona Sul regions of the city, with the CISP at Point 6 (Zona Sul) standing out with the highest rate, at 227 victims per 100 km of road. This scenario may be related not only to the high population density in these areas but also to the intense travel attraction throughout the day, due to the greater availability of commerce and services.
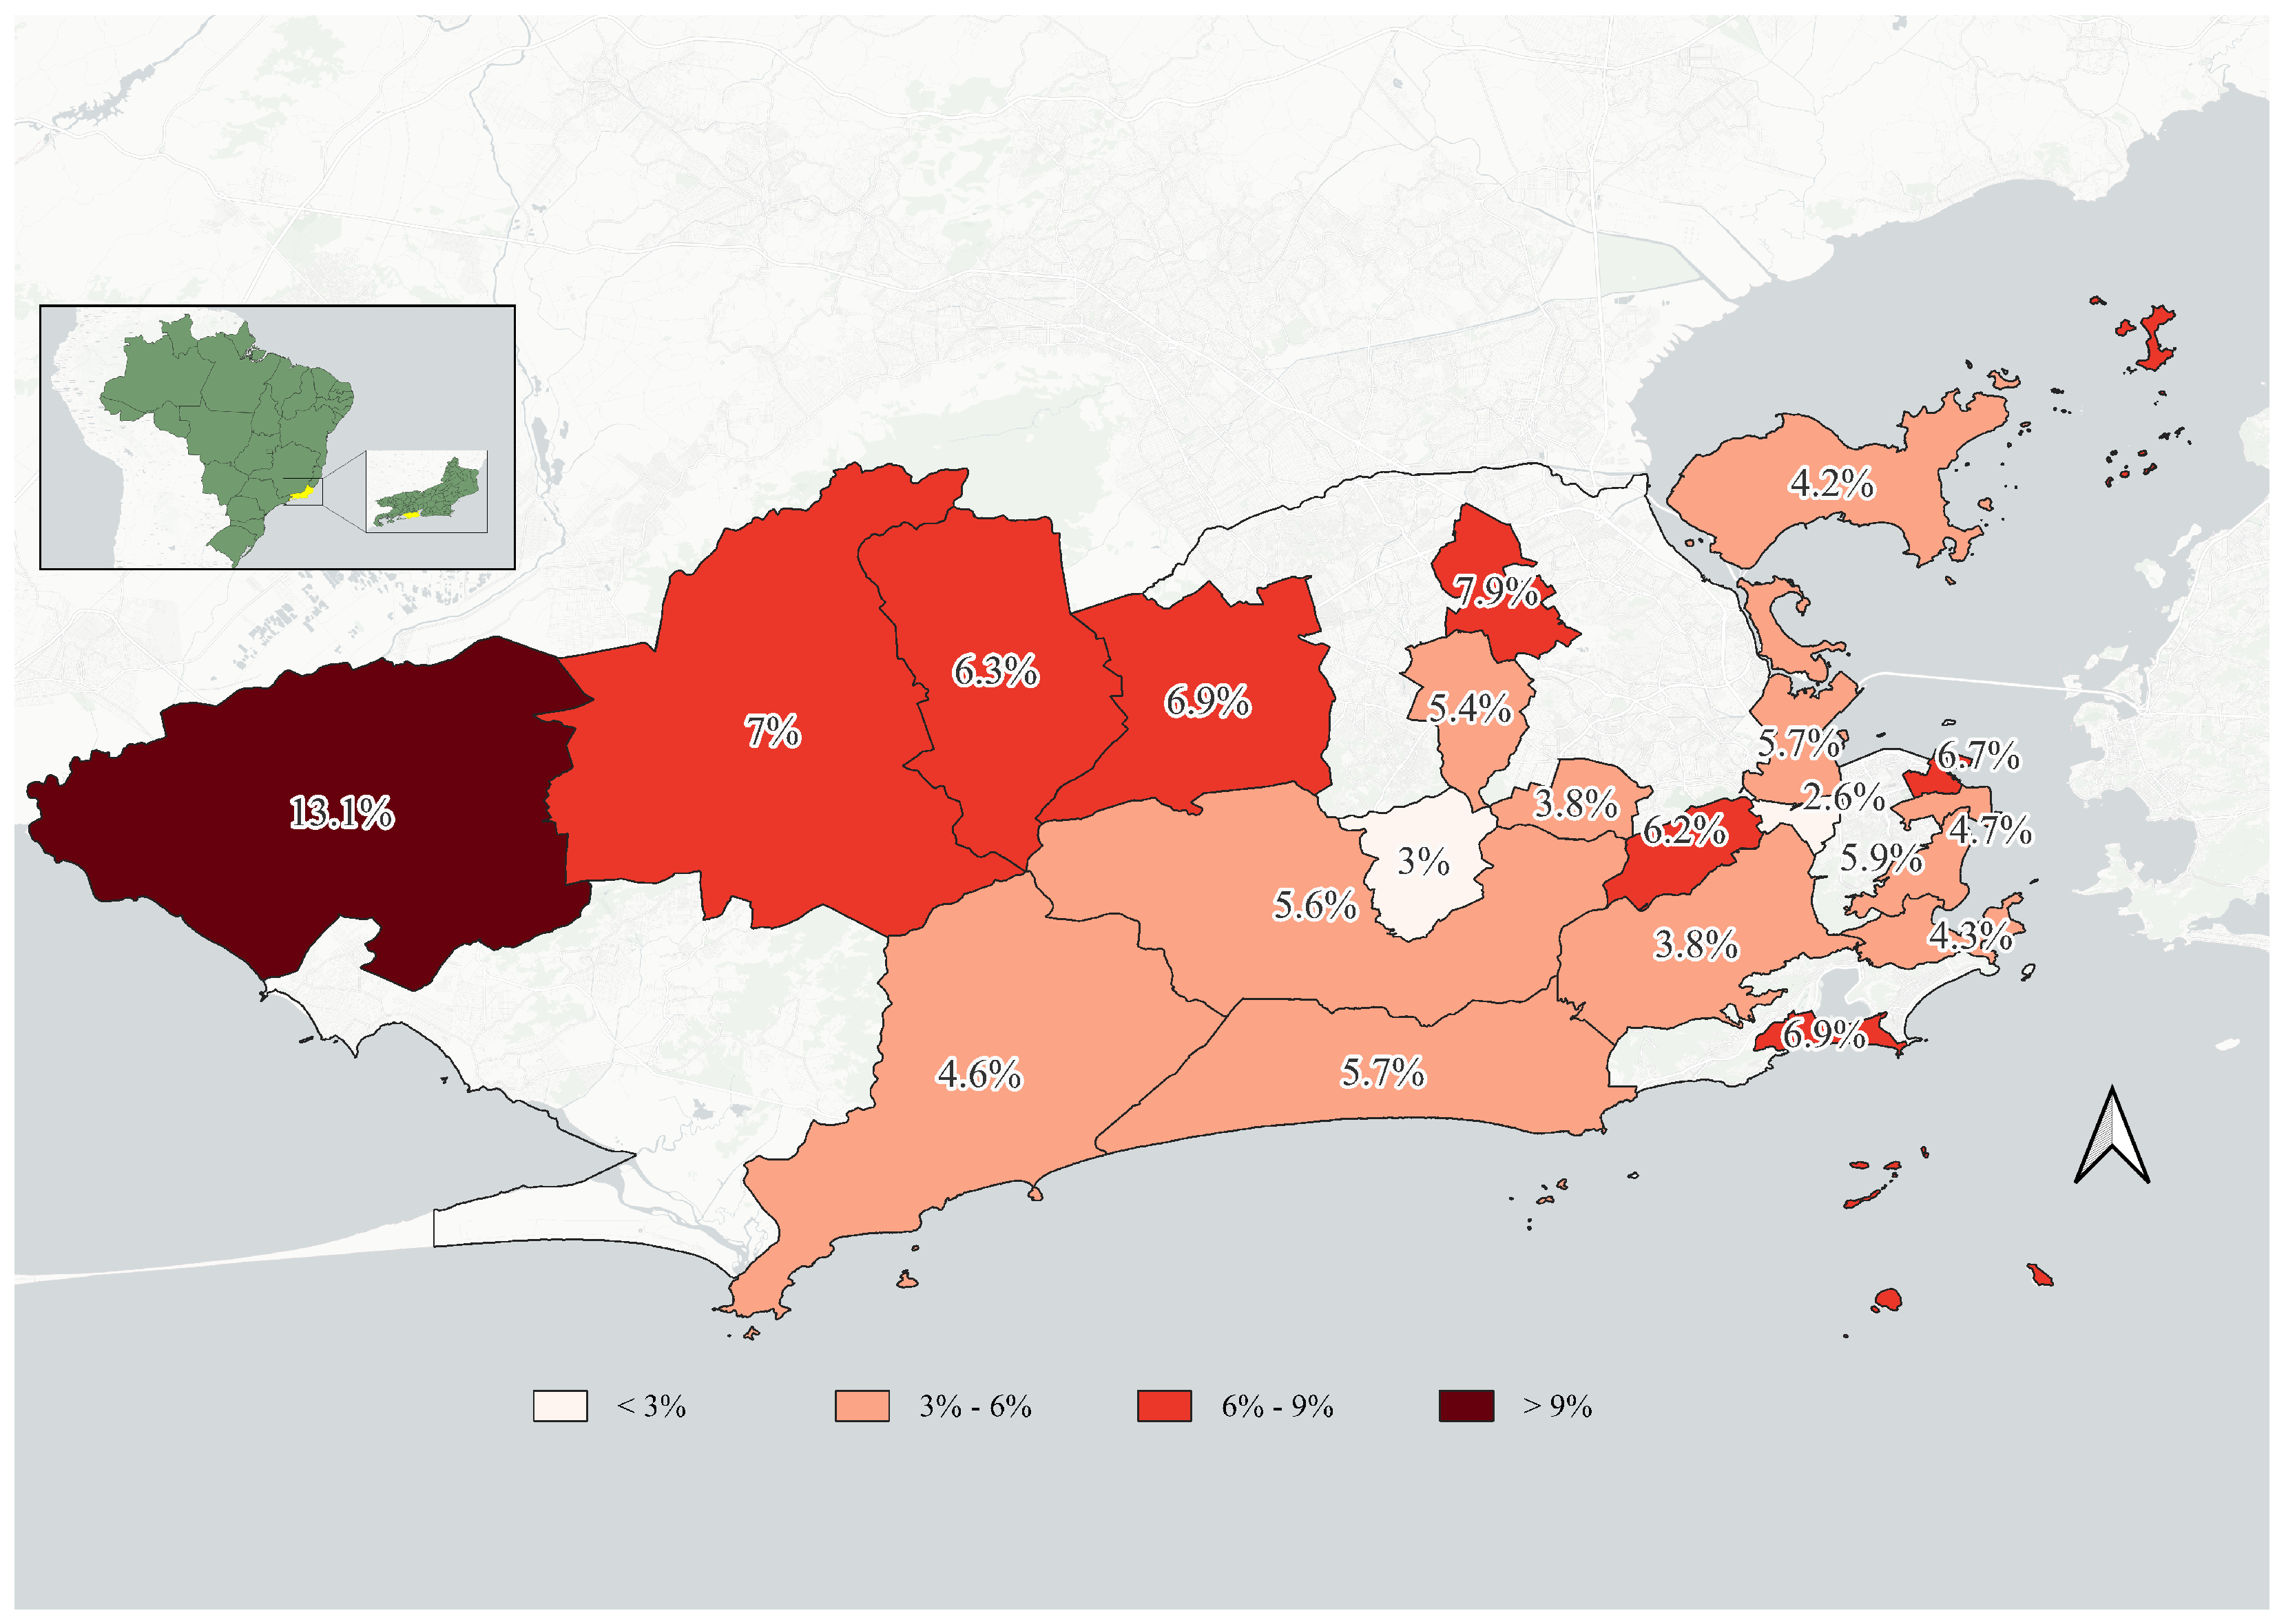
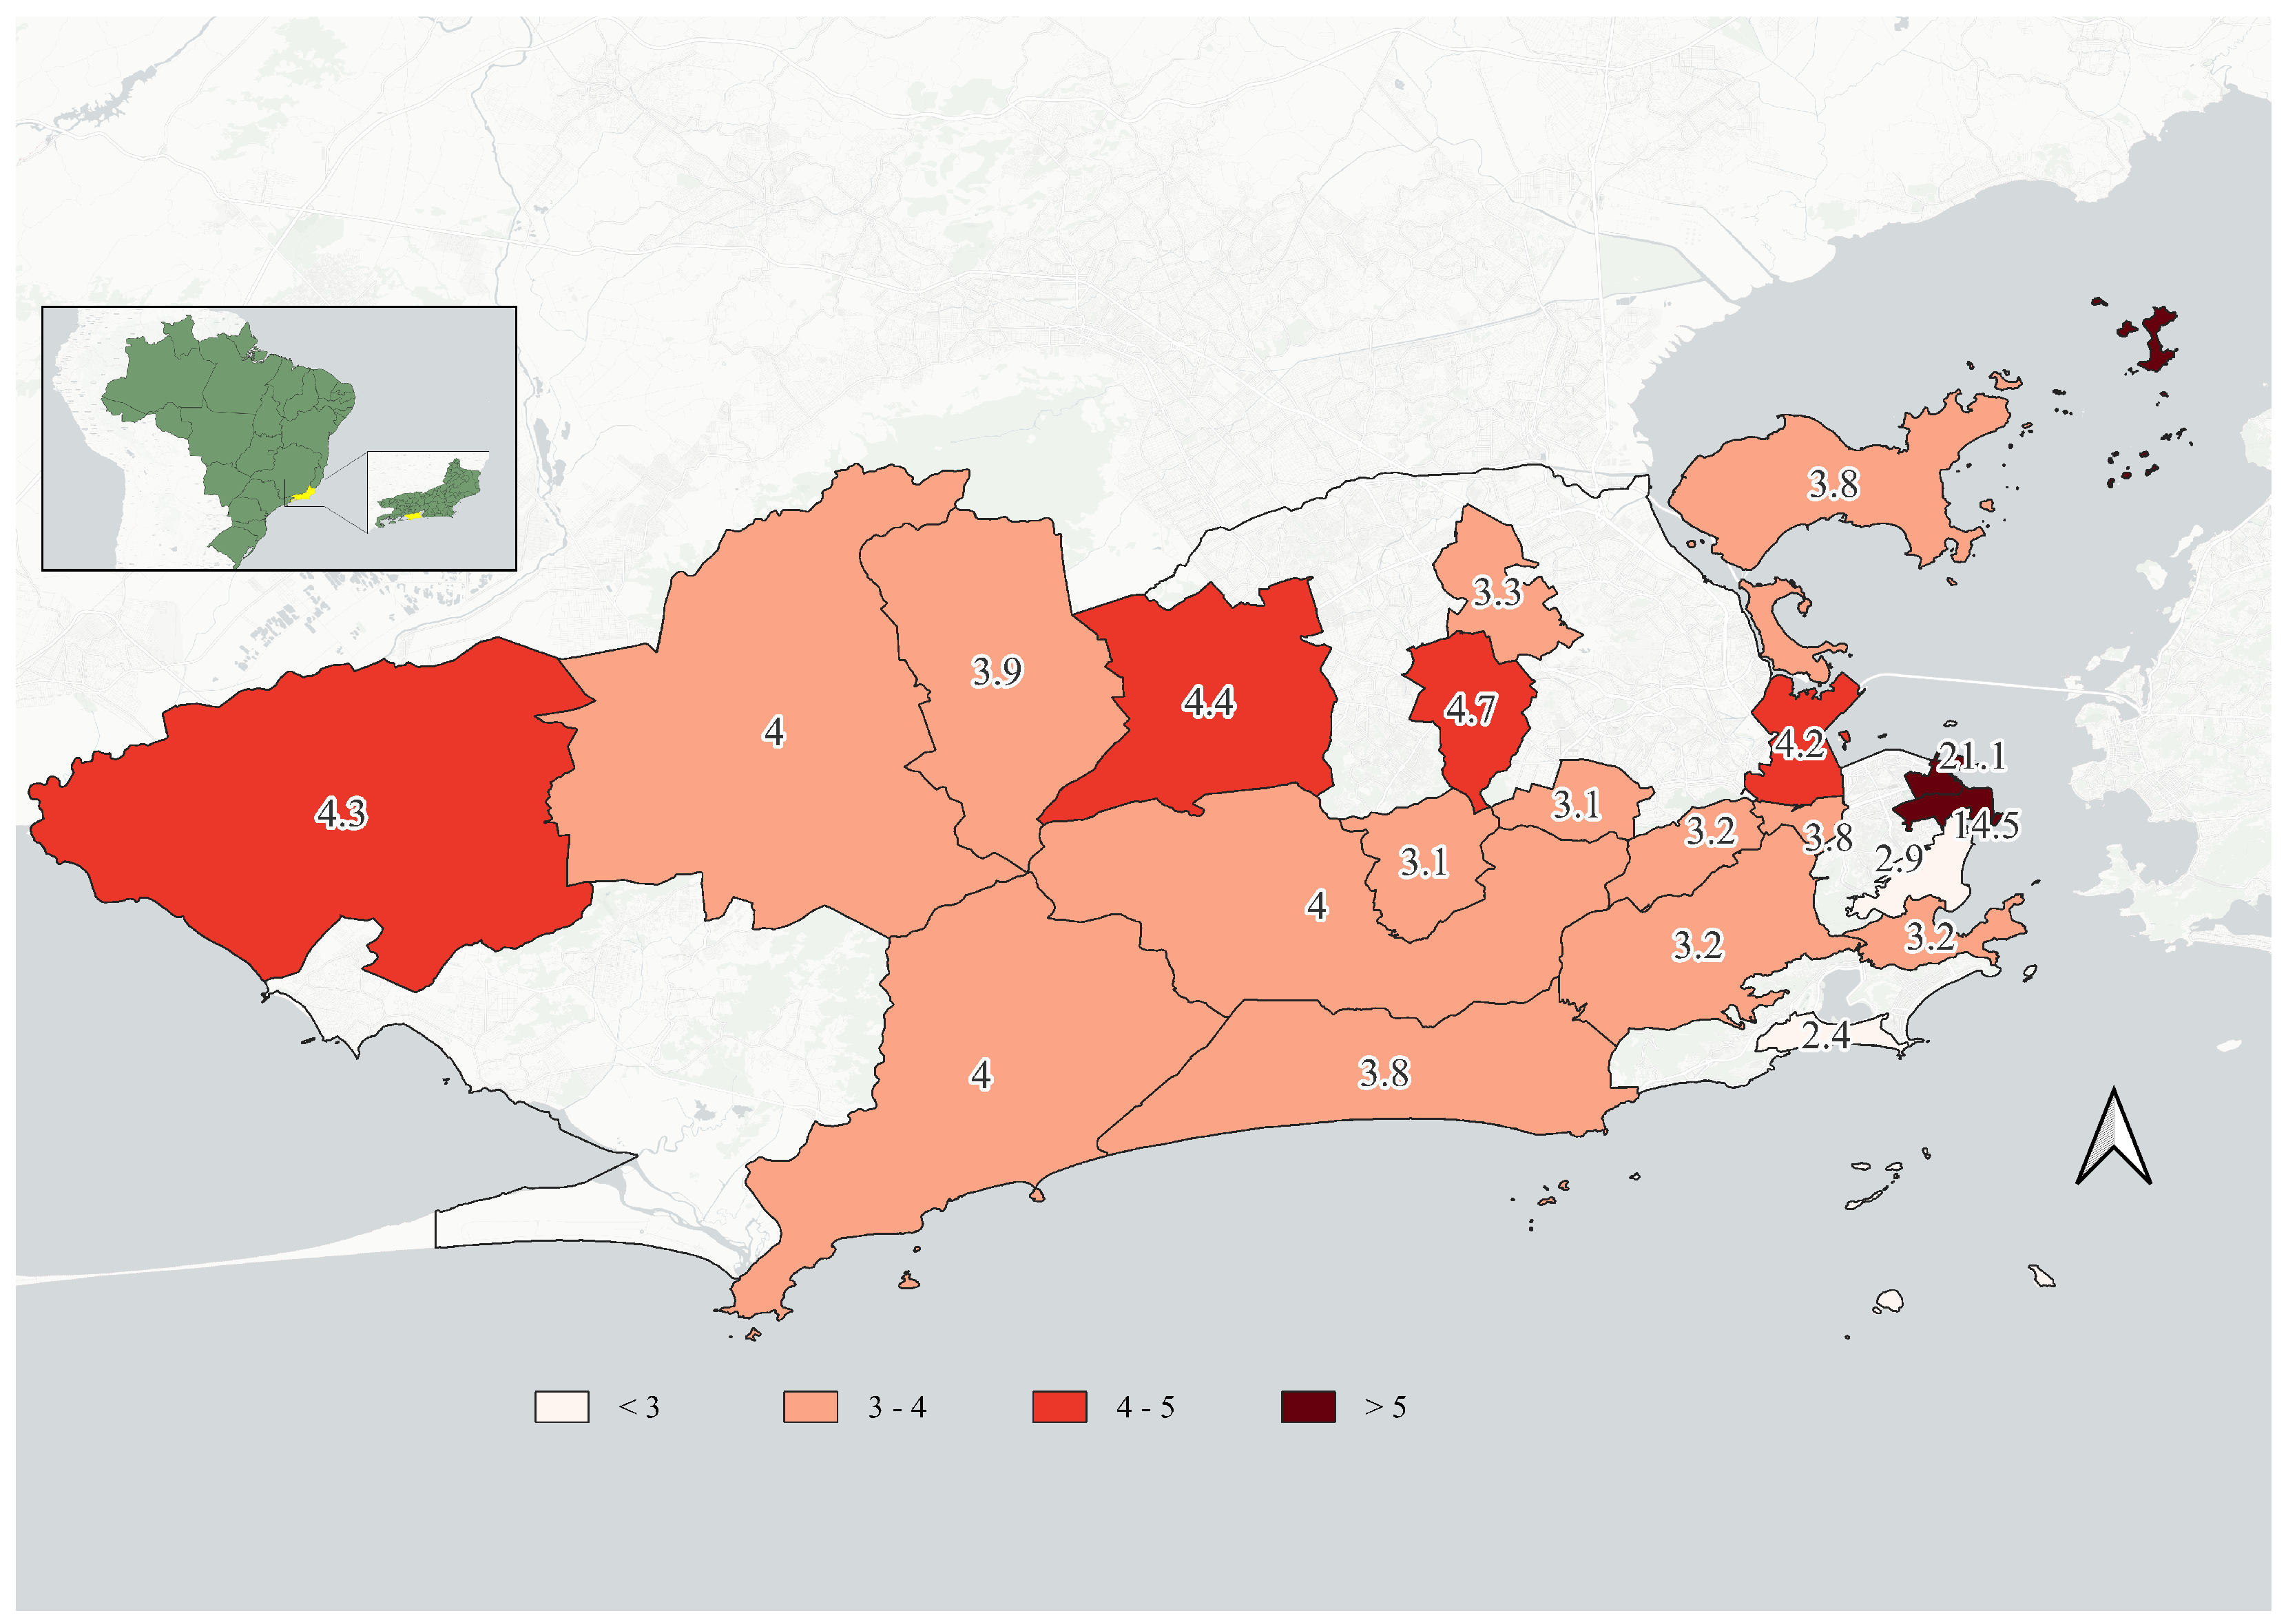
Figure 7, which presents the fatality rates, indicates higher lethality in the Zona Oeste and Grande Bangu regions, especially at Point 21, where the rate reaches 13.1%. This pattern follows the trend observed in the low use of safety equipment.
This overview highlights the complexity of traffic incident dynamics in the city of Rio de Janeiro, showing that areas with higher population density and intense travel flow have a greater absolute number of victims, while regions with lower use of safety equipment tend to record more severe crashes. These results reinforce the importance of differentiated prevention and enforcement strategies that consider the specific characteristics of each region to reduce both the occurrence and the severity of crashes.
The density of traffic enforcement cameras was calculated considering the number of locations with speed control, red-light running, and exclusive lane infringement. These values were divided by the length of the road network, resulting in a rate of devices per 100 km of road. In
Figure 8, areas 2, 3, 5, 6, 7, and 10 stand out in dark blue, where the higher density can be explained by the presence of exclusive bus lanes and BRT corridors, which require extensive monitoring to prevent incidents involving public transportation.
These data are used as independent variables in the models that relate the occurrence of victims and the fatality of incidents.
Data on crimes classified as violent were obtained from the Public Security Institute [
37] for the period from 2020 to 2024, the same interval used for the history of traffic injuries and fatalities. Based on these records, the annual average number of occurrences in each area was calculated. The data were then related to the resident population in the same regions, according to the 2022 Census [
30], resulting in a per capita violent crime rate per thousand inhabitants.
Figure 9 shows the territorial distribution of these rates. It can be observed that two observation points located in the city center (OPs 2 and 3) recorded the highest per capita crime rates. This result can be explained by the socioeconomic dynamics of the Centro area, which, despite having a low resident population density, concentrates a large flow of people during the day due to the availability of jobs, services, and commerce. At night, with the reduction in movement, the region becomes more susceptible to the occurrence of crimes.
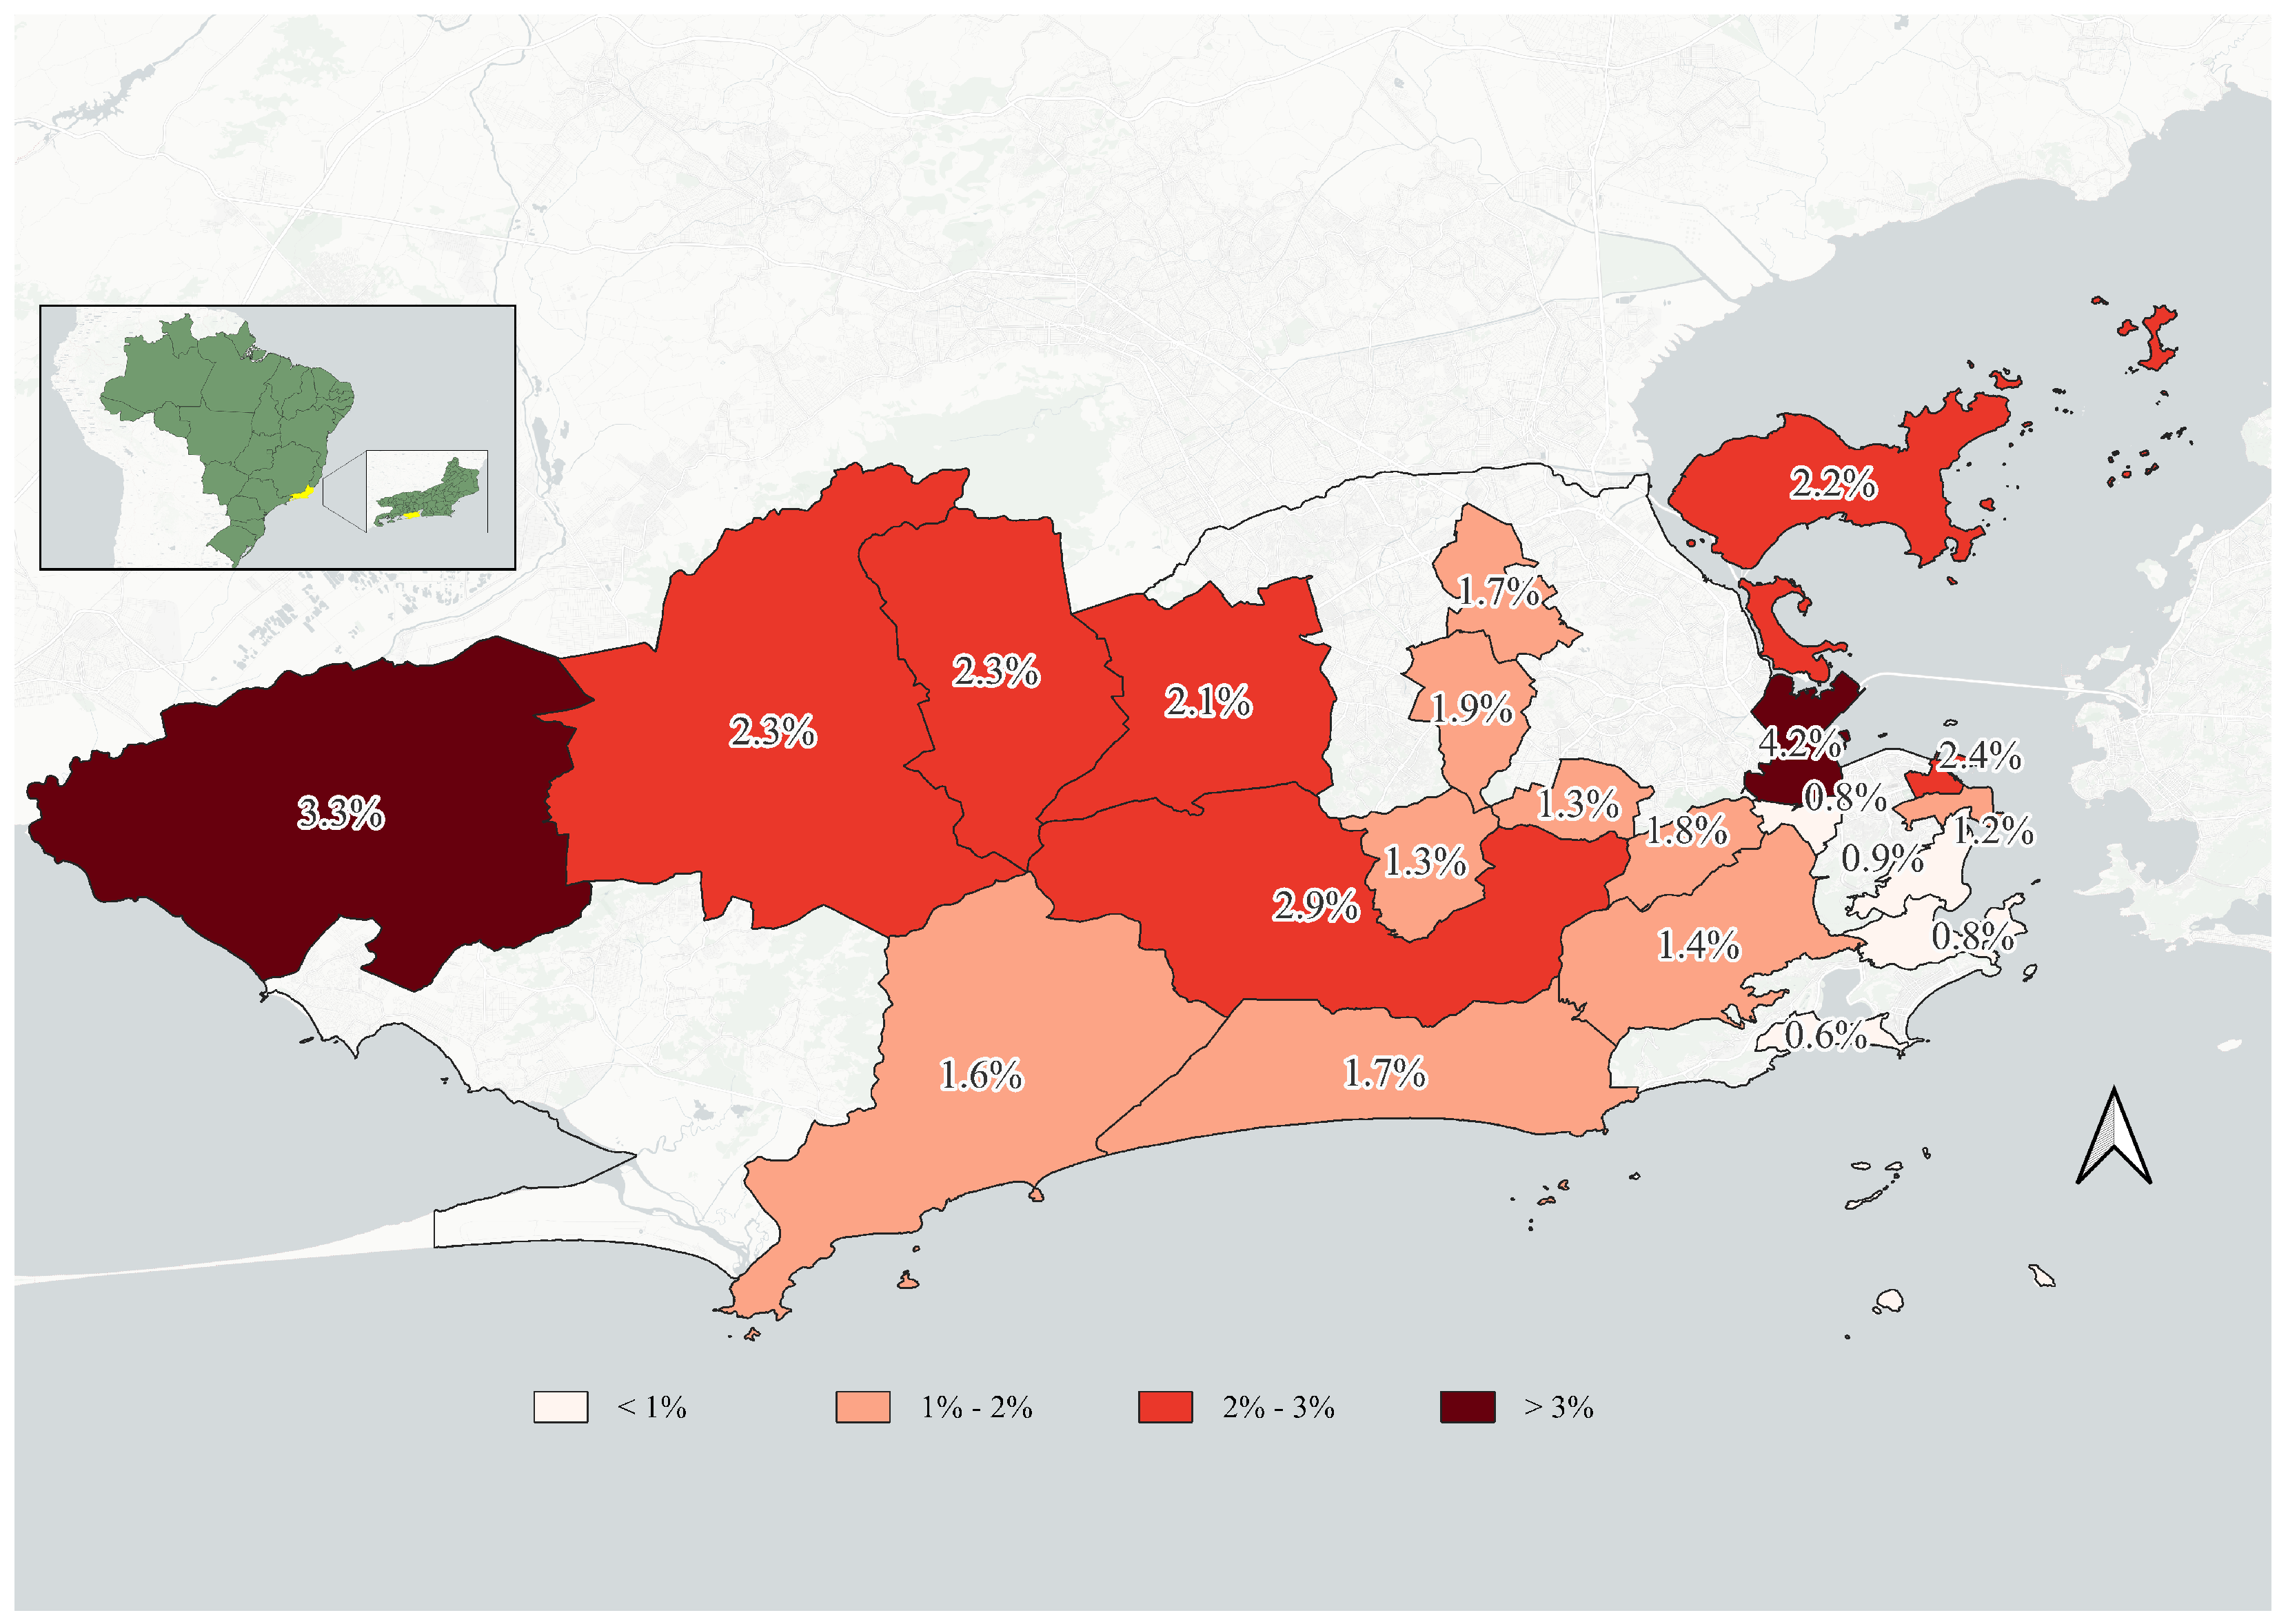
In the total area covered by the study, which includes approximately 3.4 million people over fifteen years old, just over 71,000 reported being unable to read and write, resulting in an average illiteracy rate of 2.1%. The highest incidence was recorded in Centro (OP 1), with a rate of 4.2%, while the lowest rate was observed in Zona Sul (OP 5), at 0.6%.
The spatial distribution of these rates is illustrated in
Figure 10. Areas shown in darker colors indicate higher percentages of the illiterate population, particularly toward Zona Oeste and parts of the central area. Although illiterate people cannot legally obtain a driver’s license, their presence in traffic, even irregularly, may have impacts on road safety.
Furthermore, limitations in access to education may compromise the understanding of educational messages and crash-prevention campaigns, indirectly influencing the occurrence and severity of recorded events.
It is important to note that, regarding Point 21, this area presents low population density and extensive green areas, which likely explain the lower rate of traffic victims per 100 km. However, the region is also more prone to crashes with higher severity. In contrast, the southeastern areas of the municipality are densely populated and concentrate major employment zones. These areas show a strong presence of traffic enforcement, which may contribute to greater compliance with traffic laws, although they also experience high vehicular flows.
4.3. Statistical Models
This subsection presents the results obtained from the statistical models of traffic crash occurrence and severity. Each set of models was built using different combinations of independent variables, as previously discussed in the methodological sections. The data used in the analyses were organized by observation point and are consolidated in
Table 3, covering all variables considered in both sets of models.
The following subsections present a detailed analysis of the results obtained, organized according to the two groups of models. In each case, the statistical performance of the variables used and their possible implications in the context of urban road safety are discussed.
4.3.1. Traffic Victim Occurrence Model
For this model, four independent variables were selected: the driver distraction rate (DI), the traffic enforcement cameras density (TE), the violent crimes per capta (VC), and the illiteracy rate of the population over 15 years old (IL). Based on these variables, fifteen linear regression models were developed, covering different combinations, ranging from individual models to models including all four variables. Four models were constructed with single variables, ten with combinations of two or three variables, and a final model included all the considered independent variables.
Using the data analysis tools in Microsoft Excel, the degree of association between the variables was initially examined through the
correlation function, which calculates the Pearson coefficient for each pair of variables. As shown in
Table 4, the closer the absolute value is to one, the stronger the association between the variables. It is observed that DI and VC had low correlation values with the dependent variable TV, indicating that they may be weak predictors for the model. On the other hand, TE and IL resulted in absolute values close to 0.5 and may be statistically more significant variables to explain the occurrence of traffic incidents. However, the negative correlation of IL indicates an inverse relationship with the victim rate, which contradicts the initial hypothesis that lower education levels would be associated with a higher occurrence of incidents.
The analysis of collinearity among the independent variables revealed the highest correlation between DI and TE (r = 0.574), which, although high, is still insufficient to indicate redundancy between these variables.
These hypotheses were confirmed through the application of simple linear regressions, resulting in Models 1.1 to 1.4, whose results are presented in
Table 5. The coefficient of determination (R
2) indicates the degree to which the dependent variable is explained by the model, while the
p-value assesses the statistical significance of the variable.
The closer the value is to one, the better the dependent variable is explained. This means that Model 1.1 can explain about 1.8% of the annual victim rates per 100 km of roads in the studied regions. On the other hand, the illiteracy rate in Model 1.4 explains 27.8% of the cases. The p-value is considered adequate when it is below 0.05, indicating statistical significance at the 5% level and allowing the rejection of the null hypothesis. Only Models 1.2 and 1.4 presented variables with p-values below this threshold. However, given the low correlation coefficients and modest values, these results should be interpreted as indicating weak statistical associations rather than strong explanatory relationships.
The statistical parameters of the linear regressions (adjusted R
2 and
p-value) for combinatorial Models 1.5 to 1.15 are summarized in
Table 6. It is observed that none of these models resulted in an adjusted R
2 higher than that of Model 1.4. Furthermore, no model was statistically significant, as none had
p-values below 0.05 for all variables.
Based on the data collected in this study, Model 1.4 showed comparatively higher explanatory capacity regarding the occurrence of traffic victims in relation to the road network length, within the exploratory nature of the analysis. However, the estimated coefficient for the variable IL in the linear regression was negative (−33), indicating that an increase in the population that cannot read or write is associated with a reduction in the victim rate per kilometer. This result contradicts the initial hypothesis, which assumed that a lower level of education would lead to an increase in incidents, thus invalidating this analysis.
The second model with the best statistical parameters was Model 1.2, which considers the density of traffic enforcement points as the sole variable. Its R
2 indicates that 18.9% of the variation in victim rates per kilometer can be explained by this variable, with a
p-value slightly below 0.05. However, the positive correlation presented in
Table 4 also contradicts the hypothesis that more monitored roads have fewer crashes. This result may be related to a higher concentration of monitoring in areas with greater vehicle volume, which in turn increases traffic conflicts, or to the installation of monitoring precisely at critical points.
The mathematical formulation of the model is given by Equation (
2), where:
is the annual number of traffic victims per one hundred kilometers of road; and
is the traffic enforcement cameras density per one hundred kilometers of road network.
Traffic crashes result from multiple risk factors of diverse nature, which can interact in combination with varying intensities. Therefore, the low correlation observed among the variables used in Models 1.1 to 1.8 is consistent with the multi-causality of crashes, reinforcing the argument that identifying patterns capable of explaining all events is not trivial.
4.3.2. Fatal Victims Model
For this model, four independent variables were selected: the seatbelt non-use rate (SB), the helmet non-use rate (HE), the density of traffic enforcement cameras (TE), and the illiteracy rate of the population over 15 years old (IL). Based on these variables, fifteen linear regression models were developed, covering different combinations, from individual models to models including all four variables. Four models were built with single variables: one model combined the variables related to safety equipment (no seatbelt and no helmet), two additional models successively added the monitoring and illiteracy variables, and the final model included all considered independent variables.
Table 7 presents the results of the correlation analysis among the considered variables. It can be observed that the fatality rate (FR) has the weakest association with TE, this being the correlation coefficient with an absolute value closest to zero. On the other hand, the correlation of 0.60562 between FR and the variable HE indicates that the latter tends to provide the best statistical parameters in the tested linear regressions. It is also noteworthy that there is high collinearity between the independent variables SB and HE, whose correlation coefficient is 0.77284. Although less than one, this value suggests that both variables may contribute similarly to the explanations provided by the generated models.
The hypotheses formulated based on the presented results are confirmed through the application of individual linear regressions, which gave rise to Models 2.1 to 2.4. As shown in
Table 8, the lowest R
2 value was obtained for the variable TE (0.012), while the highest was associated with the variable HE (0.367). This indicates that, individually, the density of enforcement points explains about 1.2% of the fatality rates in the analyzed regions, whereas the helmet non-use rate can explain 36.7% of the cases. Among the four tested variables, only TE did not show statistical significance when used alone in the linear regression, with a
p-value of 0.643.
The statistical parameters (adjusted R
2 and
p-value) of the linear regressions for the eleven combinatorial models (Models 2.5 to 2.15) are presented in
Table 9. It can be observed that Models 2.8, 2.9, 2.14, and 2.15 showed adjusted R
2 values higher than the R
2 of 0.367 for Model 2.2, which considers only the variable HE. However, only in Model 2.14 did all independent variables (HE, TE, and IL) achieve
p-values below 0.05.
Based on the data collected in this study, the model with the best statistical parameters for explaining traffic fatality in the city of Rio de Janeiro is Model 2.14. In this model, the independent variables are the rate of motorcycle occupants without helmets, the density of traffic enforcement cameras in the road network, and the illiteracy rate of the population. Its mathematical formulation is given in Equation (
3), where:
is the traffic fatality rate;
is the rate of passengers without helmets (percentage);
is the density of traffic enforcement cameras per one hundred kilometers of the road network; and
is the illiteracy rate of the population over fifteen years old (percentage).
Compared to the models proposed to evaluate the occurrence of traffic crashes with victims, the correlation of risk factors used to explain the fatality of these events showed better statistical parameters. While Model 1.4 obtained an R2 of 0.278, the adjusted R2 for Model 2.14 was 0.505. This higher significance may be related to the smaller set of risk factors that affect injury severity and deaths on the roads, which reduces the number of possible combinations of causes and simplifies the analysis.
These findings are consistent with the literature that emphasizes the multicausal nature of traffic crashes and the influence of unobserved heterogeneity in aggregated analyses [
9,
14]. The absence of a positive association between illiteracy and crash occurrence suggests that educational level alone does not directly translate into higher exposure to traffic risk. In the literature, Assailly [
12] shows that road safety education may yield positive outcomes when it goes beyond information delivery and effectively develops psychosocial competencies. Similarly, the positive relationship between victim occurrence and enforcement density likely reflects the reactive placement of traffic control devices in historically high-risk locations, rather than a causal increase in crash occurrence due to enforcement itself. As discussed by Lord and Manneringv [
38], safety-related explanatory variables may be endogenous, since their presence is often a response to past crash occurrence rather than an exogenous determinant of crash risk. The fatality model aligns closely with previous studies by demonstrating the dominant role of helmet non-use in explaining traffic-related deaths [
10,
15,
24]. Therefore, our study aligns with the literature by demonstrating how the interaction of behavioral, educational, and enforcement factors can inform targeted road safety interventions, providing evidence to support more effective municipal policies.
6. Conclusions
Due to the lack of detailed information on traffic crashes in the city of Rio de Janeiro, this study aimed to establish correlations between the occurrence and severity of victims and the risk factors observed at strategic points in the municipality. To this end, two models were proposed. The first focused on the occurrence of traffic events with victims, based on variables such as the use of distraction items, the density of traffic enforcement cameras, violent crime rates, and literacy rates. The second focused on explaining the fatality rate of victims based on the non-use of seatbelts, the non-use of helmets, the density of traffic enforcement cameras, and the illiteracy rate.
The collected sample revealed low adherence to seatbelt use, especially among rear-seat passengers. Helmet use among motorcycle riders was significantly higher, although in many cases it was not properly worn. Distracted driving behaviors were also observed, such as using a cell phone, smoking, and consuming food or beverages, among both drivers and motorcyclists. Differences in the use of protective equipment and the occurrence of distractions across the studied territory may be related to socioeconomic factors, regional habits, lack of enforcement, and even public safety issues.
The results of the first model indicated that the negative correlation between illiteracy and the number of victims invalidates the hypothesis that an increase in the illiterate population is associated with more crashes. In addition, the positive relationship between victim occurrence and the presence of traffic enforcement cameras contradicts the expectation that areas with greater control would register fewer occurrences, suggesting a possible concentration of these devices in locations with a history of high crash rates. This supports the idea that traffic crashes occur due to multiple factors.
The second model, on the other hand, demonstrated greater robustness, concluding that helmet non-use, the density of traffic enforcement cameras, and illiteracy together explain a significant portion of the variation in the fatality rate. Although seatbelt use is relevant, automobile occupants have additional layers of protection, which may explain its lower influence on fatal cases.
It is recommended that future research explore different modeling methods, in line with approaches found in the literature, applying the same variables analyzed here. Machine learning techniques can be tested as an alternative to assess potential variations in results and improve the predictive capability of the models. Furthermore, it is essential to seek new sources of data that allow for a more accurate characterization of the traffic context, including information on vehicle and pedestrian flow, population density, and records of traffic violations. Given the lack of detailed information on crashes, these additional data would complement existing records rather than replace them. This information allows risk factors to be inferred through alternative means, supporting evidence-based public policies.




 ,
,