Article

Reducing Data Uncertainties: Fuzzy Real-Time Safety Level Methodology for Socio-Technical Systems

by
Apostolos Zeleskidis
*,
Stavroula Charalampidou
and
Ioannis M. Dokas
Department of Civil Engineering, Democritus University of Thrace, 67100 Xanthi, Greece
*
Author to whom correspondence should be addressed.
Safety 2024, 10(4), 85; https://doi.org/10.3390/safety10040085
Submission received: 15 July 2024 / Revised: 18 September 2024 / Accepted: 24 September 2024 / Published: 30 September 2024

Abstract

:
This paper presents the fuzzy real-time safety level (Fuzzy RealTSL) methodology. It aims to address the data uncertainties resulting from a lack of sensors in complex sociotechnical systems and reduce the need for the determination of their safety level in real-time during their operation. To achieve this, the methodology utilizes: (1) safety constraints from STPA (systems theoretic process analysis) analysis and EWaSAP (early-warning-signs analysis process), (2) fuzzy logic as the mathematical backbone to identify the degree of confidence about the occurrence of unsafe system states, (3) a modified centroid point and spread ordering to enable ordering sequences of unsafe system states that can lead to accidents according to how detrimental they are to the system safety. The RealTSL methodology is presented through its step-by-step application to the panel alignment system of a solar park utilizing rotating solar arrays. This paper aims to open a new perspective on the STAMP literature for discussions of uncertainties from a lack of information about the system’s state and to make it easier to measure its safety level. Knowing the safety level of a system in real-time is crucial for the systems in question as it enables proactive risk management and enhances decision-making by providing immediate insights into potential hazards, thus safeguarding against accidents.

1. Introduction

Despite advancements in understanding organizational safety and safety dynamics, current risk assessment and safety monitoring methods in high-risk industries are still considered inadequate. Recent accidents highlight the limitations of the existing approaches, underscoring the need for new strategies to predict better and prevent future incidents. Specifically, the authors of [1] call for a method that can accurately measure the real-time safety level of a system within its specific context, as current methods do not effectively capture or respond to the warning signs that precede major accidents. Introducing the capability of knowing what the safety level of a system is during its operation is crucial for any industry operating complex systems as it can enable proactive risk management, ensure operational stability and enhance decision-making in terms of safety by providing immediate insight into potential hazards and future accidents. More recently, [2] identified the need for such analyses in the case of dynamic risk because “Dynamic environments are uncertain and their aspects are varied, not only in their intrinsic parameters but also in how those aspects are affected by externally unpredictable factors. It is worth noting that the uncertainty of an environment can present both risk and opportunity for developing systems and drive the performance of the embedded processes to provide products and services at higher rates and diversities”.
In an attempt to address this need, [3] introduced the RealTSL (real-time safety level) methodology to calculate the safety level of safety-critical sociotechnical systems in real time. This methodology utilizes the outputs of STPA (systems theoretic process analysis) [4] and EWaSAP (early-warning-signs analysis process) [5] analysis as well as system data and inputs from experts to provide an assessment for which sequences of transitions between system states can lead to losses in the system, how long until the losses are actualized, and which ones are the worst in terms of safety.
To calculate the safety level of a system using RealTSL requires sensor data for every unsafe system state and unsafe control action identified by the STPA analysis. Thus, one major limitation of the RealTSL methodology is that all the sensors for all unsafe system states need to be present in order to calculate the safety level. Collecting all the data needed for the safety level calculations is not possible in most systems. In certain cases, it is impossible to have all these sensors in place either due to budgetary reasons, data protection, privacy reasons, or the nature of the information (for example, if an operator is actively monitoring the perimeter they are assigned to). In essence, RealTSL needs to be enhanced in order to be able to assess the safety level with uncertain and occasionally incomplete real-time data about the operation of the system.
This manuscript incorporates the information uncertainties of complex systems by implementing fuzzy logic in the RealTSL methodology. Fuzzy logic is used in order to increase the applicability of the methodology (RealTSL) in systems where it is not possible or is impractical to have sensory information about every potential unsafe system state the system could be in during its operation. Triangular fuzzy numbers are used to represent the estimated time remaining until an accident can be caused by a sequence of unsafe system states incorporating the degree of confidence toward the sensory information that is available about those unsafe system states. Then an ordering of fuzzy numbers is used to determine the most detrimental to the safety sequence of unsafe system states.
This new fuzzy RealTSL is presented through its use in an automated solar park system that rotates its photovoltaic panels to follow the sun’s trajectory in the sky.

2. Related Work

Data uncertainties are regularly encountered in the case of hazard analyses and the question of managing safety at acceptable levels. These uncertainties take the form of lacking information about how the system will behave in certain situations or how it operates. According to [6], to identify uncertainties, it is helpful to define individual uncertainty types. They classify uncertainty using two independent classifiers, identifying its appearance and effect. “The first classifier captures the effect of the uncertainty on the system at its core. It distinguishes between stochastic uncertainty, incertitude, and ignorance. There exists a 3 × 3 matrix (see Figure 1) of the classifications of uncertainties depending on the effect, quantification of uncertainty, and system design”. These uncertainties are more common when studying novel and complex systems that are being developed or have existed for a short period of time.
The literature on addressing uncertainties in STAMP-based methods and tools is presented in the following paragraph. Two research teams [7,8] worked on using fuzzy logic, which is a mathematical foundation used to model uncertainties, model expert opinions, and to produce quantifiable metrics for STPA (model uncertainty Figure 1). The authors of [9] used fuzzy inference to model the control algorithm of the controller on a dam overflow system (model uncertainty Figure 1); [10] used TOPSIS fuzzy methods to determine the importance of UCAs by quantifying the opinions of system experts (model uncertainty, incertitude Figure 1); [11] used fuzzy Bayesian Networks in combination with STPA to identify risk factors quantitatively in a fire-fighting system (data uncertainty, Figure 1); [12] used fuzzy linguistic variables to quantify the degree to which safety requirements identified by STPA are met and then calculate a fuzzy version of the RiskSOAP situational awareness indicator (data uncertainty and model uncertainty, Figure 1). The research works presented above are shown in Figure 1 in relation to the type of uncertainties they address. Figure 1 also indicates the types of uncertainties that have not been covered in the STAMP literature. It can be concluded from the literature presented above that the data uncertainties and incertitude of systems studied with STAMP methods have yet to be addressed extensively. The approach presented in this paper is also mapped in Figure 1 in relation to the type of uncertainties covered. The fact that this work is the first in the STAMP literature to address data uncertainties is an indicator of its novelty.

3. Methods

3.1. STAMP/STPA

The systems theoretic process analysis (STPA) [4] has emerged as a comprehensive and systematic approach for conducting hazard analysis within complex systems. STPA extends the traditional hazard analysis approaches by incorporating a systems-thinking perspective. This methodology states that accidents and failures in complex sociotechnical systems are not the result of isolated component failures but often emerge from unsafe interactions between system components that have not failed. STPA offers insights into the systemic mechanisms contributing to hazards by addressing technical and organizational aspects. The systems theoretic process analysis (STPA) methodology involves the following steps:
The first step of STPA is defining the purpose of the analysis and the definition of losses and hazards for the system in study. In STPA, loss is defined as “something of value to stakeholders” and hazard as “a system state or set of conditions that, together with a particular set of worst-case environmental conditions, will lead to a loss”. After the identification of losses and hazards, the system-level constraints that “specified system conditions or behaviours that need to be satisfied to prevent hazards (and ultimately prevent losses)” are also identified.
The second step of STPA involves the creation of a control structure. According to Leveson, a control structure is “a system model composed of feedback control loops. An effective control structure will enforce constraints on the behaviour of the overall system”. The control structure is created using control loops, with the controller providing control actions to control different processes and requesting the necessary feedback to achieve that. In the control structure, all the essential parts of the system, such as control algorithms, their process models, actuators that enforce the control actions, and sensors that provide feedback are included.
In the third step of STPA, the unsafe control actions (UCAs) are identified. An unsafe control action (UCA) is “a control action that, in a particular context and worst-case environment, will lead to a hazard”. The purpose of this step is for the analyst to investigate the way in which the following may occur: 1. Not providing the control action, 2. Providing the control action, 3. Providing a potentially safe control action but too early, too late, or in the wrong order and 4. The control action lasts too long or is stopped too soon (for continuous control actions, not discrete ones), which can lead to a hazard.
The final step of STPA involves the identification of loss scenarios and, subsequently, generating the safety constraints. A loss scenario is defined as “a description of the causal factors that can lead to the unsafe control actions and to hazards”. The analyst must consider two categories of identification of the loss scenarios: (a) scenarios that lead to UCAs and (b) scenarios in which control actions are improperly executed or not executed. The loss scenarios can then be used to mitigate the occurrence of the UCAs, implement system changes, and design safer systems.

3.2. EWaSAP

Τhe early warning sign analysis based on STPA (EWaSAP) [4] is an analysis for identifying and incorporating early warning signs in sociotechnical systems and is based on the STAMP accident model. EWaSAP serves as an extension of the STPA hazard analysis. The main contributions of the EWaSAP extension are (1) the methodology aids in identifying the required sensors and their characteristics to enable system controllers to comprehend safety constraint violations and unsafe system state occurrences, and (2) determining the information that should be perceived by the sensors that are needed to produce early warning signs for potential accidents.
EWaSAP is structured around three steps. In the first step of the analysis, one identifies the external agents (e.g., emergency responders) essential for informing about hazardous events in the system. The second step focuses on identifying sensory systems (e.g., video surveillance, proximity monitoring) in neighboring systems, and determining signs of violations of the safety constraints derived by the STPA analysis conducted on the same system. This step further involves identifying surrounding systems with sensors capable of perceiving these signs, establishing synergy for transmitting the early warnings in alignment with the first step of EWaSAP.
The third step mirrors the second but centers on internal sensory systems. It entails identifying useful sensory systems (e.g., proximity, audio, visual monitoring) in the system itself, recognizing signs of safety constraint violations from the STPA analysis (e.g., losses, hazards, unsafe control actions, loss scenarios). Subsequently, the third step calls for identifying systems with sensors capable of perceiving these signs and establishing internal awareness actions. This includes specifying what must be monitored and the necessary sensor capabilities for controllers to perceive (1) signs indicating a safety constraint violation and (2) violations of assumptions from the system’s initial design. Finally, it defines how warning signs are created and transmitted, ensuring the correct perception by controllers. The controllers’ process model is updated to leverage these signs, either adapting or eliminating safety constraint violations or taking appropriate action against unwanted events.

3.3. Fuzzy Logic

Fuzzy logic has emerged as a powerful tool for handling uncertainty and imprecision in engineering systems. Unlike classical binary logic, which deals with crisp values of statements being true or false, fuzzy logic introduces the concept of partial truth, allowing for the representation and manipulation of vague or uncertain information. This paradigm shift has revolutionized engineering applications by enabling the modelling and control of complex systems that exhibit nonlinear and ambiguous behaviour. Fuzzy logic utilizes linguistic variables, fuzzy sets, and fuzzy rules to capture and process imprecise inputs, making it particularly suitable for decision-making and control tasks in real-world engineering problems. As stated in [13], “fuzzy systems are very useful in two general contexts: (1) in situations involving highly complex systems whose behaviours are not well understood and (2) in situations where an approximate but fast solution is warranted”. This section provides an overview of fuzzy logic, highlighting the fundamental principles that are used in this paper.
Fuzzy logic extends classical logic to include the law of contradiction. The law of contradiction states that contradictory statements cannot both be true at the same time e.g., A = B and A =/ B. The authors of [14] introduced the notion of fuzzy sets by proposing an extension of the truth of statements from {0,1} 0 = FALSE, 1 = TRUE to a degree of truth in [0,1]. To map the degree of truth of statements, membership functions are used.
Membership functions are a crucial component of fuzzy logic and are used to quantify the degree of membership or the extent to which an element belongs to a particular fuzzy set. In fuzzy logic, membership functions define the boundaries and shape of fuzzy sets, which represent linguistic terms or concepts, by mapping the input values to a degree of membership between 0 and 1, indicating the level of resemblance of an element to a specific fuzzy set. It assigns a membership grade or value to each element, reflecting the degree of truth of that element belonging to the fuzzy set. Membership functions can take various forms, such as triangular, trapezoidal, Gaussian, or sigmoidal shapes, often based on expert knowledge, data analysis, or domain-specific considerations depending on the nature of the fuzzy concept being represented. By utilizing membership functions, fuzzy logic allows for the representation and manipulation of vague or imprecise information. It enables reasoning and decision-making in situations where crisp boundaries or precise measurements are inadequate or difficult to define. Membership functions provide a flexible and intuitive framework for capturing and processing uncertainty and imprecision, allowing for more robust and human-like reasoning in various fields, including control systems, pattern recognition, optimization, and decision support systems.
When dealing with uncertainty, fuzzy logic offers several benefits compared to probabilistic approaches, such as the ones presented below:
  • Handling linguistic variables. Fuzzy logic allows for the representation and manipulation of linguistic variables, which are subjective and qualitative in nature. This enables experts to express and reason with imprecise concepts and knowledge that cannot be modelled effectively with probabilistic quantification.
  • Dealing with imprecision. Fuzzy logic provides a framework for managing imprecision and vagueness in data and knowledge. Instead of requiring precise numerical values, fuzzy logic assigns degrees of membership to fuzzy sets, accommodating gradual transitions and overlapping boundaries.
  • Robustness to noise and incomplete data. Fuzzy logic can effectively handle noisy or incomplete data by providing a smooth and flexible representation. It can accommodate uncertain or missing information, making it suitable for real-world applications where data may be limited or unreliable.
  • Intuitive reasoning. Fuzzy logic offers intuitive reasoning capabilities by allowing the use of linguistic rules and fuzzy inference. This makes it easier for humans to understand, interpret, and contribute to decision-making processes.
  • Integration with expert knowledge. Fuzzy logic allows for the incorporation of expert knowledge and heuristics into the system. Experts can contribute their domain expertise by defining fuzzy sets, membership functions, and rules, enhancing the system’s performance and adaptability.
Overall, fuzzy logic offers a flexible and intuitive approach to dealing with uncertainty, making it a valuable tool in various domains where imprecision, subjectivity, and nonlinear behavior are prevalent. Its ability to handle linguistic variables, imprecision, and complex systems provides distinct advantages over traditional probabilistic approaches.

4. RealTSL and Fuzzy RealTSL

4.1. RealTSL

The RealTSL (real-time safety level) methodology provides a real-time calculation of the safety level of sociotechnical systems during their operation. In RealTSL, a system’s safety level is defined as “the ordered set of the most detrimental to safety sequences of unsafe system states that result in an accident and are ordered according to the severity of their resulting accident” [2]. The RealTSL methodology follows the assumptions of the STAMP accident causation model [15], as presented in Section 3.1.
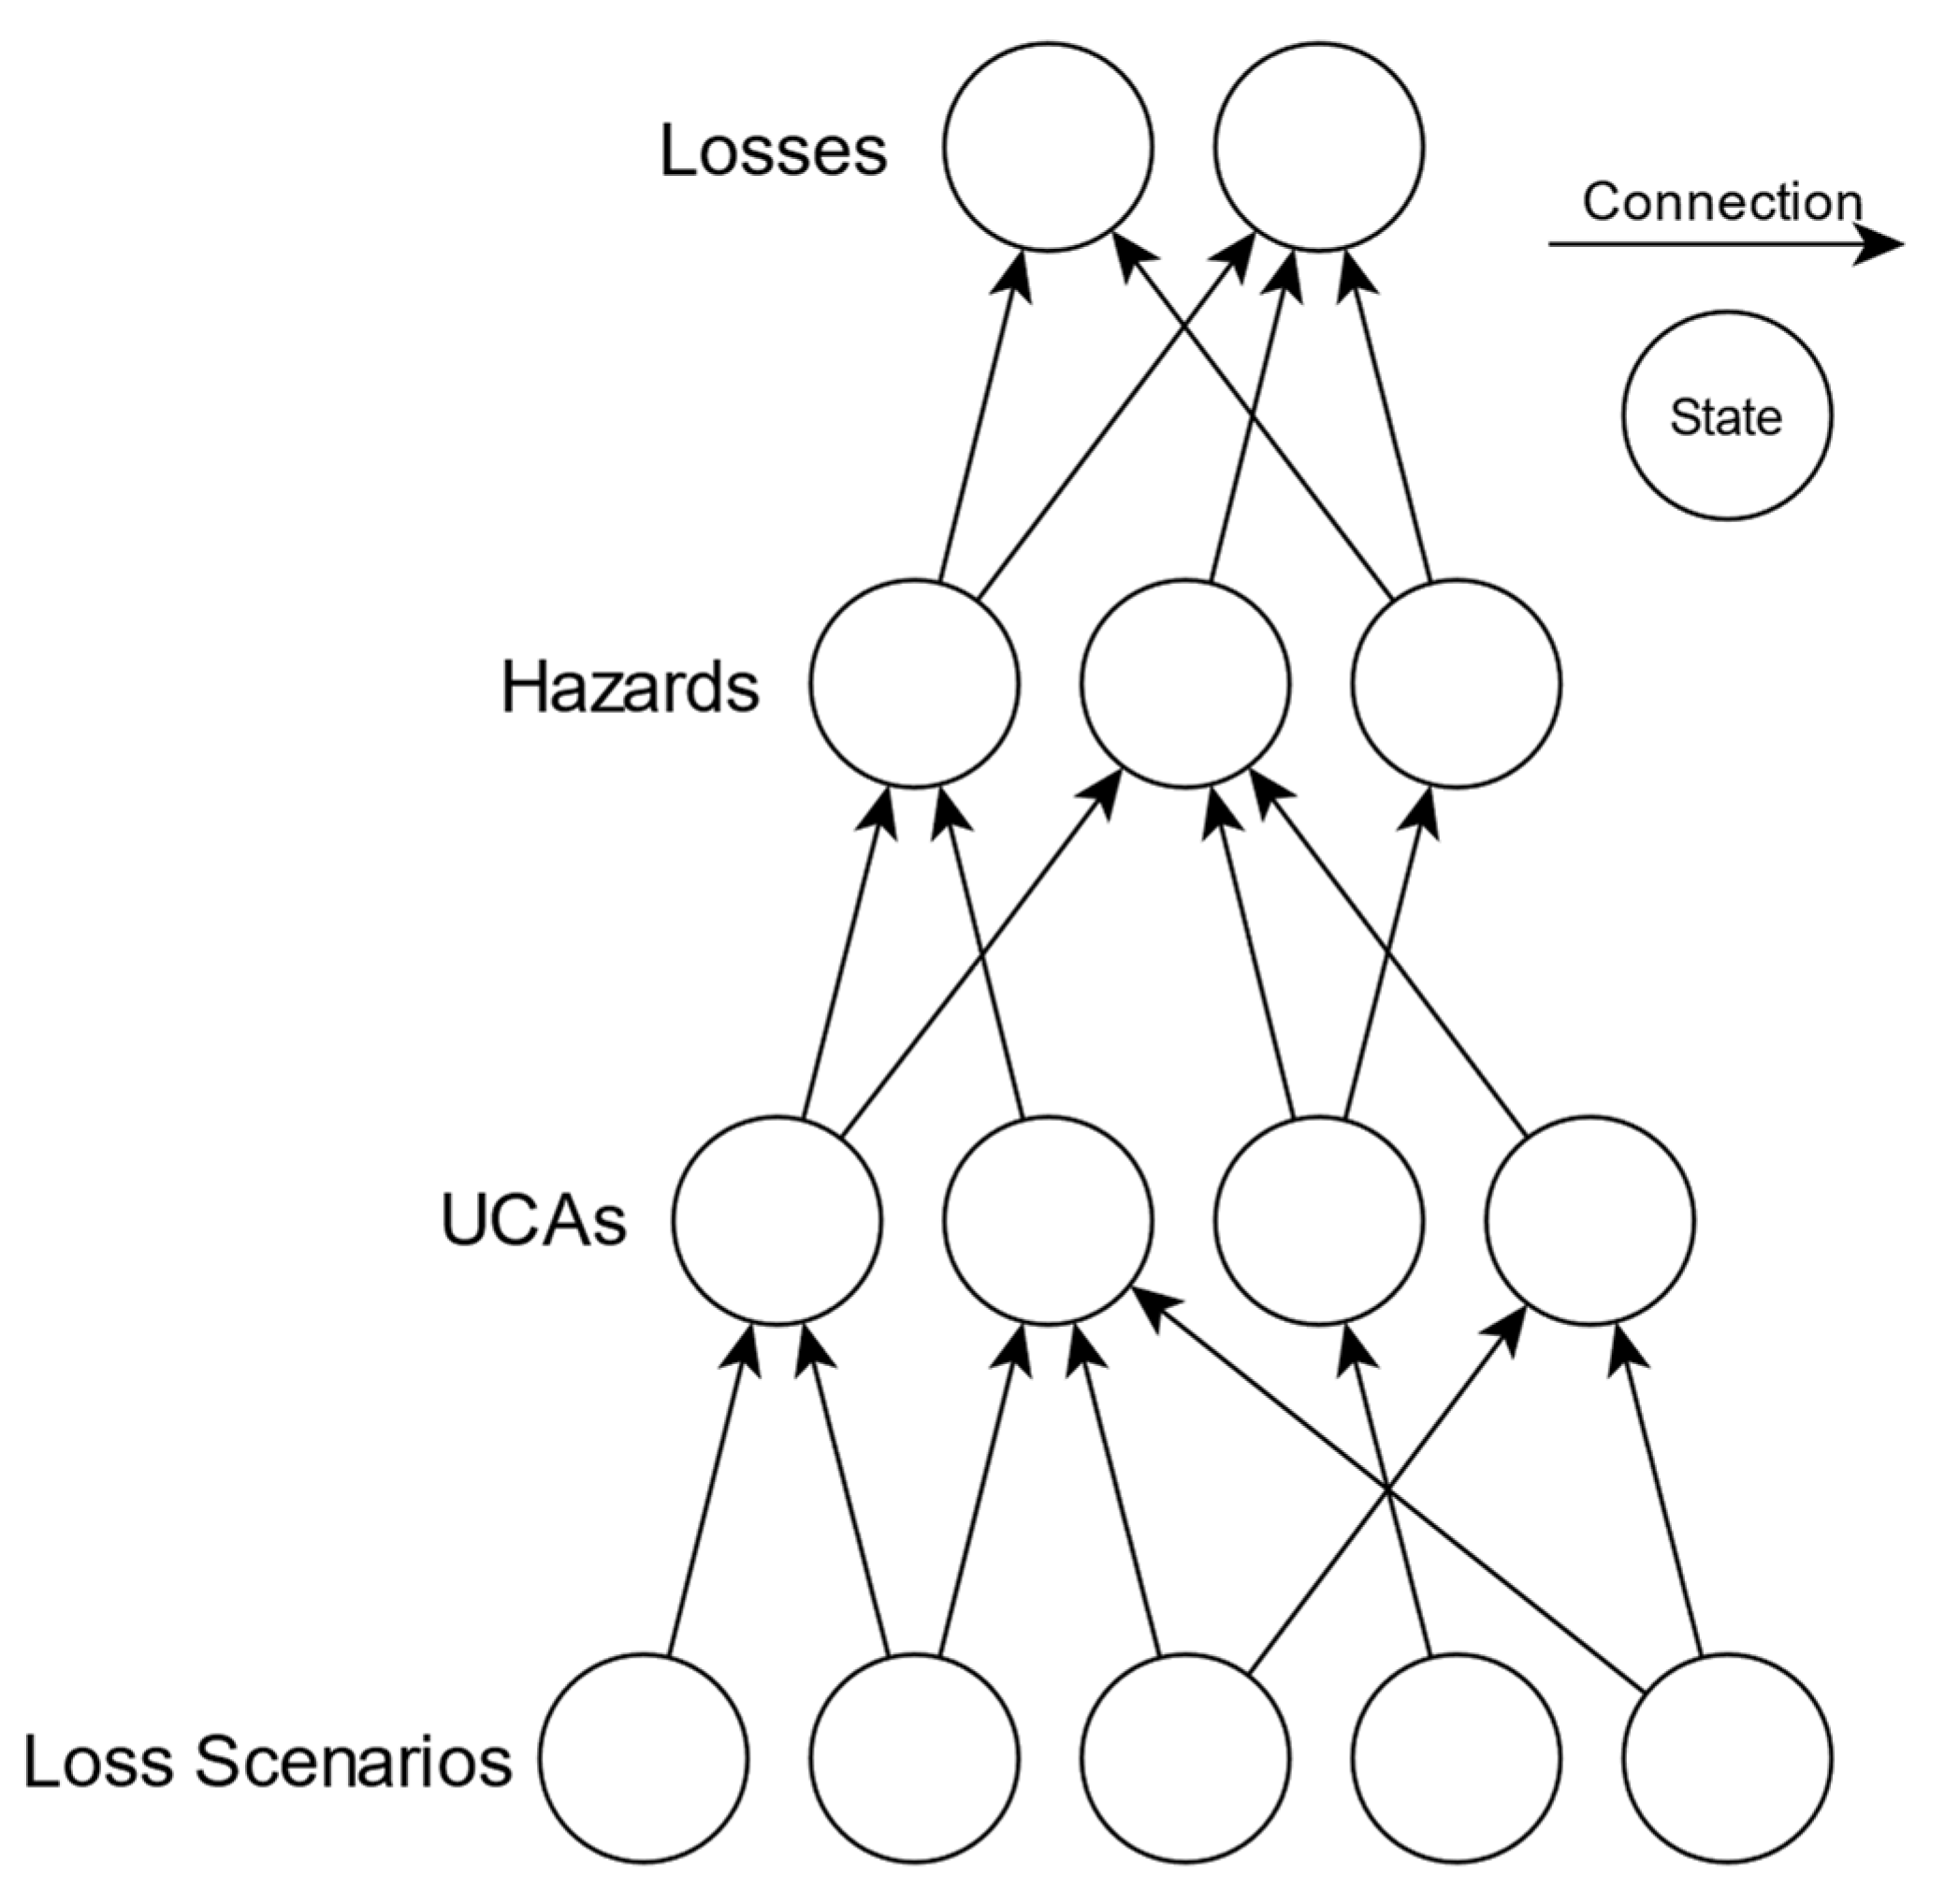
An STPA hazard analysis is to be conducted to determine the system’s safety level in question. The resulting unsafe system states from the STPA analysis, mainly losses, hazards, unsafe control actions, loss scenarios, and the connections between them, form a RealTSL acyclic diagram. The unsafe system states form the nodes or vertices of the diagram, and their causal connections form the edges or links between the nodes (see Figure 2).
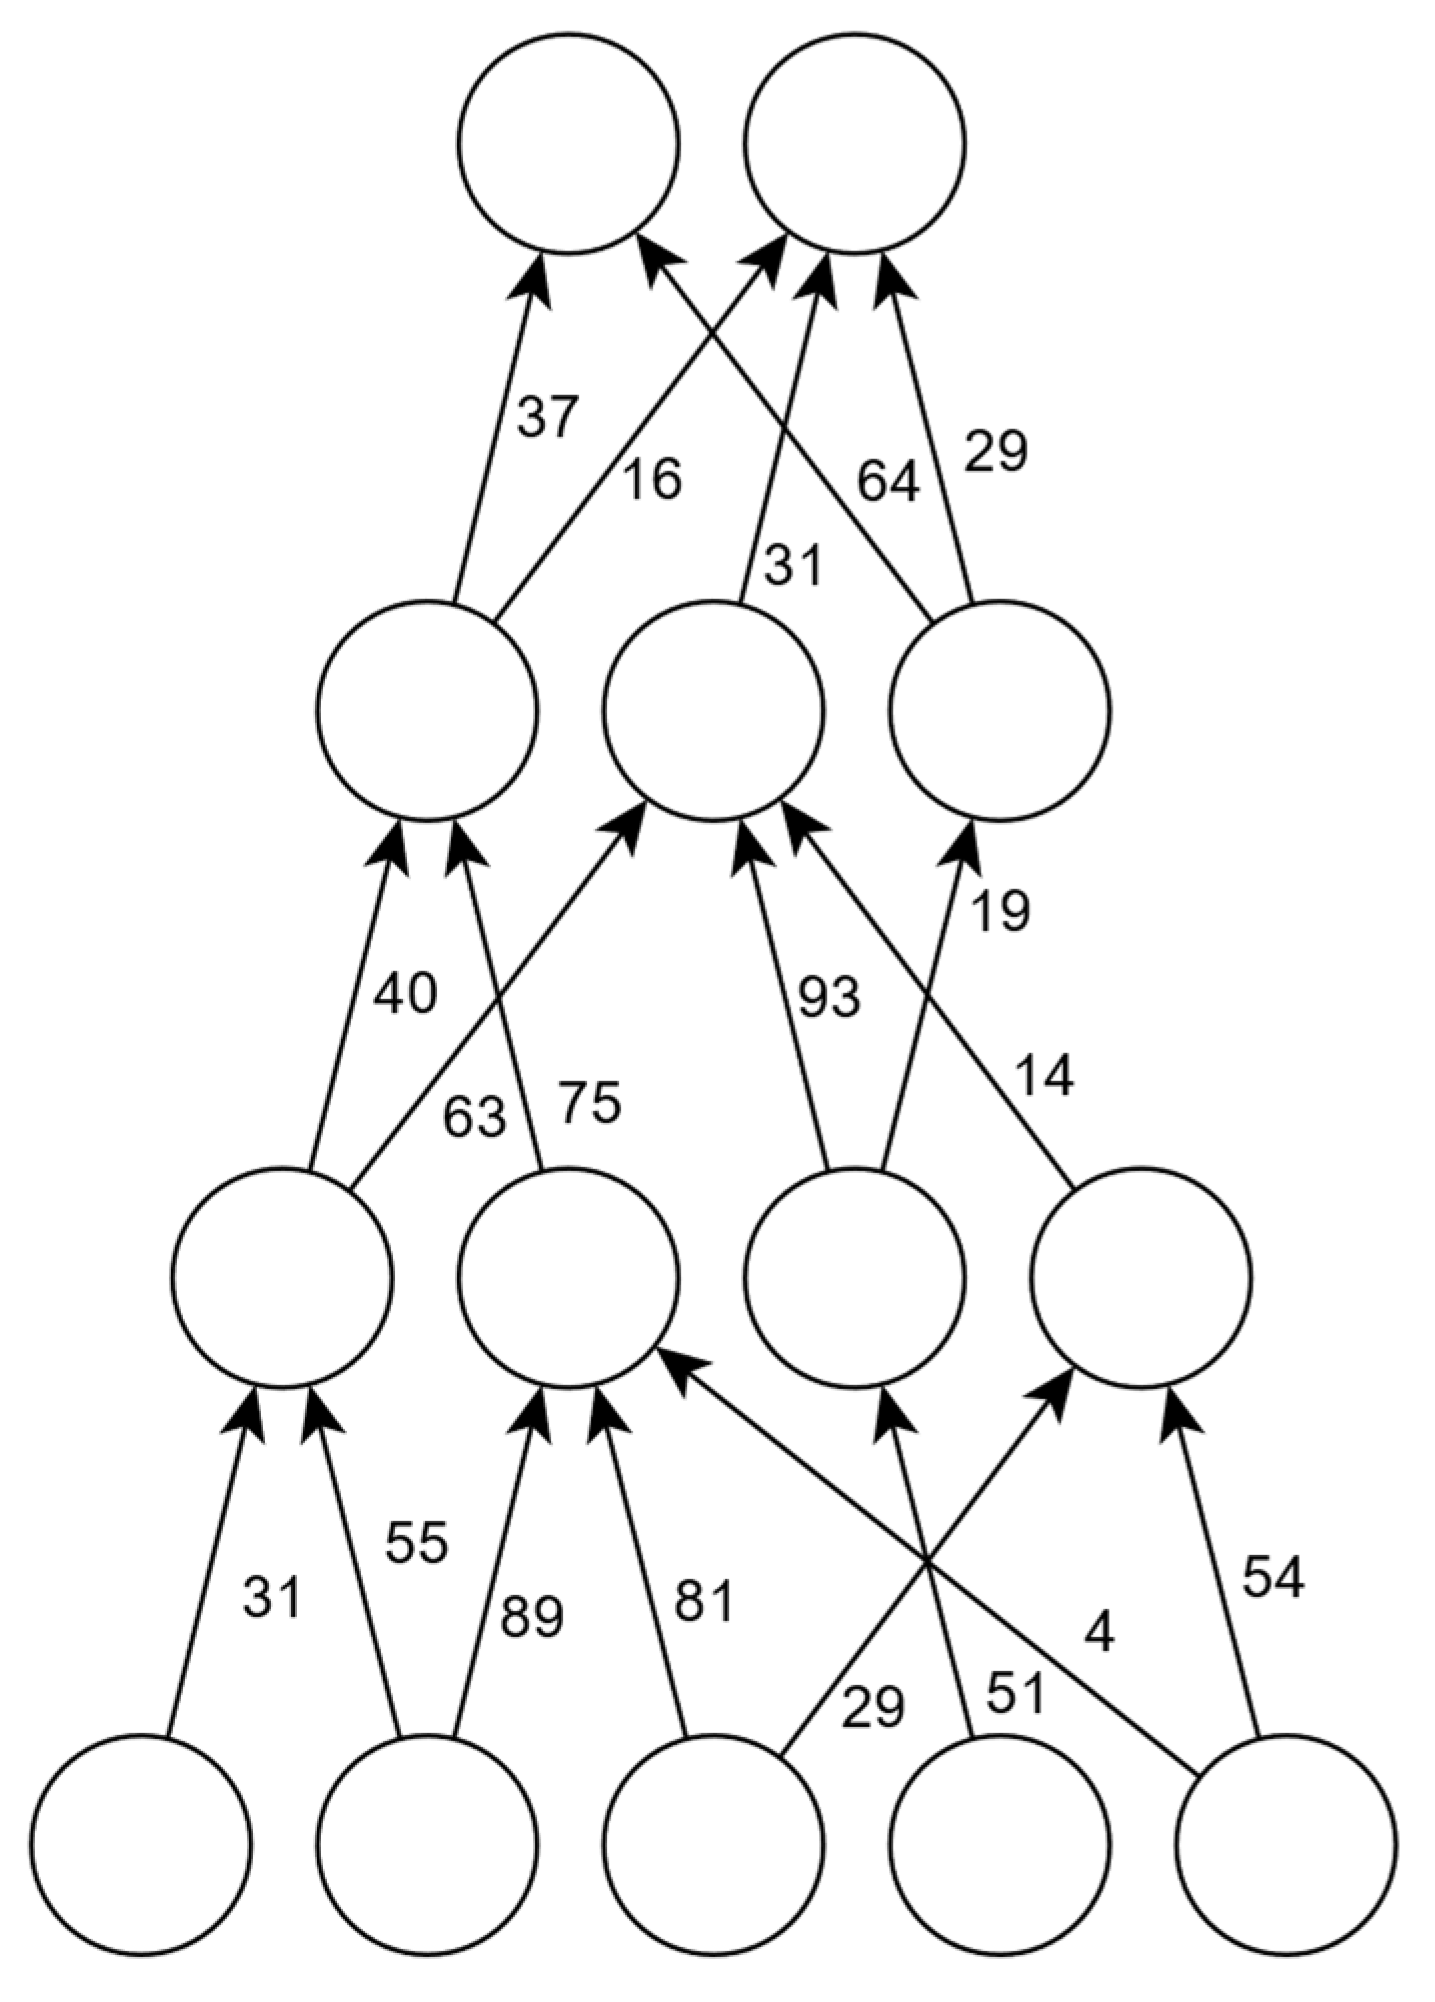
After creating the RealTSL acyclic diagram comes the determination of time values for the connections between the unsafe system states. These time values indicate the time for the transition of the system from one unsafe system state to another connected one, as described in the STPA analysis. The time values populate the RealTSL acyclic diagram with information for every connection between two states (Figure 3). These time values can be determined empirically, using system simulations and system tests. Figure 3 shows the time values in the RealTSL acyclic diagram.
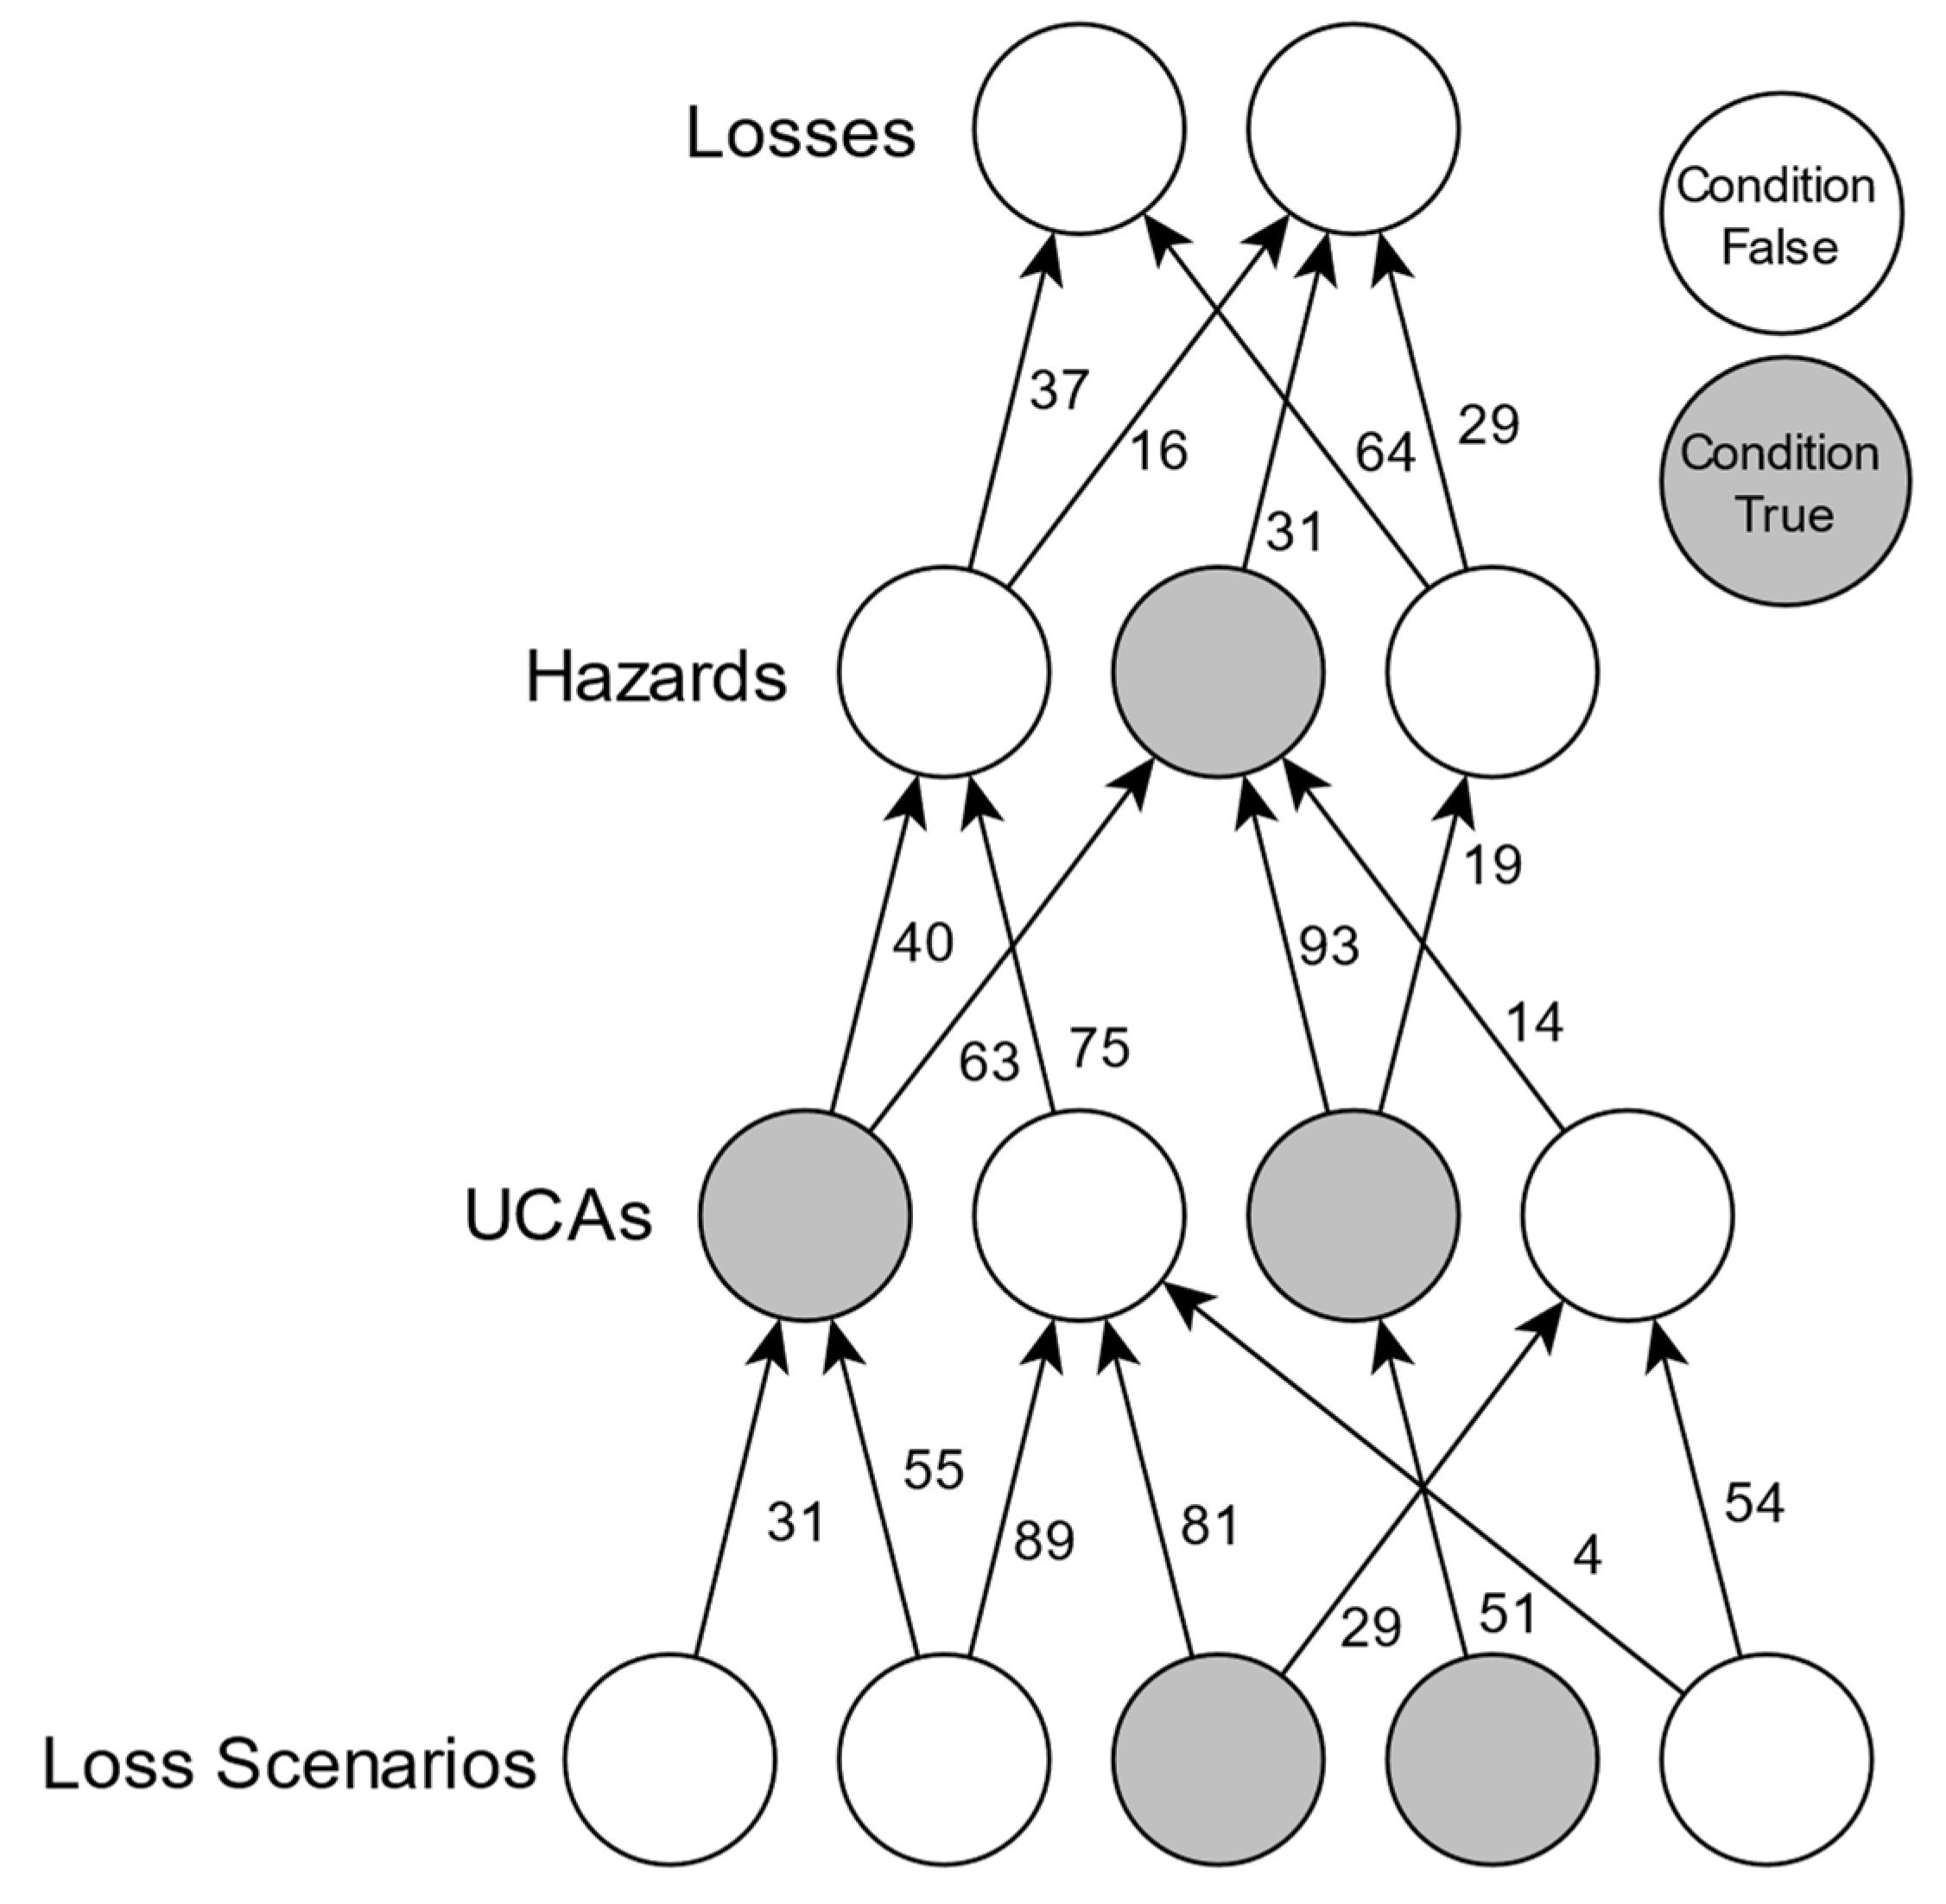
Subsequently, the EWaSAP extension of STPA will be applied to the system, as per Section 3.1 and Section 3.2. The EWaSAP analysis outputs provide the data that must be perceived during the operation of the system to provide awareness about whether the unsafe system states identified by STPA are occurring at any point during the system’s operation. The EWaSAP analysis also provides information about what sensory systems are required to enable this awareness of unsafe system states (Figure 4). The methodology then makes the assumptions that (1) these sensors are implemented in the system, and (2) that the data required can be transmitted in real-time to a location where the mathematical calculations take place.
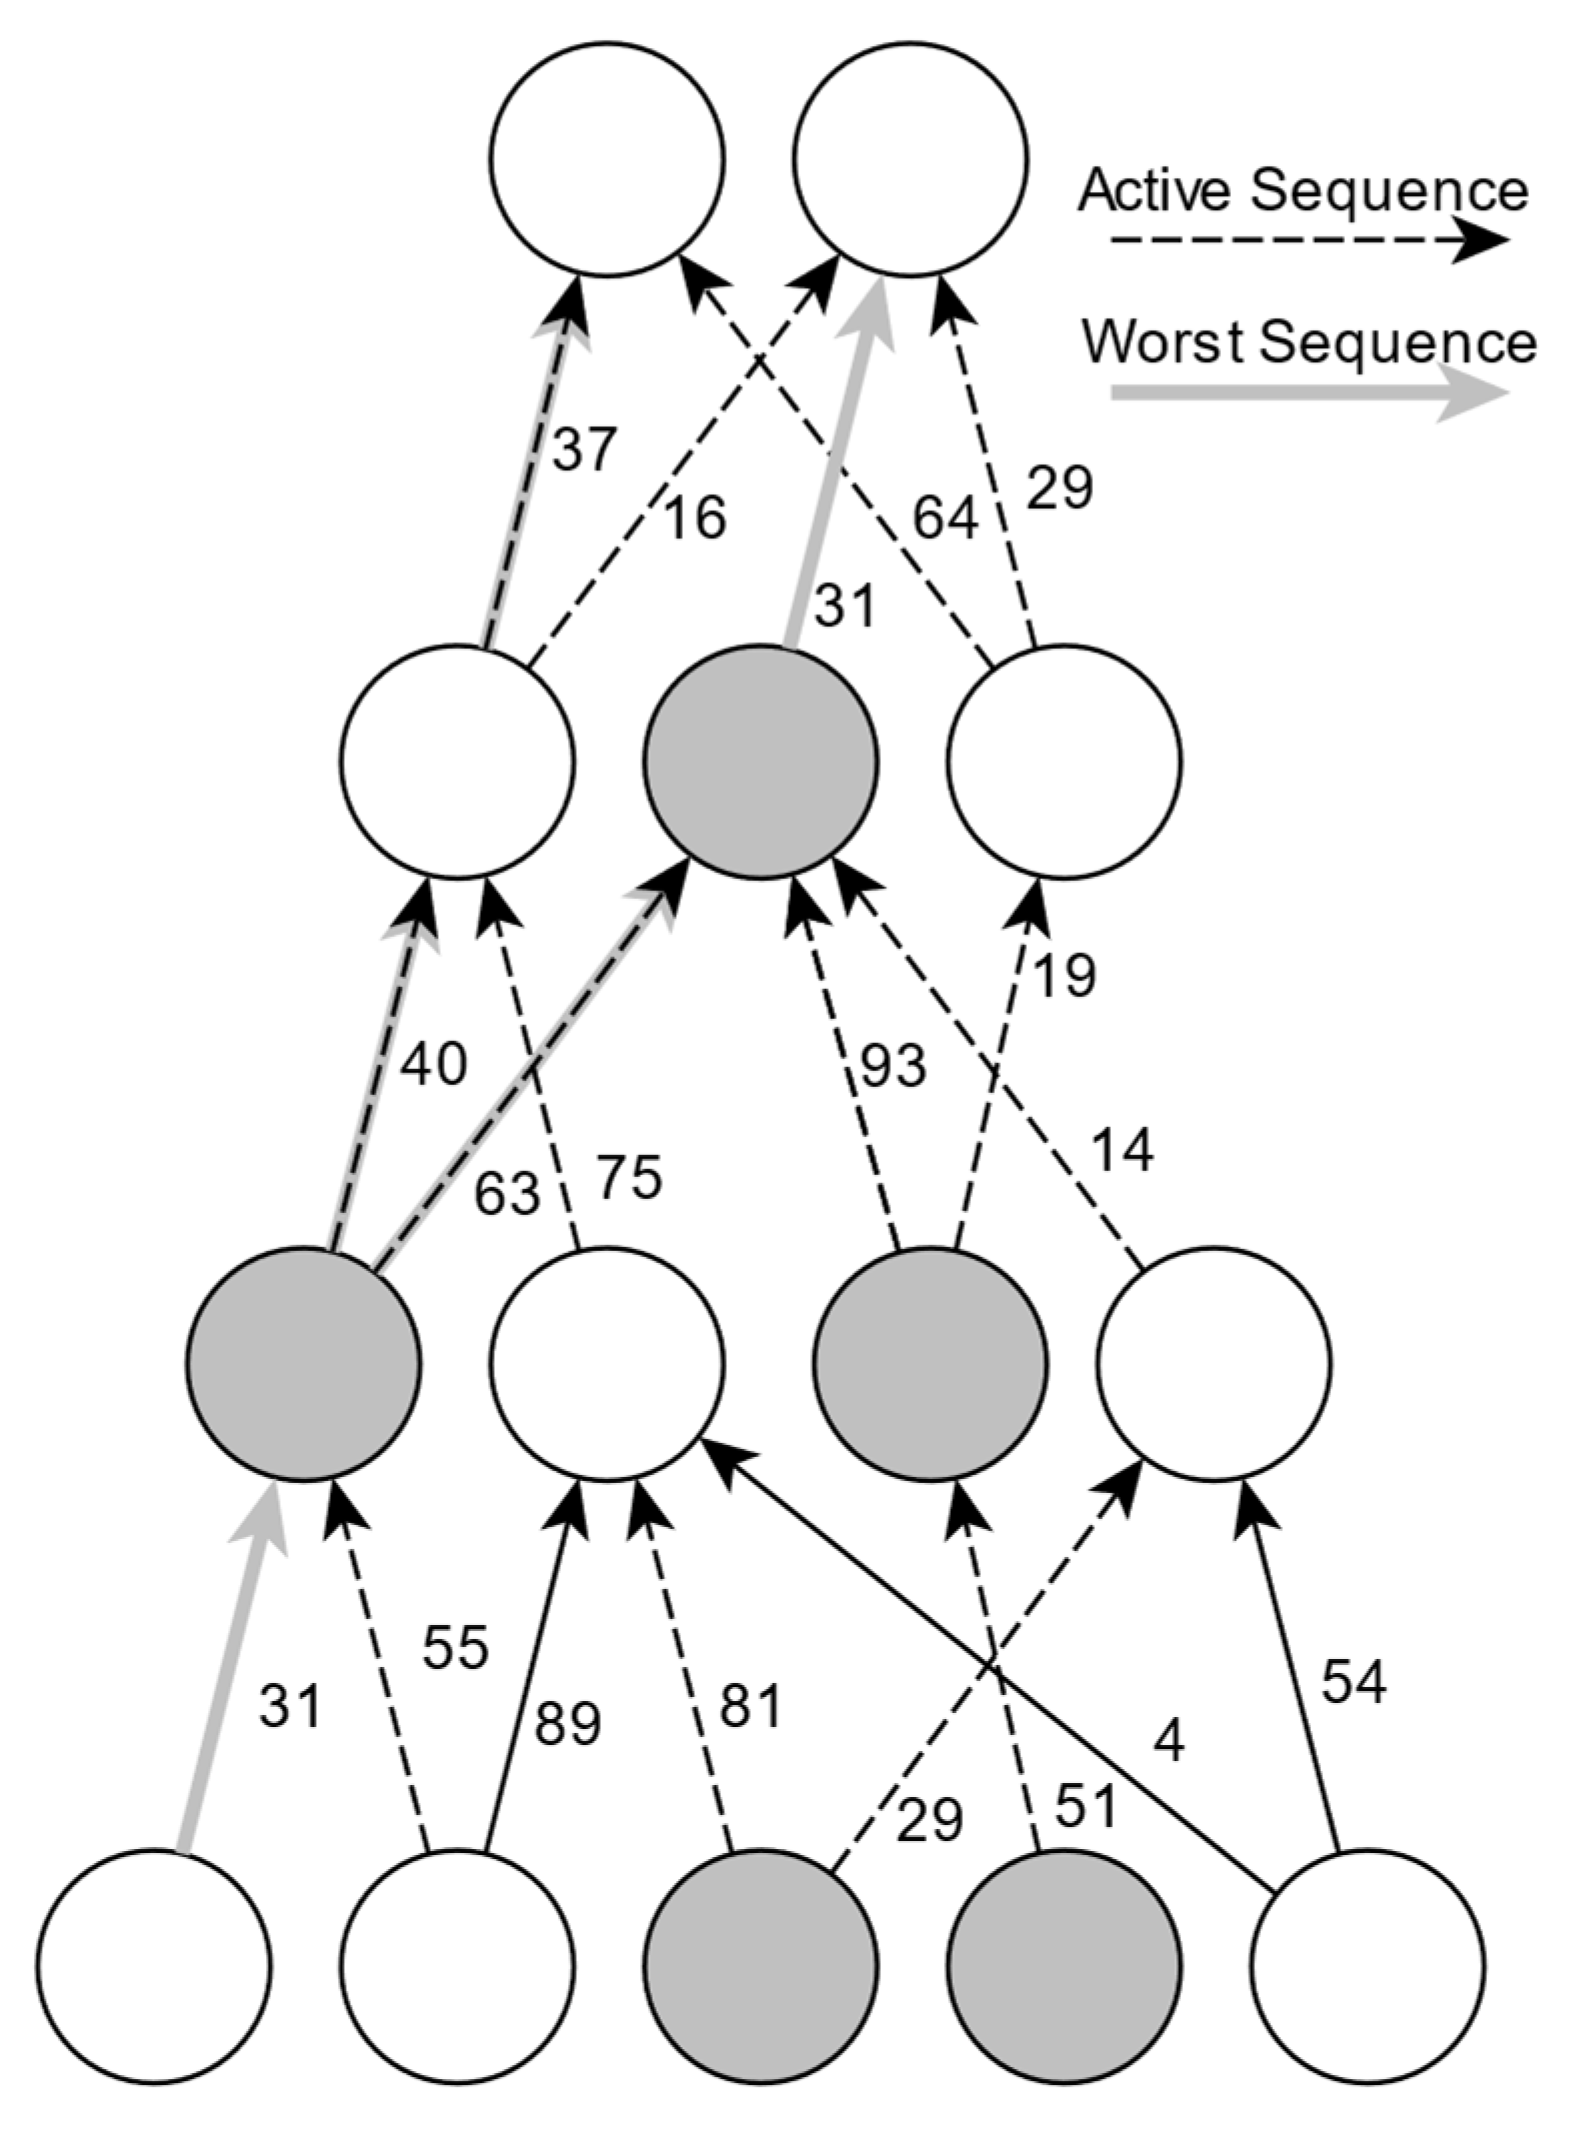
Finally, when the system is in operation, assuming all the needed real-time data (determined by EWaSAP) are provided, the mathematical model of RealTSL can calculate the most detrimental to the safety sequence of system state transitions according to the sequence of unsafe system states with the least amount of time between its highest true state and the top of the diagram, meaning the occurrence of losses (see Figure 5).

4.1.1. RealTSL Mathematical Model

The mathematical model of the methodology is presented in this section. The first notion to be defined is the sequence of unsafe system state transition paths [2]:
p = y , t p + y Y × R + ,
where Y = { 0,1 , 2,3 , 4 } .
Each path is defined by a vector with coordinates y Y , the path’s completeness, and t p + y , the time remaining until the accident occurs. The time remaining until the accident can be calculated using the following formula:
t p + y = t 1 2 p + t 2 3 p + t 3 4 p , y 0,1 , t 2 3 p + t 3 4 p , y = 2 , t 3 4 p , y = 3 , 0 , y = 4 ,
where t i j p represents the time until the system state transition between node i and node j.
All paths are categorized according to the severity of their resulting loss, meaning the loss at level 4 of the acyclic diagram.
The ordering of these paths provides the most detrimental-to-safety path. The ordering is described below [2]:
In the set P A i the paths of each accident, we define the following order relation:
p 1 y p 1 , t p 1 + y p 1 , p 2 y p 2 , t p 2 + y p 2 P A i
If t p 1 + y p 1 t p 2 + y p 2 > k is true, then
p 1 p 2 t p 1 + < t p 2 + t p 1 + = t p 2 + y p 1 y p 2
If t p 1 + y p 1 t p 2 + y p 2 k is true, then
p 1 p 2 y p 1 > y p 2 y p 1 = y p 2 t p 1 + t p 2 +
where k [ 0 , ] is the “Safety Tolerance” managerial decision, and (3), (4) sub-orderings.
Finally, we define the most detrimental-to-safety path for each accident as
p w A i = P A i = m a x { 3 4 } ,
where (3), (4) are the sub-orderings above.
According to the ordering of the accidents, the most detrimental-to-safety paths for each accident are ordered.
A k > A l > > A p S L = p w A k > p w A l > > p w A p
The reader is referred to the work by [2] for more details about the methodology and an in-depth analysis of its mathematical model.

4.2. Fuzzy RealTSL

In fuzzy RealTSL, the system level safety constraints, controller constraints, safety constraints, and awareness constraints resulting from STPA and EWaSAP are also implemented on the RealTSL acyclic diagram. The constraints derived from STPA represent the existence of measures that make it harder for each unsafe system state to be realized and on the other hand the constraints derived from EWaSAP represent the potential awareness about the realization of the unsafe system states.
Each unsafe system state is covered by a set of constraints (some constraints can be the same across multiple unsafe system states). Assuming that these constraints have a similar weight towards the degree of confidence on whether the state is indeed true or false, the degree of confidence in the available data of the existence of an unsafe system state is defined as follows:
For every path p in time t , there exists a fuzzy set A ~ t p = { a 0 t p , a 2 t p , a 3 t p , a 4 t p } which is defined as A ~ t p : Y 0,1 , where Y = { 0,1 , 2,3 , 4 } represents the 4 levels of the acyclic diagram (0 = LS and 4 = L) and a 0 t p represents the degree of confidence placed in the sensors of each node of path p in time t .
The uncertainty of information covered by the introduction of the degree of confidence parameter is reflected in the calculation of the time until the accident occurs.
To account for the degree of confidence parameter, the fuzzy mean ( μ ) of the fuzzy set A ~ t p is used according to the following formulae:
μ = 0 · a 0 t + 1 · a 1 t + 2 · a 2 t + 3 · a 3 t + 4 · a 4 t
μ y = i = 0 y i · a i t , w h e r e   y Y
μ y is the fuzzy mean of the degree of confidence until the highest active node of the path in question.
Since Y is a discrete set, the maximum values (for a i t = 1 , i Y ) of μ y can be derived as μ y m a x = { 0,1 , 3,6 , 10 } .
The definition of the time remaining until an accident occurs ( t + ) is “fuzzified” by using the operations presented above.
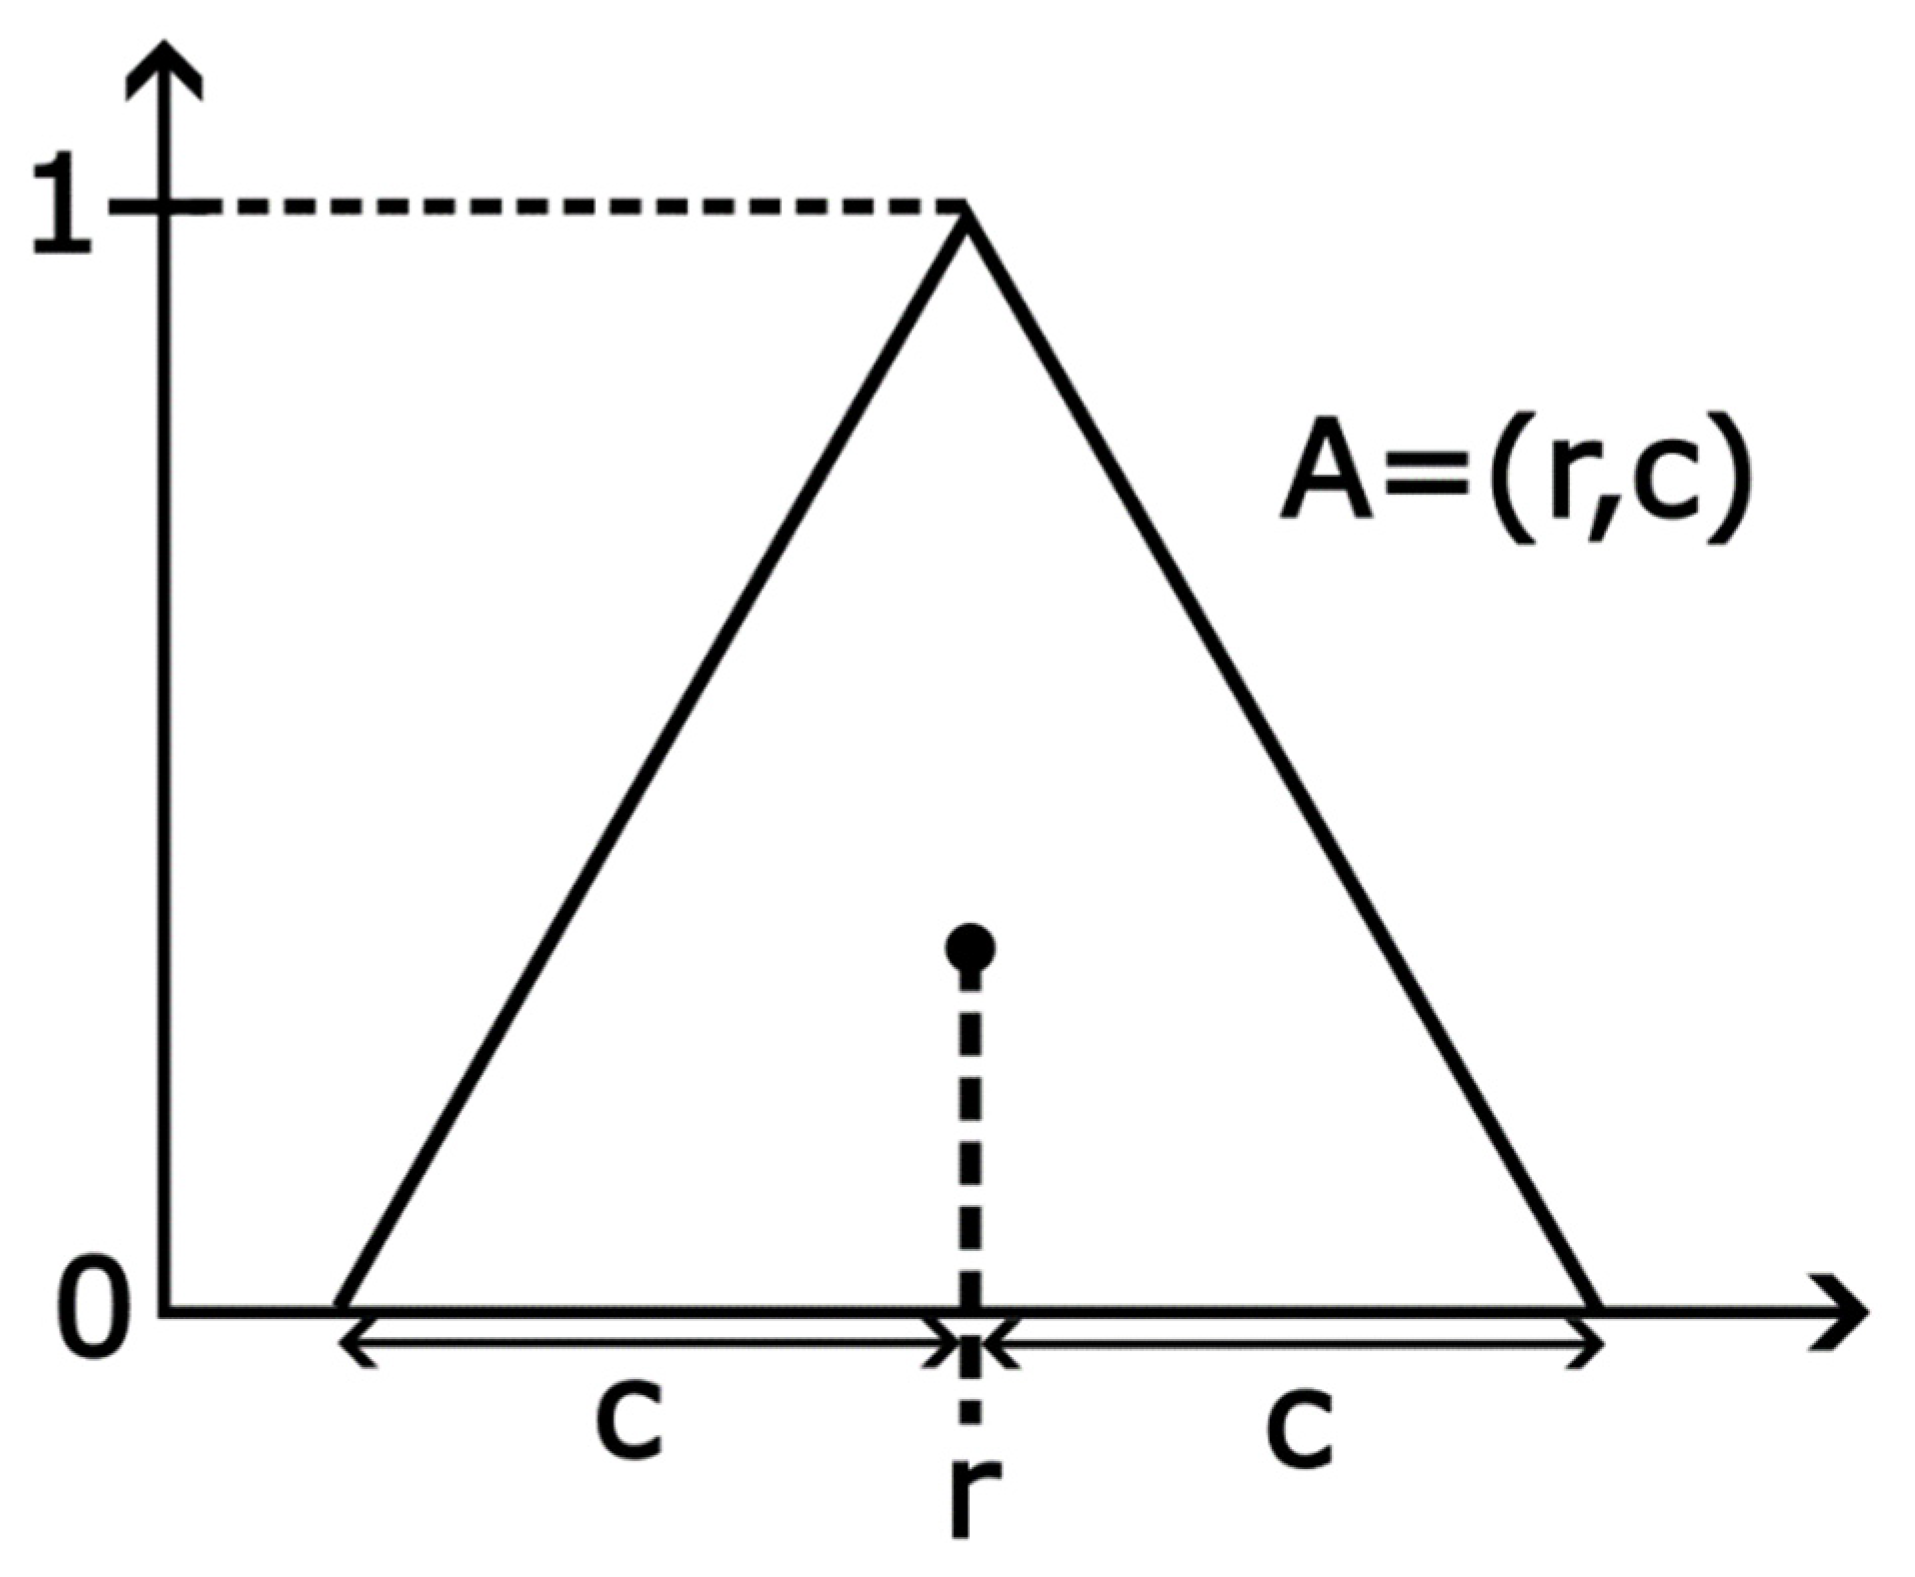
The fuzzy time remaining until an accident occurs t f + = ( r , c ) is defined as a triangular fuzzy number with centre r = t + and range c = μ y m a x μ y μ y m a x · t + (see Figure 6).
The fuzzy time remaining until an accident occurs can be calculated using the following formula:
t f + = t + ± μ y m a x μ y μ y m a x · t + ,
where y Y .
The fuzzy time remaining until an accident is defined as a triangular fuzzy number whose base becomes wider the more unsure the information about the occurrence of the unsafe system states becomes. While a trapezoidal fuzzy number was also considered, the triangular variant was finally chosen because conceptually it fit the idea of the uncertainty of the available information because the peak represents the ideal or most certain value, while the slopes capture the gradual decrease in certainty as you move away from this value. In addition, the triangular set consist of straight lines; their calculation involves only basic linear interpolation. This leads to reduced computational overload compared to more complex shapes like Gaussian or sigmoidal fuzzy sets. Since the point of RealTSL is to conduct real-time calculations, resources are limited, and triangular sets are ideal for that.
However, in order to be able to calculate the most detrimental-to-safety path, an ordering of fuzzy sets needs to be utilized.
By implementing a modified version of the “Ranking of fuzzy numbers based on centroid point and spread CPS” [16], an ordering of fuzzy sets is achieved and the rest of the RealTSL mathematical model can be followed as defined in Section 3.1.
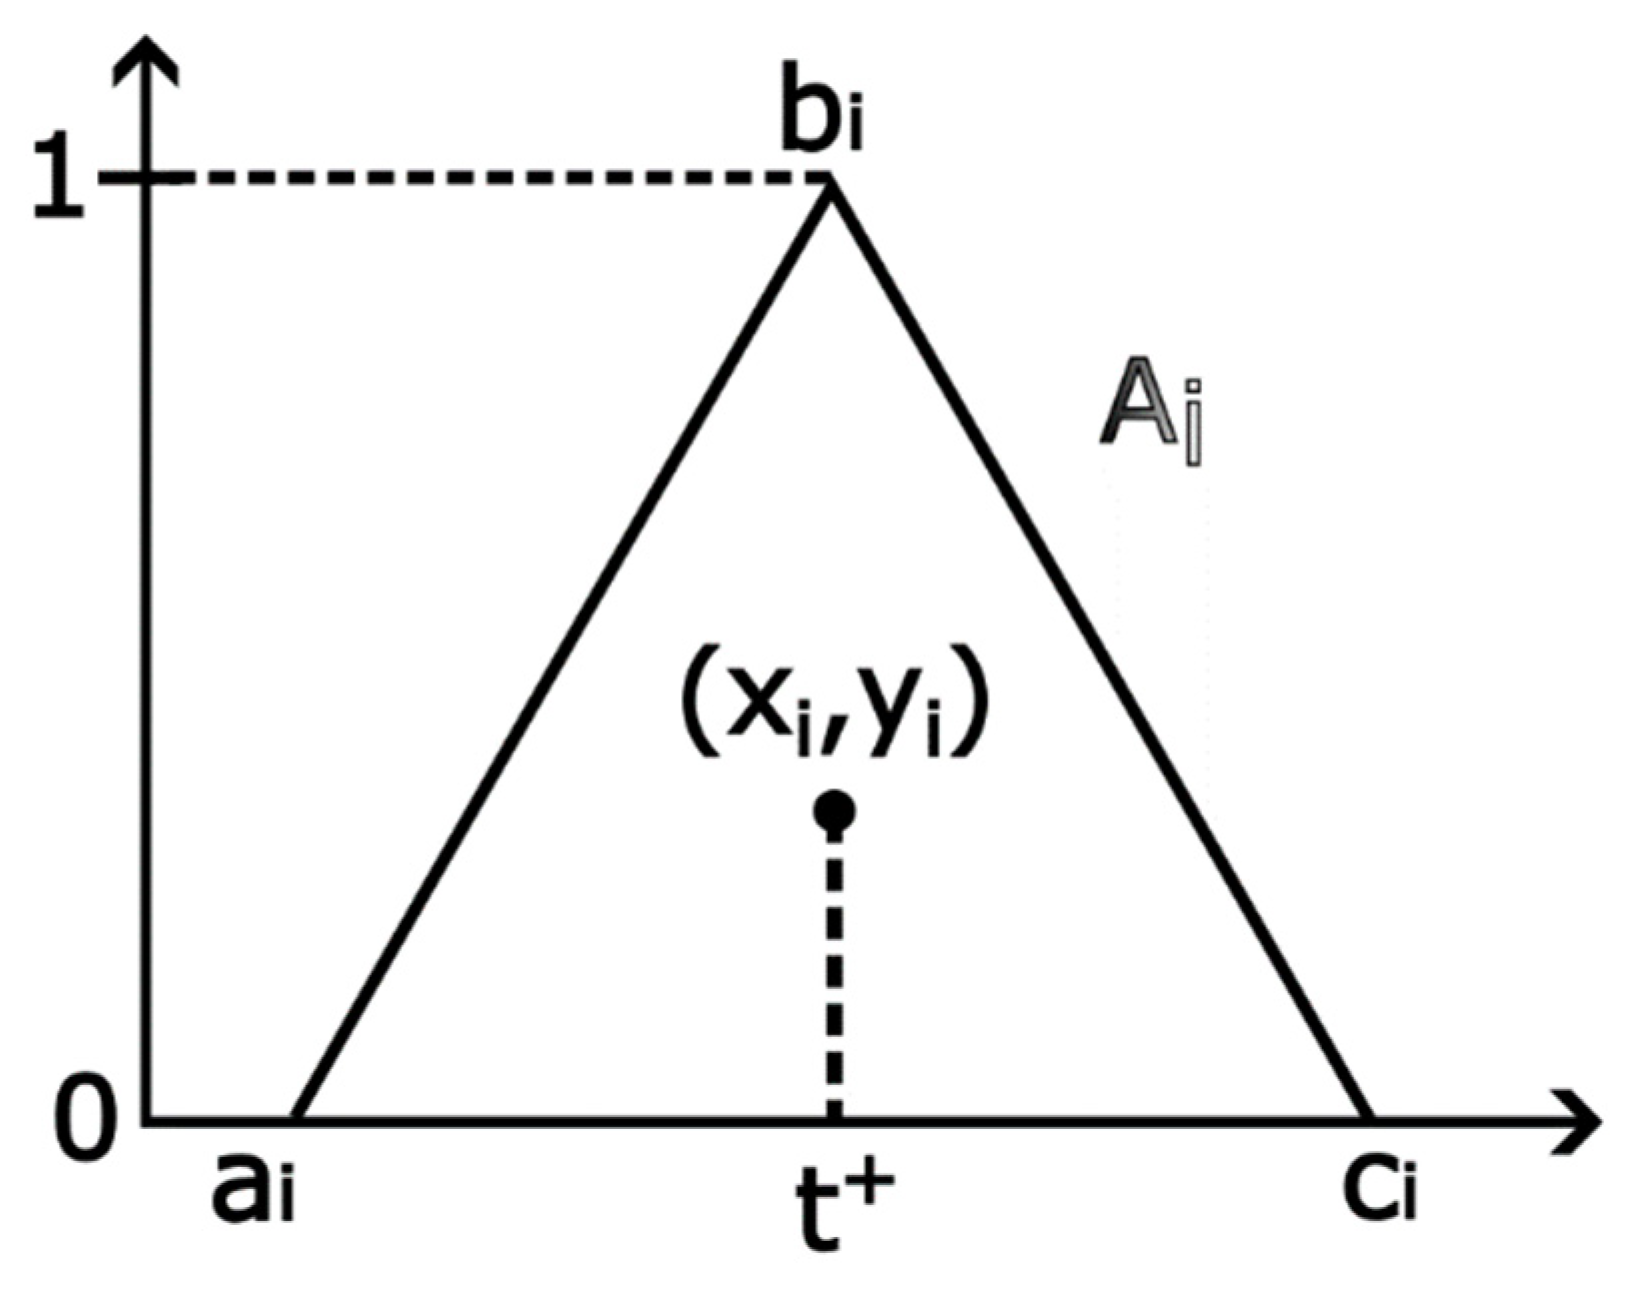
The ranking based on CPS works by providing a CPS formula that is used to order fuzzy numbers. The CPS formula when applied to a triangular fuzzy number as depicted in Figure 7 is as follows:
C P S A i = x i · y i · max t s i
where A i is a triangular fuzzy number, x i the x component of the centroid of the triangle, y i the y component of the centroid of the triangle and s i the spread of the triangle.
These parameters in the context of Fuzzy RealTSL can be calculated according to the following formulae:
C P S A i = x i · y i · max t s i
x i = t +
y i = 1 / 3
s i = y i · c i a i
where a i and c i are the start and end of the fuzzy number, as in Figure 7.
An example of the fuzzy RealTSL calculations to achieve the safety level is provided in Section 5.5 on a real scenario from the panel alignment system case study.
After the calculation of the CPS, the fuzzy time values t f + can be ordered and the path ordering presented in Section 4.1.1 can be followed to determine the safety level of the system.
The authors investigated multiple potential ordering relations for the fuzzy numbers in order to identify one that fit the requirements of this approach. These requirements were firstly in case the “spread” of the triangular numbers was 0, to be able to order them numerically, meaning that t 1 = 5 s < t 2 = 10 s. Secondly, because in this case the smaller the time value for the time remaining until the accident, the more “severe” that path is toward safety. Then the larger the base of the triangle, meaning the more uncertain the value of the time remaining until accident should also be smaller, so that it is more “severe” toward safety. Furthermore, many of the ordering relations we found were meant for comparing pairs of fuzzy numbers whereas the CPS ordering utilized the number C P S A i that makes it easier to order multiple fuzzy numbers. Finally, since this methodology is meant to operate in real-time, the simple calculations required to conduct the CPS ordering would not drastically increase the computational needs to conduct the new fuzzy RealTSL when compared to alternative options.

5. Case Study

5.1. System Description

The automatic PV panel alignment system (hereafter called PAS) of a 150 KW solar park located in a rural village in northern Greece (Figure 8) was analyzed as a case study of the new fuzzy RealTSL methodology. The solar park components are as follows:
  • It has 45 arrays, each one containing: ≃18 PV panels;
  • It has two electric motors for lateral and longitudinal movement in each array;
  • One programmable logic controller that houses the astronomical and weather monitoring algorithms.
  • There is one switch box that limits each array’s movement individually to obtain the optimal position against the sun and avoid potentially rotating arrays in unexpected ways. This is achieved without software, as the switch box just cuts power to the motors of each array in case one tries to rotate in an unwanted position.
  • One sensor data recorder that records the data from the various sensors positioned on the array.
  • Fire detection and suppression system.
  • Surveillance system with cameras that have a complete view of the park.
  • Power transformer that inverts the direct current generated by the array to alternating current to be transported through the power grid.
  • An anemometer for weather measurements.
  • A storage room for housing the park’s main computer, manual array alignment controller and other electrical systems as well as storing maintenance equipment and extra components.
Using this array configuration and PV panel alignment system, the park is able to produce 28–30% more electrical energy than if the panels were stationary.
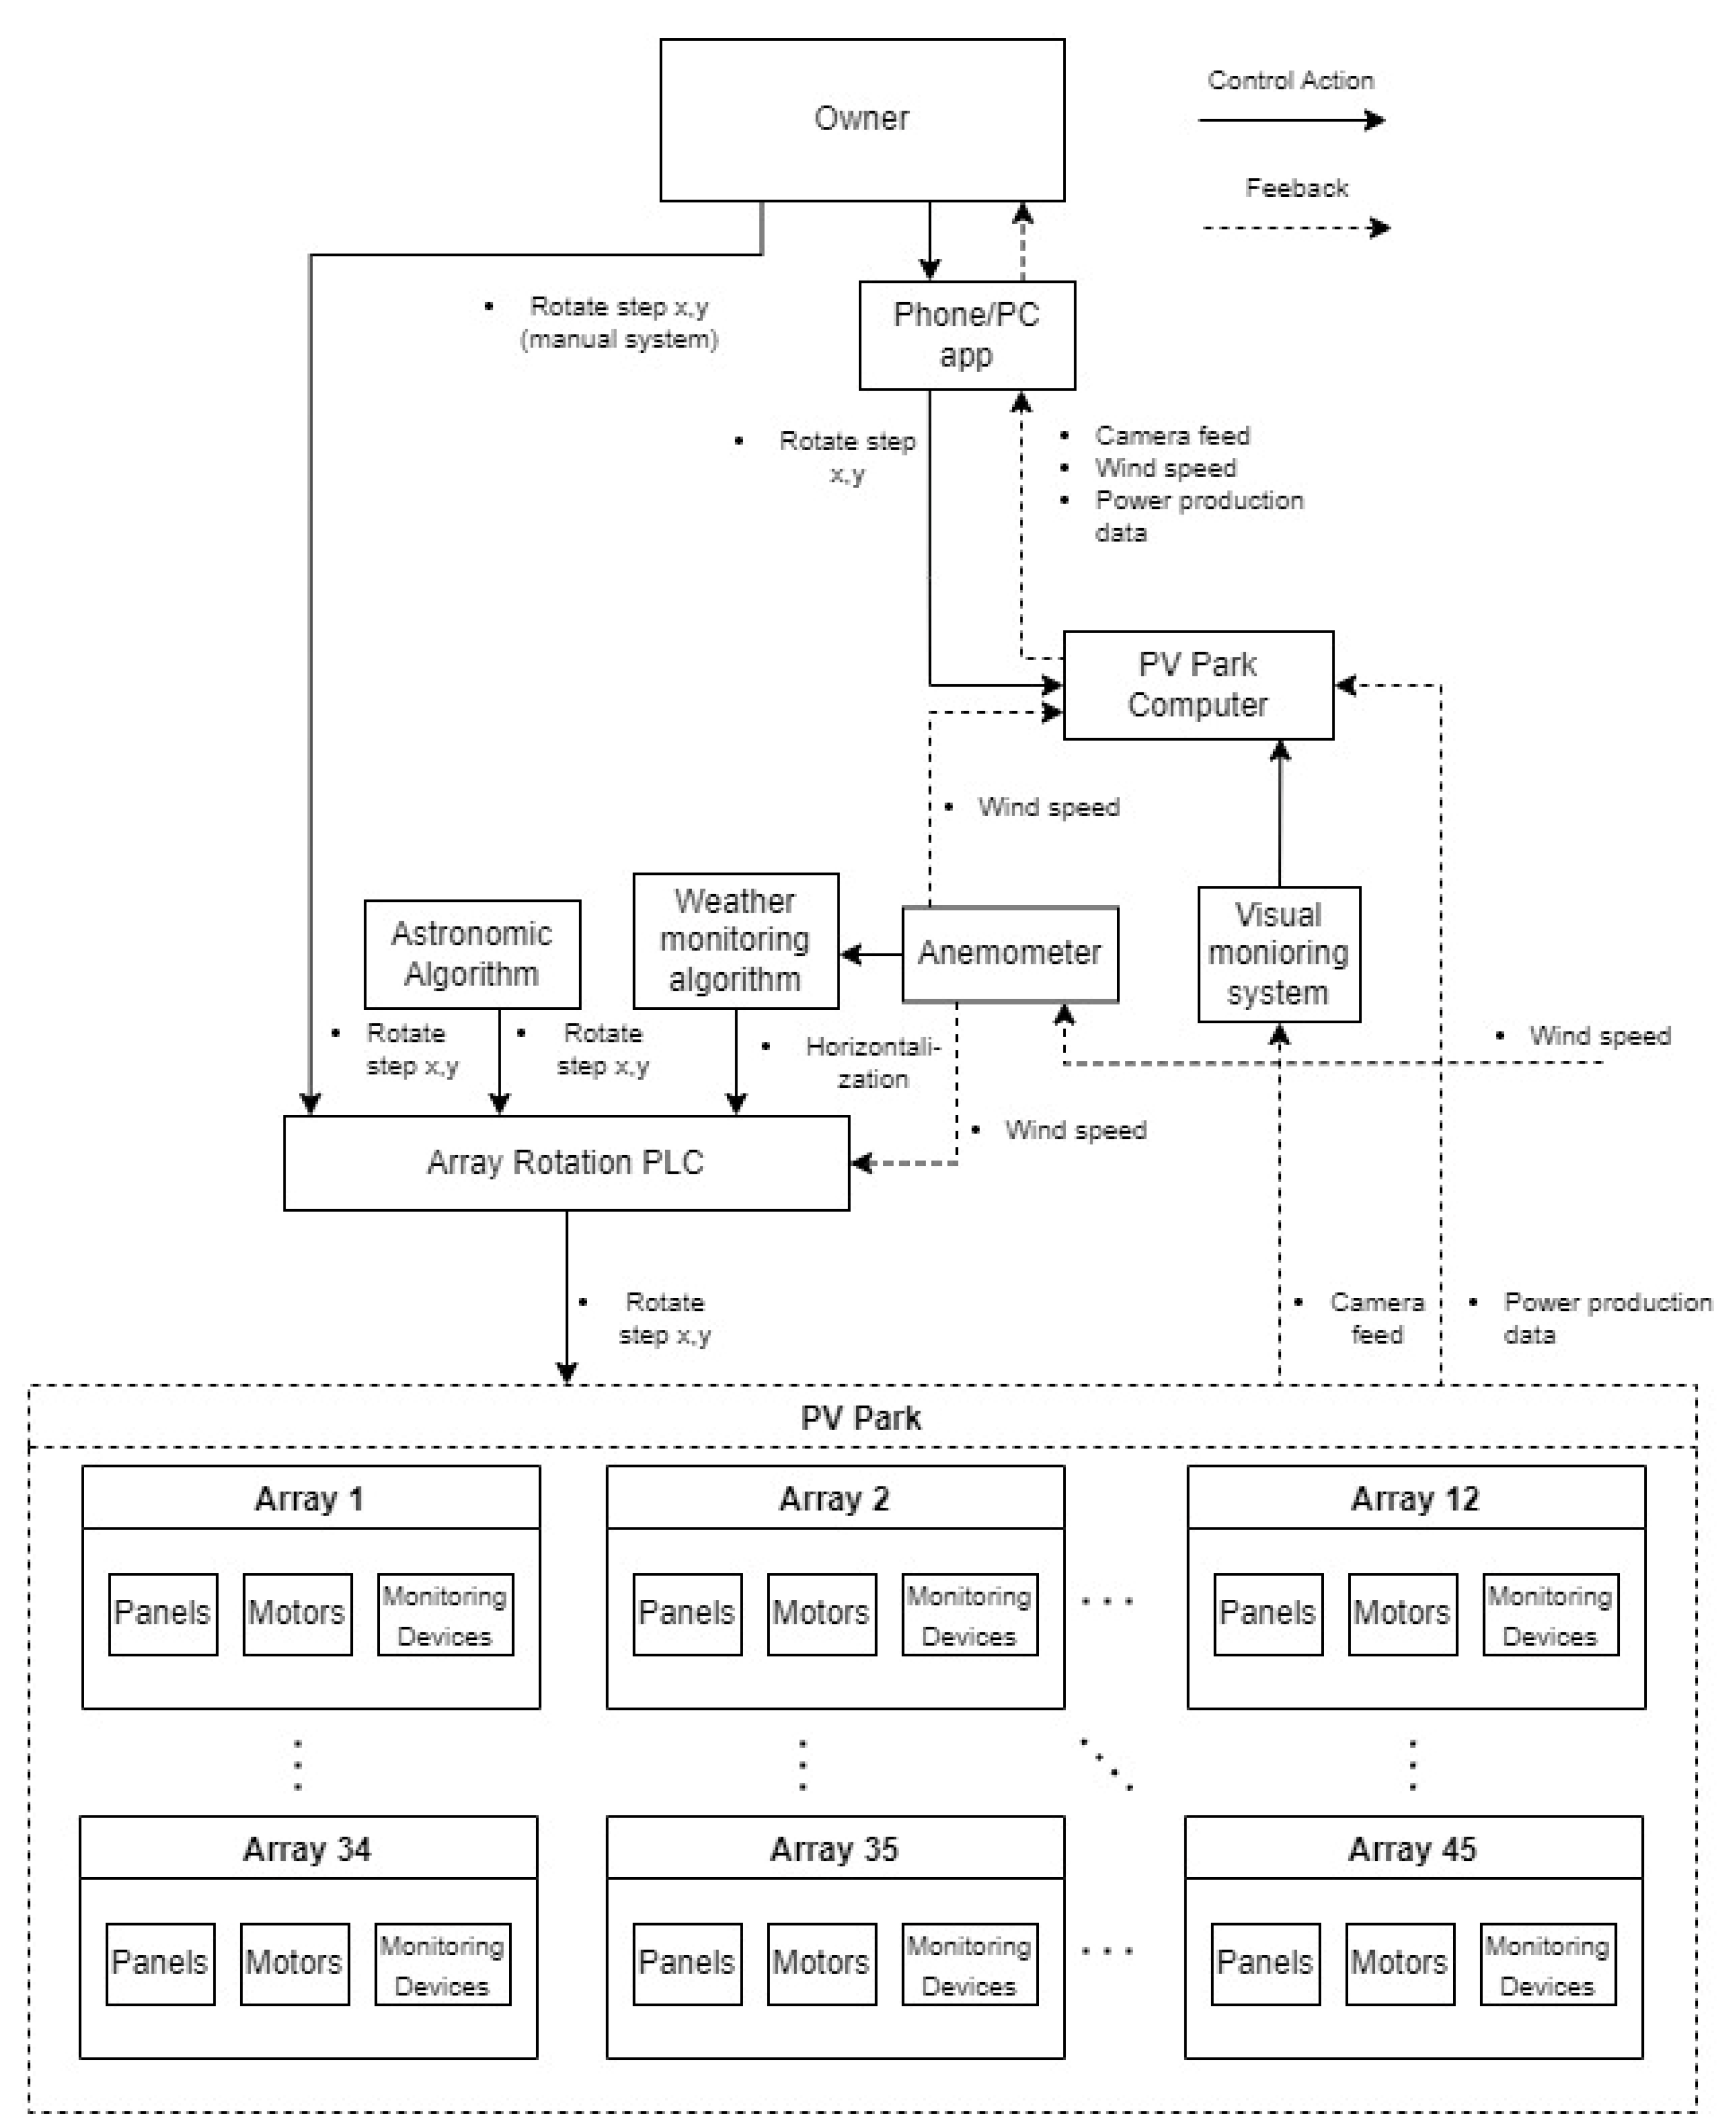
To track the sun properly, the system utilizes an astronomical algorithm that has been calibrated for the specific location of the park and a solar time-based control unit. With these tools, the astronomical algorithm provides control actions in the form of “Rotate step (x,y)” through a PLC controller to all arrays in the park (the x and y indicate which motor should be used to rotate the array in this specific “Rotate step” action). These control actions are provided in short intervals to follow the trajectory of the sun through the sky in an optimal manner. In cases of high winds, a weather monitoring algorithm analyzes the information provided by the anemometer, and if winds exceed a specified value for a prolonged period of time, a “Horizontalization” control action is provided that rotates all arrays to a horizontal position with the aim of minimizing potential damage to the equipment due to the extreme environmental conditions. There are also two ways of changing the position of all arrays at the same time if needed. One is through the manual array alignment controller and one through the PV park computer that is also connected to the internet and through an app, where one can change the position of the arrays from a remote location.

5.2. STPA

5.2.1. First Step

The first part of the fuzzy RealTSL methodology remains the same as its non-fuzzy counterpart, applying STPA and EWaSAP analyses to the system studied.
After consulting the owner and the developers of the PAS, the results of the first step of the STPA analysis were three system level losses, four system level hazards and four system-level safety constraints (presented in Table 1).

5.2.2. Second Step of STPA

The second step of STPA involves modelling the studied system in a safety control structure. The safety control structure used in the analysis of the PAS is shown in Figure 9.

5.2.3. Third Step of STPA

In the third step of the STPA, the unsafe control actions (UCAs) are generated. In the case of the PAS, 22 UCAs were identified for the (1) rotate step control action (provided by the PV park computer controller), (2) rotate step control action (provided by the astronomical algorithm controller) and the (3) horizontalization control action provided by the weather monitoring algorithm controller.
The UCAs identified for the PAS are presented in Table 2.
Table 2 is presented in the format of an STPA, meaning that the UCAs are presented in rows according to their originating control action and in columns in regard to the category of UCA, as stated by Leveson and Thomas (2018) [4]. The categories, as detailed also in paragraph 2.1 above are: (1) providing control action causes hazard, (2) not providing control action causes hazard, (3) control action provided too long or stopped too soon and causes hazard, and (4) control action provided out of order or with incorrect timing and this causes hazard.
Also, during this step according to the identified UCAs, controller safety constraints are determined. The formal definition of a controller constraint is as follows: “A controller constraint specifies the controller behaviours that need to be satisfied to prevent UCAs”. (Leveson and Thomas, 2018) [4]. For example, the Controller constraints for UCA-1, UCA-6, UCA-19 are as follows:
  • SC-5-UCA-1: Sequence of “Rotate step x,y” CAs should be provided by the owner when one or more arrays are not positioned with proper alignment.
  • SC-10-UCA-6: When the array is positioned with proper alignment “Rotate step x,y” CAs should not be provided by the owner and the astronomical algorithm.
  • SC-19-UCA-19: “Rotate step x,y” CAs should not be provided by the astronomical algorithm too late after the sun has moved too far such that one time step movement would not place the array in the position at which the PV panels generate electricity optimally.

5.2.4. Fourth Step of STPA

For the final step of the STPA, which is the generation of loss scenarios (LS), only the UCA-1, UCA-6, and UCA-19 were analyzed for this case study. The result was 21 loss scenarios and their corresponding safety requirements. A sample of the loss scenarios and their corresponding constraints generated for the PAS is presented below.
UCA-1: Rotate step x,y is not provided by the owner when the array is not positioned with proper alignment. [H-1]
  • LS 5 (loss scenario) for UCA-1: The owner does not have access to the phone/pc app and is in a remote location.
  • LS 7 for UCA-1: The owner does not have access to the phone/pc app and the temperature of the computer room, or the surrounding area is too hot; it may not be safe for the owner to manually adjust the arrays.
  • LS 13 for UCA-1: The owner is in a remote location and their phone or pc are receiving software updates.
UCA-6: Rotate step x,y is provided by the owner when the array is positioned with proper alignment. [H-1, H-2, H-3, H-4]
  • LS 16 for UCA-6: The camera feed is stuck showing the park in a previous time and the owner believes that the arrays are out of proper alignment.
UCA-19: Rotate step x,y is provided too soon by the astronomical algorithm, before the Sun has moved an adequate amount. [H-1]
  • LS 18 for UCA-19: The clock used by the astronomical algorithm runs out of battery, causing the astronomical algorithm to provide erratic control actions.
  • LS 19 for UCA-19: The clock used by the astronomical algorithm malfunctions, causing the astronomical algorithm to provide erratic control actions.
The safety constraints for the loss scenarios presented above are presented below.
  • SC-28-S5-UCA-1: The owner should be near a phone or pc with the app installed at all times.
  • SC-32-S7-UCA-1: The park’s computer room should have adequate cooling (through large windows, fans, or an AC unit).
  • SC-41-S13-UCA-1: The owner should check if updates are available for their phone and PC. They should also update their devices after they have checked into the park or while at the park.
  • SC-46-S16-UCA-6: The camera feed should have a time stamp so the owner will be able to check if the time on the visual feed matches the current time.
  • SC-47-S16-UCA-6: The owner should also check the power production data for discrepancies when checking the park’s camera feeds.
  • SC-48-S18-UCA-19: A notification system should be in place to notify the owner, technician, and park maintenance staff when the clock battery used by the astronomical algorithm reaches 10 percent.
  • SC-49-S19-UCA-19: A system should be in place that checks whether the clock used by the astronomical algorithm is working properly and notifies the owner, technician, and park maintenance staff if it is not.
Annex A presents the complete set of loss scenarios (for UCA-1, UCA-6, and UCA-19), safety constraints, and the overall list of safety constraints.

5.3. Determining Time Values and Calculating the Safety Level

Three meetings were conducted with the system developers and owner to determine the time values required for the RealTSL acyclic diagram. The first was to determine time constants for the system’s functions, i.e., rotation time for each time step, daytime, the average time between rotations, etc. A sample of the time constants identified for the PAS is shown in Table 3.
Following the initial time constant identification, combinations of these time values based on the unsafe system states were identified. Further meetings with the developers and owner were held to check if the derived times were realistic. Site visits were conducted to measure time values and validate the ones derived by the analysts.
The determination of the time ranges for path p: LS-5 -> UCA-1 -> H-1 -> L-1 (see Section 5.2.1, Section 5.2.3 and Section 5.2.4) is presented as an example.
The connections between unsafe system states needed to cover these two paths are as follows:
  • LS-5 -> UCA-1: This time value was determined to be equal to two times between “Rotate step x,y” control actions due to the sun movement of Table 4 This is the case because if the owner monitors the solar park right before a rotation of the arrays takes place, then it would take two consecutive movements of the arrays for someone to identify the discrepancy through the phone or PC app. So, the time value is t_(LS5 → UCA1) = 2.2 × 103 = 4.2 × 10³ s.
  • UCA-1 -> H-1: This value is considered the same as the execution time for the “Rotate step x,y” control action time constant of Table 4. So, the value is t_(UCA1→H1) = 4 s.
  • H-1 -> L-1: This time value was taken directly from the time constant of Table 4. The time between panels not being aligned perfectly with the sun and having a significant loss of production. So, it is t_(H1→L1) = 7.2 × 10³ s.

5.4. EWaSAP

As presented in Section 3.2, EWaSAP is applied after an STPA of the same system has been concluded. The EWaSAP was applied to the results of Section 5.2 and indicative results are shown in Table 4.
The first column of Table 4 presents the symbols representing the safety requirement (node) studied. The second column describes each safety constraint. In the third column, the sensory systems that should be linked to the controller to comprehend the violation of each safety constraint are described. The last column presents the signals (i.e., the data coming from the sensors) that indicate that the safety constraint has been violated during operations.
The awareness constraints resulting from the EWaSAP results shown above are presented below.
  • SC-63-EWaSAP-H-2: An array position sensor should be integrated into every array of the system.
  • SC-64-EWaSAP-H-2: A rotate step x,y CA listener should be integrated into the system’s PLC controller.
  • SC-65-EWaSAP-H-2: An alert awareness action should be provided when an array is rotated to its maximum angle and a rotate step x,y is provided.
  • SC-66-EWaSAP-H-3: An array position sensor should be integrated into every array of the system.
  • SC-67-EWaSAP-H-3: An anemometer should be integrated into the system.
  • SC-68-EWaSAP-H-3: An alert awareness action should be provided when all array positions are not horizontal while the anemometer registers strong winds (strong as referred to by the engineers)
  • SC-69-EWaSAP-UCA-1: The energy production graph should be shown in the app.
  • SC-70-EWaSAP-UCA-1: An accelerometer should be integrated into every array of the system.
  • SC-71-EWaSAP-UCA-1: An AI visual pattern recognition system using the feed from the security systems cameras should be integrated into the system.
  • SC-72-EWaSAP-UCA-1: A solar tracking sensor should be integrated into the system.
  • SC-73-EWaSAP-UCA-1: A rotate step x,y CA listener should be integrated into the PLC controller of the system.
  • SC-74-EWaSAP-UCA-1: A warning awareness action should be provided when the production graph declines over time.
  • SC-75-EWaSAP-UCA-1: A warning awareness action should be provided when one or more arrays are out of alignment with the rest of the arrays.
  • SC-76-EWaSAP-UCA-1: When all arrays are out of alignment with the sun’s position, a warning awareness action should be provided (visual check or solar tracking sensor).
  • SC-77-EWaSAP-UCA-1: When the accelerometer indicates that an array has not moved in a while, a warning awareness action should be provided.
  • SC-78-EWaSAP-UCA-1: A warning awareness action should be provided when the rotate step x,y CA is not provided for some time.
  • SC-79-EWaSAP-UCA-6: A rotate step x,y CA listener should be integrated into the system’s PLC controller.
  • SC-80-EWaSAP-UCA-6: The energy production graph should be shown in the app.
  • SC-81-EWaSAP-UCA-6: An AI visual pattern recognition system using the feed from the security systems cameras should be integrated into the system.
  • SC-82-EWaSAP-UCA-6: A array position sensor should be integrated into every array in the system.
  • SC-83-EWaSAP-UCA-6: A warning awareness action should be provided when the rotate step x,y CA is provided (the arrays are in alignment with the sun’s position (visual check)), or the production graph shows no discrepancies or that all arrays are in sync (position sensor).

5.5. Calculations in Real-Time

An example of the calculation of the safety level using the fuzzy RealTSL mathematical model is provided below.
The path that will be the focus of this example is p: S5 -> UCA1 -> H-1 -> L-1. The descriptions of the unsafe system states comprising this path as well as the safety and awareness constraints for each node are shown in Table 5.
The time steps for path p are shown in Section 5.3 as well as the rationale behind their definition. The RealTSL acyclic diagram only for path p is shown in Figure 10.
The degrees of confidence for each node of path p are determined by whether the safety and awareness constraints covering each node are present in the system or not (shown as 0 = not present in the system, 1 = present in the system). The process of determining the degrees of confidence is shown below:
The degree of confidence for L-1 is a = 0.
The constraints for H-1 are as follows:
  • SC-1-H-1, this constraint is not in place (SC-1-H-1 = 0).
  • SC-54-EWaSAP-H-1, this constraint is not in place (SC-54-EWaSAP-H1 = 0).
  • SC-55-EWaSAP-H-1, this constraint is not in place (SC-55-EWaSAP-H1 = 0).
  • SC-56-EWaSAP-H-1, this constraint is not in place (SC-56-EWaSAP-H1 = 0).
  • SC-57-EWaSAP-H-1, this constraint is not in place (SC-57-EWaSAP-H1 = 0).
  • SC-58-EWaSAP-H-1, this constraint is not in place (SC-58-EWaSAP-H1 = 0).
  • SC-59-EWaSAP-H-1, this constraint is not in place (SC-59-EWaSAP-H1 = 0).
  • SC-60-EWaSAP-H-1, this constraint is in place (SC-60-EWaSAP-H1 = 1).
  • SC-61-EWaSAP-H-1, this constraint is not in place (SC-61-EWaSAP-H1 = 0).
  • SC-62-EWaSAP-H-1, this constraint is not in place (SC-62-EWaSAP-H1 = 0).
So, the degree of confidence for H-1 is a = 1/10 = 0.1
The constraints for UCA-1 are as follows:
  • SC-5-UCA-1, this constraint is not in place (SC-1-UCA-1 = 0).
  • SC-69-EWaSAP-UCA-1, this constraint is in place (SC-69-EWaSAP-UCA-1 = 1).
  • SC-70-EWaSAP-UCA-1, this constraint is not in place (SC-70-EWaSAP-UCA-1 = 0).
  • SC-71-EWaSAP-UCA-1, this constraint is not in place (SC-71-EWaSAP-UCA-1 = 0).
  • SC-72-EWaSAP-UCA-1, this constraint is not in place (SC-72-EWaSAP-UCA-1 = 0).
  • SC-73-EWaSAP-UCA-1, this constraint is not in place (SC-73-EWaSAP-UCA-1 = 0).
  • SC-74-EWaSAP-UCA-1, this constraint is not in place (SC-74-EWaSAP-UCA-1 = 0).
  • SC-75-EWaSAP-UCA-1, this constraint is not in place (SC-75-EWaSAP-UCA-1 = 0).
  • SC-76-EWaSAP-UCA-1, this constraint is not in place (SC-76-EWaSAP-UCA-1 = 0).
  • SC-77-EWaSAP-UCA-1, this constraint is not in place (SC-77-EWaSAP-UCA-1 = 0).
  • SC-78-EWaSAP-UCA-1, this constraint is not in place (SC-78-EWaSAP-UCA-1 = 0).
So, the degree of confidence for UCA-1 is a = 1/12 = 0.083
The constraints for LS-5 are as follows:
  • SC-28-S5-UCA-1, this constraint is not in place (SC-28-S5-UCA-1 = 0).
  • SC-84-EWaSAP-LS-5, this constraint is not in place (SC-84-EWaSAP-LS-5 = 0).
  • SC-85-EWaSAP-LS-5, this constraint is not in place (SC-85-EWaSAP-LS-5 = 0).
So, the degree of confidence for LS-5 is a = 0
So, the degree of confidence for the path p is A = {a1, a2, a3, a4} = {0, 0.083, 0.1, 0}
Determining the fuzzy time remaining until the accident for y = 1   and   y = 2 . (See Section 3.2 for more information on the parameters that will be calculated below).
For y = 1 :
μ y = 1 · a 1 = 1 · 0 = 0
t + = 4.2 · 10 3 + 4 + 7.2 · 10 3 = 11.4 · 10 3   s
t f + = t + ± μ 1 m a x μ 1 μ 1 m a x · t + = 11.4 · 10 3 ± 11.4 · 10 3 = t f + = 11.4 · 10 3 , 11.4 · 10 3
x 1 = t + = 11.4 · 10 3   s
y 1 = 1 / 3
c 1 = 22.8 · 10 3   s
a 1 = 0
max t = 22.8 · 10 3   s
s 1 = y 1 · c 1 a 1 = 1 3 · 22.8 · 10 3 0 = 7.6 · 10 3
C P S t f + , y = 1 = x 1 · y 1 · max t s 1 = 5.8 · 10 7
For y = 2:
μ y = 1 · a 1 + 2 · a 2 = 1 · 0 + 2 · 0.083 = 0.166
t + = 4 + 7.2 · 10 3 = 7.2 · 10 3   s
t f + = 7.2 · 10 3 ± 3 0.166 3 · 7.2 · 10 3 = 7.2 · 10 3 , 6.8 · 10 3
x 2 = t + = 7.2 · 10 3   s
y 2 = y 1
c 2 = 1.4 · 10 4   s
a 2 = 400 s
max t = 22.8 · 10 3   s
s 2 = y 2 · c 2 a 2 = 1 3 · 1.4 · 10 4 400 = 4.5 · 10 3
C P S t f + , y = 2 = x 2 · y 2 · max t s 2 = 4.4 · 10 7
To identify the worst (in terms of safety) of the two fuzzy triangular membership functions, their CPS values are compared:
C P S t f 1 + > C P S t f 2 + t f 1 + > t f 2 + 3 & ( 4 ) p y = 1 < p y = 1

6. Concluding Remarks and Future Work

In this paper, fuzzy logic is introduced to the RealTSL methodology to address the data uncertainties resulting from the assumption of RealTSL that all the required sensors will be available, and their information will be transferred in real-time to enable the calculation of the safety level of systems during their operation, which in many cases is not realistic. Indeed, the measurement of the safety level of a system using the RealTSL methodology is not an easy task, as stated by [2], mainly due to the amount of hardware infrastructure (sensors, warning systems) that need to be in place in the system. By “breaking” this assumption, the applicability of the RealTSL methodology is increased, which is proven from the case study of this paper where for the first time RealTSL and the safety level of the system were assessed in real operating conditions, on an existing system that is used to optimize the generation of electricity in a solar park.
The proposed fuzzy RealTSL enables the calculation of the safety level of the system in real time depending on the number of sensors and warning systems that are already installed, by implementing the system level, controller and causal constraints derived from STPA as well as the awareness constraints by EWaSAP to assign a degree of confidence in the available information for each unsafe system state, reducing the data needed to be collected to calculate the system’s safety level. This reduction is achieved because, with fuzzy RealTSL, it is not mandatory to have all available sensors in place to monitor every possible state of the system to achieve a calculation for the system’s safety level. The time remaining until the accident is redefined using fuzzy logic and a fuzzy ordering is used to enable the ordering of the time remaining until the accident parameter. This in turn enables the ranking of sequences of unsafe system states according to how detrimental they are to the safety of the system in question. The increased applicability of fuzzy RealTSL was demonstrated in the case study of the whole methodology in the panel alignment system of a 15 KW solar park. The owner and developers of the system were quite impressed with the results of the analysis as this could increase the electricity production of the solar park. The developers calculated that if the PAS is experiencing losses, the output of the park can fall by up to 72%. This indicates that fuzzy RealTSL could significantly impact the potential profits generated by the system. The non-fuzzy version of the RealTSL methodology cannot be applied to the panel alignment system due to the lack of awareness constraints (sensors), as noted in Section 5.5, which make it impossible to calculate any safety level because there would be no information about the existence of potential unsafe system states in the system.
The strengths of the proposed fuzzy RealTSL are the greatly increased applicability of the methodology when compared to its non-fuzzy counterpart. Because a wider range of systems can be analyzed using this methodology, the ability to know what their safety level is can enable proactive risk management and enhance decision-making, potentially averting future accidents that could lead to loss of life, injuries, damage to equipment and other financial losses. Losses of the proposed methodology include an increased workload to produce an analysis using the methodology as additional parameters need to be determined as well as monitored during operation. This could also cause an increase in the data that need to be processed in order to achieve a calculation of the safety level; this could increase the computational power needed to produce a calculation of the safety level in real-time in more complex systems. The effect of the fuzzy RealTSL on the accuracy of the calculation is hard to determine when compared to the non-fuzzy version, as the non-fuzzy version cannot be used in as wide a range of potential systems. This effect should be studied more in the future to determine potentially a metric for how many sensors should be in place to maximise the accuracy of the calculations while minimizing the cost of introducing additional sensors in the system.
As future work, there is an on-going discussion to conduct a long-term (1 to 2 years) application of the fuzzy RealTSL on the panel alignment system to determine the potential increase in the productivity of the system in that time, while also setting up some warning notifications to the owner in case losses in production, or accidents are expected. Potential further future work ideas are the development of a software solution that could make larger scale applications of the methodology easier by combining a database of all unsafe system states, real-time recording of the appropriate information and calculation of the safety level as well as a user interface to empower system managers with information that can be generated by the methodology.

Author Contributions

Conceptualization, A.Z. and I.M.D.; methodology, A.Z., S.C. and I.M.D.; validation, A.Z., S.C. and I.M.D.; formal analysis, A.Z. and S.C.; investigation, A.Z. and S.C.; writing—original draft preparation, A.Z. and S.C.; writing—review and editing, A.Z., S.C. and I.M.D.; visualization, A.Z. and S.C.; supervision, I.M.D. All authors have read and agreed to the published version of the manuscript.

Funding

The authors acknowledge the financial support provided by the project “Methodologies for environmental planning of civil engineering projects” administered by the Research Council of DUTH (Project ID: 82809 PI: Prof AL Protopapas) funded by ETAA.

Institutional Review Board Statement

Not applicable.

Informed Consent Statement

Not applicable.

Data Availability Statement

The raw data supporting the conclusions of this article will be made available by the authors on request.

Acknowledgments

We would like to thank the “Charalampidis & Kostopoulos O.E.” company for providing access to the solar park that was used for the case study presented in this manuscript. We would also like to thank the “Technologiki E.E.”, developers and maintainers of the system, for providing their expertise on the system in question as well as feedback on the results of the case study.

Conflicts of Interest

The authors declare no conflict of interest.

References

  1. Knegtering, B.; Pasman, H. The safety barometer: How safe is my plant today? Is instantaneously measuring safety level utopia or realizable? J. Loss Prev. Process Ind. 2013, 26, 821–829. [Google Scholar] [CrossRef]
  2. Asgari, A.; Beauregard, Y. Using a Brain-Inspired Decision-Making System to Model a Real-Time Responsive Risk Assessment of the Dynamic Tasks Involved with Hazardous Materials. Safety 2022, 8, 45. [Google Scholar] [CrossRef]
  3. Zeleskidis, A.; Dokas, I.; Papadopoulos, B. Knowing the safety level of a system in real-time: An extended mathematical model of the STAMP-based RealTSL methodology. Saf. Sci. 2022, 152, 105739. [Google Scholar] [CrossRef]
  4. Leveson, N.G.; Thomas, J.P. STPA Handbook, 1st ed.; MIT Press: Cambridge, MA, USA, 2018. [Google Scholar]
  5. Dokas, I.M.; Feehan, J.; Syed, I. EWaSAP: An Early Warning Identification Approach Based on a Systemic Hazard Analysis. Saf. Sci. 2013, 58, 11–26. [Google Scholar] [CrossRef]
  6. Pelz, P.F.; Pfetsch, M.E.; Kersting, S.; Kohler, M.; Matei, A.; Melz, T.; Platz, R.; Schaeffner, M.; Ulbrich, S.; Kersting, S.; et al. Types of uncertainty. In Mastering Uncertainty in Mechanical Engineering; Springer International Publishing: Cham, Switzerland, 2021; pp. 25–42. [Google Scholar]
  7. Patriarca, R.; De Carlo, F.; Leoni, L. A System-Theoretic Fuzzy Analysis (STheFA) for systemic safety assessment. Process Saf. Environ. Prot. 2023, 177, 1181–1196. [Google Scholar]
  8. Bu, Y.; Wu, Y.; Li, X.; Pei, Y. Operational risk analysis of a containerized lithium-ion battery energy storage system based on STPA and fuzzy evaluation. Process Saf. Environ. Prot. 2023, 176, 627–640. [Google Scholar] [CrossRef]
  9. Pavlovic, B. Automated Control Flaw Generation Procedure: Cheakamus Dam Case Study. Master’s Thesis, The University of Western Ontario, London, ON, Canada, 2016. [Google Scholar]
  10. Borges, S.; Belderrain, M.; Junior, M.; Castilho, D. Integration of STPA and TOPSIS fuzzy methods for risk analysis in aerospace projects. Int. J. Decis. Sci. Risk Manag. 2022, 10, 212–226. [Google Scholar]
  11. Qiao, W.; Huang, E.; Guo, H.; Lian, C.; Chen, H.; Ma, X. On the causation analysis for hazards involved in the engine room fire-fighting system by integrating STPA and BN. Ocean. Eng. 2023, 288. [Google Scholar] [CrossRef]
  12. Zeleskidis, A.; Dokas, I. A fuzzy extension to the risk situation awareness provision indicator (RiskSOAP). Risk Anal. Based Data Crisis Response Beyond Knowl. 2019, 417–423. [Google Scholar] [CrossRef]
  13. Ross, T. Fuzzy Logic with Engineering Applications, 1st ed.; John Wiley & Sons: Hoboken, NJ, USA, 2009. [Google Scholar]
  14. Zadeh, L. Fuzzy sets. Inf. Control 1965, 8, 338–353. [Google Scholar] [CrossRef]
  15. Leveson, N. Engineering a Safer World: Systems Thinking Applied to Safety, 1st ed.; MIT PRESS: Cambridge, MA, USA, 2011. [Google Scholar]
  16. Bakar, A.S.A.; Gegov, A. Ranking of fuzzy numbers based on centroid point and spread. J. Intell. Fuzzy Syst. 2014, 27, 1179–1186. [Google Scholar] [CrossRef]
Figure 1. The classification of uncertainties by [6] and the literature of STAMP-based tools [7,8,9,10,11,12] regarding that classification.
Safety 10 00085 g001
Figure 2. RealTSL acyclic diagram derived from the results of an STPA analysis.
Safety 10 00085 g002
Figure 3. Time values (indicative values) assigned to the connections of the unsafe system states of the RealTSL acyclic diagram.
Safety 10 00085 g003
Figure 4. RealTSL acyclic diagram (indicative values) where the occurrence of the states is monitored using EWaSAP-derived sensor systems and real-time feedback.
Safety 10 00085 g004
Figure 5. RealTSL acyclic diagram (indicative values) where the safety level is calculated, and the sequences of unsafe system states can be ordered (most to least detrimental to safety).
Safety 10 00085 g005
Figure 6. Triangular fuzzy number with center r and range c.
Safety 10 00085 g006
Figure 7. Triangular fuzzy number (Ai = (ai,bi,ci)) with centroid (xi,yi) and center t+.
Safety 10 00085 g007
Figure 8. Picture of the solar park that is the focus of this case study.
Safety 10 00085 g008
Figure 9. Safety control structure of the PAS.
Safety 10 00085 g009
Figure 10. RealTSL acyclic diagram only for path p.
Safety 10 00085 g010
Table 1. Identified losses and hazards for the PAS using STPA.
A/ADescriptionLeads to
L-1Loss of production.N/A
L-2Loss of equipment or damagesN/A
L-3Loss of life or injury.N/A
H-1One or multiple arrays out of proper alignment.L-1
H-2Array rotating past component tolerance angle.L-2
H-3Minimum safe distance violation from the array by people, objects, or animals.L-2, L-3
H-4Non-horizontal array position during adverse weather conditions.L-2, L-3
SC-1-H-1All arrays should be simultaneously at the proper alignment at which the PV panels are producing maximum electric power at all times.H-1
SC-2-H-2The array motors should be unable to provide motion to the array when it has reached the limit of its possible rotationH-2
SC-3-H-3The array should be unable to rotate when the minimum safe distance between it and people, objects or animals has been violated.H-3
SC-4-H-4All arrays should be maintained simultaneously at the horizontal position when adverse weather conditions are taking place.H-4
Table 2. UCAs identified for the PAS.
Control ActionProviding CA Causes HazardNot Providing CA Causes HazardWrong Timing/Order of CA Causes HazardCA Stopped Too Soon/Applied Too Long
Rotate step x,y (PV park computer)UCA-6: When the array is positioned with proper alignment. [H-1, H-2, H-3, H-4]UCA-1: When the array is not positioned with proper alignment. [H-1]UCA-16: When it is provided after sunset leading to discrepancy at sunrise. [H-1]-
UCA-7: When maintenance staff are close to the array. [H-3]UCA-2: When maintenance on the arrays is taking place or is about to occur. [H-3]UCA-18: When it is provided simultaneously by two different controllers (either the astronomical algorithm and the PV park computer or by the owner and the phone/PC app). [H-1, H-2, H-3, H-4]
UCA-8: When cleaning of the PV panels is taking place on the array. [H-3]UCA-3: When a number of arrays are out of sync with the rest of the park. [H-1]
UCA-9: When the array is in the horizontal position and adverse environmental conditions occur. [H-3]
Rotate step x,y (astronomical algorithm)UCA-10: When the array is positioned with proper alignment. [H-1, H-2, H-3, H-4]UCA-4: When the sun has moved enough for the PV panels to not generate electricity optimally. [H-1]UCA-19: When it is provided too soon before the sun moves an adequate amount. [H-1]-
UCA-11: When maintenance staff are close to the array. [H-3] UCA-20: When it is provided too late after the sun has moved too far. [H-1]
UCA-12: When cleaning of PV panels is taking place on the array. [H-3]
UCA-13: When the array is in the horizontal position and adverse environmental conditions occur. [H-4]
HorizontalizationUCA-14: When maintenance is taking place or is about to take place. [H-3]UCA-5: When adverse weather conditions are taking place. [H-4]UCA-21: When provided simultaneously as the Rotate step x,y CA. [H-1, H-4]UCA-22: Applied too long when adverse weather conditions stopped taking place. [H-1]
UCA-15: When adverse weather conditions are not taking place. [H-1]
Table 3. Sample of the time constants used in PAS case study.
Time ConstantTime Value
Execution time for the “Rotate step x,y” control action.4 s
Time between “Rotate step x,y” control actions due to sun movement. According to the developers, the astronomical algorithm is designed to provide 20 “Rotate step x,y” control actions each day. Due to the change in daytime between winter and summer solstice, 2 time-values were derived for this time constant: 43 min and 18 s during summer solstice and 28 min and 18 s for winter solstice. For simplicity in this paper, the average between these two is used 35 min and 48 s, rounded to 35 min.35 min = 2.1 × 10³ s
Daytime similar to the time between “Rotate step x,y”; there are two time values for summer and winter solstice in the year 2023: 14 h 30 min, 9 h and 30 min.11 h and 40 min = 4.2 × 10⁴ s
Time between mandatory checks of the park by an individual. Through discussion with the system owner, it became apparent that there is a standard procedure in place that states that some individuals should check up on the system every 48 h at dawn. This was used in the same calculations accordingly.48 h = 1.72 × 10⁵ s
Time between panels not being aligned perfectly with the sun and having a significant loss of production. To quantify this parameter, a time value of 2 h was chosen. This means that one array would have to be out of optimal alignment with the sun’s position for 2 h for that to be considered a significant loss of production.2 h = 7.2 × 10³ s
Astronomical algorithm clock battery capacity. These values were taken from the battery’s specification documentation.70 years = 2.2 × 10⁹ s
Table 4. A sample of the EWaSAP analysis conducted for the PAS.
SymbolsDescriptionSensory SystemIdentifying Signs
H-2Tracker rotating past component tolerance angle.Tracker position sensor.
Rotate step x,y CA listener.
The tracker is rotated at its maximum angle and a rotate step x,y is provided.
H-3Non-horizontal array position during adverse weather conditionsTracker position sensor.
Anemometer.
All array positions are not horizontal while the anemometer registers strong winds (strong referred to by the engineers).
UCA-1The owner does not provide rotate step x,y when the array is not positioned properly.Visual check via video feed and AI recognition system.
Accelerometer.
Energy production graph.
Solar tracking sensor.
Rotate step x,y CA listener.
Production graph declines over time.
One or more arrays are out of alignment with the rest of the arrays.
All arrays are out of alignment with the sun’s position (visual check or solar tracking sensor).
The accelerometer informs that an array has not moved in a while.
Rotate step x,y CA is not provided.
UCA-6Rotate step x,y is provided by the owner when the array is positioned with proper alignment.Rotate step x,y CA listener.
Visual check via video feed and AI recognition system.
Energy production
tracker position sensor.
Rotate step x,y CA is provided.
Trackers are in alignment with the sun’s position (visual check).
Production graph shows no discrepancies.
All arrays are in sync (position sensor).
UCA-19Rotate step x,y is unsafely provided by the astronomical algorithm when it is provided too soon before the sun moves an adequate amount.Rotate step x,y CA listener.
Tracker position sensor.
Solar tracking sensor.
Rotate step x,y CA is provided.
Trackers were in alignment with the sun’s position and have not moved in the pre-set amount of time that it takes the sun to move to the position for a “rotate step x,y” CA to put it in the proper position.
UCA-1: Rotate step x,y is provided by the astronomical algorithm when the array is in the horizontal position and adverse environmental conditions are taking place. [H-1]
LS-5The owner does not have access to the phone/pc app and is in a remote location.Application listener for if the owner has checked the park.The owner has not checked the park through the app in a significant amount of time.
LS-7The owner does not have access to the phone/pc app and the temperature of the computer room, or the surrounding area is too hot; it may not be safe for the owner to manually adjust the arrays.Computer room and surrounding area thermometer, application listener for if the owner has checked the park.The owner has not checked the park through the app in a significant amount of time and the thermometer is showing dangerous temperatures.
UCA-6: Rotate step x,y is provided by the owner when the array is positioned with proper alignment. [H-1, H-2, H-3, H-4]
LS-16The camera is stuck showing the park in a previous time and the owner believes that the arrays are out of proper alignment.Camera feed timestamp cross checkCamera feed timestamp discrepancy with actual time.
UCA-19: Rotate step x,y is unsafely provided by the astronomical algorithm when it is provided too soon before the sun moves an adequate amount. [H-1]
The clock used by the astronomical algorithm runs out of battery causing the astronomical algorithm to provide erratic control actions.Astronomical algorithm clock battery sensorThe astronomical algorithm clock battery is empty
LS-19The clock used by the astronomical algorithm malfunctions causing the astronomical algorithm to provide erratic control actions.Astronomical algorithm clock operability cross checkThe astronomical algorithm clock is experiencing technical issues.
Table 5. Unsafe system states comprising path p.
NodeDescription of System StateSafety and Awareness Constraints
L-1Loss of production.N/A
H-1One or multiple arrays out of proper alignment.SC-1-H-1, SC-54-EWaSAP-H-1, SC-55-EWaSAP-H-1, SC-56-EWaSAP-H-1, SC-57-EWaSAP-H-1, SC-58-EWaSAP-H-1, SC-59-EWaSAP-H-1, SC-60-EWaSAP-H-1, SC-61-EWaSAP-H-1, SC-62-EWaSAP-H-1
UCA1Rotate step x,y is provided by the astronomical algorithm when the array is in the horizontal position and adverse environmental conditions are taking place.SC-5-UCA-1, SC-69-EWaSAP-UCA-1, SC-70-EWaSAP-UCA-1, SC-71-EWaSAP-UCA-1, SC-72-EWaSAP-UCA-1, SC-73-EWaSAP-UCA-1, SC-74-EWaSAP-UCA-1, SC-75-EWaSAP-UCA-1, SC-76-EWaSAP-UCA-1, SC-77-EWaSAP-UCA-1, SC-78-EWaSAP-UCA-1
S5The owner does not have access to the phone/pc app and is in a remote location.SC-28-S5-UCA-1, SC-84-EWaSAP-LS-5, SC-85-EWaSAP-LS-5
Disclaimer/Publisher’s Note: The statements, opinions and data contained in all publications are solely those of the individual author(s) and contributor(s) and not of MDPI and/or the editor(s). MDPI and/or the editor(s) disclaim responsibility for any injury to people or property resulting from any ideas, methods, instructions or products referred to in the content.