Article

Manufacturing of a PET Filament from Recycled Material for Material Extrusion (MEX)

by
Maximilian Bustos Seibert
1,*,
Gerardo Andres Mazzei Capote
2,
Maximilian Gruber
3,
Wolfram Volk
3 and
Tim A. Osswald
2
1
TUM School of Engineering and Design, Technical University of Munich, 80333 Munich, Germany
2
Polymer Engineering Center, University of Wisconsin-Madison, Madison, WI 53706, USA
3
Chair of Metal Forming and Casting, Technical University of Munich, 85748 Garching, Germany
*
Author to whom correspondence should be addressed.
Recycling 2022, 7(5), 69; https://doi.org/10.3390/recycling7050069
Submission received: 6 August 2022 / Revised: 6 September 2022 / Accepted: 12 September 2022 / Published: 20 September 2022
(This article belongs to the Special Issue Advances in the Recycling and Processing of Plastic Waste)

Abstract

:
Due to its low cost and easy use, the use of material extrusion (MEX) as an additive manufacturing (AM) technology has increased rapidly in recent years. However, this process mainly involves the processing of new plastics. Combining the MEX process with polyethylene terephthalate (PET), which offers a high potential for mechanical and chemical recyclability, opens up a broad spectrum of reutilization possibilities. Turning used PET bottles into printable filament for MEX is not only a recycling option, but also an attractive upcycling scenario that can lead to the production of complex, functional parts. This work analyzes the process of extruding recycled PET bottle flakes into a filament, taking different extrusion screws and extrusion parameters into account. The filament is subsequently processed with MEX into tensile tests. An accompanying thermal, rheological and mechanical characterization of the recycled resin is performed to offer a comparison to the virgin material and a commercially available glycol modified polyethylene terephthalate (PETG) filament. The results show the importance of adequate drying parameters prior to the extrusion and the sensitivity of the material to moisture, leading to degradation. The recycled material is more prone to degradation and presents lower viscosities. Mechanical tests display a higher tensile strength of the recycled and virgin resin in comparison to the PETG. The extrusion of the used PET into a filament and the subsequent printing with the MEX process offers a viable recycling process for the discarded material.

1. Introduction

The continuous growth of the global population has led to a rise in the consumption of disposable goods, leading to copious increases in waste generation. As an example, 
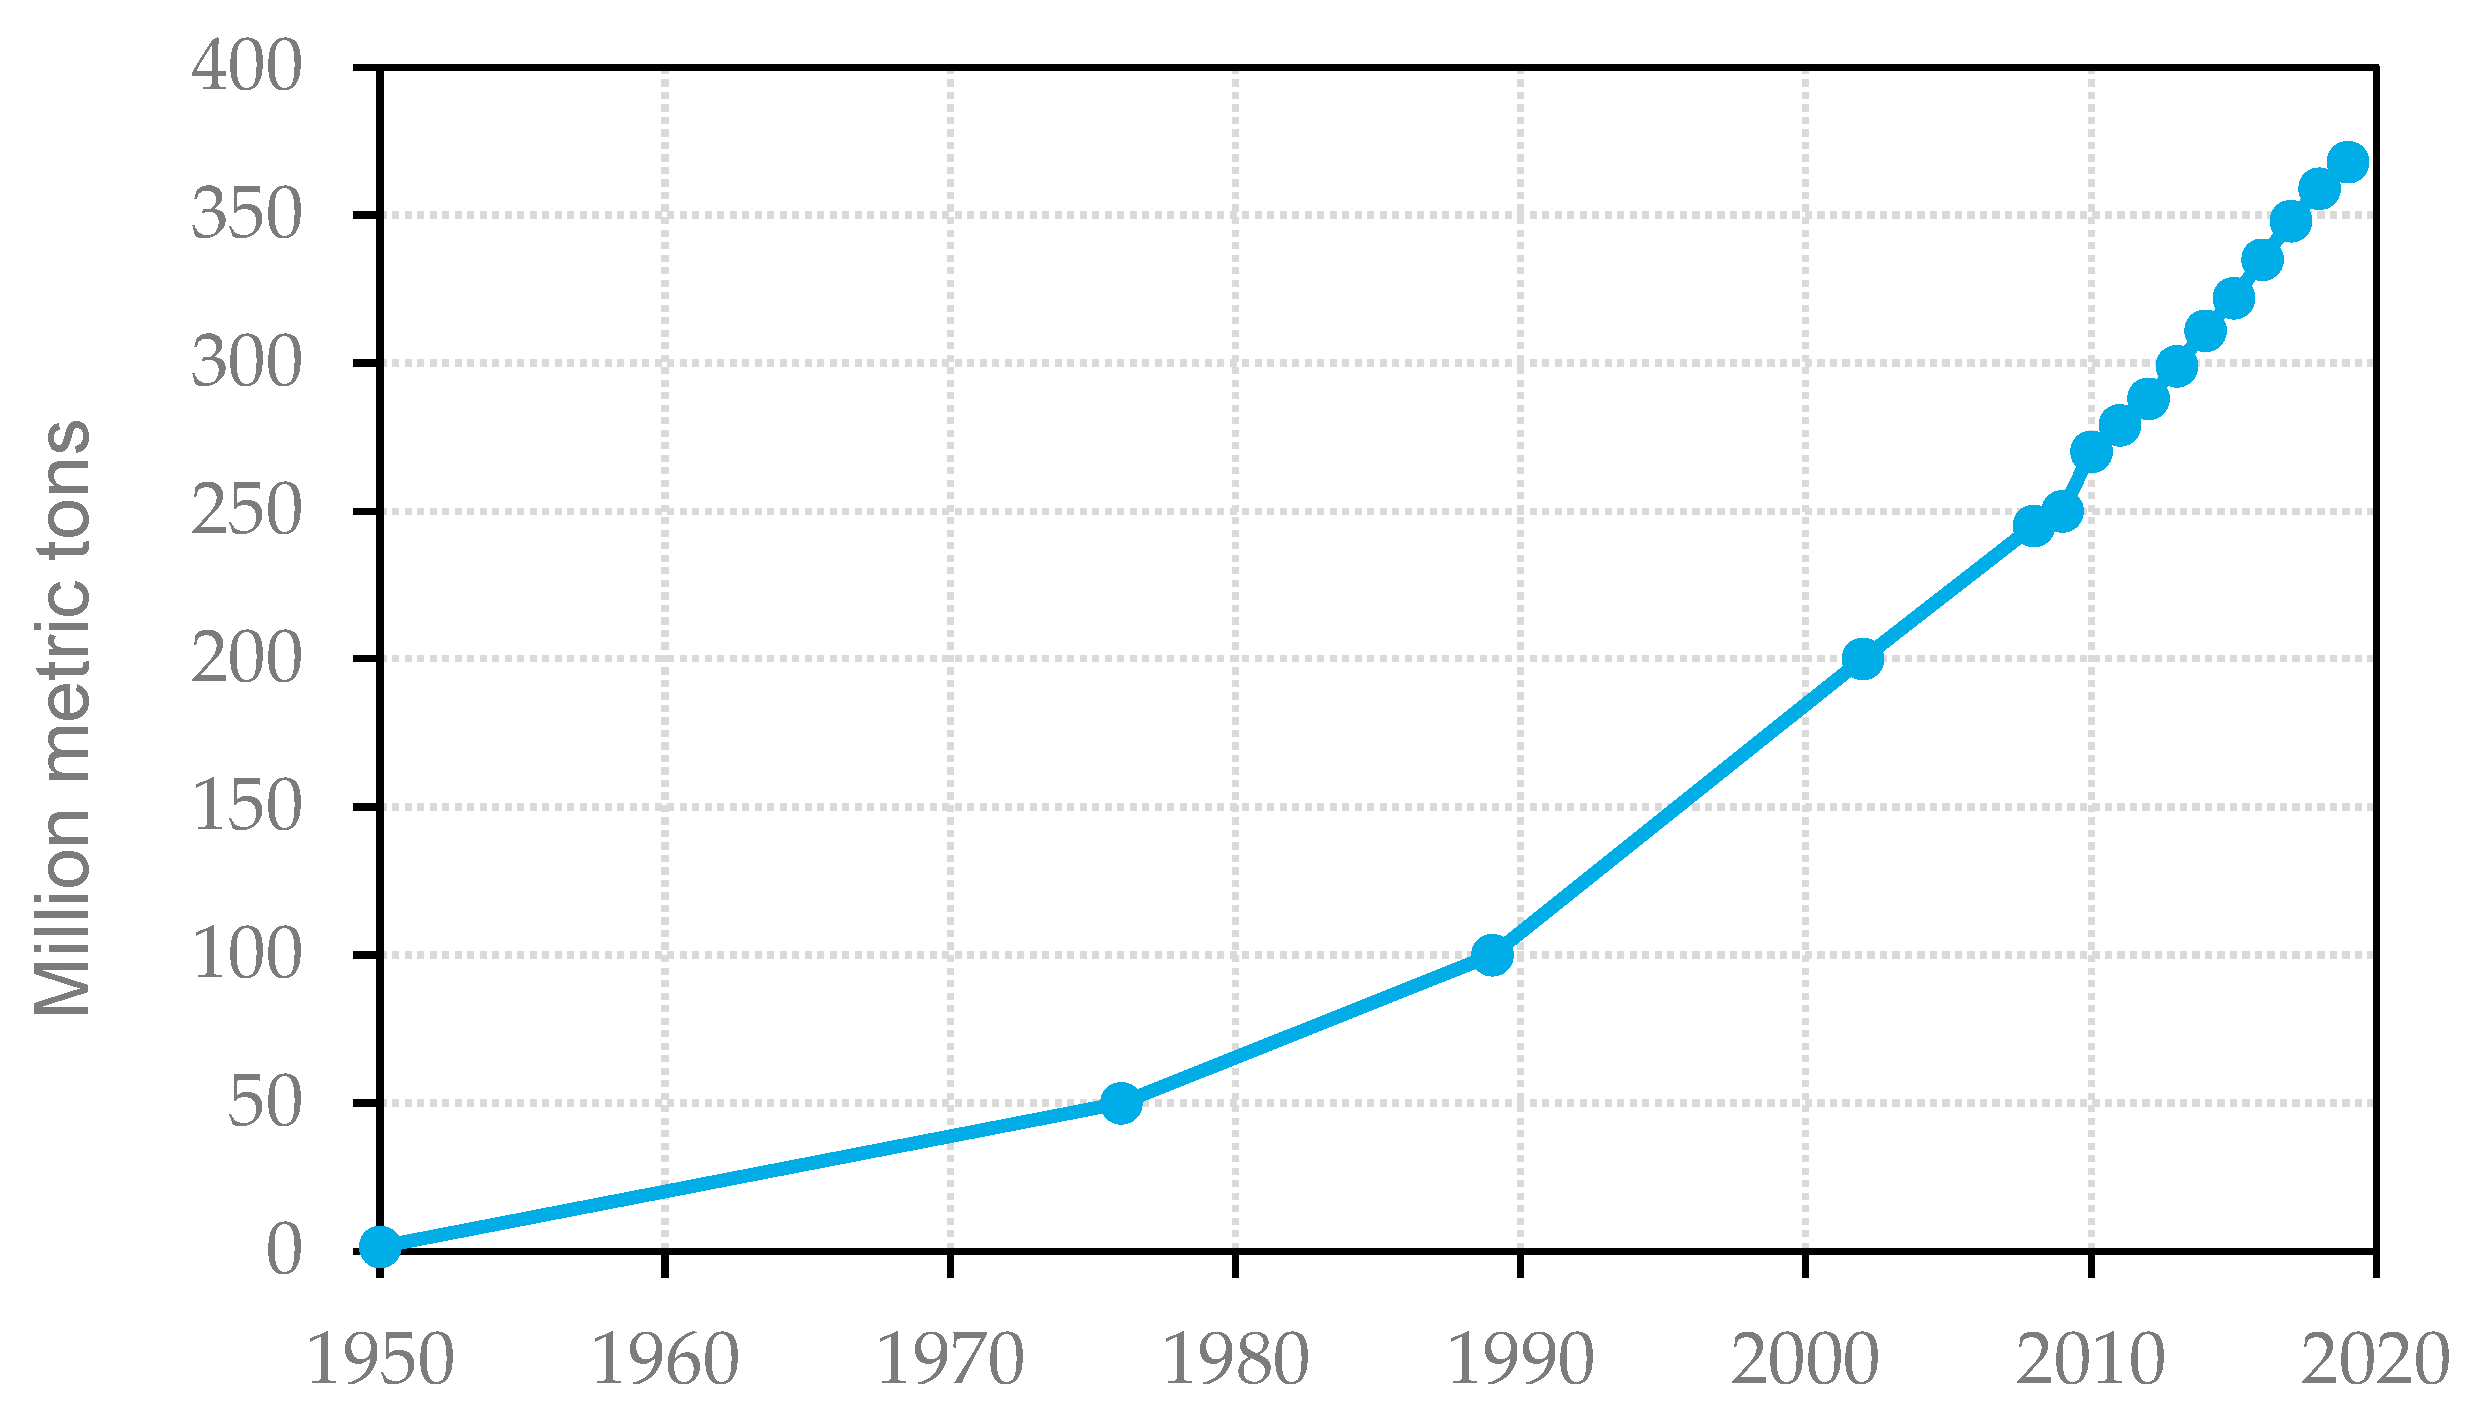
Figure 1 illustrates the worldwide volume in million metric tons of plastic production. Starting in 1950, the annual production of plastic was not relevant. After 1970, the amount of plastic manufacturing started to grow exponentially and reached a value of 270 Mt (million metric tons) in 2010 and more than 368 Mt in 2019 [1]. This represents a growth of more than 36% in the years between 2010 and 2019. In the case of Europe, which has one of the highest rates of plastic recycling worldwide [2], the production of plastic resin has reduced by 14% in the last 4 years, and the recyclability has gone up by 22% [3]. In the year 2018, out of the 61.8 Mt of plastics produced, 29 Mt was recollected as waste, out of which 9.4 Mt was recycled, 12.4 Mt was incinerated and the remaining 7.2 Mt ended up in landfills [3]. Comparing the recycling rates to the total production, only 15% of plastic was recycled, and compared to the collected waste, 32% was recycled. In other equally developed economies such as the United States of America, which do not have recycling regulations, plastic recyclability is around 10% [2]. These values demonstrate the potential for the improvement in polymer recycling.
In the case of the United States, 32.52 Mt of plastic waste was produced in 2017 [4]. Overall, 63% was either waste in the form of polypropylene (PP), low-density polyethylene (LDPE) or high-density polyethylene (HDPE). However, only 18% of this waste was recycled. Leaving the polypropylenes and polyethylenes aside, the fourth most commonly produced polymer in the United States was polyethylene terephthalate (PET), making up 14.4% of the total plastic waste. Out of this 4.7 Mt of PET waste, only 20% was recycled, leaving significant room for improvement [4].
PET is a polymer which offers multiple recycling options within mechanical and chemical recycling, and therefore has a high recyclability potential [5]. Mechanical recycling is the simplest and most low-cost way of reusing PET, as the process consists only of washing, drying and melt processing. However, due to multiple degradation processes, melt processing of mechanically recycled PET leads to a decrease in the molecular weight. This reduction is translated into a lower viscosity, which complicates the processing of the polymer melt [5]. Unlike mechanical recycling, chemical recycling is an option where the polymer chain of the recycled material is fully or partially depolymerized into its monomers and subsequently repolymerized into an equivalent of a virgin resin [6]. The most common processes for chemical recycling are glycolysis, methanolysis, hydrolysis, aminolysis and ammonolysis, and they depend on the reagent used for the depolymerization [7]. Slow production rates and cost-intensive processes are still some of the downsides of chemical recycling; however, the usage of new reaction catalysts and the implementation of microwaves or ultrasound waves as a heating source are improving the effectivity of the recycling process drastically [8].
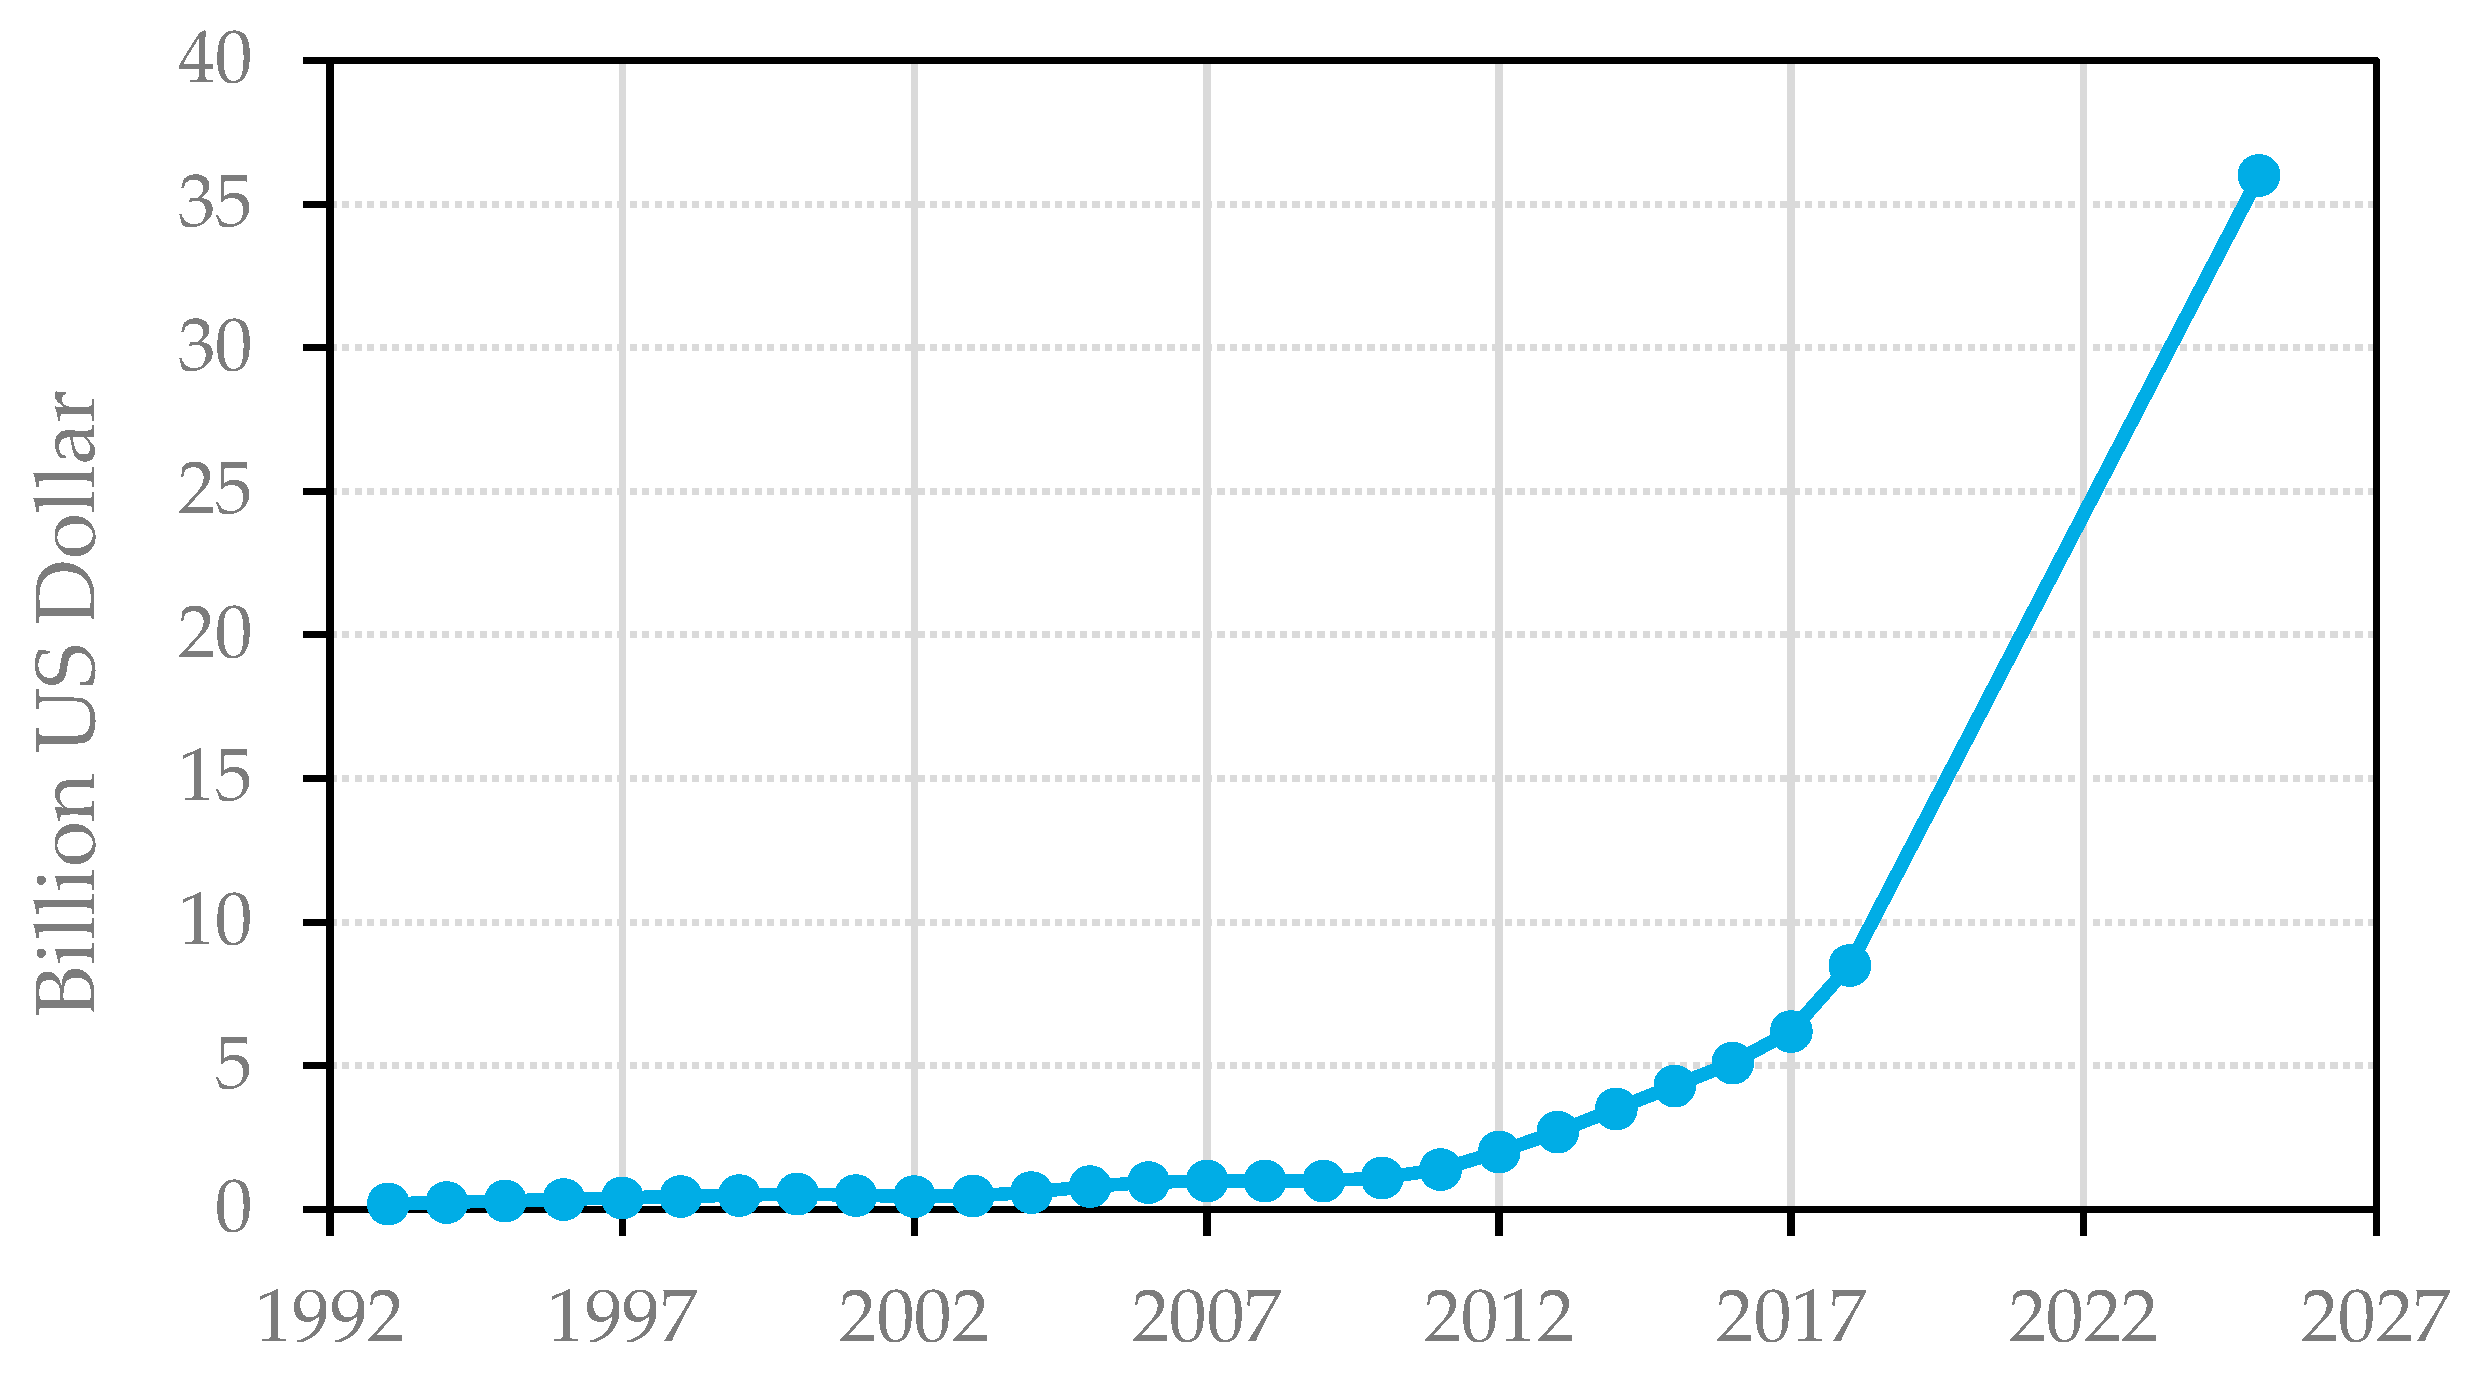
Similarly, the field of additive manufacturing (AM) has seen steady growth since its creation in the late 1980s, as illustrated in Figure 2, where the total revenues for services and products since 1993 are presented. Between 2012 and 2018, the AM market revenues improved by a factor of more than 8, and they are expected to keep improving until 2025 by a factor of over 36 [9]. AM techniques possess unique advantages, such as almost unrestricted geometrical options or the absence of molds, which is causing the field to be perceived as a viable mainstream manufacturing process [10]. Material extrusion (MEX), brought to the market in 1991 by Stratasys under the name fused deposition modeling (FDM), is one of the most widely used and well-known AM technologies. This process uses the extrusion of thermoplastic polymers to create three-dimensional parts. Since being introduced, the MEX process has become one of the most common, simple, and cost-effective AM processes in the industry [
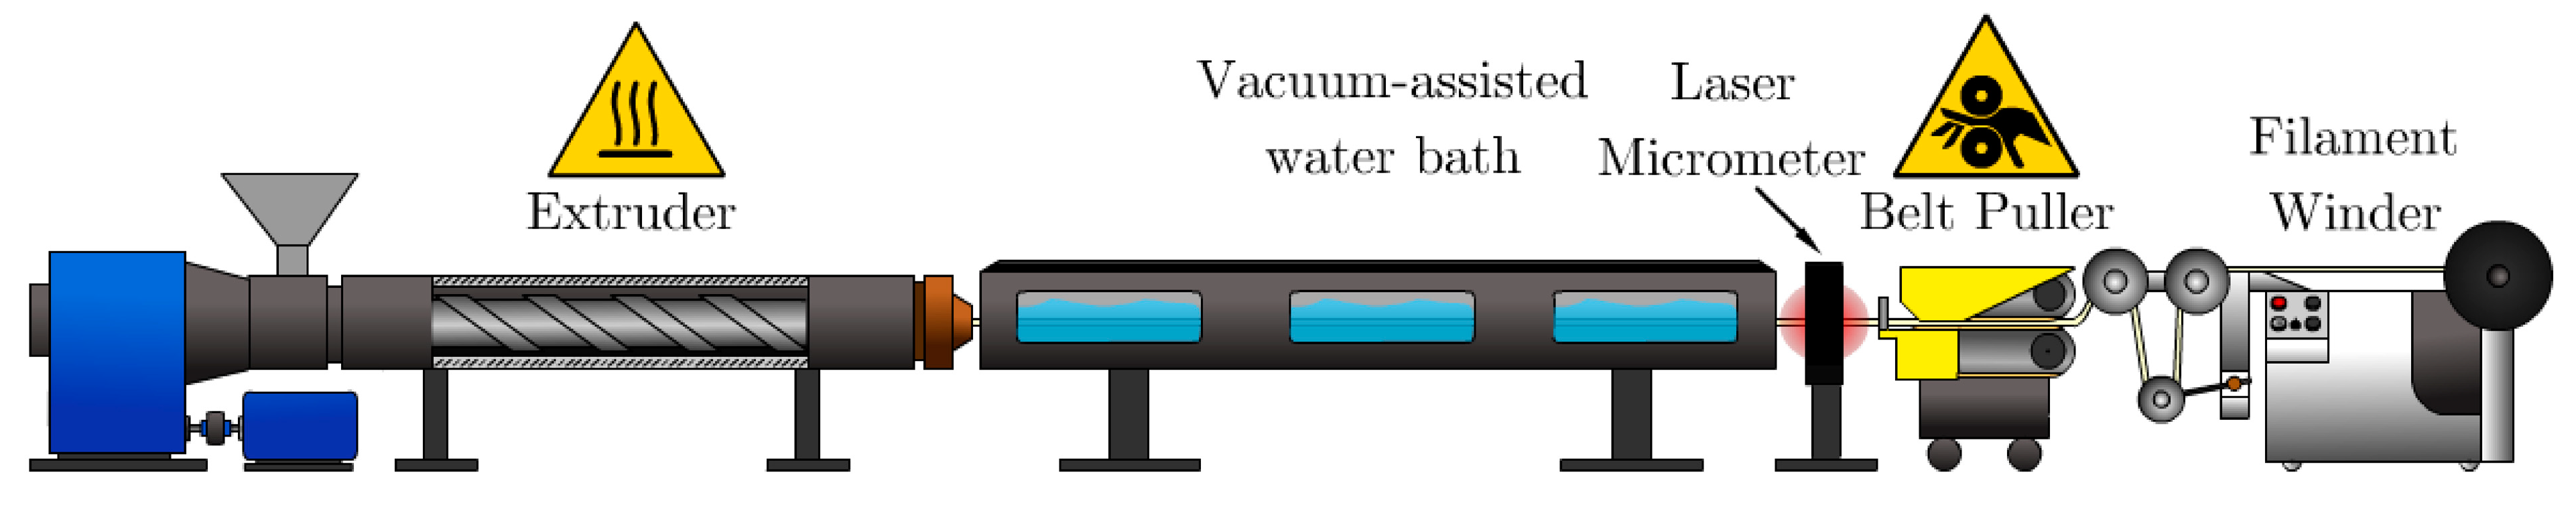
10]. The goal of this work is combining the high potential recyclability of PET with the AM market, specifically through the production of a MEX filament that can be used to produce functional parts. The mechanical recycling of PET and the subsequent extrusion of the recycled material into a filament for the MEX process are analyzed. Compared to the work completed by Zander et al. [11], where recycled PET is also used as feedstock for MEX, this work places emphasis on different aspects, such as the extrusion process with the importance of the extrusion screw and the extrusion parameters and also the procedures prior the extrusion, such as the influence of drying and the possible degradation of PET.

2. Background

2.1. Polyethylene Terephthalate

Polyethylene terephthalate is a semi-crystalline thermoplastic material created by the condensation of terephthalic acid and ethylene glycol. PET can be differentiated in three different classes: semi-crystalline PET (PET-C), amorphous PET (PET-A) and PETG, which is a glycol-modified PET with a higher impact resistance [12]. For the purposes of this work, PET-C, which is the PET used for this work, will be referred to from here onwards as PET for simplicity. One of the more ubiquitous uses for PET is the production of disposable thermoplastic bottles used in the beverage industry. These bottles are blown into shape by means of a process named injection stretch blow molding [13].
PET can be a difficult material to extrude, given its hygroscopic tendencies. In order to maintain a stable process, PET should be extruded with a moisture content below 0.02 wt.%. Recommended drying temperatures are around 120–150 °C for 4 h [12]. Studies present cases where the material is dried to a moisture content below 0.01 wt.% and subsequently exposed to air with a relative humidity of 50%. Within only 15 min, the material absorbs enough moisture to reach a content of 0.02 wt.%. Having this or higher contents of moisture in the material can lead to degradation and viscosity discontinuities during processing. Therefore, the PET needs to be processed immediately after drying [14]. To complicate matters further, tests conducted by Jabarin and Lofgren [15] showed that over-drying the material can result in material degradation. The atmosphere used to dry the material also plays a significant role in the final behavior of PET. Material dried in air for 25 h at 132 °C can have a mass loss of 2.5% after only 10 min during a degradation test in air at 280 °C. By comparison, a vacuum-dried material with the same parameters does not present any mass loss.
Processing temperatures and processing atmospheres also play a role. For undried samples tested above 325 °C in nitrogen and in air, the weight losses behave differently. After twenty minutes, the samples in the nitrogen atmosphere have a mass loss of up to 7% at 350 °C. Instead, in the air atmosphere, they have a mass loss even four times higher. This is due to the dependency of the formation of carboxyl end groups on oxygen. With the presence of oxygen, carboxyl end groups, which cause a random chain-scission, will appear faster [15]. Further analyses also show that formaldehyde and acetaldehyde, which are products of degraded PET, have a maximum development for a temperature of 280 °C, which means that this temperature is already critical for the degradation of PET, even in small time scales of less than two minutes [16]. Another result also shows that the chain ends are more prone to thermal and thermo-oxidative degradation than the inner parts of the chains. This causes PET with a lower molecular weight to degrade faster due to a larger number of chain ends [16]. Additional studies compliment the influence of oxygen and drying on PET and analyze the viscosity instead of the mass. At a temperature of 305 °C in a 100% oxygen atmosphere, PET can lose more than 53% of its viscosity after an hour. For an oxygen-free atmosphere, PET would only lose 10.7%. In the case of dried and undried material, the undried PET presents a starting viscosity at a temperature of 285 °C that is 21.9% lower than that for the dried material. The cause of this drastic reduction in viscosity is a virtually instantaneous hydrolysis of the material due to the water content [17]. To conclude, it can be said that the degradation due to hydrolysis of PET is increased with an increased moisture content. In contrast to this, thermal degradation is independent of the moisture content. However, the higher the temperature, the faster the degradation [18].

2.2. Extrusion of PET

PET can be extruded with single or twin-screw extruders. In the case of twin-screw extruders, the material throughput is dependent on the feeding rate and is therefore not purely controlled by the screw speed, as in single screw extruders. This dependency on the feeding mechanism leads to a less constant throughput, and is therefore not ideal for the extrusion of tightly tolerated filaments. However, this system proves ideal for mixing applications [14]. On the other hand, single screw extruders need special screw designs to extrude the material in a narrow processing window between 250 °C and 270 °C. Above these temperatures, PET will start degrading. For PET extrusion, barrier screws with grooved barrels in the feeding section prove to be of extreme utility for the process. They increase the friction coefficient between barrel and polymer and thereby improve the material conveying [19].
Furthermore, the feeding section should be cooled to a temperature of 50 °C. Higher temperatures will reduce the friction between the material and the barrel and therefore diminish the conveying of the polymer. On the other hand, lower temperatures can cause water condensation and, thus, a higher moisture content during processing. In order to obtain an ideal constant throughput, melt pumps are often used [12]. For PET extrusion, L/D screw ratios between 24 and 30, paired with compression ratios of 3–3.25, are recommended [14]. Due to the amount of volatile material in PET, most extruders are vented. After the maximum pressure is reached, the root of the screw reduces its diameter drastically and a vent is built into the barrel. Through this vent the volatiles exit the extruder and improve the throughput stability. Afterwards, the screw root increases its diameter to build up pressure again [19]. Studies even present vacuum venting extruders, which could be so effective at removing the volatiles and the moisture that the drying step can be skipped [20]. In order to enhance a homogenous melt, mixing components are used [21]. PET is a temperature-sensitive polymer, and for this reason, high shear stresses do not influence the viscosity as much as temperature does. Therefore, dispersive mixers cannot perform properly. Distributive mixers which separate and recombine the polymer melt present good results. Examples for this type of mixer are the Saxton, the Pin and the Pineapple mixing sections [14].

3. Experimental Methods

3.1. Filament Production

For the processes presented in this article, three different materials were used. In order to test the extrusion parameters and compare the properties of the recycled polymer, a virgin PET resin (vPET) named Cleartuf 8006C by M & G Chemicals (Luxembourg, L1855, Luxembourg) was used. This material was provided in pellet form. On the other hand, the recycled material came from used PET bottles collected in different regions of the U.S. and Mexico. The bottles were sent to EcoStar, a subdivision of Placon, a polymer processing company in Madison, WI, USA. They sorted, shredded and washed the containers. The washing was completed with a water solution containing 5% sodium hydroxide at a temperature of 80 °C. The recycled bottle flakes were subsequently provided to us along with the vPET. To compare the printing and mechanical properties of the materials, a third material was used, namely a PETG filament by MatterHackers (Valencia Cir, CA, USA) with a filament diameter of 2.85 mm.
For the extrusion of the recycled resin filament, the provided flakes were fed into the extruder as a parent material. The extrusion process was initially divided into two. In the first step, the flakes were extruded into pellets using a twin-screw extruder. In the second step, the produced pellets were used as feedstock for the final filament production in a single screw extruder. These processes were performed with a Leistritz ZSE 27 (Nuremberg, Germany) co-rotating twin screw extruder with a screw diameter of 27 mm and an L/D of 36. This extruder had four mixing sections and a degassing one. The room dried flakes were fed by hand into the extruder, as the size of the received flakes had high variations and no automatic feeding mechanism could be used. The first two zones were set at a temperature of 200 °C. The next 5 zones were set at 235 °C. The last zone, equal to the die, was set at 245 °C. The extrudate exited the machine through a die with three nozzles, each one having a diameter of 3.0 mm and entered a 6 m-long water bath with room temperature water. The pellets were cut as the filament was conveyed past the water bath towards a granulator. The pellets had a cylindrical shape with an average length and diameter of 4 mm and 2 mm, respectively, as shown in Figure 3.
The produced pellets were firstly extruded using a single screw EDN 45X30D extruder by Extrudex (Mühlacker, Germany). This extruder had a three-zone screw with a diameter of 45 mm and an L/D ratio of 30. However, this extruder had a smooth barrel, and the screw design was not convenient for the PET extrusion. Even though the single screw was better suited for the filament extrusion, the poorly designed screw was not ideal for extruding PET and melt plugs were generated consistently. For this reason, the extrusion process to produce the filament used in the subsequent printing and testing was performed exclusively with the twin-screw extruder. The produced pellets were dried at a temperature of 150 °C for 4 h in an NWB-75 Dryer by Novatec (Baltimore, MD, USA) reaching a moisture content of 0.009 wt.%. The material was fed into the twin-screw extruder using a single screw Mechatron Feed System by Schenck Process, set to a feeding rate of 6.5 kg/h. The feeder was refilled every 15 min. For the extrusion of the filament, the temperatures of the extruder were raised as seen on Table 1. The die was changed to a single-hole die with a diameter of 2.7 mm. With these temperatures and an extrusion speed of 80 rpm, the melt temperature at the head was 264 °C. After the material left the extruder, it entered a MT-104 Vacuum Sizing Tank by Conair (Cranberry Twp, PA, USA), divided into four sections. The temperature of the different sections was controlled externally by a Thermolator TW-V by Conair (Cranberry Twp, PA, USA). The first section cooled the filament down with a water temperature of 65 °C. The second one was set at 50 °C and the third one at 40 °C. The last section had an air-blowing ring which removed excess water. The water bath was followed by a Triton 331 Laser Micrometer by Laserlinc (Fairborn, OH, USA). This tool measured the outer diameter of the filament with the help of three laser beams. In combination with the Total Vu-Software, the average diameter, the ovality, the length and the puller speed could be displayed. The next device was a Precision Series Belt Puller by Conair (Cranberry Twp, PA, USA). This tool played an important role in determining the form of the filament, because the pulling speed determined the outer diameter of the filament. Finally, a filament winder collected the material. A scheme of the different segments is shown in Figure 4.

3.2. Rheology

With the intention of describing the flowability of the polymer melt, the first experiment conducted was the Standard Test Method for Melt Flow Rates, as presented in [22]. For this test, a Tinius Olsen MP 987 Extrusion Plastometer (Salfods Surrey, England) was used. Preliminary to the test, the PET was dried for 5 h at a temperature of 140 °C. The test was carried out at a temperature of 265 °C with no inert atmosphere. A mass of 8.0 g was used for the sample and the testing load was 2160 g. For each condition, five samples of each material, including vPET, rPET and PETG, were measured using the procedure in [22].
A further rheological test included was the relaxation test, used to illustrate the shear stress τ and the relaxation time λ of the different materials. This test was conducted following the standards of ISO 3384-1 [23]. The experiments were performed with an AR 2000ex Rheometer from TA Instruments (New Castle, DE, USA) at normal atmospheric conditions. The materials tested were pellets of either the vPET or rPET after being extruded once into a filament. This means that in the case of the vPET, it had been processed once; from virgin resin to extruded filament. In the case of rPET, it had been processed at least three times. Transformed from virgin resin into a bottle, the bottle flakes were then extruded into the small pellets, and these were subsequently extruded into the filament. As the relaxation time is mainly needed as a parameter for the extrusion, no measurements were performed with PETG. The pellets were dried for 5 h at 140 °C and placed between two parallel plates with a diameter of 25 mm and a gap distance of 1 mm. Then, the sample was heated until reaching the testing temperature. After having stabilized the testing temperature of 280 °C, one of the plates turned and sheared the material in order to reach the described strain of 0.007. The plate was turned in 0.01 s. The relaxation time can be measured after 1% of the maximal shear stress τmax is reached.
With the same rheometer and materials, an oscillation test was conducted in order to get the complex viscosity |η*| curve of the materials. This test was conducted following the standards of ISO 6721-1 [24]. Gap and testing temperature were equal to those described for the relaxation test, but the shear strain of each oscillation was changed to 0.002. The frequency range started at 1 Hz and ended at 100 Hz.

3.3. Thermal Characterization

The first thermal test conducted was the thermal gravimetric analysis (TGA). The TGA was performed with a TG 209 F1 Libra by NETZSCH (Selb, Germany). The sample was heated up to a temperature of 280 °C at a rate of 75 K/min. This rapid heating rate was used to recreate the fast heating of the material while being extruded. Afterwards, the temperature was held constant for 60 min. The plateau was set at the maximum temperature used in the extrusion process with the aim of analyzing the possible degradation of the PET. After the hour had passed, the material was heated up to 800 °C at a rate of 20 K/min with the purpose of burning the material. Tests were conducted with an oxygen and nitrogen atmosphere to assess oxidative and non-oxidative degradation processes. The procedure during testing was as presented in ISO 11358 [25]. Specimen masses of approximately 10 mg were used. Only one representative sample is presented.
As a second part of the thermal analysis, differential scanning calorimetry tests (DSC) were performed. For these measurements, a DSC 214 Polyma by NETSCH (Selb, Germany), with nitrogen as a purge gas, was used. In order to analyze the crystallization and melting temperatures of the polymer, heating rates of 10 K/min and maximum temperatures of 300 °C were used. The crystallinity α was then calculated using the equation below (1). In this case, Δ H m 0 was the literature value for the heat of fusion of a 100% crystalline material, which for PET is 140 J/g, and ∆Hm was the experimental heat of fusion. As for the glass transition temperature, a heating rate of 20 K/min and a maximum temperature of 120 °C were used [26]. The procedure during testing was as presented in ISO 11357-1 [27]. Only one representative sample is presented.
α = Δ H m Δ H m 0 × 100

3.4. Sample Printing

The LulzBot TAZ 5 (Fargo, ND, USA) was used to produce printed samples. Three different materials were printed: a filament produced using only virgin resin (vPET), a filament made using recycled material (rPET), and a Translucent Red Pro Series PETG 2.85 mm filament by MatterHackers, selected as a commercial benchmark material. Type I ASTM D638 tensile test specimens [28] were printed to test the mechanical properties of the printed parts. Printing conditions, as presented on Table 2, were the same for all materials to ensure proper comparison of the performance of the different materials. Two prints were conducted for each bead orientation of 0° and 90° with respect to the loading direction in order to test the adhesion between the layers and the polymer properties of the three materials. Each print included five coupons. Each coupon was fully printed without the use of skirts or wimping towers. The filament diameter tolerances for this machine were 2.825 mm and 2.875 mm.

3.5. Mechanical Testing

With the aim of comparing the mechanical properties of the vPET, rPET and PETG, Type I dog bones as described in [28] were printed. The specimens were tested with an Instron 5967 dual column universal testing machine by Instron (Norwood, MA 02062, USA). A 30 kN load cell was used and the testing speed was 5 mm/min. The strain was measured by an extensometer and the data were evaluated with the accompanying software Instron Bluehill Version 3 (Norwood, MA, USA). For each material in each direction, at least five samples were tested.

4. Results

4.1. Extruded Filament

Multiple filament extrusions at different speeds and temperatures were conducted. Figure 5 presents the best extrusion result with the parameters explained in Section 3.1. The graph shows that for a length of 110 m, 81.8% of the average outer diameter ODavg was between the tolerances used for printers in the MEX process. In the case of the ovality OD, which is calculated from the difference between the outer diameter’s major and minor axis ODmax and ODmin, 100% of the data laid underneath the tolerance of 0.06 mm. The recycled filament presented in this figure is the rPET used for the remaining printing and testing during this project. Low ovality values were reached with a cooling temperature in the water tank above 60 °C. Temperatures underneath led to ovality values above 1 mm.
The ovality is a result of the relative low viscosity of the molten resin, where gravity causes the resin to flow and flatten the filament, before exiting the die and just before entering the cooling bath. This causes the filament to acquire an elliptical cross-section, where the horizontal dimension is the major axis and the vertical dimension is the minor axis of the elliptical shape. The only mechanism competing with the forces of gravity is the surface tension effect, which tends to force the filament into a cylinder in order to reduce the surface area, consequently minimizing surface energy. The gravity effect is basically eliminated by buoyancy forces when the filament enters the water bath. A cool water bath rapidly reduces the temperature of the filament, freezing the ovality in place and not allowing surface tension to return the filament into its cylindrical shape. However, a hot water bath gives surface tension more time to force the filament back into its circular cross-sectional shape.

4.2. Rheological Results

The results of the Standard Test Method for Melt Flow Rates are analyzed. Figure 6 shows the MFI for dried and undried vPET, dried rPET and dried PETG. For each condition, at least five samples were tested. The different flowability values are presented in Table 3. The dried vPET, which had a moisture content of 0.0116 wt.%, had the lowest MFI. Second was the dried rPET, with a moisture content of 0.0156 wt.%, followed by the PETG and the undried vPET, with a moisture content of 0.2733 wt.%. These last two cases presented results in the same region, which meant that their flowability was similar. PETG had a median line at 47.6 g/10 min and the undried vPET at 46.5 g/10 min. PETG and rPET could only be measured after drying, as in the undried tests the viscosity was too low and the residence time of the material in the cylinder was too short. The outcome of the experiment showed the importance of drying the material prior to processing. Using the vPET as an example, the MFI between the dried and undried material presented a difference of more than 2.5 times.
The results of the relaxation test are shown in Figure 7. The test was conducted with one dried and one undried sample of each virgin and recycled PET. The same vPET and rPET used for the MFI, with the measured moisture content, were used for the following rheological tests. However, the specimens had to be carried to a different laboratory, which likely influenced the moisture content. This influence could not be quantified prior to testing. The values of the relaxation test are presented in Table 4. As it can be seen, the dried vPET reached the maximum shear stress, followed by the dried rPET and then the two undried samples. This was caused by the moisture of the material, which lowered the viscosity, as can also be seen in Figure 6. The relaxation time λ of three of the samples at a remaining shear stress τ of 1% laid between 0.06 s and 0.07 s. The only test which had a lower relaxation time was the undried rPET. As shown in the figure, the undried rPET behaved differently to the others and even had a negative value at around 0.01 s. Negative values during the test indicate that the plate slipped due to air bubbles between the sample and plate. Figure 8 shows an optical image of the undried rPET sample after the relaxation test. As can be seen, the specimen presented bubbles, possibly due to degradation. Having a lower viscosity in the rPET indicates an overall lower molecular weight distribution, which could correlate with the faster degradation due to shorter chains. The remaining samples presented a normal behavior which can be correlated to the MFI. This test was conducted with the aim of ensuring that the die has an adequate length for the material to relax and lose its rotational motion. With relaxation times of 0.07 s at most, the die geometry was appropriate and had a sufficient distance.
The results of the oscillation test are presented in Figure 9. As can be seen, the Newtonian plateau and the shear thinning region for all the samples were inside of the frequency region. The complex viscosity values of the oscillation test are presented in Table 5. Starting from top to bottom, the dried vPET presented the highest complex viscosity with 434 Pa s. The dried vPET was followed by the dried rPET and, with a lower but similar complex viscosity, the undried vPET. The lowest complex viscosity was shown by the undried rPET with 106 Pa s. However, the undried rPET test looked like the degraded sample shown in Figure 8, signaling once more the degradation of the material during testing. Due to the likely higher molecular weight number average of the vPET, the starting complex viscosity was higher than the rest. As alluded to previously in the MFI results, the dried rPET starting complex viscosity was higher than for the undried vPET. The shear thinning region was dependent on the material and the moisture content. For the dried vPET, the shear thinning region started at the lowest frequency. The dried rPET and the undried vPET had a shear thinning region which started at similar frequencies. The highest frequency was reached by the undried rPET. In order to validate the higher viscosity of the vPET in comparison to the rPET due to higher molecular weight, a true molecular weight analysis, for example a gel permeation chromatography, is needed.

4.3. Thermal Analysis

In the first part of the thermal analysis, the TGA curves of the isothermal degradation at 280 °C were analyzed. It can be seen in Figure 10 that the samples measured in a nitrogen atmosphere behaved almost identically in the isothermal region. The rPET lost only 0.25% of its mass after the isothermal plateau was over, and the vPET lost even less, with only 0.2%. On the other hand, both materials behaved differently in the oxygen atmosphere. rPET lost its first 1% of mass after 54 min and 1.2% after the isothermal plateau ended. In comparison, vPET lost its first 1% of mass after 33 min and when the isothermal step ended, it lost around 2.7%. All four samples started degrading with the same rate and at the same time until the atmosphere and the pyrolytic carbon content started to play a role. As it can be seen, a temperature of 280 °C can already be critical for the material in all its variations. In order to analyze the pyrolytic carbon content, another TGA test is conducted.
In order to analyze the pyrolytic black carbon content, the test was conducted entirely under a nitrogen atmosphere. The heating curve and the gravimetric changes are presented on Figure 11. After 38 min, the remaining mass, equal to the pyrolytic black carbon content, of the vPET was 14.9% and 15.0% for the recycled one. As for the onset temperature, where the material degradation started, the rPET started first at a temperature of 374 °C and the virgin material at a temperature of 378 °C. For the rest of the curve, both samples behaved almost equally.
Figure 12 displays the results of the second heating and cooling cycle of the DSC measurement. The first results were obtained with a heating and cooling rate of 10 K/min. The light blue curves represent the virgin PET and the pink curves represent the recycled PET. Both materials showed a similar behavior. The heating cycle is represented by the lower curves, which show endothermic behavior, and the cooling cycle by the upper ones, which show exothermic behavior. The results of the second heating cycle are presented in Table 6. Taking the form and the size of the curves into account, the lamellar thickness distribution of the crystallites could be characterized. At the melting onset temperature, the polymer started melting, which in the case of the semi-crystalline PET meant that the thinner or less perfect crystallites began to melt. At the melting end temperature, none of the crystallites were in a solid state. However, it could be seen that the difference between the onset and the melting end temperature of the rPET was greater than for vPET. The difference was 50 °C for the rPET and 47 °C for the vPET. As a result, the lamellar thickness distribution for the rPET was broader than for vPET. In the case of the cooling cycle, the onset temperature showed the moment where the samples started to become crystallite solids. Both cases had very similar onset temperatures. They were 202 °C for rPET and 200 °C for vPET. The maximum crystallization rate was at the peak of the curve and was at 186.1 °C for the rPET and 181.1 °C for the vPET.
Figure 13 shows the second heating cycle of a DSC measurement at 20 K/min. This measurement helped to determine the glass transition region. Transitions in the heat flux were more pronounced due to the faster heating rate. In the case of the rPET, the onset temperature for the glass transition region started at 77 °C with a significant drop in the slope of the curve and ended at a temperature of 87 °C with a local maximum of the curve. In this region, the material started changing from its energy-elastic state into an entropy-elastic one. The virgin resin had the same onset temperature at 77 °C, but its end temperature was one degree lower than that of the recycled resin, at 86 °C.

4.4. Mechanical Testing Results

Figure 14 illustrates the coupons which were printed with a 0° bead orientation. The virgin and recycled resin presented a high scattering of the results; therefore, only two representative outcomes with the highest tensile strengths were demonstrated for each material. The remaining coupons presented high scattering mostly due to a breakage outside of the narrow measuring section. These results are presented separately on a further Figure. The elastic modulus (E-modulus) and the tensile stresses are presented in Table 7. Each print manufactured five tensile coupons. Two prints were conducted for each material in each direction. Each coupon was fully printed before the nozzle moved to the subsequent position and started with a further coupon. The highest tensile strength and highest E-modulus were displayed by vPET 0°_p2_2. In this case, the number 2 means that the coupon was printed secondly during the second print (p2). This sample had a maximum tensile strength of 56 MPa and an E-modulus of 1920 MPa. The fracture was brittle. The second coupon of vPET (vPET 0°_p3_4) had a lower tensile strength and E-modulus. The difference from the first sample was that this one had a ductile fracture. The rPET behaved in a similar way and presented samples with brittle and ductile fractures. Both samples had comparable tensile strengths of 53 MPa. Illustrated by the yellow line is the PETG, which showed the lowest values in the test. With a tensile strength of 45 MPa and an E-modulus of 1360 MPa, it was clearly inferior to the virgin and recycled PET. Due to the different types of breakage, samples with a large elongation before breakage are analyzed in a further figure. For the samples shown, the maximum strain was 9%.
The test coupons with a bead orientation of 90° are presented in Figure 15. All samples displayed a brittle breakage and a low scattering in comparison to the samples at 0°. Therefore, only one coupon of each material is shown. Comparable to the last figure, vPET presented the highest tensile strength, and even though the bead orientation was changed to 90°, the maximum strength was 52 MPa, only 8.8% lower than with 0°. The E-modulus, presented together with the shear stresses in Table 8, was 1950 MPa, higher than that at 0°. The results of rPET and PETG were not comparable to those at 0°, nor with the vPET. In the case of the rPET, the maximum strength was 33 MPa, which was 37.7% lower than the strength at 0°. Although the strength was lower, the E-modulus was 2000 MPa, making it 16.7% higher. PETG again presented the lowest values. Having only 53.3% of the tensile strength observed in the test at 0°, the PETG presented the largest difference due to orientation. Possessing a filament dimensional accuracy of 0.02 mm, the PETG should have had the least fluctuations due to filament size. This led to the conclusion that the PETG had the poorest interlaminar strength. The maximum strain reached by the samples was around 3%.
Some of the samples with 0° bead orientation presented a ductile fracture with large elongations. These results are illustrated in Figure 16. The samples showed more noise during the testing; this was due to the slippage of the extensometer on the elongating sample. The E-modulus was for the two presented samples lower than those represented in Table 7. For the rPET, the E-modulus was around 1560 MPa, and for the vPET, it was around 1680 MPa. However, the maximum tensile strengths were similar to the ones with a lower breakage strain. In the case of the rPET, it was 50 MPa, which was only 5.6% lower, and for vPET it was 53 MPa, making it only 5.4% lower. With regard to strain, these samples presented a clear tapering of the narrow section and elongations of 38% in the case of the rPET and 52% in the case of vPET. PETG behaved similarly, but the tapering regions were always outside of the extensometer’s measuring region and therefore could not be considered.
The samples printed with our own extruded filament presented large fluctuations during tensile testing, in comparison to the existent PETG filament. This was possibly due to the fluctuations in the diameter size during the filament extrusion. A clear statement about which PET presented the best mechanical properties cannot be established, since the vPET presented higher results, but also fewer fluctuations during extrusion in comparison to the recycled one. A clear image of the deviation is seen in Figure 17.

5. Discussion

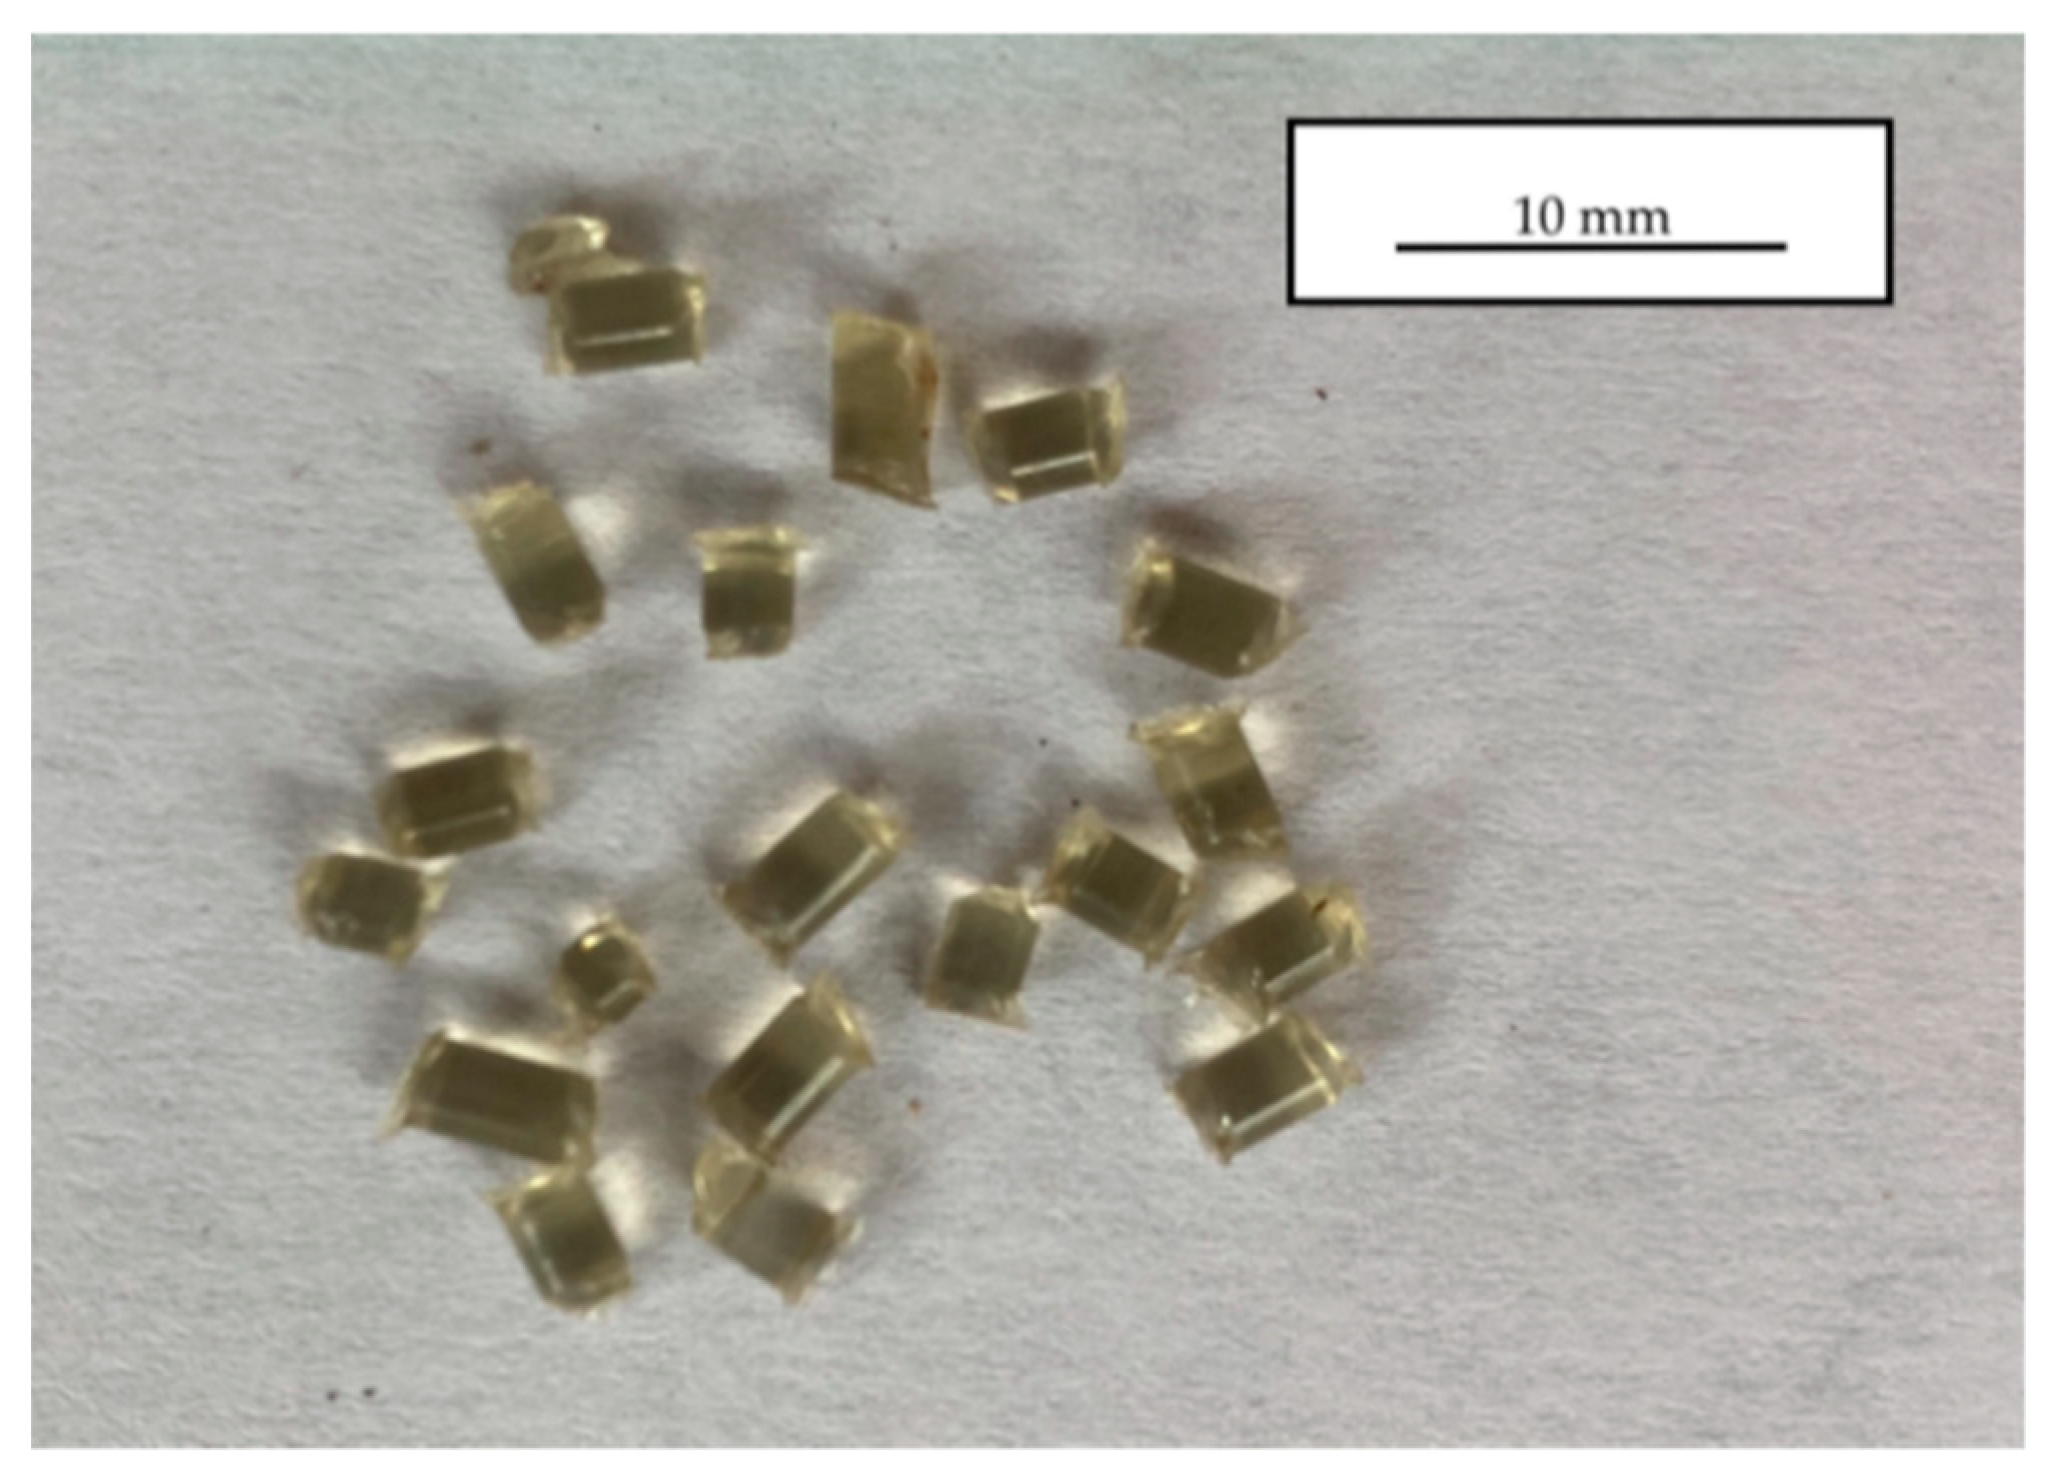
This work focused on recycling bottle-grade PET in order to extrude it into a filament for the MEX process. Compared to other materials used for material extrusion, PET presents higher melting temperatures and the formation of crystallites, which influence the final coloration of the printed parts [11]. For these reasons, PET is avoided as a MEX material. However, the usage of recycled PET as a filament for additive manufacturing also presents some advantages. The recycled PET, as used in this study, is recycled mechanically. Mechanical or physical recycling, as it is also named, grinds and separates the PET out of the remaining waste due to size, color and density. Afterwards, it reutilizes the PET without intentionally changing the molecular structure of the material [29,30]. With the help of the float and sink process, PET and PVC, having a density of approximately 1.4 g/cm3, are easily separated from the remaining commonly used polymers such as polyethylene (PE) and polypropylene (PP) [4]. In comparison to chemical recycling, for example the ethylene glycol modification of the PET to generate PETG, the simple steps during mechanical recycling make it a reliable and low-cost process [29]. In addition, no further materials apart from the PET bottles are needed. Therefore, the filament can be produced basically everywhere where PET bottles are found. A further advantage in comparison to the chemical recycling is the time it takes to depolymerize or chemically modify the PET. Without the use of microwave irradiation, chemical recycling processes can take from four to eight hours [31,32]. This implies a high energy consumption to keep the endothermic reaction running.
PET presents a further advantage, as the miscibility between the virgin and the recycled resin is ideal [33]. The blend between these two variants presents absolutely no phase separation and can therefore be mixed totally, depending on the properties needed. As the results in [33] present, blends with high contents of recycled PET of up to 90% behave basically as well as the virgin resin in dynamic and static mechanical tests. In addition, the viscosity of the polymer melt can be adapted with different quantities of recycled and virgin material.
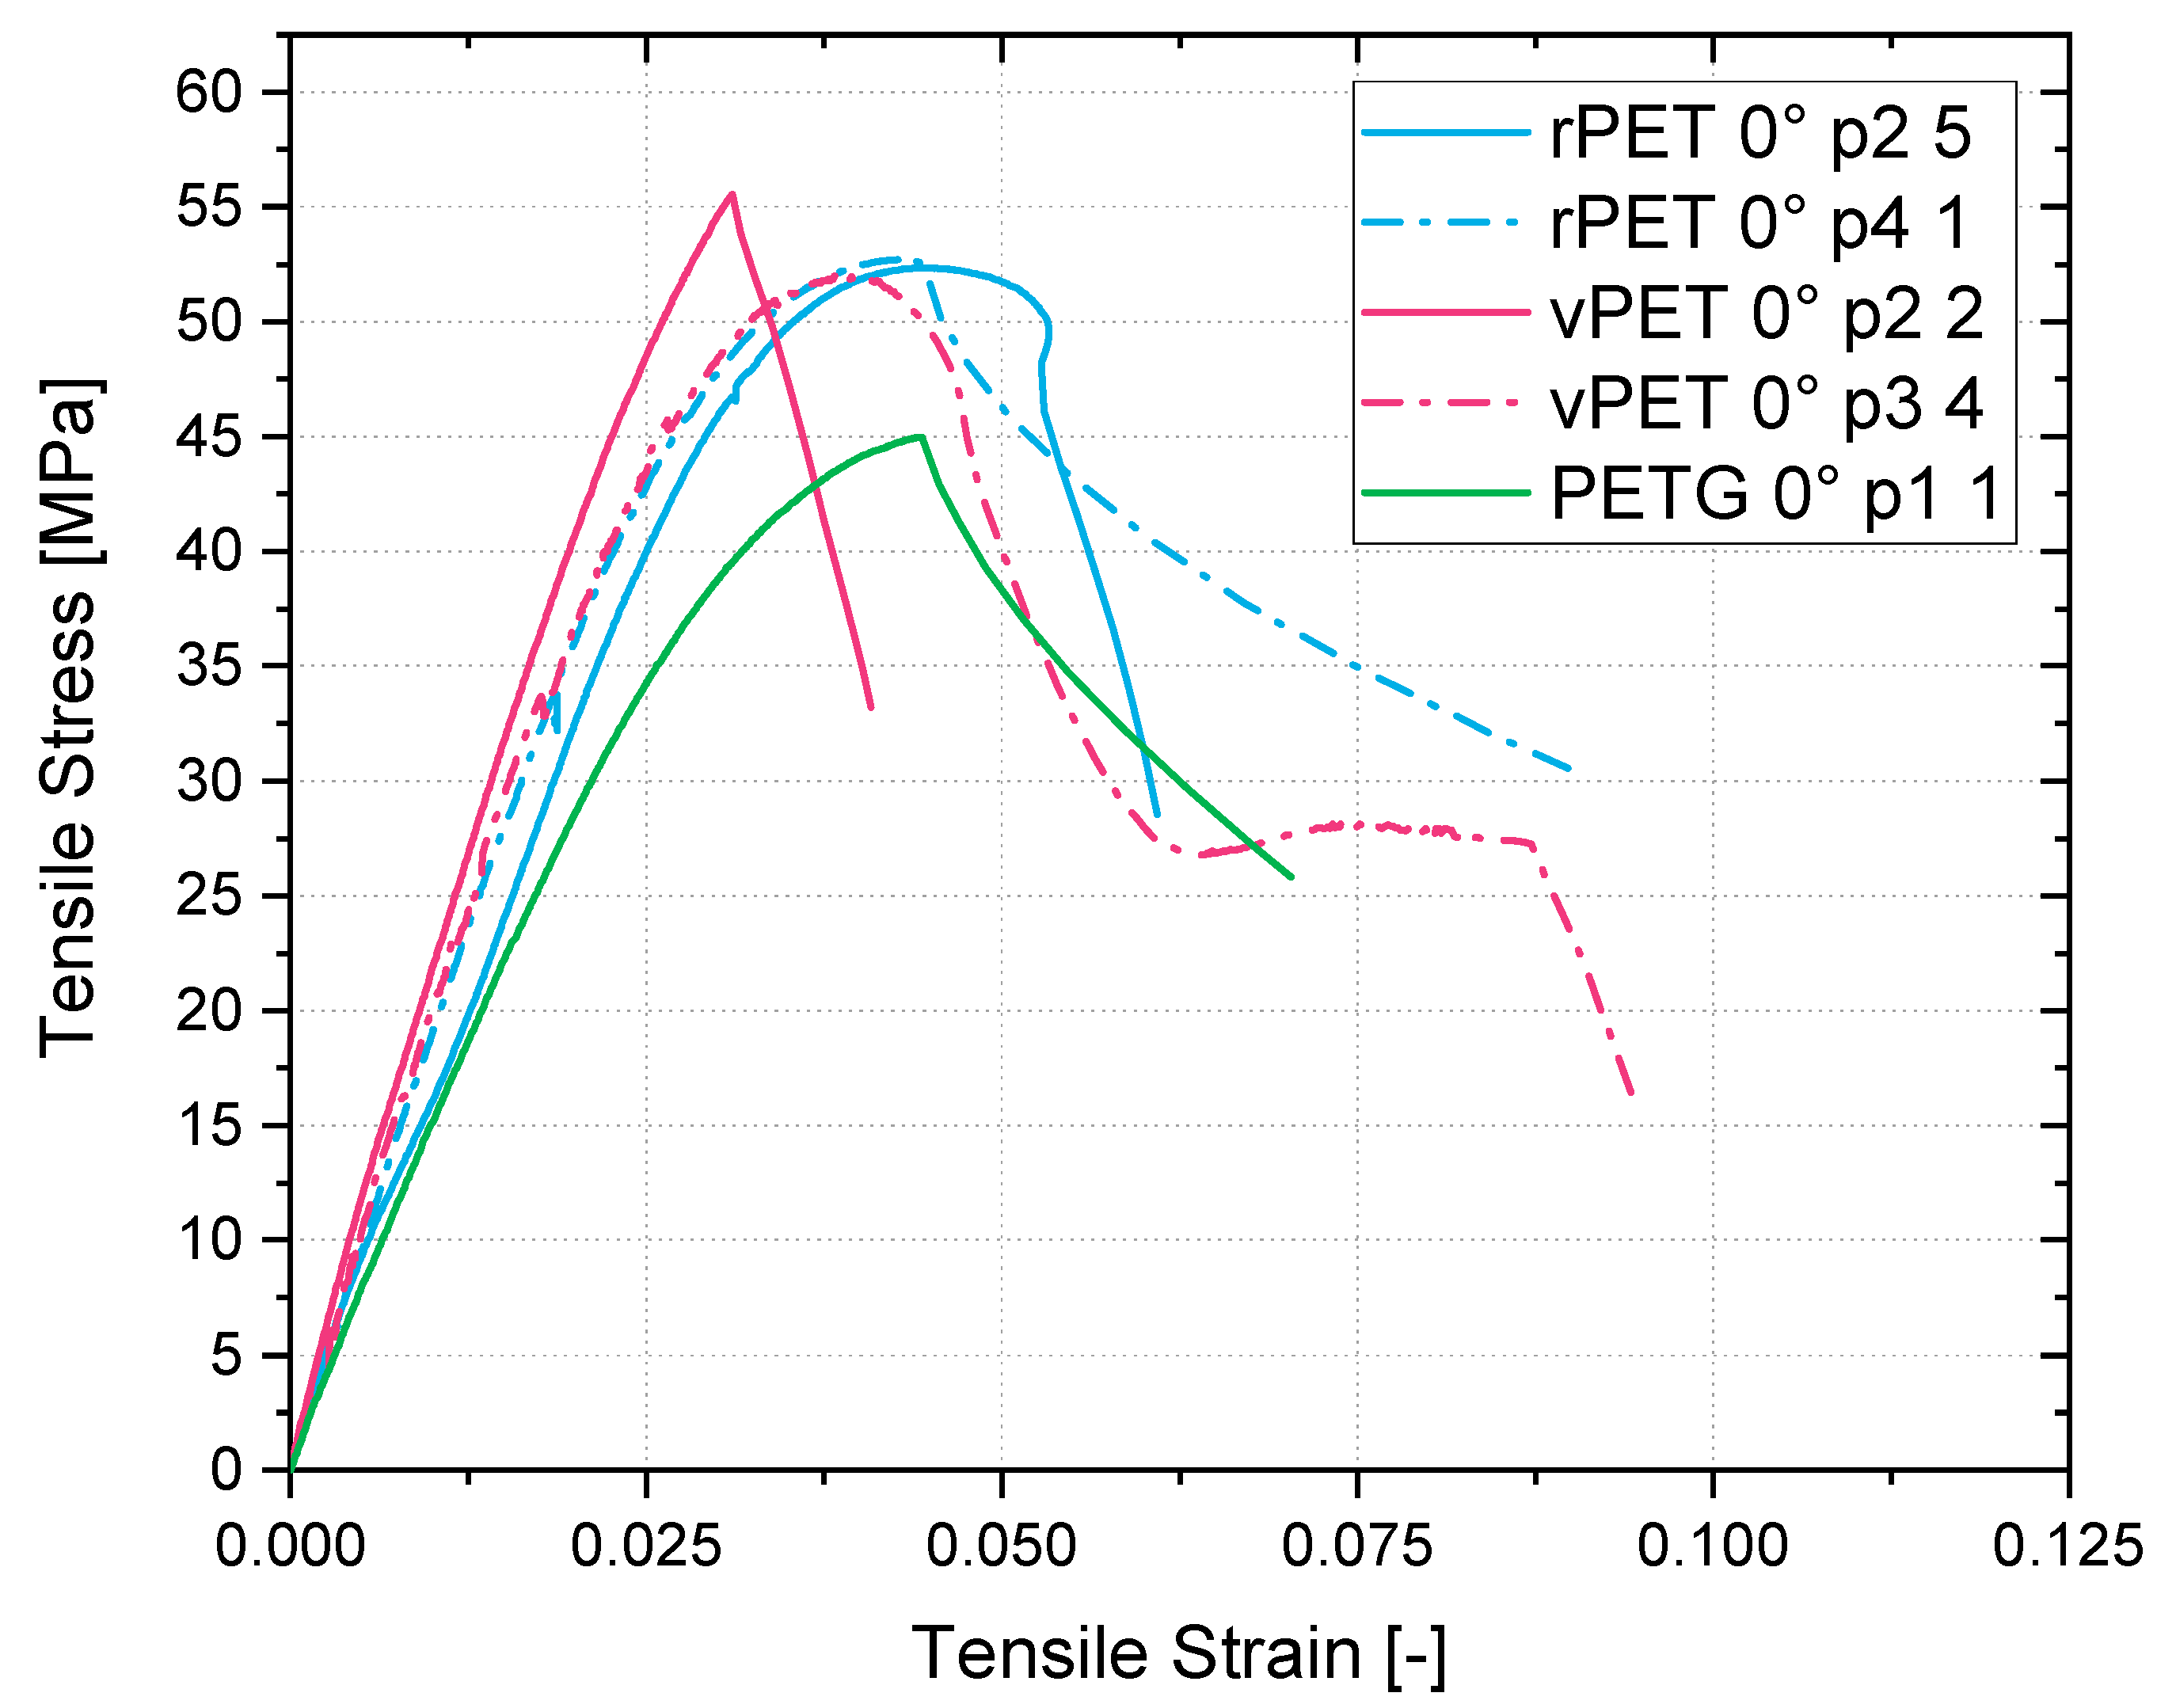
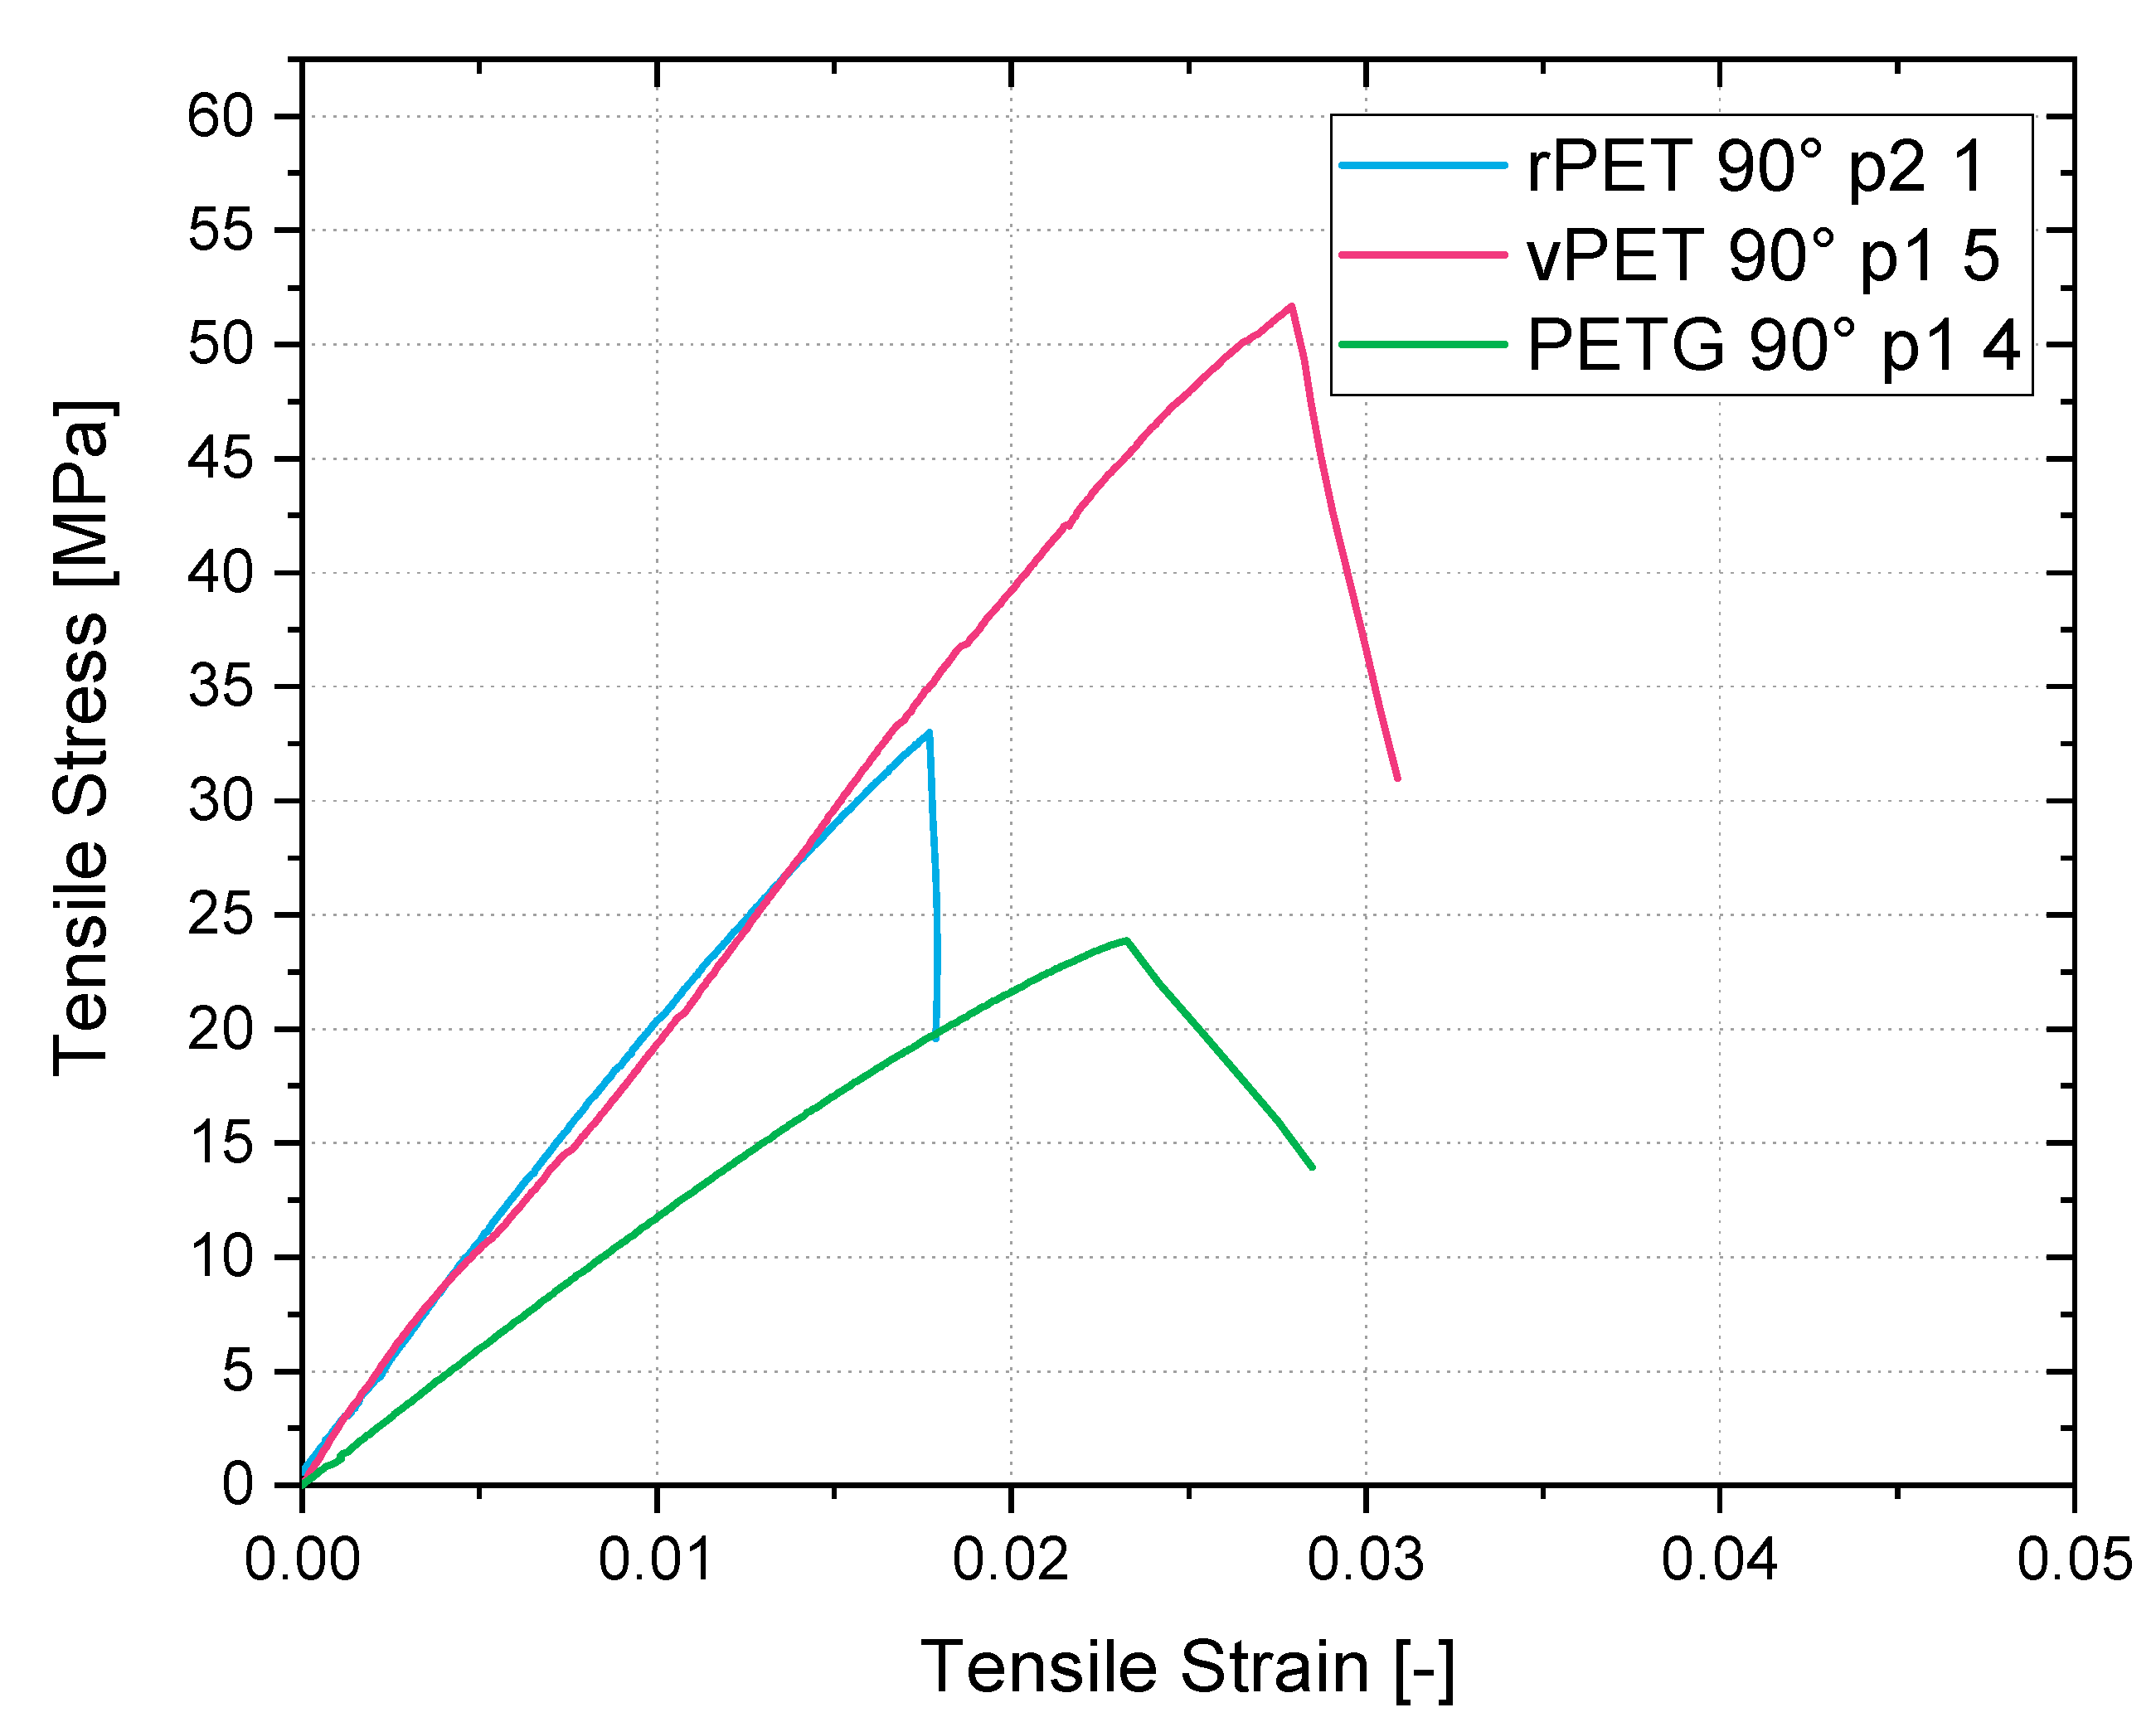
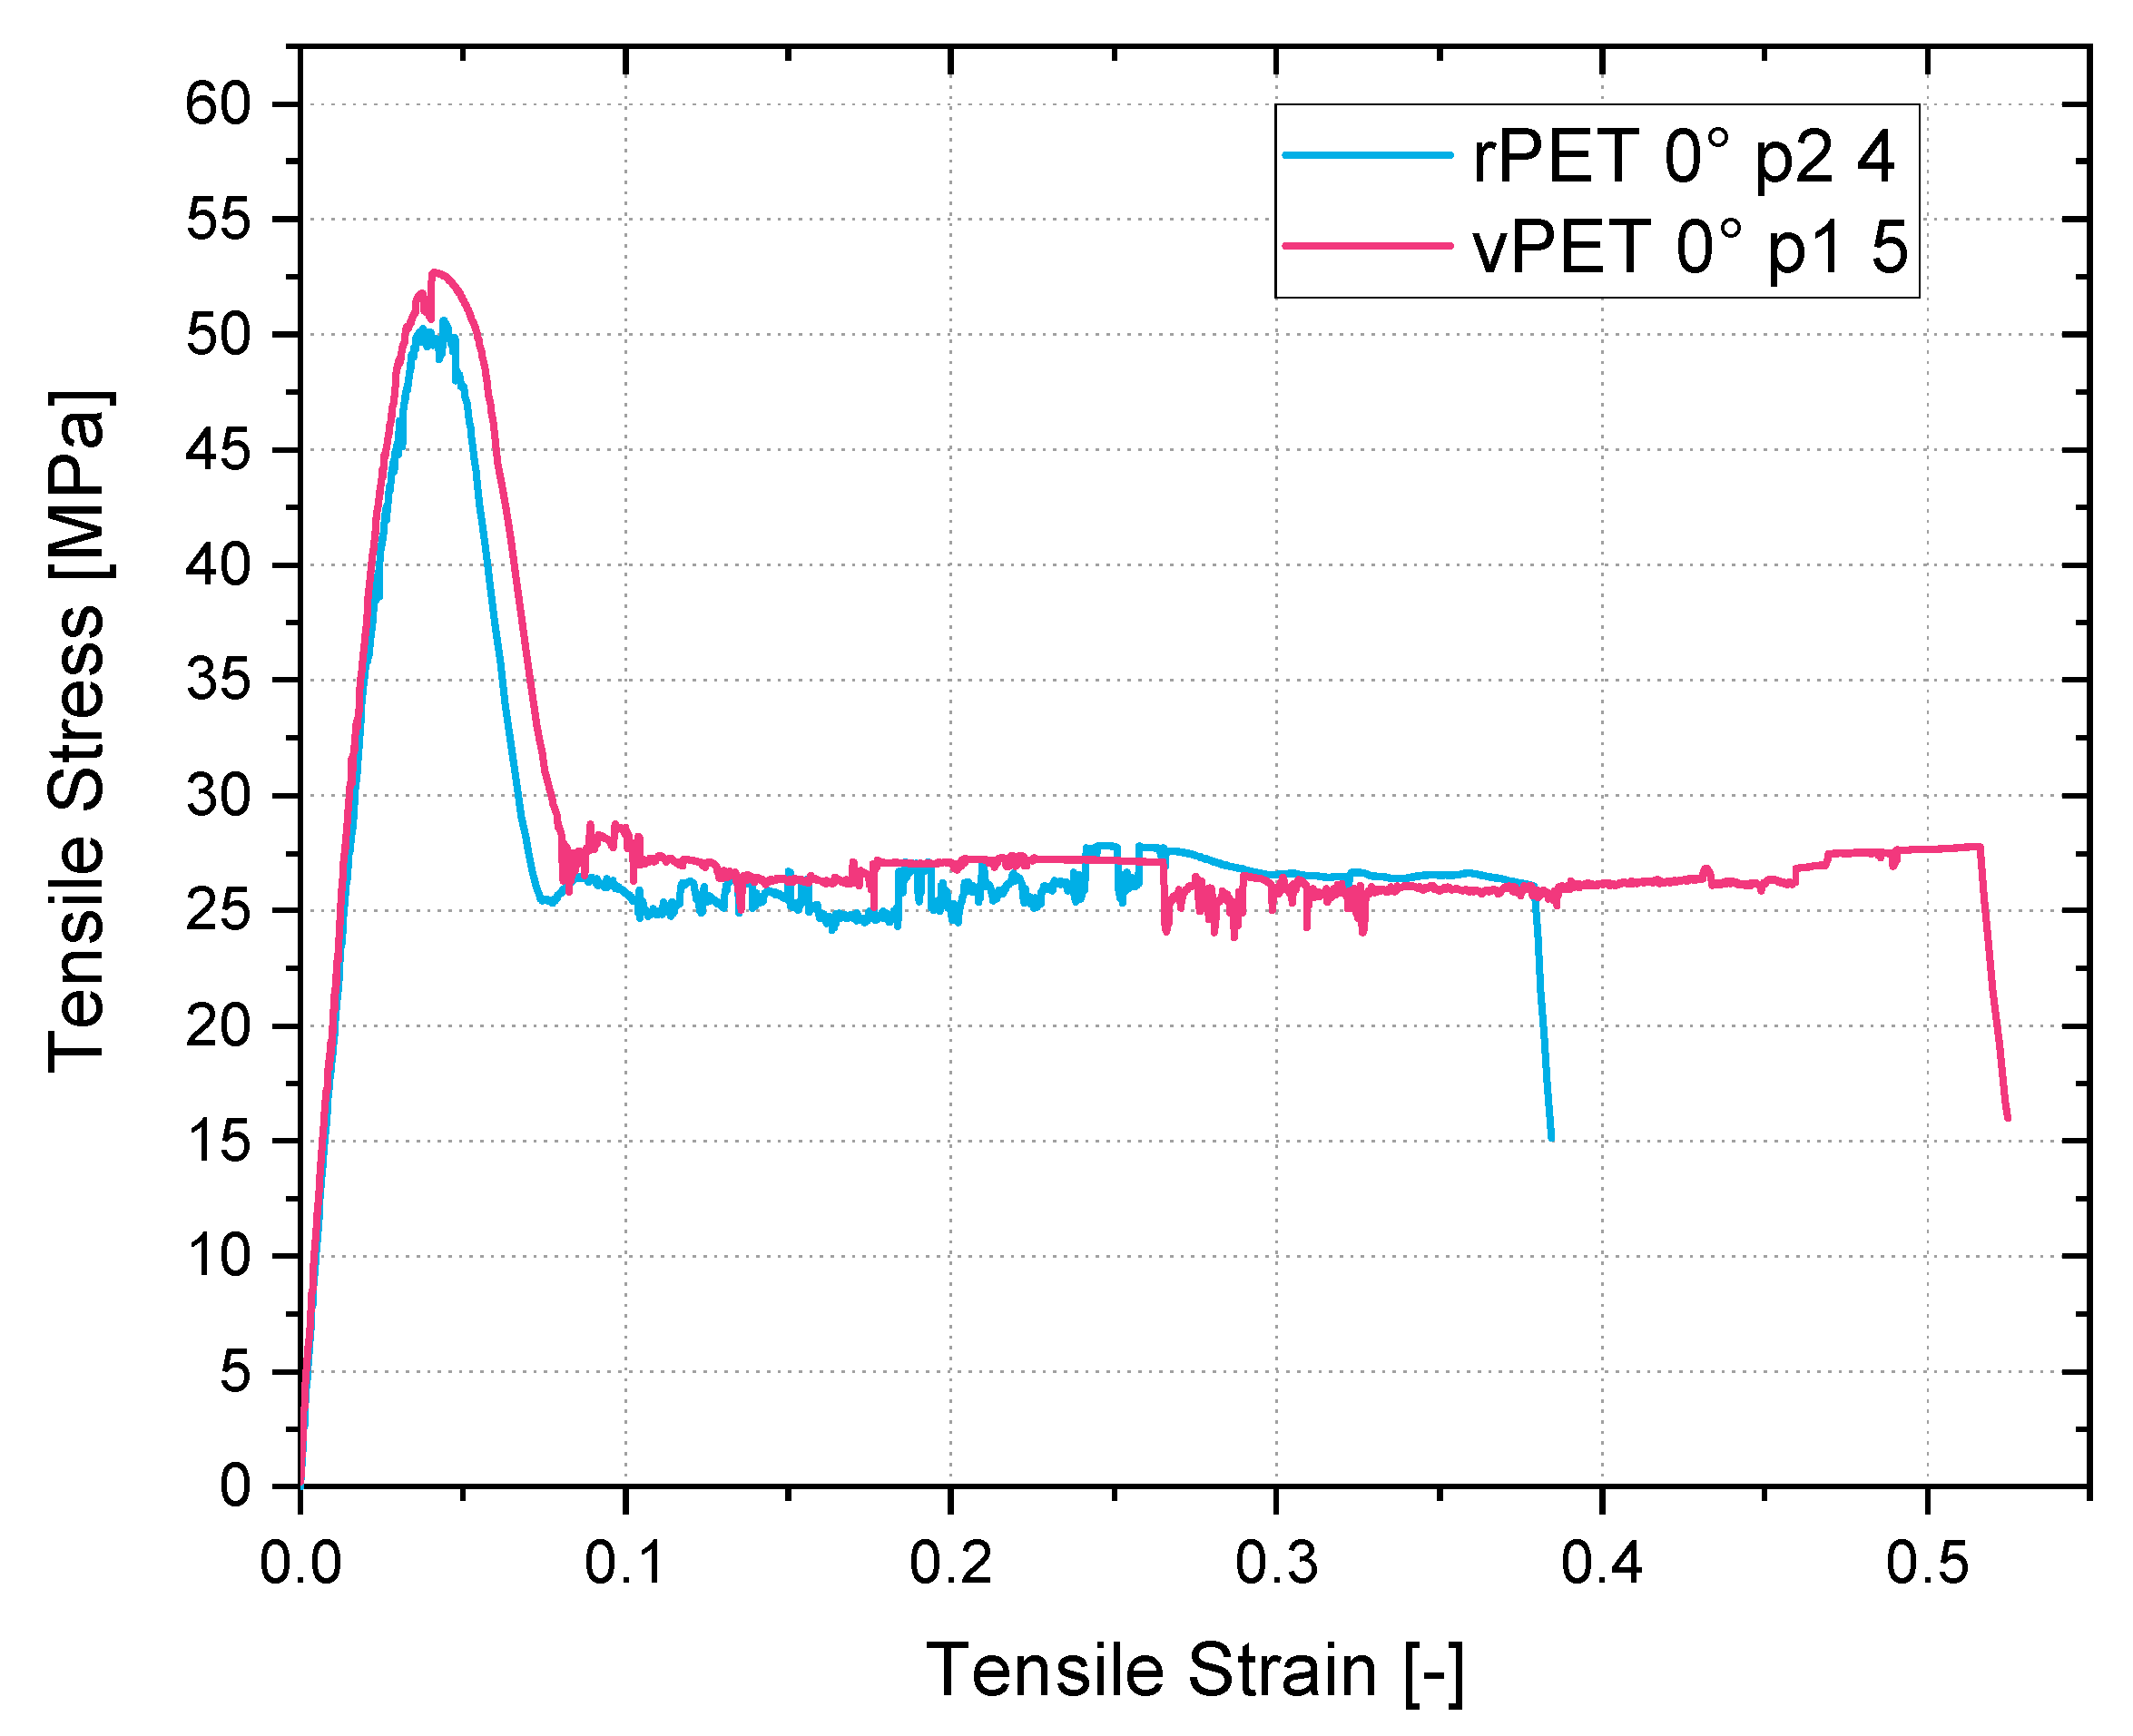
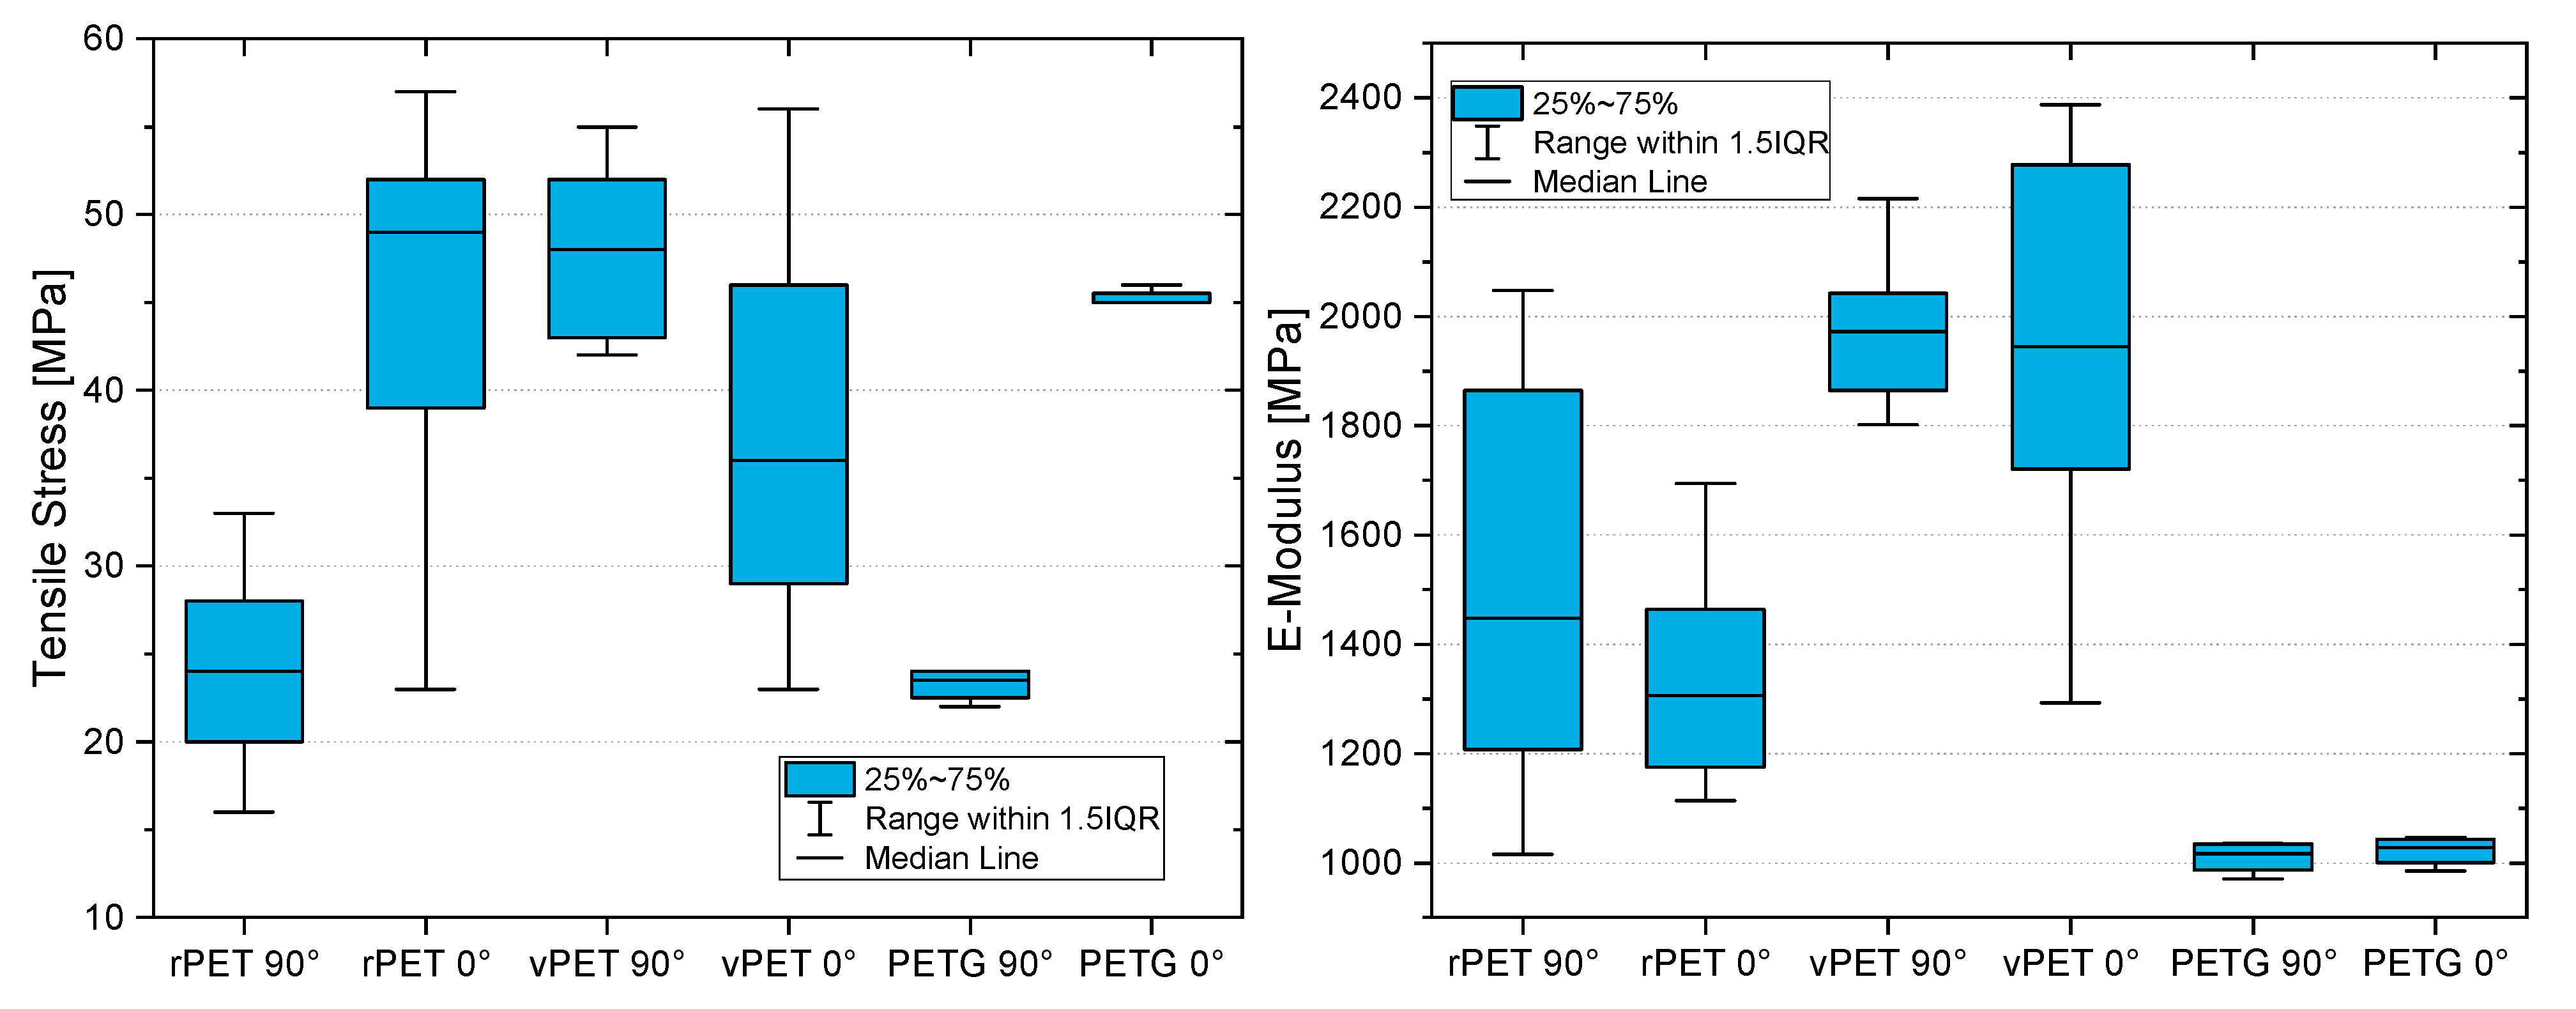
Apart from the advantages in miscibility and simple recyclability, the recycled resin presents higher tensile strengths and E-modulus in comparison to the glycol-modified PETG filament available on the market. As the results in this study clarify, the printed tensile coupons made from PETG presented a maximum tensile strength of 45 MPa with a bead orientation of 0° and of 24 MPa with a bead orientation of 90°. Compared to the PETG, the recycled coupon tests presented results of 53 MPa at a 0° bead orientation and of 33 MPa at a 90° bead orientation. This represents a 17% higher molecular strength and a 38% higher interlaminar strength of the recycled material in comparison to the commonly used filament for MEX.

6. Conclusions

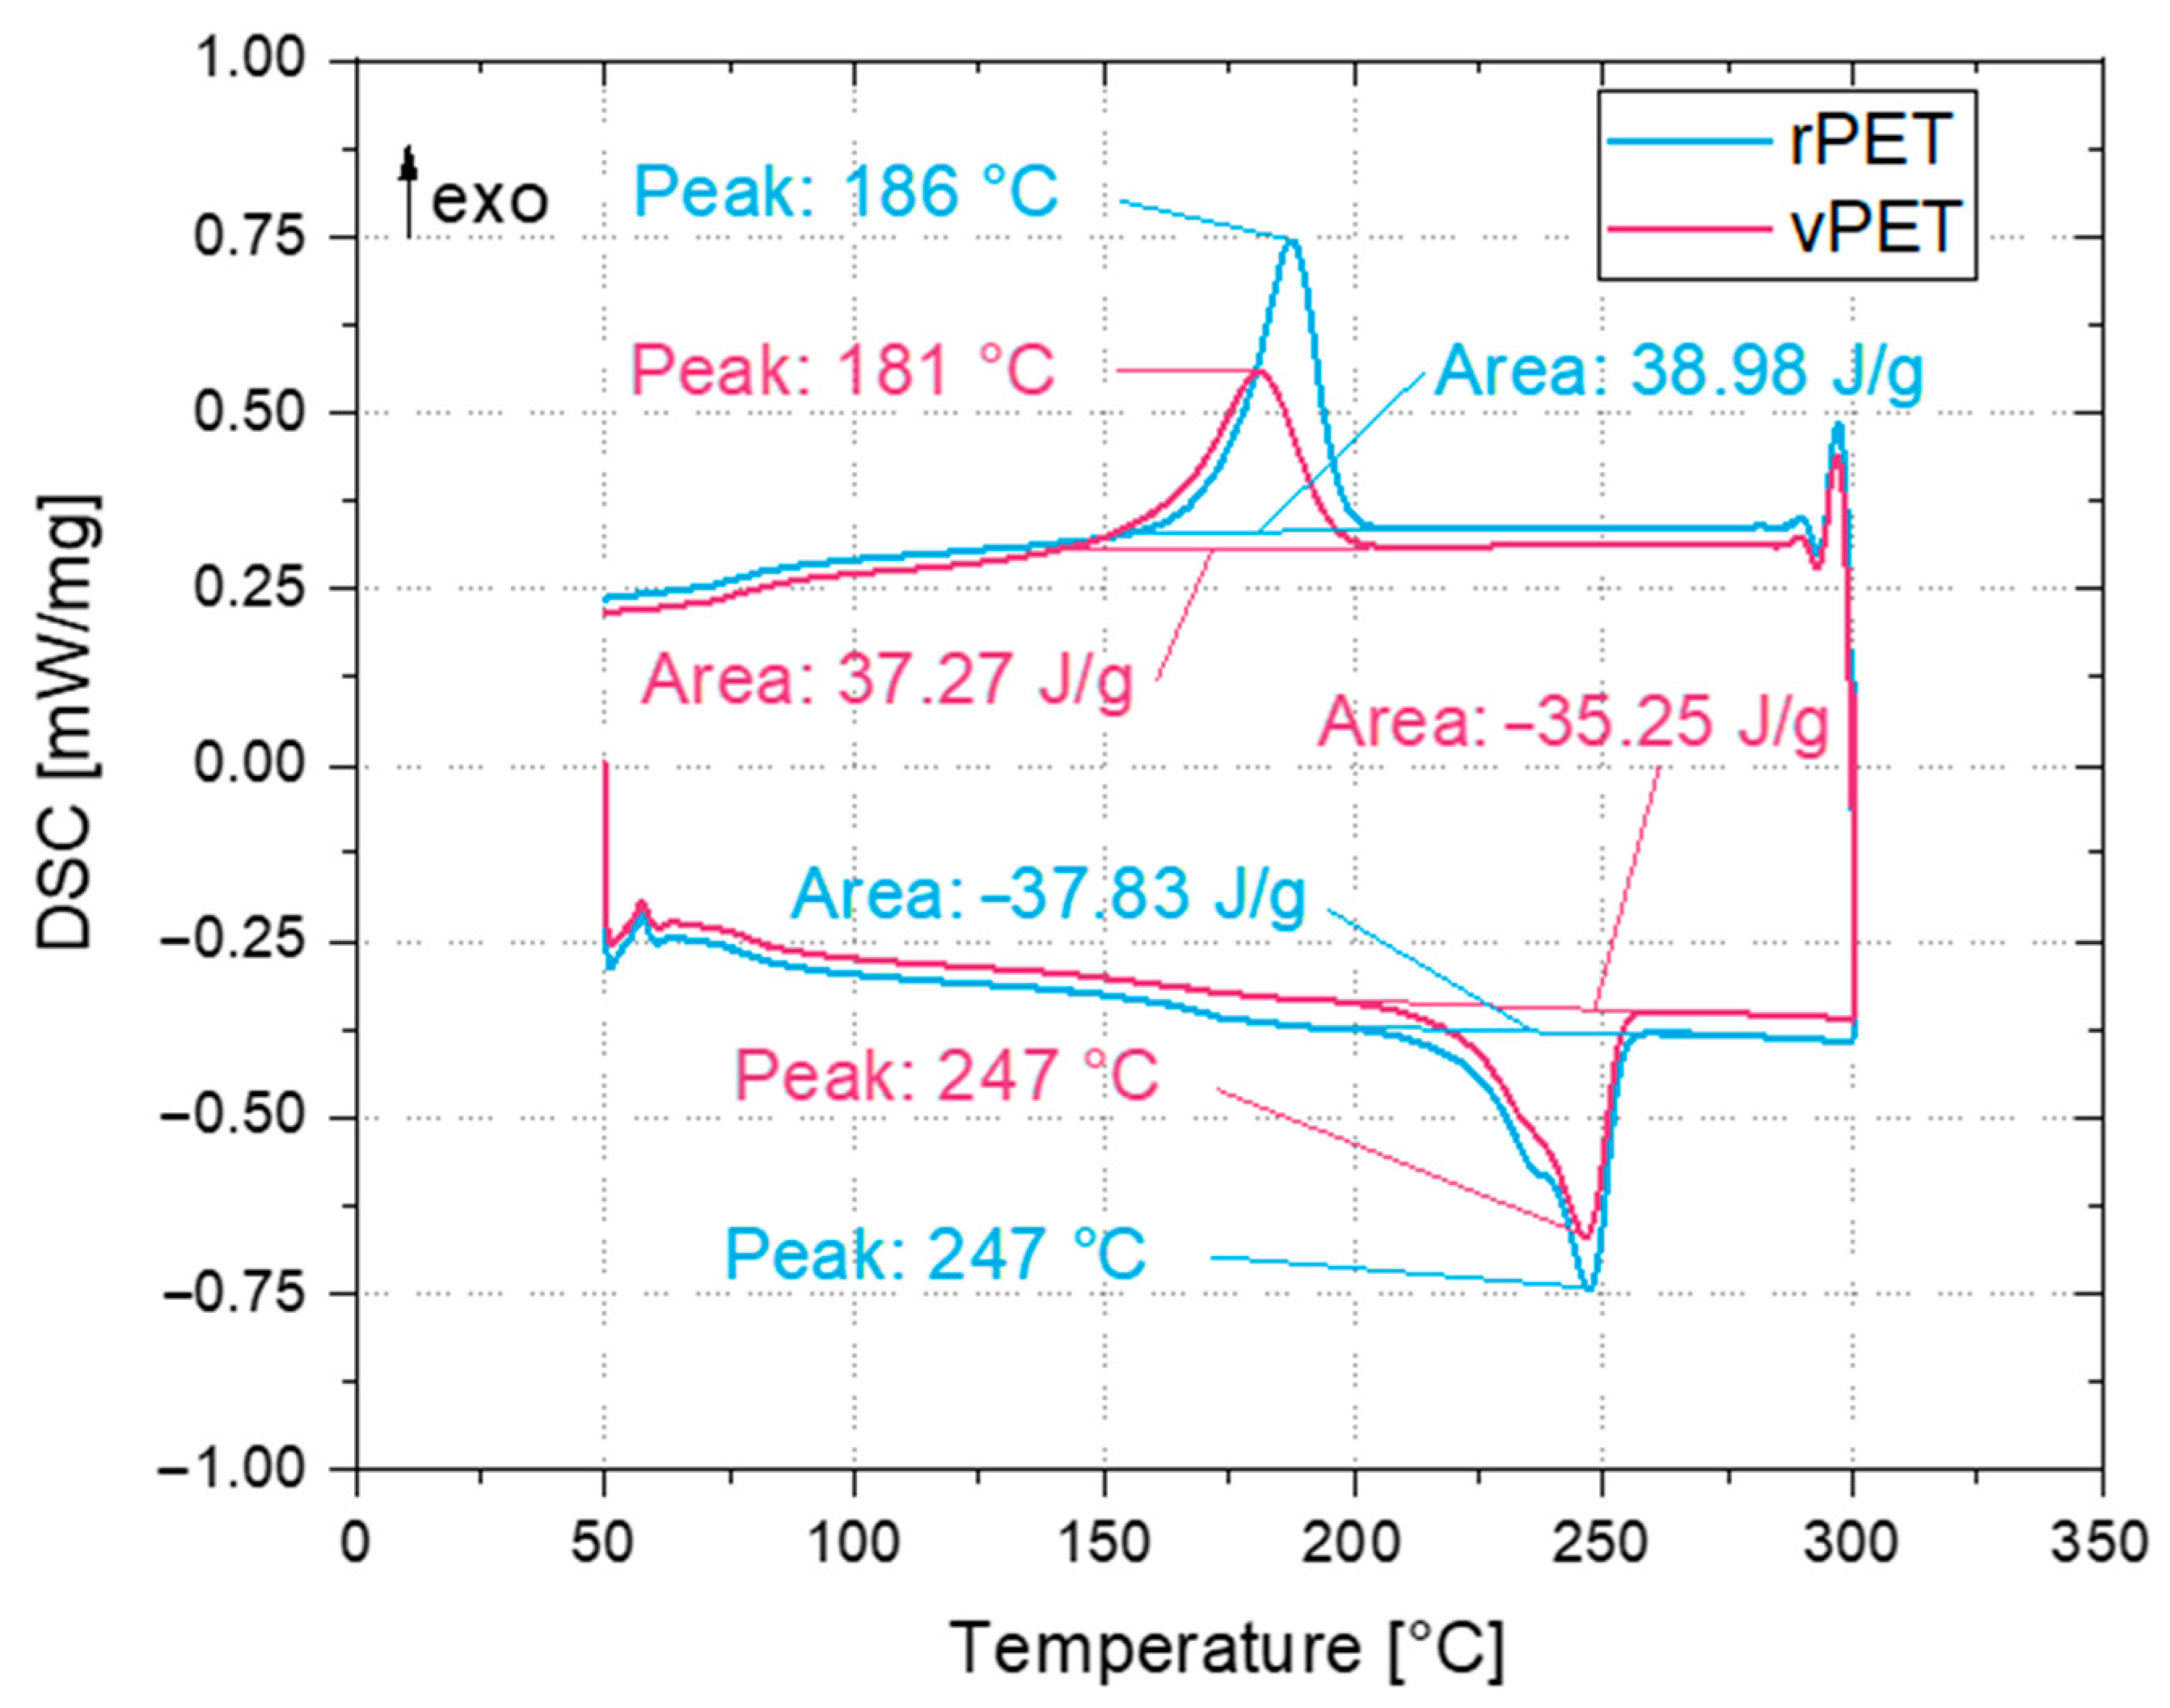
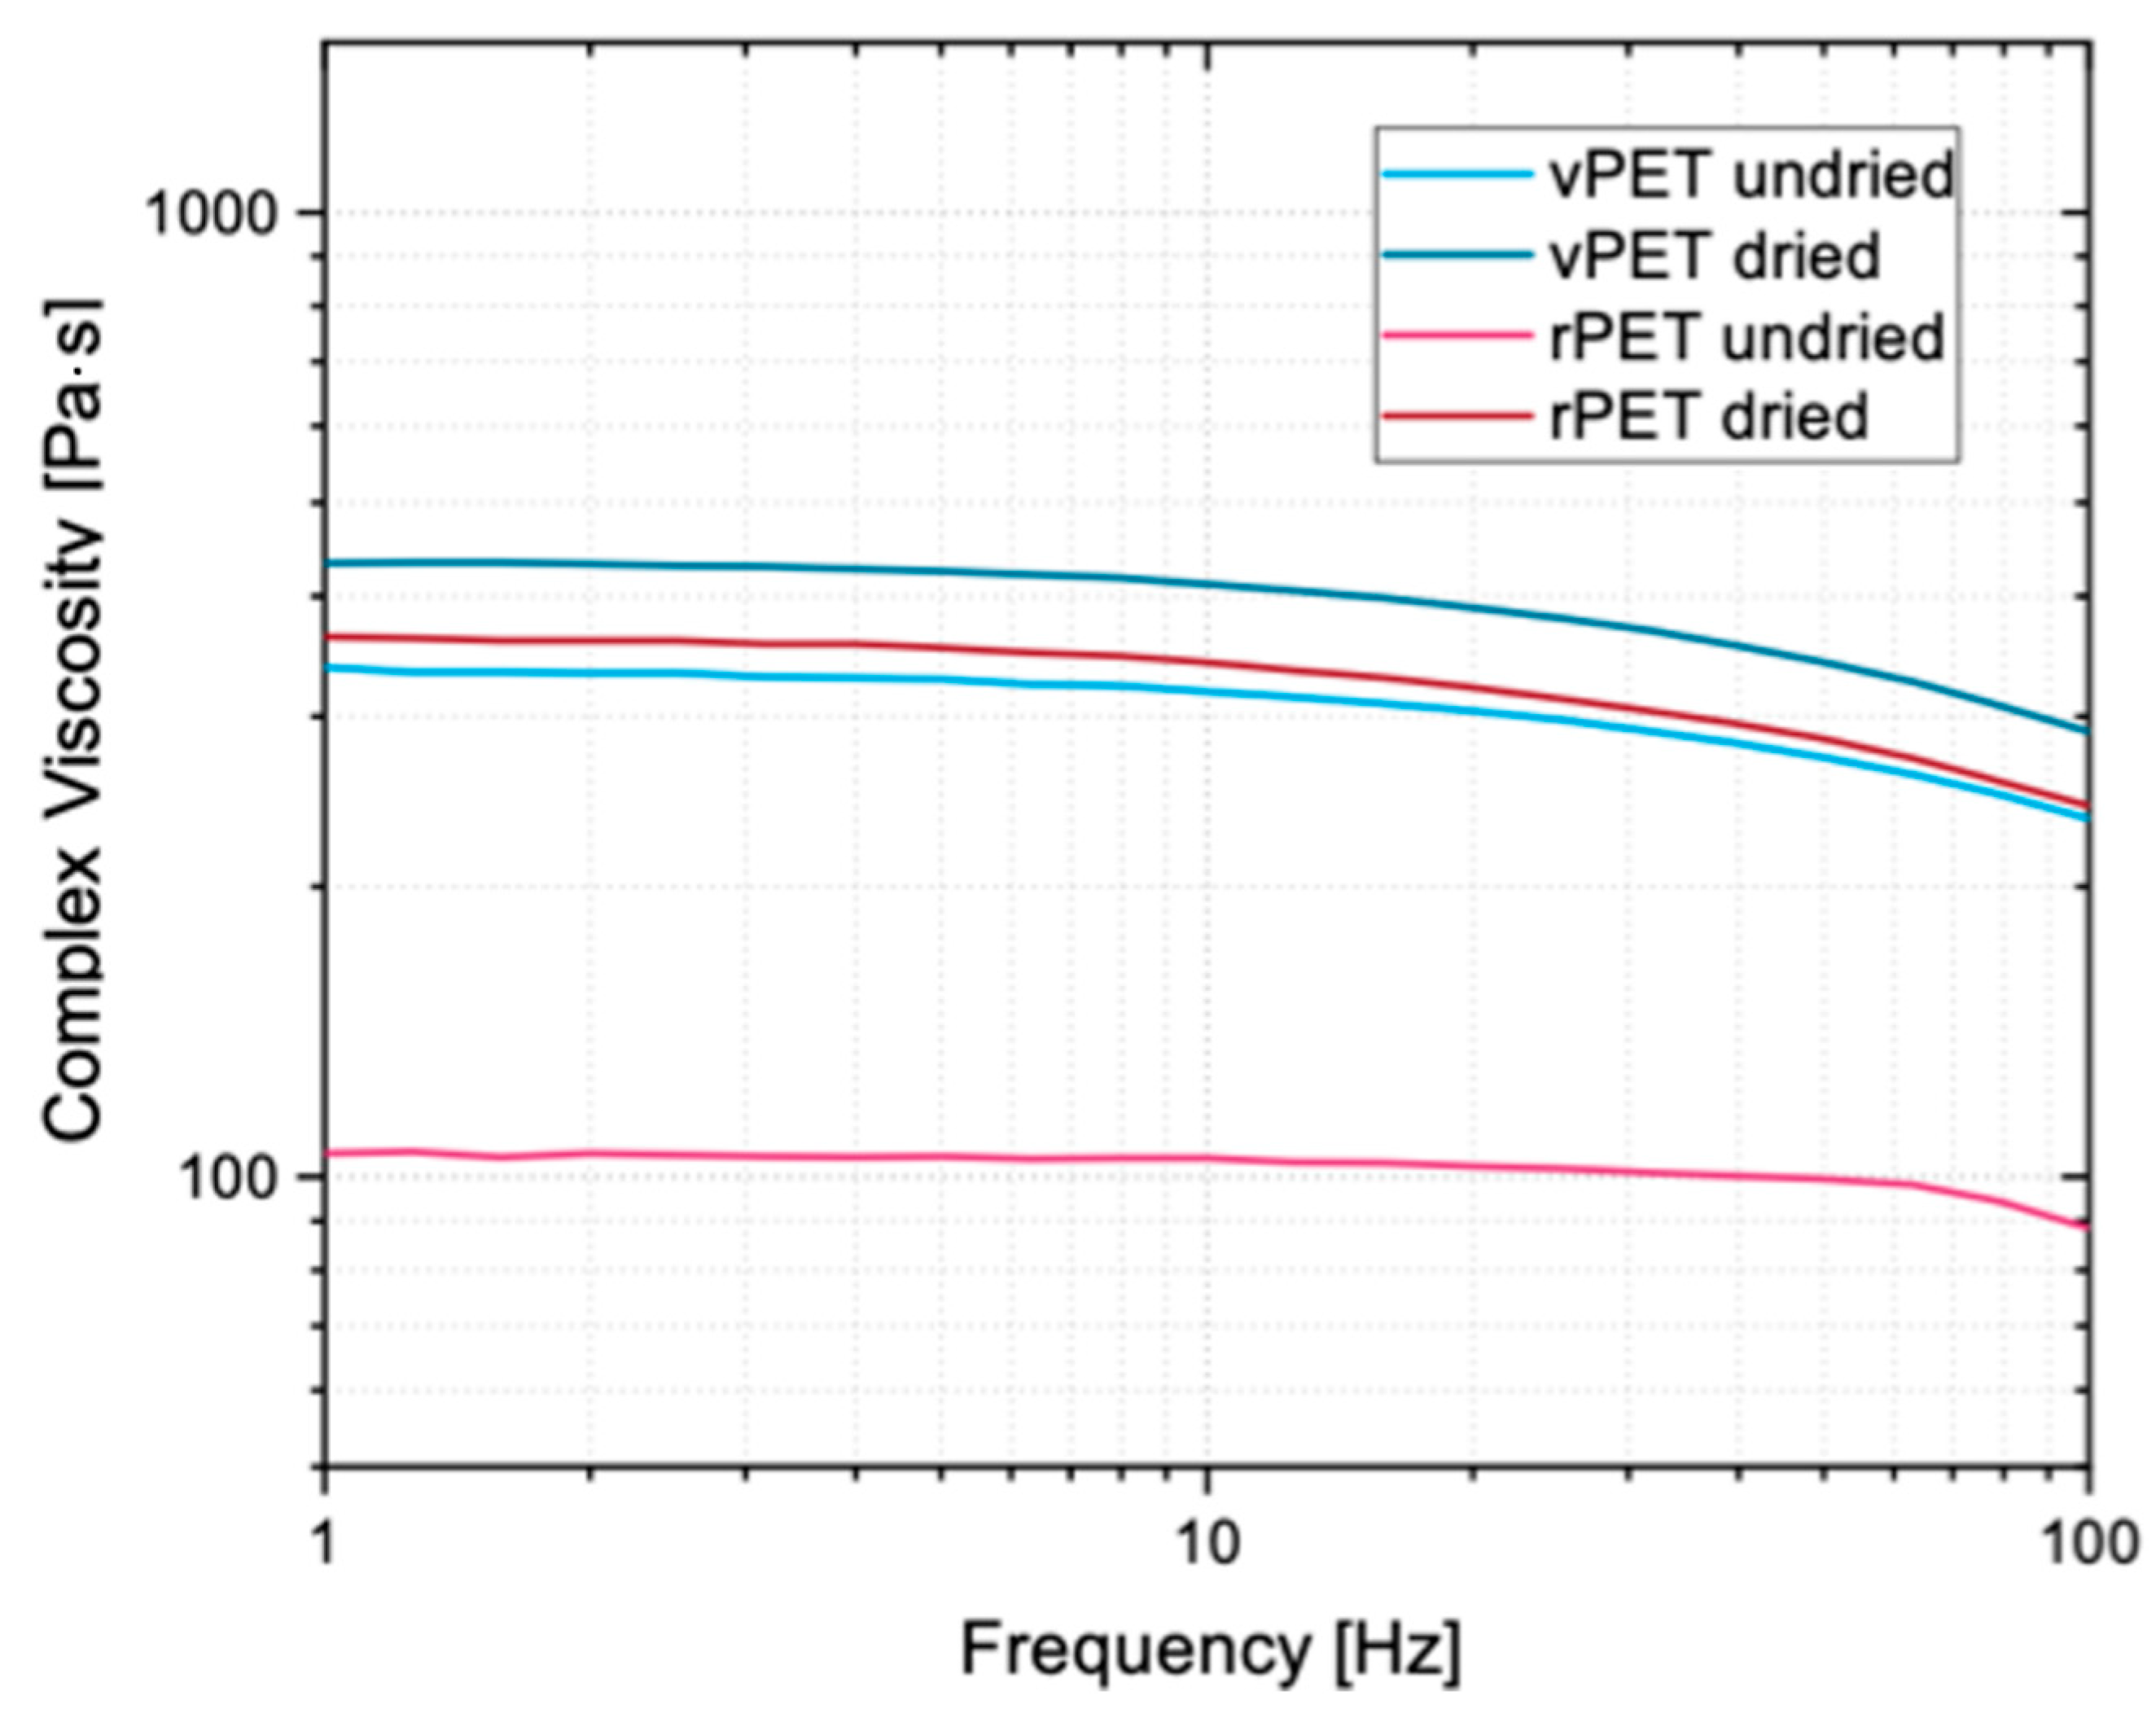
Within a growing additive manufacturing market and a greater need for recycling and reusing materials, the recycling of PET into a filament for the MEX process has proved to be a viable option. Washed and shredded PET bottles can be used as a material input for pellets. Drying the material prior to extrusion proved to be an important step, leading to higher complex viscosities in both vPET and rPET. These produced pellets can then, in turn, be extruded into a filament. Printed tensile coupons out of the recycled PET filament exhibited higher tensile strengths than the PETG filament available in the market. However, the highest tensile strengths were shown by the vPET. The final geometry and function of the recycled material is up to the capacity and imagination of each manufacturer, given the freedom offered by the MEX process. In addition to the potential use for additive manufacturing, the recycling of PET into a filament could also increase the merit of the material. Recycled PET can not only be recycled but even upcycled if being sold as a filament.
In order to improve the results and make the recycling of PET more feasible, further work needs to be carried out. Within the timeframe, some important factors were noted, but not all could be examined in detail. The propositions presented below can be used as guidance for future work.
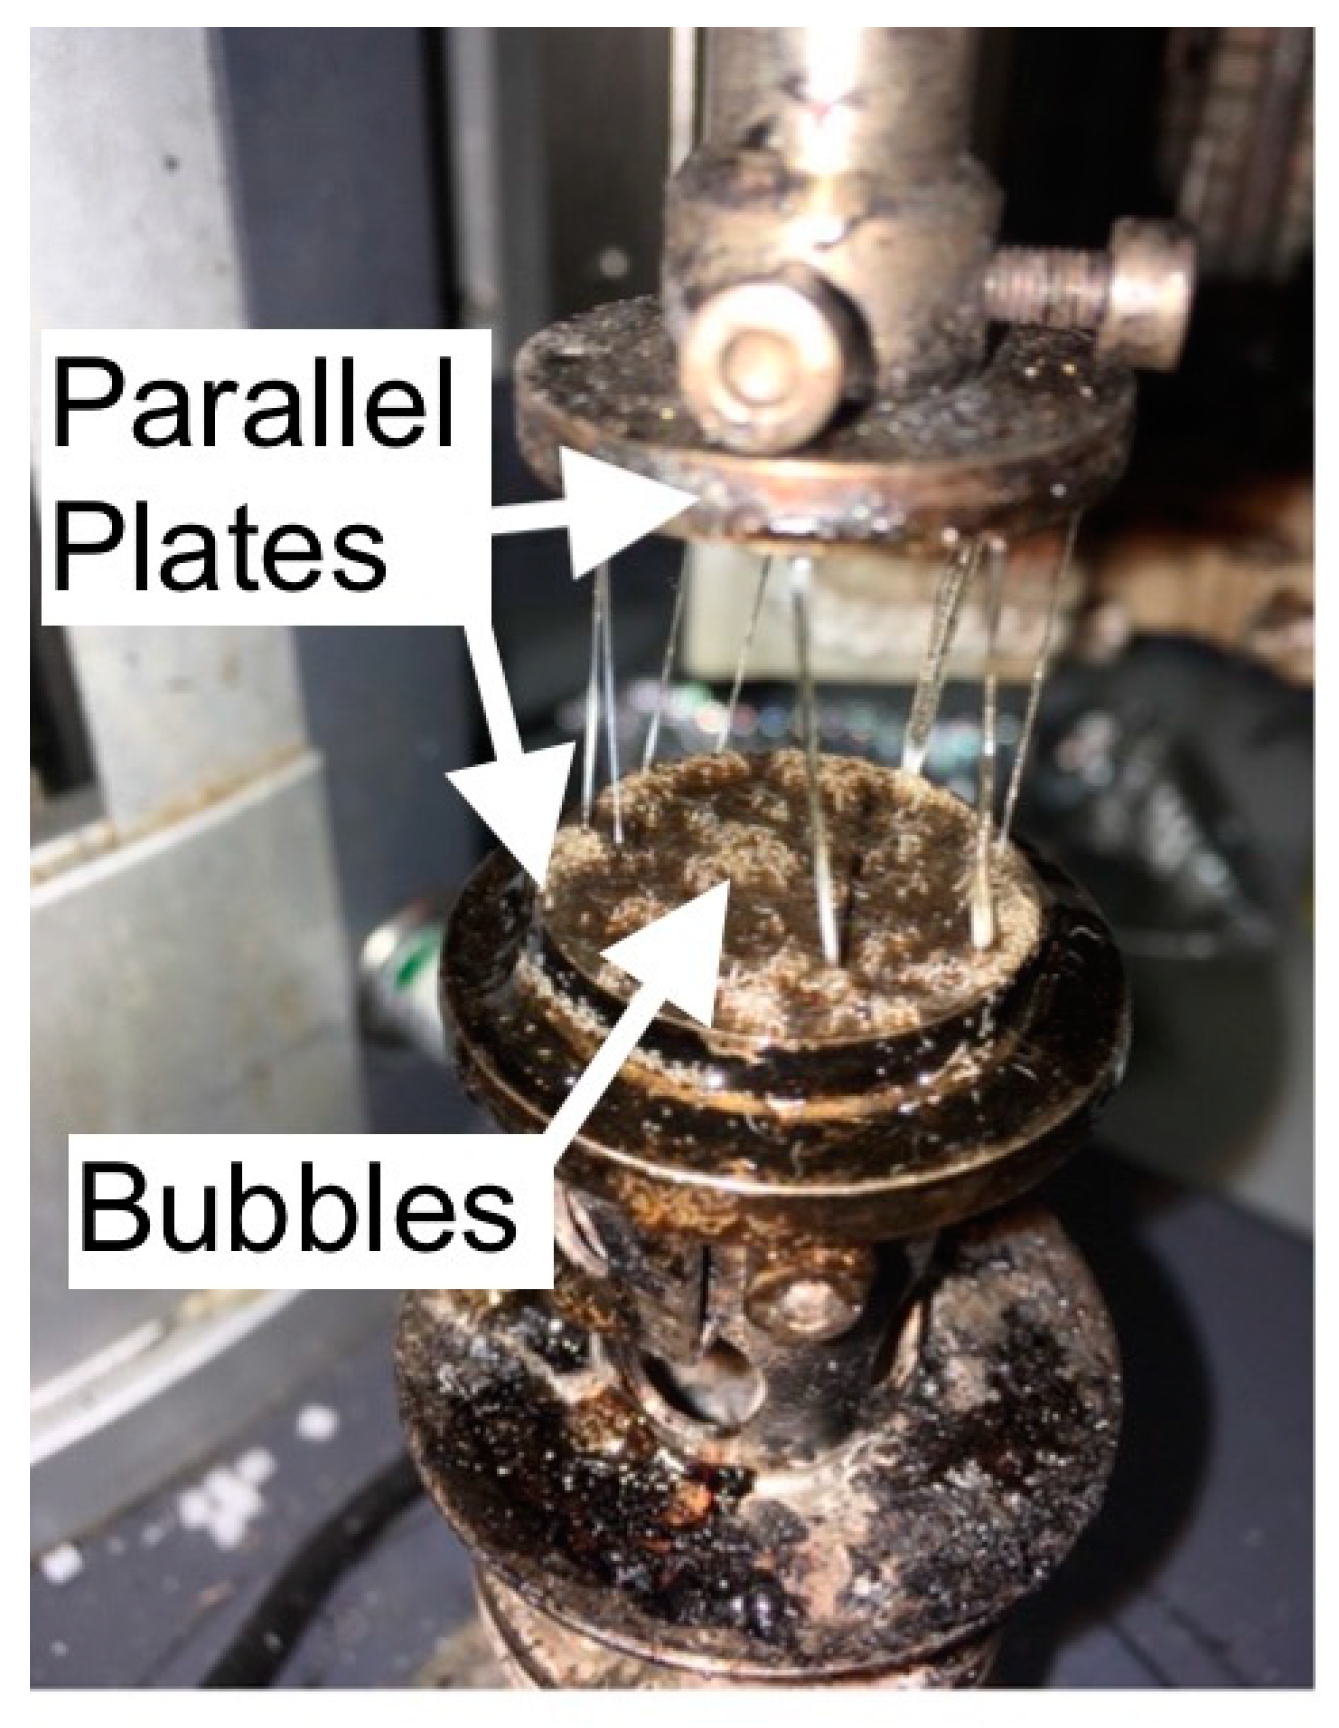
The drying procedure of the material needs to be properly analyzed. PET is sensitive to moisture and therefore needs to be dried before processing. Recommended moisture contents for processing vary in the previous literature on this subject. A better understanding of the drying process, including the drying atmosphere, drying temperature, drying time and resultant moisture content could lead to a better handling of the material and less degradation during processing. A further interesting parameter is the time in between the end of the drying procedure and the start of the extrusion process. Not all laboratories are capable of drying and blowing the material straight into the extruder. So, the influence of recess time and the humidity in the air would need to be considered too.
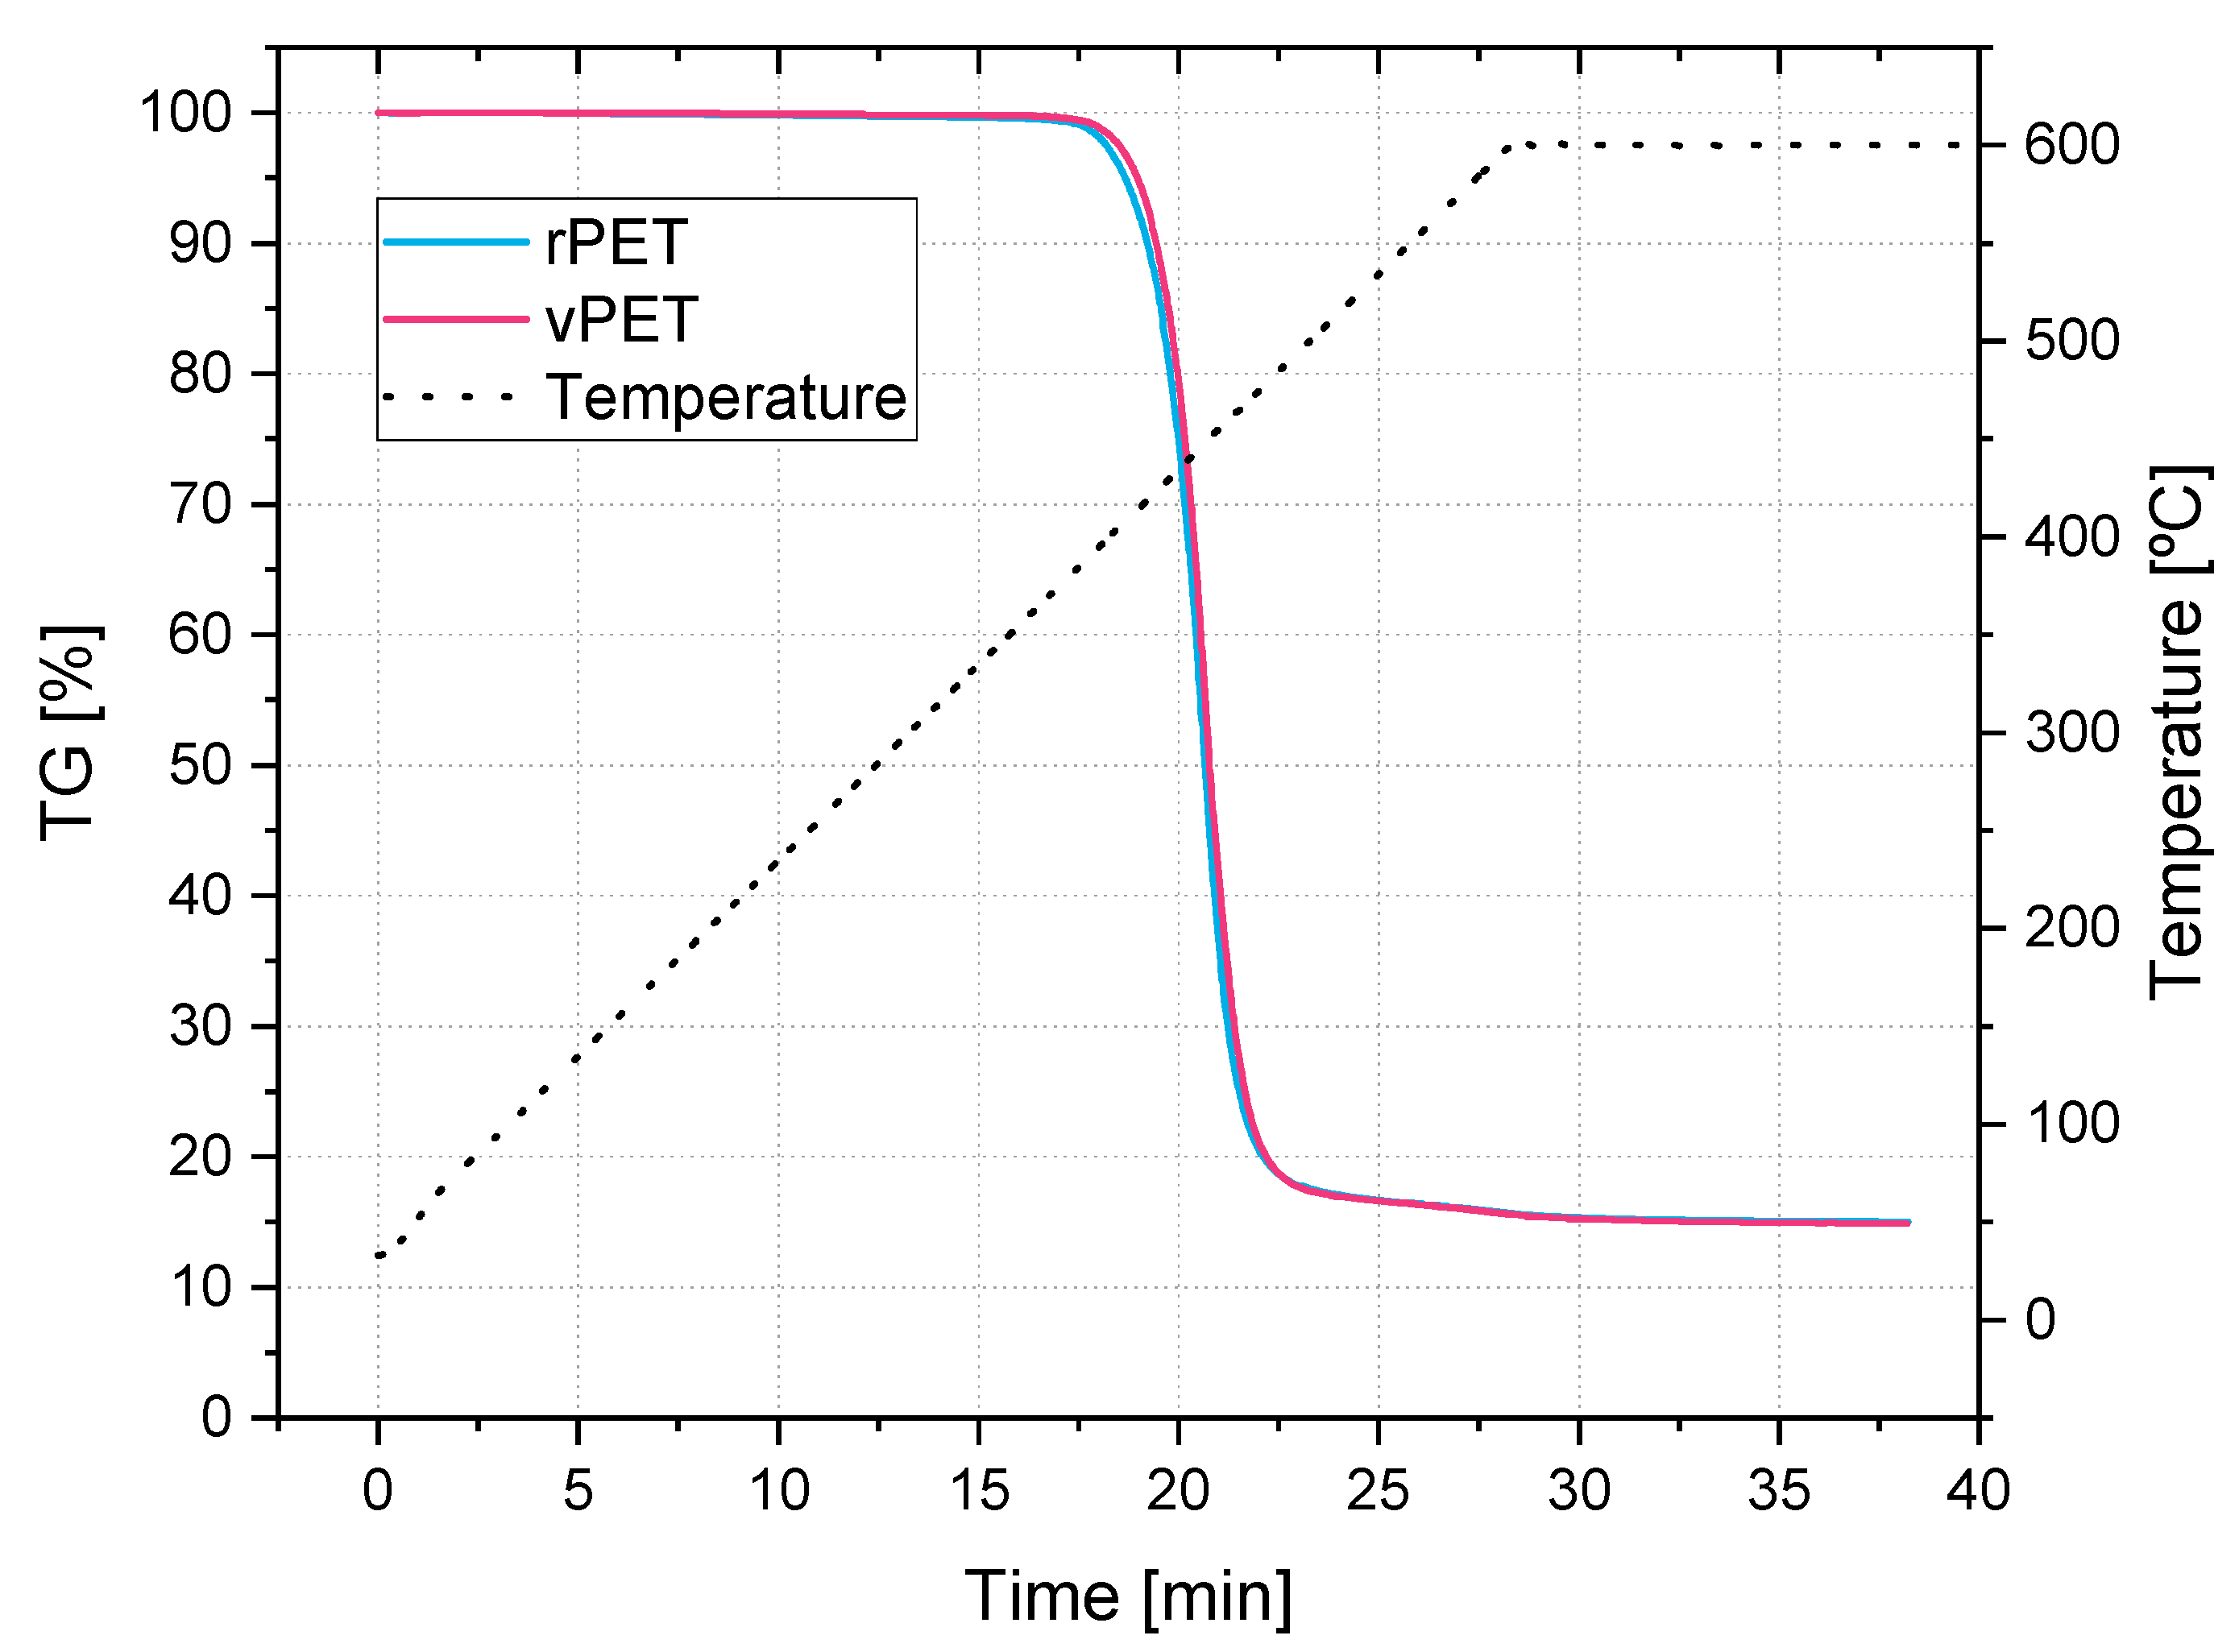
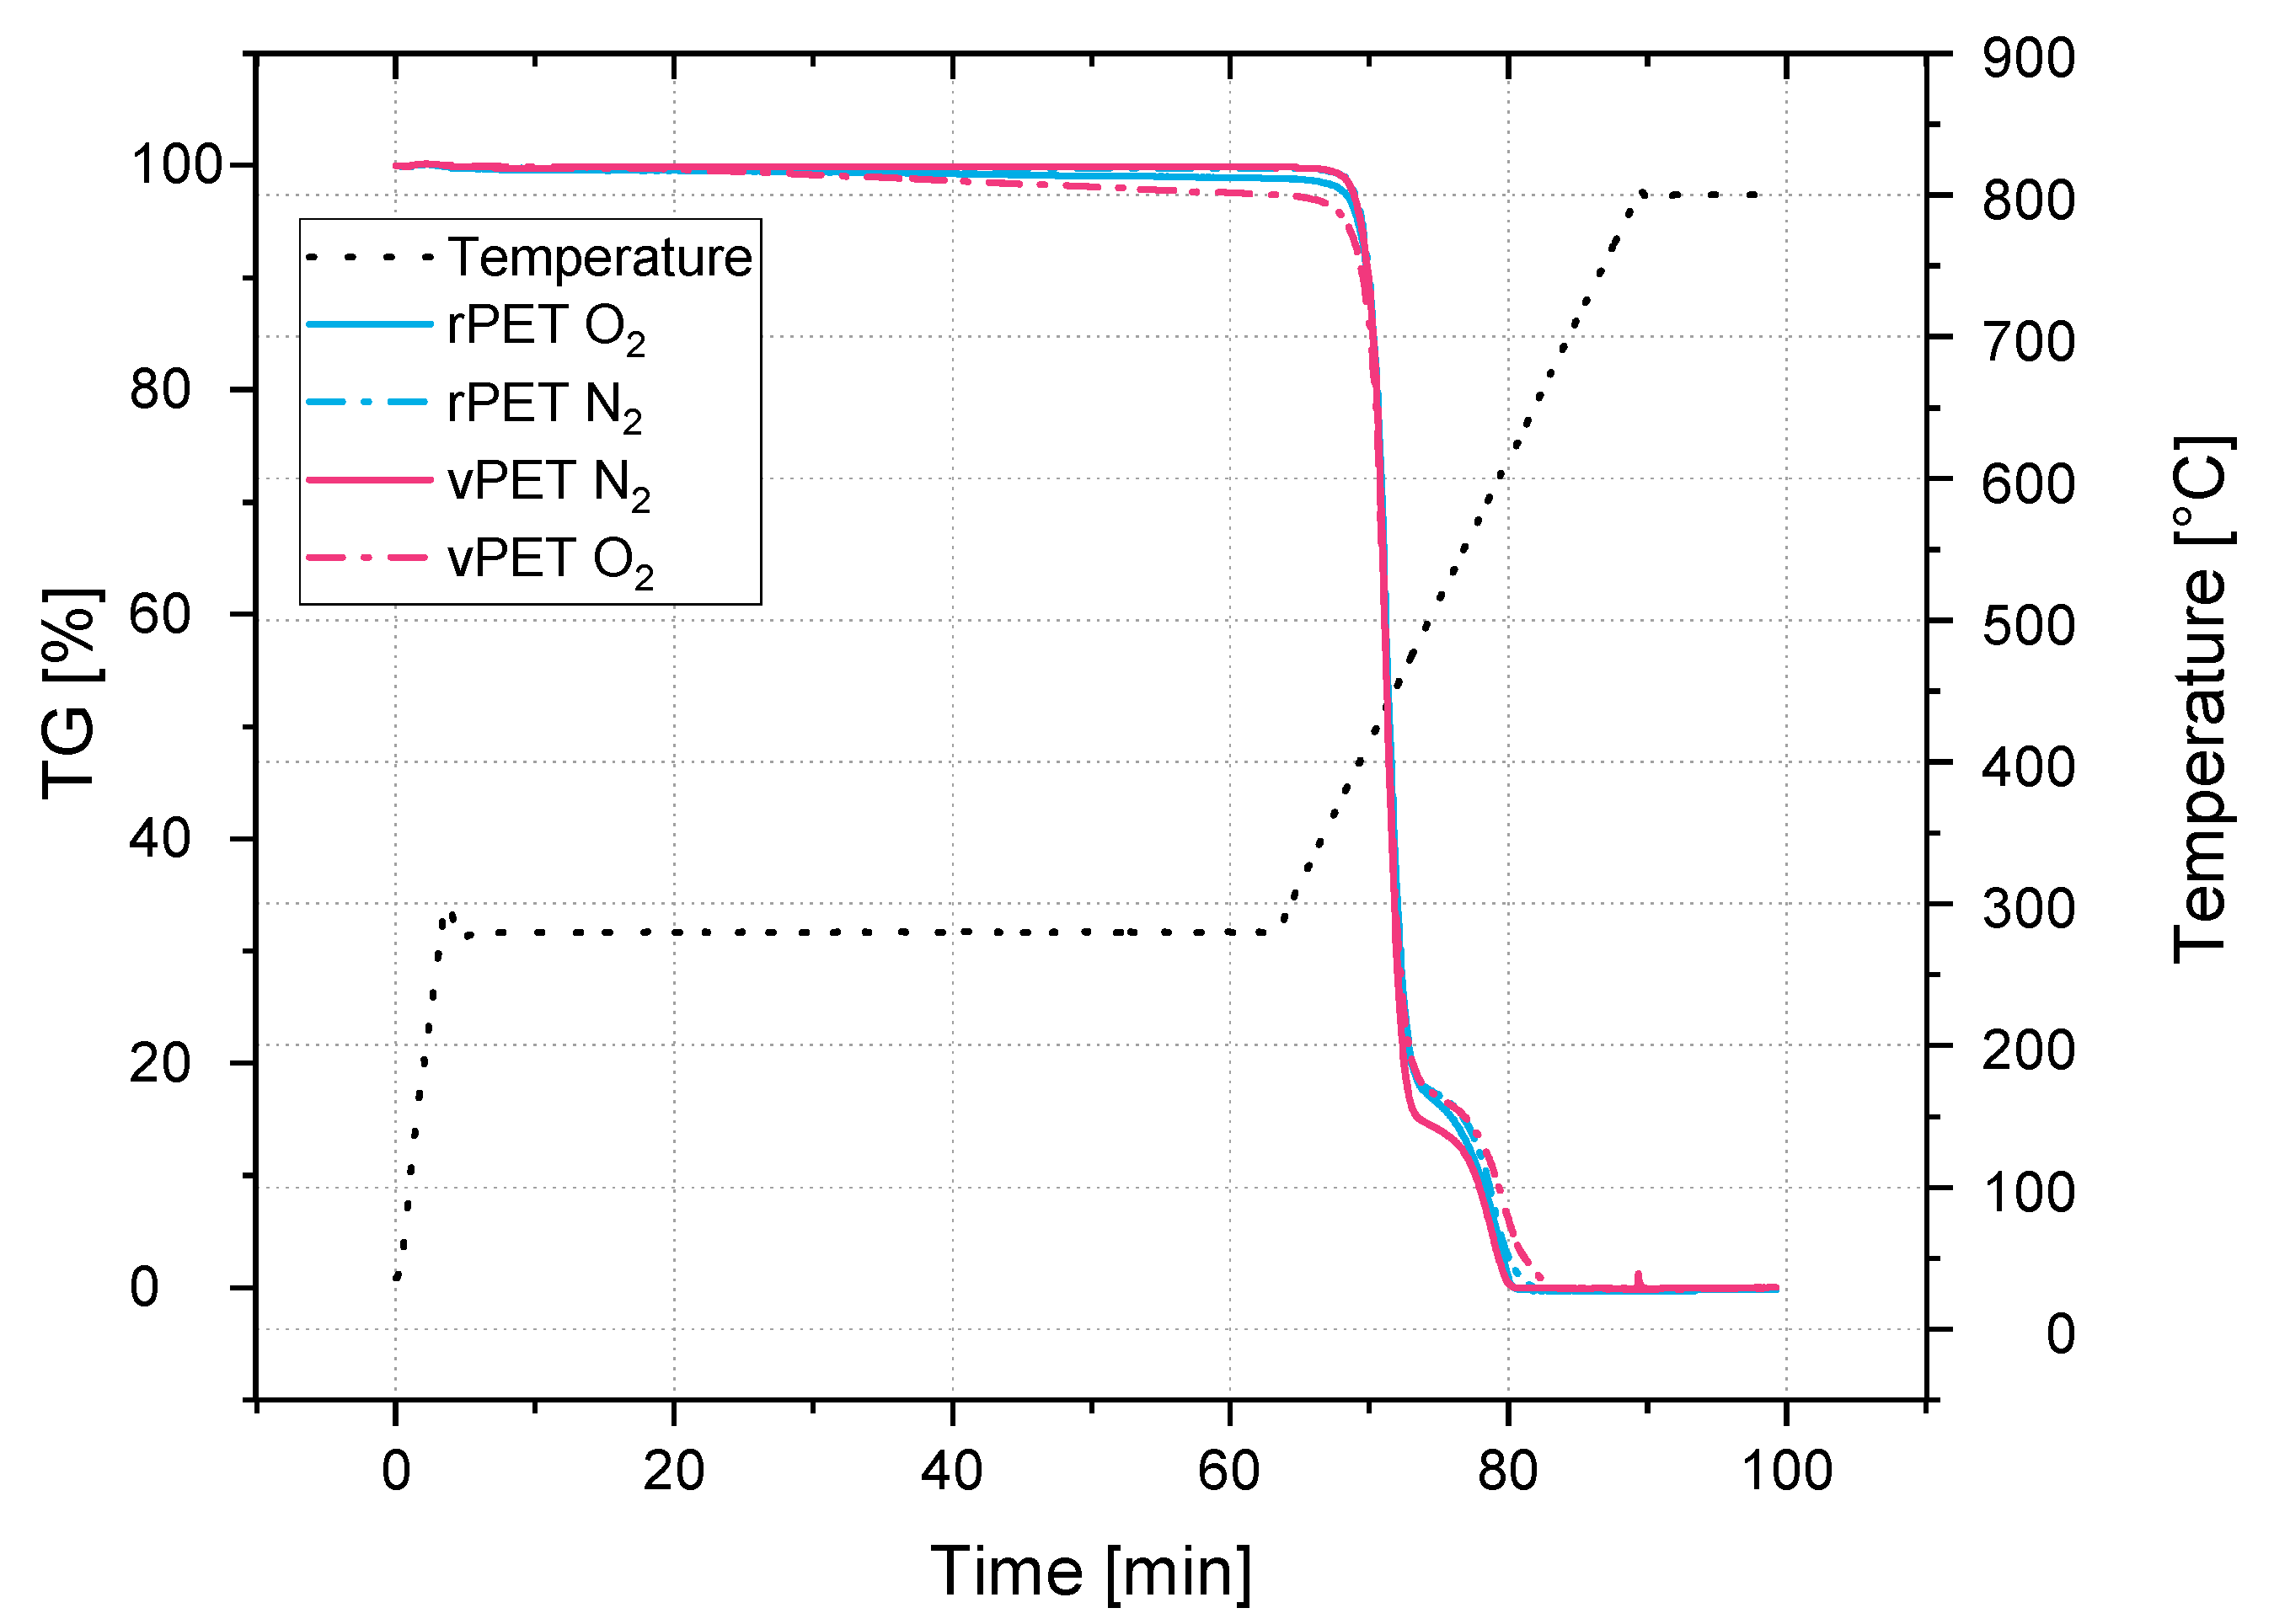
Similar to the point presented previously is the degradation of PET: this material degrades hydrolytically and thermally. Depending on prior drying and the processing temperatures, it undergoes different mechanisms of degradation. Which processing temperatures would be sufficient to obtain a stable rheological behavior and what amount of degraded material could still be tolerated need to be studied. The literature presents some degradation analysis of PET, but the results are not in context with the behavior during processing [15,16,18].
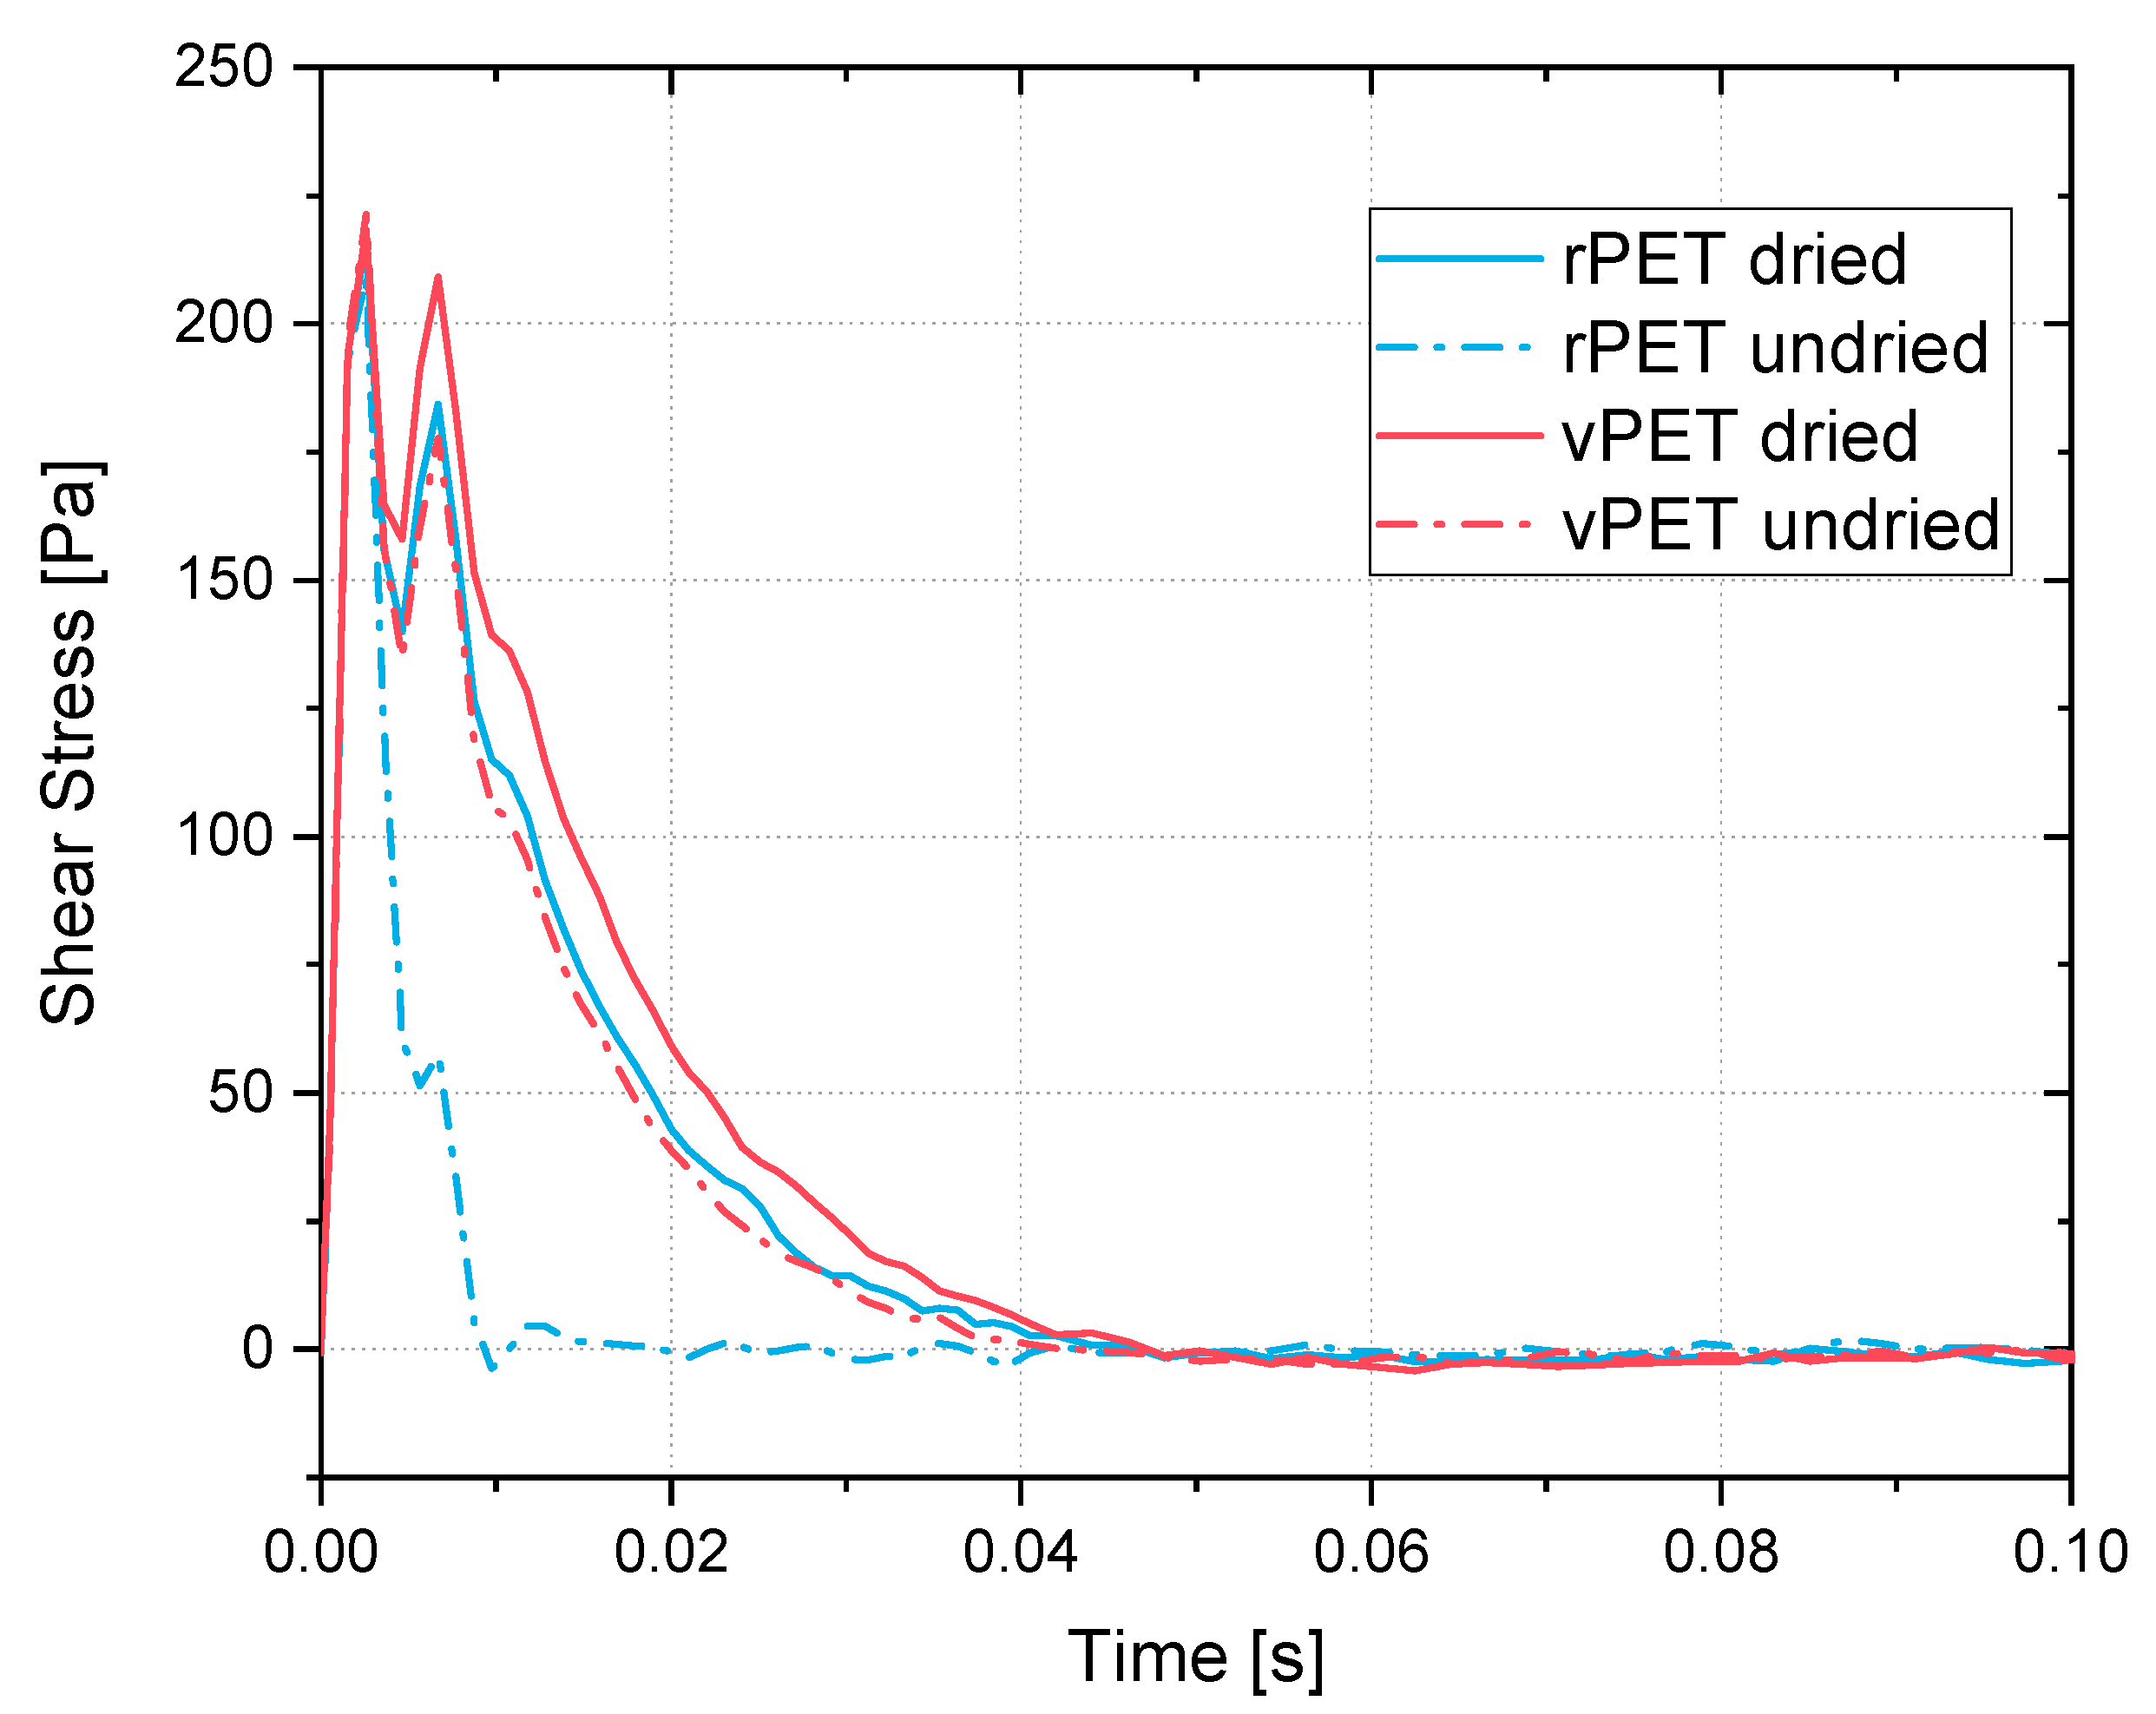
The viscosities of the vPET and the rPET are different in a dried and undried state. During the printing of the filament, different viscosities cause different material throughput through the nozzle. If the printing speed is equal for the different cases, there will be a variation in the amount of printed material. Therefore, the speeds must be adapted depending on the rheological behavior in order to obtain a homogeneous print. This could be complemented with an analysis of the influence of the amount of virgin PET mixed with the recycled one during extrusion. Different ratios could be tested in order to produce a stable and strong filament, using the highest amount of recycled material as possible.

Author Contributions

Conceptualization, M.B.S.; methodology, M.B.S.; validation, M.B.S.; formal analysis, M.B.S.; investigation, M.B.S.; data curation, M.B.S.; writing—original draft preparation, M.B.S.; writing—review and editing, M.B.S., G.A.M.C. and M.G.; visualization, M.B.S.; supervision, G.A.M.C., M.G., W.V. and T.A.O. All authors have read and agreed to the published version of the manuscript.

Funding

This research received no external funding.

Institutional Review Board Statement

Not applicable.

Informed Consent Statement

Not applicable.

Acknowledgments

We thank Placon, especially Nabil Kacem, for providing the virgin and recycled resin, as well as for their great support and input. Further acknowledgement goes to Teel, especially to Chris O’Connor, who gave invaluable input regarding the extrusion. We also thank Timothy W. Womer and Nicole E. Zander for their helpful advice and support throughout the process.

Conflicts of Interest

The authors declare no conflict of interest.

References

  1. Europe Plastics. Plastics—The facts 2020. Plast. Eur. 2020, 1, 1–64. Available online: https://www.statista.com/statistics/282732/global-production-of-plastics-since-1950/ (accessed on 9 January 2022).
  2. d’Ambrières, W. Plastics recycling worldwide: Current overview and desirable changes. Field Actions Sci. Rep. J. Field Actions 2019, 12–21. [Google Scholar]
  3. Europe Plastics. Plastics—The facts 2021. Plast. Eur. 2021, 1, 1–34. [Google Scholar]
  4. Rudolph, N.; Kiesel, R.; Aumnate, C. Understanding Plastics Recycling: Economic, Ecological, and Technical Aspects of Plastic Waste Handling; Carl Hanser Verlag GmbH & Co., KG: Munich, Germany, 2020. [Google Scholar]
  5. Awaja, F.; Pavel, D. Recycling of PET. Eur. Polym. J. 2005, 41, 1453–1477. [Google Scholar] [CrossRef]
  6. Allen, R.D.; James, M.I. Chemical Recycling of PET. In Circular Economy of Polymers: Topics in Recycling Technologies; American Chemical Society: Washington, DC, USA, 2021; pp. 61–80. [Google Scholar]
  7. Bartolome, L.; Imran, M.; Cho, B.G.; Al-Masry, W.A.; Kim, D.H. Recent developments in the chemical recycling of PET. Mater. Recycl.-Trends Perspect. 2012, 406, 576–596. [Google Scholar]
  8. Shojaei, B.; Abtahi, M.; Najafi, M. Chemical recycling of PET: A stepping-stone toward sustainability. Polym. Adv. Technol. 2020, 31, 2912–2938. [Google Scholar] [CrossRef]
  9. Wohlers, T.; Campbell, R.I.; Huff, R.; Diegel, O.; Kowen, J. Wohlers Report 2019: 3D Printing and Additive Manufacturing State of the Industry; Wohlers Associates: Fort Collins, CO, USA, 2019. [Google Scholar]
  10. Gebhardt, A.; Hötter, J.S. Additive Manufacturing: 3D Printing for Prototyping and Manufacturing; Carl Hanser Verlag GmbH Co., KG: Munich, Germany, 2016. [Google Scholar]
  11. Zander, N.E.; Gillan, M.; Lambeth, R.H. Recycled polyethylene terephthalate as a new FFF feedstock material. Addit. Manuf. 2018, 21, 174–182. [Google Scholar] [CrossRef]
  12. Brooks, D.W.; Giles, G.A. (Eds.) PET Packaging Technology; Taylor & Francis US: Florence, KY, USA, 2002. [Google Scholar]
  13. Osswald, T.A.; Baur, E.; Rudolph, N. Plastics Handbook: The Resource for Plastics Engineers; Carl Hanser Verlag GmbH Co., KG: Munich, Germany, 2019. [Google Scholar]
  14. Giles, H.F., Jr.; Mount, E.M., III; Wagner, J.R., Jr. Extrusion: The Definitive Processing Guide and Handbook; William Andrew: Norwich, NY, USA, 2004. [Google Scholar]
  15. Jabarin, S.A.; Lofgren, E.A. Thermal stability of polyethylene terephthalate. Polym. Eng. Sci. 1984, 24, 1056–1063. [Google Scholar] [CrossRef]
  16. Villain, F.; Coudane, J.; Vert, M. Thermal degradation of poly (ethylene terephthalate) and the estimation of volatile degradation products. Polym. Degrad. Stab. 1994, 43, 431–440. [Google Scholar] [CrossRef]
  17. Marshall, I.; Todd, A. The thermal degradation of polyethylene terephthalate. Trans. Faraday Soc. 1953, 49, 67–78. [Google Scholar] [CrossRef]
  18. Pirzadeh, E.; Zadhoush, A.; Haghighat, M. Hydrolytic and thermal degradation of PET fibers and PET granule: The effects of crystallization, temperature, and humidity. J. Appl. Polym. Sci. 2007, 106, 1544–1549. [Google Scholar] [CrossRef]
  19. Rauwendaal, C. Polymer Extrusion; Carl Hanser Verlag GmbH Co., KG: Munich, Germany, 2014. [Google Scholar]
  20. Michaeli, W.; Schmitz, T. Processing Polyethylene Terephthalate on a Single Screw Extruder without Predrying using Hopper-and Melt Degassing. In Proceedings of the ANTEC 2004, 62nd Annual Technical Conference, Chicago, IL, USA, 16–20 May 2004; Volume 1, pp. 294–298. [Google Scholar]
  21. Osswald, T.A. Understanding Polymer Processing: Processes and Governing Equations; Carl Hanser Verlag GmbH Co., KG: Munich, Germany, 2017. [Google Scholar]
  22. ASTM D1238-13; Standard Test Method for Melt Flow Rates of Thermoplastics by Extrusion Plastometer. ASTM International: West Conshohocken, PA, USA, 2004.
  23. ISO 3384-1; Rubber, Vulcanized or Thermoplastic—Determination of Stress Relaxation in Compression—Part 1: Testing at Constant Temperature. International Organization for Standardization: Geneva, Switzerland, 2019.
  24. ISO 6721-2; Plastics-Determination of Dynamic Mechanical Properties. Part 2: Torsion Pendulum Method. International Organization for Standardization: Geneva, Switzerland, 1994.
  25. ISO 11358-1: 2014; Plastics. Thermogravimetry (TG) of Polymers. Part 1: General Principles. International Organization for Standardization: Geneva, Switzerland, 2014.
  26. Ehrenstein, G.W.; Riedel, G.; Trawiel, P. Thermal Analysis of Plastics: Theory and Practice; Carl Hanser Verlag GmbH Co KG: Munich, Germany, 2012. [Google Scholar]
  27. ISO 11357-1: 2009; Kunststoffe–Dynamische Differenz-Thermoanalyse (DSC)–Teil 1: Allgemeine Grundlagen. International Organization for Standardization: Geneva, Switzerland, 2009.
  28. ASTM International. Standard Test Method for Tensile Properties of Plastics; ASTM International: West Conshohocken, PA, USA, 2014. [Google Scholar]
  29. Hamad, K.; Kaseem, M.; Deri, F. Recycling of waste from polymer materials: An overview of the recent works. Polym. Degrad. Stab. 2013, 98, 2801–2812. [Google Scholar] [CrossRef]
  30. Cui, J.; Forssberg, E. Mechanical recycling of waste electric and electronic equipment: A review. J. Hazard. Mater. 2003, 99, 243–263. [Google Scholar] [CrossRef]
  31. Pingale, N.D.; Shukla, S.R. Microwave assisted ecofriendly recycling of poly (ethylene terephthalate) bottle waste. Eur. Polym. J. 2008, 44, 4151–4156. [Google Scholar] [CrossRef]
  32. Achilias, D.S.; Redhwi, H.H.; Siddiqui, M.N.; Nikolaidis, A.K.; Bikiaris, D.N.; Karayannidis, G.P. Glycolytic depolymerization of PET waste in a microwave reactor. J. Appl. Polym. Sci. 2010, 118, 3066–3073. [Google Scholar] [CrossRef]
  33. Elamri, A.; Lallam, A.; Harzallah, O.; Bencheikh, L. Mechanical characterization of melt spun fibers from recycled and virgin PET blends. J. Mater. Sci. 2007, 42, 8271–8278. [Google Scholar] [CrossRef]
Figure 1. Development of worldwide plastic production from 1950 to 2019 (adapted from [1]).
Recycling 07 00069 g001
Figure 2. Total revenue for the additive manufacturing market in the world from 1993 to 2018 and a forecast for 2025 in billion dollars (adapted from [9]).
Recycling 07 00069 g002
Figure 3. Optical image of the pellets after the granulator.
Recycling 07 00069 g003
Figure 4. Scheme of the components for the filament extrusion.
Recycling 07 00069 g004
Figure 5. Filament outer diameter with size tolerances at 2.825 mm and 2.875 mm and ovality.
Recycling 07 00069 g005
Figure 6. Results of the Standard Test Method for Melt Flow Rates.
Recycling 07 00069 g006
Figure 7. Shear stress curves of the relaxation test.
Recycling 07 00069 g007
Figure 8. Degraded rPET after relaxation test.
Recycling 07 00069 g008
Figure 9. Complex viscosity curves for dried and undried rPET and vPET at 280 °C.
Recycling 07 00069 g009
Figure 10. TGA of the isothermal degradation at 280 °C in different atmospheres.
Recycling 07 00069 g010
Figure 11. TGA in nitrogen atmosphere for the determination of pyrolytic black carbon content.
Recycling 07 00069 g011
Figure 12. Second heating and cooling cycle of the DSC measurements at 10 K/min.
Recycling 07 00069 g012
Figure 13. Second heating cycle of the DSC measurement at 20 K/min.
Recycling 07 00069 g013
Figure 14. Stress–strain diagram at 0° bead orientation.
Recycling 07 00069 g014
Figure 15. Stress–strain diagram at 90° bead orientation.
Recycling 07 00069 g015
Figure 16. Stress–strain diagram for samples with a ductile fracture at 0° bead orientation.
Recycling 07 00069 g016
Figure 17. Statistical dispersion of the tensile stress results (left) and of the E-modulus (right).
Recycling 07 00069 g017
Table 1. Temperature settings in [°C] for the twin screw extruder.
Zone 1Zone 2Zone 3Zone 4Zone 5Zone 6Zone 7Zone 8Die
240245245245250250250250245
Table 2. Settings for the printing of the tensile test specimens with the LulzBot TAZ5.
Nozzle TemperaturePrint Bed TemperatureLayer Thickness
270 [°C]90 [°C]0.2 [mm]
Printing speedFlow multiplierBuild platform material
2000 [mm/min]1 [-]Glass
Table 3. Median line of the results of the MFI on Figure 6.
Dried vPETDried rPETUndried vPETPETG
18.2 [g/10 min]35.5 [g/10 min]46.5 [g/10 min]47.6 [g/10 min]
Table 4. Starting shear stresses of the relaxation test.
Dried vPETDried rPETUndried vPETUndried rPET
224 [Pa]223 [Pa]220 [Pa]220 [Pa]
Table 5. Starting complex viscosity during the oscillation test.
vPET DriedrPET DriedvPET UndriedrPET Undried
434 [Pa s]363 [Pa s]337 [Pa s]106 [Pa s]
Table 6. Results of the second heating cycle of the DSC.
Melting PeakHeat of FusionCrystallinity
vPET246.5 [°C]−35.25 [J/g]25.2 [%]
rPET247.1 [°C]−37.83 [J/g]27 [%]
Table 7. E-modulus, presented in the first row, and tensile stress, presented in the second row, of the samples in Figure 14.
Mechanical PropertyrPET 0°_p2_5rPET 0°_p4_1vPET 0°_p2_2vPET 0°_p3_4PETG 0°_p1_1
E [MPa]16001720192017201360
σ f [MPa]52.553565245
Table 8. E-modulus, presented on the first row, and tensile stress, presented on the second row, of the samples in Figure 15.
Mechanical PropertyrPET 90°_p2_1vPET 90°_p1_4PETG 90°_p1_4
E [MPa]200019501200
σ f [MPa]335224
Publisher’s Note: MDPI stays neutral with regard to jurisdictional claims in published maps and institutional affiliations.

