1. Introduction
The global textile industry continues to expand, largely driven by the growing demand caused mainly by fast fashion and a switch in consumer behaviors that prioritize frequent apparel turnover over durability. As a result, textile waste is increasing at an alarming rate. On average, textiles’ consumption in the EU increased from 17 kg per person in 2019 to 19 kg per person in 2022 [
1]. Therefore, the EU has taken several actions to address the growing textile waste problem. One of the initial steps was the introduction of mandatory separate collection for textile waste from 1 January 2025, as well as emphasizing prevention, reuse, and recycling over disposal [
2]. Additionally, the EU Strategy for Sustainable and Circular Textiles has been published, with the aim of making textiles more durable, repairable, reusable, and recyclable by 2030. The key steps in reaching those goals shall be the introduction of a mandatory extended producer responsibility (EPR) system; different eco-design requirements; a ban on the destruction of unsold textiles; and boosting sorting, reuse, and recycling infrastructure [
3]. Supporting these measurements, the EU also foresees the rollout of a Digital Product Passport (DPP) as part of the Deliver Proven Traceability initiative. These tolls provide verified digital records of material composition and product history. Accurate fiber content detection, especially for polyester/cotton blends, is essential for enabling traceability in textile circularity [
4].
This has also brought more attention to recycling non-reusable textiles. Currently, the state of textile recycling is still not optimal, with only low levels of textile waste being effectively recycled. A major bottleneck is the lack of efficient sorting systems, which are essential for sorting textiles by fiber type and content, as subsequent recycling processes are specifically tailored to different types of textile materials. This is especially challenging for blended textiles such as polyester/cotton blends (also known as polycotton), which is the most common blend, accounting for approximately 9% of all textile waste [
5]. An investigation of post-consumer textile waste in Vienna, Austria has further highlighted the prevalence of cotton- and polyester-based materials, indicating that polyester/cotton blends represent a significant share of the waste stream [
6]. As the fast fashion industry continues to expand, the use of inexpensive, mass-produced materials like polyester/cotton blend is expected to increase even further. While this blend offers cost advantages for both manufacturers and consumers, its blended fiber composition poses significant challenges for recycling. Conventional recycling methods struggle to effectively process blended fibers, making polyester/cotton blend difficult to handle. Although significant research efforts are currently underway in the field of polyester/cotton separation and recycling, these approaches depend on accurate information about the fiber composition of the input material [
7,
8,
9,
10,
11,
12]. Recent reviews highlight the need for efficient sorting solutions; in this context, NIR spectroscopy presents itself as a promising technology, offering fast, non-invasive, real-time measurements without the need for sample preparation [
13,
14]. It is already being used in textile sorting applications, and continuous research supports its potential [
15,
16,
17,
18,
19,
20]. When it comes to its capabilities for quantitative measurements, however, research is still in its infancy. This is particularly true for research focusing on post-consumer textiles (textile waste), where real-world variability presents additional complexity. Yao et al. [
21] analyzed waste-derived polyester/cotton blends using a portable NIR spectrometer, achieving a high prediction accuracy of up to 97% and errors within ±3%. However, the analysis was limited to specific wavelength ranges of 1400–1700 and 1900–2200 nm and was conducted under fully controlled laboratory conditions. More application-focused experiments were performed by Becker et al. [
16]. Their study showed promising results (4% prediction error) for identifying polyester-rich textiles and demonstrated a scalable application of NIR in a real-world recycling facility. Nevertheless, the focus remained primarily on polyester detection, with a low number of samples and without introducing the influence of material heterogeneity in waste textiles. Mäkelä et al. [
22] introduced hyperspectral NIR imaging combined with machine vision to predict the polyester content. Their model achieved prediction errors between 2.2% and 4.5% and offered spatially resolved fiber content maps, which are valuable for identifying textile heterogeneity. However, the study focused on polyester quantification in and post- as well as pre-consumer textiles without further investigating other influences on quantification. The study performed by Paz and Sousa [
23] additionally compared NIR and MIR spectroscopy, reporting lower calibration errors for NIR (of 3.3%) and validation errors of 3.6%. However, it is important to note that their analysis was conducted on controlled samples rather than on post-consumer textiles, limiting its applicability to real-world textile waste streams.
Building on the existing research, this study introduces a more comprehensive approach to cotton content quantification in post-consumer polyester/cotton blended textiles using NIR spectroscopy, with a focus on practical implementation across different usage contexts. This study combines two types of NIR spectroscopic instruments: an industrial NIR sorting system of lab-scale size and a handheld NIR spectrometer. Each device was selected to serve a specific purpose within the study’s framework. The NIR sorter represents an automated solution already integrated into textile sorting facilities. It enables rapid and contactless measurements of materials and reflects real-world industrial conditions. In contrast, the handheld NIR spectrometer offers a portable, low-cost alternative that is increasingly used for on-site textile assessment, particularly in settings with limited infrastructure or for quality checks supporting the automated systems.
The combination of both instruments, each covering different but complementary regions of the NIR spectrum, enables a more comprehensive evaluation of spectral features relevant to cotton and polyester across distinct wavelength ranges. By including both instruments, this study investigates how differences in spectral coverage, measurement geometry, and resolution influence cotton content quantification under similar conditions. To ensure comparability, both instruments measured the same set of post-consumer textile samples, which exhibited varying material characteristics. Unlike previous studies that primarily focused on controlled laboratory conditions or employed only a single type of NIR instrument, this study integrates two complementary setups, each representing different practical use cases and spectral capabilities. This approach bridges the gap between experimental accuracy and industrial relevance while also addressing the complexity of analyzing heterogeneous post-consumer textile waste.
To simulate real-world automated sorting conditions, a lab-scale NIR sorter (911–1677 nm) was utilized. This setup enabled evaluation of the performance of NIR-based quantification under conditions closely replicating those found in industrial environments. In parallel, a handheld NIR spectrometer (1596–2396 nm) was used to explore the capabilities and limitations of portable spectroscopy, which are increasingly being considered for random material characterization on site. This dual-method approach aided the analysis of the limitations and challenges met by the current NIR technology for quantification of cotton in polyester/cotton post-consumer textiles, comparing accuracy across different spectral ranges and use cases.
The samples used in the study consisted of post-consumer textiles, both apparel and home textiles, collected from various sources containing 100% cotton, 100% polyester and polyester/cotton blends of 20–95% cotton. In total, 190 samples were used, of which 79 as training set for model training and 111 as test set for model validations. To improve the reliability of the quantification, the samples used in these experiments exhibited different textile characteristics—such as surface color, textile structure, and application types—to address the complexity and variability of real-world post-consumer textile waste and to better understand their impact on quantification performance.
Additionally, many textiles undergo mercerization, the most common form of alkaline treatment, whose influence on quantification was therefore also examined. Alkaline treatment, commonly in the form of mercerization, is a widely used method for modifying the physical and chemical properties of textiles, particularly cellulose-based materials such as cotton and cotton-rich textiles (including polyester/cotton blends), in order to enhance properties such as strength, dye shade, and increased luster [
24,
25]. Alkaline treatment is commonly used in high-quality apparel and home textiles, yet its presence in post-consumer textiles is often undocumented and difficult to identify. Given its potential impact on fiber structure and spectral properties, understanding the effects of such treatments is essential for model development. To address this, measurements were performed using controlled laboratory samples with a constant cotton content of 50% to simulate conditions potentially present in post-consumer textiles and to analyze the influence of alkaline treatment on the quantification of polyester/cotton blends.
2. Results and Discussion
2.1. Spectral Acquisition and Model Training
The acquired spectra for each training sample reveal differences in the intensities of characteristic peaks associated with polyester and cotton.
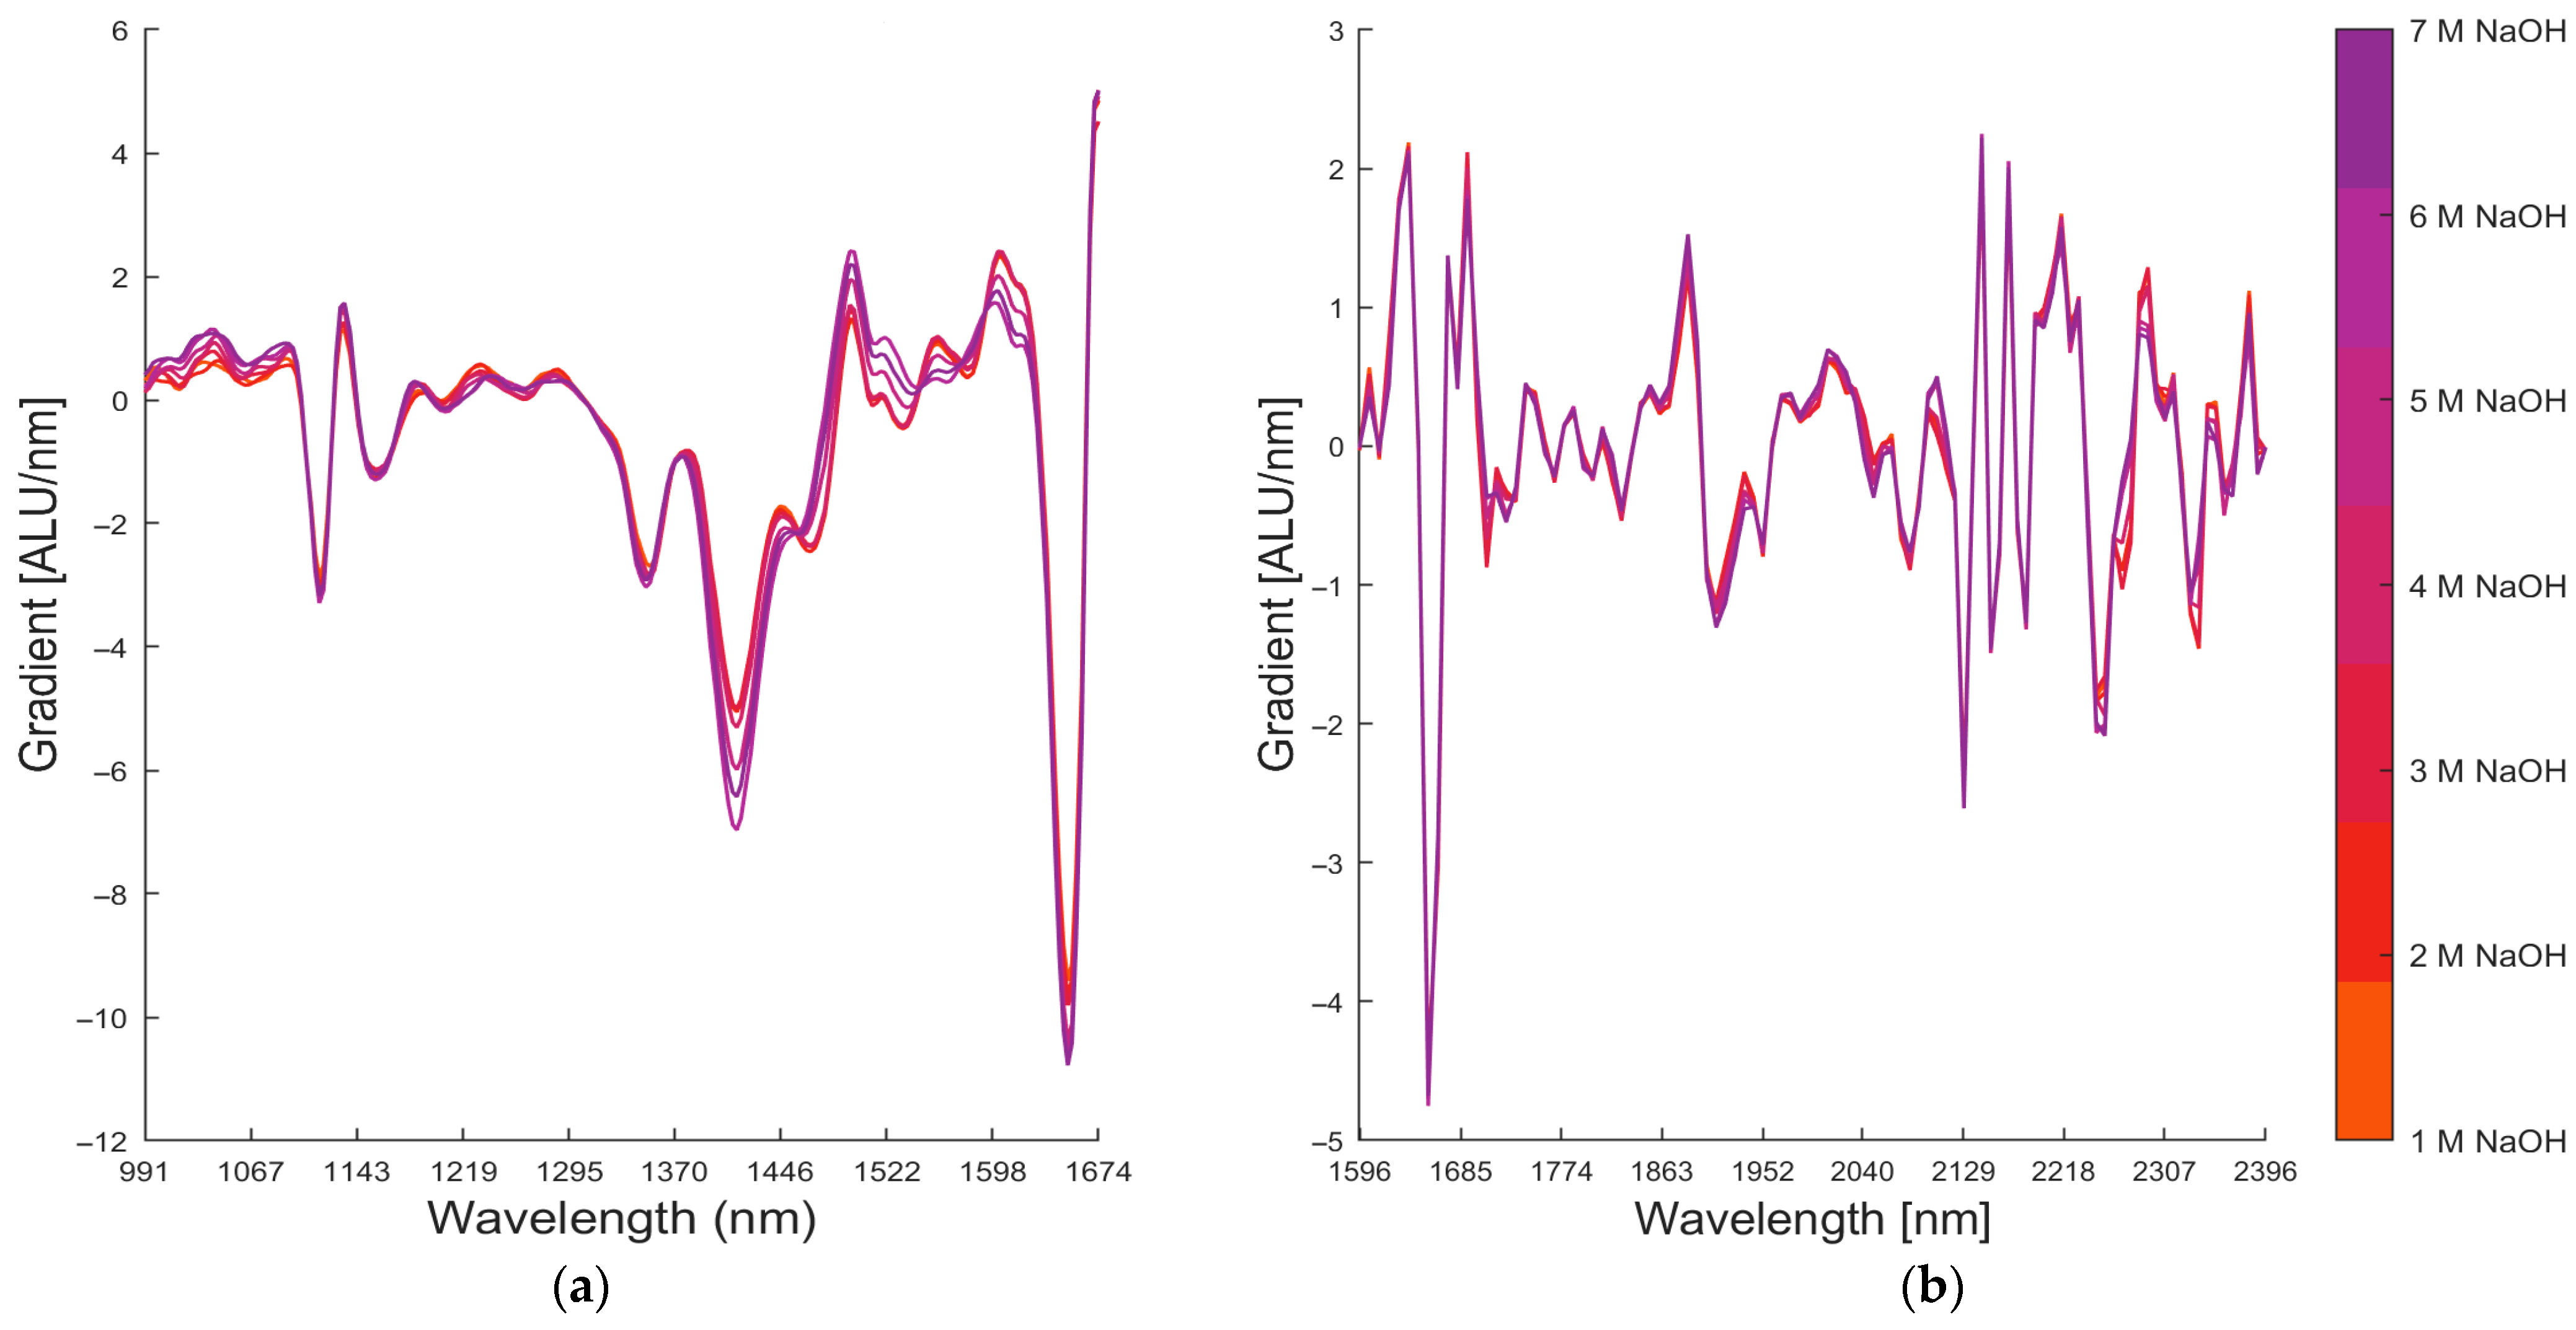
Figure 1 shows the spectral trend between 0 and 100% cotton, where the spectra shown in lighter colors represent lower cotton content, while darker-colored spectra correspond to higher percentages of cotton. As the cotton content in the blend increases, the intensity of the cotton characteristic peaks also increases. Prior to analysis, the spectra were pre-processed using a first derivative followed by smoothing for the NIR sorter and SNV normalization after derivation for the handheld NIR spectrometer. The pre-processed spectra are plotted as the first derivative of absorbance, commonly referred to as the gradient (y-axis, in ALU/nm) versus wavelength (x-axis). Gradient indicates how the signal changes with wavelength, and ALU/nm (absorbance line units per nanometer) reflects the rate of change in the absorbance-like signal, enhancing variations in spectral features across the range and thus allowing relative evaluation.
For the NIR sorter, the most prominent absorption bands for cotton appear in the ranges of 1130–1200 nm, corresponding to the second overtone of C-H stretching; 1355–1470 nm, attributed to the first overtone of O-H stretching and combination bands of O-H bending and C-O stretching; and 1600–1650 nm, associated with combination bands involving O-H and C-H vibrations. These are typical of cellulose-based materials [
26,
27]. For the handheld NIR spectrometer, cotton shows absorption bands at 1860–1950 nm and 2000–2100 nm, primarily resulting from combination bands of O-H stretching and C-O stretching vibrations [
28]. A similar trend is observed for polyester, with key absorption regions in the 1100–1150 nm range for the NIR sorter, related to the second overtone of C-H stretching and the 1380–1630 nm range, corresponding to overtones and combination bands involving C-H and C=O groups [
16,
26]. For the handheld spectrometer, polyester shows characteristic bands at 1600–1700 nm and 2100–2200 nm, primarily linked to combination bands of C=O stretching and C-H deformation, especially from ester functional groups that are characteristic of polyester [
23,
29].
Based on acquired spectral differences, PLS models were trained. The full modeling procedure, including definitions of evaluation metrics such as R
2, RMSEC, RMSEP and bias are described in
Section 3.2. For the NIR sorter, the model using three LVs was selected to minimize model complexity while maintaining acceptable predictive performance, resulting in an RMSEC of 8.6% and an R
2 of 0.93. These results demonstrate robustness and reliable predictive performance of the model. The use of three LVs indicates that the model effectively captures the essential spectral variance required for accurate quantification, while minimizing the risk of overfitting.
PLS models were developed for both instruments using the same training set and number of LVs to ensure consistent analysis. This configuration yielded an RMSEC of 8.1% and an R2 of 0.94, indicating slightly improved predictive accuracy while maintaining a consistent level of model complexity.
2.2. Model Validation
The models were validated using an independent test set, with performance metrics calculated based on a single train–test split. No repeated cross-validation was applied. This approach was intentionally chosen to simulate a realistic operational scenario, reflecting typical deployment conditions where models are trained once and used in practice without repeated retraining or resampling. The results are not intended for direct comparison between the instruments but rather to identify the respective challenges and limitations associated with each setup.
The model developed for the NIR sorter demonstrated its validation performance by yielding an R
2 of 0.98, an RMSEP of 7.4%, and bias of 1.8%. Although it may appear unexpected, the RMSEP was lower than RMSEC in this case. The training (calibration) set was deliberately constructed to cover a broad range of variability, reflecting the heterogeneity of post-consumer textile waste. The independent test (validation) set, compiled separately, also exhibited high variability but was well represented within the broader calibration domain. This likely enabled the model to generalize effectively to new samples, resulting in a lower prediction error (RMSEP) than the calibration error (RMSEC). While this outcome is uncommon, it has already been discussed in the literature, particularly when the characteristics of the test samples fall within the variability modeled by the calibration set [
30].
While Becker et al. achieved predictive performance R
2 of 0.99 and RMSEP of 3.6%, our model reflects slightly lower correlation and a higher prediction error, likely due to the greater variability introduced by increased sample diversity, which may have offset the advantages of a larger training and test set. Nonetheless, the results indicate a fair balance between predicted and reference values, with adequate average prediction performance, especially when addressing the complexity of heterogenous post-consumer textile samples. Additionally, the calculated bias suggests a slight overestimation of cotton content by 1.8%. While the RMSEP is comparatively higher, the low bias suggests that the model’s errors are largely random rather than systematic, suggesting that the model maintains a reasonable balance. The validation results acquired using the NIR sorter are shown in
Figure 2, which presents a plot of predicted versus reference values.
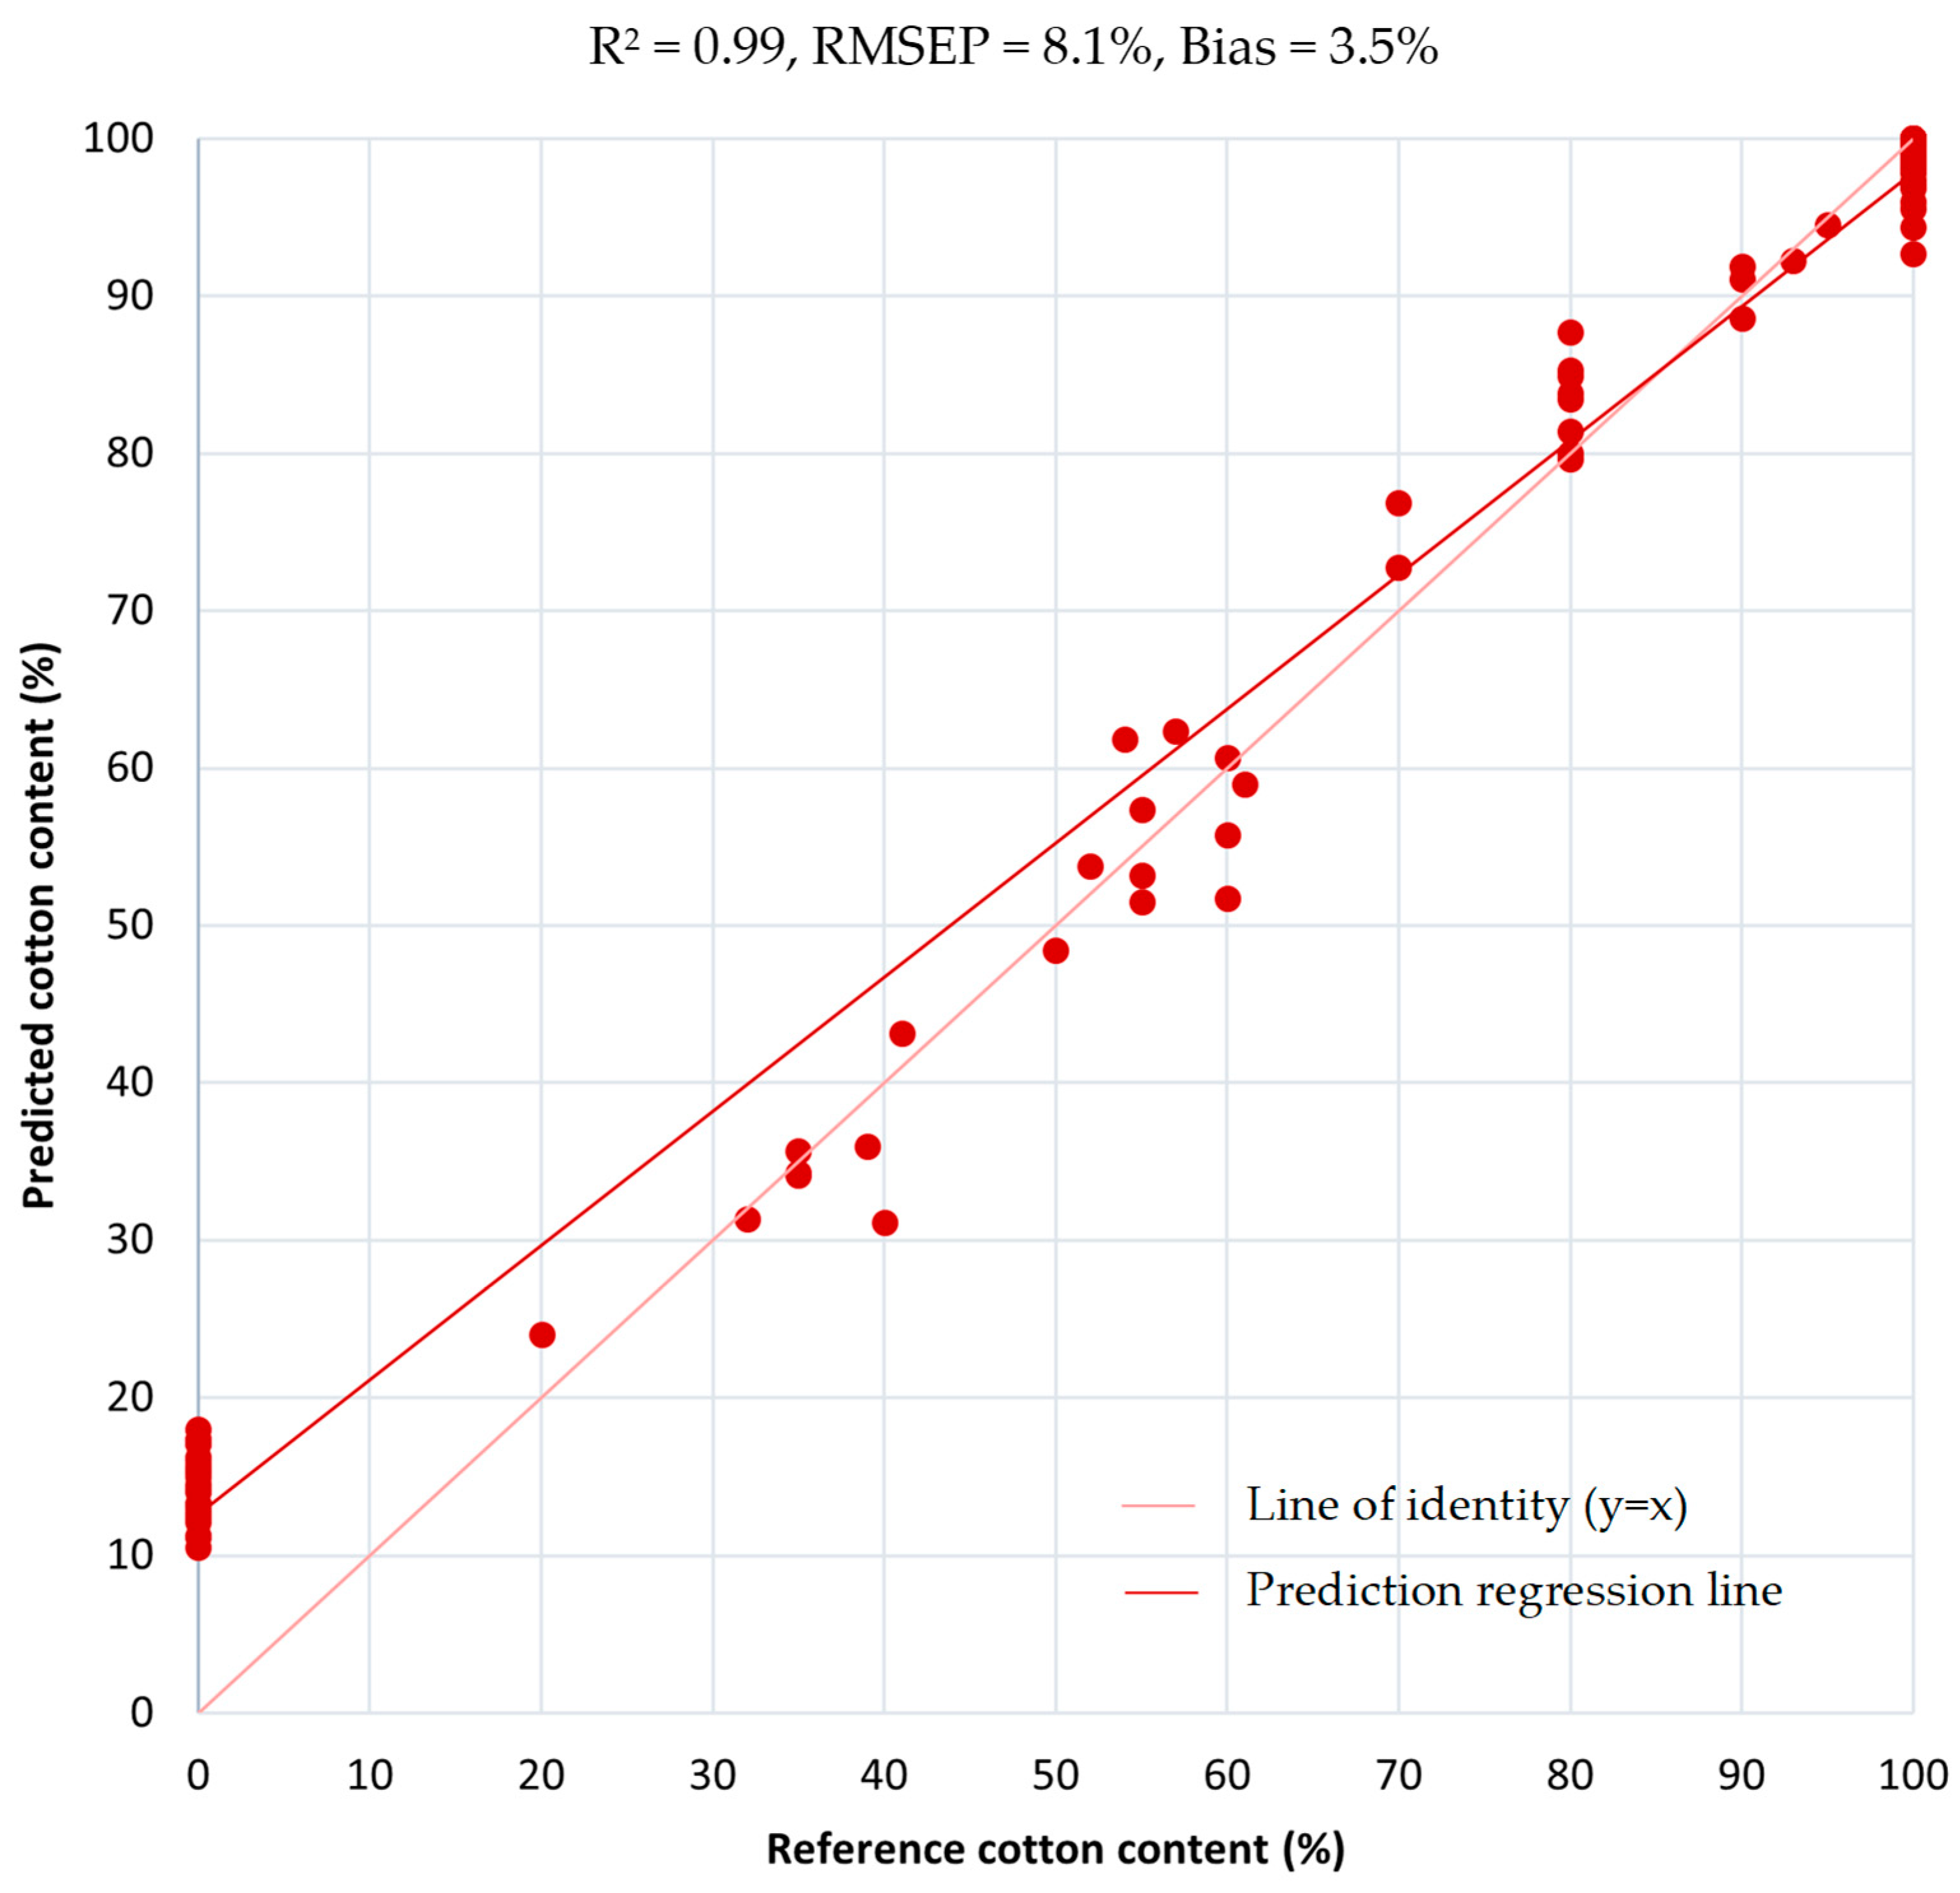
Method validation for the handheld NIR spectrometer resulted in an R
2 of 0.99, an RMSEP of 8.1%, and bias of 3.5%.
Figure 3 provides a visualization of the validation results acquired using the handheld NIR spectrometer. The model shows a relatively high R
2 accompanied by increased RMSEP and bias values, indicating higher prediction errors. This may be due to increased variability within the measurements, as well as a smaller and inconsistent sampling area, as each sample was measured at only five points. However, the scatter of the predicted cotton content around the reference line (reference cotton content) is lower, though the RMSEP and bias remain higher, likely influenced by the presence of outliers at 0% cotton content. In particular, the predicted cotton content for samples containing 0% cotton (i.e., 100% polyester) is notably overestimated, a trend further supported by the analysis of the average bias and RMSEP across different cotton content levels (
Table 1).
A degree of scatter from the line of identity is noticeable in the measurements from both instruments, with scattering differing across cotton content levels. To better understand this behavior, an additional targeted assessment was conducted by calculating RMSEP and bias within specific cotton content ranges for each instrument. The results are presented in
Table 1 to provide a structured overview of performance across different content intervals.
The RMSEP and bias values differ between the two instruments, with the NIR sorter showing higher average prediction errors and systematic deviation than the handheld NIR spectrometer. The RMSEP values for both instruments indicate generally balanced performance, although the NIR sorter results in higher error for most of the contents. When focusing specifically on polyester/cotton blends, the results stay in the same range per instrument. However, more distinct differences are present in samples composed entirely of either polyester or cotton. In these cases, cotton samples show the lowest prediction error, while polyester samples show the highest. This suggests that the presence of cotton in the sample contributes to improved quantification accuracy, rather than the model simply detecting the absence of cotton.
In contrast, the bias results show a clear difference, indicating better stability in the model using handheld NIR spectroscopy. This may be due to various factors but mainly due to the difference in how each device interacts with the sample surface. The handheld NIR spectrometer measures directly in contact with the sample, whereas the NIR sorter operates from a distance.
The results obtained from both instruments suggest potential non-linearity in the 0–35% cotton range, as this effect appears in the measurements from both setups. However, identifying the exact point of deviation is challenging due to the limited availability of samples within this range. Although polyester/cotton textiles containing 35% cotton are relatively common, samples with lower cotton content are comparatively rare. This scarcity is consistent with trends in Western Europe, where cotton remains a dominant fiber, accounting for 43% of non-reusable textiles [
5]. Due to the small number of samples in the low-percentage-cotton range (under 35%), the statistical reliability of any interpretation in this interval is limited and must be viewed with caution. Consequently, it is debatable whether this range should be considered relevant for inclusion in the cotton content quantification model.
When samples containing 0–34% cotton were excluded, the models’ accuracies improved. The improvement was especially pronounced in the results acquired with the handheld NIR spectrometer, where the RMSEP dropped significantly from 8.1% to 3.1% and bias from +3.5% to −0.6%. In contrast, the improvement observed for the NIR sorter was smaller, though still notable, with the RMSEP dropping from 7.4% to 6.6% and bias from 1.8% to −0.9%.
To test the linearity of the quantification in the range of 0–35% cotton content, additional models focusing exclusively on this segment were trained to test possible changes in quantification accuracy. The validation results for both instruments are presented in
Figure 4. The results still exhibit a certain level of variability, with a calculated RMSEP of 3.3% and bias of 1.6% for the NIR sorter and RMSEP of 5.2% and bias of 2.1% for the handheld NIR spectrometer. Overall, some non-linearity appears to be present in the 0–35% cotton content range; however, the 0% cotton samples show lower absolute predictive errors when evaluated using the 0–35%-range model, compared to the full-range (0–100%) model. Given the limited sample size and the practical application-oriented design of the study, which was based on a single train–test split, resampling-based validation methods such as
p-values or confidence intervals were not applied. This evaluation strategy reflects a realistic use-case scenario and prioritizes operational relevance. Accordingly, the currently applied threshold of <35% cotton content reflects a pragmatic decision based on empirical observations and observed model behavior, rather than a validated or universally applicable boundary. The main finding is the detection of non-linearity, which may begin at a lower cotton content and merits further investigation.
Some of the samples containing 0% cotton (i.e., 100% polyester) continue to show significant dispersion when measured with both instruments. This is mainly the case for samples having a shiny surface or low material thickness, which are often semi-transparent (i.e., scarves). Shiny surfaces can scatter light and disrupt NIR sensor performance, which can then lead to misclassification. Therefore, matte and rough surfaces are preferable as they reflect light diffusely, providing more consistent and reliable spectral data for classification [
31,
32,
33,
34]. For thin or semi-transparent materials, partial light transmission may lead to minor background signal contributions. However, thin textiles also reflect less light overall, leading to weaker signals and reduced spectral quality.
2.3. Influence of Different Textile Characteristics on Quantification
Since the PLS model’s accuracy results varied across samples, an additional analysis was conducted to determine whether specific textile characteristics influence quantification outcomes. This influence was assessed primarily by analyzing variations in absolute errors for both the NIR sorter and the handheld NIR spectrometer. Additionally, because handheld measurements were taken from five distinct points on each sample, the standard deviation of these measurements was calculated to assess whether certain textile characteristics correlate with increased measurement variability.
The analysis for potential influencing factors included surface design (unicolor versus patterned), textile structure (knitted versus woven fabrics), and application type (apparel versus home textiles). Material composition was also analyzed to determine whether samples made of 100% cotton, 100% polyester, or polyester/cotton blends differ in accuracy when distinguishing between blends and non-blends as well as between only cotton or only polyester. Finally, the impact of various product categories of apparel textiles (e.g., t-shirts, scarves, and pants) on quantification accuracy was evaluated. All results are presented in
Figure 5.
The differences in surface design between the absolute errors of unicolored and patterned textiles reveal higher absolute errors for patterned samples when measured with both instruments, although the error is slightly lower for the handheld NIR spectrometer. The standard deviation results for surface design confirm that patterned samples result in higher variability than unicolored ones. The detected higher variability in patterned samples may be due to their non-homogeneous nature, as patterns often involve multiple dyes which deliver varying spectral response or cause light-scattering effects, Nevertheless, this difference remains below 1% in terms of absolute error.
Textile structure appears to influence quantification with varying intensity across the two analyzed instruments. While no significant difference was observed between knitted and woven fabrics when measuring with NIR sorter, the handheld NIR spectrometer showed slightly higher absolute errors and greater variability for woven fabrics. This suggests that textile structure may influence measurement stability when measured with a handheld NIR spectrometer, possibly due to differences in sensor contact and light interaction.
Regarding the application type, significant variation is evident across both instruments. The NIR sorter shows higher absolute errors for home textiles, while the handheld NIR spectrometer performs least accurately on apparel. Home textiles also show greater standard deviation, likely due to their common use of woven fabrics. In contrast, the higher error for apparel may come from greater variability in different treatments and dyeing processes, which are often less standardized. These differences highlight how structural and chemical variations across application types can influence NIR signal response and prediction accuracy. Differentiating between categories allows for a more targeted evaluation of model robustness, supporting future adaptation of quantification methods to the specific characteristics and challenges of each stream.
The significantly higher absolute error for 100% polyester samples is not unexpected, as it is consistent with overall quantification results. However, the standard deviation does not show a notable discrepancy from other material types. In contrast, 100% cotton textile samples exhibit the lowest absolute error when measured with both instruments. Notably, the handheld NIR spectrometer achieves higher accuracy, with an absolute error of 1.51% and a low standard deviation of 0.93%, performing significantly better than the NIR sorter in this context. Polyester/cotton blend samples, as expected, show higher absolute error than only cotton, with values of 7.50% for the NIR sorter and 3.01% for the handheld NIR spectrometer. These results suggest that the handheld NIR spectrometer may offer better accuracy for polyester/cotton blends as well. Despite a standard deviation of 2.9%, the handheld NIR spectrometer still performed adequately. Although cotton is typically considered more spectrally variable due to its moisture sensitivity and biological variability, it showed the lowest prediction error in this study. In contrast, the higher error for polyester samples may be linked to physical characteristics such as glossy surfaces and reduced thickness, both of which can negatively affect NIR signal quality, especially in handheld measurement. These effects, including how shiny surfaces scatter light and thin textiles yield weaker signals, are described earlier in the text (see
Section 3.2).
The analysis of product categories in relation to quantification accuracy revealed several notable patterns. The NIR sorter demonstrated low sensitivity to variations, delivering consistent results across different cotton content categories. However, both instruments identified the same product categories—namely, sportswear, scarves, and jackets—as exhibiting higher absolute errors and standard deviations. Higher errors were expected for sportswear, which predominantly consists of polyester, a material previously identified as challenging for accurate quantification. Similar challenges are present when analyzing scarves and jackets as they often contain either 100% polyester or high-percentage polyester blends and typically feature a shiny surface, further complicating accurate quantification. On the other hand, t-shirts and pants showed the lowest absolute error and standard deviation for both instruments. This can be attributed to their material composition, as these categories typically comprise either 100% or high-percentage cotton blends.
2.4. Influence of Alkaline Treatment on Quantification
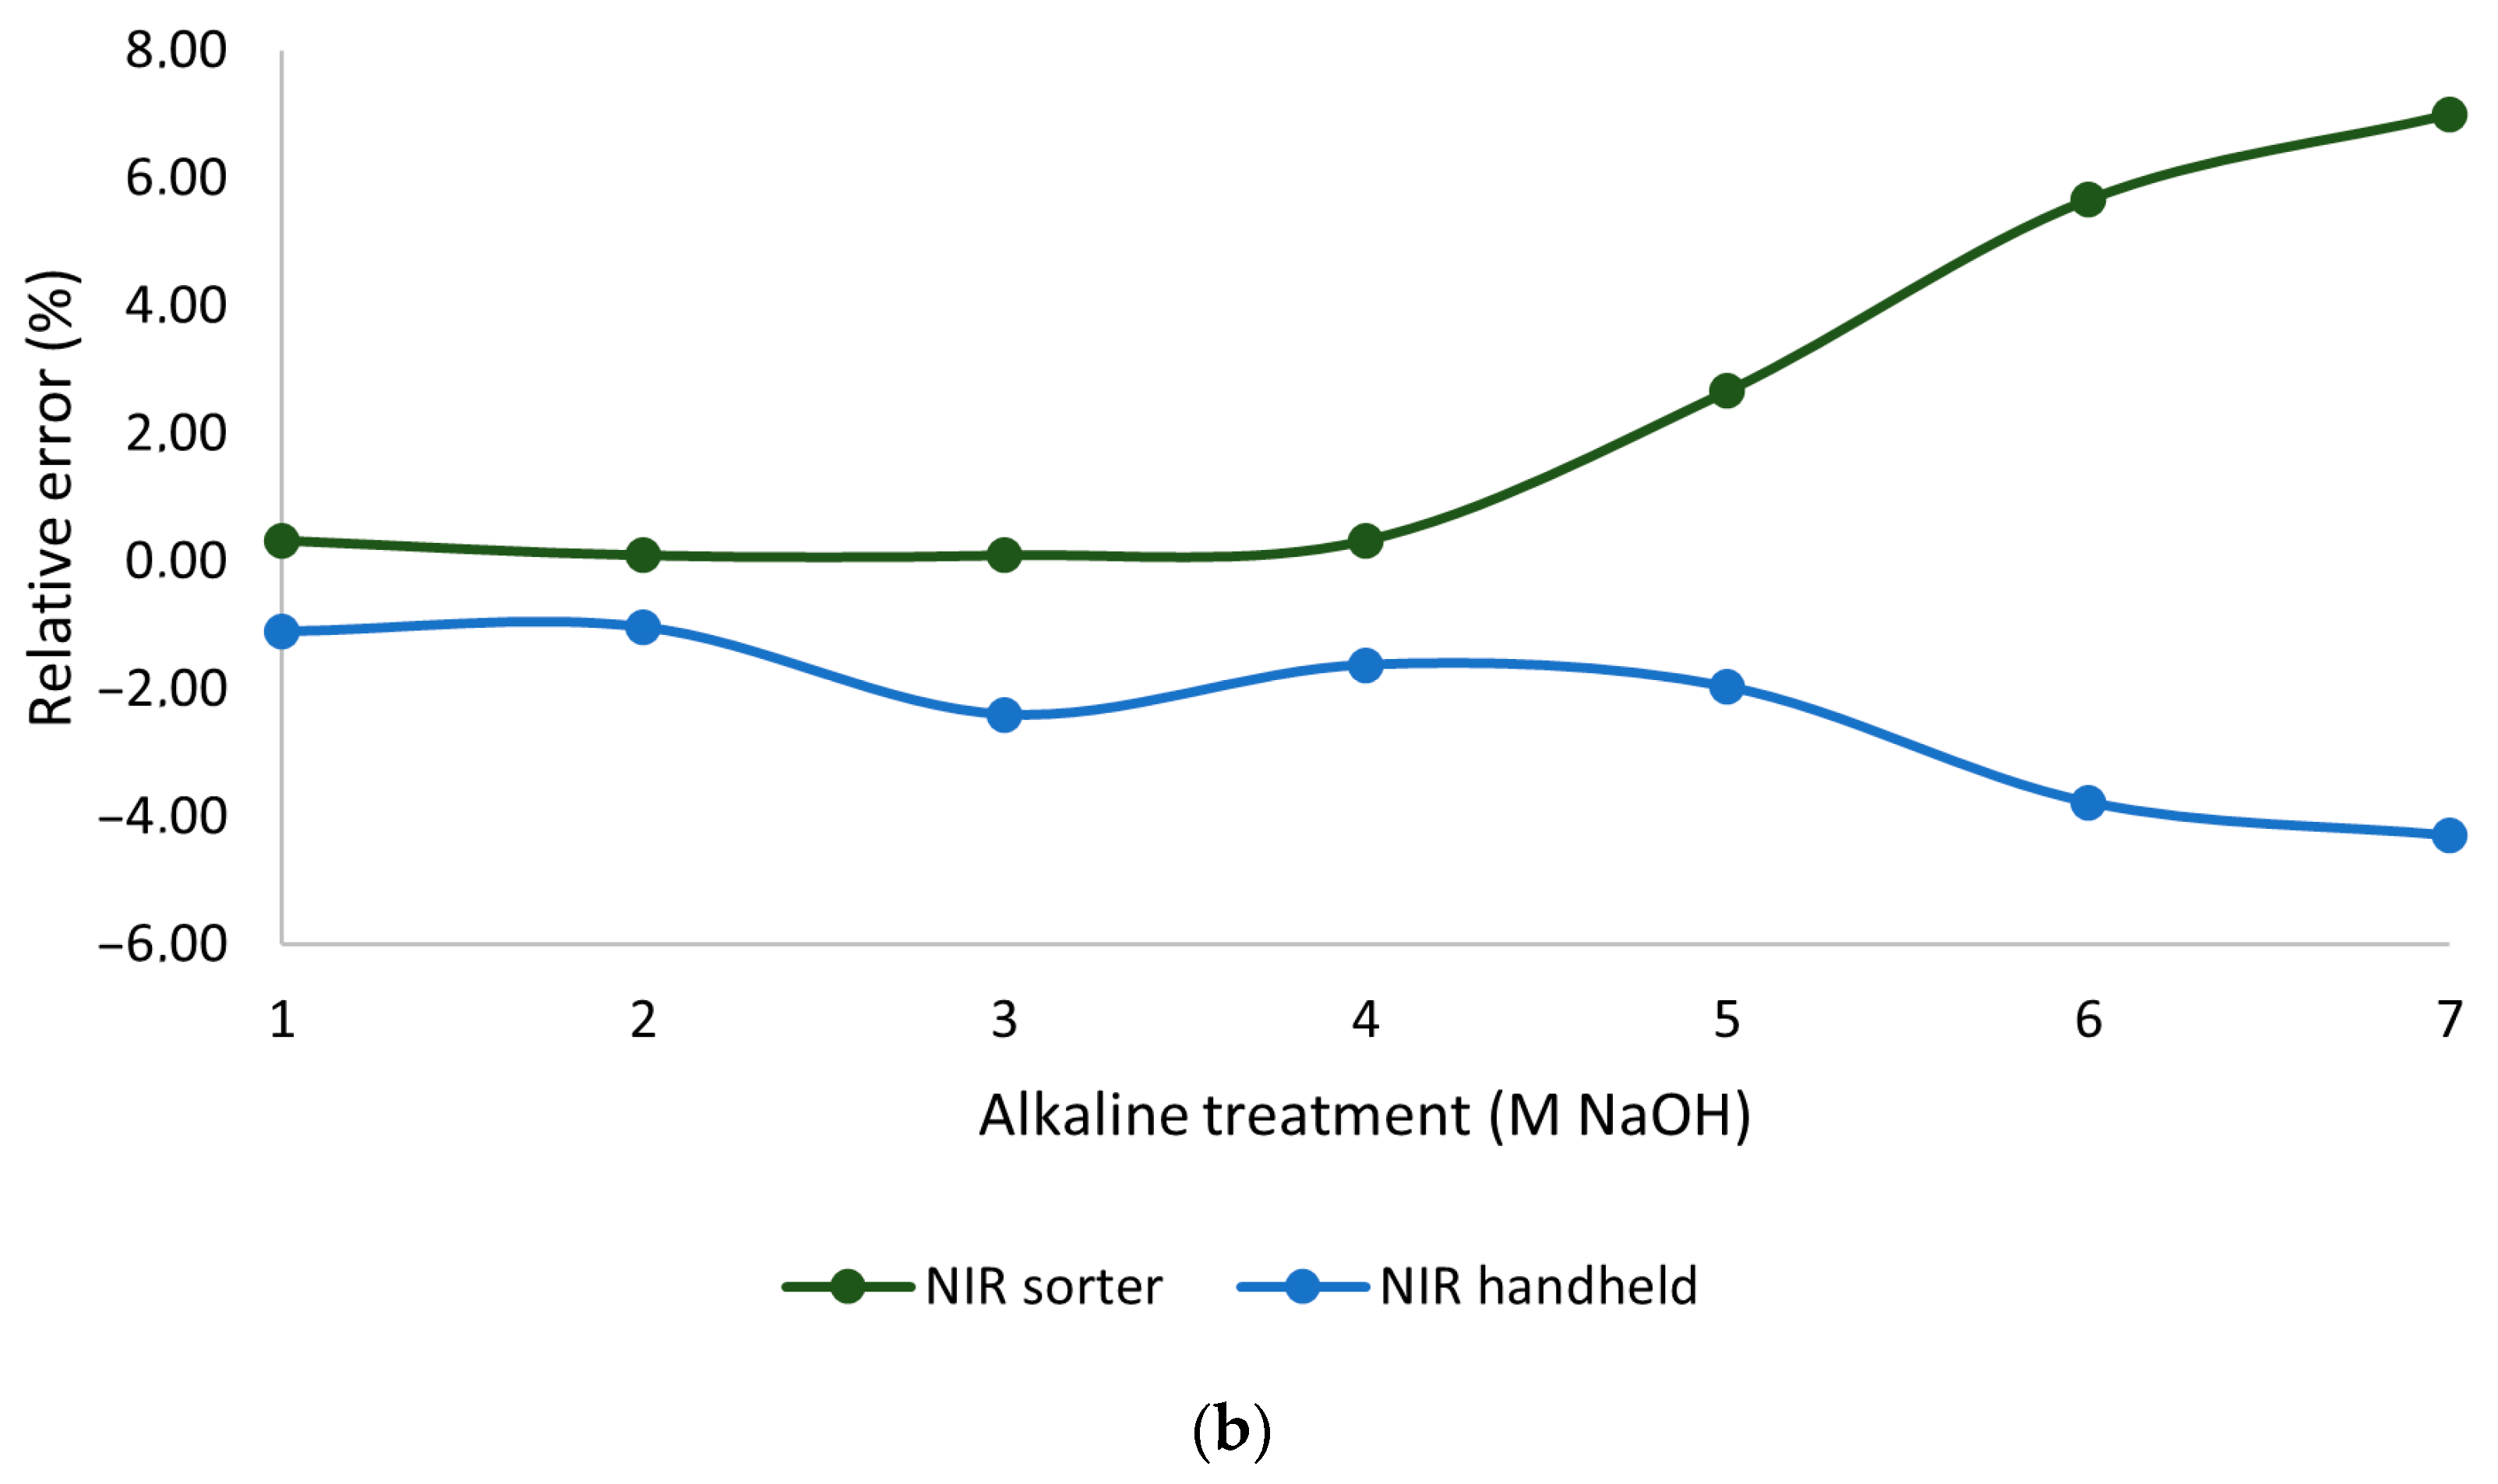
The influence of alkaline treatment under varying molarities was tested using previously trained quantification models, and the resulting absolute and relative errors per sample are shown in
Figure 6. A noticeable increase is observed in absolute errors (
Figure 6a) at higher molarity levels. For the NIR sorter, the shift becomes particularly evident between 4 and 5 M, marking a distinct change in performance. In contrast, the handheld NIR spectrometer does not exhibit a clear trend; however, a similar increase in error is apparent starting from 5 M. This observation is further confirmed by the acquired spectra (
Figure 7).
Research focusing on analysis of the transformation of cellulose I to cellulose II during alkaline treatment with NaOH indicates that this transition typically occurs starting at concentrations around 15% by weight, corresponding to approximately 3.75 M in our case, aligning with the acquired results [
35]. Although such high-concentration treatments are not common in most everyday apparel textiles, they occur in specific textile categories, particularly high-quality garments (premium apparel textiles), home textiles such as towels and bed linens, formal wear such as shirts, and occasionally denim [
36]. Consequently, these textiles, despite constituting a smaller fraction of post-consumer textile waste, still appear in sorting systems. These observations may also explain the increased absolute error observed when measuring woven post-consumer textiles, especially with the handheld NIR spectrometer, as this category frequently includes formal shirts, which are commonly subjected to alkaline treatments to enhance their properties.
Although the results herein confirm the recognition and influence of the transition, a significant discrepancy is evident when analyzing relative error, where the NIR sorter tends to indicate a higher cotton content with the rise of molarity, while the handheld NIR spectrometer identifies a lower cotton content. This may be due to varying spectral responses in different wavelength ranges as well as disparities between the two instruments. The NIR sorter, operating in a lower wavelength range, is more sensitive to surface-level structural changes and moisture-related functional groups like O-H, which are affected by alkaline treatment. Treated cotton samples exhibit stronger O-H absorption bands, particularly around 1450 and 1580 nm, likely due to rearrangement of hydrogen bonding during the transition from cellulose I to II. These structural changes can also lead to shifts or the broadening of absorption features in the 1450–1480 nm region (O-H first overtone) and increased absorbance near 1580 nm. In contrast, polyester lacks these O-H features [
37,
38]. Consequently, with increased levels of alkaline treatment, the NIR sorter detects a more pronounced cotton signal, leading to higher estimation of cotton content.
In contrast, the handheld NIR spectrometer, operating in a higher wavelength range, captures more defined combination bands, making it more sensitive to spectral disruptions caused by alkaline treatment. Notable changes are observed around 2100, 2250, and 2280 nm, where band shifts and intensity reductions occur in treated samples. These changes likely result from increased crystalline disorder and hydrogen bond rearrangement, which affect cellulose-specific absorption features and can contribute to underestimation of cotton content. These differences highlight how alkaline treatment alters the cotton spectrum, increasing certain O-H features while disrupting others, depending on the spectral region.
In summary, alkaline treatment of cotton alters its NIR spectral behavior by modifying hydrogen bonding and crystalline structure. The NIR sorter, which measures shorter wavelengths, detects stronger cotton signals after treatment due to increased O-H absorption. On the other hand, the handheld spectrometer, which works at higher wavelengths, shows weaker signals from cotton because the treatment disrupts key spectral features. These differences reflect the transition from cellulose I to cellulose II and highlight the need to interpret results differently depending on the instrument used.
Although the two instruments respond in opposite directions, the discrepancy in their errors begins at a similar threshold. This shows that the performance of both instruments is affected by alkaline treatment, though in different ways, and may therefore influence the sorting efficiency. Consequently, future work shall compare spectroscopic data from alkaline-treated cotton samples to cellulose II type fibers such as viscose and lyocell to identify similarities and false-positive results based on conversion of cellulose I to II.
2.5. Targeted Qualitative Assessment of Samples Producing Inaccurate or No Results
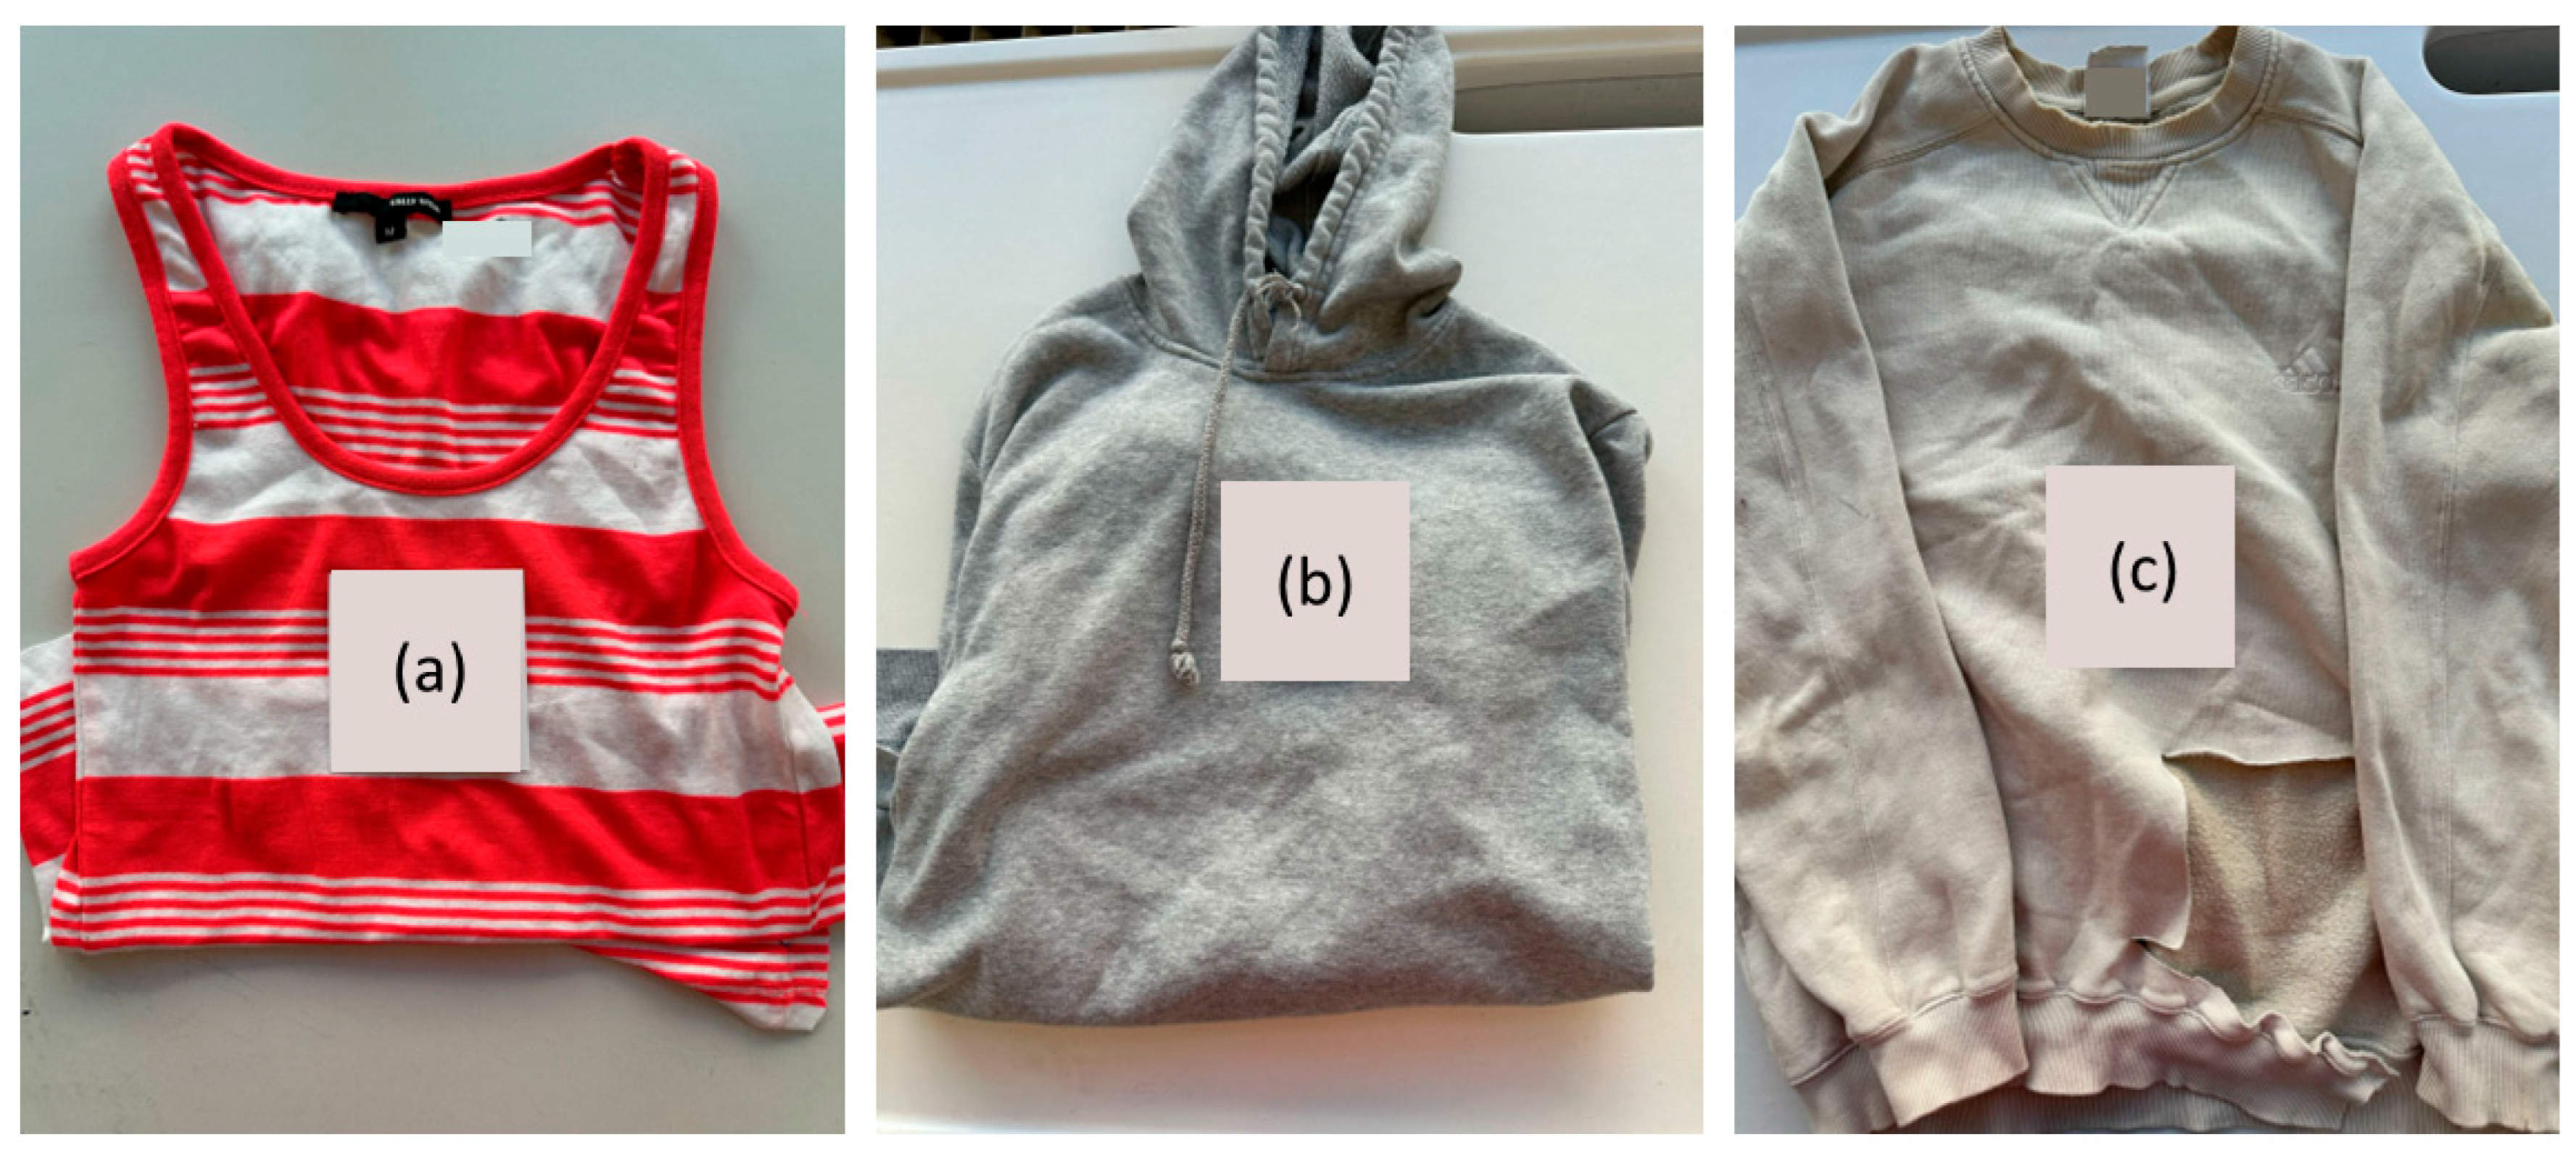
In addition to the thin samples and fabrics with shiny surfaces, which yielded the poorest results, three additional categories of polyester/cotton samples could also be identified as challenging. These samples were either excluded from the quantification process or selected for an additional investigation during discussion of the results. The decision to further examine certain samples was based on criteria such as unusually high prediction errors, inconsistent classification results, or unexpected spectral characteristics that deviated significantly from the majority of the results. The three categories are (a) visually heterogeneous samples, (b) light grey textiles, and (c) sweatshirts and sweatpants with a multilayered structure.
Figure 8 shows one example from each of the identified categories.
The results from the category of visually heterogenous samples (a) display measured variability related to fabric color, pattern, and localized material composition differences. This effect is particularly pronounced when using the handheld NIR spectrometer due to its point-based measurements, which yield variable results depending on the color of the specific area being measured. Color-dependent behavior can lead to significant variability in the quantified fiber composition. While averaging multiple handheld measurements can, in many cases, approximate the reference cotton content, this is only valid when all color variants present are included in the measurements. If certain colored areas are omitted, the resulting average may strongly deviate from the reference cotton content. This is particularly challenging in samples with highly patterned surfaces, when numerous colors and fine-scale patterns increase the likelihood of uneven measurements. In some cases, this deviation may be minor, being only a few percentage points, and it may still fall within acceptable quantification limits. Dye–matrix interactions may also affect spectral variation, especially if certain dyes alter absorbance or scattering, potentially impacting prediction accuracy [
39]. However, extreme cases can occur, such as the one shown in
Figure 8a, where the white area of the sample contains 0% cotton and the red area 100% cotton content despite the chemical analysis and label indicating 50% cotton content. This discrepancy is not necessarily due to the color itself but more likely reflects the presence of two distinct materials combined in one garment and visually separated by color. This composition was correctly quantified by the NIR sorter, which analyzed the entire sample area and calculated an average value for accurate quantification. Although this approach is generally more representative, it relies on comprehensive coverage of all corresponding parts of the samples. If some areas or colors remain undetected due to uneven presentation of the sample to the sensor, the resulting quantification may also be inaccurate. The highlighted challenge shows the importance of representative measurements, capturing all the color variances in order to achieve accurate quantification.
The light grey-colored textiles (n = 4) (b) were identified as a sample category frequently associated with inaccurate quantification results, with predicted cotton content averaging between 10 and 15% despite reference values above 50%. While not all grey textiles showed this issue, it was most pronounced in lighter shades. This is likely due to the presence of carbon black pigments, which are known to absorb strongly in the NIR range, leading to weak or unusable spectra [
40]. In our case, black textiles did not show similar errors, suggesting that not all black textiles were dyed with carbon black; some may have used synthetic dyes that are more compatible with NIR. In contrast, the poor performance of certain light grey samples suggests that carbon black or similar pigments may have been used, resulting in low reflectance and limited spectral contrast, which hinder accurate quantification. This limitation affects not only quantification but also the reliability of material identification.
Sweatshirt and sweatpant materials (c) present an additional challenge due to their layered structure, typically consisting of different inner and outer layers. While both sides are often made from polyester/cotton blends, their compositions can differ significantly, with deviations of up to 30% observed in our measurements. The outer layer usually has a higher cotton content, while the inner layer tends to contain more polyester [
41]. These differences show the importance of measuring both sides of such textiles, as significant variations in fiber composition can exist.


 ,
, 


