1. Introduction
Graphene production has been the subject of extensive research due to its remarkable physical, chemical, and electronic properties, including high electrical conductivity, mechanical flexibility, and large surface area [
1,
2,
3]. Graphene can be synthesized by several methods, with the specific method significantly impacting the resulting graphene type, as synthesis procedures can induce structural defects in accordance with the second law of thermodynamics [
4]. The top-down method uses graphite as precursor. This method relies on the principle of exfoliating graphite, which serves as the initial material. Graphite, essentially a stack of graphene layers bound by Van der Waals forces, undergoes exfoliation through mechanical or micro-mechanical means, graphite intercalation, nanotube slicing utilizing carbon nanotubes as precursors, pyrolysis, reduction of graphite oxide, electrochemical exfoliation, sonication, and ball milling [
5].
In recent years, innovative methods by liquid phase exfoliation (LPE) have emerged focused on the use of solvents and ultrasound, with the aim of reducing production costs and using more environmentally friendly raw materials [
5,
6,
7,
8,
9,
10]. The research development about LPE involves flaking natural graphite through sonication (cavitation) or high shear mixing under mild operating conditions [
5,
9,
10,
11,
12]. This technique has enabled the production of graphene from various raw materials, including natural graphite, expanded graphite, and, more recently, graphite recovered from the anodes of spent lithium-ion batteries. However, the synthesis of pure natural graphite for graphene production typically involves high energy input and the use of toxic organic solvents, rendering such production methods either costly or potentially environmentally hazardous [
9,
13,
14,
15]. Additionally, natural graphite may not always be an optimal choice for graphene synthesis. Furthermore, natural graphite has been designated as a critical resource by the European Union (EU), indicating a high risk of supply shortages that could significantly impact the economy [
16].
The production of graphene from waste materials holds great promises for reducing its long-term cost. The global demand for lithium-ion batteries (LIBs) is projected to surge from 185 GWh in 2020 to over 2000 GWh by 2030, largely driven by emerging applications such as electric vehicle (EV) technology [
17]. However, this rapid increase in demand is expected to lead to significant waste disposal challenges as these batteries reach the end of their lifespan. Consequently, battery reuse and recycling have garnered considerable attention as measures to mitigate environmental impacts. Researchers have recently begun focusing on anode recycling, which constitutes 12–21% of the total mass of LIBs composition [
4,
9]. Utilization of substantial quantities of waste graphite from LIBs presents a significant opportunity for graphene production to contribute to waste management and the circular economy. In recent years, researchers have increasingly focused their efforts on producing graphene from LIBs graphite, recognizing its potential to provide a balance between scalability and quality in a cost-effective manner [
6,
18,
19,
20,
21,
22,
23]. However, in most studies conducted to date, the focus has primarily been on characterizing the dispersed graphene fraction, while the sedimented fraction has received little attention. This asption is largely based on the premise that most graphene is obtained in the dispersed fraction.
Previous research has demonstrated that graphite recovered from LIBs has the potential to serve as a viable source of graphene, contributing not only to the sustainable management of hazardous waste but also to the production of high-value material [
17,
20,
24]. However, a key limitation of these studies is the lack of evaluation of the sedimented fraction of the processed graphite, which may contain particles with properties similar or complementary to those of the dispersed graphene fraction. This gap in literature underscores the need for a more comprehensive approach that includes the full characterization of the exfoliated material, encompassing both the dispersed and sedimented fractions, to gain a complete understanding of the distribution and quality of the graphene obtained.
Additionally, in liquid-phase graphite exfoliation for graphene production, sonication plays a crucial role, as the applied ultrasound amplitude directly influences the degree of exfoliation and, consequently, the yield and quality of the resulting graphene [
6,
25,
26]. Despite this, there is a notable lack of studies investigating the impact of sonication amplitude on the properties of graphene derived from graphite recovered from LIBs. Most research has focused on fixed amplitudes or optimizing other parameters, such as solvent type or sonication duration, without thoroughly examining the relationship between sonication amplitudes and process efficiency. This gap highlights the need for a systematic investigation of different sonication amplitudes to gain a deeper understanding of their influence on graphite exfoliation and the quality of the resulting graphene.
For these reasons, the present study focuses on the production of graphene from the graphite contained in the anodes of LIBs via ultrasound-assisted liquid-phase exfoliation, using water as the solvent. Water was selected due to its low cost, availability, and environmental safety, offering a more sustainable approach to graphene synthesis. The primary objective was to investigate the effect of sonication amplitude on both graphene yield and its structural and composition. Additionally, a comprehensive physicochemical characterization of both the sedimented and dispersed fractions was conducted, enabling a holistic evaluation of the material properties in both phases.
This innovative approach not only optimizes the graphene production process but also complements existing research by providing critical insights into the influence of sonication amplitude on the exfoliation of recycled graphite. Furthermore, it expands the current understanding of the sedimented fraction, which has remained largely unexplored. The findings of this study may serve as a valuable reference for future research on graphene recovery from electronic waste and the development of more sustainable and cost-effective production techniques.
2. Materials and Methods
The pretreatment of LIBs involved multiple steps, including safe discharge, manual dismantling, crushing, screening, and basic cleaning. Initially, different types of spent LIBs were placed in separate discharge tanks and submerged in a 5% sodium chloride solution for 24 h to ensure complete and safe discharge and washed with deionized water. Afterward, the discharged LIBs manually disassembled, and the graphite-based negative electrode strips were extracted. These graphite strips, sourced from various LIBs, were then fed into a universal crusher and pulverized for 5 min, followed by sieving through an 80-mesh screen to achieve a uniform particle size.
Graphene production was carried out via liquid-phase exfoliation assisted by ultrasonic homogenization, using deionized water as the solvent. A Cole-Parmer 750-Watt, 20 kHz ultrasonic processor was employed for this purpose. In each experiment, 100 mg of graphite recovered from spent LIBs was dispersed in 150 mL of deionized water in a 200 mL of 50-mm-diameter glass beaker. The suspension was then subjected to ultrasonic homogenization at varying amplitudes for 2 h while maintaining the temperature at 45 ± 2 °C using an external cooling system with continuous water circulation around the reaction vessel. The specific sonication conditions (amplitude and graphene raw) investigated for aqueous liquid-phase exfoliation of graphite are detailed in
Table 1. Sonication was performed using amplitudes of 50% and 80%. These values were selected based on reports indicating that an amplitude of approximately 70% enhances graphite exfoliation in similar systems [
27]. Thus, 50% and 80% were chosen as reference points below and above this threshold, respectively, to evaluate their effect on the exfoliation process.
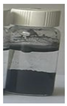
After the sonication process, a thin surface layer with a silver-gray color was observed, corresponding to unexfoliated material. This fraction was carefully removed using a glass Pasteur pipette (mass < 1% of the initial graphite) and excluded from the yield analysis. Subsequently, the dispersions were centrifuged at 6000 rpm for 30 min. The resulting fractions—supernatant (dispersed fraction) and sediment (decanted fraction)—were carefully separated and dried in an oven at 80 °C until constant weight was reached. The approximate graphene yield in each fraction was estimated using a gravimetric method by dividing the dry mass of each fraction by the sum of the total dry masses of both fractions, multiplied by 100%. This approach was adopted as a relative approximation of the exfoliated material distribution, following similar methodologies reported in the literature [
28,
29,
30,
31,
32]. Although this method does not provide a fully precise quantification of pure graphene content, the structural analyses included in this study indicate that both fractions contain material with graphene-like characteristics.
The tests were conducted using commercial graphite and graphite extracted from spent LIBs to investigate the differences between the graphene obtained from each source. Additionally, commercial graphene and graphene oxide were used as reference materials for characterization purposes, allowing for a comparative analysis of their properties with those of the materials obtained in this study.
3. Material Characterization
An initial characterization was performed to determine the basic physicochemical properties and chemical composition of both the dispersed and sedimented fractions. The analyzed properties included density by volumetric displacement (pycnometer method) using water as the reference fluid (USP-699 Density of Solids), Brunauer-Emmett-Teller (BET) surface area, average pore volume, average pore diameter, dispersion pH, zeta potential, dispersion conductivity, and contact angle. graphene and characterize its structural and physicochemical properties. Additionally, more advanced analytical techniques were employed to confirm the formation of graphene and characterize its structural and physicochemical properties.
The metal composition was determined using Atomic Absorption Spectroscopy (AAS) on an Agilent 240 FS atomic absorption spectrophotometer, employing an air-acetylene flame.
For the contact angle analysis, the different materials were compacted onto a glass sample holder using axial pressure to form a flat and uniform surface. Contact angles were measured for two water volumes. Initially, a single water (~50 μL) droplet was deposited on the surface of each material, and high-resolution photographs were taken at an initial time (1 s) and monitored over a period of 10 s. Subsequently, four additional droplets (~200 μL) were added to assess the material’s stability and permeability. Each image was analyzed using the LB-ADSA (Liquid Bridge—Axisymmetric Drop Shape Analysis) method, implemented in the ImageJ V1.54k software with the Drop Shape Analysis (DSA) plugin [
33]. This method numerically solves the Laplace-Young equation, which relates the axisymmetric shape of the droplet to surface tension and gravitational forces. This approach compensated for roughness effects, ensuring reliable measurements on the compacted material surfaces.
The specific surface area of the samples was determined by nitrogen (N2) physisorption at 77 K using the Brunauer–Emmett–Teller (BET) method on a Quantachrome Autosorb Automated Gas Sorption System. Prior to measurement, the samples were degassed under vacuum at 380 °C for 12 h.
Zeta potential measurements were performed on a Malvern ZEN 2600 equipment, Malvern, UK.
XPS analyses were carried out on samples using an AES-XPS PHI-548 spectrometer, Amsterdam, The Netherlands in which the samples were excited by an unmonochromatized Al Kα line at 1486.6 eV. The working pressure was <1 × 10⁻¹⁰ Pa. Survey scans were obtained in the range from 1205 to (−10) eV energy interval at 1.0 eV per step and pass energy of 100 eV. Additionally, the high-resolution XPS scans were completed at 0.2 eV energy steps and pass energy of 50 eV (the constant pass energy mode).
High-resolution transmission electron microscopy (HRTEM) and energy-dispersive X-ray spectroscopy (EDS) were conducted using an INCA Oxford Si (Li) detector integrated into a JEOL 2100F electron microscope, Tokyo, Japan. The microscope operated at an accelerating voltage of 200 kV, providing a resolution of 0.19 nm.
Ultraviolet–Visible (UV–Vis) spectroscopy, recorded with a Shimadzu UV–Vis spectrophotometer, Kyoto, Japan to identify the formation of graphene in the samples. The dispersed fraction was analyzed directly, while the decanted fraction required the dried samples to be dispersed in distilled water by agitation with a magnetic stirrer. Immediately after, all dispersions were transferred into 10 × 10 mm vials and measured to prevent partial agglomeration of the flakes and their sedimentation in the aqueous solution. Each UV–Vis spectrum was collected with an acquisition time of 20 s within the spectral range of 200 to 800 nm, covering the region where graphene-related peaks are expected.
X-ray diffraction (XRD) analysis was performed using a Rigaku, Tokyo, Japan, D-Max 2200 Series diffractometer equipped with Cu-Kα radiation (λ = 1.54 Å). The scanning rate was set at 3° per minute, with an operating tube voltage and current of 40 kV and 40 mA, respectively. Diffraction patterns were recorded over a 2θ angular range of 2–90°.
Raman analyses were performed at room temperature using a Horiba Jobin Yvon, Stow, MA, USA, Labram HR confocal Raman spectrometer, equipped with a 632.81 nm laser. The spectra were recorded in the range of 600 to 4000 cm−1.
H2-Temperature programmed reduction (H2-TPR) of the materials was carried out at 10 °C/min from 25 °C up to 900 °C, in the presence of 10% H2/Ar (Infra). The gas flow rate was 25 mL/min and it was kept constant using a mass flow controller. The apparatus was calibrated by reduction of 30 mg of CuO powder (99%, Merck, Rahway, NJ, USA) under the same experimental conditions.
Attenuated total reflectance-Fourier transform spectroscopy (ATR-FTIR) analyses were carried out over the wave number range of 4000–500 cm−1 using a Shimadzu IRAffinity-1S.
4. Results and Discussion
4.1. Metal Composition
The analysis was conducted using AAS identified trace metallic impurities in the selected materials (
Table 2). Specifically, elements such as cobalt (Co), nickel (Ni), manganese (Mn), lithium (Li), and copper (Cu) were detected. However, these impurities were not found in commercial graphite (Gf-C), indicating a high purity of the source material. In contrast, recycled graphite from LIBs (GPi) exhibited significant amounts of these elements, reflecting the composition of the internal components of the batteries, particularly those used in cathodes and current collectors [
34,
35,
36].
In the graphene obtained via liquid-phase exfoliation, both in the dispersed fraction (Gn-S8-Di) and the sedimented fraction (Gn-S8-De), metallic impurities were detected at varying concentrations, with Co, Ni, Mn, and Cu being the most prominent. However, lithium was not identified in either graphene fraction, suggesting that the ultrasound-assisted exfoliation process facilitated the removal of this metal. This result may be attributed to the solubility of the electrolyte and the deintercalation of Li during treatment, a phenomenon previously reported in studies on anode material recovery from LIBs [
17].
The absence of metallic impurities in commercial graphite aligns with its use in applications requiring high purity standards. On the other hand, the detected impurities in recycled graphite originate directly from materials used in LIBs manufacturing. Co and Ni are commonly found in cathodes, while Cu is used in current collectors. During the recycling process, residual traces of these materials often remain in the recovered graphite, affecting its chemical composition. The results obtained are consistent with findings reported in the scientific literature. Previous studies have identified metallic impurities in graphene produced from the exfoliation of graphite recovered from LIBs, highlighting the persistence of elements such as Co, Al, Cu, and Mn, which confirm the presence of residues from cathode materials and other internal battery components [
17].
On the other hand, X-ray photoelectron spectroscopy (XPS) analysis confirmed the presence of metallic impurities and complemented the observations made by AAS.
Figure 1 and
Figure 2 show the XPS spectra of the sonicated materials at 80% amplitude for the sedimented fraction of both commercial graphite (Gc-S8-De) and graphite recovered from LIBs (Gn-S8-De). This analysis is crucial for evaluating the purity of the obtained graphene and the presence of residual metallic impurities, which are key factors for its potential applications, particularly in catalytic systems [
37].
Figure 1, corresponding to the material derived from commercial graphite (Gc-S8-De), presents an XPS spectrum dominated by the C 1s bands at 284.1 eV, characteristic of C–C and C=C bonds associated with graphene structures along with its π–π* plasmon, confirming the presence of graphene structure after sonication.
In contrast, the spectrum shown in
Figure 2, corresponding to the material derived from graphite recovered from LIBs (Gn-S8-De), reveals a more complex surface composition. In addition to the C 1s (284.1 eV) and O 1s (532.1 eV) bands, contributions at 932.5 eV (Cu 2p
3/
2) and 953.5 eV (Cu 2p
1/
2), corresponding to copper, as well as signals at 852.6 eV for nickel (Ni 2p
3/
2) and 101.4 eV associated with cobalt (Co 2p), were identified.
The presence of these transition metals, which are typical of LIB cathodes, indicates that some residual metallic impurities persist after the exfoliation process. This partial incorporation of metals into the carbonaceous matrix could significantly modify the electronic properties of graphene, creating opportunities for its application in heterogeneous catalysis, where Cu, Co, Mn, and Ni could act as active sites or promoters, or in energy storage devices, where these metallic species may enhance charge storage capacity and transfer [
38,
39]. If high-purity graphene is required, these findings highlight the need for additional purification processes. However, the controlled presence of these metals could be strategically leveraged to develop functional materials with properties tailored to specific applications.
4.2. Zeta Potential
The zeta potential (ζ) analysis is a measure of the electrical charge on the surface of dispersed particles in a liquid and is used to assess their colloidal stability in water. High absolute values (greater than ±30 mV) indicate electrostatic repulsion between particles, which prevents aggregation and promotes stable dispersions [
25,
40,
41]. The results obtained in this study, presented in
Table 3, show predominantly negative values, consistent with Lewis-type charge transfer at the particle-solvent interface. Highly negative zeta potential values (ζ < −40 mV) in aqueous graphene dispersions are primarily attributed to the ionization of oxygen-containing functional groups (e.g., -COOH, -OH) on the material surface. These groups undergo deprotonation in neutral or alkaline media, generating negatively charged species (-COO
−, -O
−) that induce electrostatic repulsion between particles [
41,
42]. Additionally, the adsorption of hydroxyl ions (OH
−) onto the graphene surface, which is favored at high pH, further increases the negative charge density. These mechanisms align with the DLVO theory, wherein electrostatic repulsion predominates over van der Waals forces, thereby stabilizing the colloidal dispersion [
43]. Although Lewis acid-base interactions may occur at defective sites on graphene (e.g., edges with electron-deficient sp
2 carbon), their contribution to surface charge is secondary in aqueous systems, where ionic and pH-dependent effects dominate [
41,
43].
A difference in stability is observed between the dispersed (Di) and decanted (De) fractions of each material. In all cases, for each type of raw material, the dispersed fractions exhibit higher zeta potential magnitudes than the decanted fraction. For example, for graphene derived from commercial graphite at 50% sonication, the dispersed fraction (Gc-S5-Di) has a zeta potential of −58.6 mV, while the decanted fraction (Gc-S5-De) shows −45.9 mV. This trend is consistent in materials derived from LIBs, indicating that dispersed fractions are more stable due to their higher surface charge, which enhances electrostatic repulsion and prevents sedimentation. This behavior is attributed to the sonication process, which increases the surface charge of graphene by introducing defects, exposing a greater surface area of graphene layers, and consequently leading to a higher exposure of ionized functional groups.
Regarding the influence of sonication amplitude, the data show that graphene obtained at 80% and 50% amplitude tends to have very similar zeta potential values. This suggests that stability is comparable among materials derived from the same raw source, which is consistent with the stability images (
Table 4), where suspensions of materials sonicated at 80% exhibited greater stability.
Moreover, graphene derived from LIBs exhibits zeta potential values further from zero in its dispersed fractions compared to that from commercial graphite. For example, the material (Gn-S5-Di) obtained at 50% sonication amplitude shows a zeta potential of −58.6 mV, while Gc-S5-Di has −48.5 mV. Similarly, at 80% amplitude, Gn-S8-Di reaches −58.0 mV, whereas Gc-S8-Di shows −50.8 mV. This indicates that materials derived from LIBs (dispersed fraction) are more stable in dispersion. In contrast, the zeta potential of the decanted fractions showed similar values regardless of the graphite source, which is consistent given that this fraction settled immediately after the exfoliation process.
As explained in the analysis of the stability of different material dispersions, the greater stability observed in materials derived from LIBs may be related to the presence of residual metals. These metals modify the surface charge of the particles, specifically through the adsorption of metal ions onto the graphene surface, generating additional charges that increase the absolute value of the zeta potential. This modification in surface charge enhances electrostatic repulsion between particles of the same charge, reducing aggregation tendencies and promoting greater suspension stability [
44]. Additionally, certain metals can serve as active sites for the formation of oxygenated functional groups during treatment processes, further contributing to an increase in surface charge. Together, these factors explain why LIB-derived materials, particularly Gn-S5-Di and Gn-S8-Di, exhibit greater stability compared to those obtained from commercial graphite.
On the other hand, if graphene has a low zeta potential value (close to 0 mV), it means that electrostatic repulsion forces between particles are weak or nonexistent. In this case, graphene particles tend to aggregate rapidly due to Van der Waals attraction forces. This aggregation leads to particle sedimentation, preventing effective dispersion in water and causing the formation of large flocs or aggregates [
43]. Pure graphene without functionalization, or exfoliated graphite that has not been properly processed through sonication or chemically modified, typically exhibits low zeta potential values and, consequently, low dispersion capacity in water. Although this value is not listed in
Table 3, this observation is consistent with the stability images in
Table 4, where commercial graphene sedimented within a few days after dispersion preparation.
In other words, the analysis of the results reveals that materials derived from LIBs exhibit greater colloidal stability compared to those from commercial graphite. Moreover, while sonication at 80% amplitude enhances exfoliation, the zeta potential values suggest that optimal stability is achieved at 50% amplitude. Finally, dispersed fractions demonstrate greater stability than decanted fractions, highlighting the importance of controlling sonication conditions to obtain materials with optimal properties for specific applications.
The differences in zeta potential (Z) values between materials derived from commercial graphite and those recovered from lithium-ion batteries (LIBs) (ranging from −42.4 to −58.6 mV) demonstrate the influence of material origin and prior treatment on dispersion properties. Although both values fall within a narrow range associated with colloidal stability, the ~16 mV gap can be linked to enhanced aggregation resistance and long-term dispersion uniformity in materials with higher absolute zeta potential values, as reported in previous studies [
44,
45]. Such works indicate that even moderate differences in zeta potential may significantly influence dispersion stability and homogeneity, particularly in systems like composites or coatings there is a minimal difference between 50% and 80% amplitude, suggesting that graphene with these properties can be obtained at 50% amplitude while achieving energy savings compared to 80% amplitude sonication. The differences observed between graphene derived from commercial graphite and that recovered from LIBs emphasize the influence of material origin and prior treatment on the dispersion properties of graphene.
For a long time, graphite was considered hydrophobic.
4.3. Contact Angle
For a long time, graphite was considered hydrophobic, with a water contact angle of 90° or higher [
46]. However, it has been found that this hydrophobicity may be related to the presence of active sites on the material [
47]. Additionally, studies have shown that the wettability of monolayer and bilayer graphene is significantly higher than that of graphite, exhibiting a water contact angle of θ < 30° [
6]. The rigorous determination of hydrophobicity in carbonaceous materials, such as graphite and graphene, requires the integration of precise contact angle (θ) measurements with theoretical models adapted to rough or porous surfaces [
48,
49].
Wetting is the phenomenon in which a liquid spreads over a solid surface upon contact. The contact angle is commonly used to describe the degree of wetting, where Young’s equation (Equation (1)) defines the equilibrium state of a resting droplet on an ideal, smooth surface.
where γ
sv, γ
lv y γ
sl correspond to the interfacial surface tensions of the solid–vapor, liquid–vapor, and solid–liquid interfaces, respectively, and θ
Y is the resulting contact angle [
50]. A hydrophilic surface typically exhibits a contact angle in the range of 10° < θ < 90°, while hydrophobic surfaces fall within 90° < θ < 150°. Surfaces with are classified as ultrahydrophilic, whereas those with θ 150° < θ < 180° are considered superhydrophobic [
51,
52,
53]. However, this model assumes an ideal, perfectly smooth surface. For rough surfaces, such as compressed powder materials, wetting behavior can be understood through two principal models: the Wenzel model and the Cassie-Baxter model. The Wenzel model is particularly applicable to hydrophilic materials, as it describes a liquid making uniform contact with the surface, regardless of the roughness or porosity. In this case, liquid adsorption into surface pores or irregularities is a defining characteristic, and if the material’s porosity allows, complete penetration of the liquid into surface asperities occurs, leading to total wetting [
50]. This behavior is characteristic of hydrophilic surfaces, where the presence of polar functional groups (such as -OH, -COOH) in graphene or graphite enhances water interaction [
44,
51,
54].
On the other hand, the Cassie-Baxter model describes heterogeneous wetting, in which the water droplet remains suspended on the peaks of a rough surface while air becomes trapped in the valleys. This condition is known as the Cassie-Baxter state Where γ
sv, γ
lv y γ
sl correspond to the interfacial surface tensions of the solid–vapor, liquid–vapor, and solid–liquid interfaces, respectively, and θ
Y is the resulting contact angle [
50]. A hydrophilic surface typically exhibits a contact angle in the range of 10° < θ < 90°, while hydrophobic surfaces fall within 90° < θ < 150°. Surfaces with are classified as ultrahydrophilic, whereas those with θ 150° < θ < 180° are considered superhydrophobic [
51,
52,
53]. However, this model assumes an ideal, perfectly smooth surface. For rough surfaces, such as compressed powder materials, wetting behavior can be understood through two principal models: the Wenzel model and the Cassie-Baxter model. The Wenzel model is particularly applicable to hydrophilic materials, as it describes a liquid making uniform contact with the surface, regardless of the roughness or porosity. In this case, liquid adsorption into surface pores or irregularities is a defining characteristic, and if the material’s porosity allows, complete penetration of the liquid into surface asperities occurs, leading to total wetting [
50]. This behavior is characteristic of hydrophilic surfaces, where the presence of polar functional groups (such as -OH or -COOH and epoxides) in graphene or graphite enhances water interaction [
44,
51,
54].
On the other hand, the Cassie-Baxter model describes heterogeneous wetting, in which the water droplet remains suspended on the peaks of a rough surface while air becomes trapped in the valleys. This condition is known as the Cassie-Baxter state [
50,
55]. In this regime, the formation of liquid marbles can be observed, where liquid droplets (typically water) are coated with hydrophobic particles that prevent wetting [
56]. This behavior is characteristic of superhydrophobic materials [
55], in which surface roughness traps air pockets, creating a liquid-air-solid interface. The presence of liquid marbles, which roll freely across the surface, is a key indicator of the Cassie-Baxter state. This phenomenon is commonly observed in materials with micro- or nanostructures that minimize contact between the liquid and the solid, such as graphene functionalized with nonpolar groups or surfaces with hydrophobic coatings [
50].
A modified Young’s model (θ > 90°\theta > 90^\circθ > 90° without liquid marble formation) describes intrinsically hydrophobic surfaces, where the contact angle exceeds 90° but does not reach superhydrophobicity. This behavior is attributed to the presence of non-oxidized graphene domains (sp
2), which are inherently hydrophobic due to their low surface energy [
48]. Unlike the Cassie-Baxter model, liquid marbles do not form because there is no significant surface roughness to trap air [
53].
The combination of these data with qualitative criteria, such as the formation of liquid marbles or liquid absorption, allows for the classification of hydrophobicity according to these models.
Table 3 presents the details contact angle of the materials. Based on these parameters, it was determined that the initial graphite samples Gpi (θ = 143.9°) and Gf-C (θ = 148.1°) exhibited superhydrophobicity (Cassie-Baxter model) with the formation of stable liquid marbles. In contrast, commercial graphene (Gn-C, θ = 19.4°) displayed extreme hydrophilicity (Wenzel model), absorbing the droplet in less than 2 s.
For materials derived from commercial graphite subjected to sonication at 50% amplitude, the sedimented fraction (Gc-S5-De, θ = 149.3°) retained the hydrophobicity of the original graphite, while the dispersed fraction (Gc-S5-Di, θ = 138.4°) showed a slight decrease in contact angle, although it maintained the formation of liquid marbles. In the case of sonication at 80% amplitude, only the sedimented fraction (Gc-S8-De) preserved the hydrophobic properties of the starting graphite, with a moderate reduction in contact angle (θ = 143.5°) and the formation of a partial liquid marble. Conversely, the dispersed fraction (Gc-S8-Di) exhibited a transition toward extreme hydrophilicity (θ = 22.1° within the first second), with complete absorption occurring in less than 5 s.
For materials obtained from graphite recovered from LIBs and sonicated at 50% amplitude, a similar trend was observed: the sedimented fraction (Gn-S5-De, θ = 147.2°) and the dispersed fraction (Gn-S5-Di, θ = 135.4°) retained high hydrophobicity with liquid marble formation. However, when sonication was increased to 80%, both fractions (Gn-S8-De and Gn-S8-Di, with θ = 21.5° and θ = 13.9° within the first second, respectively) transitioned toward extreme hydrophilicity, with complete absorption in less than 5 s.
Based on the literature, where contact angle increases of approximately 1° have been reported for a volume increment of 15 μL [
57], it can be inferred that the contact angle variation obtained in this study (Δθ\Delta\thetaΔθ close to or below 10° for a volume increment of ~200 μL) suggests a uniform chemical hydrophobicity at the macroscopic scale.
The images in
Figure A1 (
Appendix A) confirm that, in materials sonicated at 50% amplitude, the sedimented fraction formed partial liquid marbles, whereas the dispersed fraction exhibited more extensive liquid coverage. This behavior suggests that these materials retain their hydrophobic properties and promote the formation of a partial liquid marble. Additionally, the low variation in Δθ implies that the observed hydrophobicity is homogeneous at the macroscopic level, although the incomplete formation of liquid marbles reveals potential heterogeneity in surface roughness. It is proposed that the limited mobility of sedimented particles in the decanted fraction restricts their ability to fully coat the air-liquid interface, whereas in materials processed at high amplitude (S8-Di), fragmentation into nanoparticles and surface oxidation promote localized liquid absorption.
On the other hand, sonication at 80% amplitude in the dispersed fraction homogenizes the extreme hydrophilic response, regardless of the starting graphite, possibly due to the generation of polar functional groups such as -OH and -COOH, and may also promote the formation of ether-type epoxide groups during sonication, which increases the solid-liquid interfacial energy and favors complete wetting. The fragmentation of graphite into nanoparticles creates a porous structure that facilitates liquid penetration via capillary action, in accordance with the Wenzel model. Furthermore, the presence of trace metals (Co, Cu, etc.) could act as active sites for oxidation reactions, promoting the hydrophilicity of the materials.
Overall, it is concluded that sonication at 50% amplitude favors the production of superhydrophobic materials, whereas amplitudes of 80% induce extreme hydrophilicity, except in the case of materials derived from commercial graphite. These findings suggest a multifaceted approach to designing materials with controlled wetting properties by adjusting ultrasonic treatment intensity and surface morphology.
In this regime, the formation of liquid marbles can be observed, where liquid droplets (typically water) are coated with hydrophobic particles that prevent wetting [
56]. This behavior is characteristic of superhydrophobic materials [
55], in which surface roughness traps air pockets, creating a liquid-air-solid interface. The presence of liquid marbles, which roll freely across the surface, is a key indicator of the Cassie-Baxter state. This phenomenon is commonly observed in materials with micro- or nanostructures that minimize contact between the liquid and the solid, such as graphene functionalized with nonpolar groups or surfaces with hydrophobic coatings [
50].
4.4. Textural Properties
The textural analysis of the materials indicates that they fall within the mesoporous range (2–50 nm). Specific surface area (BET) measurements revealed that the decanted fraction did not exhibit significant changes compared to the starting graphite [
58]. In contrast, the dispersed fraction of graphene showed substantial increases in specific surface area, with an approximate 100% increase for materials derived from commercial graphite and up to 200% for those obtained from LIB graphite. This significant increase in the dispersed fraction can be attributed to the greater exposure of internal surfaces following exfoliation. The enhancement in the surface area of LIB-derived graphene is likely due to a combination of exfoliation, pre-existing defects, and the formation of few-layer sheets, which promote the opening of new active surfaces [
58]. Conversely, the decanted fraction exhibited minimal increases, likely due to its composition of thicker (~3-layer) and less exfoliated sheets, which restrict access to internal surfaces.
Regarding pore diameter, materials derived from commercial graphite exhibited a significant increase, ranging from 70% to 160%, from 15.45 nm in the original commercial graphite to 39.73 nm in the decanted fraction sonicated at 80% amplitude. In contrast, materials derived from LIB graphite maintained a nearly constant pore diameter of approximately 22.4 nm, with no clear correlation between pore size and recovered fraction (dispersed or decanted) or sonication amplitude (50% or 80%).
The observed expansion in pore diameter for materials derived from commercial graphite, particularly in the decanted fraction, can be attributed to the more ordered and less defective initial structure of this type of graphite [
35]. During sonication, mechanical stresses and cavitation promote mesopore growth by widening pre-existing pores. This effect is more pronounced in the decanted fraction because the partially exfoliated, multi-layered sheets (approximately three layers, according to Raman analysis) can retain expanded porous structures. In contrast, the constant pore diameter in graphene derived from LIBs suggests that these materials already possess a more heterogeneous and defective porous structure due to charge-discharge cycles during their use. This is consistent with their slightly larger initial pore diameter compared to commercial graphite, making them less sensitive to sonication-induced modifications in pore diameter.
Regarding pore volume, the decanted fraction materials remained nearly unchanged compared to reference graphite, whereas the dispersed fraction materials exhibited a substantial increase in pore volume-approximately 100% for LIB-derived materials and up to 200% for those obtained from commercial graphite. The significant increase in pore volume in the dispersed fraction can be explained by the formation of thin graphene sheets (approximately two layers), which provide greater accessibility to internal pores. Sonication at 80% amplitude facilitates the near-complete exfoliation of these sheets, generating open structures with increased available pore volume. For LIB-derived materials, the moderate increase in pore volume may be related to residual impurities and structural defects that restrict pore growth.
4.5. Dispersion Conductivities
The electrical conductivity results of the material dispersions (
Table 3) reveal significant correlations between the graphite source, sonication amplitude, and recovered fraction. In general, materials derived from graphite recovered from LIBs exhibit significantly higher conductivity than those obtained from commercial graphite. For instance, the dispersed fraction (Di) of LIB-derived graphene sonicated at 80% amplitude (Gn-S8-Di) reaches 352 mS/cm, approximately 3.4 times higher than its commercial counterpart (Gc-S8-Di: 104.3 mS/cm).
The graphite source plays a crucial role in determining the conductivity behavior of the different graphene dispersions. LIB-derived graphene (Gn) not only outperforms commercial graphene (Gc) in this property but even under lower sonication conditions (50% amplitude), Gn-S5-Di (265 mS/cm) surpasses Gc-S8-Di (104.3 mS/cm), which was processed at 80% amplitude. This advantage may be related to the electrochemical history of LIB graphite. During charge/discharge cycles, the repeated intercalation of various metals induces a controlled expansion of the layered structure, effectively “pre-conditioning” the material for more efficient exfoliation. Additionally, the presence of metallic impurities enhances the conductivity of the recovered graphite, which could be beneficial for electronic applications.
This pronounced difference suggests that LIB-derived graphite possesses intrinsic structural characteristics that favor the production of high-conductivity graphene. This finding aligns with the zeta potential values, where materials derived from recovered graphite exhibited higher absolute values compared to those obtained from commercial graphite.
The sonication amplitude proved to be a significant factor, regardless of the graphite source or recovered fraction. As the amplitude increased, the conductivity of all dispersions improved. For instance, in the decanted fraction of commercial graphite, Gc-S8-De (91.2 mS/cm) exhibited an 81% increase compared to Gc-S5-De (50.2 mS/cm). Similarly, in LIB-derived graphite (Gn), Gn-S8-De (164 mS/cm) surpassed Gn-S5-De (143 mS/cm) by 15%. This trend aligns with the observed zeta potential values.
This behavior may be attributed to the greater mechanical energy transfer at higher amplitudes, which effectively breaks the interlayer Van der Waals bonds, reducing the number of layers. However, this decrease in layer count is only evident in Raman spectroscopy for the dispersed fraction at 80% amplitude. Additionally, in all cases, the dispersed fractions (Di) exhibited significantly higher conductivities than the decanted fractions (De). For example, in LIB-derived graphite treated at 50% amplitude, Gn-S5-Di (265 mS/cm) exceeded Gn-S5-De (143 mS/cm) by 85%.
4.6. Density Solids
The density of all analyzed materials decreased compared to the original graphite, which is consistent with the exfoliation process. The most significant reduction in density was observed in the dispersed fraction, particularly in LIB-derived graphene subjected to sonication at 80% amplitude (Gn-S8-Di). This effect is attributed to the presence of thin layers, approximately two in number, which lead to less compact structures. The observed decrease in density across all cases aligns with the exfoliation process, where layer separation reduces material compaction.
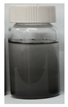
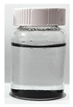
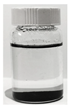
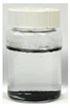
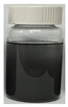
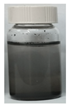
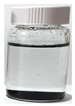
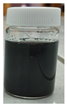
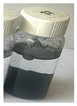
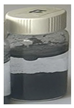
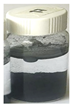
4.7. Dispersion Stability and Exfoliation Yields
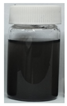
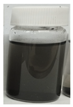
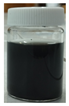
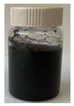
The results indicated that both the sonication amplitude and the type of graphite used significantly influenced the dispersion stability and exfoliation efficiency. Notably, graphite recovered from LIBs yielded more stable dispersions compared to commercial graphite. Furthermore, increasing the sonication amplitude from 50% to 80% enhanced graphene formation in the dispersed fraction, as evidenced by a more intense coloration of the suspensions, indicative of a higher concentration of exfoliated material.
As summarized in
Table 4, the exfoliation yield varied depending on the graphite type and sonication conditions. Commercial graphite subjected to 50% sonication amplitude exhibited a limited exfoliation yield, with 95.54% of the material remaining in the decanted fraction and only 4.46% in the dispersed fraction. Increasing the sonication amplitude to 80% resulted in a slight improvement, with the dispersed fraction reaching 5.55% and the decanted fraction accounting for 94.45%. This suggests that while higher sonication energy may promote exfoliation, the effect is less pronounced for commercial graphite, likely due to its lower intrinsic exfoliation susceptibility in the absence of natural stabilizers.
In contrast, graphite recovered from LIBs demonstrated superior exfoliation efficiency under identical conditions. At 50% sonication amplitude, the dispersed fraction reached 8.60%, increasing to 9.95% at 80% amplitude. Although the absolute difference in exfoliated material was not drastic, the dispersions derived from LIB-derived graphite exhibited significantly greater long-term stability, indicating a reduced tendency for aggregation and sedimentation of exfoliated graphene.
This behavior can be attributed to the presence of trace metal impurities in the recycled graphite from LIBs, such as manganese, nickel, cobalt and copper (identified by both AAS and XPS), which may act as counter-cations within the dispersion. These metallic species could interact with the surface of exfoliated graphene, enhancing its stabilization in the aqueous medium and mitigating its propensity to reaggregate. Consequently, dispersions obtained from LIB-derived graphite exhibited superior stability and lower sedimentation rates compared to those derived from commercial graphite, even when the amount of exfoliated material was comparable.
These findings align with prior literature reports [
6,
7,
9,
59,
60,
61], which have demonstrated that liquid-phase exfoliation efficiency and graphene dispersion stability are influenced by factors such as sonication energy, precursor surface chemistry, and the presence of stabilizing species. In this context, the presence of metallic traces in recycled LIB graphite appears to play a critical role in enhancing dispersion stability, presenting a potential advantage for graphene production from battery waste.
On the other hand, sonication amplitude and graphite origin are key factors influencing graphene production via liquid-phase exfoliation. While higher sonication amplitudes moderately improve exfoliation efficiency, dispersion stability is significantly enhanced by the presence of metallic species in LIB-derived graphite. This finding highlights a potential advantage in leveraging battery waste for the sustainable synthesis of advanced nanomaterials, offering promising prospects for large-scale graphene production.
4.8. UV-Vis Analysis
A preliminary characterization was conducted to confirm the formation of graphene in the different samples, with Ultraviolet–Visible (UV-Vis) spectroscopy being the first technique used for this purpose. The UV-Vis spectra were analyzed to detect characteristic peaks associated with the presence of graphene in the dispersed and decanted fractions of the materials obtained from both commercial graphite and discarded battery graphite after ultrasonic exfoliation. The UV-Vis spectra are displayed in
Figure 3. This technique allowed for the initial identification of graphene-related features and provided insights into the extent of graphene formation under the different experimental conditions.
In the analysis of these spectra, no band was identified in either the graphite from discarded batteries or the commercial graphite. It is important to note that the absence of specific bands in the UV-Vis spectra for both types of graphite is consistent with findings reported in the literature [
12,
15,
62]. According to studies, graphite itself does not exhibit distinct UV-Vis absorption bands in the 200–800 nm range, as the conjugated π-electron system of graphite typically absorbs in a different region, primarily in the infrared or visible range. Therefore, the lack of observable bands in this region for both commercial and discarded battery graphite aligns with the expected behavior for unmodified graphite, which does not possess the specific electronic transitions seen in graphene oxide or reduced graphene oxide. This result highlights the need for further processing or exfoliation to induce the characteristic features of graphene, such as the π-π* transition, which would appear in the UV-Vis spectra.
However, for the commercial graphene, a broad band was identified with a center around 265 nm [
12,
62], which is characteristic of graphene and is associated with the sp
2 hybridization of the C=C bonds in graphene [
14,
63]. Specifically, this band was more pronounced in materials sonicated from LIB graphite compared to those from commercial graphite, when compared at the same sonication percentage. Similarly, it was found that materials sonicated at a higher amplitude percentage (80%) exhibited a more pronounced band compared to those sonicated at 50%. Additionally, the materials from the dispersed fraction showed a higher intensity of this band, suggesting a greater amount of graphene is present in this fraction, although it cannot be ruled out that some graphene may also be present in the decanted fraction. Thus, based on this technique, it is initially evident that materials obtained via sonication at 80% amplitude from battery graphite, particularly those recovered in the dispersed fraction, contain a higher amount of graphene.
4.9. DRX Analysis
Figure 4 presents the diffractograms obtained for the different materials. All samples exhibit several common peaks associated with the characteristic crystalline phases of carbonaceous materials. The most prominent peaks correspond to the (002), (100), (101), (004), and (103) planes, located at 2θ angles of 26.1°, 42.4°, 44.5°, 54.7°, and 59.9°, respectively. These reflections indicate the laminar structure and degree of crystalline ordering typical of this type of material [
11,
64,
65].
Additionally, in graphene derived from graphite recovered from LIBs, two additional peaks associated with copper oxide (CuO: tenorite) are identified at 2θ angles of 38.7° and 65.5°, corresponding to the (111) and (022) planes, respectively [
66,
67]. However, these peaks are observed only in the dispersed fraction of these materials (Gn-S5-Di and Gn-S8-Di). This finding is consistent with AAS and XPS results, which identified metal impurities, including Cu. Other metals were not detected by this analysis, likely because their concentrations were below the detection limit of the technique or due to their specific distribution within the graphene structure [
68].
The presence of Cu may result from its accumulation in graphite during the electrochemical cycling of charge and discharge in LIBs or from the graphite recovery process from the copper foils on which it is deposited. This hypothesis aligns with AAS analyses, which identified Cu contents ranging from 0.465 to 1.271 wt% in materials recovered from LIBs. The fact that these CuO peaks appear only in the dispersed fraction suggests that CuO nanoparticles may localize during exfoliation. Their weak affinity with exfoliated carbon layers could promote the formation of ordered crystalline domains, increasing the XRD detection limit (~1–5%) despite their low overall concentration. In contrast, in non-dispersed fractions, such as unexfoliated graphite or sedimented residues, Cu likely remains diluted within the graphite matrix or in amorphous forms, preventing its detection [
64,
66]. Based on this, it can be inferred that the dispersed fraction of LIB-derived graphene exhibits a structure similar to that of commercial graphene, likely to consist of very few stacked layers.
The most prominent peak characteristic of carbonaceous materials appears at 26.1°, corresponding to the (002) plane of graphite, which indicates graphene layer stacking.
Figure 4 shows that commercial graphite (Gf-C) exhibits the most intense peak, reflecting a highly ordered structure with minimal defects. In contrast, graphite recovered from LIBs (Gpi) shows a peak intensity reduced to approximately one-third of that of Gf-C, suggesting lower stacking order due to degradation during its use in LIBs. This process induces defects and increases interlayer spacing, leading to a less crystalline and more turbostratic structure [
69]. Meanwhile, commercial graphene (Gn-C) presents the lowest (002) peak intensity, indicating a highly defective structure or very few stacked layers with weak interlayer interactions. The progressive decrease in peak intensity reflects a reduction in layer stacking, which aligns with increased turbostratic disorder (order within each plane but with random orientation) [
5,
70].
Figure 5 presents the second most intense peak, identified at 54.7°, assigned to the higher-order (004) plane. This reflection is particularly useful for estimating the exfoliation level of the evaluated materials, as higher-order planes like (004) require a more periodic stacking of layers to produce constructive interference. This characteristic enhances its sensitivity to layer ordering, especially since reflections at angles greater than 50° are more widely spaced, reducing phase ambiguity. It can be observed that commercial graphite (Gf-C) exhibits the highest intensity for this peak, followed by battery-derived graphite (Gpi), whereas commercial graphene (Gn-C) shows the lowest intensity, consistent with its disordered or few-layered structure.
Additionally,
Figure 5 illustrates that sonicated materials display a broad variation in intensity depending on the graphite source and analyzed fraction. For instance, graphene derived from commercial graphite exhibits higher peak intensity than that from LIBs. Moreover, the dispersed fraction of LIB-derived materials presents the lowest intensity, approximately 30% higher than commercial graphene. In contrast, the dispersed fraction of materials originating from commercial graphite exceeds commercial graphene by approximately 500%, suggesting that the recovered dispersed fraction of LIB-derived graphite possesses a layer count approaching that of graphene.
Furthermore,
Figure 4 reveals that the dispersed fraction of LIB-derived graphene does not exhibit the 2θ ≈ 59.9° peak corresponding to the (103) plane. This peak serves as a key marker for assessing three-dimensional (3D) order in crystalline graphite, as it corresponds to a non-basal reflection (hkl with h, l ≠ 0). Its presence requires atomic correlation in three dimensions due to the ordered stacking of layers along the c-axis (ABAB sequence) and lateral alignment in the basal plane (a–b) [
71]. Therefore, the presence of this peak confirms a 3D structure, whereas its attenuation or absence indicates disorder or partial to complete exfoliation. Based on this, the complete disappearance of this peak in the dispersed fraction of graphene (Gn-S5-Di and Gn-S8-Di) signifies a significant loss of 3D order, indicating exfoliation approaching few-layer graphene. This result is consistent with the behavior observed in commercial graphene, which lacks the (103) peak due to its inherent 2D or few-layer nature [
36,
72].
According to the literature [
5,
70,
73,
74], XRD analysis is an essential tool for determining key properties such as interlayer spacing (d002) and average crystallite size (DGP). In carbonaceous materials like graphite, these parameters are obtained from the analysis of the (002) peak, which characterizes the stacking of graphene layers, using Bragg’s law (nλ = 2d sinθ) and the Scherrer equation (DGP = Kλ/βcosθ), where K is a shape factor (typically 0.89 for (002) planes), λ is the wavelength of the radiation (0.15406 nm), β is the full width at half maximum (FWHM) of the peak, and θ is the diffraction angle. Based on these values, the approximate number of layers (NL) was determined using the relation NL = DGP/d
002, where d
002 was experimentally obtained for each material based on its specific diffraction angle [
73].
This approach has been widely applied in the literature for carbonaceous materials derived from commercial sources and even recycled LIBs [
10,
14,
73,
75]. However, it is important to consider that the application of the Scherrer equation assumes a spherical crystallite morphology, which introduces uncertainties in layered materials such as graphene. In these materials, anisotropy and the presence of defects may alter the correlation between particle diameter and interlayer spacing. Nonetheless, despite these limitations, this technique remains fundamental for comparative studies and process optimization, provided that its scope and limitations are carefully considered, particularly in the context of highly exfoliated or disordered systems.
Table 5 presents the NL results for each material. Based on these results, the evaluated materials can be categorized into two main groups: those derived from commercial graphite and those obtained from LIBs. The NL values reveal general trends associated with the exfoliation process and the inherent limitations of the XRD technique. First, it is observed that materials derived from commercial graphite exhibit a layer count ranging from 2.5 to 3.7, with a moderate reduction in NL as the sonication amplitude increases from 50% to 80%. For instance, in the sedimented fraction, NL decreases from 3.0 (Gc-S5-De) to 2.5 (Gc-S8-De), while in the dispersed fraction, it decreases from 3.7 (Gc-S5-Di) to 2.7 (Gc-S8-Di). This trend suggests that higher ultrasonic energy (80% amplitude) promotes slightly more efficient exfoliation, although the effect is limited, likely due to a balance between crystallite fragmentation and actual layer separation.
In contrast, graphene derived from LIB-recovered graphite consistently shows NL values between 2.0 and 2.5, regardless of the applied amplitude. This indicates a slightly higher degree of exfoliation compared to graphene derived from commercial graphite [
62], which may be attributed to an enhanced exfoliation capability even at lower sonication amplitudes. This behavior is likely related to the presence of structural defects or impurities in the recycled graphite source, as identified by both AAS and XPS.
A particular aspect of the results is observed in the NL values obtained for Gf-C and GPi graphite (~2.0 layers), which are unexpectedly low for a graphitic material. This can be attributed to specific limitations of the XRD method, as the Scherrer equation assumes the presence of well-defined and separated crystalline domains. However, in graphite, the layered morphology and the possible presence of turbostratic disorder (rotationally misaligned layers) induce an artificial broadening of the (002) peak, which reduces the calculated DGP and, consequently, severely underestimates NL.
Additionally, the technique may not be well-suited for detecting extremely tightly stacked layers, which could explain the observed underestimation in the analyzed graphite. Based on these observations, the XRD-based exfoliation efficiency analysis suggests that the sonication treatments promote layer separation in both the decanted and dispersed fractions of materials derived from LIBs and commercial graphite. However, given the limitations of the technique, complementary analyses using Raman spectroscopy and HRTEM are necessary to achieve a more precise characterization of the exfoliation degree.
4.10. Raman Analysis
The Raman spectra of all materials (
Figure 6) exhibited three characteristic bands of crystallized carbonaceous materials with sp
2 hybridization: the D band at ~1360 cm
−1, attributed to the A
1g mode activated by structural defects at graphene ring edges; the G band at ~1580 cm
−1, associated with the E
2g vibrational mode of C-C bond stretching; and the 2D band at ~2710 cm
−1, corresponding to the second harmonic of the D band, generated by double resonant phonon scattering [
17,
75,
76,
77]. These bands provide key structural insights, such as the number of layers and defect density, through the analysis of their relative intensities. The I
2D/I
G ratio is a critical parameter for determining the exfoliation degree, where values close to or above 1.6 indicate monolayer graphene, values around 0.8 suggest few-layer structures (~2 layers), values near 0.3 correspond to multilayer graphene (~3 layers), and a further reduction to ~0.07 reflects graphite-like behavior, indicating insufficient exfoliation [
12,
75,
78,
79]. Additionally, an increase in the I
D/I
G ratio signifies a higher density of defects, fractures, or topological imperfections in the carbon network [
17,
76,
80].
The results presented in
Table 5 show the intensity ratio values for all evaluated materials. When comparing the reference materials (Gf-C, Gpi, and Gn-C), it is observed that both commercial graphite and graphite recovered from LIBs exhibit I
2D/I
G values significantly lower than 0.3 (0.18 and 0.16, respectively). This indicates that these materials are predominantly composed of highly ordered multilayer structures, whereas commercial graphene presents an I
2D/I
G value of 0.76, characteristic of ~2-layer materials [
76,
81].
Figure 5a,b illustrate the evolution of the I
2D/I
G and I
D/I
G intensity ratios, respectively, as a function of the analyzed fraction (decanted or dispersed) for each material. These results provide insight into the number of layers based on these parameters. The I
2D/I
G values reveal that all sonicated materials, both from commercial graphite and LIBs, exhibit graphene-like characteristics, even those processed at lower amplitudes (50%). However, this ratio is slightly higher for materials derived from LIB graphite, which may be associated with the presence of impurities that facilitate the exfoliation process during localized sonication.
Additionally, the decanted fractions displayed similar I
2D/I
G values (ranging from 0.46 to 0.51), indicating a reduction to a comparable number of layers (~3 layers) [
76], compared to the original multilayer graphite, regardless of the sonication amplitude or material. In contrast, in the graphene obtained from the dispersed fraction, the effect of increased amplitude on exfoliation is more pronounced. For instance, in LIB-derived materials, this ratio increased from 0.53 to 0.74 when sonicated at 50% and 80%, respectively. Furthermore, in both graphite sources (commercial and LIBs) sonicated at 80%, the dispersed fraction exhibited I
2D/I
G values closer to those of commercial graphene (~2 layers), with Gc-S8-Di showing the highest similarity to commercial graphene.
On the other hand,
Figure 7b presents the I
D/I
G ratio as an estimate of the defect density or structural disorder [
82]. As observed, commercial graphite exhibits an I
D/I
G value of 0.12, indicative of a highly ordered structure, whereas LIB-recovered graphite shows a higher value (0.19), suggesting greater disorder. In contrast, commercial graphene presents an I
D/I
G of 0.46, reflecting a more fragmented structural network [
9,
77,
83], consistent with its low surface area and non-pristine monolayer nature.
Figure 7b also reveals that materials derived from commercial graphite retain a superior structural organization in all cases compared to those obtained from LIBs. The higher I
D/I
G values in LIB-derived materials coincide with the presence of impurities and the electrochemical history of the precursor. Additionally, it is observed that the decanted fractions of both materials exhibit similar I
D/I
G values regardless of sonication amplitude but consistently lower than their corresponding dispersed fractions. This suggests that the decanted material retains a more ordered structure, whereas the dispersed fractions, subjected to more intense exfoliation, accumulate greater fragmentation and defects.
These findings, together with the calculated number of layers, confirm the successful exfoliation of graphene in both fractions across all materials. However, the resulting graphene varies in quality. Mechanical exfoliation effectively reduces the number of layers while increasing structural disorder, a trend more pronounced in graphene derived from LIBs. This behavior may be attributed to the presence of residual metallic impurities and the degradation of the carbon network during battery life cycles. Notably, defect density could be a critical factor in applications sensitive to electronic, mechanical, or catalytic properties. Although sonication at higher amplitude (80%) enhances exfoliation in dispersed LIB fractions, bringing them closer to commercial graphene, the significant increase in defect density implies a trade-off between exfoliation efficiency and structural preservation. This balance could be strategically managed depending on specific application requirements.
4.11. HRTEM Analysis
Figure 8 presents the HRTEM micrographs corresponding to commercial graphene and the samples obtained in this study. The images reveal thin sheets with regular edges in the case of commercial graphene, while the graphene obtained through exfoliation exhibits irregular edges, characteristic of the two-dimensional structure of graphene. The presence of a few layers, generally between one and three, is a key indicator of graphene formation, although it is important to note that ideal graphene is monolayer, whereas multilayer graphene exhibits properties more like graphite.
In all images, the graphene sheets appear partially overlapped or folded, attributed to surface interactions and the exfoliation process. However, commercial graphene shows a greater number of semitransparent regions compared to the samples obtained from both types of graphite, confirmed by the presence of areas with lower contrast, indicating a smaller number of layers in these samples. In contrast, the exfoliated samples display more dark areas corresponding to stacks of multiple layers. These findings are consistent with results obtained through XRD and Raman spectroscopy, indicating several layers approximately between 1 and 3 for all samples.
Additionally, the micrographs reveal significant differences in the purity of the obtained materials. Commercial graphene reflects high purity, evidenced by the absence of impurities, indicating superior quality, likely due to a controlled synthesis process. In contrast, graphene derived from the graphite of LIBs shows the presence of various nanoparticles, in some cases homogeneously distributed, attributable to residual metals such as Cu, Mn, and Co from the batteries. These metals were identified through techniques like AAS and XPS, indicating lower quality in these materials. However, the presence of impurities in graphene is not always a negative factor, as they could have a positive effect if these materials are intended for catalytic applications, given that these nanoscale metals can catalyze various reactions.
It is important to note that HRTEM analysis did not reveal significant differences between the various materials obtained from LIBs, commercial graphene, and those derived from commercial graphite, except for the presence of impurities, which are clearly observed in graphene from LIBs. Additionally, it was not possible to identify differences between the materials obtained at different amplitude percentages. These results are consistent with previous studies that have reported the presence of metallic impurities on graphene obtained from recycled LIBs. For example, in the study by [
35,
59], the presence of metallic nanoparticles in recycled graphene was observed, which influenced the electrochemical properties of the material.
On the other hand, the HRTEM micrographs provide visual evidence of the structural and purity differences between commercial graphene and those obtained by exfoliation of graphite from spent batteries and commercial graphite. These observations are fundamental to understanding the properties and potential applications of the materials obtained.
4.12. H2-TPR Analysis
Figure 9 and
Figure 10 present the general and deconvoluted H
2-TPR profiles of the materials, respectively, providing insight into their reducibility. Furthermore,
Table 6 summarizes the H
2 consumption associated with each reduction event, enabling a quantitative comparison of the materials’ reduction behavior. The results reveal notable differences between the samples derived from commercial graphite and those obtained from recycled graphite from spent LIBs. In general, the observed reduction events can be attributed to the presence of oxygen-containing functional groups and the reduction of metal impurities, particularly copper and manganese oxides in the case of materials derived from LIB graphite.
The samples obtained from commercial graphite exhibited reduction events at higher temperatures, exceeding 500 °C. This behavior suggests a lower concentration of oxygen-containing functional groups and a more ordered structure, resulting in reduced reactivity toward hydrogen. In these samples, the total hydrogen consumption ranged from 0.026 to 0.053 mmol H
2/g (
Table 6), indicating a relatively low number of reducible species.
In contrast, the samples obtained from recycled LIBs graphite displayed multiple reduction events at lower temperatures, around 300 °C. This behavior suggests a higher content of oxygen-functionalized groups, such as epoxides and hydroxyls, which typically reduce within this temperature range. Moreover, these samples exhibited higher hydrogen consumption, with values ranging from 0.028 to 0.058 mmol H
2/g (
Table 6). This increased reactivity could be related to a higher concentration of metal impurities and a more defective structure compared to the materials derived from commercial graphite. These results can be explained by several key factors related to the nature of the material, the presence of impurities, and the conditions of the exfoliation process.
The fact that graphene materials derived from commercial graphite exhibit reduction peaks at higher temperatures (>500 °C), while those from spent LIBs show reduction events at lower temperatures (~300 °C), suggests significant differences in chemical composition and structural characteristics. One plausible explanation is the presence of metal impurities in the graphene derived from LIBs, which may act as catalytic centers, facilitating the reduction of oxygen-functionalized groups at lower temperatures. Indeed, AAS analysis revealed the presence of Mn, Li, Cu, and Al in variable concentrations, with higher levels in the dispersed fraction. Based on the comparison of the TPR profiles of materials obtained from LIBs and commercial graphite, it is evident that the presence of these metals influences the reduction behavior, either by forming oxidized species that are reduced within specific temperature ranges or by modifying the hydrogen-carbon matrix interactions. These effects are discussed in detail in the TPR results section.
Moreover, in LIBs, the anode graphite can be contaminated with residues from the cathode or electrolyte, which contain metal oxides (e.g., MnO2 from LiMn2O4 cathodes, Cu from current collectors). Although the material was not intentionally subjected to oxidation processes or high temperatures, it is possible that the liquid-phase exfoliation using ultrasound may have induced slight surface oxidation of exposed metals due to conditions inherent to the process itself. This phenomenon has been reported in studies on colloidal dispersion and nanoparticle synthesis. Additionally, in aqueous environments, Mn and Cu can exist in different oxidation states depending on pH and redox potential. Cu can oxidize to Cu2+ and form species such as Cu(OH)2 or CuO under certain conditions, whereas Mn can exist in soluble forms or as colloidal MnO2. Furthermore, the detection of metal impurities by AAS and XPS suggests that these metals may be present in various forms, including metallic nanoparticles, oxides, or even species adsorbed on the graphene surface.
According to the literature, oxygen-functionalized groups in carbonaceous materials undergo reduction within distinct temperature ranges. Specifically, epoxide and hydroxyl groups typically reduce between 200 and 400 °C, while carbonyl and carboxyl groups generally reduce within the 400–600 °C range [
84,
85]. Additionally, the presence of metal impurities can modify the reduction profiles, as certain metals, such as copper (Cu) and manganese (Mn), form oxides that reduce at characteristic temperatures. In this regard, copper oxides (CuO, Cu
2O) commonly reduce between 200 and 300 °C, whereas manganese oxides (MnO
2, Mn
2O
3) typically reduce within the 300–500 °C range [
84,
86]. Therefore, the observed reduction peaks in the samples can be attributed to both the decomposition of these oxygen-functionalized groups and the reduction of metal oxides present as impurities.
On the other hand, the use of water as a solvent in the liquid-phase exfoliation process may have played a significant role in the surface composition of the materials obtained. In the presence of water, hydrolysis could promote the formation of additional oxygen-containing functional groups, such as hydroxyls and carboxyls, which would explain the higher hydrogen consumption observed during the reduction process. Furthermore, the ultrasonic treatment applied during exfoliation induces structural defects, which can enhance the material reactivity.
An additional factor influencing the reducibility of the materials is the sonication applied during sample preparation. A higher sonication amplitude tends to increase the number of structural defects and the presence of oxygen-containing functional groups, which in turn leads to higher hydrogen consumption during the reduction process. This effect is more pronounced in samples derived from recycled graphite, where the exfoliation induced by sonication enhances the accessibility of reducible species to hydrogen gas.
4.13. Surface Analysis by DRIFT-ATR
The results of the surface analysis by FTIR-ATR are shown in
Figure 11. The spectra of all materials reveal the presence of different bands. A broad band between 3200 cm
−1 and 3500 cm
−1, centered at 3450 cm
−1, is associated with the stretching of hydroxyl (-OH) groups and adsorbed water. This band appears more intense in materials derived from commercial graphite (Gf-C, Gpi, Gc-S5-De, and Gc-S8-De) compared to those obtained from LIB-recovered graphite (Gn-S5-Di, Gn-S8-Di, and Di), suggesting that the commercial material has a greater tendency to retain these functional groups after the applied treatments. Additionally, the suspended fraction in sonicated materials exhibits greater intensity in this region than the decanted fraction, which may be attributed to a higher specific surface area and a greater dispersion of oxygen-containing groups in this fraction.
A second band, located between 1600 cm−1 and 1700 cm−1 and centered at 1650 cm−1, corresponds to the stretching of C=O bonds. This band is more intense in materials derived from commercial graphite compared to those from LIBs, indicating a higher degree of functionalization with carbonyl groups. Among these, Gn-S8-Di exhibits the highest intensity, suggesting that higher-power sonication promotes more effective oxidation. The difference in C=O band intensity may be related to the initial structure of the precursor material since LIB-recovered graphite may contain fewer surface defects susceptible to oxidation. In contrast, commercial graphite, having undergone industrial treatment, might have greater accessibility for carbonyl group formation.
Additionally, weak bands are observed between 2925 cm−1 and 2850 cm−1 in some materials (Gf-C, Gpi, Gn-S5-Di, Gc-S5-De, Gn-S8-De, and Gc-S8-De), attributed to the C-H stretching of methyl and methylene groups. The presence of these bands suggests that, despite the applied treatments, residual aliphatic structures persist, likely originating from the graphite precursor of the graphene. The intensity of these bands is low in all cases but slightly more pronounced in materials derived from commercial graphite, suggesting that these materials retain a higher surface composition of such compounds. Furthermore, the band at 1580 cm−1, related to C=C stretching, is more prominent in graphene derived from commercial graphite in both decanted and suspended fractions, indicating a greater presence of surface functional groups.
At around 1400 cm−1, most materials, except for commercial graphene, exhibit a very weak band, which is slightly more evident in LIB-recovered materials subjected to 80% sonication. This suggests that sonication may induce structural changes that enhance the presence of vibrational modes associated with OH or CH bond deformation. Finally, in the 1100–1050 cm−1 region, two small bands appear, associated with C=O and C-C bonds. These bands are more pronounced in Gf-C and, to a lesser extent, in Gc-S5-De and Gc-S8-De, whereas they appear with even lower intensity in Gn-S5-Di. The presence of these bands suggests that some materials retain residual oxygenated structures after the applied treatments. Their relative intensity may be linked to the oxidation degree induced by the sonication process and the nature of the precursor material.
These results suggest that sonication has a significant effect on surface functionalization and the intensity of the observed bands. In general, sonicated materials exhibit more pronounced bands, indicating that this treatment enhances the exposure and generation of functional groups. Additionally, the difference between the suspended and decanted fractions suggests that sonication may induce greater fragmentation, increasing the accessibility of oxygen-containing groups in the more dispersed fraction.
For materials derived from LIBs, the lower intensity of carbonyl groups compared to those from commercial graphite suggests that the initial structure of the precursor plays a key role in the final surface composition. The fact that Gn-S8-Di exhibits higher carbonyl band intensity compared to other recycled materials indicates that the combination of high-power sonication and the chemical history of the starting material can influence the evolution of functional groups. This differential oxidation could be strategically exploited for specific applications.
5. Conclusions
These findings demonstrate that tip-sonotrode-assisted sonication is highly effective in modifying the textural properties of carbon-based materials. The production of dispersed fraction graphene with characteristics similar to commercial graphene (two layers) highlights the efficiency of the process, particularly for commercial graphite. Meanwhile, LIB-derived graphene offers additional sustainability advantages by contributing to the valorization of hazardous waste.
These results highlight that the combination of high sonication amplitude (80%), dispersed fraction (Di), and recycled battery graphite maximizes the conditions for producing conductive graphene. This not only validates LIB recycling as a sustainable strategy but also suggests that “used” materials can outperform their virgin counterparts in specific applications. This finding highlights a potential advantage in leveraging battery waste for the sustainable synthesis of advanced nanomaterials, offering promising prospects for large-scale graphene production.
In summary, increasing the sonication amplitude from 50% to 80% results in progressive exfoliation, reducing the number of layers. The sonication treatment significantly modifies the structure of both processed graphite, promoting mechanical exfoliation and graphene layer separation. Notably, LIB-derived graphite is more susceptible to this treatment. These findings emphasize the critical influence of sonication amplitude in achieving efficient exfoliation, particularly in the dispersed fraction, to obtain few-layer graphene structures.
Although water is generally considered an optimal dispersion medium due to its ubiquity and cost-effectiveness, most studies on liquid phase exfoliation have been carried out using organic solvents and surfactants as they have shown that dispersion stability of graphene derived from commercial graphite is so low, this is due to the hydrophobic nature of commercial graphite. Here, graphite is exfoliated from LIBs directly in pure water, circumventing the need for chemical agents or surfactants. The presence of impurities in graphite sourced from LIBs, such as metals and organic solvents, has been found to promote both exfoliation and the stable dispersion of graphene in water. This work demonstrates that it is possible to valorize the anodic graphitic material waste from spend LIBs as inputs for multilayer graphene production by exfoliation in the liquid phase; a simple, economical and environmentally friendly method. In contrast to the productivity exhibited by graphene derived from pristine graphite powders procured from Sigma-Aldrich, the graphene extracted from battery anodes showcased a remarkable fourfold increase in yield. This underscores the paramount significance of graphene sourced from batteries in terms of productivity enhancement.
These results confirm that combining recycled graphite from LIBs, high sonication amplitudes, and appropriate fraction selection creates optimal conditions for producing conductive graphene. Notably, recycled materials can outperform their virgin counterparts in terms of yield and aqueous dispersion behavior, making them highly relevant for real-world applications such as printed electronics, conductive inks, sensors, and energy storage devices.
Despite the promising results, this study has certain limitations. A more detailed mechanistic analysis of the role of impurities in the exfoliation behavior is still needed. Furthermore, while the process shows potential for scale-up, additional work is required to optimize energy consumption and assess the process from a life cycle perspective. Future research should focus on a deeper physicochemical characterization of impurity–graphite interactions, process evaluation at pilot scale, and validation for industrial applications.
Overall, this work presents a practical, economical, and environmentally friendly strategy for producing multilayer graphene from battery waste, aligning with circular economy principles and advancing the sustainable development of advanced nanomaterials. Moreover, it expands existing knowledge by validating the use of pure water as a dispersion medium and demonstrating the potential of waste-derived precursors for functional graphene production.


 ,
, 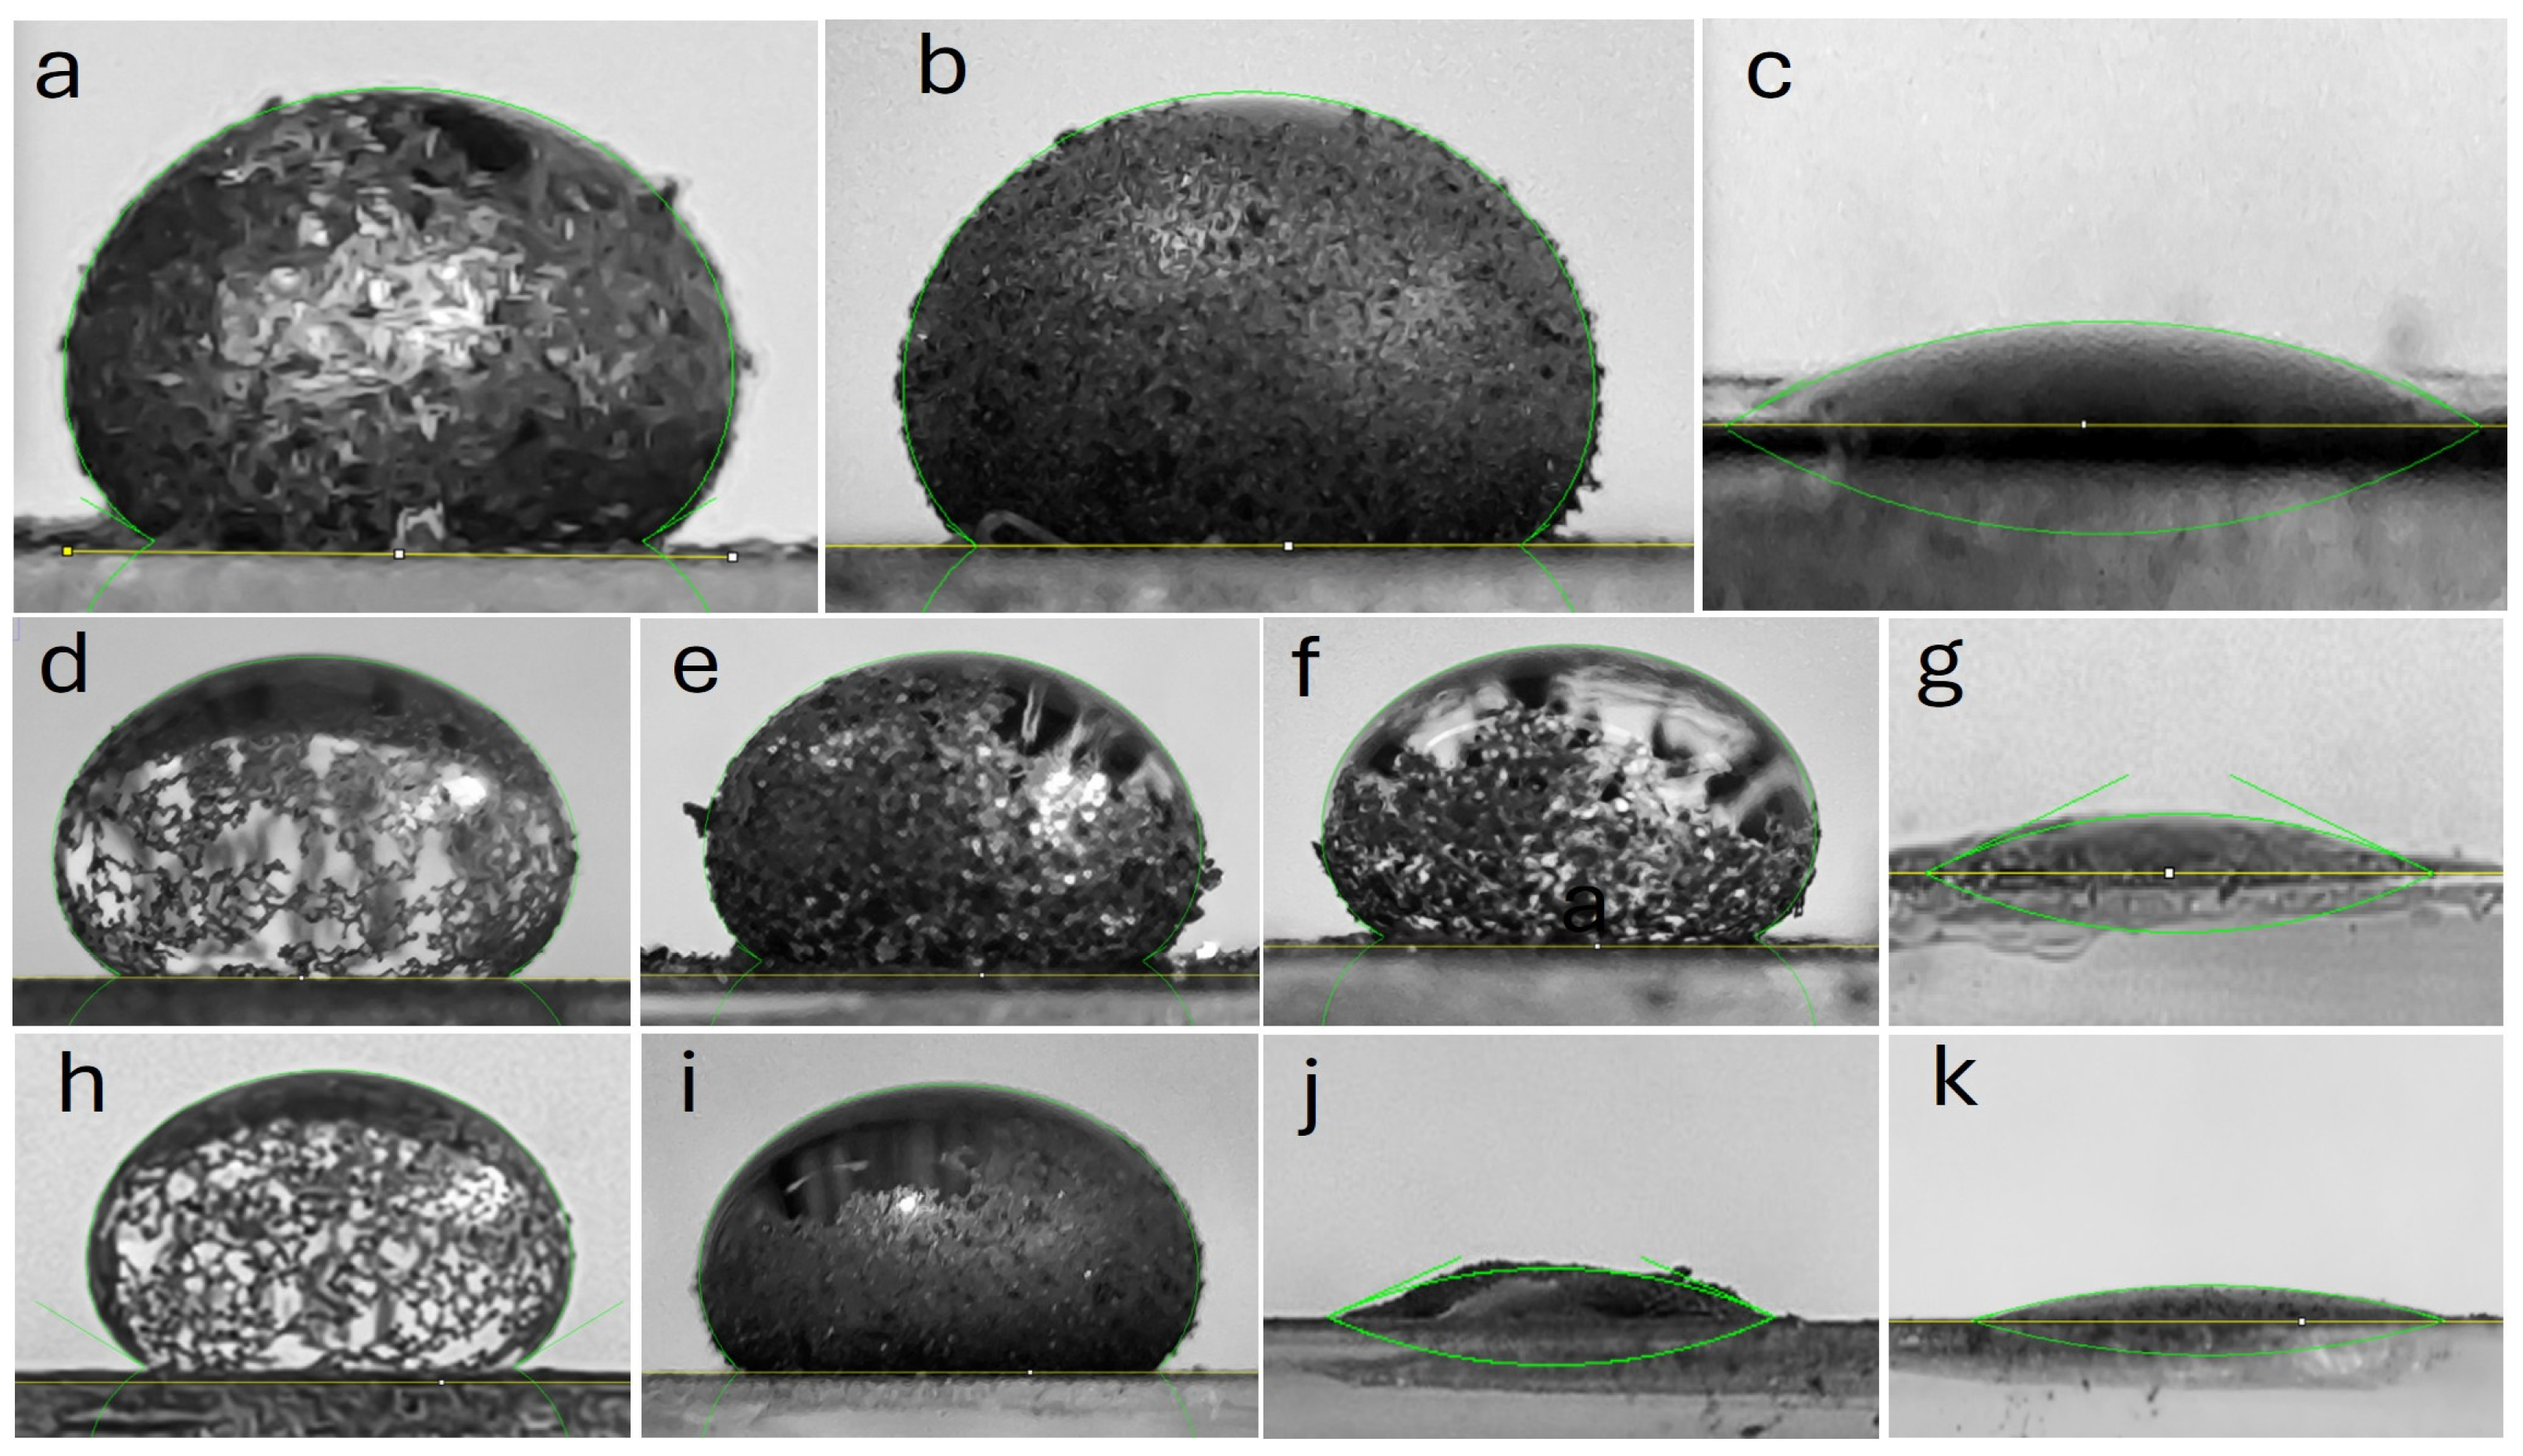

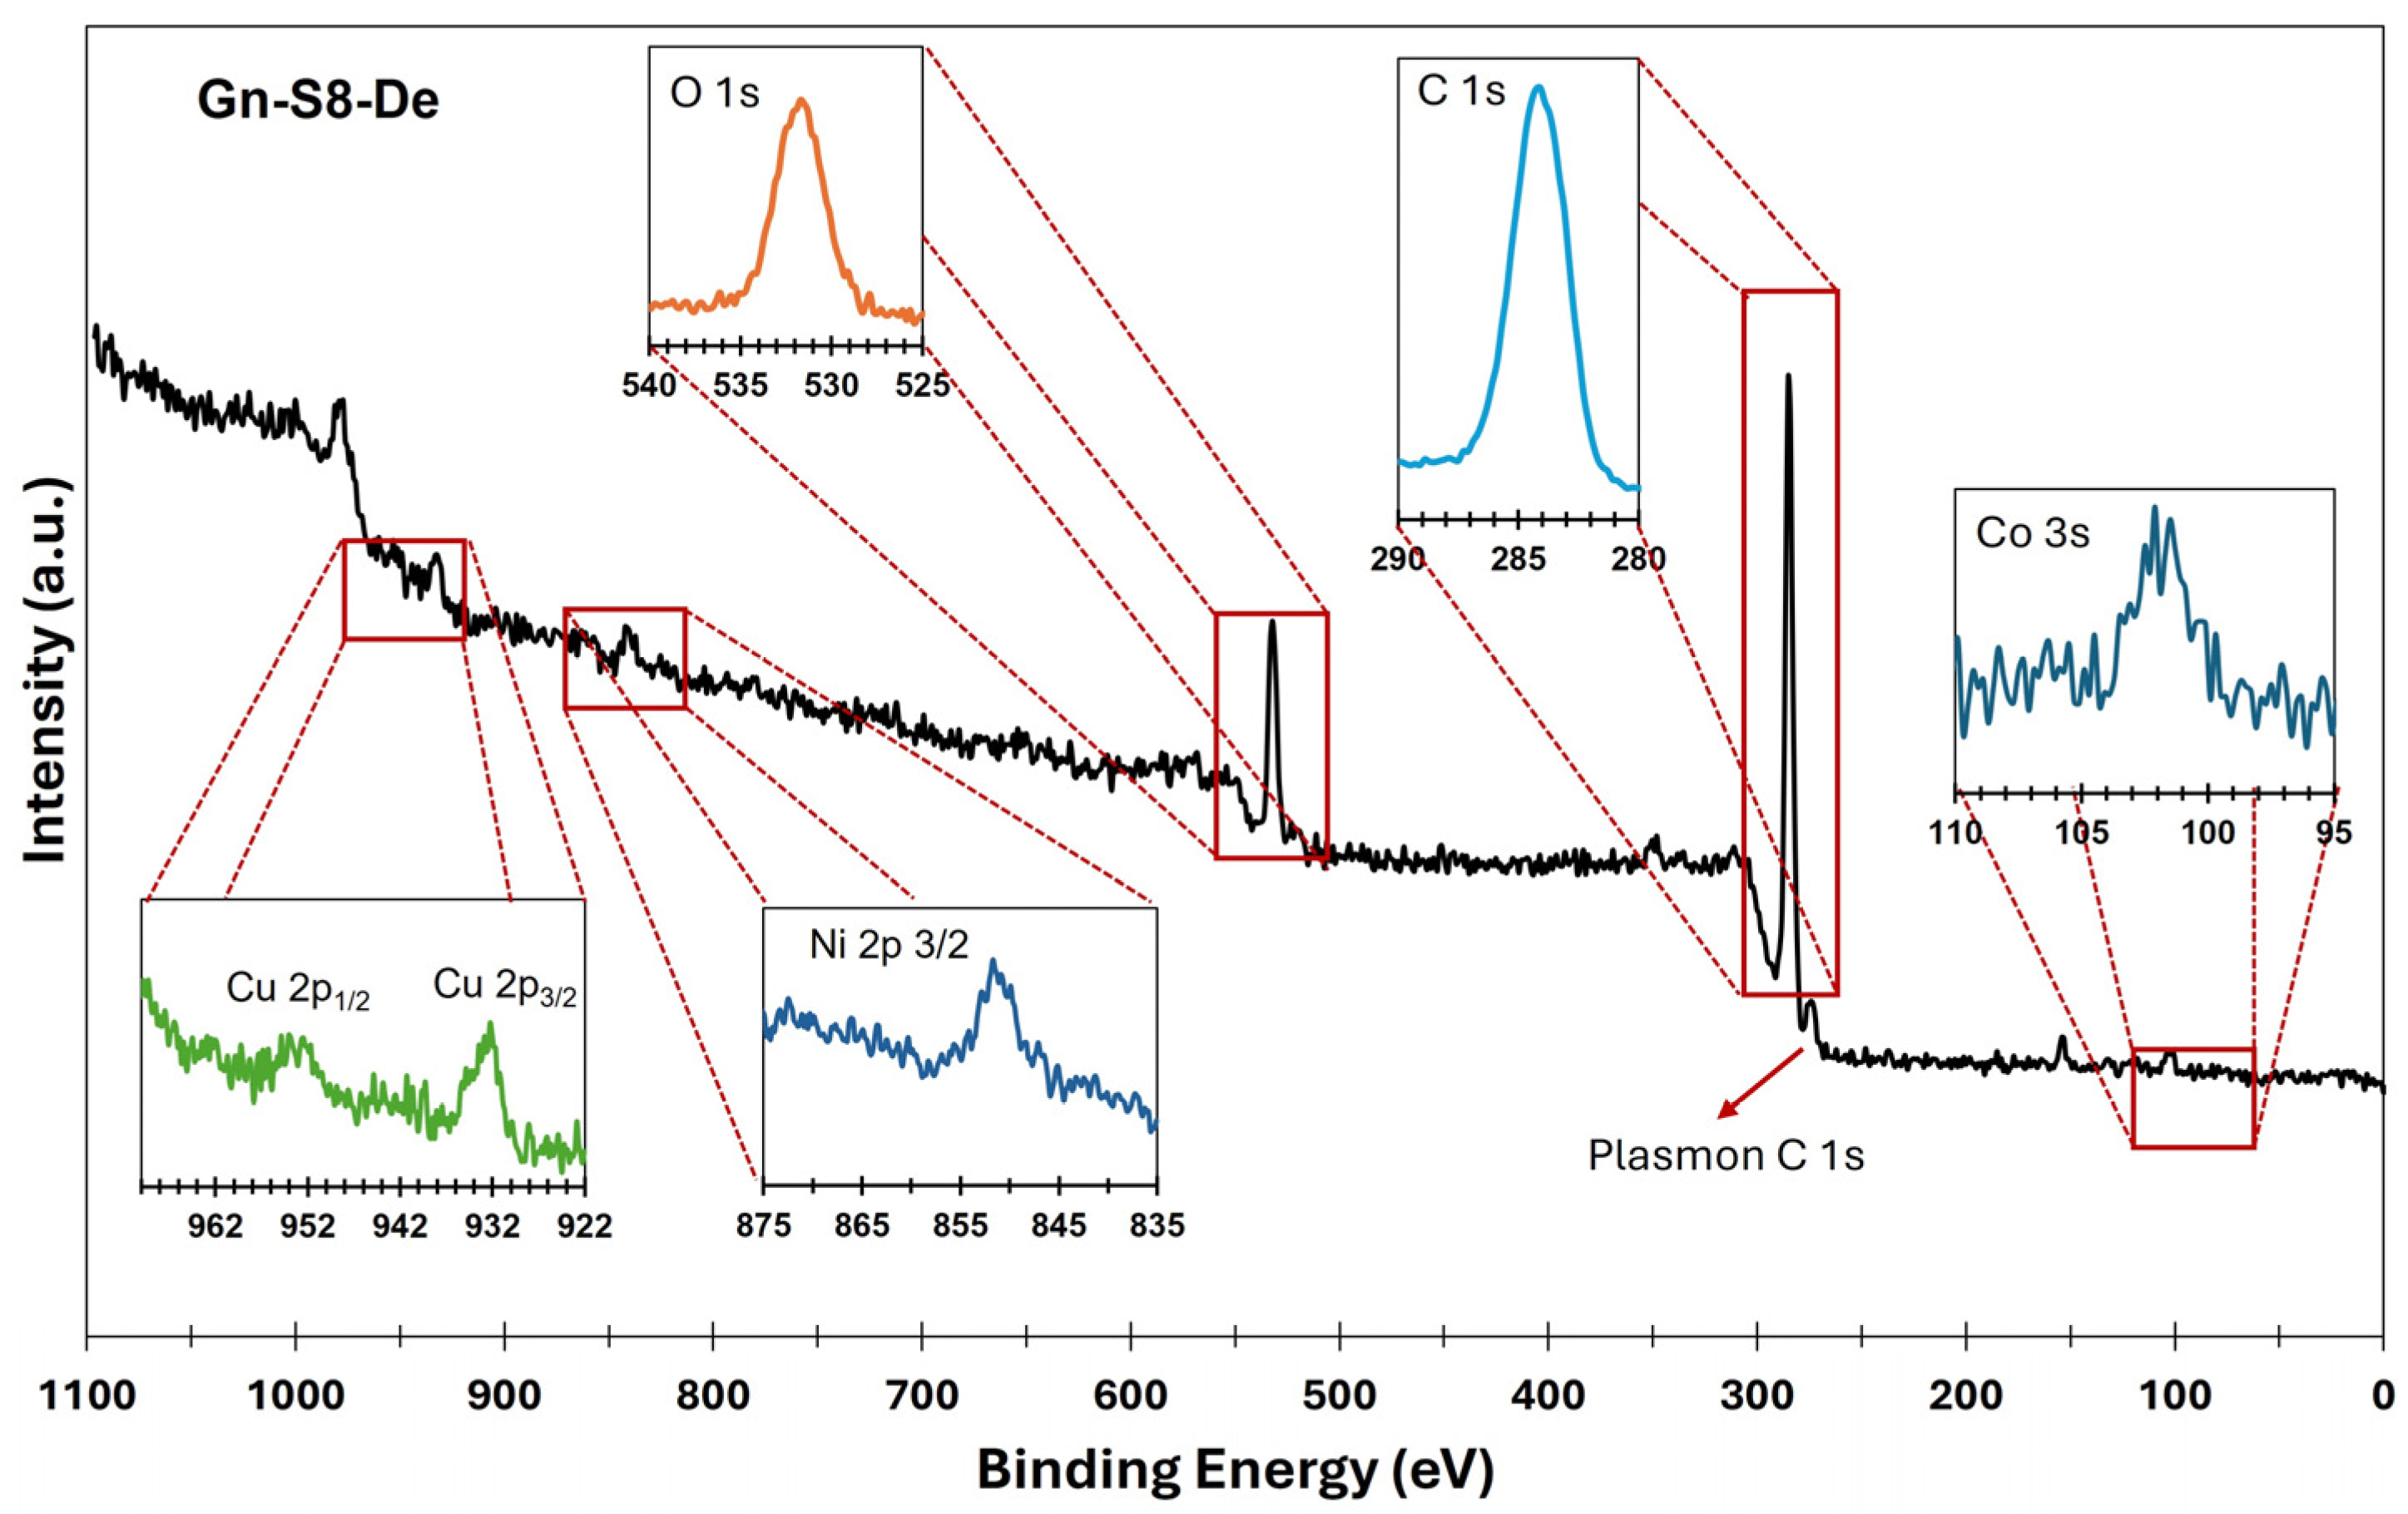
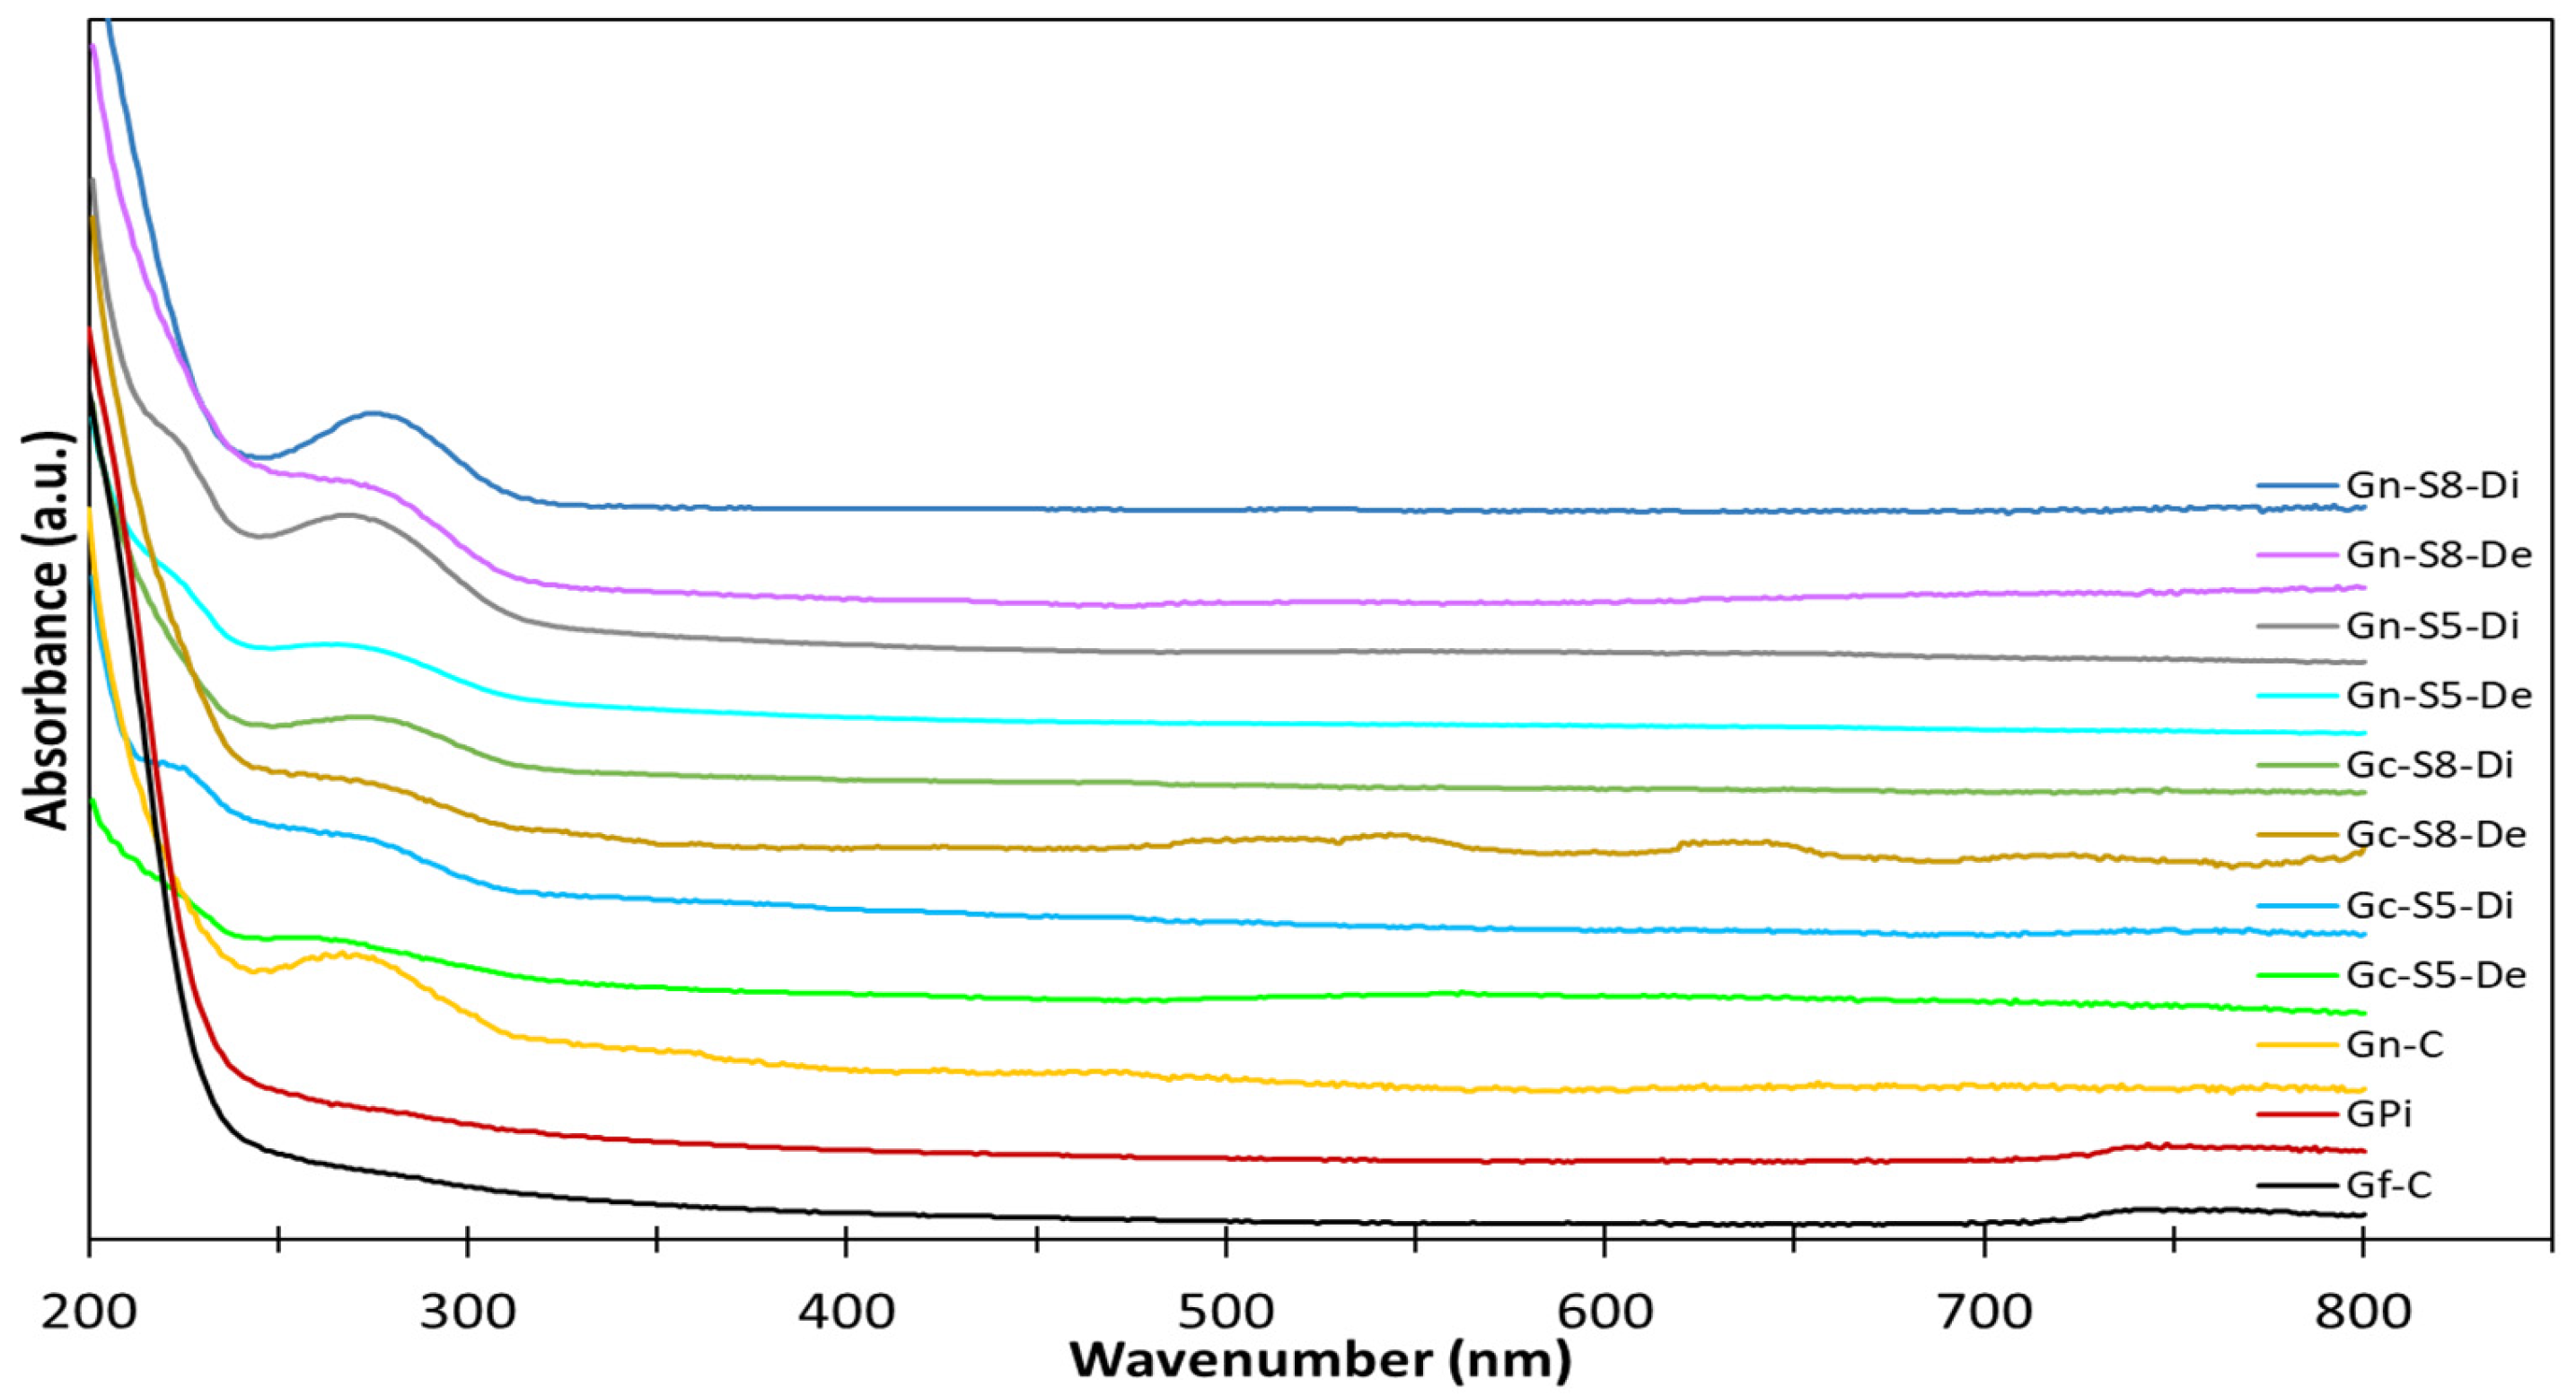
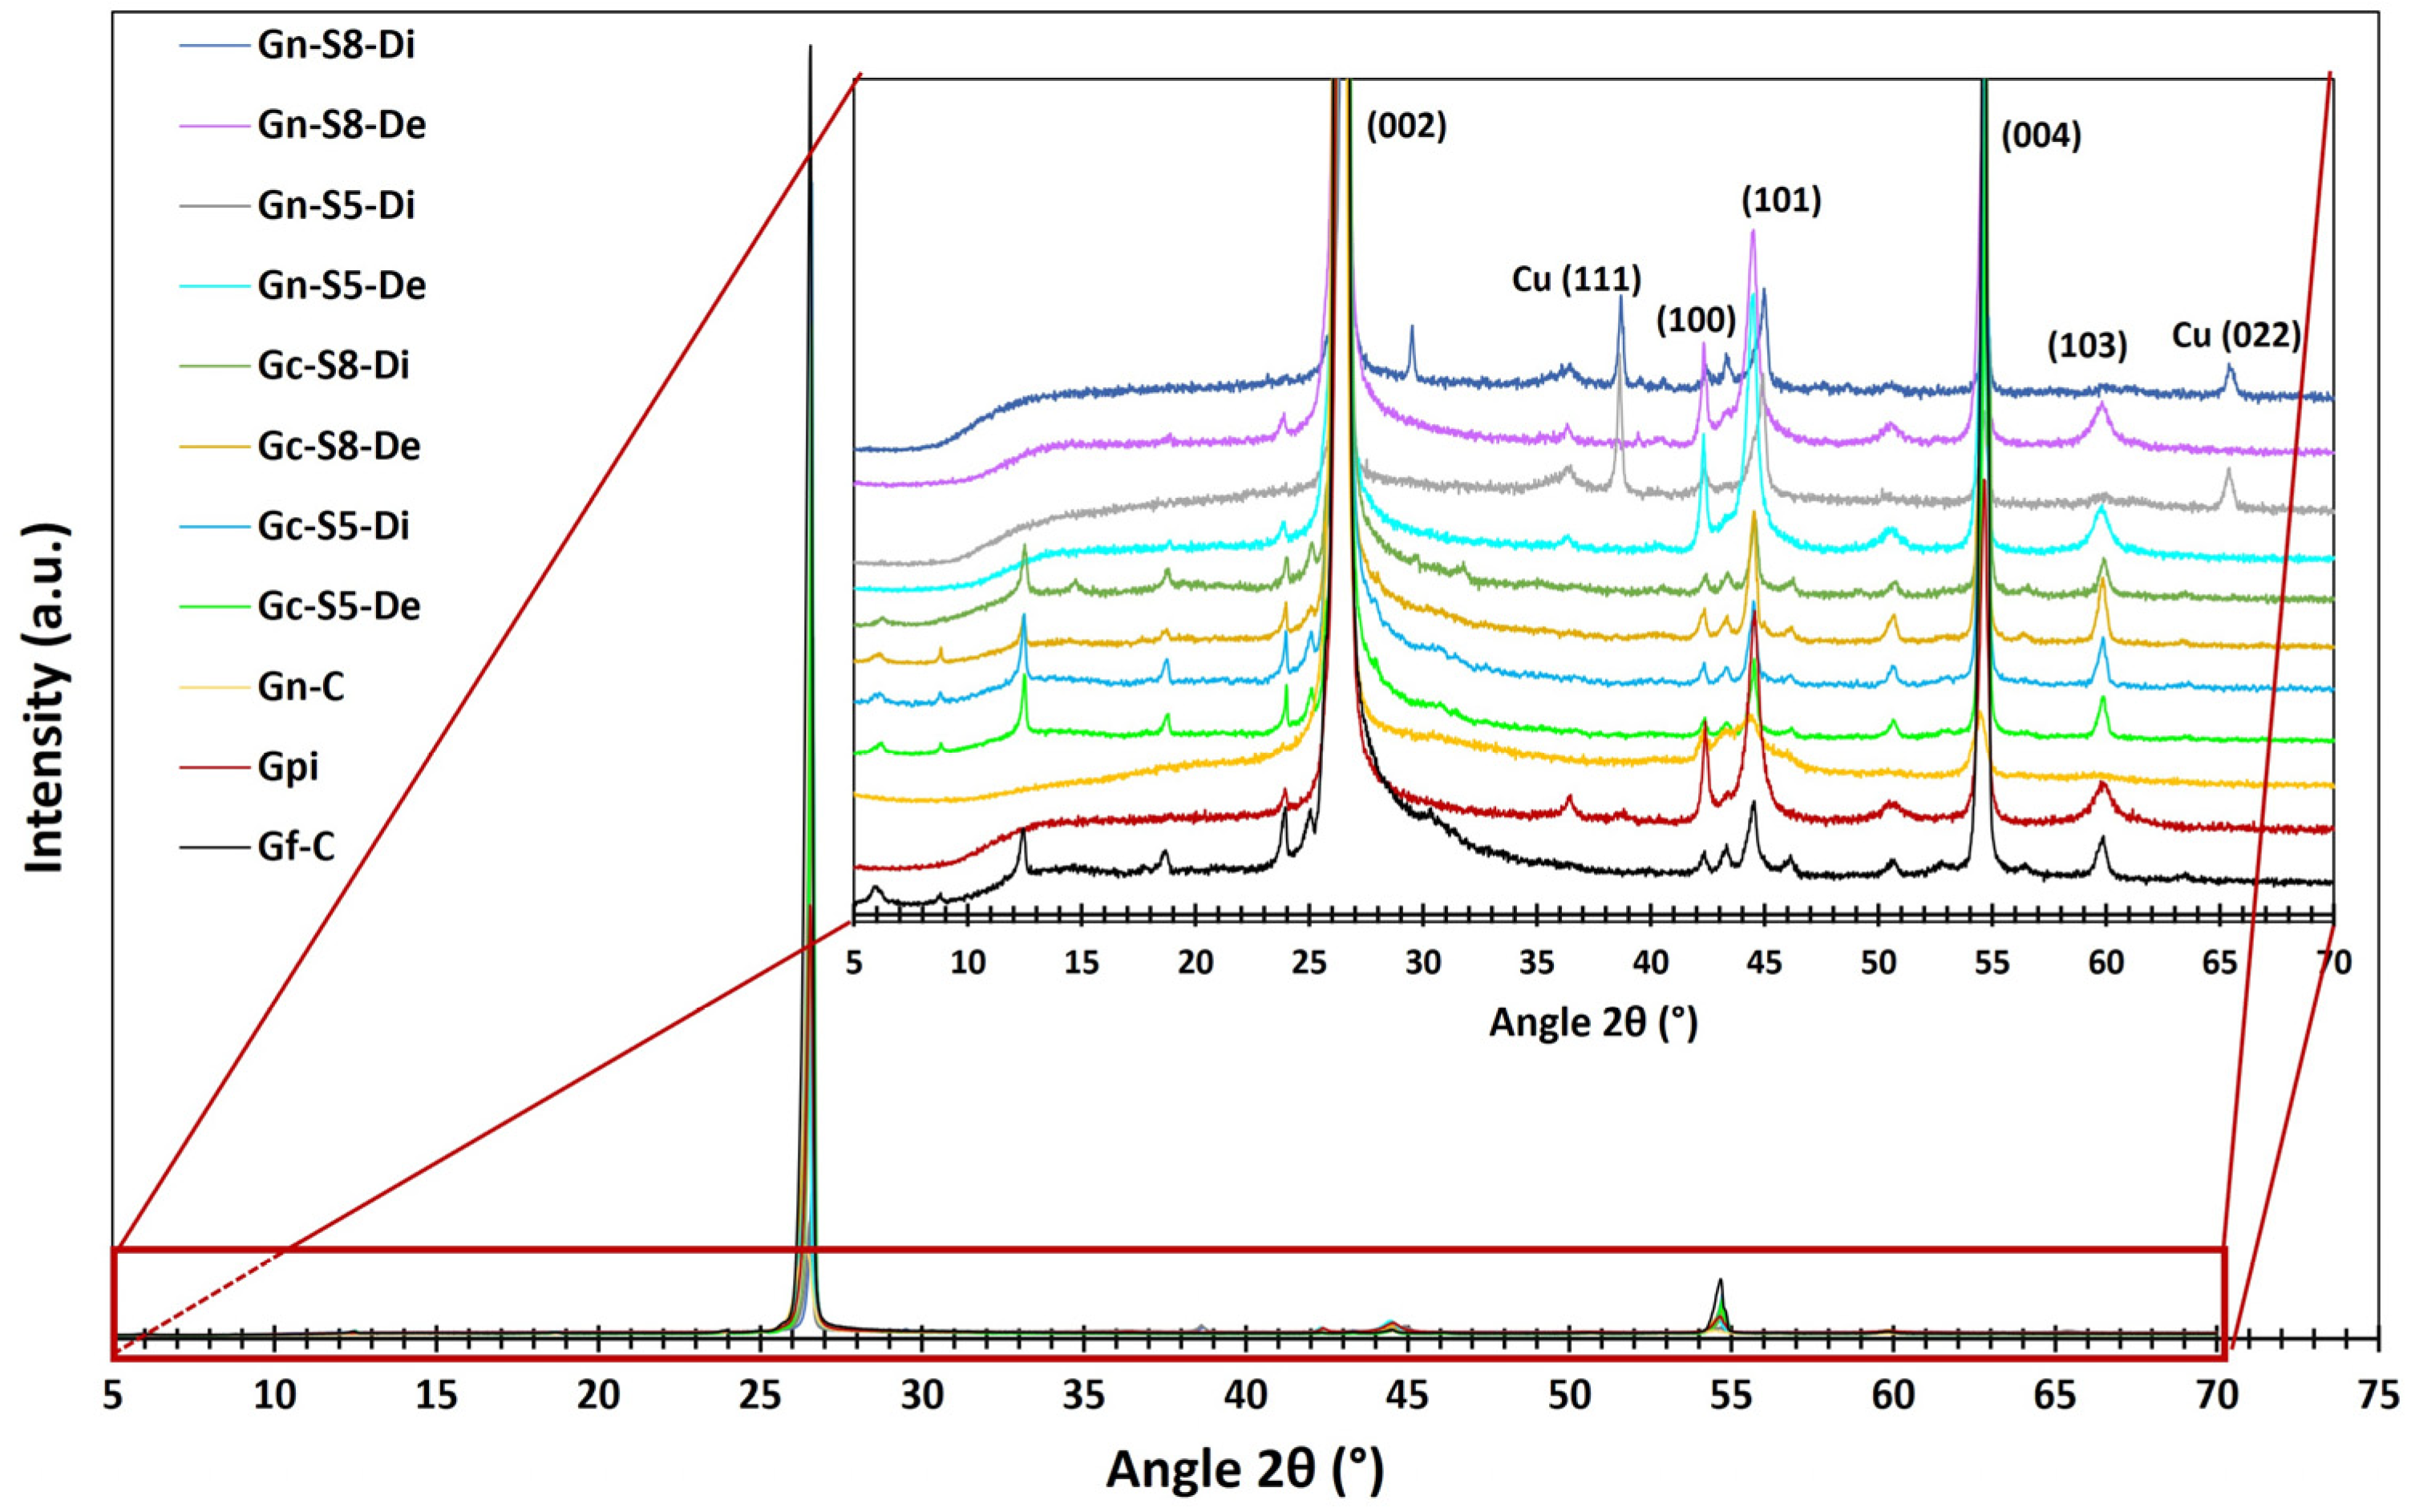

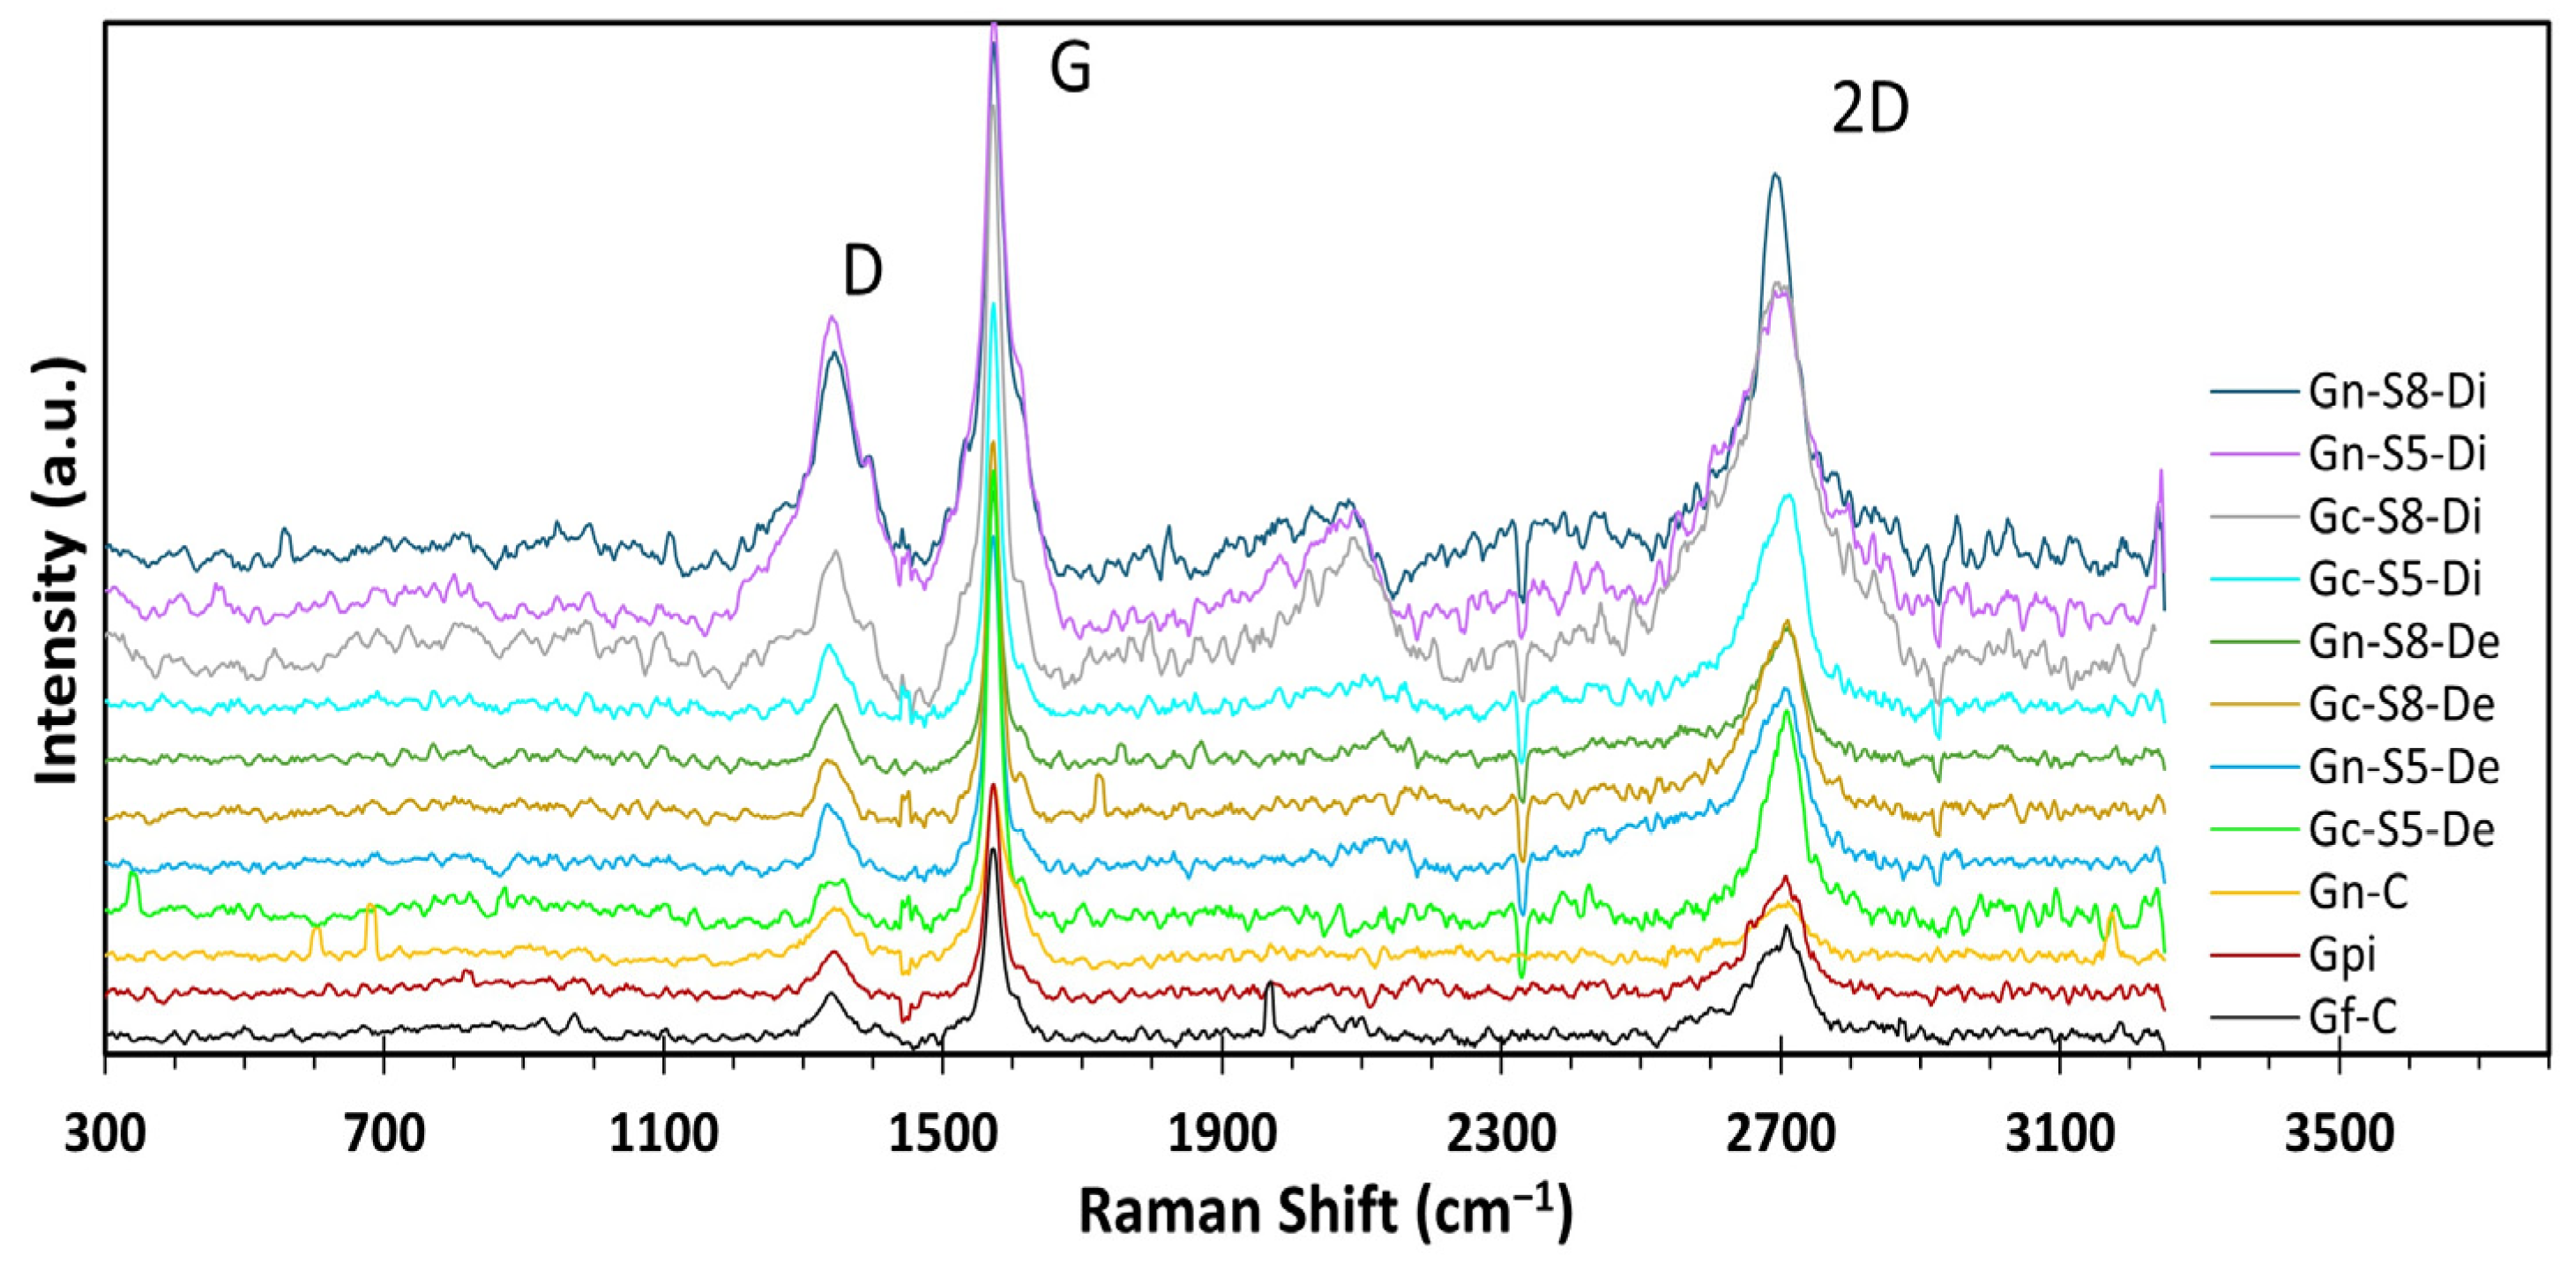
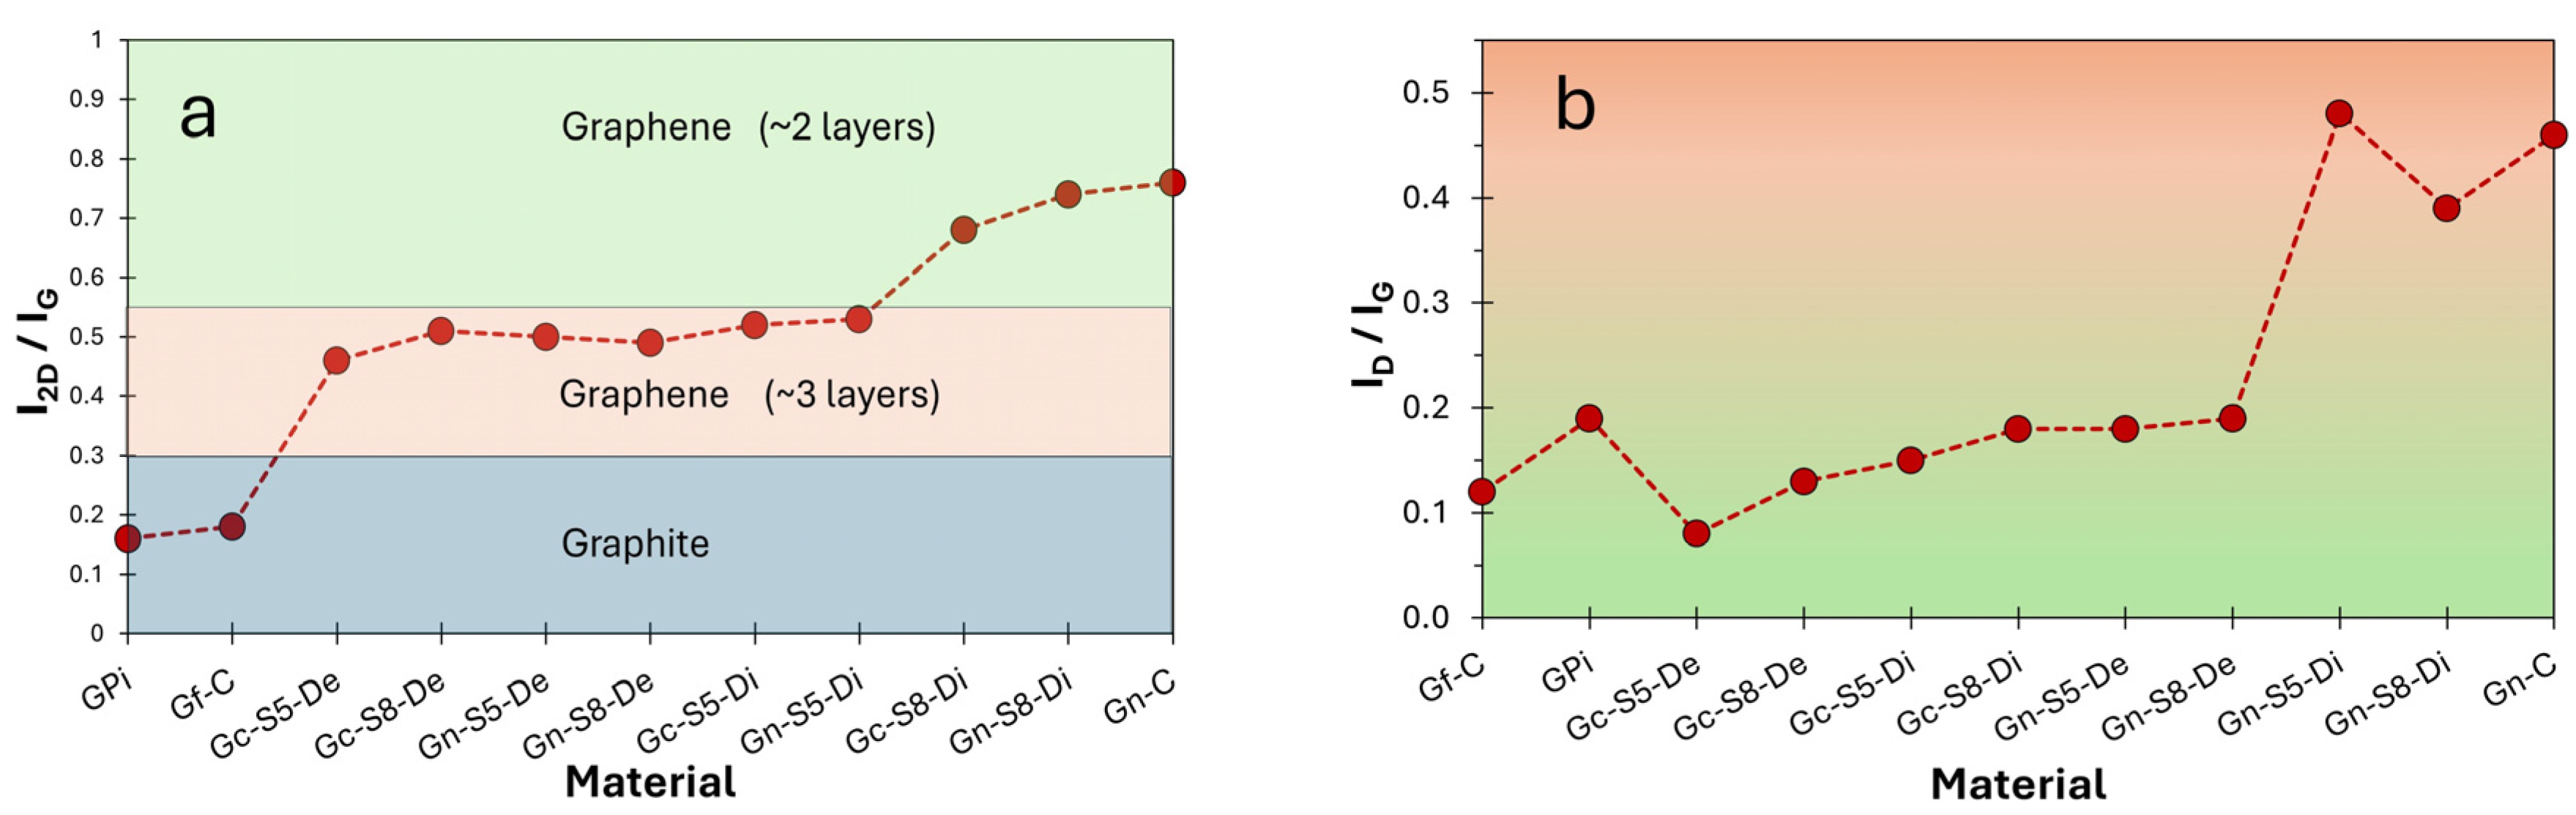
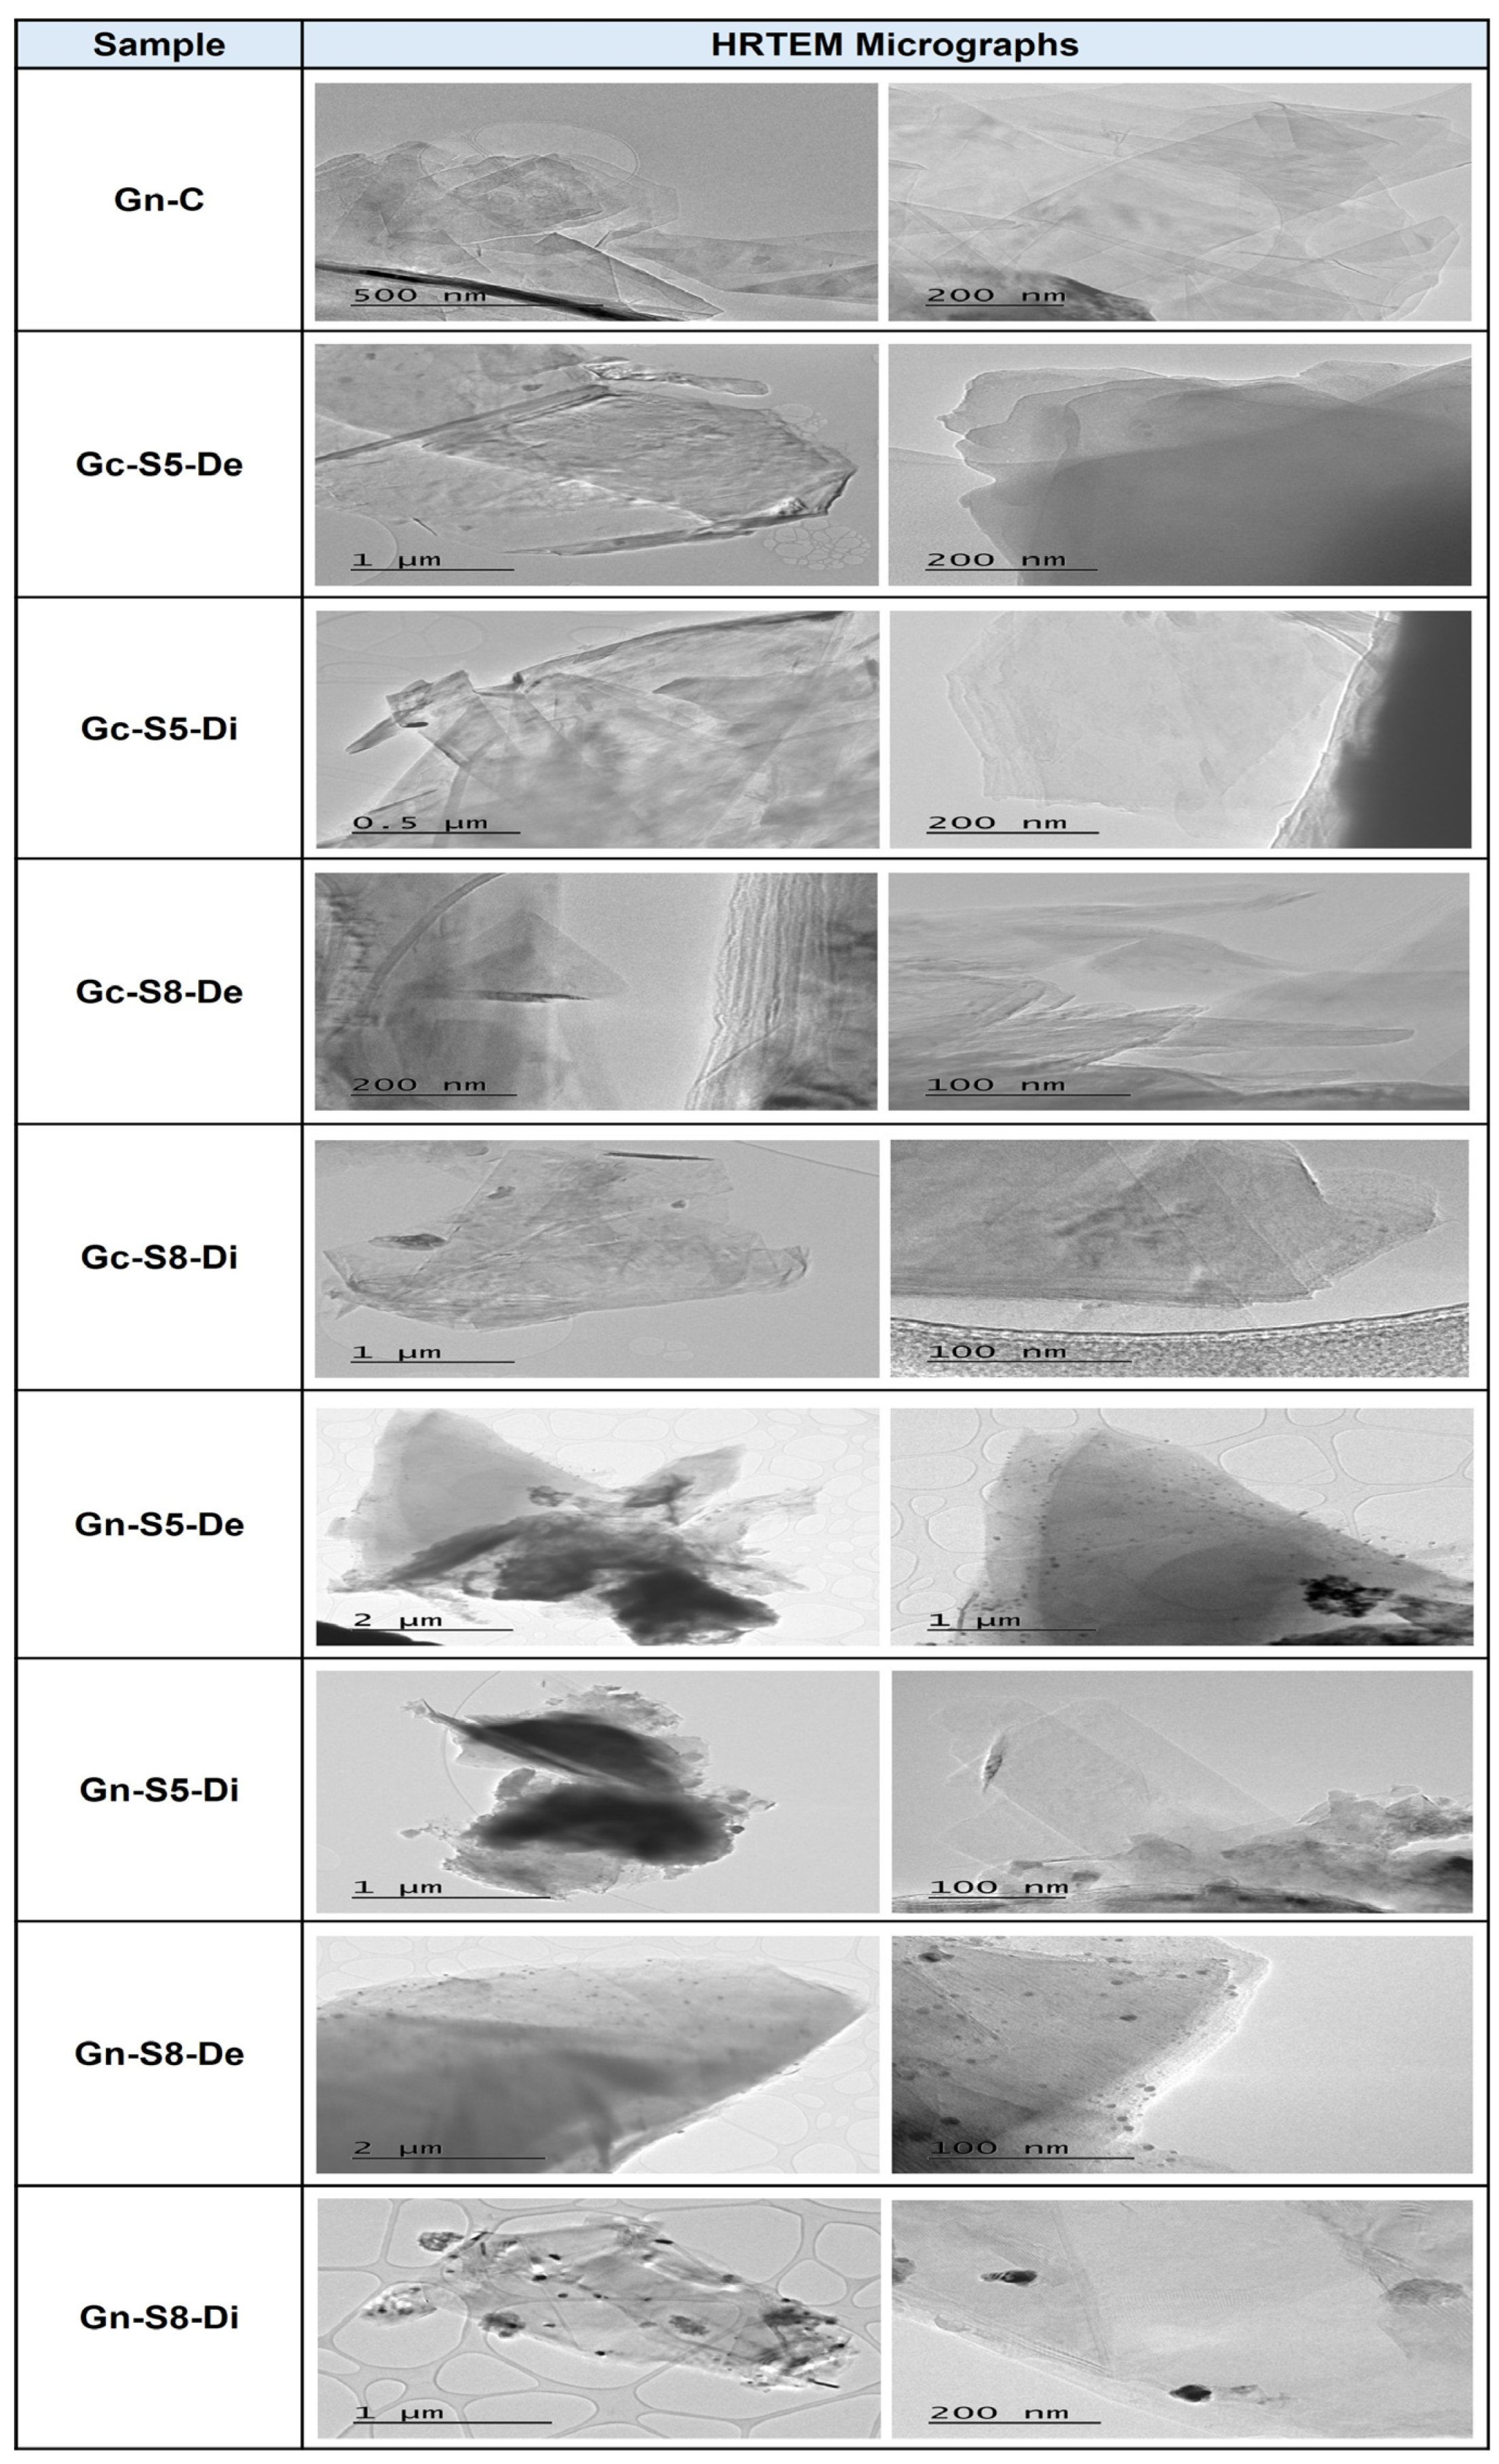


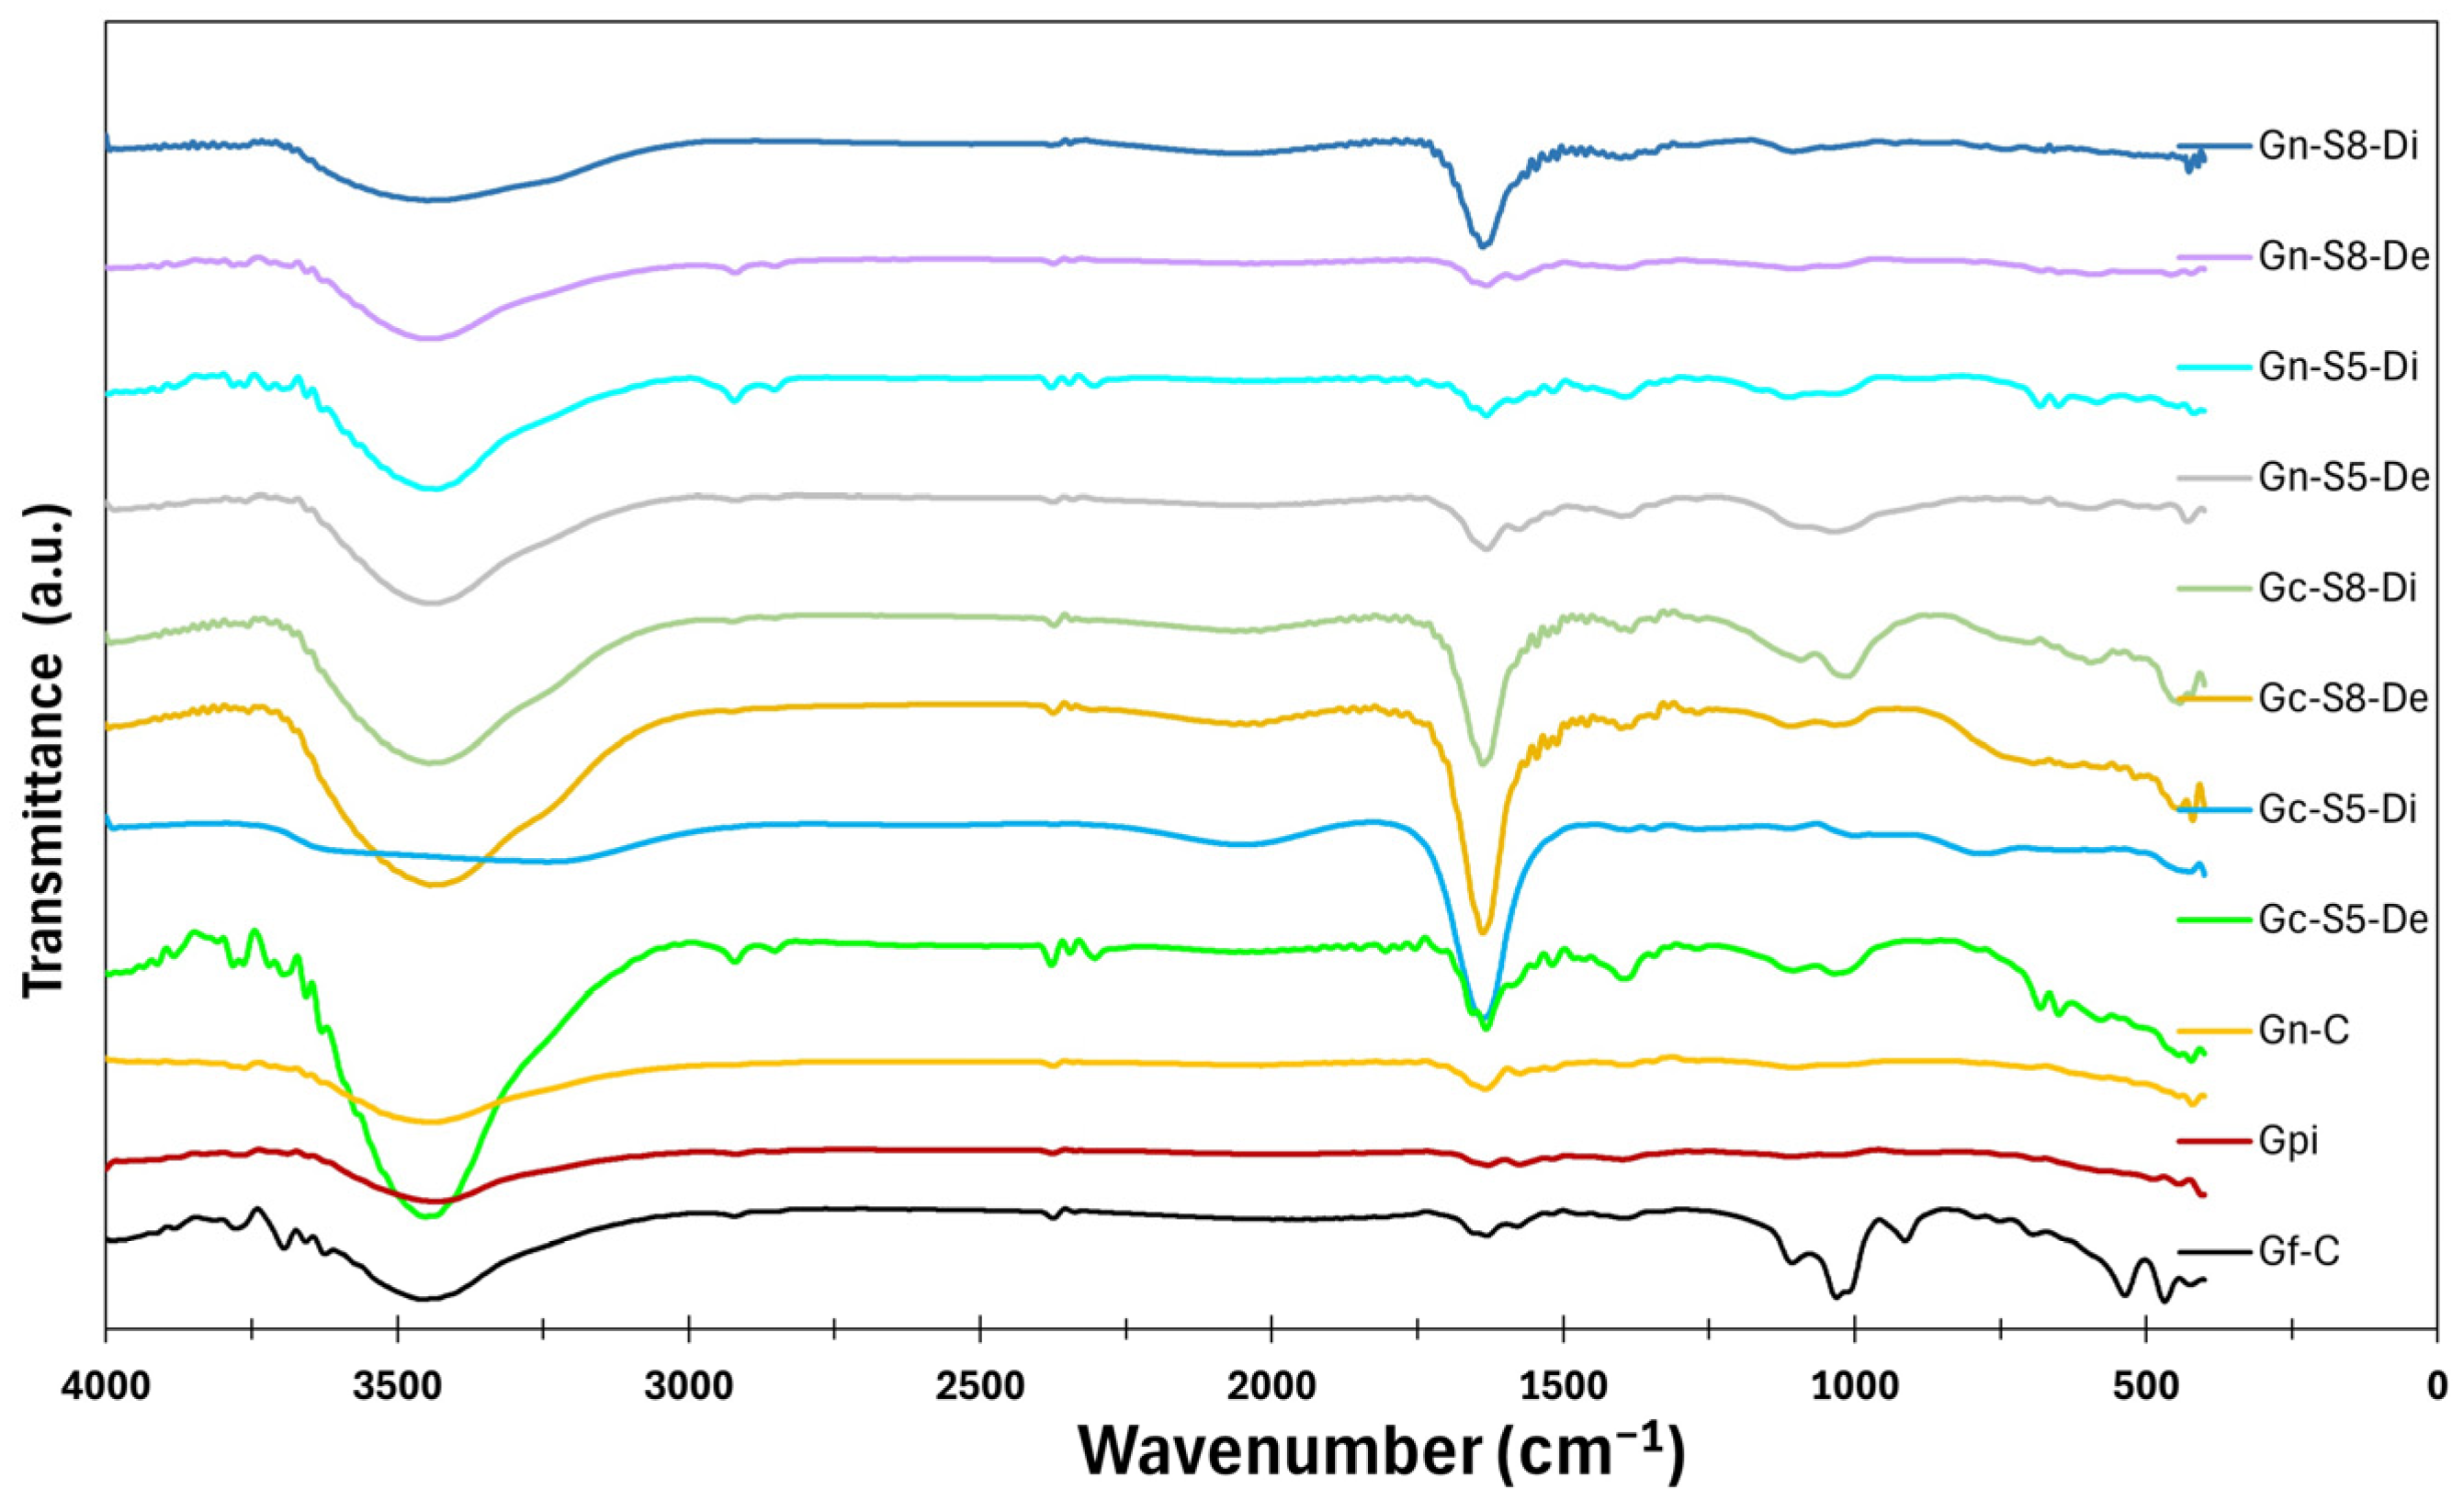
