Article

Sustainability and Innovation: Incorporating Waste from Ophthalmic Lenses into Natural Rubber Composites

by
José Afonso Rocha
1,2,
Carlos Toshiyuki Hiranobe
1,
Dener da Silva Souza
1,
Samara da Silva Araújo
1,
Márcia Ferreira Hiranobe
3,
Guilherme Henrique Barros de Souza
4,
Elmer Mateus Gennaro
5,
Flávio Camargo Cabrera
1,
Guilherme Pina Cardim
1,
Michael Jones da Silva
1,2,
Erivaldo Antônio da Silva
4,
José Francisco Resende da Silva
1,2 and
Renivaldo José dos Santos
1,*
1
Department of Engineering, School of Engineering and Sciences, São Paulo State University (UNESP), Rosana Campus, Avenida dos Barrageiros, Rosana 19274-000, SP, Brazil
2
Department of Engineering, School of Engineering of Ilha Solteira, São Paulo State University (UNESP), Ilha Solteira Campus, Avenida Brasil, Ilha Solteira 15385-007, SP, Brazil
3
Department of Tourism and Territory Development, School of Engineering and Sciences, São Paulo State University (UNESP), Rosana Campus, Avenida dos Barrageiros, Rosana 19274-000, SP, Brazil
4
Department of Cartographic and Surveying Engineering, School of Science and Technology, São Paulo State University (UNESP), Presidente Prudente Campus, Rua Roberto Simonsen, Presidente Prudente 19060-900, SP, Brazil
5
Department of Aeronautical Engineering, Engineering School, São Paulo State University (UNESP), Avenida Profª Isette Corrêa Fontão, São João da Boa Vista 13876-750, SP, Brazil
*
Author to whom correspondence should be addressed.
Recycling 2025, 10(3), 90; https://doi.org/10.3390/recycling10030090
Submission received: 25 March 2025 / Revised: 28 April 2025 / Accepted: 1 May 2025 / Published: 4 May 2025
(This article belongs to the Special Issue Challenges and Opportunities in Plastic Waste Management)

Abstract

:
This study investigates the recycling of ophthalmic lens waste (OLW) in the production of vulcanized natural rubber (NR) composites, aiming to promote sustainability and reduce costs. To this end, Vietnamese natural rubber and ophthalmic lens waste were used, varying the filler content from 0 to 50 phr. Rheological tests demonstrated that the addition of OLW decreases the cure time. The crosslink density, assessed through the Flory–Rehner and Mooney–Rivlin methods, exhibited an increase with the incorporation of a reinforcement. Thermal and spectroscopic analyses demonstrated the thermal stability of the composites and the absence of chemical interactions between the polymer matrix and the OLW. Mechanical tests showed that the composites exhibit satisfactory tensile and tear resistance, although the filler primarily acts as a filler rather than a structural reinforcement. Thus, the incorporation of OLW in NR composites emerges as a viable alternative for the reuse of industrial waste, fostering more sustainable and efficient practices in the polymer industry.

Graphical Abstract

1. Introduction

Vulcanized natural rubber (NR) compounds have gained prominence in the industrial sector due to their superior mechanical properties and versatile applications. Simultaneously, there is a growing research trend in composite materials focusing on the incorporation of waste as reinforcing fillers, aligning with the principles of sustainability and cost reduction. The generation of industrial waste is a significant environmental concern, and repurposing these materials as fillers in rubber compounds not only mitigates improper disposal but also promotes the circular economy. Recent studies have highlighted the potential of various waste materials, such as agricultural residues, peanut shells, and sugarcane bagasse ash, as reinforcements in natural rubber composites [1,2,3]. However, the application of OLW remains largely unexplored, representing a fertile field for scientific research.
The incorporation of waste as a reinforcing agent can notably impact the strength and durability of composites. Specifically, the incorporation of sugarcane bagasse ash into NR composites has demonstrated improvements in the mechanical properties of the vulcanized material [2]. Similarly, peanutshell and eggshell residues have been studied as potential reinforcements, exhibiting improvements in tensile strength and elastic modulus [4,5]. In a study conducted by Batista et al. [6], polyester resin composites were produced using bamboo petiole powder and OLW as filler materials, both of which are often discarded in landfills. The results indicated that, although these composites exhibited lower mechanical strength, they demonstrated a significant increase in impact resistance. The most viable composite, containing 40% OLW, was utilized in the manufacturing of table tops and benches.
NR composites filled with waste materials offer several advantages, including reduced production costs, decreased reliance on traditional fillers (e.g., carbon black), and a lower environmental impact. However, the compatibility between the rubber matrix and the waste used as a reinforcing filler is a critical factor in ensuring the uniformity and quality of the final composite’s properties. Challenges such as the homogeneous dispersion of the waste within the polymer matrix and the preservation of mechanical properties require careful attention.
In light of these challenges, this study aims to analyze the impact of OLW incorporation on structural, mechanical, and thermal properties in NR composites. This methodology includes the preparation of composites with varying OLW proportions, followed by tensile strength tests, elastic modulus evaluation, hardness measurements, and thermal analyses. Additionally, interfacial interactions regarding the reinforcement and polymer matrix will be assessed in order to understand the reinforcement mechanisms and optimize the performance of the developed materials.

2. Results and Discussion

2.1. Evaluation of Rheometric Properties

Table 1 displays the data related to the rheometric parameter results. The introduction of fillers into the compounds causes a modification in the minimum torque, which is related to viscosity. Throughout the process and as heat is supplied, crosslinking occurs, contributing to an increase in maximum torque. The variation in torque is inherently linked to crosslink formation and the presence of fillers. Considering the margins of statistical error, it is evident that the torque variation remains practically stable up to the 30 phr proportion compared to the reference composite (free of filler), while from 40 phr onwards, there is an increase in maximum torque with the incorporation of fillers. The scorch time (ts1), corresponding to the moment when the composite acquires sufficient heat to initiate the crosslinking process, decreases significantly with the addition of fillers compared to the reference composite. Conversely, the optimal curing time (t90), which corresponds to the duration required to achieve 90% of the maximum torque, shows a decrease compared to the reference composite. However, it remains consistent when accounting for the range of statistical errors. This suggests that the addition of fillers leads to a decrease in thermal energy consumption.

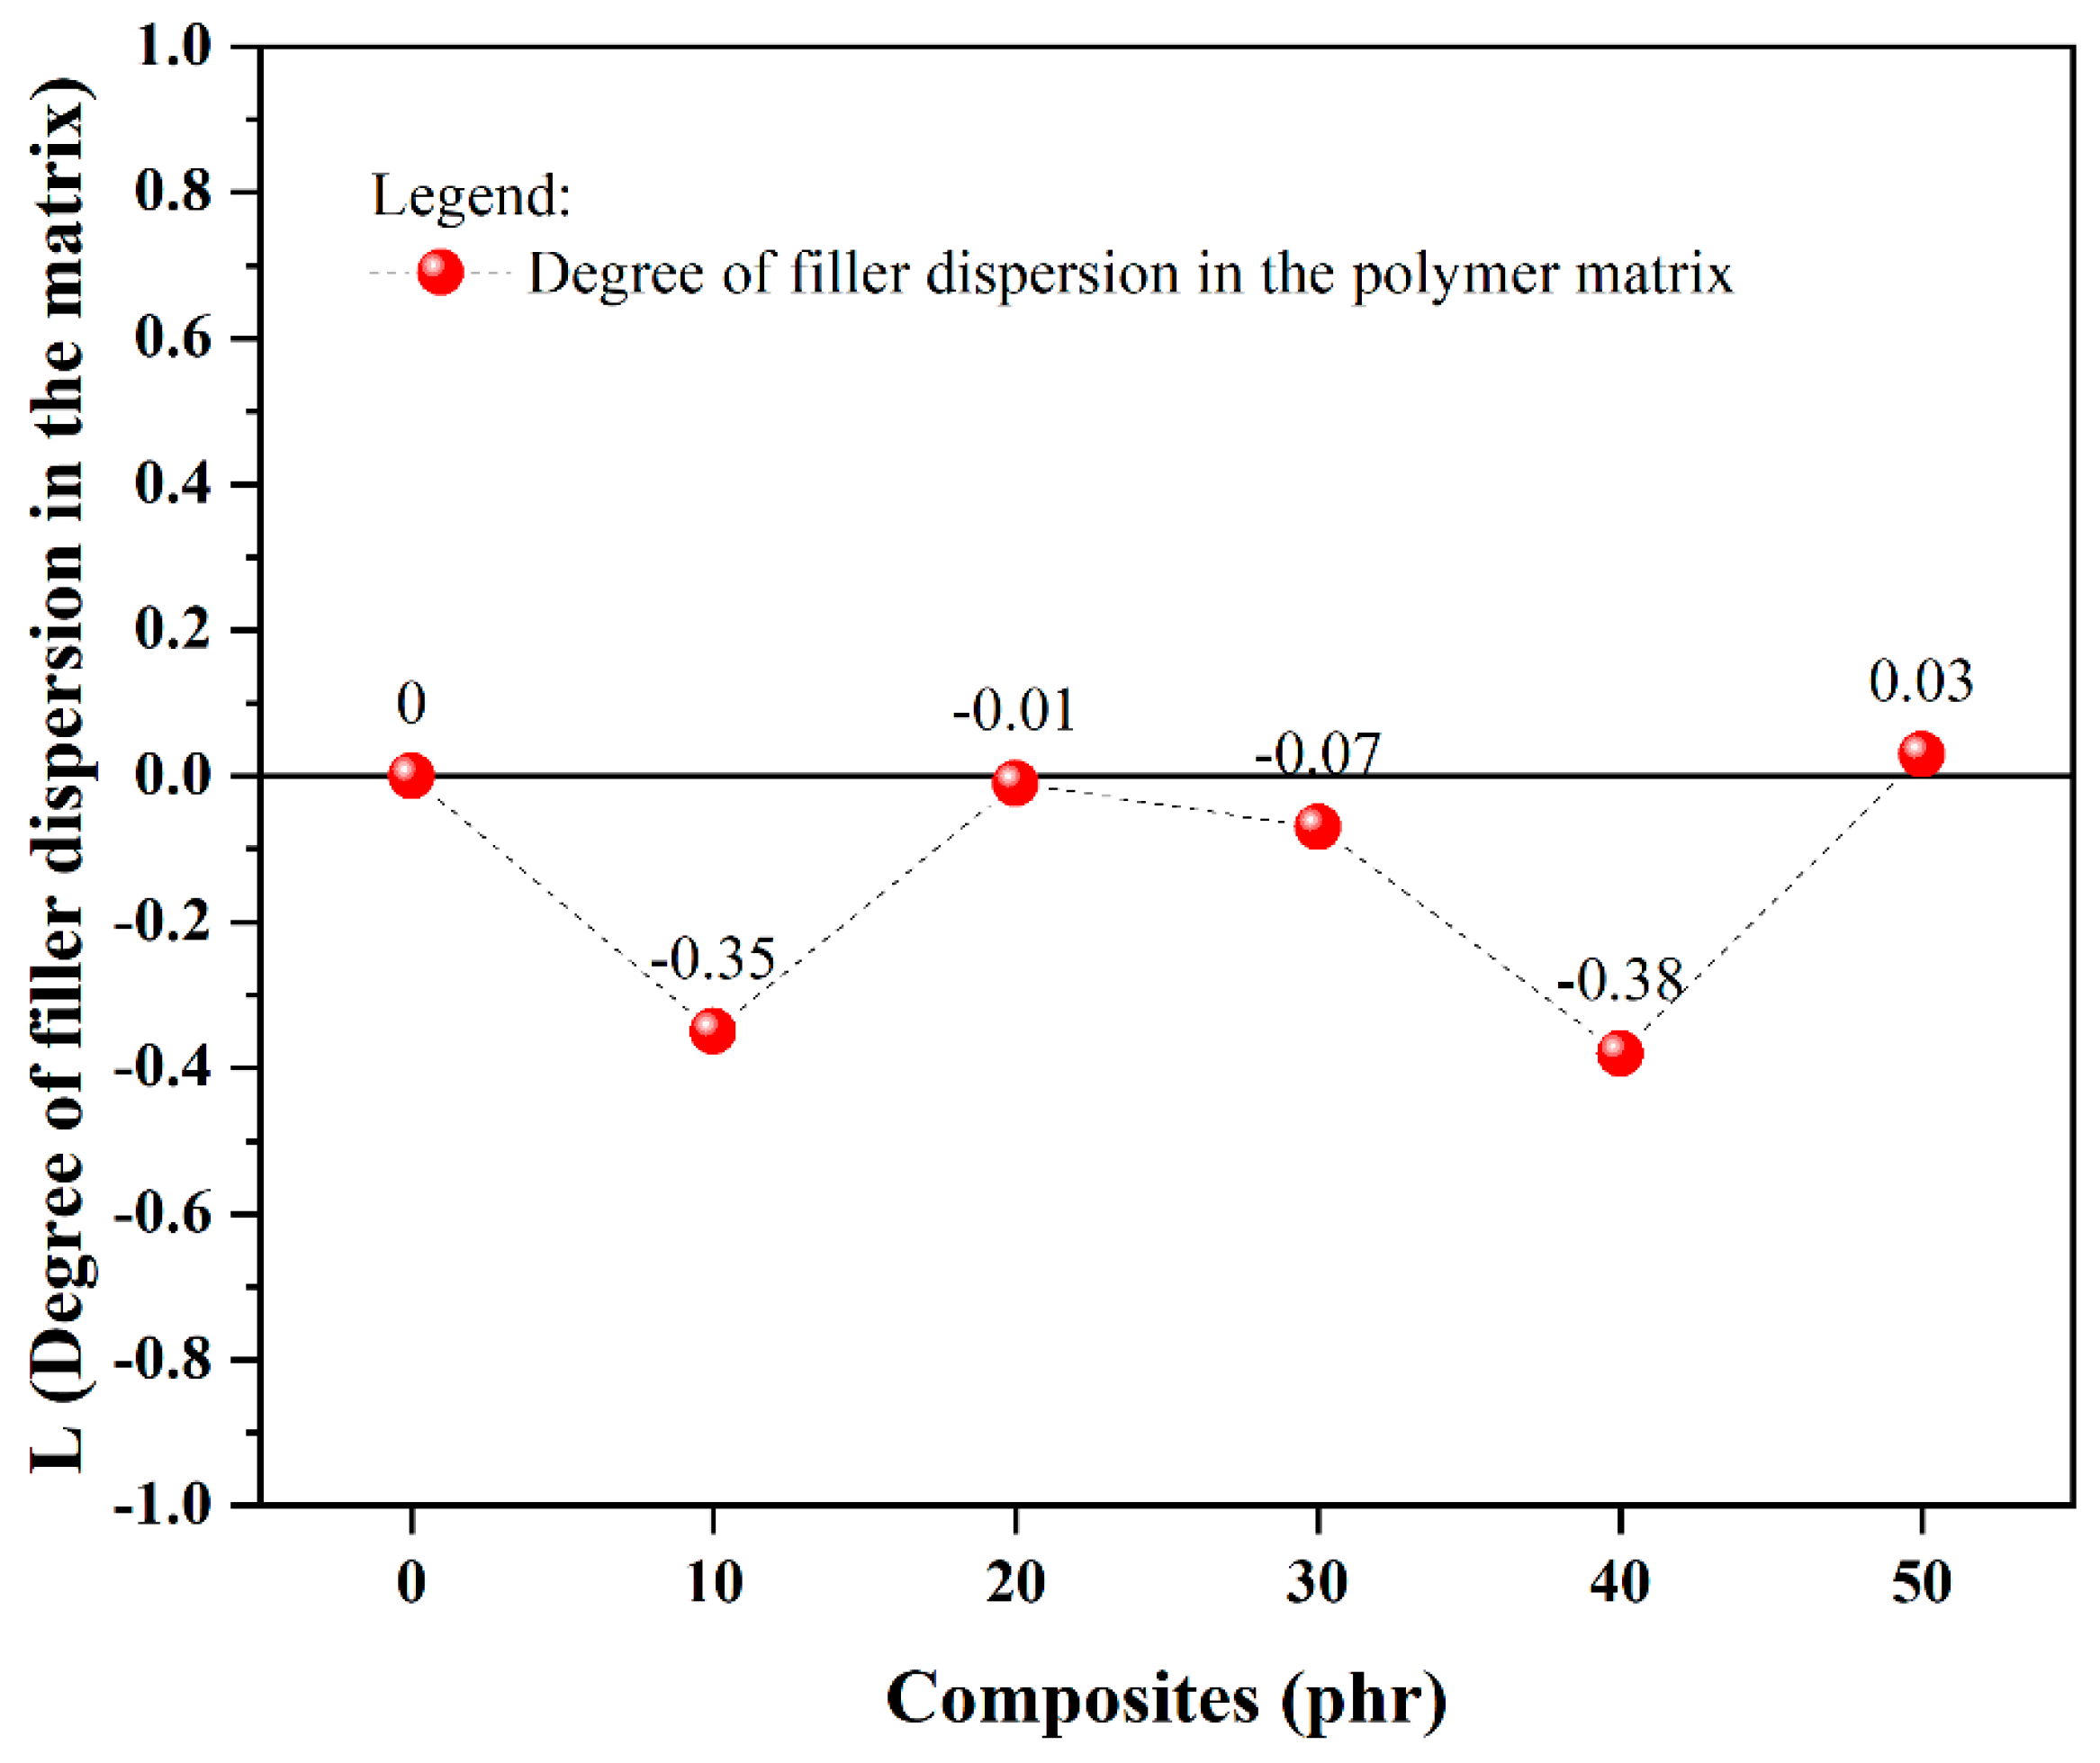
2.2. Analysis of the Dispersion Degree of OLW Fillers in the NR Matrix

Figure 1 illustrates the profile and data regarding the dispersion degree of the OLW filler in the NR matrix, using the 0 phr composite as a reference point. The closer this value is to the reference, the better the filler dispersion. It was observed that the filler dispersion degree remained close to the reference baseline, with some values being negative. This indicates that the fillers likely lower the viscosity of the composites, promoting better uniformity in the distribution of the filler within the matrix.

2.3. Analysis of Scanning Electron Microscopy (SEM)

Figure 2 displays a photograph of the OLW material alongside scanning electron microscopy (SEM) images of both the residues and the resulting composites captured from the fracture surfaces of the specimens subjected to tensile testing. In Figure 2a, a photo of the ophthalmic lens residues is shown, obtained through grinding and polishing processes, followed by drying in an oven at 100 °C and subsequent sieving with a 120-mesh screen. Figure 2b–h present SEM micrographs taken at a scale of 10 µm and a magnification of 1.0 K×. Figure 2b depicts the morphology of the lens residue particles, revealing various shapes and sizes, many of which resemble snowflake-like structures. Figure 2c shows the fractured surface of the unfilled composite, characterized by visible cracking and the presence of small, dispersed white circles within the natural rubber matrix. These features are likely attributed to polyethylene glycol 4000, a plasticizer known for enhancing flexibility and elasticity. In Figure 2d, the SEM micrograph of the composite incorporating 10 phr of OLW reveals a relatively uniform surface with alternating raised and recessed areas, as well as well-distributed filler particles within the elastomeric matrix. Figure 2e–h correspond to composites formulated with 20–50 phr of OLW, respectively. In these images, it is apparent that although the fillers are embedded in the matrix, they lack sufficient anchoring interactions, which can lead to their detachment under stress. Starting from the formulation with 30 phr of OLW (Figure 2f), it becomes evident that the high filler concentration promotes the formation of stress concentrators, which undermine the integrity of the polymer network, making it more prone to fracture.

2.4. Evaluation of XRF Data for the Ophthalmic Lens Residue

The elemental profile of the ophthalmic lens waste (OLW), derived from an identical production batch provided by the same optical lens manufacturer, was established via X-ray fluorescence spectrometry (XRF) [7]. The analysis revealed that the sample is predominantly composed of carbon (98.128%), followed by sulfur (0.776%), silica (0.551%)—likely originating from silicon carbide or silicon dioxide released during the sanding process—and other elements in trace amounts, such as bismuth, indium, tin, calcium, potassium, iron, copper, zinc, and lead. It is noteworthy that metal elements such as calcium (0.030%), potassium (0.013%), and zinc (0.003%) are present in very low concentrations. While zinc is traditionally used as an activator in the vulcanization process of rubbers, the levels detected in the OLW are merely indicative of its residual presence, which is insufficient to play a functional role in the compounds studied [8].

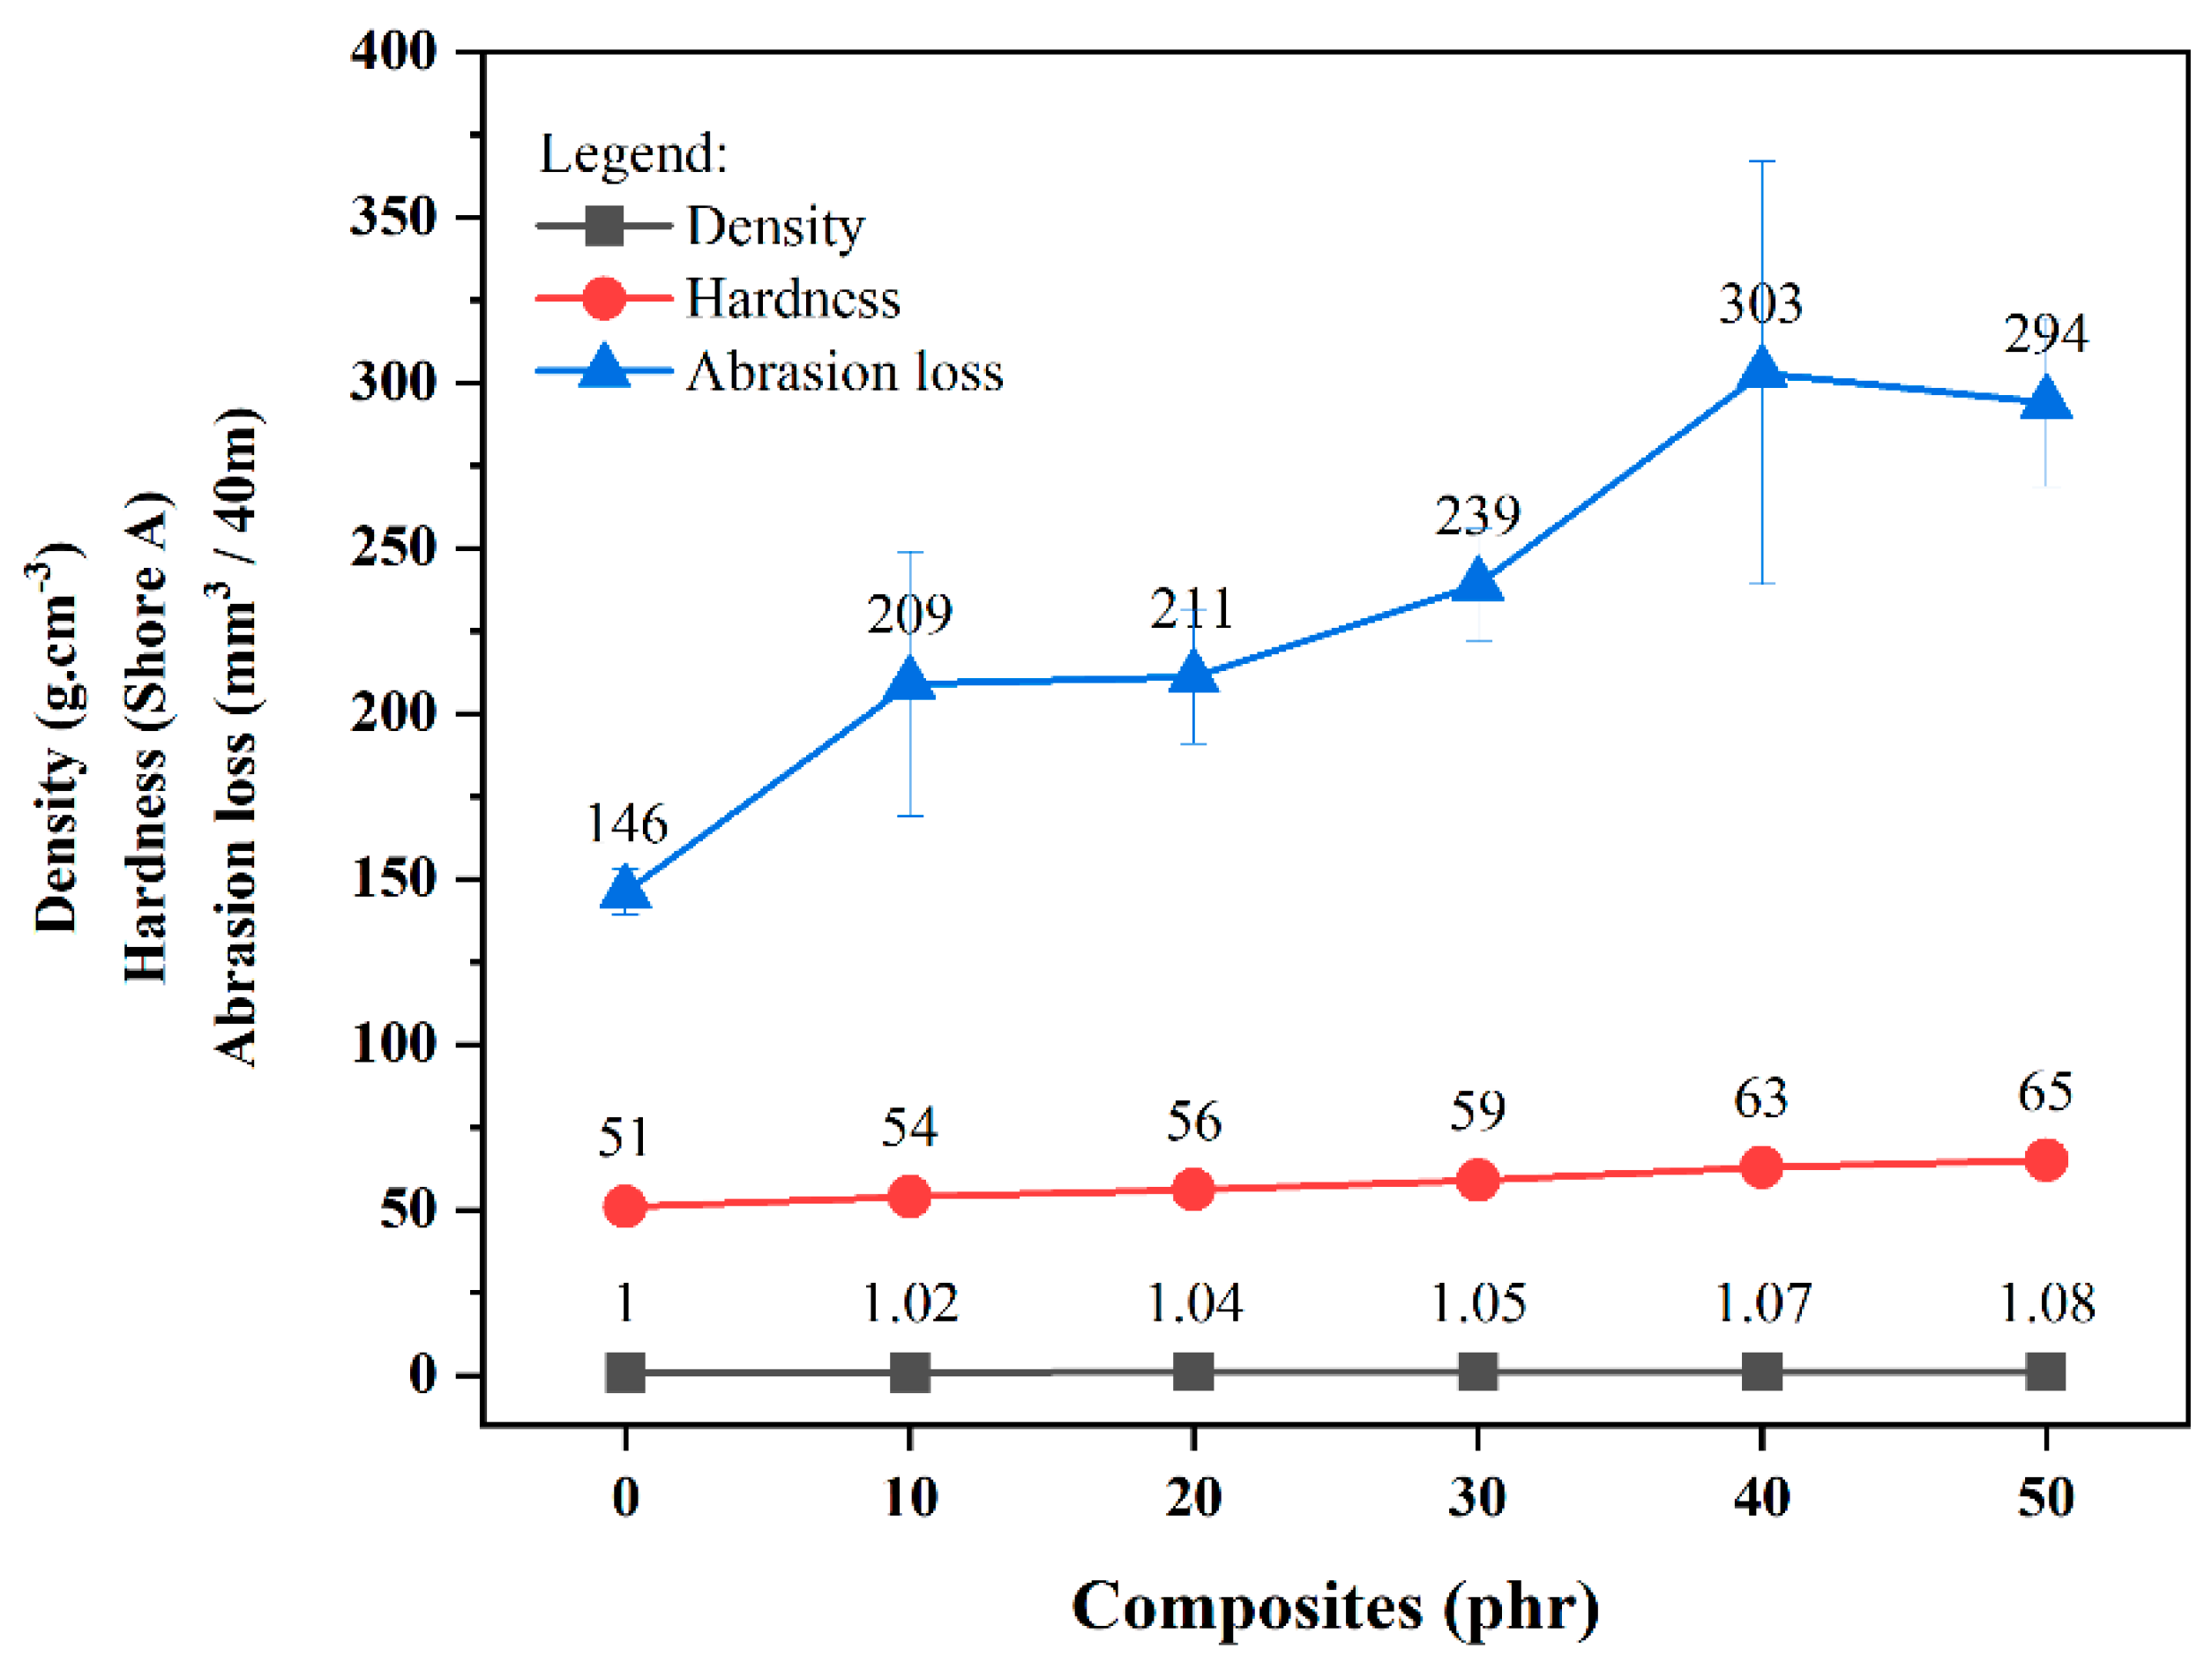
2.5. Analysis of the Density, Hardness, and Abrasion Loss of NR/OLW Composites

Figure 3 presents the profiles and results of the density, Shore A hardness, and abrasion resistance evaluations conducted on the composites. A progressive increase in the density of the composites is observed as the filler content rises, with values ranging between 1.0 and 1.08 g·cm−3. Similarly, the Shore A hardness exhibits a growing trend due to the restricted mobility of polymer chains caused by filler incorporation, resulting in a more rigid material. In contrast, abrasion resistance deteriorated markedly with higher filler loadings, as the presence of discontinuities in the matrix structure promotes material loss during wear by friction.

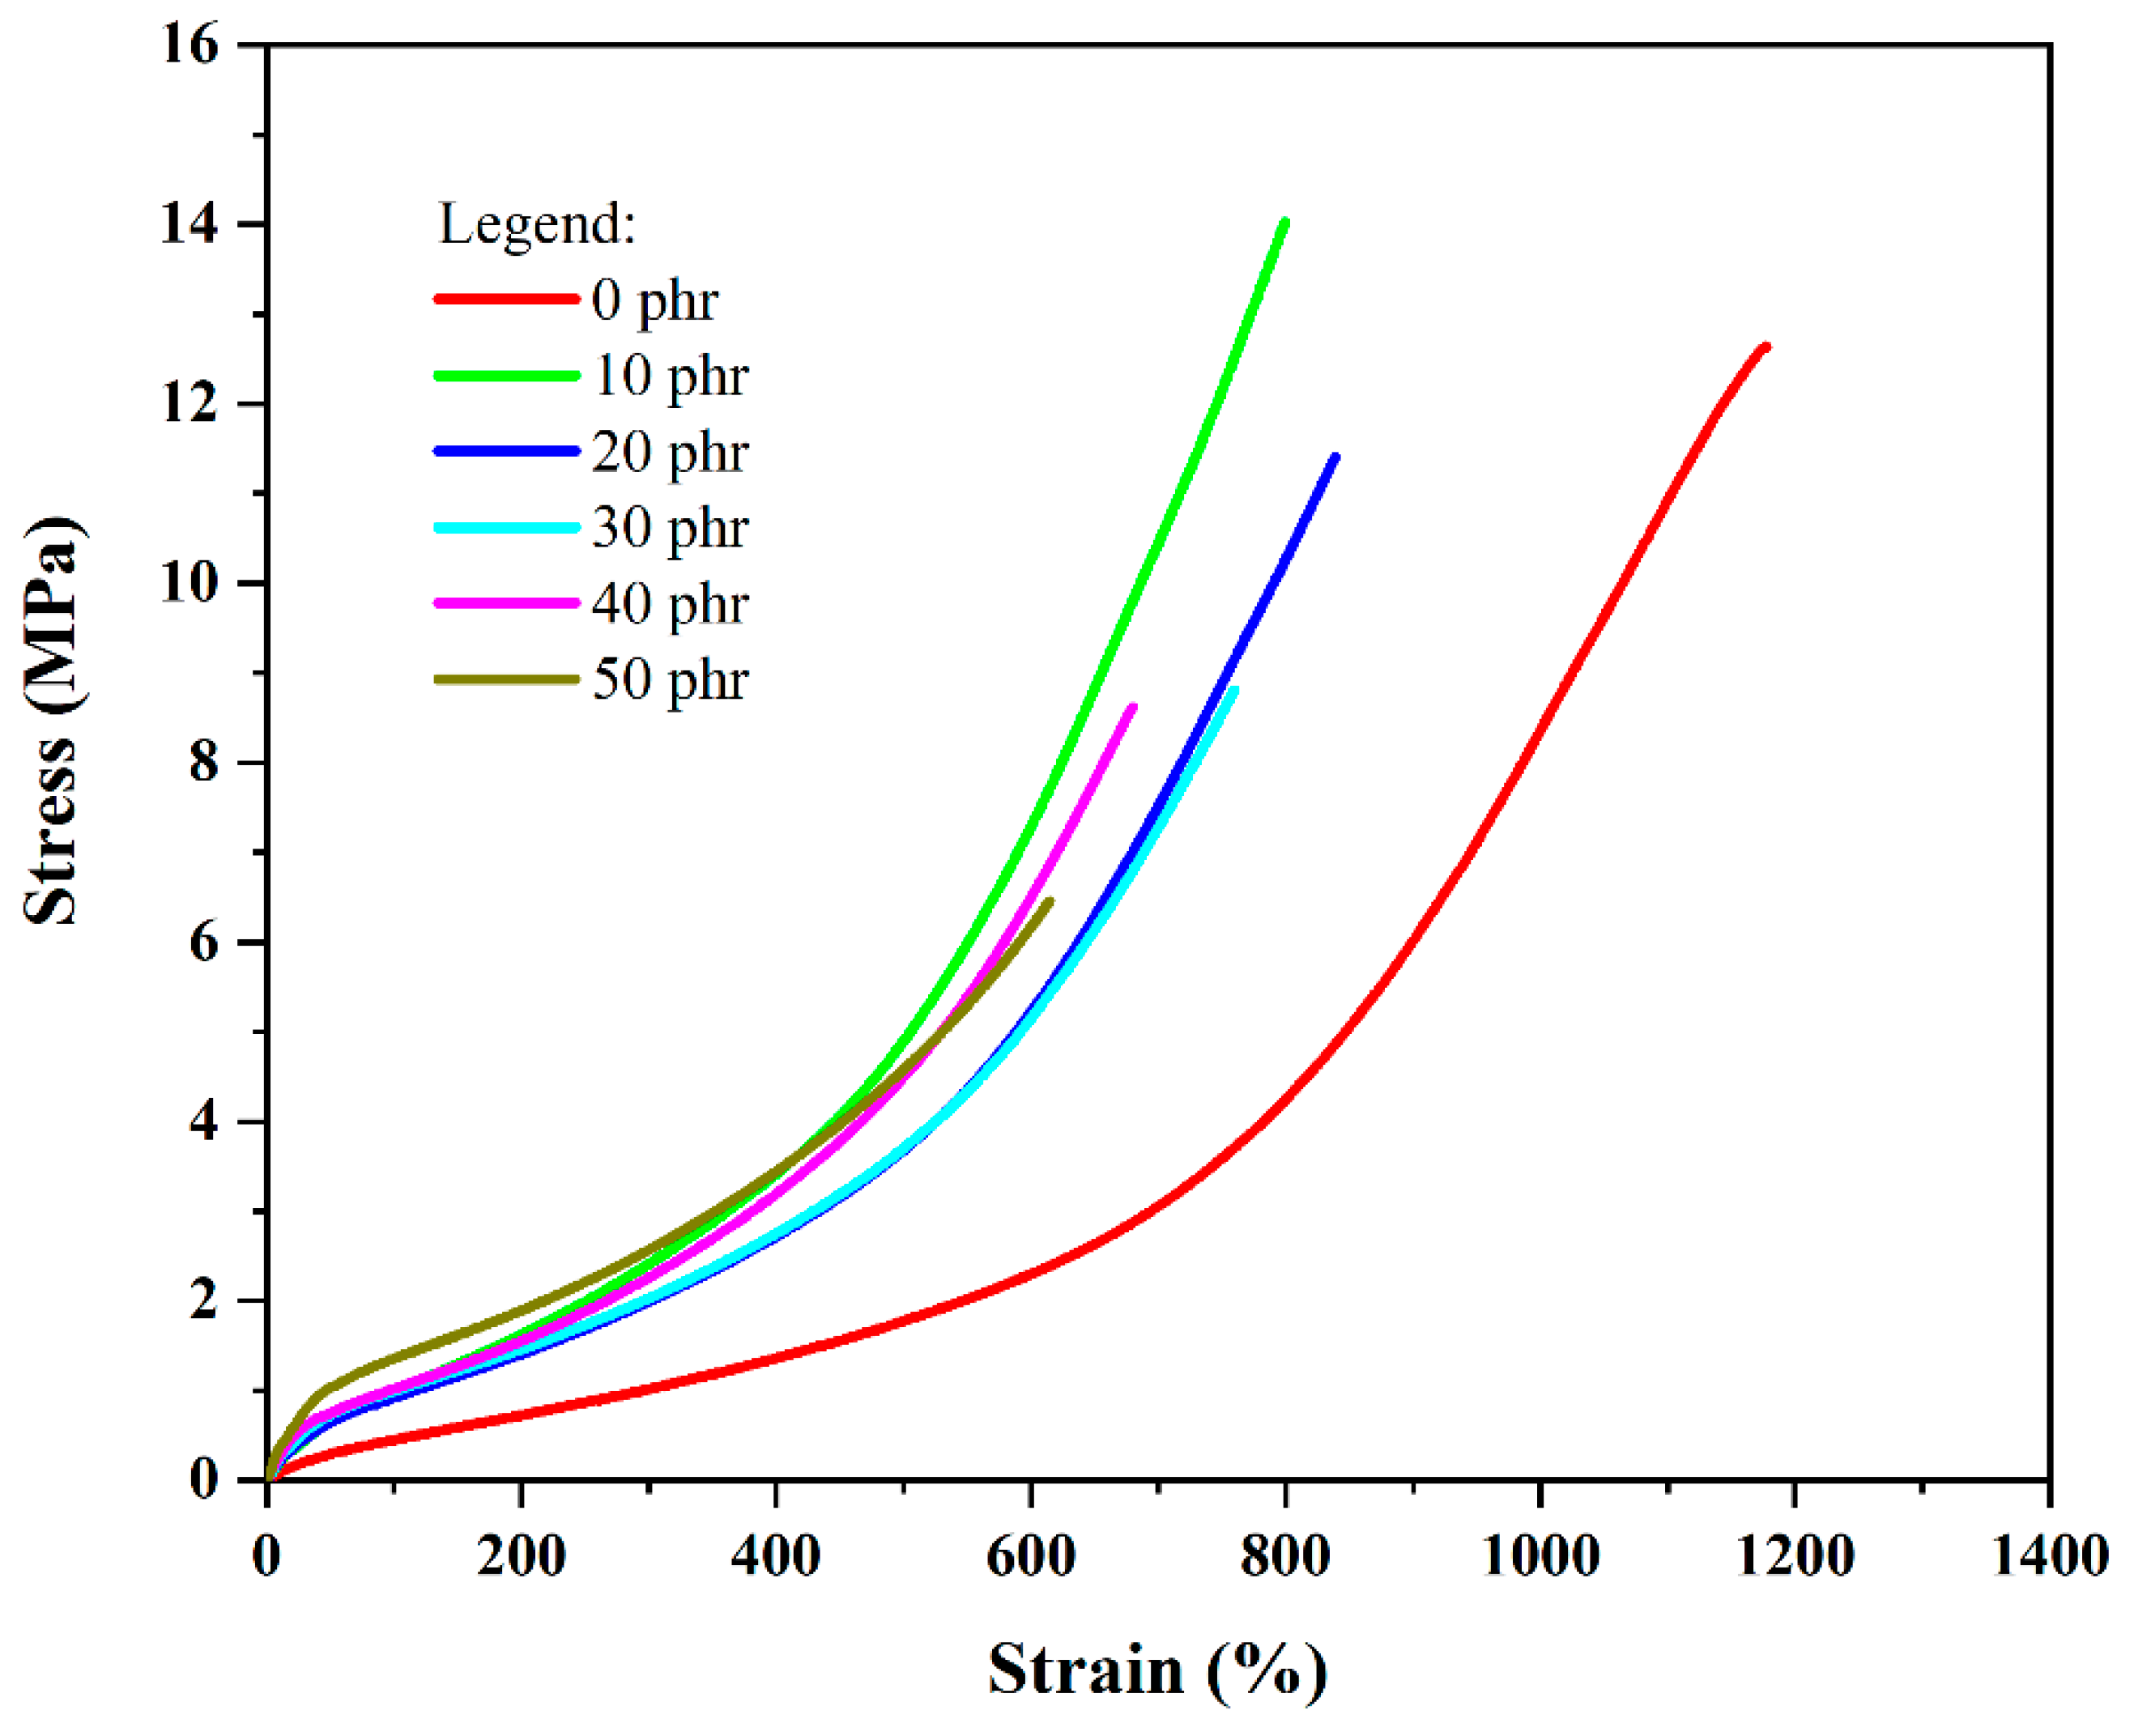
2.6. Assessment of the Mechanical Behavior Under Tension of NR/OLW Composites

Figure 4 shows the strain–stress response curves, while Table 2 provides the results obtained from the mechanical tensile tests performed on the NR/OLW composite materials.
It is noted that the elasticity moduli at 100% and 300% tend to increase with the incorporation of fillers, resulting in a stiffer composite, as indicated by the data provided in Table 2 and the curve profiles shown in Figure 4. With respect to the maximum stress and fracture strain values, a reduction can be noted as the filler content rises in comparison to the control sample, indicating that the added material acts more effectively as a bulk filler than as a reinforcement phase.

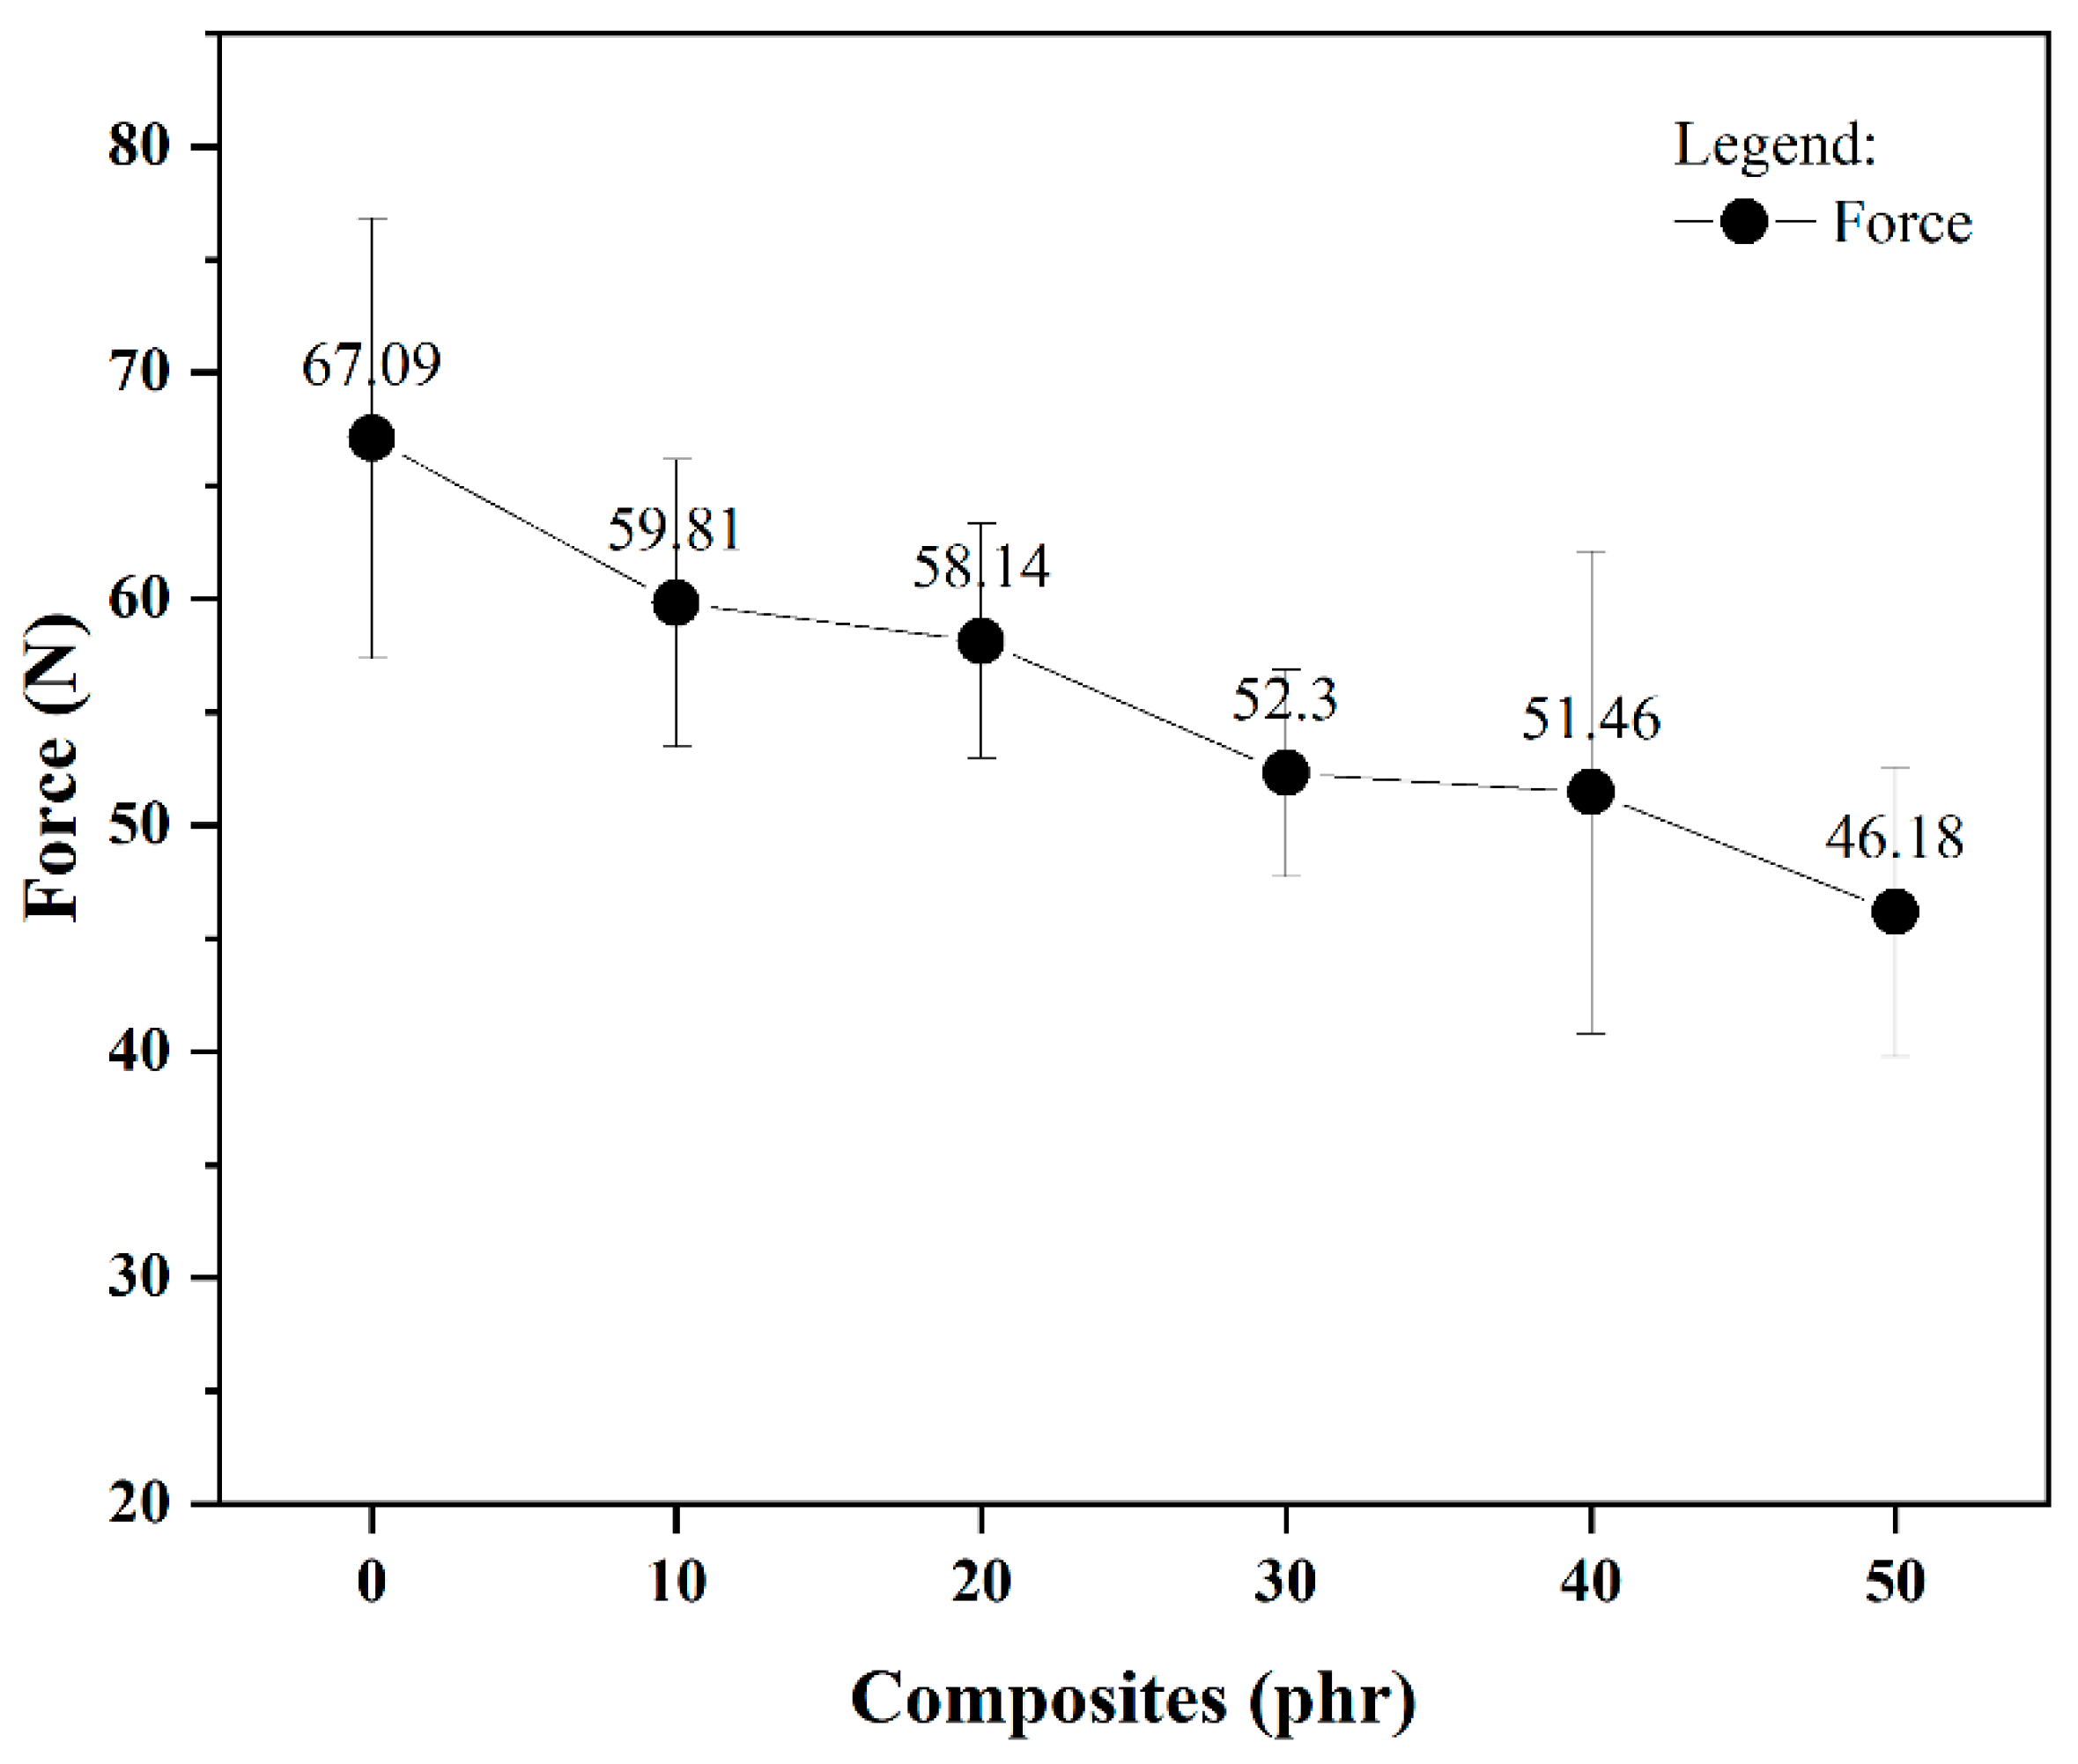
2.7. Assessment of the Tear Strength in NR/OLW Formulations

Figure 5 presents the findings from the tear strength evaluations. Similarly to what was observed in the tensile strength tests, increasing the filler content does not seem to enhance the material’s resistance to tearing when compared to the control composite. This outcome suggests that the incorporated fillers fail to serve as obstacles capable of hindering or minimizing the progression of tears.

2.8. Determination of Network Chain Density via Swelling in Organic Medium—Flory–Rehner Approach

The formation of crosslinks plays an essential role in the overall evaluation of rubber, and the analysis of crosslink densities provides significant insights that may be utilized to enhance the mechanical and thermal characteristics of composites [9]. Determining crosslink densities by saturating the material with an organic solvent and utilizing the Flory–Rehner equation provides accurate and dependable outcomes [10]. Table 3 lists the crosslink density values calculated using the Flory–Rehner method. A progressive increase in crosslink densities of the composites is observed with the addition of filler. This result confirms the effective interaction between the filler and the polymer matrix. However, this approach cannot distinguish a crosslink between two isoprene polymer chains from one involving a filler particle, as the filler acts as a barrier to solvent penetration into the polymer chain structure, resulting in an increase in the calculated value of crosslink densities. Thus, to confirm and compare the results of crosslink density, the determination of crosslinks was carried out using the Mooney–Rivlin method.

2.9. Determination of Crosslink Density Through Tensile Strength Tests—Mooney–Rivlin Approach

The crosslink density was assessed by applying the Mooney–Rivlin approach, using data obtained from tensile strength tests conducted on the vulcanized NR/OLW composites. Figure 6 displays a linear regression curve, which was employed to calculate the constant values C1 and C2 in the Mooney–Rivlin model.
The values presented in Table 4 indicate the crosslink densities, demonstrating a reduction in the C1 constant and an increase in the C2 constant as the filler content in the composites rises. According to the study by Rooj et al. [11], the constants C1 and C2 are related to the network architecture and the chain mobility, respectively. The rise in the slope of the Mooney–Rivlin curves is ascribed to a decrease in chain mobility, resulting from interactions between the polymer and the filler, as reported in previous studies [12,13]. The Mooney–Rivlin coefficients, obtained from the stress–strain profiles and detailed in Table 4, validate the interaction between the OLW and the elastomer matrix. This method aligns with the crosslink density results obtained via the Flory–Rehner approach.

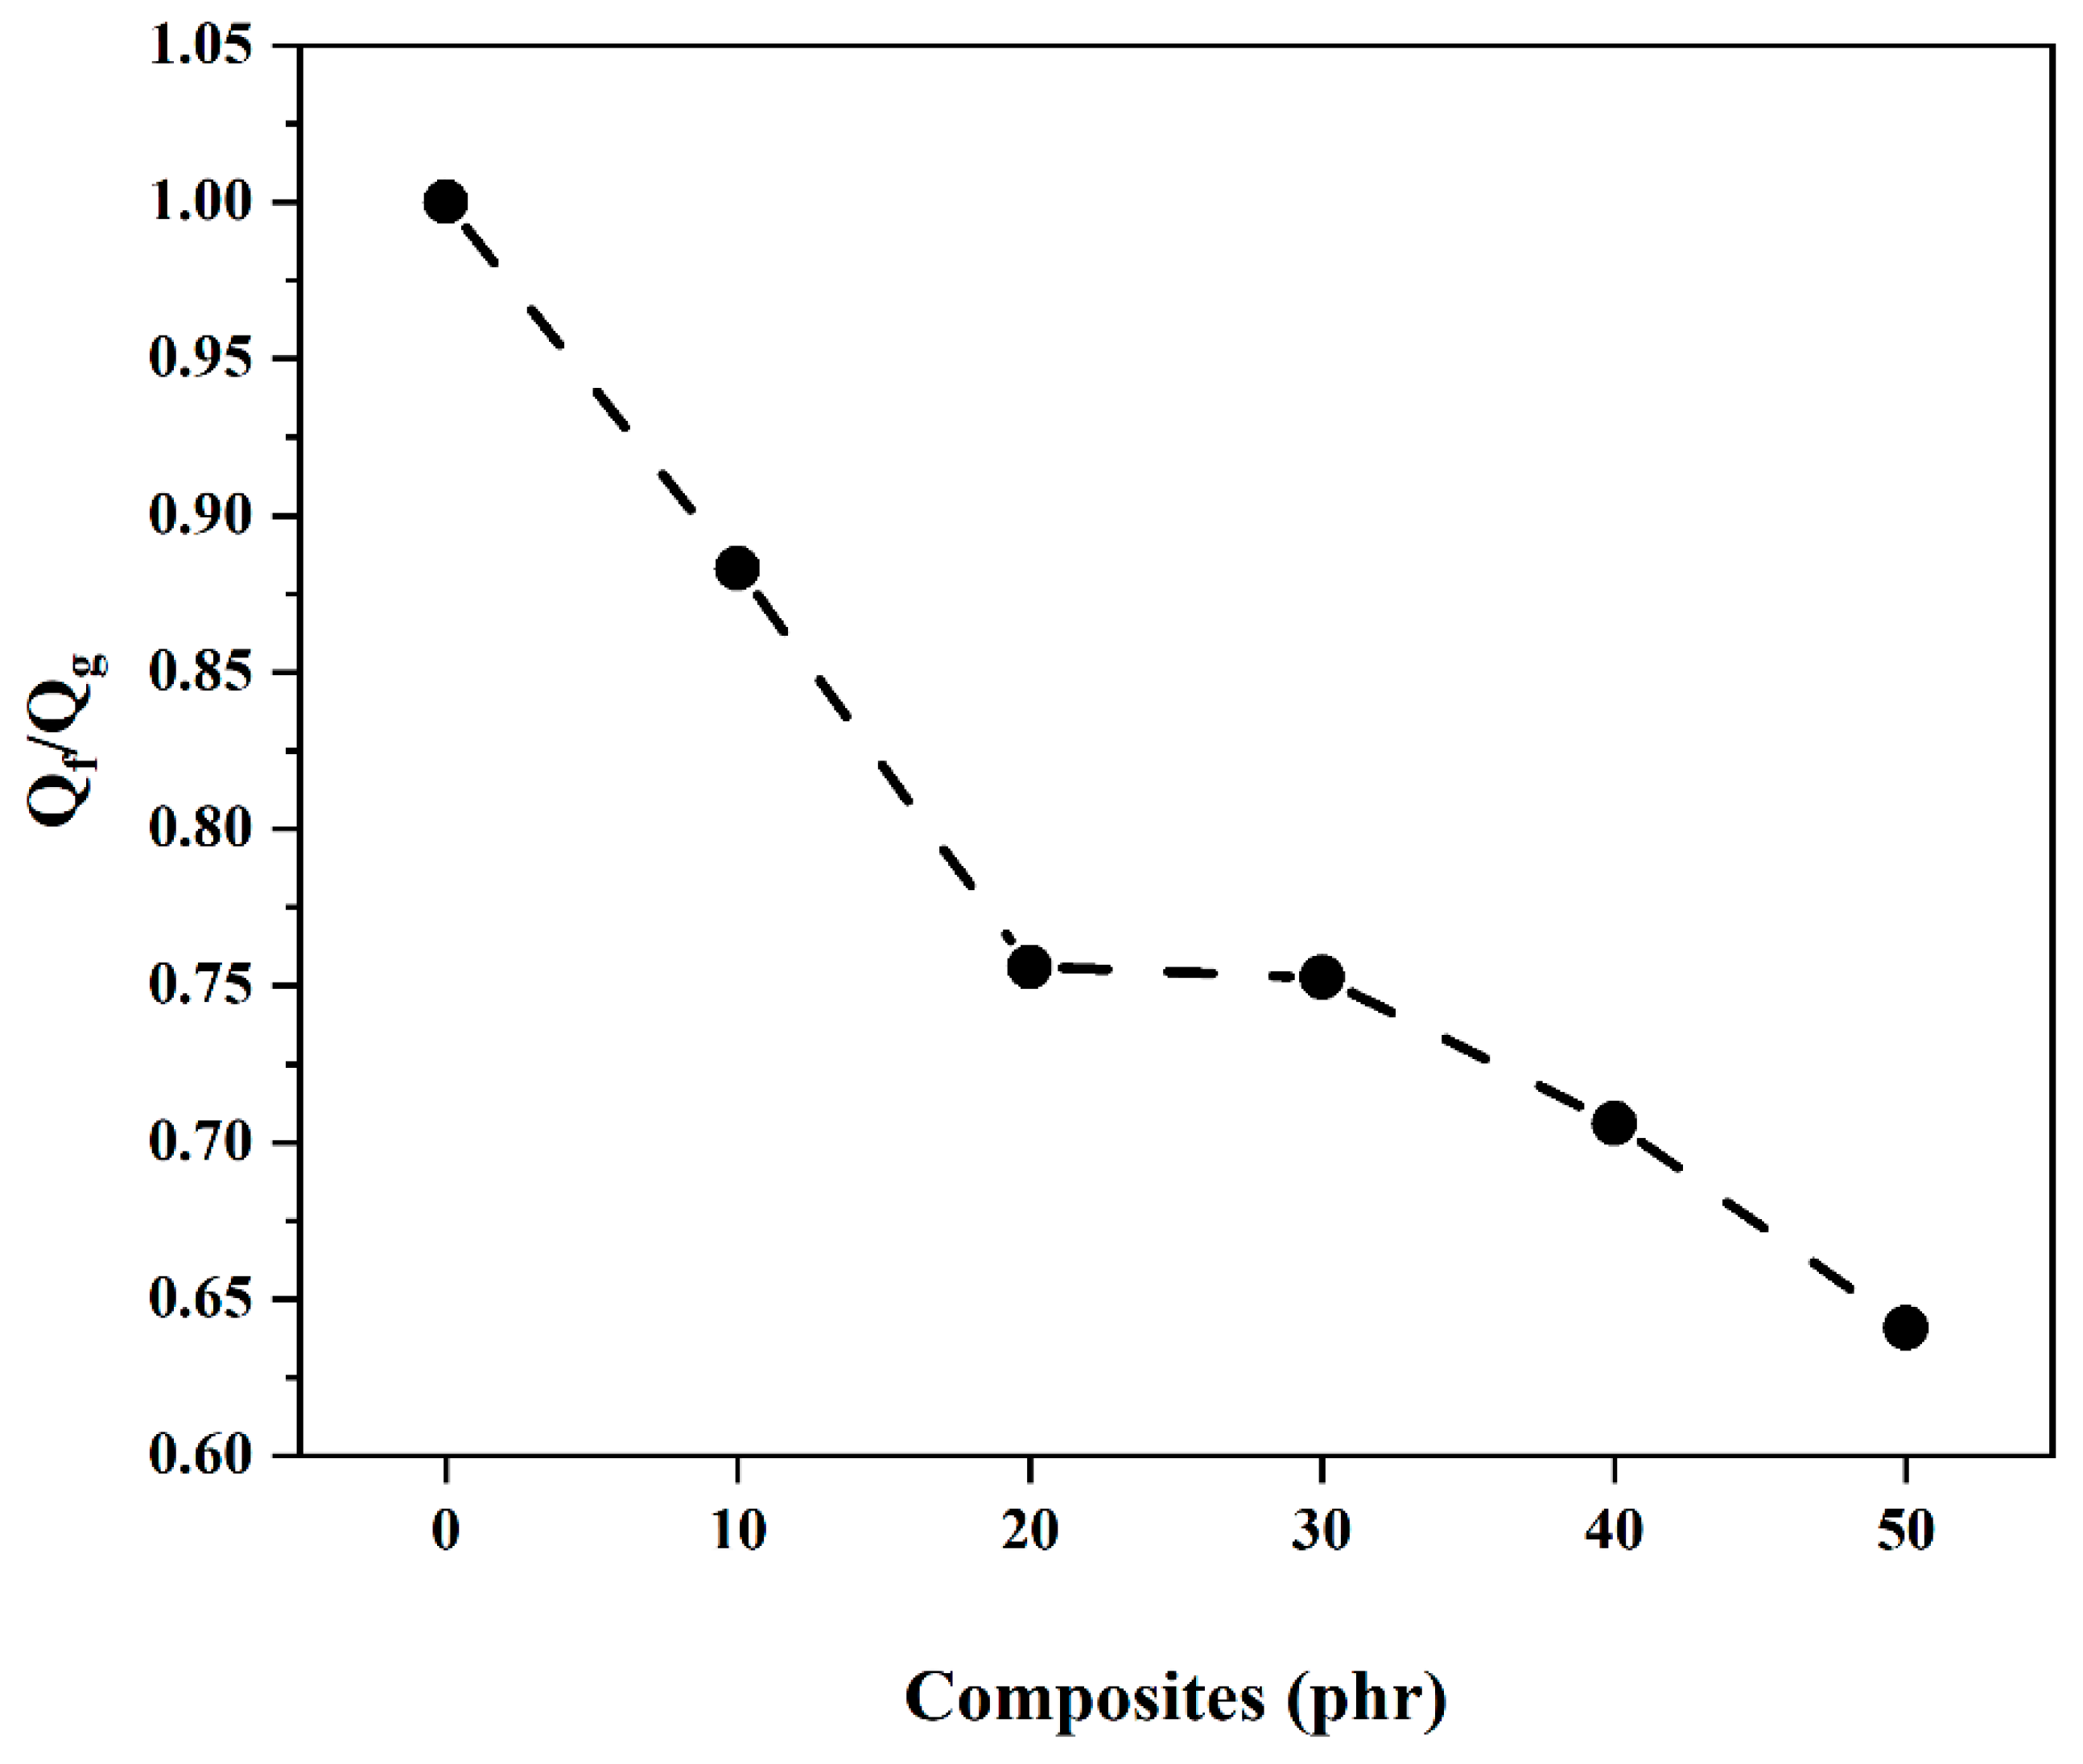
2.10. Investigation of Interfacial Interaction Using the Lorenz–Parks Approach

The evaluation of interfacial adhesion between the filler and the rubber was carried out using the formula proposed by Lorenz and Parks. In Figure 7, plots of the variation in Qf/Qg versus e−z are shown for the NR composites incorporating ophthalmic lens residues, with pure gum (without filler) serving as the reference.
The variables “a” and “b” are constants in the equation, with values of 0.86 and 0.11, respectively, indicating a correlation coefficient (R) of 0.94. According to the findings of Lorenz and Parks, values of the constant “a” greater than 0.7 suggest a significant interaction between the OLW filler and the rubber matrix. Santos et al. [14] reported similar results for the constants “a” and “b” in natural rubber composites containing leather waste.
Figure 8 shows a decrease in the Q f Q g values as the OLW content rises, indicating an interaction between the OLW-NR.

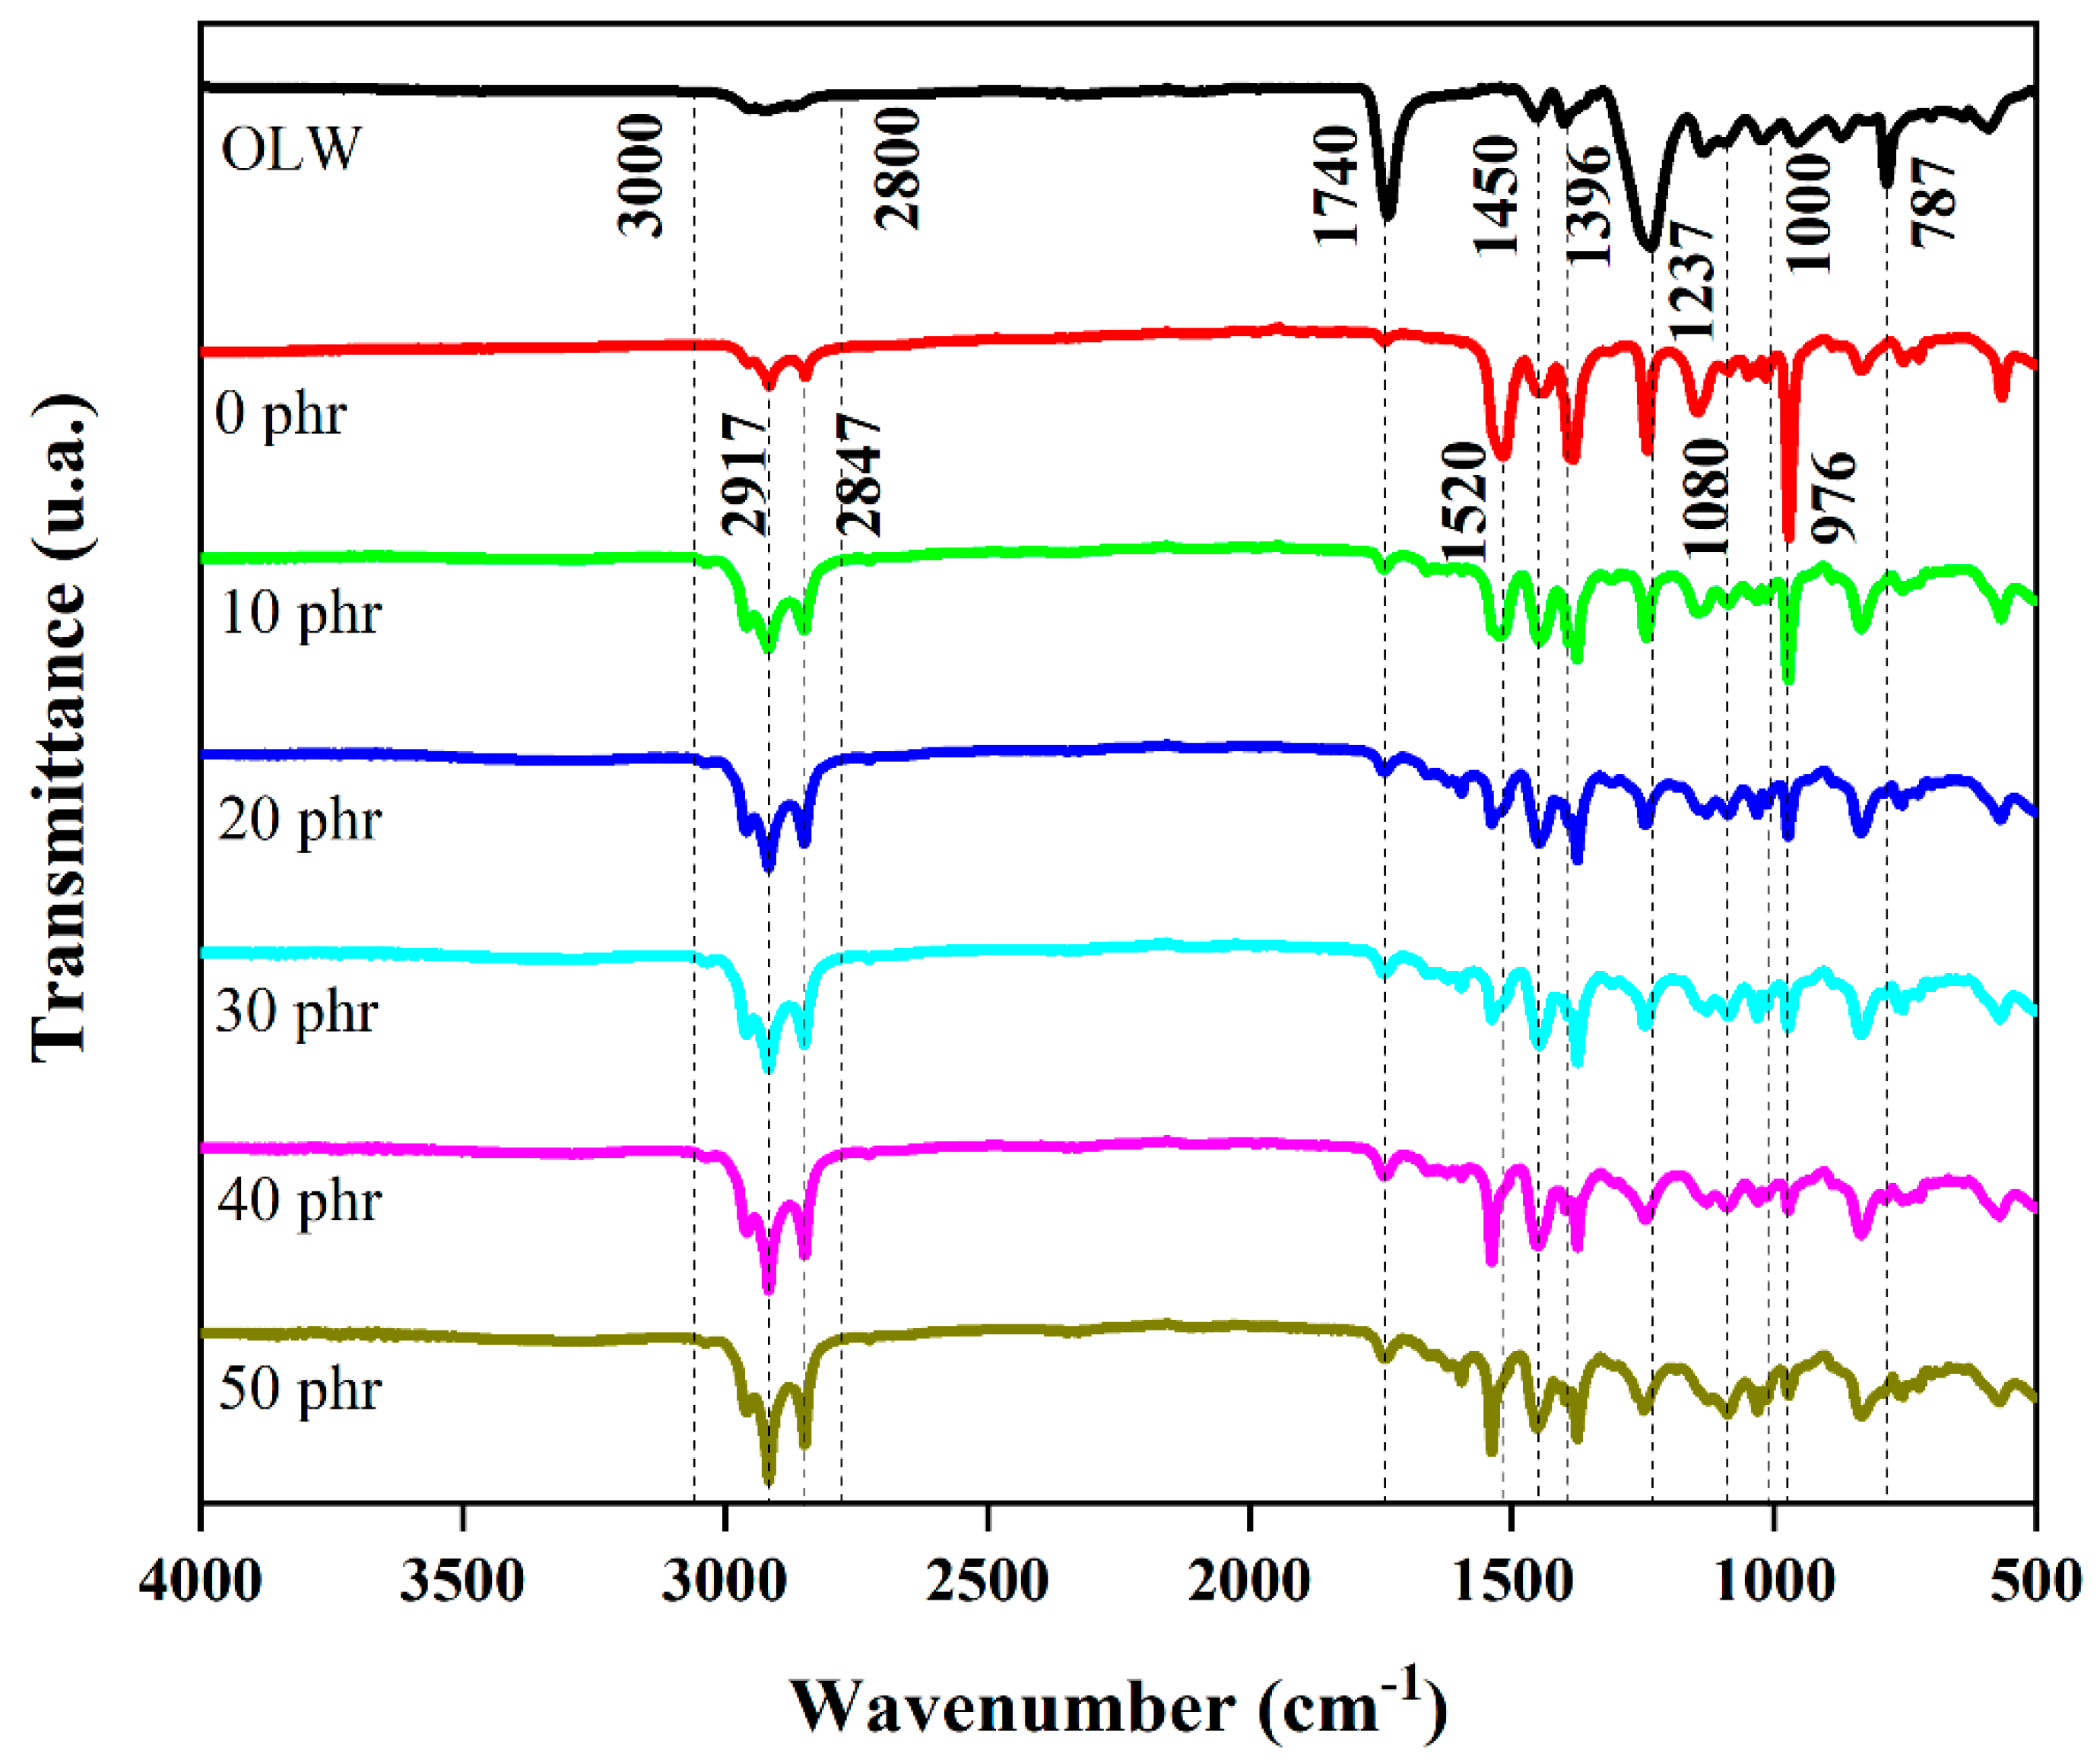
2.11. Analysis of Fourier-Transform Infrared Spectra in ATR Mode

The infrared spectra obtained by Fourier transform analysis of the OLW and NR composites are presented in Figure 9. The FTIR spectrum analysis of the lens residue reveals a notable similarity to the spectra of polymethyl methacrylate (PMMA) [15,16], displaying symmetric and asymmetric C–H stretching bands between 3000 and 2800 cm−1, C=O stretching vibration at 1740 cm−1, CH3 bending at 1450 cm−1, C–H stretching at 1396 cm−1, C–O–C stretching at 1237 cm−1, and C–H bending at 787 cm−1. However, the presence of contaminants such as silica (Si–O stretching at 1080 cm−1) [17] is also detected, likely resulting from the lens grinding process, which involves the use of silicon carbide or silicon dioxide abrasives. The natural rubber exhibited characteristic bands corresponding to asymmetric C–H3 stretching at 2917 cm−1, symmetric C–H2 stretching at 2847 cm−1, CH2 bending at 1520 cm−1, Si–O stretching (originating from impurities and coupling agents) at 1080 cm−1, and C=C stretching of the aromatic ring at 976 cm−1 [18]. Upon incorporating OLW into the polymer matrix during the vulcanization process, no new spectral peaks indicative of chemical reactions between the filler and the matrix were observed. Therefore, it can be inferred that the filler either adheres to the matrix or is encapsulated within it.

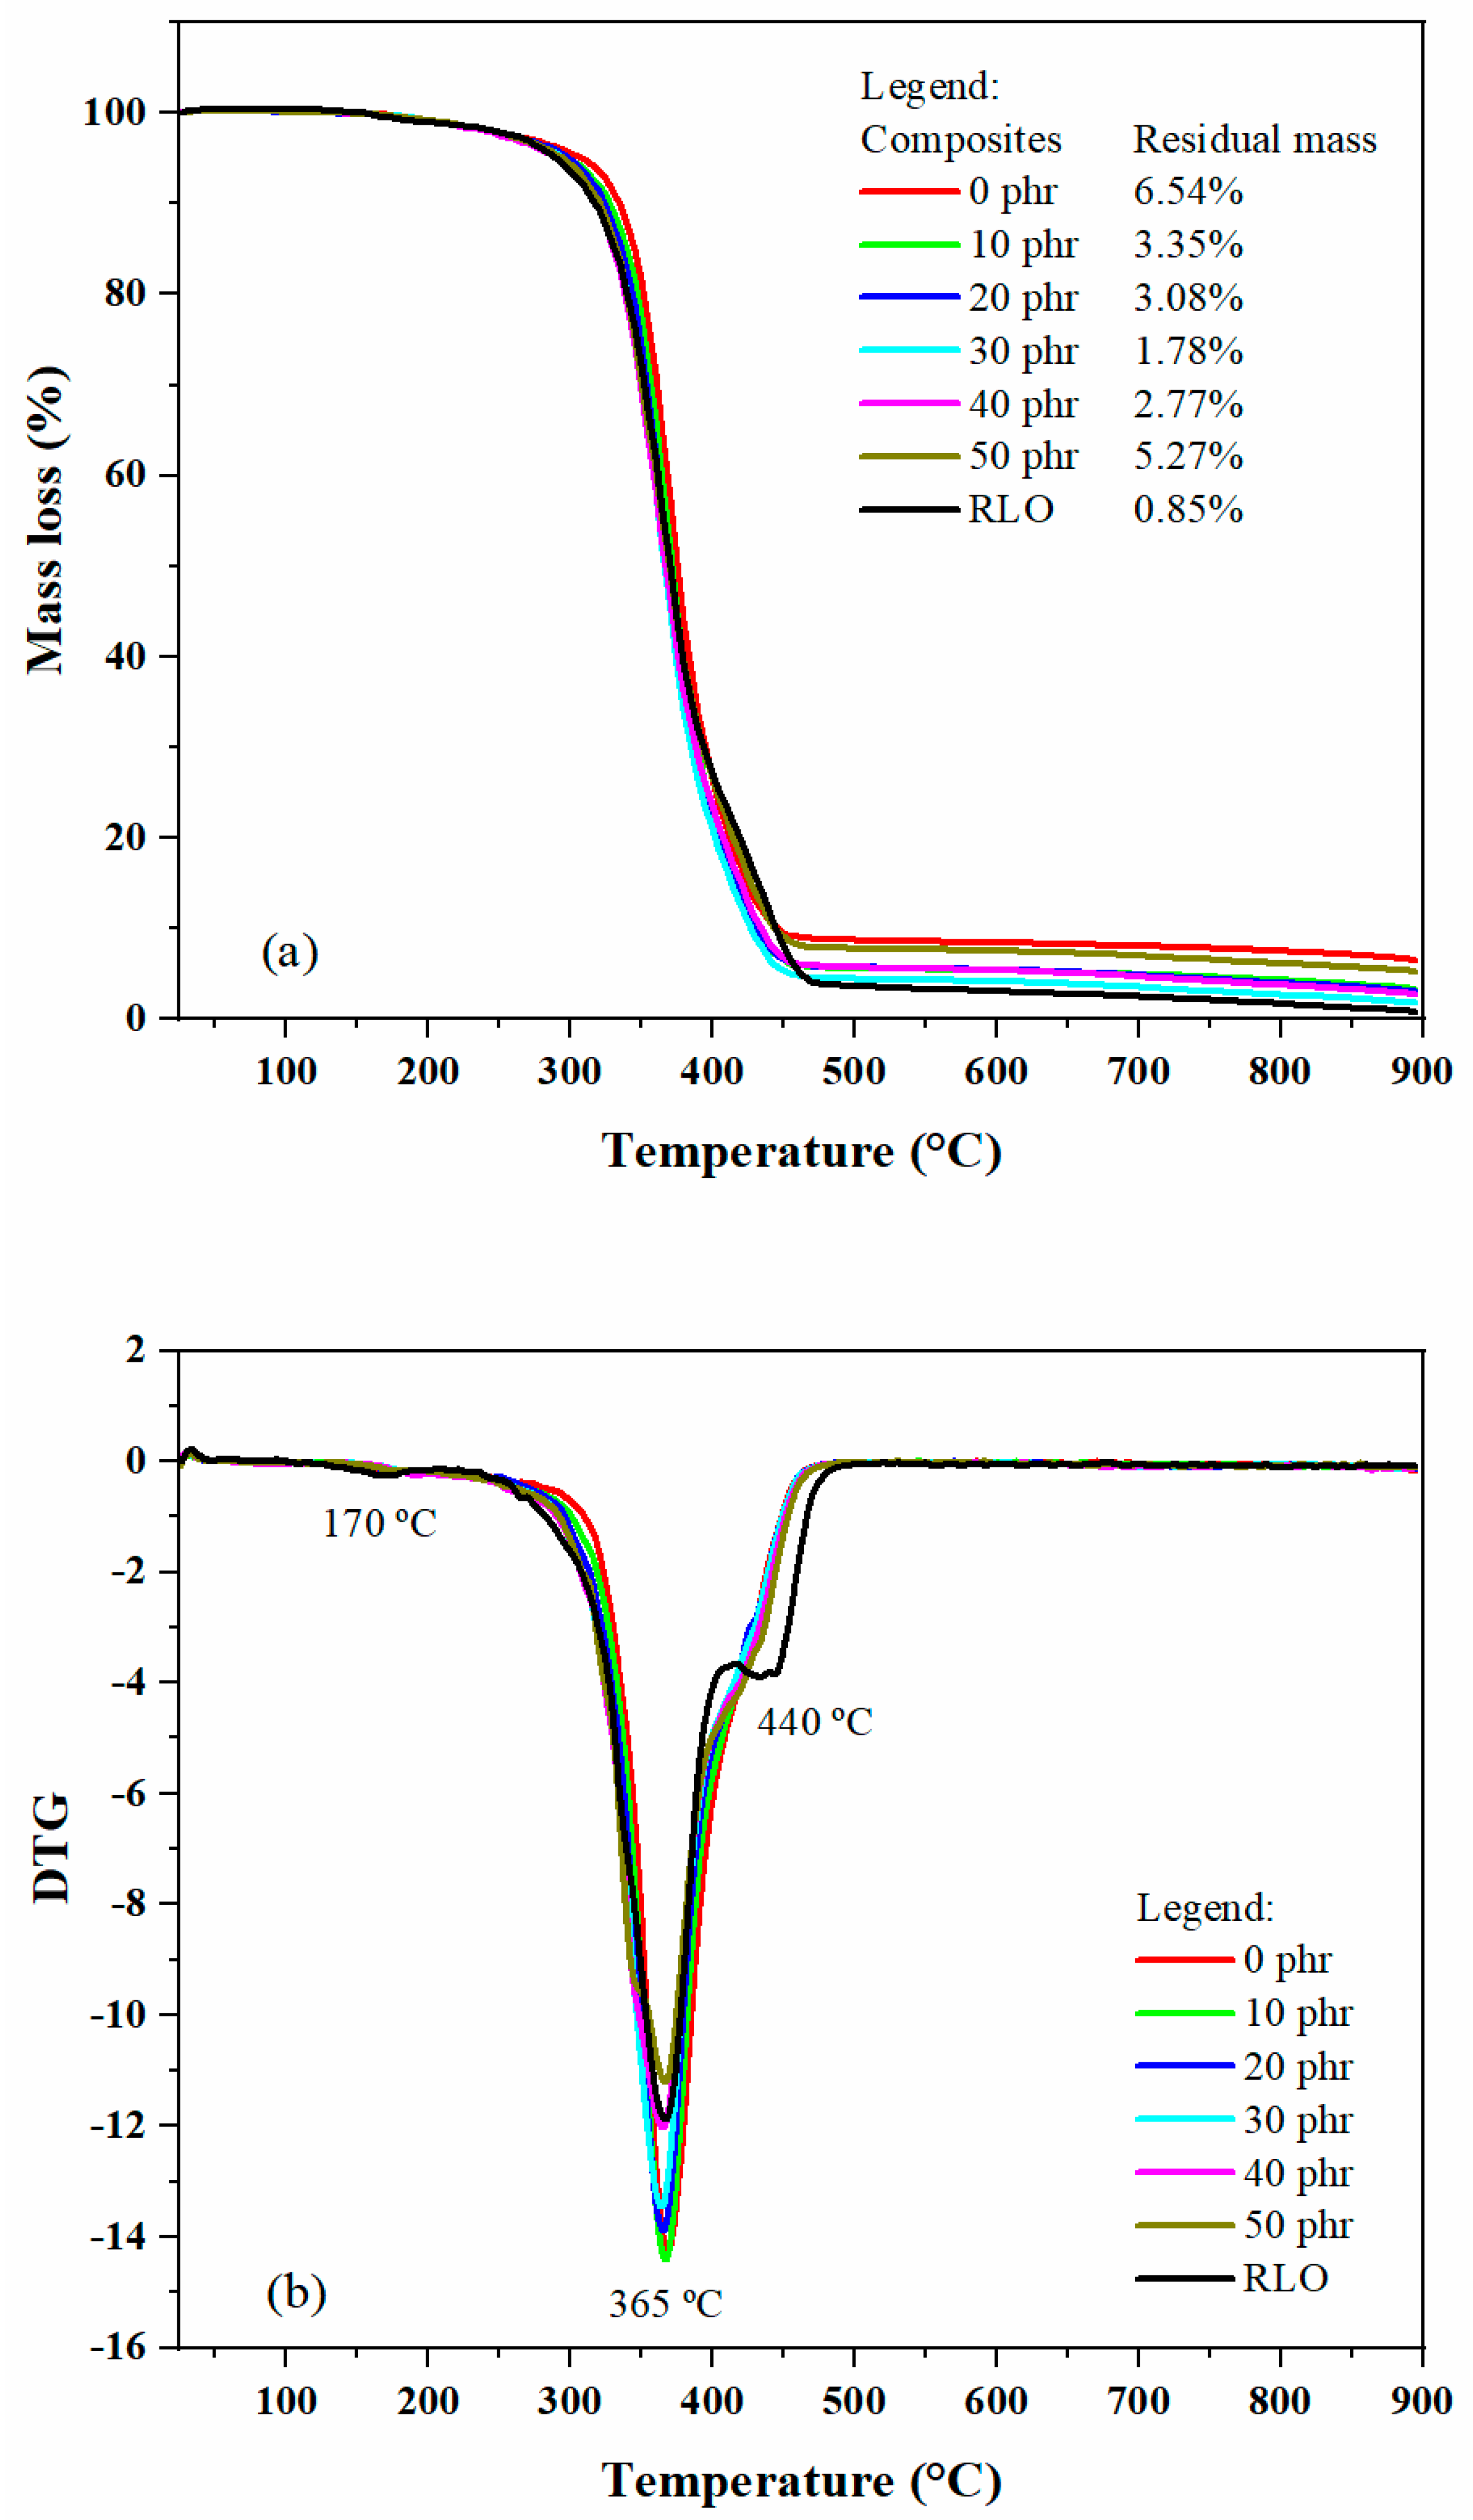
2.12. Analysis of Mass Loss by Thermogravimetry (TGA)

The thermal stability of the composites was examined using thermogravimetric analysis (TGA). In Figure 10a, the thermal degradation profile of the OLW is illustrated (represented by the black line). The degradation of this compound is observed to occur in three distinct stages. The initial phase takes place at approximately 170 °C, with a mass loss of 0.85%, which is associated with the breakdown of weak H–H bonds in PMMA.
The second phase, more intense, occurs at 365 °C, resulting in a mass loss of 77.62%, attributed to the depolymerization of the vinyl group [19]. The third phase, evidenced at 440 °C, results in a mass loss of 20.68%, corresponding to oligomer degradation [20]. The remaining mass of OLW is around 0.85%, which is linked to the presence of inorganic components in the sample, such as silica, bismuth, tin, bromine, and others, as identified through X-ray fluorescence analysis. Figure 10a shows the thermogram of the unfilled composite (red trace), which exhibits a single dominant degradation event centered at 365 °C. This peak corresponds to the decomposition of organic constituents in the natural rubber, resulting in a residual 6.54% of inorganic material [21]. Although the change is slight, increasing the filler content causes the composites’ decomposition onset to occur at progressively lower temperatures. Figure 10b displays the first derivative (DTG) curves for the various composites. For the filled composites (10–50 phr), a single degradation event is observed at temperatures around 365 °C, corresponding to the degradation of isoprene and organic materials present in NR. Table 5 presents, in a comparative manner, the events observed in the thermogravimetric analysis.

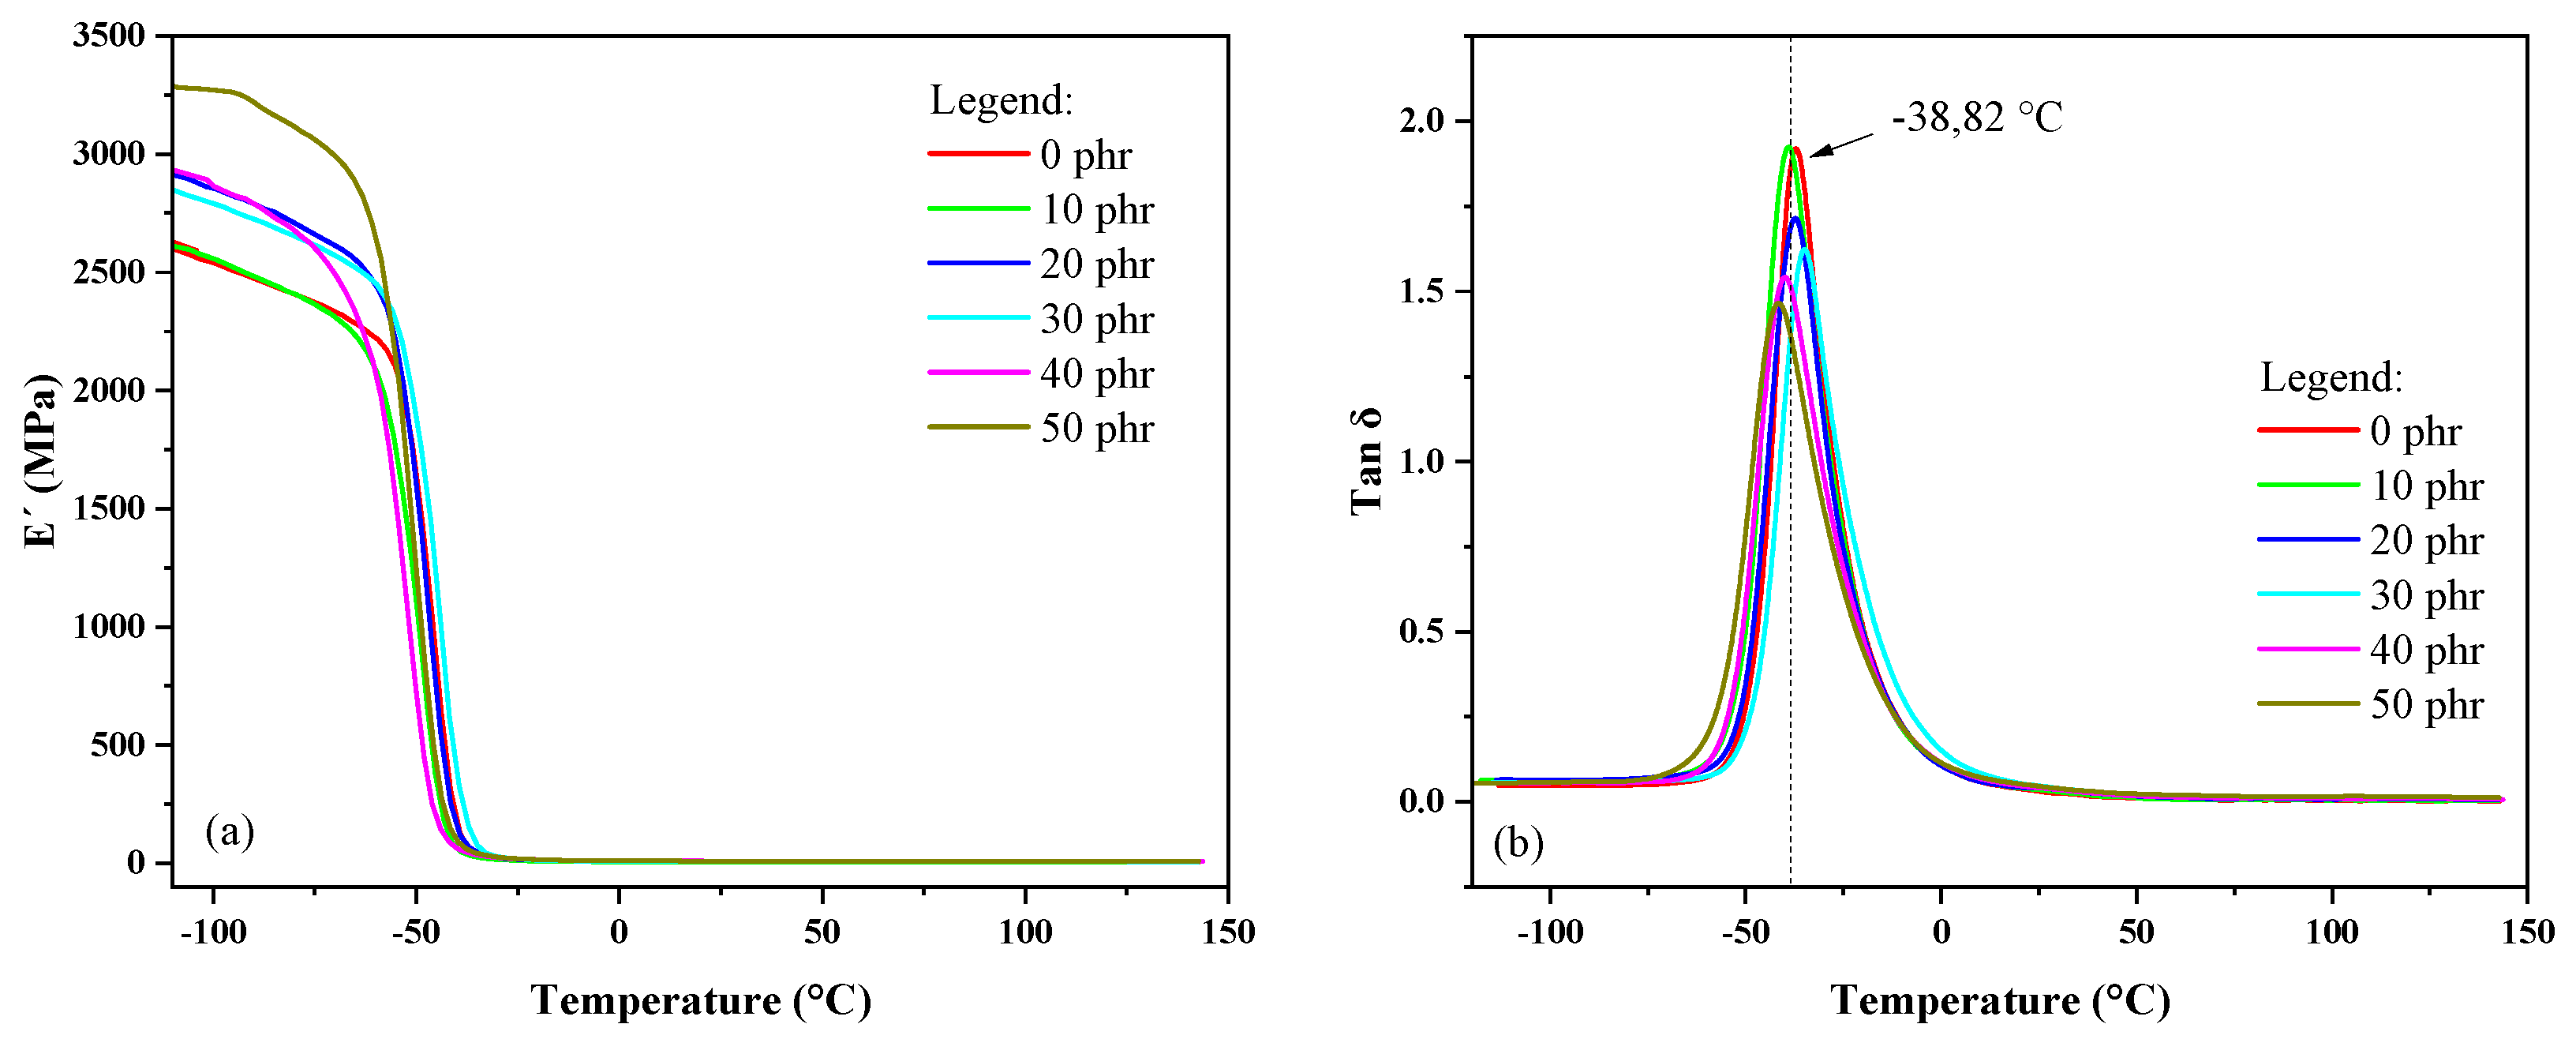
2.13. Dynamic Mechanical Analysis (DMA)

Figure 11a,b show the storage modulus (E’) curves and tan delta (tan δ) curves, respectively. In Figure 11a, it can be observed that with increasing concentrations of ophthalmic lens residue, there is an increase in the storage modulus (E’). This indicates that the presence of the residue contributes to a greater rigidity of the composites. The increased rigidity is particularly evident at lower temperatures, where the material is in a glassy state, and the polymer chains have reduced mobility. With increasing temperature, a shift from the glassy state to the rubbery state takes place, leading to a reduction in E’. However, even after the glass transition, composites with higher lens residue content maintain a higher storage modulus compared to those with lower content or no residue, suggesting that the residue continues to influence rigidity in the rubbery state.
Figure 11b illustrates the maximum point of the loss factor (tan δ), which corresponds to the glass transition temperature (Tg) and reflects the composite’s capacity for energy dissipation. The presence of lens residue slightly affects the height of the tan δ peak, with a reduction observed as the residue concentration increases. This can be interpreted as a reduction in the damping capacity of the composites with higher residue content, which may be attributed to the increased rigidity, resulting in lower energy dissipation. The Tg of the composites, indicated by the tan δ peak, remains virtually unchanged regardless of the residue concentration. This indicates that although the lens residue alters mechanical characteristics like stiffness and damping, it does not markedly change the temperature at which the material transitions from its glass to its rubbery phase.

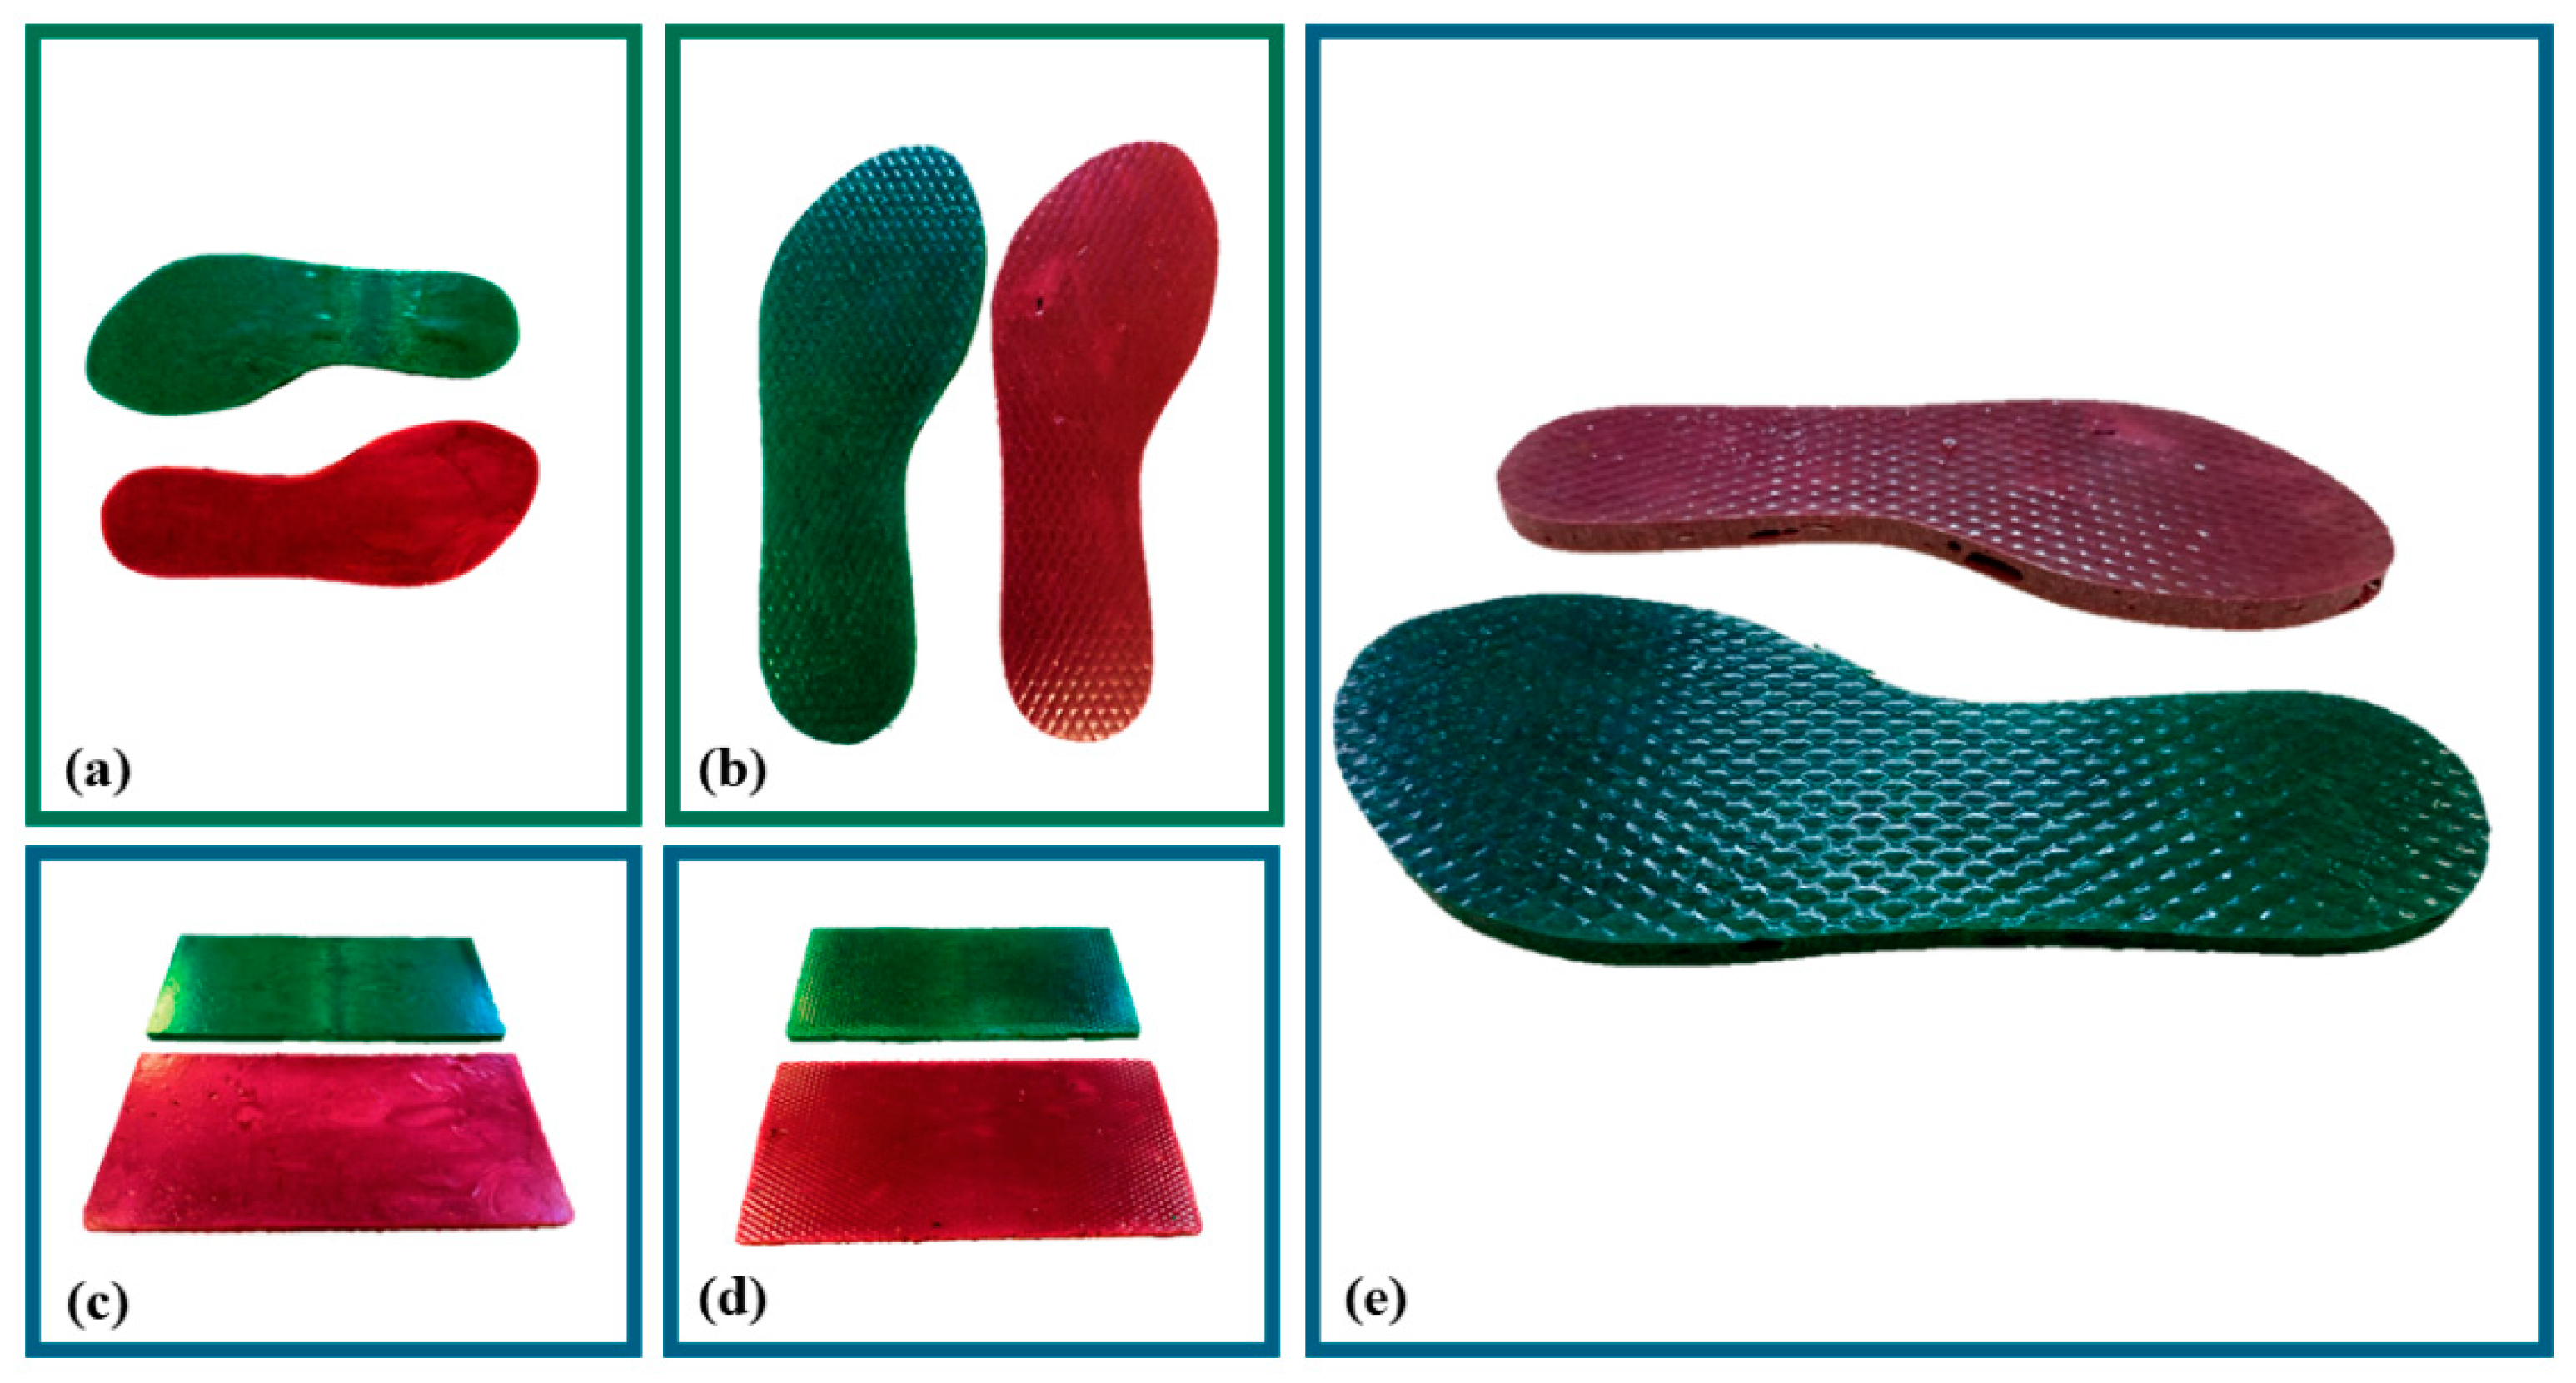
3. Application of the New NR/OLW Composite

Figure 12 shows the prototype of a flip-flop sole produced from the natural rubber composite with 10 phr of OLW.
Although OLW primarily functions as a filler rather than a structural reinforcement, the mechanical results were satisfactory, and the material demonstrated potential for practical applications, such as in the production of flip-flop soles. The dispersion of the waste within the polymeric matrix was homogeneous, contributing to the preservation of the material’s overall properties.
When compared to three other studies that incorporated different types of waste—namely sugarcane bagasse [22], recycled polyurethane [23], and carbonized wood with silica [24]—marked differences become evident. Sugarcane bagasse, following alkaline treatment, yielded composites with a significant enhancement in tensile strength (up to a 98% increase) and substantial flexibility (elongation reaching 546%). However, as a plant-based material, its resistance to moisture and prolonged exposure to sunlight is limited, requiring appropriate chemical treatment to improve adhesion with the hydrophobic rubber matrix. The study involving recycled polyurethane (PU) from the refrigeration industry exhibited outstanding mechanical and environmental performance. The PU/SBR/NR composite displayed strong filler–rubber interaction, with mechanical behavior resembling that of metallic materials in terms of plastic resistance. Additionally, the recycled PU demonstrated high resistance to abrasion, moisture, ultraviolet radiation, and extreme temperatures, making it highly suitable for industrial applications, such as technical footwear soles. Finally, the use of carbonized wood with silica produced statistically optimized composites, achieving high tensile strength (19.22 MPa), Shore A hardness of 97.15, and low water absorption (7.18%). This type of composite also showed excellent performance under aggressive environmental conditions, proving particularly suitable for large-scale footwear sole manufacturing.
In terms of climatic durability, it was evident that composites reinforced with recycled polyurethane presented the best overall performance, exhibiting high resistance to water, solar radiation, and extreme temperatures. Composites containing carbonized wood/silica and OLW also showed considerable durability, suggesting potential for outdoor applications. Conversely, the sugarcane bagasse-based composite, while environmentally advantageous and economically viable, demands additional precautions concerning its durability in humid or sun-exposed environments. Therefore, it can be concluded that the selection of waste materials to be incorporated into natural rubber composites must take into account not only environmental impact and cost-effectiveness but also the final application and the climatic conditions to which the product will be subjected. The use of waste such as OLW and recycled PU represents a promising alternative, successfully integrating technological innovation with industrial sustainability.

4. Experimental Section

4.1. Material

The Vietnamese SVR-CV60 natural rubber (Standard Vietnamese Rubber), which had a Mooney viscosity greater than 60.0 at 100 °C and a nitrogen content of 0.6% by weight, was commercially obtained from DLP Indústria e Comércio de Borracha e Artefatos LTDA, Poloni, São Paulo, Brazil. Additionally, ophthalmic lens waste was generously provided by Perego Indústria e Comércio de Lentes LTDA, situated in Araçatuba, São Paulo, Brazil. This material underwent a drying process at 100 °C and was sieved to ensure a particle size greater than 120 mesh. All necessary vulcanization ingredients, including ZnO, stearic acid, PEG 4000, Chartwell® coupling agent, lubricating oil, sulfur, and curing agents, such as MBTS (benzothiazole disulfide) and TMTD (tetramethyl thiuram disulfide), were sourced from reliable suppliers to ensure high purity levels. Details regarding the formulation used for preparing the NR/OLW composites can be found in Table 6.

Development of the Composites

The compounds were prepared following the protocols established by ASTM D3182-21a [25], employing a two-roll mill operating with a speed ratio of 1:1.25. Variable amounts ranging from 0 to 50 phr were employed. During the mixing process, raw rubber was combined with curing agents such as ZnO and stearic acid, along with plasticizers like PEG 4000 and lubricant, in addition to OLW used as filler. After homogenization for 20 min, the mixture rested for 24 h under controlled conditions (22 °C). Next, this formulation was processed again using the mixer to incorporate the cross-linker (sulfur) alongside curing accelerators MBTS and TMTD. Following further mixing lasting 15 min, the mixture remained idle for 2 h under controlled conditions. After completing the process, the composite underwent rheological analysis before being molded via hot pressing to obtain test specimens.

4.2. Methodology for Characterization of the Composites

4.2.1. Characterization of Rheological Parameters

The viscoelastic behavior of the material was assessed through oscillatory testing using a disk rheometer (Team Equipamentos do Brasil). The procedure was carried out in accordance with ASTM D2084-19a [26], applying a 1° oscillation amplitude at a controlled temperature of 150 °C. Following the acquisition of the rheological data, the NR/OLW formulations were subjected to a thermocompression stage. This step was performed with the aid of a hydraulic press (Mastermac, model Vulcan 400/20-1), manufactured domestically, designed to exert up to 20.6 MPa of pressure, in conjunction with a 1010/1020 steel mold (dimensions: 15 × 15 × 0.2 cm).

4.2.2. Analysis of the Degree of Dispersion of Fillers in Natural Rubber

The uniformity of the spatial arrangement of reinforcing particles within a rubber system corresponds to its dispersion level. A high degree of homogeneity suggests a uniform distribution in terms of the size and shape of the filler particles. This condition can enhance various mechanical properties of the rubber, including its resistance to wear, abrasion, and fracture. The quantitative analysis of ophthalmic lens waste homogeneity in rubber compounds can be conducted by applying Equation (1) [27]:
L = η r m r = M L f M L g M H f M H g
where L quantifies the filler dispersion within the polymeric system, ML denotes minimum torque, MH denotes maximum torque, and f and g represent the composite material and pure rubber, respectively.

4.2.3. Analysis by Scanning Electron Microscopy (SEM)

The fracture surface topography of the samples was examined using a Carl Zeiss EVO LS15 SEM system, operating at an acceleration voltage of 20 kV, produced in Germany. Prior to imaging, the specimens were covered with a fine layer of gold, employing a Quorum Q150R ES sputtering device.

4.2.4. Measurement of Composite Density

To determine the density of the composites, the protocols described in the ASTM D297-21 [28] standard were followed, utilizing ethanol (0.79 g·cm−3) as the reference medium. The density was calculated using Equation (2):
ρ = ρ L     m A m A m B
Here, ρ denotes sample density (g·cm−3), ρL refers to ethanol density at measurement temperature (g cm−3), mA corresponds to sample mass (g), and mB represents sample mass when submerged in liquid (g).

4.2.5. Analysis of Crosslink Density in the Composites

The crosslink density of the composites was evaluated through solvent swelling analysis. Test samples (~0.25 ± 0.05 g each) underwent a five-day immersion in toluene. Post-immersion, samples were extracted, blotted to eliminate excess solvent, and then reweighed. Subsequently, they underwent oven drying at 80 °C for 24 h before a final weighing. Recorded data included initial sample weight, weight after solvent absorption, and post-drying mass, which were utilized to compute the rubber’s volumetric fraction within the swollen sample. The crosslink density was subsequently determined using Equation (3), established by Flory and Rehner [29]. For this calculation, known values of the molar volume of toluene (V0) and the Flory–Huggins interaction parameter (χ) for natural rubber and toluene were 106.3 cm3 mol−1 and 0.393, respectively.
ν = ( ln 1 V B + V B + χ V B ) 2 ( ρ B ) ( V 0 ) ( V B 1 3 V B 2 )
Here, ν represents the crosslink concentration (mol cm−3), ρB signifies rubber density (g cm−3), and VB corresponds to rubber’s volumetric fraction in its swollen state, as inferred from the weight increase following solvent absorption.
Crosslink concentrations were approximated via the Mooney–Rivlin approach [30] utilizing mechanical tensile testing results. To visualize the linear region and derive network characteristics, a graph was constructed using a semi-empirical Equation (4) [31]:
σ = F 2 A 0 ( λ λ 2 ) = C 1 + 1 λ C 2
Here, F denotes the applied force on the vulcanized sample; A0 represents its cross-section (mm2); λ expresses the elongation factor (1 + ε), where ε is the strain; and C1 and C2 denote intrinsic material coefficients, with C1 attributed to crosslinking sites, whereas C2 defines the Mooney–Rivlin elasticity term, linked to constrained molecular entanglements.
The coefficient C1 facilitates crosslink concentration assessment and serves in the formulation of Equation (5) [32]:
η = C 1 R T
where η represents crosslink concentration (mol·cm−3); R is the universal gas constant; and T defines absolute temperature (K).

4.2.6. Study of X-Ray Fluorescence of the Composites

The elemental composition of the samples was analyzed using X-ray fluorescence (XRF) spectroscopy, employing a Panalytical Axios PW 4400/40 spectrometer manufactured in the Netherlands. Data interpretation was performed using SUPERQ 5.1B software within the Om application. This method provides detailed information on the elemental composition of the samples, both quantitatively and qualitatively, identifying the elements present in the materials and their respective proportions.

4.2.7. Infrared Spectroscopy with Fourier Transform (FTIR) Examination

Infrared spectral analysis was conducted using a Bruker Invenio instrument manufactured in Germany. The measurements were obtained in ATR (Attenuated Total Reflection) configuration, covering the spectral region from 4000 to 500 cm−1, with a resolution of 4 cm−1 and averaging 32 scans per sample.

4.2.8. Tensile and Tear Strength Testing of the Composites

Mechanical performance was evaluated through tensile and tear experiments carried out on a Biopdi universal testing system, produced in Brazil, operating at a crosshead speed of 500 mm·min−1, and equipped with a 5 kN load cell and integrated strain measurement sensor. For tensile testing, five type A specimens were prepared in accordance with ASTM D412-16 [33]. For tear resistance, five type C samples were tested, as outlined by ASTM D624-00 [34].

4.2.9. Hardness Evaluation of the Composite

The determination of surface hardness in the composites followed the protocols stipulated by ASTM D2240-15 [35], using an analog durometer from Digimess manufactured in China. The measurement was performed using the Shore A scale, which ranges from 0 to 100 with increments of 1 Shore A unit.

4.2.10. Evaluation of Frictional Resistance of the Composites

To assess material loss due to abrasion, the procedure outlined in ASTM D5963-22 [36] was employed, applying the calculation expressed in Equation (6). The test utilized the MaqTest apparatus, manufactured in Brazil, with the abrasion path set to 40 m and a normal force of 5 N exerted on the sample pressed against the rotating drum.
P A = Δ m     S 0 ρ   S
In this context, PA denotes the abrasion volume loss (mm3/40 m); Δm refers to the mass reduction in the composite (mg); S0 indicates the nominal abrasion index of the abrasive sheet against reference rubber (200 ± 20 mg); S corresponds to the measured abrasion index of the abrasive sheet on standard rubber (mg); and ρ represents the composite’s density (mg·mm−3).

4.2.11. Investigation of the Compatibility Between Natural Rubber and Ophthalmic Lens Waste Based on the Lorenz–Parks Approach

The interfacial interaction behavior of the OLW-NR system was examined through the method proposed by Lorenz–Parks [37]. The required parameters were obtained from swelling tests performed in organic solvents, with data interpreted according to Equation (7) [14]:
Q f Q g = a e z + b
In this context, Q indicates the volume of toluene absorbed per gram of rubber; the indices f and g refer to the filled vulcanized sample and the unfilled (gum) reference, respectively; z indicates the mass proportion between filler and rubber; and a and b are empirically determined constants. The Q value is calculated using Equation (8):
Q = w s w d w r × 100 / w F
In this equation, ws refers to the weight of the specimen after swelling, wd corresponds to the weight of the dried material, wr indicates the rubber content present in the dried sample, and wF denotes the overall mass of the formulation.

4.2.12. Thermogravimetric Study (TGA) of the Composites

Thermogravimetric analysis (TGA) was performed using a Netzsch 209 instrument produced in Germany. The experiments were carried out across a broad temperature spectrum, ranging from approximately 25 to 900 °C, with a consistent heating rate of 10 °C per minute. The tests were conducted in a nitrogen environment, maintaining a flow rate of 15 mL per minute. For each measurement, a sample mass of around 10 mg was utilized in accordance with the guidelines outlined in ASTM D6370-99 [38].

4.2.13. Study of Dynamic Mechanical Analysis (DMA)

Dynamic mechanical behavior was evaluated using a Netzsch DMTA 242C analyzer manufactured in Germany. The measurements were performed in tensile configuration at a fixed frequency of 10 Hz, applying a heating gradient of 10 °C per minute with temperatures ranging from −100 to 150 °C. The specimens used had approximate dimensions of 10 × 5 × 0.25 mm.

5. Conclusions

This research explored the potential of recycling OLW to create new composites with a polymer matrix. Rheometric data revealed that the filler’s presence shortens vulcanization time, contributing to thermal efficiency. Crosslink densities, measured using the Flory–Rehner method, rose with the addition of filler, a pattern also confirmed by the Mooney–Rivlin approach. The interaction between the OLW-NR, evaluated through the Lorenz-Parks model, demonstrated a clear interaction between OLW-NR. However, this interaction was insufficient to enhance mechanical reinforcement, functioning primarily as a filler. Thermogravimetric tests showed the thermal stability of the composite. In dynamic mechanical analysis, the maintenance of a virtually constant glass transition temperature with the addition of the residue indicates that the processing and thermal behaviors of the composite are not drastically altered, which is advantageous for the development of new materials with tailored properties. ATR-FTIR analysis revealed no evidence of chemical bonding between the elastomeric matrix and the filler. Drawing on these observations, the most suitable OLW loadings were determined to lie between 10 and 20 phr, guiding the fabrication of a flip-flop sole prototype. Therefore, the use of OLW as filler in vulcanized natural rubber composites represents a significant innovation in the pursuit of more sustainable and economically viable materials. This research advances our understanding of the reutilization of industrial by-products and their implementation in the polymer sector, fostering more efficient and environmentally responsible practices.

Author Contributions

J.A.R.: Conceptualization, Data curation, Formal analysis, Investigation, Methodology, Project administration, Software, Validation, Visualization, Writing—original draft and Writing—review & editing; C.T.H.: Conceptualization, Data curation, Formal analysis, Methodology, Visualization, Writing—original draft and Writing—review & editing; D.d.S.S.: Conceptualization, Data curation, Formal analysis, Resources, Validation, Visualization, Writing—original draft and Writing—review & editing; S.d.S.A.: Investigation, Methodology, Validation, Visualization, Writing—original draft and Writing—review & editing; M.F.H.: Conceptualization, Data curation, Methodology, Validation, Visualization, Writing—original draft and Writing—review & editing; G.H.B.d.S.: Investigation, Methodology, Project administration, Resources, Supervision, Validation, Visualization, Writing—original draft and Writing—review & editing; E.M.G.: Conceptualization, Data curation, Investigation, Methodology, Project administration, Resources, Supervision, Validation, Visualization, Writing—original draft and Writing—review & editing; F.C.C.: Conceptualization, Data curation, Formal analysis, Funding acquisition, Investigation, Methodology, Project administration, Software, Resources, Supervision, Validation, Visualization, Writing—original draft and Writing—review & editing; G.P.C.: Investigation, Methodology, Project administration, Resources, Supervision, Validation, Visualization, Writing—original draft and Writing—review & editing; M.J.d.S.: Investigation, Methodology, Project administration, Resources, Supervision, Validation, Visualization, Writing—original draft and Writing—review & editing; E.A.d.S.: Investigation, Methodology, Project administration, Resources, Supervision, Validation, Visualization, Writing—original draft and Writing—review & editing; J.F.R.d.S.: Conceptualization, Data curation, Formal analysis, Funding acquisition, Investigation, Methodology, Project administration, Software, Resources, Supervision, Validation, Visualization, Writing—original draft and Writing—review & editing; and R.J.d.S.: Conceptualization, Data curation, Formal analysis, Funding acquisition, Investigation, Methodology, Project administration, Software, Resources, Supervision, Validation, Visualization, Writing—original draft and Writing—review & editing. All authors have read and agreed to the published version of the manuscript.

Funding

The authors thank the Fundação de Ensino, Pesquisa e Extensão de Ilha Solteira (FEPISA) for funding provided under grant No. 002/2022.

Institutional Review Board Statement

Not Applicable.

Informed Consent Statement

Not Applicable.

Data Availability Statement

The raw and processed data supporting the conclusions are available upon reasonable request to the corresponding author.

Acknowledgments

The authors sincerely thank the São Paulo Research Foundation (FAPESP) for its support provided under grant number 2016/03208-0.

Conflicts of Interest

The authors declare no conflicts of interest.

References

  1. Masłowski, M.; Miedzianowska, J.; Strzelec, K. Natural rubber composites filled with crop residues as an alternative to vulcanizates with common fillers. Polymers 2019, 11, 972. [Google Scholar] [CrossRef] [PubMed]
  2. dos Santos, R.J.; Agostini, D.L.d.S.; Cabrera, F.C.; dos Reis, E.A.P.; Ruiz, M.R.; Budemberg, E.R.; Teixeira, S.R.; Job, A.E. Sugarcane bagasse ash: New filler to natural rubber composite. Polímeros 2014, 24, 646–653. [Google Scholar] [CrossRef]
  3. Bacarin, G.B.; Dognani, G.; dos Santos, R.J.; Meirelles, M.G.; Rodrigues, T.F.; Klauck, C.R.; Rodrigues, M.A.S.; Jahno, V.D.; Cabrera, F.C.; Job, A.E. Natural rubber composites with Grits waste from cellulose industry. J. Mater. Cycles Waste Manag. 2020, 22, 1126–1139. [Google Scholar] [CrossRef]
  4. Sareena, C.; Ramesan, M.T.; Purushothaman, E. Utilization of peanut shell powder as a novel filler in natural rubber. J. Appl. Polym. Sci. 2012, 125, 2322–2334. [Google Scholar] [CrossRef]
  5. Sowińska-Baranowska, A.; Maciejewska, M. Potential Utilization of Ground Eggshells as a Biofiller for Natural Rubber Biocomposites. Materials 2023, 16, 2988. [Google Scholar] [CrossRef] [PubMed]
  6. Batista, S.S.; de Souza, L.G.M.; Bezerra, D.M.d.L.; Neto, R.V.P. Viabilities for obtaining, manufacturing and applying composites using bamboo powders and ophthalmic lens waste. Res. Soc. Dev. 2020, 9, e775997455. [Google Scholar] [CrossRef]
  7. Hiranobe, C.T.; Gennaro, E.M.; de Souza, G.H.B.; Souza, D.d.S.; Kawall, S.A.; Hiranobe, M.F.; Salmazo, L.O.; Pérez, M.A.R.; Gil, A.L.; Nascimento, E.S.; et al. Green Rubber Technology: The Potential of Ophthalmic Lens Waste as a Filler in Styrene–Butadiene Rubber-Based Composites. Materials 2025, 18, 1842. [Google Scholar] [CrossRef]
  8. Najam, M.; Hussain, M.; Ali, Z.; Maafa, I.M.; Akhter, P.; Majeed, K.; Ahmed, A.; Shehzad, N. Influence of silica materials on synthesis of elastomer nanocomposites: A review. J. Elastomers Plast. 2020, 52, 747–771. [Google Scholar] [CrossRef]
  9. Kim, D.Y.; Park, J.W.; Lee, D.Y.; Seo, K.H. Correlation between the crosslink characteristics and mechanical properties of natural rubber compound via accelerators and reinforcement. Polymers 2020, 12, 2020. [Google Scholar] [CrossRef] [PubMed]
  10. Hiranobe, C.T.; Ribeiro, G.D.; Torres, G.B.; dos Reis, E.A.P.; Cabrera, F.C.; Job, A.E.; Paim, L.L.; dos Santos, R.J. Cross-linked density determination of natural rubber compounds by different analytical techniques. Mater. Res. 2021, 24, e20210041. [Google Scholar] [CrossRef]
  11. Rooj, S.; Das, A.; Heinrich, G. Tube-like natural halloysite/fluoroelastomer nanocomposites with simultaneous enhanced mechanical, dynamic mechanical and thermal properties. Eur. Polym. J. 2011, 47, 1746–1755. [Google Scholar] [CrossRef]
  12. Schieppati, J.; Schrittesser, B.; Wondracek, A.; Robin, S.; Holzner, A.; Pinter, G. Temperature impact on the mechanical and fatigue behavior of a non-crystallizing rubber. Int. J. Fatigue 2021, 144, 106050. [Google Scholar] [CrossRef]
  13. He, S.; Hu, J.; Zhang, C.; Wang, J.; Chen, L.; Bian, X.; Lin, J.; Du, X. Performance improvement in nano-alumina filled silicone rubber composites by using vinyl tri-methoxysilane. Polym. Test. 2018, 67, 295–301. [Google Scholar] [CrossRef]
  14. Santos, R.J.; Hiranobe, C.T.; Dognani, G.; Silva, M.J.; Paim, L.L.; Cabrera, F.C.; Torres, G.B.; Job, A.E. Using the Lorenz–Park, Mooney–Rivlin, and dynamic mechanical analysis relationship on natural rubber/leather shavings composites. J. Appl. Polym. Sci. 2022, 139, 51880. [Google Scholar] [CrossRef]
  15. Al-HarbI, F.A.; Abdel-Halim, M.S.; Gad, M.M.; Fouda, S.M.; Baba, N.Z.; AlRumaih, H.S.; Akhtar, S. Effect of nanodiamond addition on flexural strength, impact strength, and surface roughness of PMMA denture base. J. Prosthodont. 2019, 28, e417–e425. [Google Scholar] [CrossRef]
  16. Kaur, J.; Sharma, J.P.; Singh, N.; Pathak, D.; Guleria, N.; Singh, P.K.; Sharma, P.K. Improvement in optical absorption and emission characteristics of polymethyl methacrylate in solution cast polymethyl methacrylate/polyvinyl carbazole polyblends. J. Thermoplast. Compos. Mater. 2023, 36, 3260–3269. [Google Scholar] [CrossRef]
  17. Hayeemasae, N.; Waesateh, K.; Masa, A.; Ismail, H. Halloysite nanotubes filled natural rubber composites: Functionality, crystallinity and thermal studies. J. Eng. Sci. 2019, 15, 1–10. [Google Scholar] [CrossRef]
  18. Rolere, S.; Liengprayoon, S.; Vaysse, L.; Sainte-Beuve, J.; Bonfils, F. Investigating natural rubber composition with Fourier Transform Infrared (FT-IR) spectroscopy: A rapid and non-destructive method to determine both protein and lipid contents simultaneously. Polym. Test. 2015, 43, 83–93. [Google Scholar] [CrossRef]
  19. Nikolaidis, A.K.; Achilias, D.S. Thermal degradation kinetics and viscoelastic behavior of poly (methyl methacrylate)/organomodified montmorillonite nanocomposites prepared via in situ bulk radical polymerization. Polymers 2018, 10, 491. [Google Scholar] [CrossRef]
  20. Kashiwagi, T.; Inaba, A.; Brown, J.E.; Hatada, K.; Kitayama, T.; Masuda, E. Effects of weak linkages on the thermal and oxidative degradation of poly (methyl methacrylates). Macromolecules 1986, 19, 2160–2168. [Google Scholar] [CrossRef]
  21. Sui, G.; Zhong, W.H.; Yang, X.P.; Yu, Y.H.; Zhao, S.H. Preparation and properties of natural rubber composites reinforced with pretreated carbon nanotubes. Polym. Adv. Technol. 2008, 19, 1543–1549. [Google Scholar] [CrossRef]
  22. De Paiva, F.F.G.; de Maria, V.P.K.; Torres, G.B.; Dognani, G.; dos Santos, R.J.; Cabrera, F.C.; Job, A.E. Sugarcane bagasse fiber as semi-reinforcement filler in natural rubber composite sandals. J. Mater. Cycles Waste Manag. 2019, 21, 326–335. [Google Scholar] [CrossRef]
  23. Hiranobe, C.T.; Tolosa, G.R.; Santos, G.T.d.A.; de Oliveira, J.P.J.; Budemberg, E.R.; da Silva, M.J.; Cabrera, F.C.; Job, A.E.; Paim, L.L.; Torres, G.B.; et al. Recycling waste polyurethane from the refrigeration industry as filler in SBR/NR composites for industrial applications. J. Appl. Polym. Sci. 2023, 140, e53709. [Google Scholar] [CrossRef]
  24. Okafor, C.E.; Okpe, D.U.; Ani, O.I.; Okonkwo, U.C. Development of carbonized wood/silicon dioxide composite tailored for single-density shoe sole manufacturing. Mater. Today Commun. 2022, 32, 104184. [Google Scholar] [CrossRef]
  25. ASTM D3182-21a; Standard Practice for Rubber—Materials, Equipment, and Procedures for Mixing Standard Compounds and Preparing Standard Vulcanized Sheets. ASTM: West Conshohocken, PA, USA, 2021.
  26. ASTM D2084-19a; Standard Test Method for Rubber Property—Vulcanization Using Oscillating Disk Cure Meter. ASTM: West Conshohocken, PA, USA, 2019.
  27. Lee, B.L. Reinforcement of uncured and cured rubber composites and its relationship to dispersive mixing—An interpretation of cure meter rheographs of carbon black loaded SBR and cis-polybutadiene compounds. Rubber Chem. Technol. 1979, 52, 1019–1029. [Google Scholar] [CrossRef]
  28. ASTM D297-21; Standard Test Methods for Rubber Products—Chemical Analysis. ASTM: West Conshohocken, PA, USA, 2022.
  29. Flory, J.; Rehner, J. Statistical mechanics of cross-linked polymer networks I. Rubberlike elasticity. J. Chem. Phys. 1943, 11, 512–520. [Google Scholar] [CrossRef]
  30. Mooney, M. A theory of large elastic deformation. J. Appl. Phys. 1940, 11, 582–592. [Google Scholar] [CrossRef]
  31. Gruendken, M.; Koda, D.; Dryzek, J.; Blume, A. Low molecular weight ‘liquid’ polymer extended compounds, impact on free volume and crosslink density studied by positron lifetime spectroscopy and stress-strain analysis according to Mooney-Rivlin. Polym. Test. 2021, 100, 107239. [Google Scholar] [CrossRef]
  32. Sombatsompop, N. Practical use of the Mooney-Rivlin equation for determination of degree of crosslinking of swollen nr vulcanisates. J. Sci. Soc. Thail. 1998, 24, 199–204. [Google Scholar] [CrossRef]
  33. ASTM D412-16; Standard Test Methods for Vulcanized Rubber and Thermoplastic Elastomers—Tension. ASTM: West Conshohocken, PA, USA, 2021.
  34. ASTM D624-00; Standard Test Method for Tear Strength of Conventional Vulcanized Rubber and Thermoplastic Elastomers. ASTM: West Conshohocken, PA, USA, 2020.
  35. ASTM D2240-15; Standard Test Method for Rubber Property—Durometer Hardness. ASTM: West Conshohocken, PA, USA, 2021.
  36. ASTM D5963-22; Standard Test Method for Rubber Property—Abrasion Resistance (Rotary Drum Abrader). ASTM: West Conshohocken, PA, USA, 2019.
  37. Lorenz, O.; Park, C.R. The crosslinking efficiency of some vulcanizing agents in natural rubber. J. Polym. Sci. 1961, 50, 299–312. [Google Scholar] [CrossRef]
  38. ASTM D6370-99; Standard Test Method for Rubber—Compositional Analysis by Thermogravimetry (TGA). ASTM: West Conshohocken, PA, USA, 2019.
Figure 1. Degree of OLW filler dispersion in the NR matrix.
Recycling 10 00090 g001
Figure 2. (a) Photographic image of the ophthalmic lens residue; SEM images at a scale of 10 µm and magnification of 1.0 K× (b) of the ophthalmic lens residue; fracture regions of the test specimens from the tensile strength test of the BN composites containing (c) 0 phr, (d) 10 phr, (e) 20 phr, (f) 30 phr, (g) 40 phr, and (h) 50 phr of lens residue.
Recycling 10 00090 g002
Figure 3. Density, hardness, and abrasion loss curves of NR/OLW composites.
Recycling 10 00090 g003
Figure 4. Tensile stress profiles of NR/OLW composites.
Recycling 10 00090 g004
Figure 5. Tear strength profiles of NR/OLW composites.
Recycling 10 00090 g005
Figure 6. Graph of σ/(λ − λ−2) against λ−1 for NR/OLW composites with (a) 0 phr, (b) 10 phr, (c) 20 phr, (d) 30 phr, (e) 40 phr, and (f) 50 phr.
Recycling 10 00090 g006
Figure 7. Relationship between Qf/Qg and e−Z for NR/OLW composites and unfilled gum used as reference.
Recycling 10 00090 g007
Figure 8. Effect of filler on Qf/Qg of NR/OLW composites and pure gum as reference.
Recycling 10 00090 g008
Figure 9. FTIR spectra of ophthalmic lens residue and NR/OLW composites.
Recycling 10 00090 g009
Figure 10. (a) TG curves of NR/OLW composites and (b) DTG curves of NR/OLW composites.
Recycling 10 00090 g010
Figure 11. (a) Curves of storage modulus (E’) and (b) curves of tan delta (tan δ) for the NR/OLW composites.
Recycling 10 00090 g011
Figure 12. Prototype of flip-flop sole produced with ophthalmic lens waste, with views: (a) top view of the smooth sole, (b) bottom view of the sole with grooves, (c) smooth upper block, (d) lower block with grooves, and (e) enlarged bottom view of the flip-flop sole with grooves.
Recycling 10 00090 g012
Table 1. Rheological parameters of the natural rubber composite with ophthalmic lens waste.
Composites NR/OLWML (dNm)MH (dNm)ΔM = (MH − ML) (dNm)ts (min)t90 (min)
0 phr3.4227.4824.071.702.71
10 phr2.5129.6927.091.592.52
20 phr3.8130.8227.001.262.32
30 phr3.9033.1929.291.302.34
40 phr3.3037.0333.731.382.38
50 phr4.8738.2233.351.462.57
Table 2. Values of tensile strength test results for NR/OLW composites.
CompositesM 100% (MPa)M 300% (MPa)Stress at Rupture (Mpa)Strain at Rupture (%)
NR/OLW00.451.0112.58 ± 0.811149.86 ± 53.28
NR/OLW100.992.4113.81 ± 0.93849.36 ± 57.43
NR/OLW200.921.9911.33 ± 0.67854.72 ± 22.60
NR/OLW300.992.038.80 ± 1.70738.60 ± 47.89
NR/OLW401.012.258.24 ± 0.71698.67 ± 40.92
NR/OLW501.362.566.24 ± 0.99607.21 ± 31.65
Table 3. Crosslink density determination through swelling—Flory–Rehner approach.
CompositesFlory–Rehner
ν × 10−4 (mol·cm−3)
NR/OLW01.91
NR/OLW101.91
NR/OLW201.93
NR/OLW301.94
NR/OLW402.18
NR/OLW502.24
Table 4. Crosslink density determined using the Mooney–Rivlin approach.
CompositesMooney–Rivlin
η ∗ 10−4 (mol·cm−3)C1C2
NR/OLW02.310.430.14
NR/OLW105.670.880.52
NR/OLW206.090.630.88
NR/OLW307.330.511.30
NR/OLW409.880.501.95
NR/OLW5011.810.342.58
Table 5. Thermogravimetric degradation events of the composites.
MaterialDegradation EventTemperature (°C)Mass Loss (%)Residual Mass (%)Observations
OLW (PMMA)Phase 1 (H–H bonds)~1700.85-Degradation of weak H–H bonds in PMMA.
Phase 2 (Depolymerization)~36577.62-Degradation of the vinyl group.
Phase 3 (Oligomers)~44020.680.85Degradation of oligomers; inorganic residue (SiO2, Bi, Sn, etc.).
NR pure (0 phr OLW)Degradation of organic compounds~365~93.466.54Degradation of isoprene; inorganic residue (vulcanization ingredients).
NR/OLW (10–50 phr)single degradation event~365Varies with %OLW-Similar behavior to pure NR, but with a tendency toward lower thermal stability.
Table 6. Preparation of natural rubber composites using ophthalmic lens waste.
Constituent ElementsConstituents in Parts per Hundred Rubber
NR/OLW0NR/OLW10NR/OLW20NR/OLW30NR/OLW40NR/OLW50
NR SVR CV60100100100100100100
Zinc oxide444444
Stearic acid222222
PEG 4000333333
Chartwell®222222
Naphthenic oil555555
Ophthalmic lens waste01020304050
Sulfur1.81.81.81.81.81.8
MBTS accelerator1.21.21.21.21.21.2
TMTD accelerator0.80.80.80.80.80.8
Total119.8129.8139.8149.8159.8169.8
NR/OLW (natural rubber composite and ophthalmic lens waste).
Disclaimer/Publisher’s Note: The statements, opinions and data contained in all publications are solely those of the individual author(s) and contributor(s) and not of MDPI and/or the editor(s). MDPI and/or the editor(s) disclaim responsibility for any injury to people or property resulting from any ideas, methods, instructions or products referred to in the content.

