Article

Thermal and Mechanical Safety Assessment of Type 21700 Lithium-Ion Batteries with NMC, NCA and LFP Cathodes–Investigation of Cell Abuse by Means of Accelerating Rate Calorimetry (ARC)

1
Karlsruhe Institute of Technology (KIT), Institute for Applied Materials-Applied Materials Physics (IAM-AWP), Hermann-von-Helmholtz-Platz 1, 76344 Eggenstein-Leopoldshafen, Germany
2
Department of Physics, Engineering Physics & Astronomy, Queen’s University, 64 Bader Lane, Kingston, ON K7L 3N6, Canada
*
Authors to whom correspondence should be addressed.
Batteries 2023, 9(5), 237; https://doi.org/10.3390/batteries9050237
Submission received: 13 March 2023 / Revised: 6 April 2023 / Accepted: 18 April 2023 / Published: 22 April 2023
(This article belongs to the Special Issue Materials Design for Electrochemical Energy Storage)

Abstract

:
In this experimental investigation, we studied the safety and thermal runaway behavior of commercial lithium-ion batteries of type 21700. The different cathode materials NMC, NCA and LFP were compared, as well as high power and high energy cells. After characterization of all relevant components of the batteries to assure comparability, two abuse methods were applied: thermal abuse by the heat-wait-seek test and mechanical abuse by nail penetration, both in an accelerating rate calorimeter. Several critical temperatures and temperature rates, as well as exothermal data, were determined. Furthermore, the grade of destruction, mass loss and, for the thermal abuse scenario, activation energy and enthalpy, were calculated for critical points. It was found that NMC cells reacted first, but NCA cells went into thermal runaway a little earlier than NMC cells. LFP cells reacted, as expected, more slowly and at significantly higher temperatures, making the cell chemistry considerably safer. For mechanical abuse, no thermal runaway was observed for LFP cells, as well as at state of charge (SOC) zero for the other chemistries tested. For thermal abuse, at SOC 0 and SOC 30 for LFP cells and at SOC 0 for the other cell chemistries, no thermal runaway occurred until 350 °C. In this study, the experimental data are provided for further simulation approaches and system safety design.

Graphical Abstract

1. Introduction

Sophisticated research on the safety of lithium-ion batteries (LIB) is an important challenge as these batteries are both currently in further development and already in wide-range use for customers in a variety of sectors and applications in everyday life. As well as the use in devices that improve day-to-day life, innovation in LIB to advance electric vehicles and grid storage systems is crucial to fight climate change and to contribute significantly to the energy transition. Thus, immediate progress is needed, as climate change is progressing towards a climate crisis worldwide.
Accelerating rate calorimetry (ARC) has been used to study thermal runaway and thermal abuse behavior [1,2]. Other laboratories are specialized for gaining similar understanding from thermal abuse experiments conducted in ovens or autoclaves instead of using calorimeters [3]. It must be pointed out that both oven and ARC tests have benefits and disadvantages and each method enables different types of learning. Based on the specific scientific question, the appropriate technique should be chosen [4].
The comparison of thermal behavior of different battery chemistries, such as LCO, LMO, NMC, NCA and LFP is widely covered in the literature e.g., [5]. Nowadays, the most prominent LIB chemistry is NMC, together with NCA, whereas LFP cells are less common but have become more relevant recently due to their superior safety [6].
Different LIB cell formats, such as cylindrical, prismatic and pouch, have been compared in terms of safety in [7]. While pouch cells are mostly used in consumer electronics, they can also be found in electric vehicles [8]. Prismatic cells are mostly used for electrical propulsion and for grid and home storage systems [9]. Cylindrical cells have amongst the largest range of applications, ranging from consumer electronics and power tools to electric cars and energy storage systems [10].
Considering cylindrical cells, the most prominent cell size is 18650. The safety behavior of this cell has, for example, been studied in [10]. However, the cell size 21700 is becoming more and more prominent and is either replacing or complementing 18650 cells, both for electric vehicles and consumer goods. The safety of type 21700 cells was investigated in [11]. The production of larger cylindrical cells, such as 26650 and 46800, is increasing and it has been announced they are to be used in several products, which shows that bigger cylindrical cells will play a relevant role in the near future [12].
The events leading to thermal runaway and details of the cascade of reactions involved is described for NMC/NCA cells in [13] and for LFP cells in [4]. The thermal behavior of separate components of LIB, such as the electrolyte and separator, were studied by use of differential scanning calorimetry (DSC) in [14]. The fire behavior of batteries in an open system and additionally for battery packs, full battery systems and electric vehicles was studied in [7].
Thermal runaway behavior is impacted by cell chemistry and size as well as the SOC of cells, as evaluated in [15], and by cell aging, as reported in [16].
We have identified the following areas where there is a lack of knowledge and where there has been limited experimental work, which will be the focus of this study:
  • Data for cylindrical cells larger than 18650, especially type 21700 cells;
  • Results of mechanical abuse testing of cells, such as nail testing;
  • Comparison of safety for several states of charge, including lower and medium states of charge for both thermal and mechanical abuse scenarios;
  • Direct comparison between high power and high energy cells, considering the impact of the different construction of these cells on abuse behavior;
  • Safety and abuse study, coupled with profound material science investigation, into the components and structure of the cells using advanced analytical techniques.

2. Materials and Methods

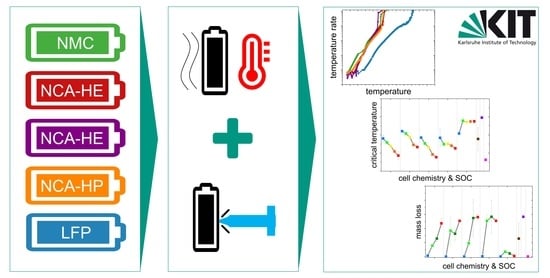
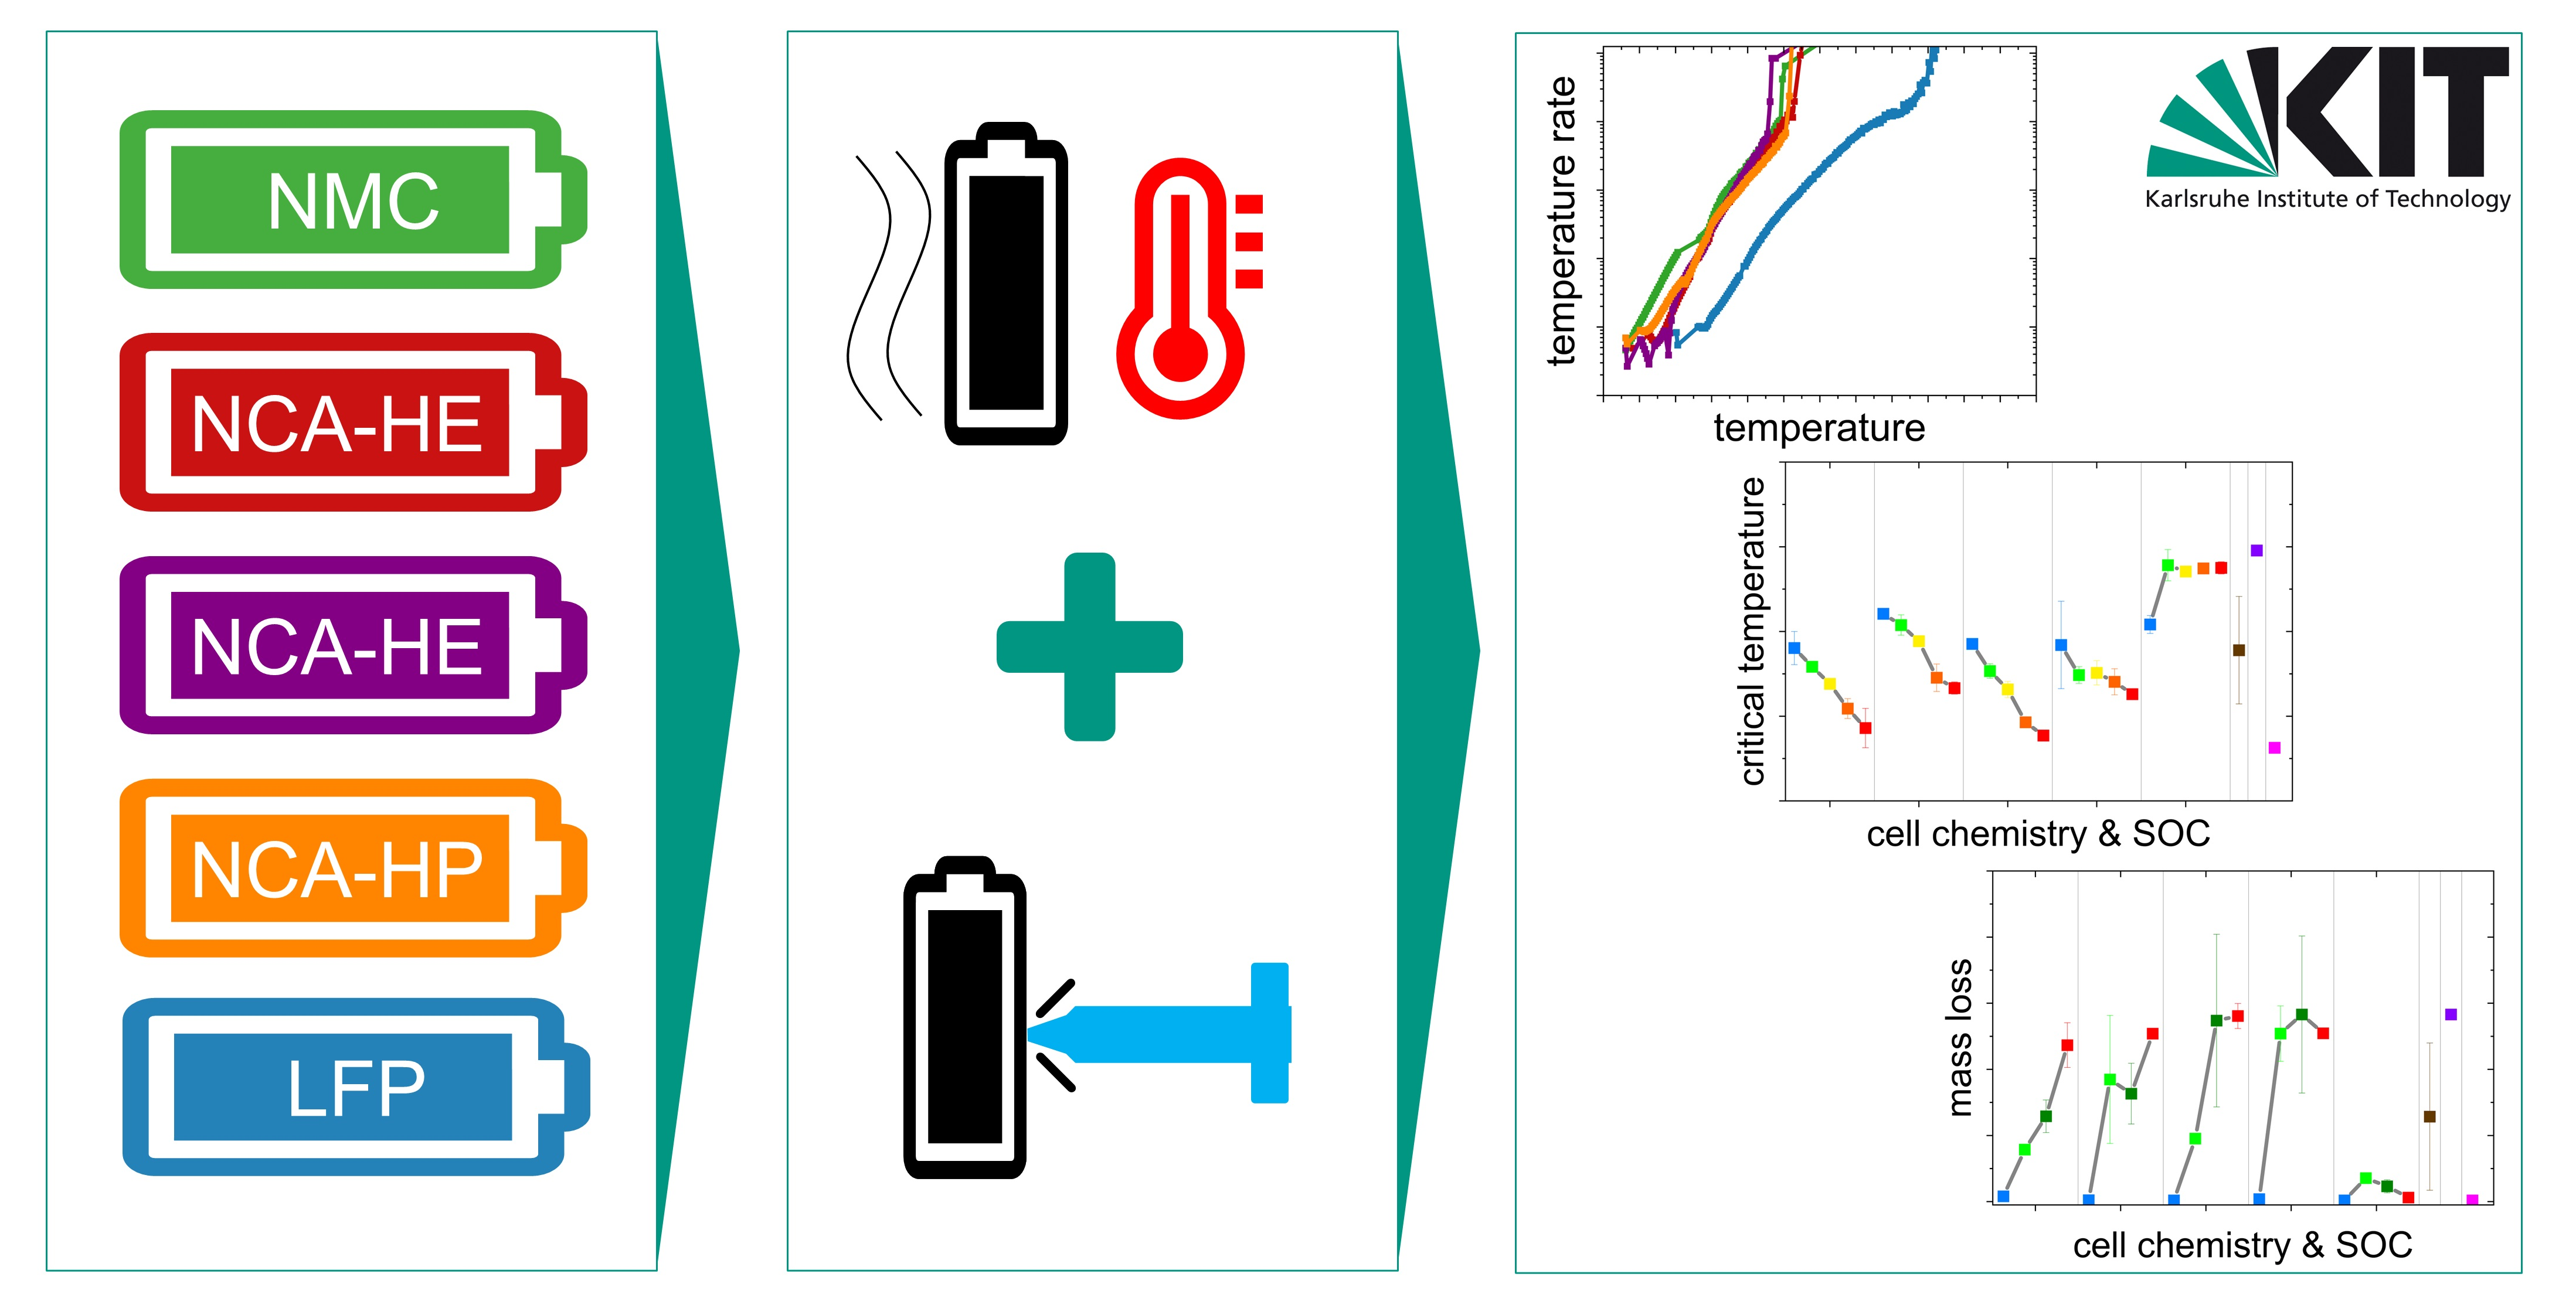
For this investigation, commercial type 21700 lithium-ion cells with different cell chemistries and for high-energy (HE) and high-power (HP) cell designs were acquired from five different manufacturers. The cylindrical cells each had a diameter of 21 mm and a height of 70 mm and were intended for industrial applications, being sold in bulk packs after formation ready to use. The main differences in the cells were the cathode material and the cell design for high-energy or high-power applications. In this article, batteries with an NMC cathode are referred to as NMC cells or with NMC chemistry for all described effects and phenomena, both for anode and cathode processes, to facilitate identification and reading.
Characterizations of the full cells were performed by capacity measurement and by computed tomography scanning. After disassembly, the electrodes were analyzed by means of inductively coupled plasma optical emission spectroscopy (ICP-OES), carrier gas hot extraction (CGHE), carbon sulfur analysis (CS), digital and scanning electron microscopy (SEM), as well as gas chromatography coupled with mass spectroscopy (GC-MS). Each technique and the parameters are described in the following sections.
The main experiment consisted of thermal and mechanical abuse experiments at different states of charge of the cells in order to compare the performance of different chemistries and cell designs, as well as the impact of the state of charge.

2.1. Electrical Characterization

To determine the capacity a Biologic BCS 815-128 system was used. All cells were tested using a standardized test program at an isothermal temperature of 25 °C in an incubator. Therefore, the cells with condition at delivery after formation and a state of charge (SOC) of about 30, were discharged to SOC 0 and subsequently fully charged with constant current (CC) and constant voltage (CV), followed by a full discharge with constant current (CC) and another CC-CV charge and CC discharge. All charging heretofore was performed with a C rate of C/3. With the second full discharge, the capacity value was determined. All values were compared between at least 160 cells that were acquired per type, and capacity was averaged over all acquired cells per type. The cells were stored at SOC 30. Shortly before each abuse experiment, cells were discharged to SOC 0 and then charged to the scheduled SOC for SOC 100 with CC-CV and for all other SOC levels with a time-limited CC charging protocol.

2.2. Elemental Composition Analysis

For the different analytical investigations, all cells were discharged to SOC 0 and subsequently opened in a glovebox under argon atmosphere. The cell casing was removed without damaging the active material; this was followed by unrolling of the electrodes and division of each electrode into pieces. The pieces were cleaned of electrolyte and LiPF6 remains by three washings with dimethyl carbonate (DMC) on each side of the active material, inside the glovebox. The process was followed by an evaporation phase of the DMC under vacuum for 12 h. The samples were stored and transported under argon atmosphere in sealed films.
Elemental composition analysis was carried out by ICP-OES with an iCAP 7600DUO from Thermo Fisher Scientific. Oxygen content was obtained by CGHE on a Bruker AXS G8 Galileo instrument and carbon content with a CS analyzer LECO CS600, all three methods were validated with internal standards. For the analysis, three samples were used to obtain the metal, oxygen and carbon content of the anode and cathode, respectively. Consequently, per cell, nine sections of each electrode were analyzed.

2.3. Microscopy Characterization

A Keyence VHX 7000 digital light microscope, placed inside a glovebox with argon atmosphere, was used to analyze the anodes and cathodes for two cells of each type. The cells were disassembled, and the electrodes were unwound and cut to provide 7 cm by 7 cm samples for analysis; magnifications of up to 5000× were used.
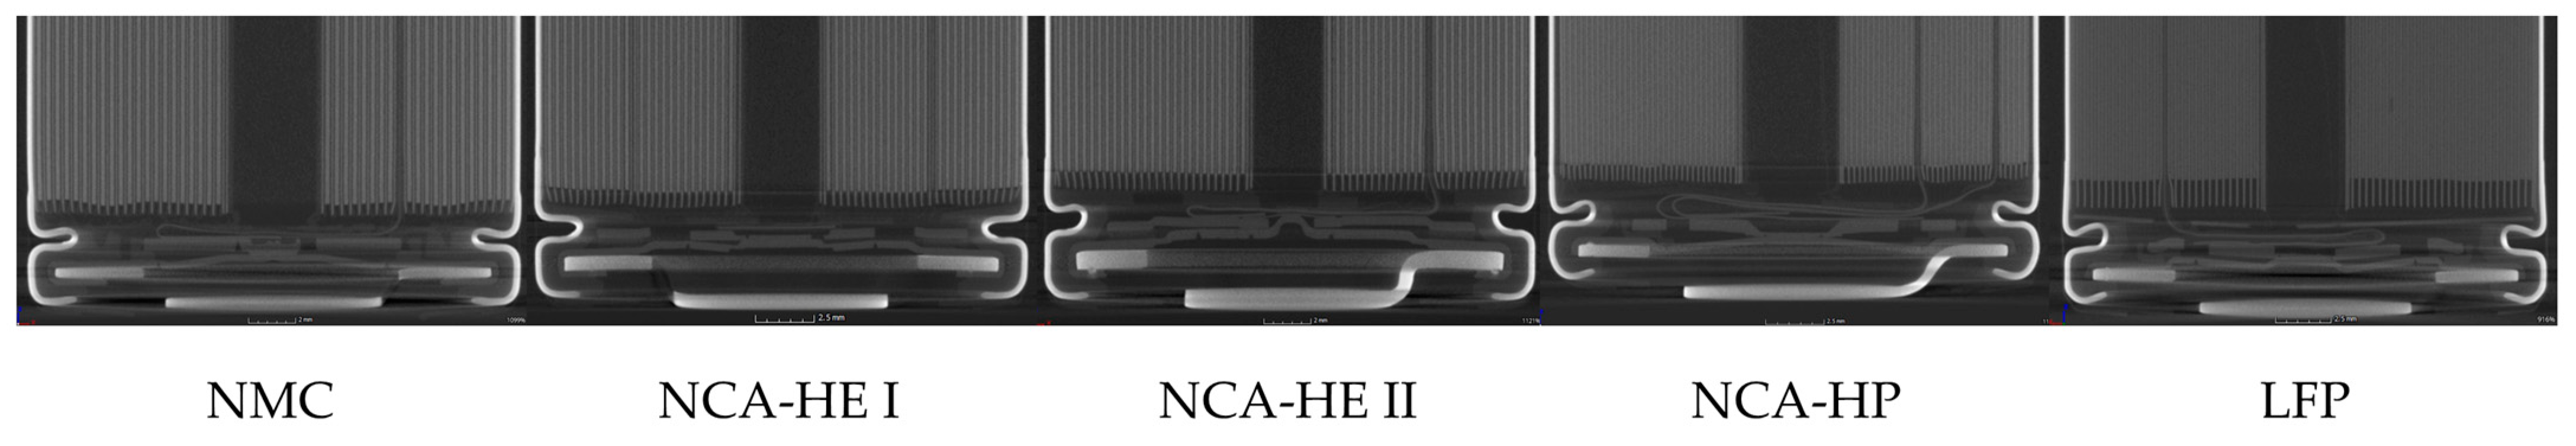
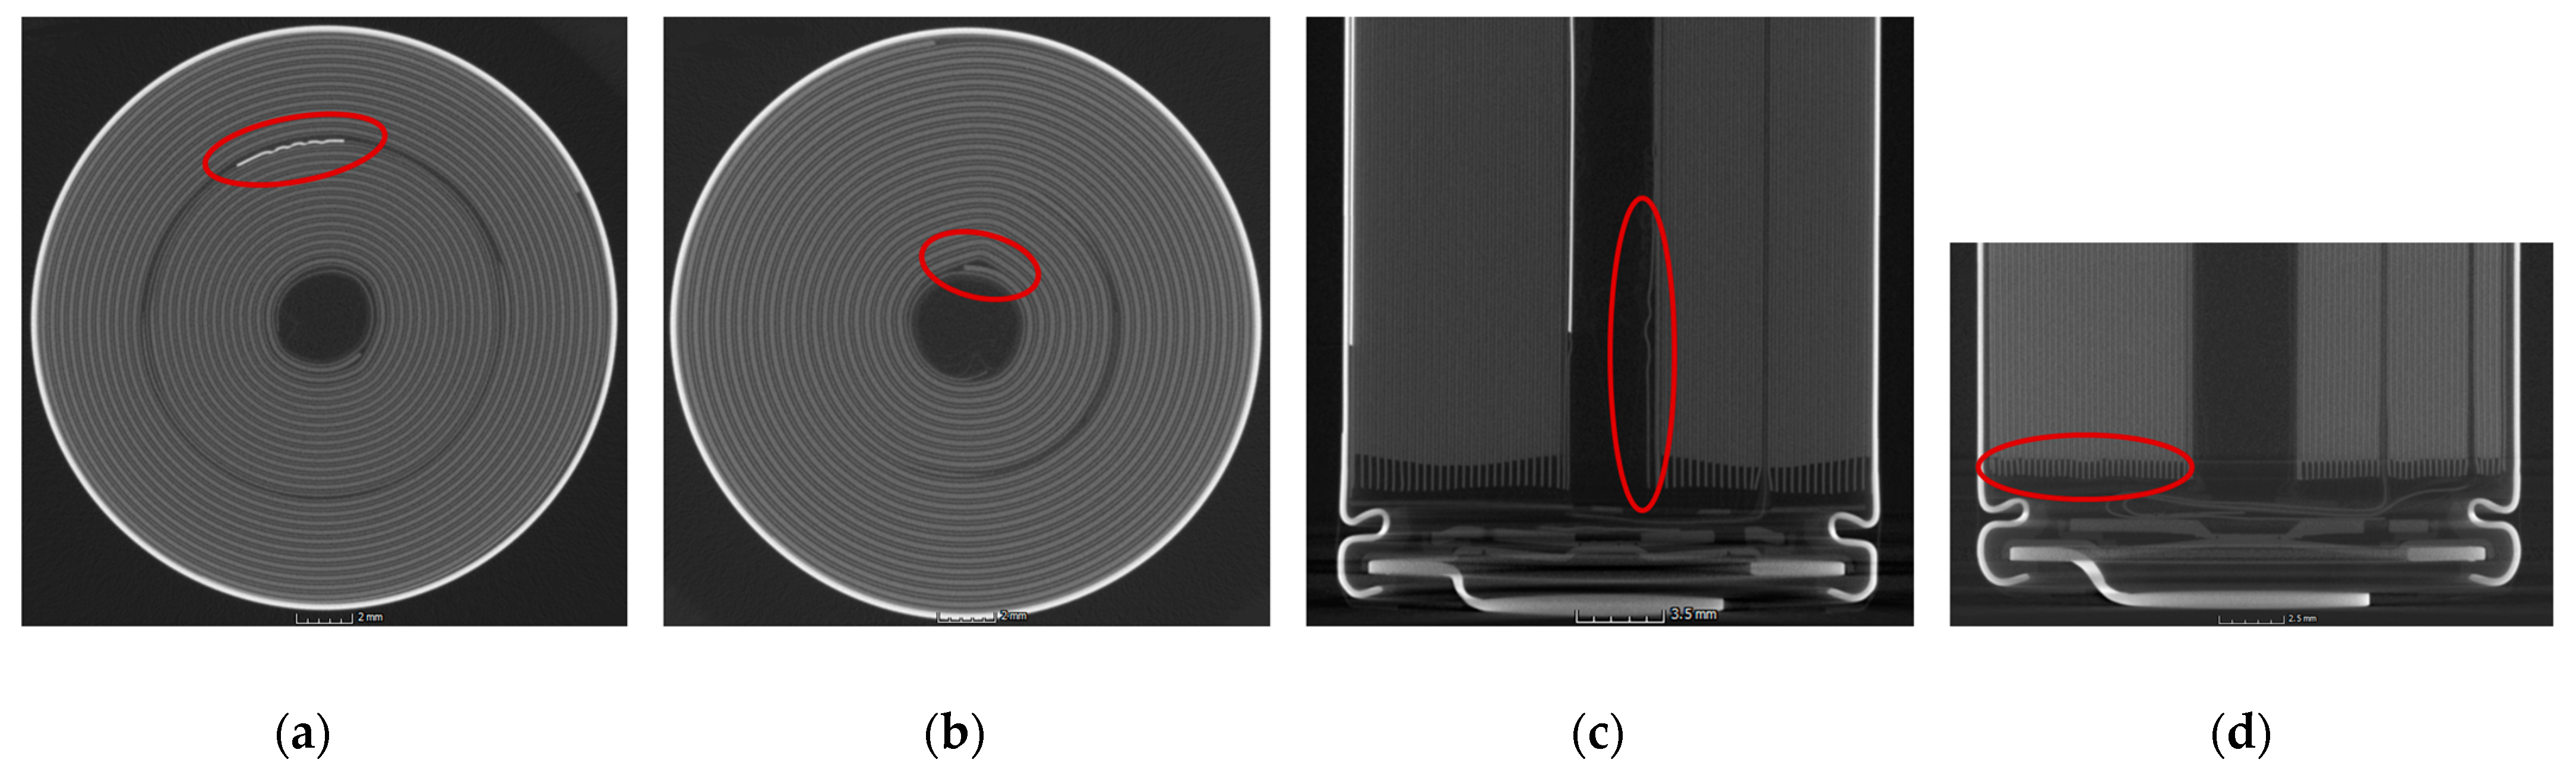
2.4. CT Analysis

The CT system used was a Phoenix v|tome|x s 240, with voltage set to 180 kV, a current of 170 µA and 1600 single images per scan, and a voxel size for x and y of 0.031 mm. CT scans were obtained for two samples of each cell type. All cells were charged to SOC 30 and with an SEI layer already formed at the time of scanning. myVGL software was used to overlay the cross-sectional images from the scans at varying depths of the material so that the resulting three-dimensional representation of the cell could be analyzed. It was possible to distinguish between features in the cells due to variations in the atomic numbers of the different materials and corresponding brightness in the scan. For each scan, the anode, cathode, positive tab, negative tab, and casing thicknesses were measured, along with the size of the cavity at the jelly roll center. Additionally, any irregularities, manufacturing defects, and variations in safety devices were captured and recorded.

2.5. Further Components Analysis

To determine the electrolyte composition, cells were opened under argon atmosphere in a glovebox and placed within a sealed plastic tube in a centrifuge to extract electrolyte from the cell. The recovered liquid was then analyzed by means of gas chromatography coupled with mass spectroscopy (GC-MS) using an internal standard for validation with a Clarus 690 Arnel 4019 gas chromatography system by Perkin-Elmer; a similar approach is described in [17].
The separator was identified to be made of polyethylene (PE) by FTIR spectroscopy, performed on a Nicolet™ iS™ 5 FT-IR-spectrometer from Thermo Fisher Scientific. The coating of each separator was found to be made of Al2O3, as determined by energy dispersive X-ray spectroscopy (EDX), using a scanning electron microscope of type Phenom XL by Thermo Fisher Scientific.
From the material safety data sheet (MSDS) of each cell, the conducting salt was identified to be LiPF6 for all cells. The binder used was polyvinylidene fluoride (PVDF) for the cathode and styrene butadiene rubber (SBR) for the anode.

2.6. Accelerating Rate Calorimetry

2.6.1. Calorimeters for Abuse Testing

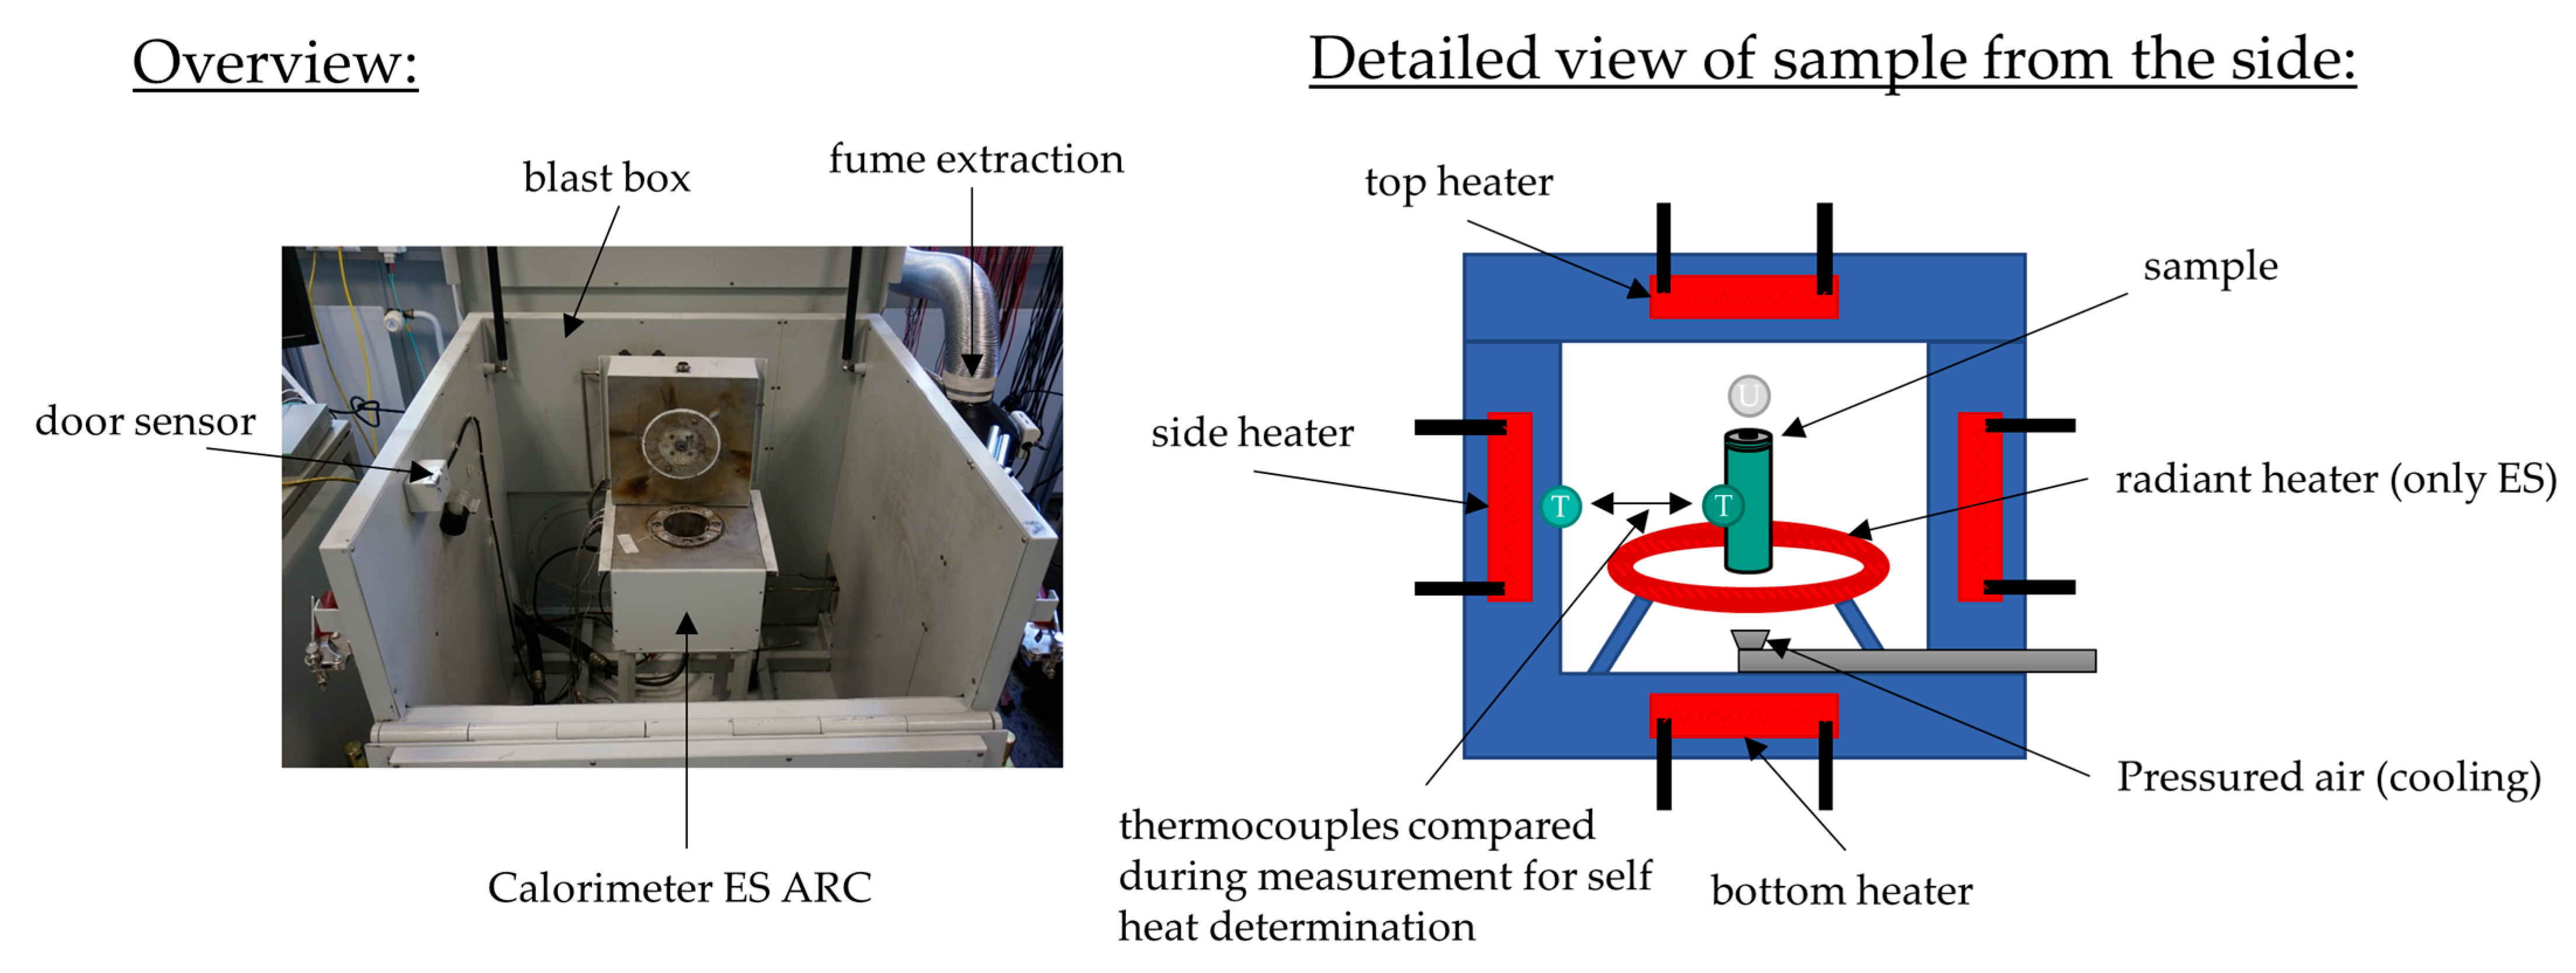
Accelerating rate calorimeters (ARCs) were originally built for the testing of explosives and have been adapted for battery abuse tests. They are equipped with safety systems and are built to withstand battery fire and explosions. For the experiments in this study, we used calorimeters manufactured by Thermal Hazard Technology (THT). Depending on the cell size and the experiment, different calorimeters were appropriate: for the thermal abuse test on type 21700 cylindrical cells, a small calorimeter with low thermal inertia and a small chamber to capture all thermal effects and temperature rates precisely was ideal; therefore, the type ES ARC was used (shown in Figure 1), which was able to track the experiment with a sensitivity of up to 0.005 °C/min. For the mechanical abuse test, a larger calorimeter was required to accommodate the set-up. Therefore, the EV+ ARC was utilized (shown in Figure 3b). It had a larger experimental chamber and all controls for the nail penetration device. For the EV+ ARC, the sensitivity was 0.02 °C/min.
Both ARC models allow tracking of the temperature and temperature rates precisely and can operate in (quasi-)adiabatic mode. This means that the cell ideally cannot transfer heat to the walls of the calorimeter chamber, providing a test atmosphere for batteries that represents the worst case and is consequently ideal for safety assessment.
The ARC was calibrated following the recommendations of the manufacturer and using the calibration mode. As recommended by the manufacturer, a dummy made of aluminum with the same thermocouple set-up was used for the experiments and the heating parameters were calibrated up to 350 °C. The heat capacity of this dummy was comparable to that of the battery. For aluminum, it was given at 298 K with 0.89 J/g·K in [18]; for the batteries, it was given at between 0.83 and 1.26 J/g·K as described in chapter 3.5.1. During calibration, the power settings for the heaters were optimized for uniform heating, and the self-heating or self-cooling from temperature gradients or thermal stabilizing of the system was recorded. This assured a correct determination of the self-heating rate during the actual test. Subsequently, using a so-called drift check, the calibration was validated. This test consisted of a heat-wait-seek test until 350 °C and was passed when the self-heating and self-cooling of the dummy was below 0.02 °C/min. When the thermocouple had to be replaced, a new calibration and drift check was performed.

2.6.2. Thermocouples and Uncertainty Estimation

All abuse tests were performed with two types of thermocouples by Omega with the following specifications. The so-called bomb thermocouple, which controlled the experiment and was placed on the center of the side of the battery, was always a type N thermocouple. The auxiliary thermocouples to obtain temperature information at other cell areas were of type K.
The following measurement-induced uncertainties were identified: A temperature measurement uncertainty could be induced depending on the thermocouples and their accuracy, which is given in Table 1. In addition, as the heating step size was 5 K, the onset temperature could be overshot by heating by a maximum of 4.9 K in the worst case. The lowest data recording rate was 0.05 min; therefore, effects faster than this could not be captured. Delayed exothermal behavior, after the waiting time of 15–20 min, was also only found during the next seek phase in the worst case of 4.9 K higher. An uncertainty introduced by the cables for electrical measurement and the thermocouples could be neglected, as the set-up was calibrated with thermocouples and the cables attached and their diameters were small, allowing for no significant heat transfer. The activation energy accuracy depends on the quality of the Arrhenius fit. For enthalpy calculation, uncertainty is introduced by averaging the cp value, by the temperature inaccuracy, and by the uncertainty in mass determination. The cells were weighed before the experiment. Weight changes during the running experiment due to decomposition of the active material and venting could not be measured as the ARC was not a closed system.

2.6.3. Thermal Abuse Test

For the thermal abuse experiments, the so-called heat-wait-seek (HWS) test was used. This test consisted of a heating interval, followed by a waiting and a seeking interval. The first heating interval started after direct heating from the laboratory temperature to 50 °C. The waiting phase enabled thermal equilibrium to be established after each heating step. The seek phase involved comparison of the temperature of two thermocouples, one on the side of the heater and one on the side of the sample, which are shown in Figure 1. When these two thermocouples showed a difference during the seek phase, the heating rate was determined. If it exceeded the threshold set to 0.02 °C/min, self-heating was detected and the system switched to a (quasi-)adiabatic mode, which is called the exotherm mode, preventing heat transfer to the chamber, allowing exothermal reaction of the cell. Thus, the cell was increasingly heating up until thermal runaway occurred or the chemicals for the exothermal reaction were completely consumed. Some events, such as venting or endothermal reactions, might stop the self-heating of the cell, which would then result in another heating phase, until the cell was exothermal again or went to thermal runaway. A more detailed description of this experimental procedure can be found in [19].
The test was stopped at 350 °C, if no thermal runaway was attained before, to prevent damage to the calorimeter. If the cell did not go into runaway by this temperature, it was not expected to do so afterwards. The parameters of each phase of investigation are presented in Table 2.
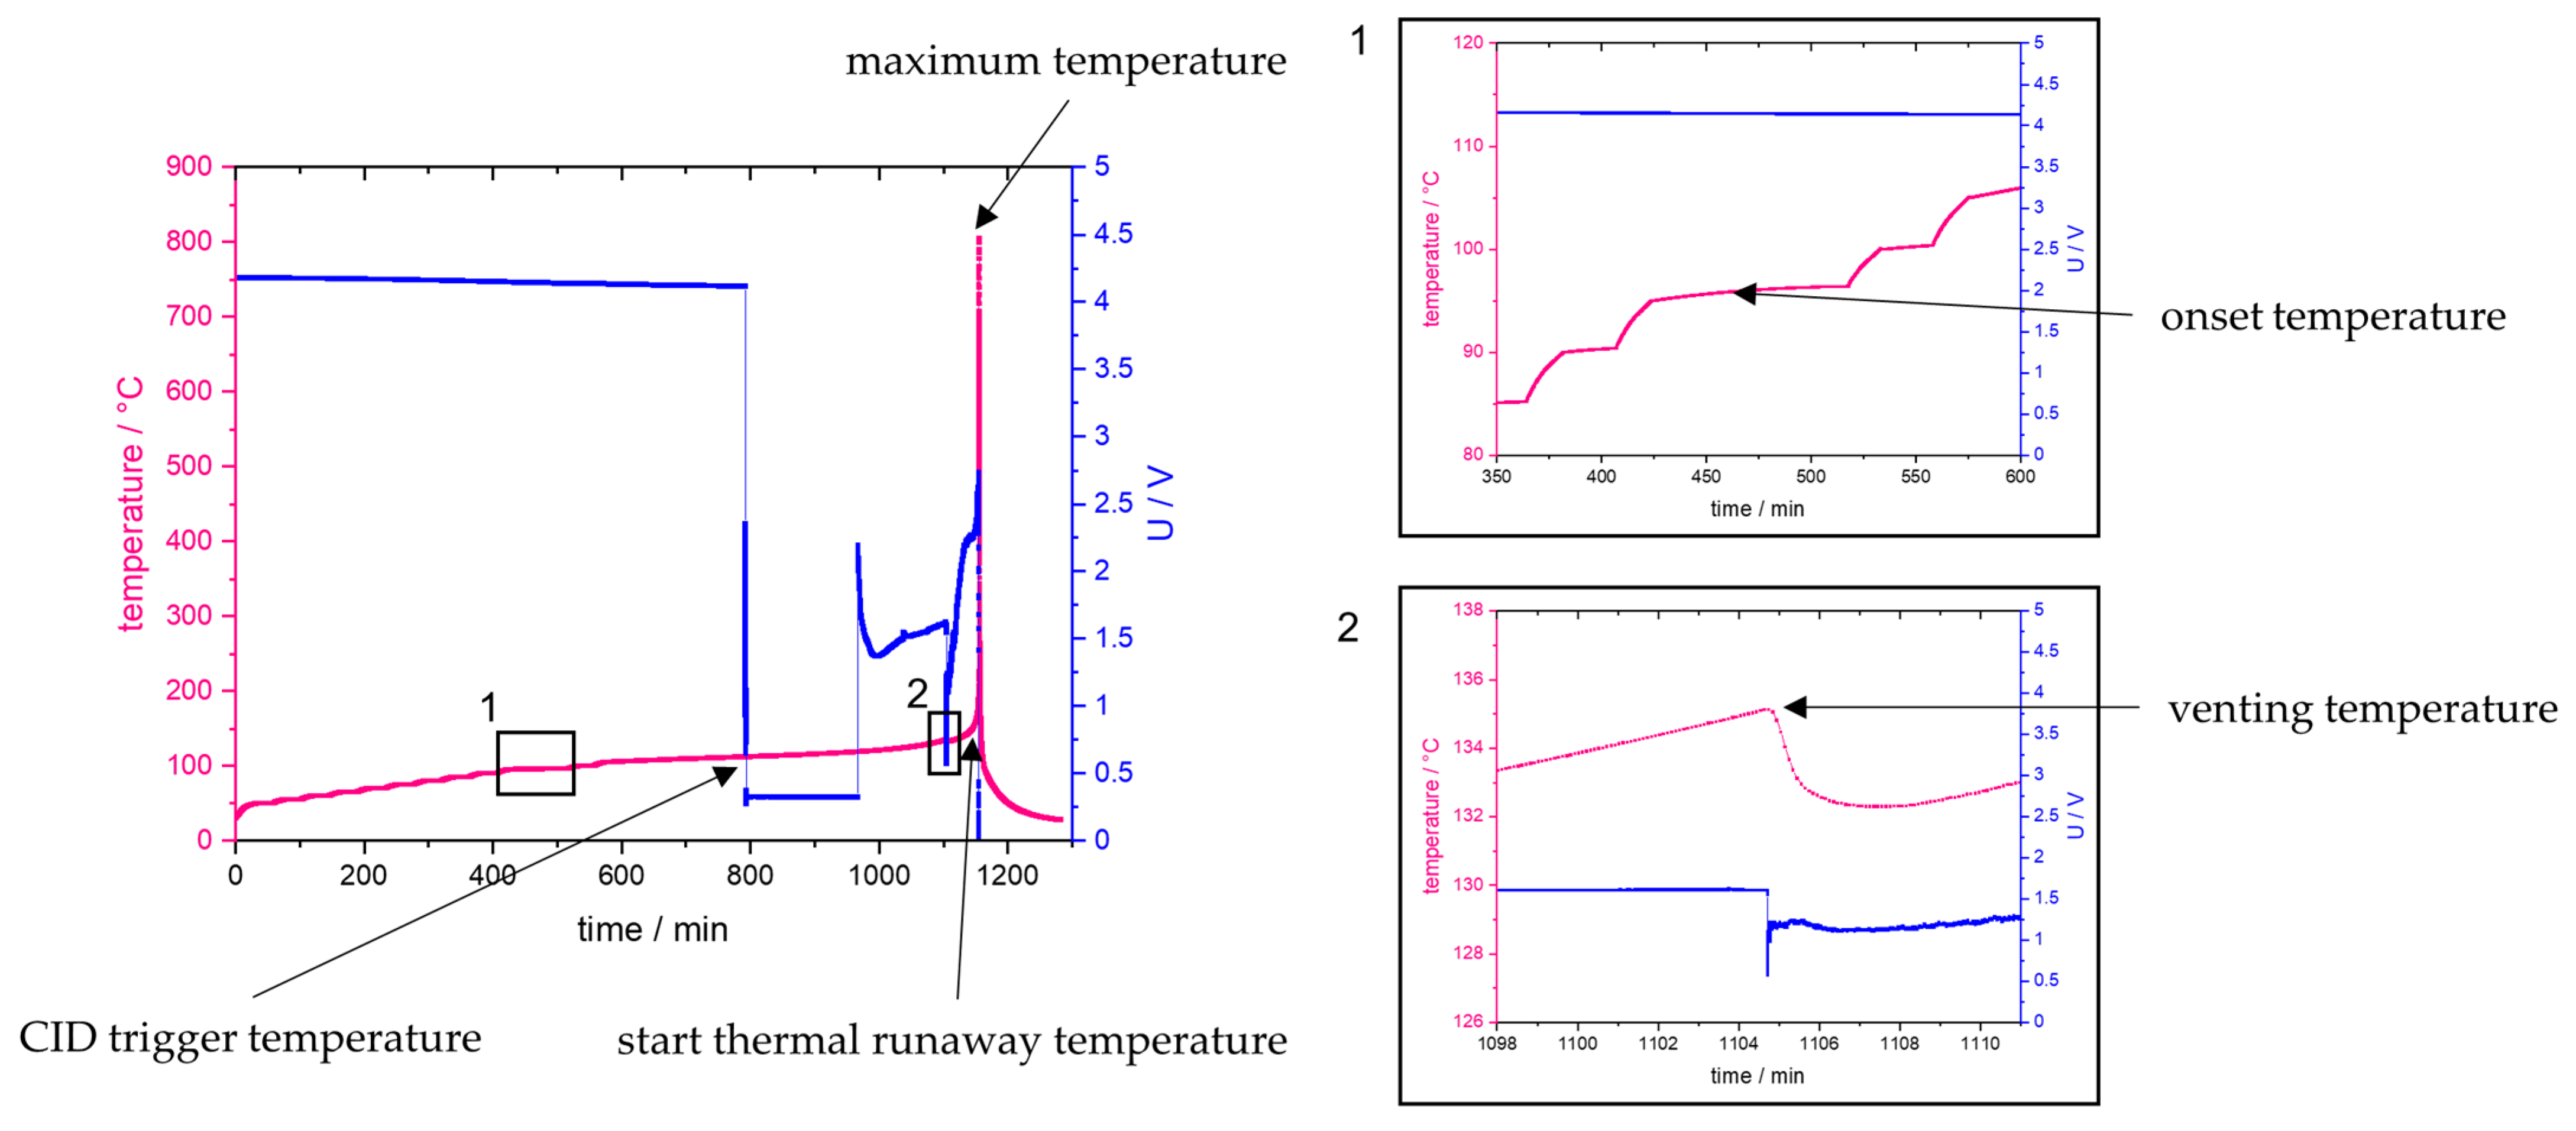
For identification of cell venting, a short decrease in the temperature was looked for in the data files. This occurs due to the Joule–Thomson effect caused during outgassing of the electrolyte, leading to immediate endothermal evaporation.
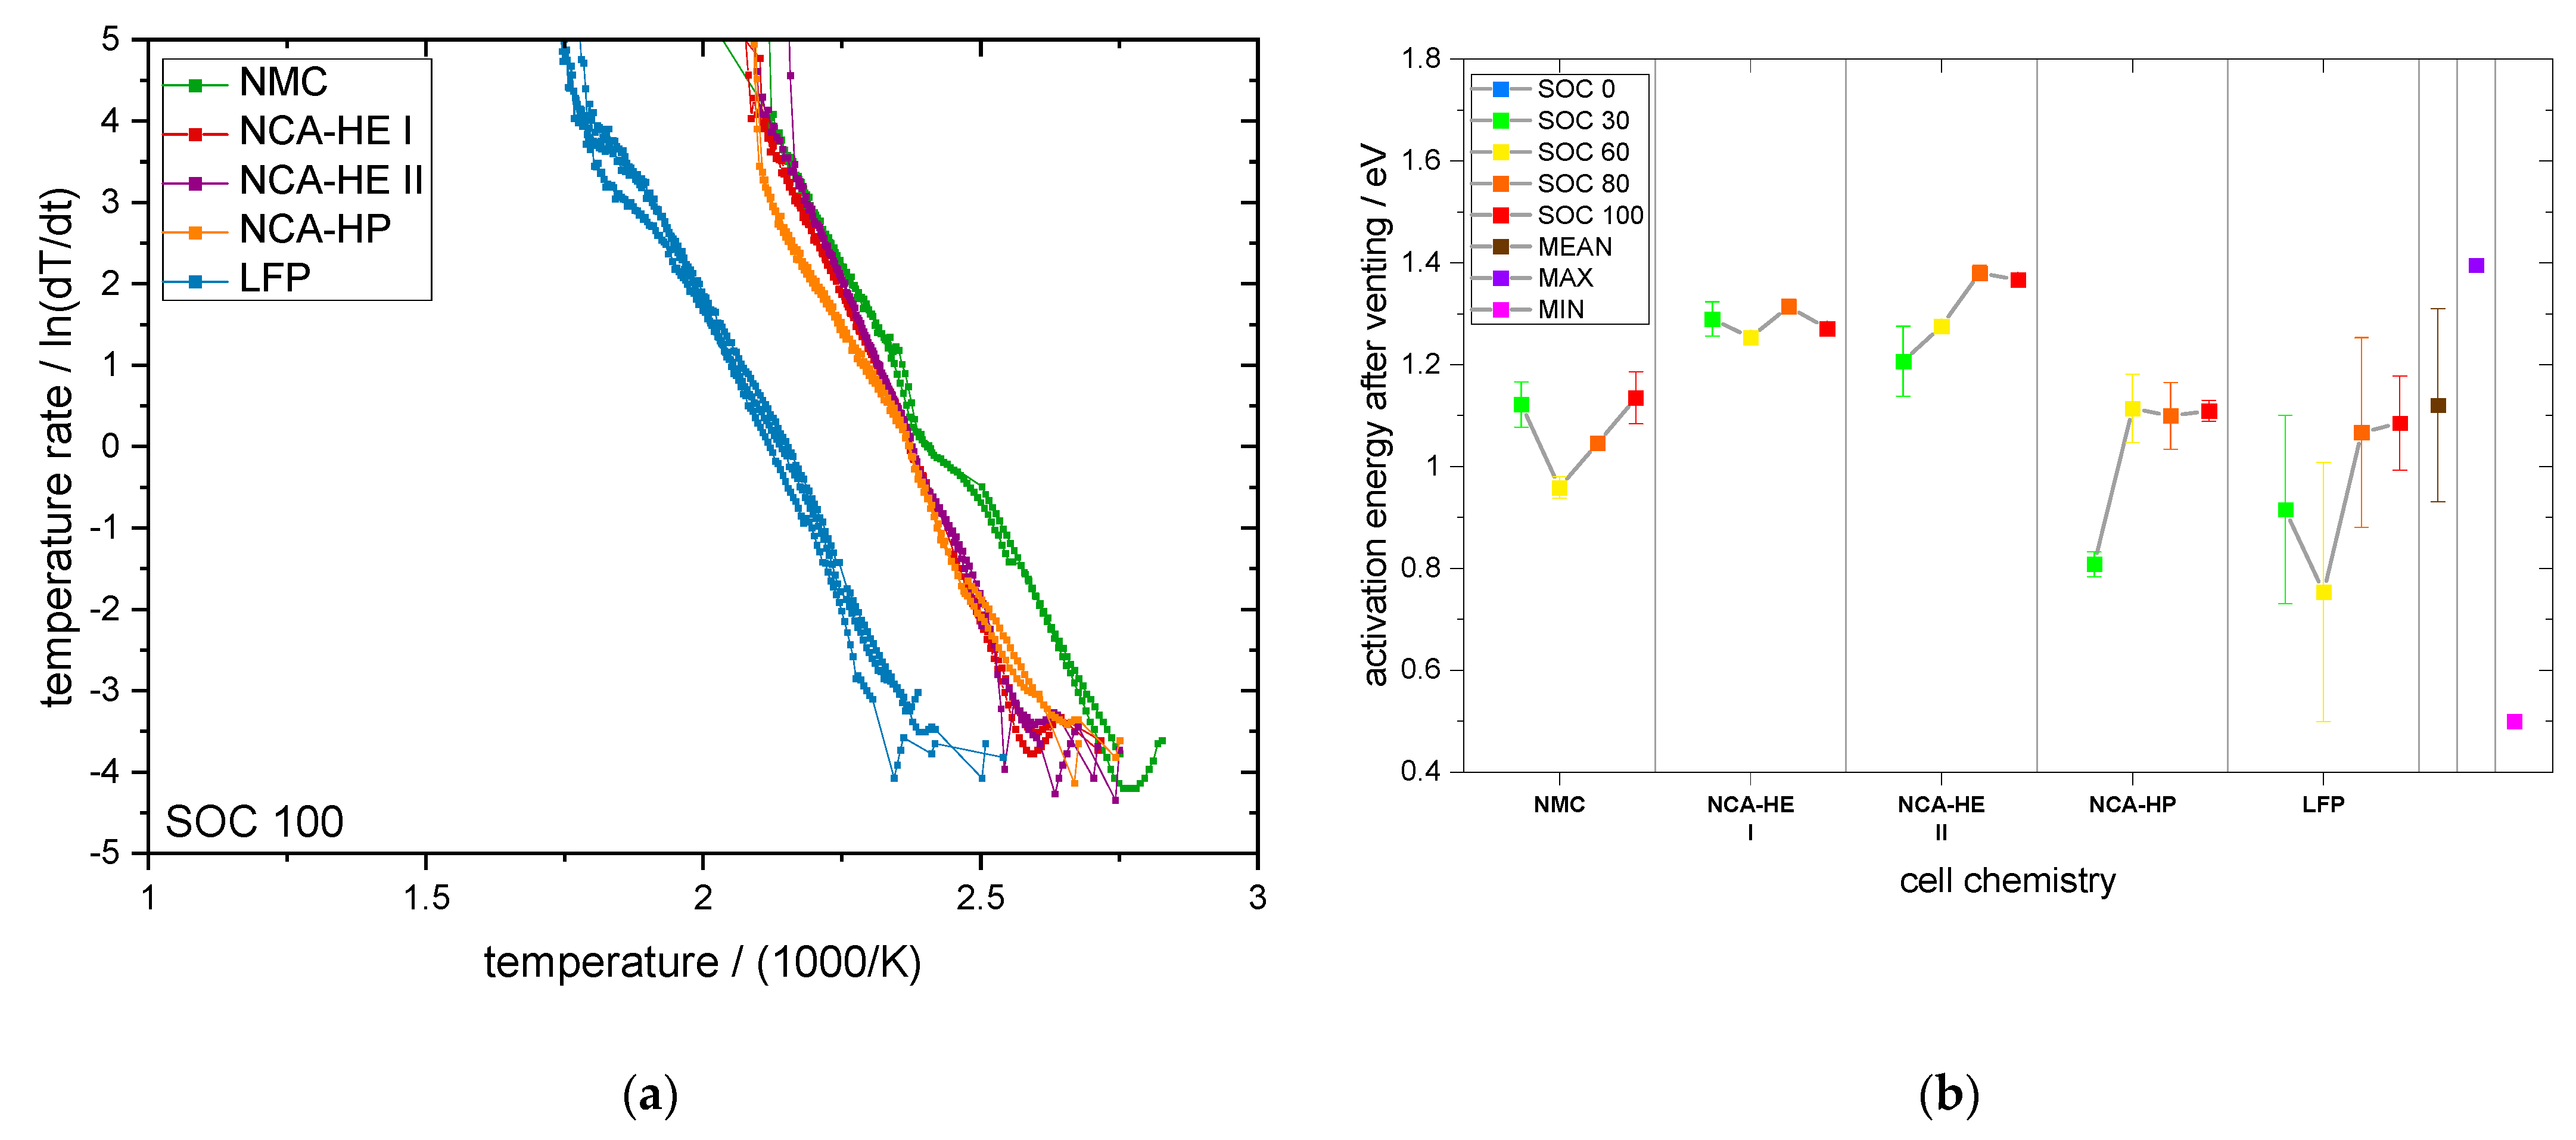
In the literature, different definitions for thermal runaway are used: some definitions use an exothermal temperature rate of 1, 5 or 10 °C/min as an indication of thermal runaway. The problem here is that, at low SOC and for LFP cells in some experiments, these rates are not reached at all, but the cells nonetheless experience thermal runaway from thermal abuse testing. Additionally, the rate where cells go into thermal runaway shows a lot of variation from experiment to experiment and can be hard to track because of the immediate change in the reaction velocity at the start of the runaway. Therefore, a different definition is used here. In order to analytically determine the moment just before the sharp temperature rise, the following definition is used: The cell must be in an exothermal state and the exothermal data log file is checked. This file logs one data point at every 1 K or every 0.05 min. When there is more than 1 K between two logged steps, this indicates the beginning of thermal runaway, as the cell is heating faster than our measurement device can log, and, thus, it is a runaway situation in this experimental set-up.
The definition of all critical temperatures is given in Table 3.
All critical temperatures presented in this paper are mean values of at least two experiments and are plotted together with their standard deviation (SD) as an uncertainty bar.
An overview of an experiment, showing the temperature and voltage over time for an NCA SOC 100 cell with all critical temperatures indicated is given in Figure 2.
From Figure 2, the location in time and the identification of the critical temperatures during the experiment can be seen, for which the definitions are given in Table 3.

2.6.4. Mechanical Abuse Test

The so-called nail penetration test was used for mechanical abuse testing. This experiment consists of a steel nail puncturing the cell inducing internal short circuits as well as compression and a degree of internal crushing of the cell.
In this investigation, the ARC-EV+ was utilized, as it accommodates a so-called nail penetration and crushing option unit (NPCO) specifically built for this test. Once the experiment was started, after 30 s, a steel nail was forced into the cell in a transversal direction in the middle of the cell. The temperature and a video of the reaction was recorded. Table 4 shows the parameters of the experiment that were applied.
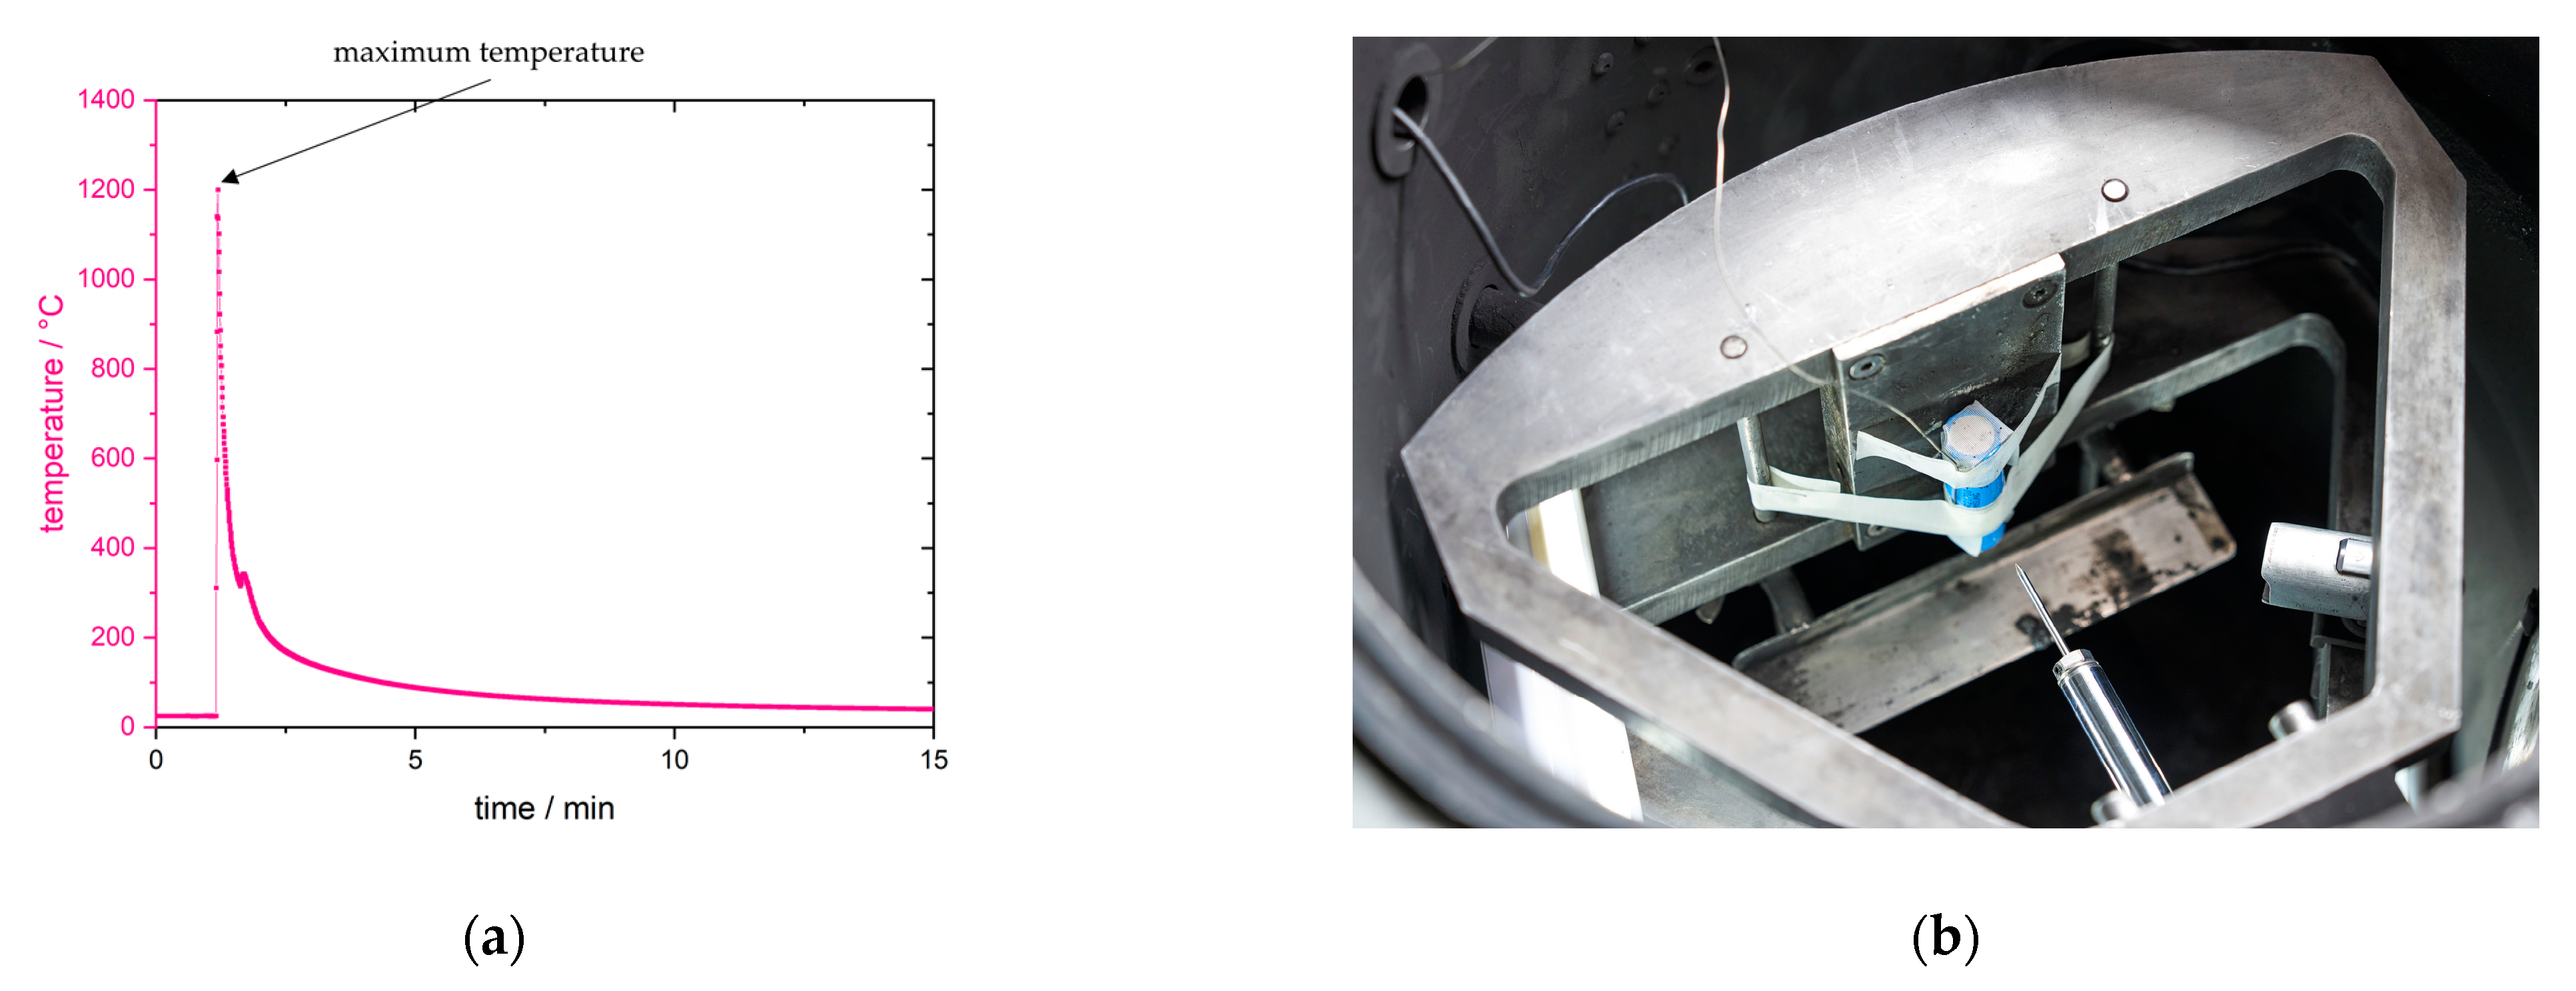
Only one critical temperature can be obtained from mechanical abuse, which is the maximum temperature obtained shortly after penetration during thermal runaway or exothermal reaction because of the short circuit through and crushing by the nail. An overview of the experiment is given in Figure 3a using a temperature over time representation.
The nail penetration system and location of the cell inside the calorimeter, as well as a simplified set-up with one thermocouple at the center of the lateral side of the cell, is shown in Figure 3b. The maximum temperature should be compared at different locations of the cell; therefore, a more complex set-up was used with several auxiliary thermocouples. Thermocouples were attached in the center (main TC, type N), on the top and bottom of the cell, on the side, and on the cathode and anode (auxiliary TC type K). Their accuracy is given in Section 2.6.2.

3. Results

3.1. Cell Components and Cell Performance Identification

The results presented in this section were obtained by analytical techniques described in Section 2.1, Section 2.2, Section 2.3, Section 2.4 and Section 2.5. With the electrical characterization procedure from Section 2.1 and from the manufacturer’s datasheets, we obtained the performances given in Table 5 for each cell type according to its cathode material.
The capacity of NMC and NCA-HE cells was comparable and close to 5 Ah, NCA-HP was nearly 4 Ah and LFP about 3 Ah. The high discharge current of the NCA-HP cells showed that a different inside cell construction could be expected.
From the composition analysis, we obtained the composition information of each relevant component of the cells; the solid components are given in Table 6.
The NMC as well as NCA cells were high nickel cells; NMC was very close to NMC 811 and for all NCA cells about 90 mass % nickel, 10 mass % cobalt and 1.5 mass % aluminum was found. All anodes were carbon based; the structure was flake-like, except for NCA-HP, which had a spheric structure. On the PE separator, an Al2O3 coating was found for all cells, which enabled raising of the melting point, increasing the thermal stability and reducing the probability of internal short circuits. The liquid components in the electrolyte were also analyzed because of their relevance to the thermal runaway reaction; the results are given in Table 7.
This means that the electrolyte for both NCA-HE cells was comparable. The NMC cells contained no FEC additive after formation and neither did the LFP cells. DMC was the main constituent for the NMC and NCA cells and its ratio was highest in the NMC cells; no DMC was found in the LFP cells. The main electrolyte component of LFP cells was DEC, which was not found in the NMC and NCA cells; the EMC and EC composition was much higher for the LFP cells, resulting in a nearly equivalent component mixture between EMC, EC, and DEC for LFP. Informed by these similarities, and by assuming that each manufacturer selected the electrolyte composition for the best behavior and performance for every active material, we based our comparison on the active material but included the electrolyte properties in the analysis.

3.2. CT Analysis

The CT analysis enabled performing measurements on the active material; in Table 8 a summary of the major differences noted between cells is provided. Each measurement was estimated to be within ± 0.01 mm of accuracy based on the achievable resolution of the analysis software. Notable manufacturing differences included that the NCA-HP cells had two positive and two negative tabs, whereas cells of all other chemistry and construction had only one of each. Moreover, the measured anode and cathode thicknesses in NCA-HP cells varied by up to 0.04 mm; other cells of the same type showed much more consistent thickness measurement results. For the anode measurements, the LFP cells were notable for being significantly thinner than the rest. The current interrupt device (CID), positive temperature coefficient device (PTC), burst disks, tab connections, and vents were located at the positive terminal of all cells. The design and location of these features varied slightly from cell type to cell type; images were obtained for reference and are given in Figure 4.
The most commonly observed defect in the cells was the presence of burrs on the negative tabs, as displayed in Figure 5a. All but the NCA-HP cells contained between seven and 31 instances of burrs along the length of one Table. All NCA-HE I, NCA-HE II, and NMC cells displayed a non-circular jelly roll center, as shown in the following Figure 5b. Other defects observed included an uneven distribution of active material at the electrode edges and bent electrodes on the inner winding of the jelly roll, both of which are shown in the following Figure 5c,d.
Each cell type analyzed displayed between two and four of the above defects, and cells of the same type tended to display similar defects, as can be seen in Table 9.

3.3. Critical Temperatures

The cell decomposition and thermal runaway reaction can be divided and described by several critical temperatures; their definitions are given in Section 2.6.3 and Section 2.6.4 and are presented in this chapter.

3.3.1. Thermal Abuse

In this investigation, in total, we tested 57 cells for thermal abuse at five different states of charge. Four different chemistries were compared; all five cell types compared came from different manufacturers. To address this for NCA-HE, the identical chemistry was directly compared between two manufacturers. The obtained values from the heat-wait-seek tests are presented in Table 10 for SOC 100.
The critical temperatures for all SOCs, together with their standard deviations as uncertainty bars, are given in the following Figure 6a,b.
Figure 6a on the left shows the onset temperature, the first exothermal reaction of the cell with a rate above 0.02 °C/min and the beginning of the ARC switching to exothermal mode. This temperature is the beginning of the decomposition of the SEI and the start of the cascade of reactions leading to thermal runaway. For NMC and NCA, a negative temperature coefficient for the SOC is visible—the higher the SOC, the earlier the SE decomposition reaction starts and the lower is the onset temperature. Between SOC 80 and SOC 100 this is less clear, and the standard deviation is higher. NMC has an earlier onset than NCA. The LFP cells have no clear tendency for SOC influence; generally, their onset is at a higher temperature. On average, over all SOC and cell chemistries, the onset temperature was 113 °C and ranged from 81 °C to 151 °C.
In Figure 6b on the right, the CID trigger temperature is presented. This is the moment where the measured cell voltage drops below 1 V because of the CID interrupting the connection between the inside cell and the outside connectors. Again, a negative temperature coefficient for the SOC dependence for NMC and all NCA cells is visible and, in this case, a mainly positive temperature coefficient for LFP can be observed. The lowest CID trigger temperature was again observed for NMC; NCA-HE and NCA-HP behaved similarly and showed good agreement from experiment to experiment, which is reflected in the small uncertainty bar displaying the standard deviation of the experiments. Ranging from 91 °C to 171 °C, the average value over all tests was 125 °C. The CID trigger temperature correlates to the buildup of pressure inside the battery because of gases from the decomposition of active material and electrolyte. Therefore, this parameter is an indication of the amount of gas produced; however, the pressure to trigger the CID can be varied by each manufacturer depending on the properties of the safety vent used.
In Figure 7a, the venting temperature is plotted. As for the CID trigger temperature, NMC and all NCA cells showed a negative temperature coefficient for the SOC; a higher SOC resulted in a lower temperature, meaning an earlier reaction, and, in this case, earlier reaching of an internal pressure of decomposition gases needing to be released to prevent destruction of the cell casing. For LFP cells, there was only a lower venting temperature for SOC 0; for the other SOCs no SOC dependence was seen, which might indicate a different safety vent construction or a difference because of the different electrolyte composition of this cell. NMC and NCA-HE II reacted first, followed by NCA-HE I and NCA-HP; the venting of LFP occurred significantly later and at a higher temperature. The average temperature was 145 °C ranging from 116 °C to 174 °C.
Figure 7b displays the start of the thermal runaway temperature, which is the beginning of the phase of the thermal runaway reaction where the battery ignites and a battery fire becomes inevitable. NMC and all NCA cells behaved similarly, and a negative temperature coefficient was found. The NCA cells went slightly earlier into thermal runaway than the NMC cells. No thermal runaway occurred until 350 °C at SOC 0. Thus, the experiment was stopped, because no thermal runaway at higher temperature was expected and to prevent damage to the calorimeter. LFP cells showed no thermal runaway for SOC 0 and 30; for higher SOC, the start of thermal runaway was later and occurred at much higher temperatures. Considering all types and SOC, the temperature ranged from 189 °C to 350 °C, including SOC 0 and 30, and to 334 °C, excluding these SOC, with an average value of 257 °C over all SOC values and chemistry. This describes the temperature frame when a battery fire is to be expected for thermal cell abuse.
The maximum temperature showed significant variation and wide standard deviation for three reasons: First, during thermal runaway, the thermocouple can become disconnected from the cell because of fire or pressure change in some experiments, while, for others, it will stay on the cell. Second, when the jelly roll is ejected, the cell casing is colder, and the main reaction takes place outside of the cell by the burning of the jelly roll and cannot be captured by the thermocouple. Third, during thermal runaway, the reaction occurs faster than the ARC can track; therefore, the recording can miss the maximum temperature. It can be concluded that, due to this fact, ARC testing determines the maximum temperature less accurately; autoclave testing would give more accurate results. However, the data showed that the maximum temperatures for NMC and NCA were comparable, whereas for LFP it was lower overall by about 100 K. A clear trend for SOC was not observed, but higher SOC was mostly associate with higher temperatures. The average maximum temperature for all SOC and chemistries was found to be 492 °C, with a minimum of 359 °C (excluding SOC 0 that was stopped at 350 °C) and a maximum of 837 °C. This was consistent with the postmortem analysis after the abuse test that sometimes showed molten aluminum (melting point 660 °C) but no molten copper (melting point 1083 °C). The experimental data for the maximum temperature in thermal abuse experiments are provided under the link given in the data availability statement at the end of this paper.
Moreover, the temperatures of the reaching of exothermal self-heating rates are of interest and sometimes used to define thermal runaway in literature, therefore they have been obtained from the experiments and are given in Table 11.
The critical temperatures where the temperature rate of 1, 5 and 10 °C/min were reached for all tested SOCs are represented in the following Figure 8a–c.
Figure 8 shows that, for SOC 0 for NCA-HP, the rate of 5 °C/min and 10 °C/min was not reached; for LFP SOC 0 even 1 °C/min was not reached. For NMC and NCA, a negative temperature coefficient for the SOC for all critical rates was found and they reacted at similar temperatures. Conversely, for LFP, there was little to no influence of the SOC on the temperatures when a temperature rate of 1, 5 and 10 °C/min was reached, and overall higher temperatures were required to reach critical rates.
These critical rates can be used to describe the thermal runaway reaction velocity inside the cell and how close the cell is to thermal runaway. On average, 1 °C/min was reached at 174 °C, 5 °C/min at 196 °C, and 10 °C/min at 208 °C.
The temperature rate at thermal runaway with the definition used in this research, given in Section 2.6.3, showed high variation, resulting in wide standard deviations and no clear dependence on the state of charge. The average rate at thermal runaway over all SOC and chemistries was 79 °C/min; the lowest was 1.6 °C/min and the highest 352 °C/min. NMC showed the highest rates, all NCA cells had comparable, lower rates, while both NMC and NCA showed no clear influence of SOC. The maximum rates for LFP cells were lower than for NCA for low SOC and higher for high SOC.

3.3.2. Mechanical Abuse

For mechanical abuse, 41 cells were tested at four different SOCs. Whether the cell went into thermal runaway from mechanical abuse through nail penetration testing is shown in Table 12.
Thermal runaway did not occur for an SOC of 0, nor for all SOCs for the LFP cathode chemistry. It did occur for SOC 30, 50 and 100 on NMC and NCA cathode chemistry for all cells.
The critical temperature from this test is the maximum temperature only; it is compared at different locations of the cell in Table 13 for all cells at SOC 100.
For the other SOCs tested for all chemistries, the results are represented in the following Figure 9a,b.
Looking at Figure 9, it is evident that LFP cells did not go into thermal runaway from nail penetration and reached not more than 132 °C. Furthermore, the maximum temperature for LFP chemistry was recorded at SOC 30 and SOC 50 depending on the thermocouple location.
Figure 9a shows the maximum temperature recorded by the main thermocouple at the center of the cell. NMC and NCA cells behaved similarly with a positive temperature coefficient, except for SOC 50 for NMC and NCA-HE I. Furthermore, the average was 332 °C, ranging from 37 °C to 732 °C.
In Figure 9b the maximum value recorded from all auxiliary thermocouples is depicted. Again, a mainly positive temperature coefficient for the state of charge was found; NMC and NCA-HE behaved similarly, but NCA-HP stood out with a very high temperature at SOC 100 of 1220 °C. In a range of 38 °C to 1220 °C, the average auxiliary maximum temperature was 430 °C.
In general, the variation from test to test was higher for mechanical abuse; therefore, the standard deviation bars were larger than for thermal abuse. The anode TC maximum temperature showed the same temperature coefficient as for the other temperature data; however, NMC and NCA-HP stood out. For NMC, SOC 50 and SOC 100 had clearly higher temperatures than the other SOC, and for NCA-HP this was the case for SOC 100. Ranging from 37 °C to 1200 °C, the average value was 314 °C, which was, excepting the maximum value, comparable to the main thermocouple at the center. The overall maximum temperature of all the thermocouple locations was similar to the auxiliary thermocouple maximum temperature. It ranged from 38 °C to 1220 °C, averaging 439 °C, and is given, together with the anode TC maximum temperature, in Appendix A.

3.4. Exothermal Behavior and Activiation Energy Estimation

3.4.1. Exothermal Behavior

In this section, the exothermal data obtained in the thermal abuse experiments are presented. Because it is difficult to determine the thermal runaway temperature directly from the temperature vs. time curve, it is more convenient to look at the related temperature rate vs. temperature curve. This curve depicts an average of the data points that were recorded when the calorimeter was in exothermal mode and is presented in Figure 10a. Therefore, the different critical points and regions of the temperature rate can be clearly distinguished. For simulation or other computational use, the exothermal data presented in this section are made available for all thermal abuse tests that have been performed. The link to the database is given in the data availability statement at the end of this paper.
Due to the difference in electrical capacity between the tested cell types, the plotted data was standardized by the average capacity of each cell type. The capacity standardized temperature rate is plotted on a logarithmic scale against the temperature in Figure 10b for SOC 100. This graph shows only the exothermal behavior of the cell and, thus, shows the behavior between the onset temperature and thermal runaway. However, after the start of thermal runaway, the behavior is not perfectly captured anymore, because the reactions can take place faster than the calorimeter can track. The maximum tracking rate of the calorimeter was 20 °C/min.
For NMC and each NCA cell type, two cells were tested. Because of a higher variation for LFP, we performed three tests for this chemistry. The earliest onset was observed for NMC cells with an average of 85.5 °C. At rates above 1 °C/min, their behavior evolved in a similar way to NCA cells, but the shape of the curve was different, and the slope varied over different temperature zones. Second in reactivity was NCA-HP, the behavior of which approached that of the other NCA cells at about 0.05 °C/min and was less reactive than those cells after 1 °C/min. The two different NCA-HE cells showed comparable behavior for most temperature rates, but NCA-HE II became a little more reactive above 1 °C/min and went into thermal runaway earlier. Most significant was the behavior of the LFP cells, which stood out and was shifted to much higher temperatures for all phases of the exothermal behavior. While the LFP cells showed comparable reaction velocity to the other chemistries until 10 °C/min, the reaction velocity decreased before going into thermal runaway.
Accordingly, in Figure 11a, we can generally see comparable behavior to that for SOC 100, though NCA-HP cells were now similarly reactive for rates below 1 °C/min to NMC cells. The slope of NMC decreased above 1 °C/min and their early onset resulted in a later start of thermal runaway compared to NCA-HE. These two cells once again showed very similar behavior, with NCA-HE II reaching thermal runaway a little earlier than NCA-HE I. Compared to SOC 100, the overall behavior was shifted to somewhat higher temperatures. LFP cells again showed higher variation between themselves; therefore, we performed the experiment three times—in one, the maximum capacity just reached the standardized rate of 10 °C/min.
Next, as shown in Figure 11b for SOC 60, NMC and NCA cells behaved very similarly for low rates, but above 0.1 °C/min NMC changed slope and became less reactive, clearly reaching thermal runaway later than all NCA cells. Because of this significant slope change, NMC cells behaved more similarly than the LFP cells for this SOC than for higher SOC. All LFP cells stayed at lower exothermal rates and the reaction slowed down towards 350 °C.
In Figure 12a, SOC 30 is presented, showing comparable behavior for all chemistries until about 1 °C/min, except for NCA-HP cells, which were more reactive at medium rates, but then went into thermal runaway later. NMC and NCA-HE cells went into thermal runaway at nearly the same time. One LFP cell was less reactive than the other cells, while, for all LFP cells, the reaction stayed below a capacity standardized temperature rate of 10 °C/min. For LFP, the reaction decreased at about 250 °C and the temperature rate fell below 0.02 °C/min at 275 °C, which meant that the ARC exits exotherm mode and the cell self-heating stopped without further heating. Therefore, we conclude that no thermal runaway occurred for LFP at SOC 30 until 350 °C.
In Figure 12b, SOC 0 is presented. For this SOC, the behavior was different from that shown in all the other graphs and several drops in the temperature rates were observed for all chemistries. Each cell type reacted differently and from experiment to experiment there was also notable variation. While NMC, NCA-HP and NCA-HE first showed exothermal behavior, by 0.1 °C/min the behavior of all cells was similar, except for LFP. NMC cells had the highest temperature rates, followed by NCA-HE. The experiment was stopped at 350 °C and no thermal runaway was found.
Considering SOC 100 to SOC 0, corresponding to Figure 10b to Figure 12b, the exothermal behavior of all cells shifted to lower temperatures and the slope was reduced. The lower the SOC, the more significant were the phases of the lower exothermal rates, which might indicate endothermal processes acting against the exothermal behavior. While the LFP cells behavior only shifted to higher temperatures for SOC 100, their exothermal behavior became much different for lower SOC, as they did not reach several rates and the reaction speed slowed down. At SOC 0, no thermal runaway was observed; the cells reacted exothermally, but the rates reduced at several points of the experiment and exothermal behavior stopped or stayed at low rates for all cells.

3.4.2. Activation Energy Estimation

The activation energy was determined after venting of the cell through linear fitting of the exothermal behavior by representation of the natural logarithm of the temperature rate on the y-axis against the reciprocal temperature on the x-axis. This Arrhenius plot enabled fitting of the behavior following the Arrhenius equation with a linear equation, making fitting and interpolation easier and the numeric result more precise.
Based on the Arrhenius equation, in [20], Richard and Dahn provided a formula that includes a link between the self-heating rate and consumption of reactants. This equation traces back to an early paper on accelerating rate calorimetry by Townsend and Tou [21]. The formula describing the linear behavior reads:
l n ( d T d t ) l n ( A · Δ T ) E A k B · T  
where T is the temperature T, t is the time, A is the Arrhenius factor, and k B is the Boltzmann constant. The parameter E A corresponds to the activation energy of the exothermal reaction the fit was applied on, and Δ T is the adiabatic temperature interval used for fitting.
This equation can be fitted as a linear function with slope m and constant b:
y = b + m · x
Resulting in the following parameters:
ln ( d T d t ) = y  
l n ( A · Δ T ) = b
E A k B · T = m · x
with   x = 1 T  
The activation energy is described by:
E A = m · k B
The fitting before venting was not possible for all SOC and the interval ΔT had a lot of variation when a fit was possible. This resulted in high variation in the activation energy data and no clear tendency for the state of charge and active material behavior. Moreover, no fitting was possible for abuse tests at SOC 0 as no pure exothermal behavior took place for SOC 0. Nevertheless, it was possible to perform a fit after venting and to determine the activation energies. In Figure 13a, the Arrhenius plots for all cell types at SOC 100 are shown and one can clearly see where linear fit is possible, as well as the difference between the active materials. In Table 14, as well as in Figure 13b, the results for the activation energy are given.
The activation energy for SOC 100 was highest for NCA-HE II, followed by NCA-HE I, NMC and NCA-HP, and was lowest for LFP. While NMC, LFP and NCA-HP had similar values, for NCA-HE I and NCA-HE II, similar activation energy was also found, that was higher than that previously mentioned. However, the extraction of kinetic data, such as the activation energy, from the ARC experiment was not perfect because of the non-isothermal conditions, which is discussed in [22].
Figure 13b shows a different influence of the SOC for each chemistry. For NMC and NCA-HE I, no clear tendency was observable, though for NCA-HE II, NCA-HP and LFP a positive temperature coefficient was found. Moreover, comparing the cathode materials for SOC lower than 100, NCA-HE again had a higher activation energy than the other chemistries. LFP and NCA-HP showed the highest SOC variation, while LFP showed the highest uncertainty at each data point. Ranging from 0.64 eV to 1.76 eV, the average activation energy after venting for all SOC and chemistry was found to be 1.07 eV.

3.5. Released Heat Calculation

3.5.1. Method and cp Value

Using the following equations, it is possible to determine the released heat up to each critical temperature, such as the CID trigger, venting, start of thermal runaway and the maximum temperature:
Δ H e x o = c p · m c e l l · ( T c r i t i c a l T o n s e t )
The mass of each cell was obtained before the abuse experiment; the cp values were obtained from the literature for cylindrical full cells and are given in Table 15, together with their source.
Because of the variation in this data and the significant impact on the result, for each chemistry, we used an average cp value for the cell to determine enthalpy. These values are given in Table 16.

3.5.2. Thermal Abuse

The calculation was performed based on the exothermal data given in Section 3.4.1. for thermal abuse. For SOC 100, the values are presented in Table 17, based on the critical temperatures given in Section 3.3.1.
Figure 14 shows the released heat for critical temperatures calculated with the mean cp value for each cell type. Furthermore, as this value was calculated between onset and the critical temperature given, the behavior for different SOC was different to that shown for the critical temperatures in Section 3.3.1.
A clear SOC influence was not observed for the released heat until the CID trigger temperature, except for NCA-HE I, which had a positive temperature coefficient. Accordingly, for NCA-HE II and NCA-HP, a tendency towards a positive temperature coefficient for most SOCs was found. The LFP cells stood out with a higher data range and standard deviation. The negative enthalpy for SOC 0 was due to the venting occurring before the onset temperature. Thus, the minimum value found was −2.2 kJ, the maximum 4.7 kJ, and 0.9 kJ was the average for all SOC and chemistry.
Accordingly, for the released heat until the venting temperature, an overall positive temperature coefficient was found for NMC and NCA. A range from 0.2 kJ to 4.7 kJ and a mean value of 2 kJ was found. However, not all SOC perfectly followed this trend. For LFP, the highest value was found for SOC 30, followed by SOC 100.
The behavior of the released heat until thermal runaway start temperatures for different SOC and chemistry was nearly identical to the start of the thermal runaway temperature behavior for the SOC and is, therefore, not plotted. Ranging from 6.1 kJ to 15.6 kJ, the average enthalpy was 9.6 kJ.
Moreover, the released heat until the maximum temperature was also very similar to the behavior of the maximum temperature and showed no clear SOC influence and higher standard deviation values. For most cells, a higher SOC resulted in a higher value. For LFP with lower maximum temperatures, the enthalpy until maximum temperature was overall lower. Overall for SOC and chemistry, the average was 25.2 kJ, ranging from 13.6 kJ to 46.2 kJ.

3.6. Grade of Destruction and Mass Loss

3.6.1. Definition of Grade of Destruction and Mass Loss

To further assess the cell damage, which is relevant for thermal runaway propagation in a battery pack, the mass loss and grade of destruction were evaluated. The mass loss is the difference between the mass before and after the experiment and is, for example, significant if a jelly roll ejection occurs. It was determined by weighing each cell before and after the experiment with a precision of ±0.01 g. The mass loss is coupled to the grade of destruction, which is a classification we undertook to analytically compare the destruction of the cells, taking into account effects such as jelly roll ejection, but being more precise by differentiating the outside state of the cell and the integrity of the cell housing.
The following different grades of destruction, shown in Table 18, were chosen and all cells were photographed and classified after the abuse experiments; examples for each grade are given in Figure 15.

3.6.2. Thermal Abuse

For all cells tested in the thermal abuse test, the above criteria were applied; the average result for all SOCs is represented in Figure 16.
Figure 16a shows the grade of destruction after the HWS test. For NMC and NCA-HE, the highest grade was found for SOC 30, however, showing a higher standard deviation than for the other SOC. For NCA-HP and LFP a positive temperature coefficient for the grade of destruction can be found. The average grade of destruction for all SOC was 3, described as a small loss of components in Table 18. Meanwhile, the destruction through thermal abuse ranged from grade 1 (nearly no damage) to grade 6 (complete destruction of the cell).
In Figure 16b, the mass loss is represented. For all cells, a positive temperature coefficient can be found for increasing SOC; however, for LFP, this was only clear for SOC 100. Once again SOC 30 stood out, with a very high variation in the mass loss from experiment to experiment, resulting in a higher standard deviation. Thus, on average, over all SOC tested, the cells lost 37% of their mass through thermal runaway. As high mass loss is often coupled to the ejection of large parts of the cell interior or the full jelly roll, it can be coupled to a high SOC from this graph. Hence, early ejection of the jelly roll can result in a less damaged cell remaining as the combustion takes place outside of the cell housing, explaining the lower grade of destruction for SOC 100 with higher mass loss. However, as for SOC 0, no thermal runaway occurred, both the grade of destruction and the mass loss were minimal and were only attributed to damage through the heating to 350 °C, such as exterior damage and some exothermal decomposition of the active material, not resulting in thermal runaway.

3.6.3. Mechanical Abuse

As for thermal abuse, the same analysis was performed for mechanical abuse and is presented in Figure 17 for all tested SOCs (0, 30, 50 and 100).
The grade of destruction of cells after mechanical abuse showed high variation from experiment to experiment and was highest either for SOC 30 or SOC 50, depending on the cell chemistry. The lowest was always found for SOC 0 as these cells did not go into thermal runaway; conversely, SOC 100 never showed the highest grade of destruction of all SOC with an average grade of 2. For mechanical abuse, grade 0 was also observed for SOC 0, as no thermal damage occurred to these cells from heating. The LFP cells did not go into thermal runaway from mechanical abuse and only heated up, which resulted in no, or only little, exterior damage to the cell, apart from the hole from nail penetration and only small mass loss. The mass loss was higher for a higher SOC for NMC and NCA HE, but with significant variation from experiment to experiment. Similarly, NCA HP had the highest mass loss at SOC 50, while the highest grade of destruction was observed at SOC 30. In consequence, the average mass loss by nail penetration was 26%.

4. Discussion

4.1. Influence of Cell Chemistry

When comparing the different cell chemistries, one has to take into account that the cells have different capacities. In particular, the LFP cells had a lower capacity than the other chemistries, as the highest available capacity for type 21700 cells was 3 Ah. Therefore, the exothermal data is always presented in a capacity standardized way. For NCA cells, we compared between HE and HP and can attribute the difference between these two cells, respectively, on one side to the capacity difference and, on the other, to the construction difference between the cells. As the impact on the temperature was found to be low between these two different cells, the difference between LFP and the other cells should also mainly have come from the different cathode chemistry and not from capacity difference.
Additionally, the electrolyte composition also showed little difference; moreover, the difference was mainly in LFP, for NCA-HE, both cells had very similar electrolyte composition, and between NMC and NCA-HP, there was little disparity, whether EMC, FEC or EC were used. It is assumed, as commercial cells were investigated, that the manufacturers had always chosen the best electrolyte composition for the performance of each cathode material and that the electrolyte was chosen in accordance with this, and that we can, thus, make our deductions based on the cathode material.
Consequently, based on these experimental results, the safety behavior of the different cell chemistries, mainly influenced by the cathode material for type 21700 LIB, can be compared.
The cells studied were high nickel cells, for NMC with a chemistry close to 811, and, for NCA, close to 90 mass % nickel in the cathode, 10 mass % cobalt and about 0.15 mass % aluminum, for all three NCA cells studied. Furthermore, the LFP cells shared a common LiFePO4 composition. The separator was made of PE with an Al2O3 coating, which was the same for all cells. Moreover, the anode was built of carbon and, with the exception of LFP, also contained between 1 to 1.6 mass % silicon. Subsequently, the main difference and focus of comparison was the cathode active material; therefore, the cells were defined by cathode chemistry.
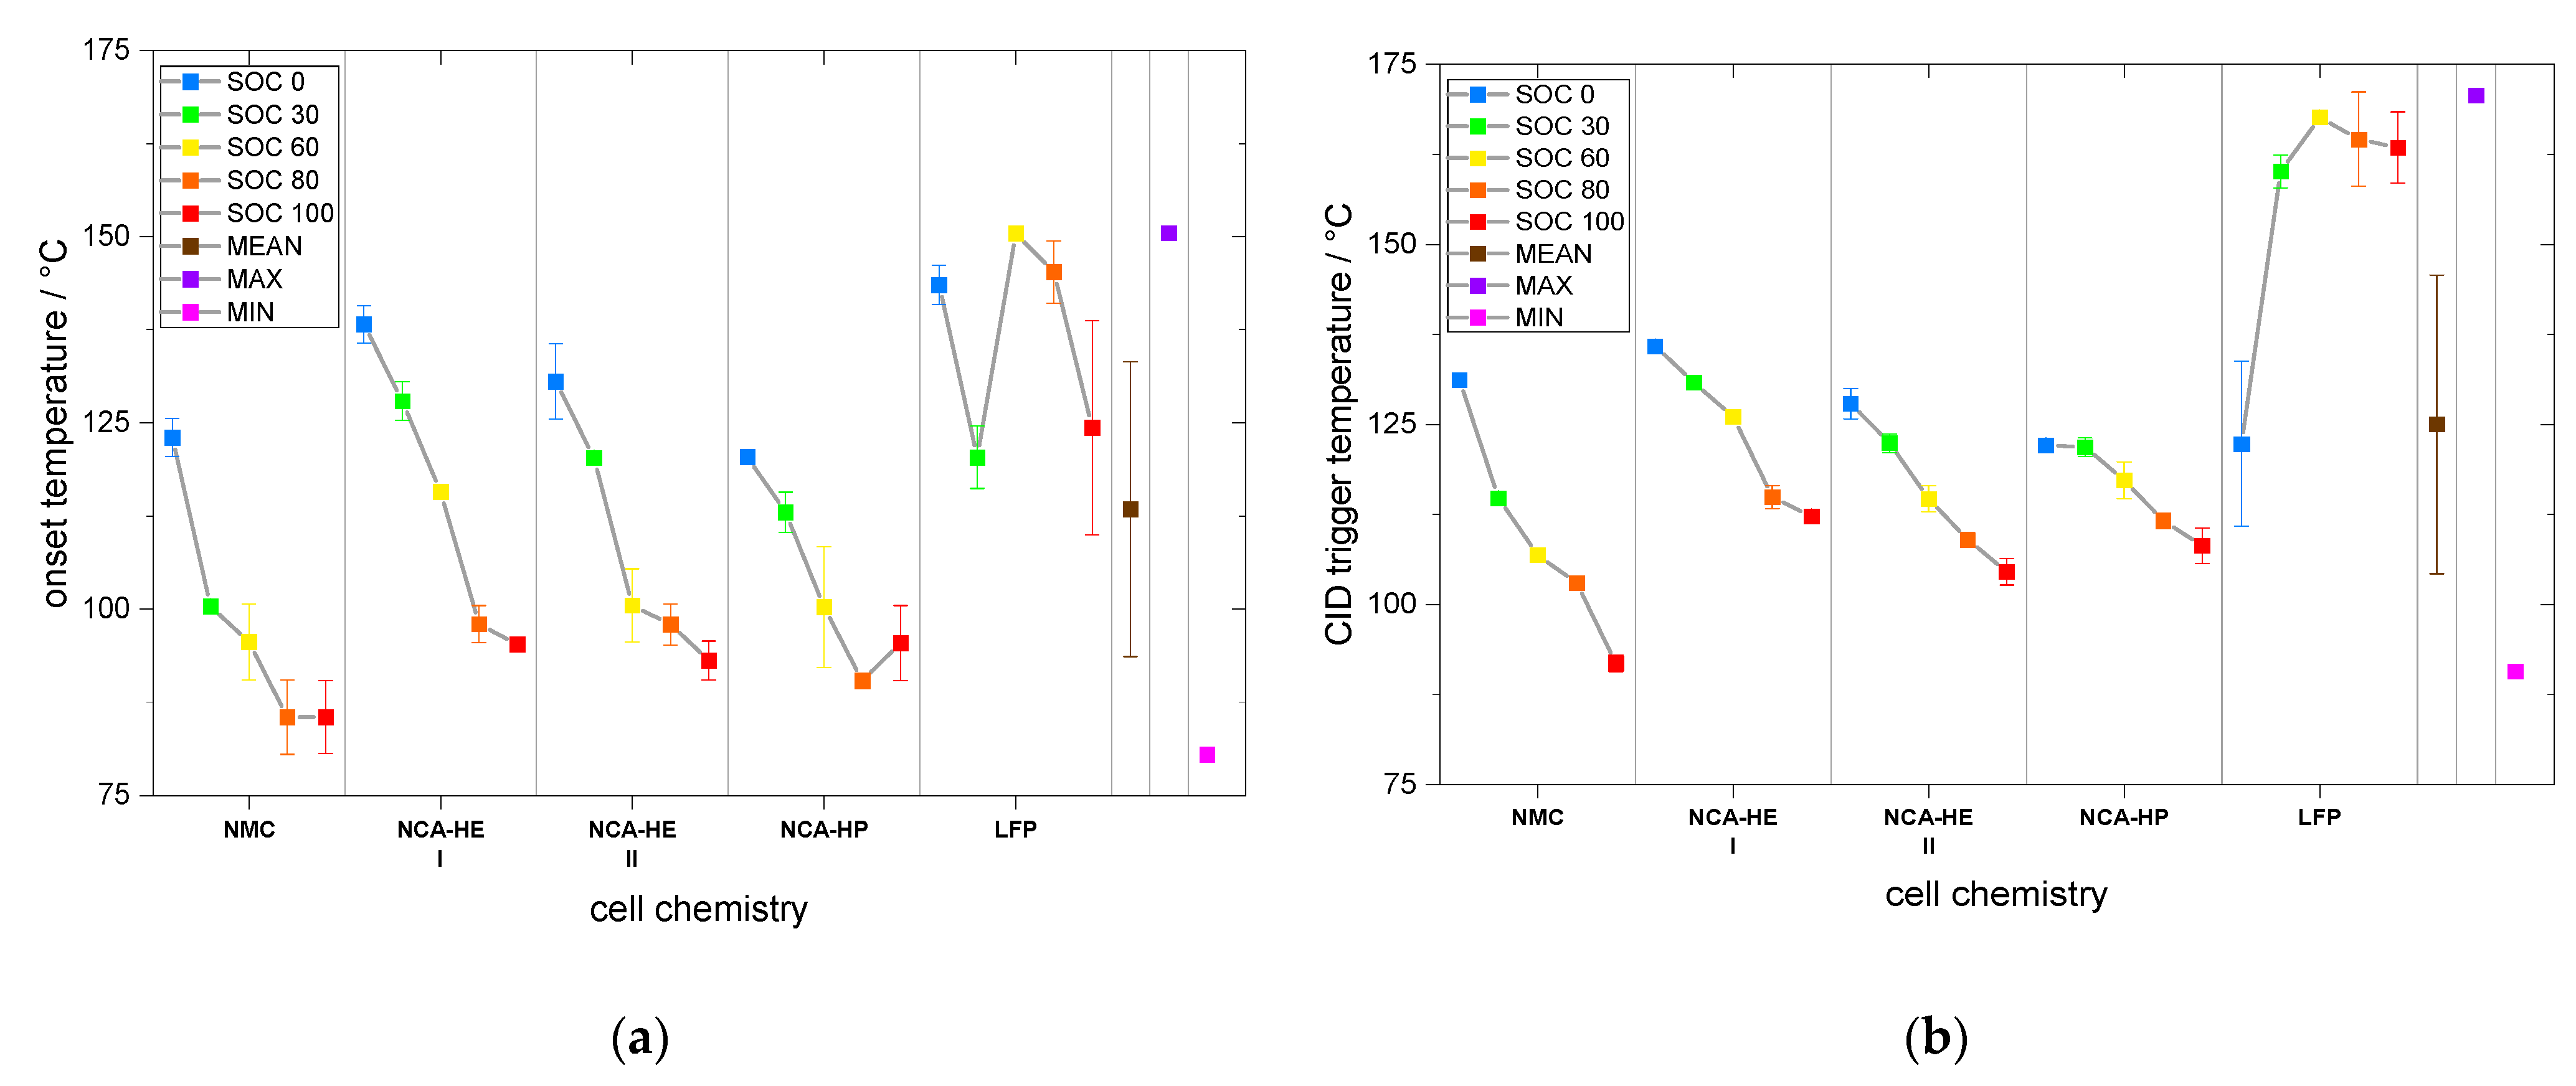
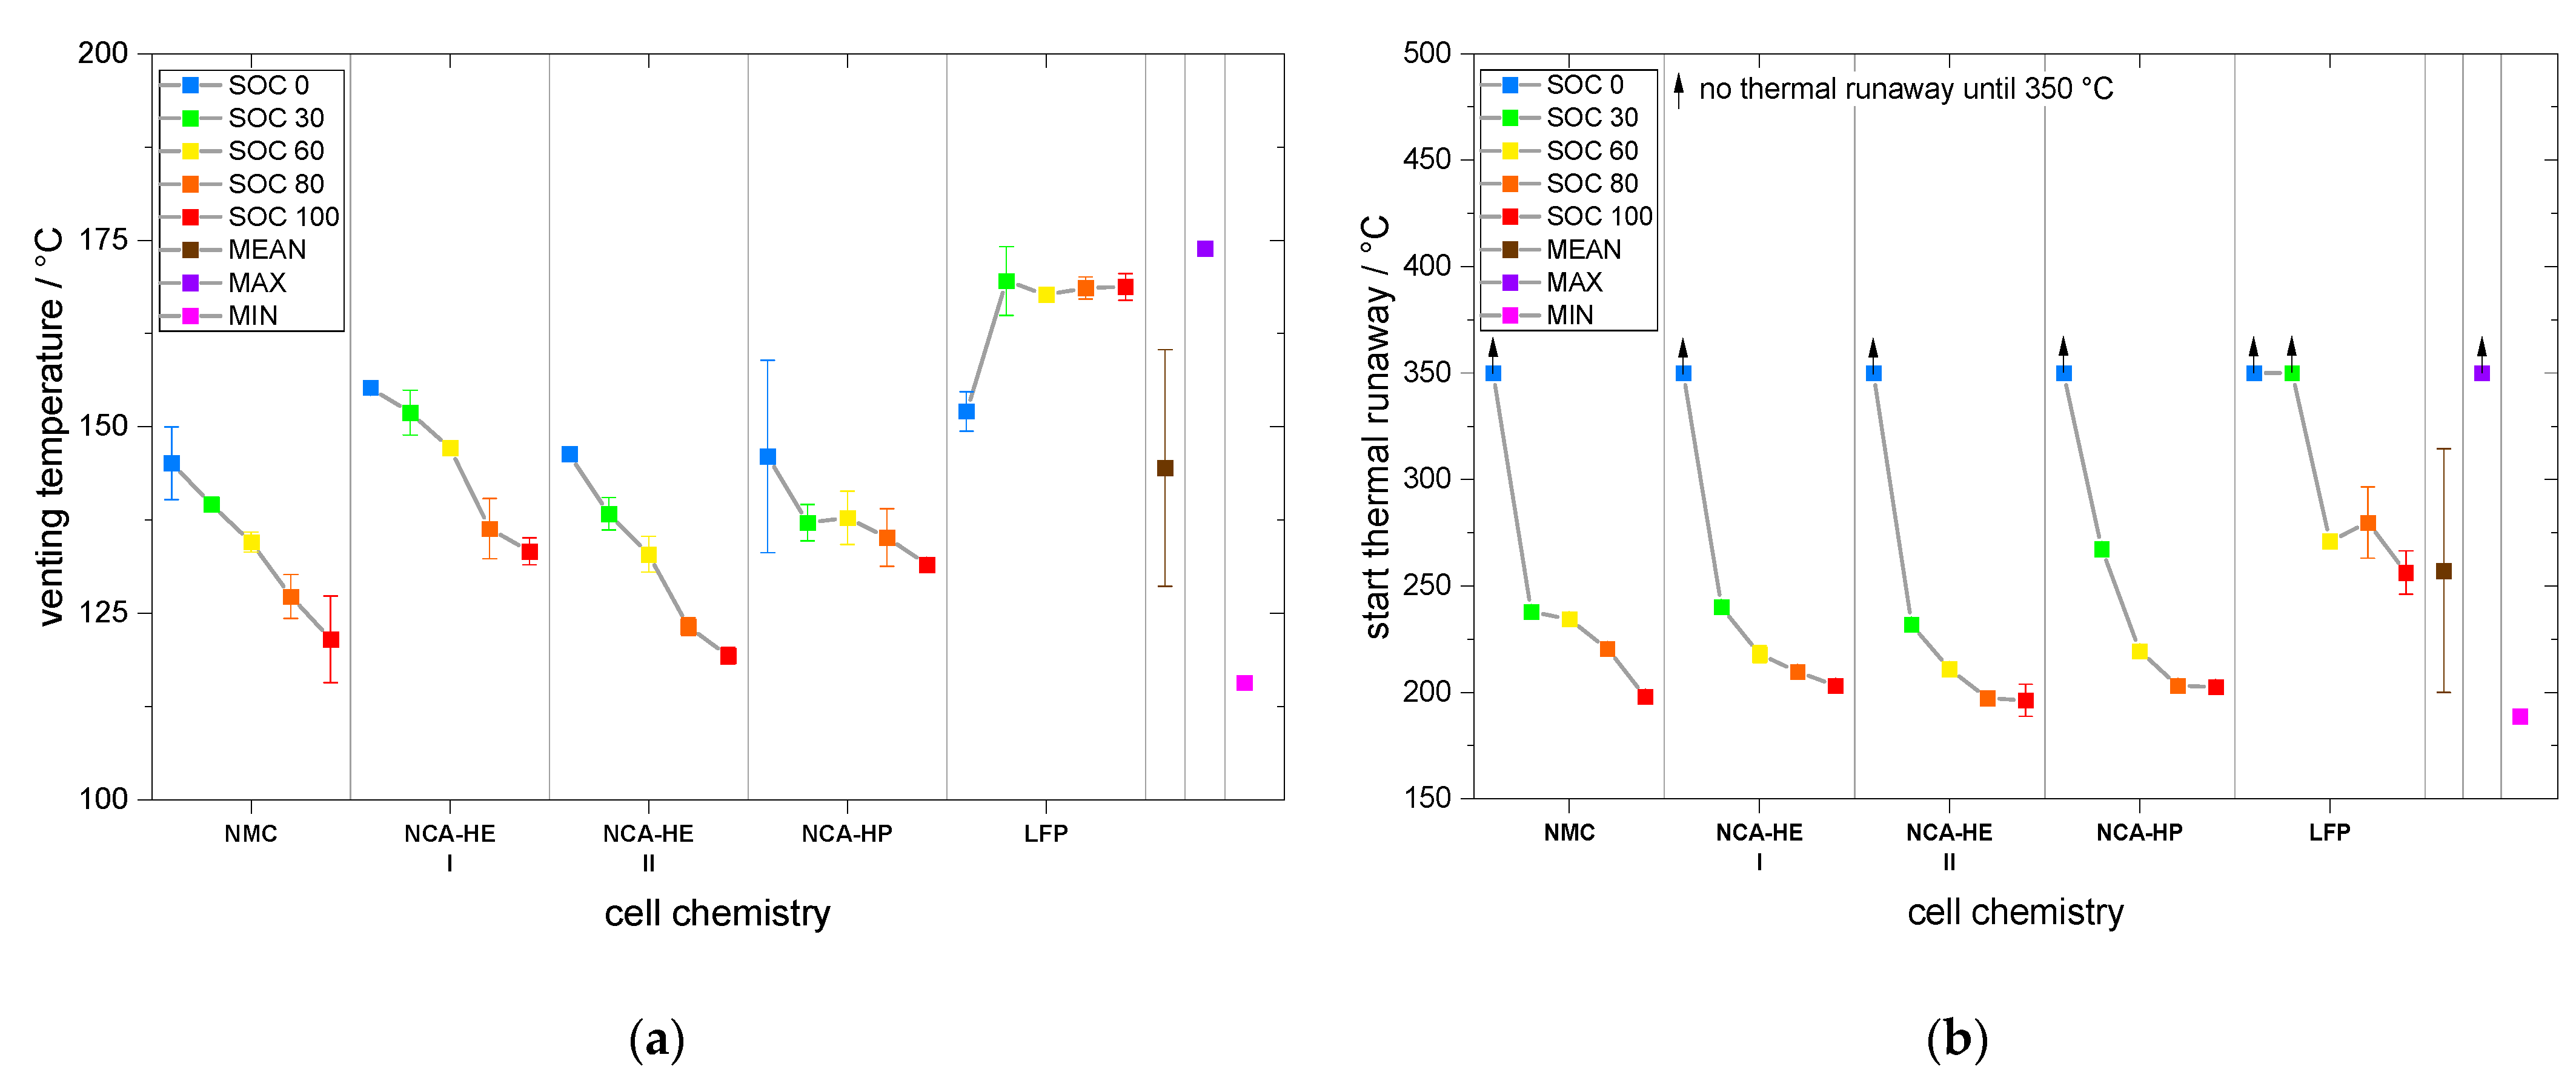
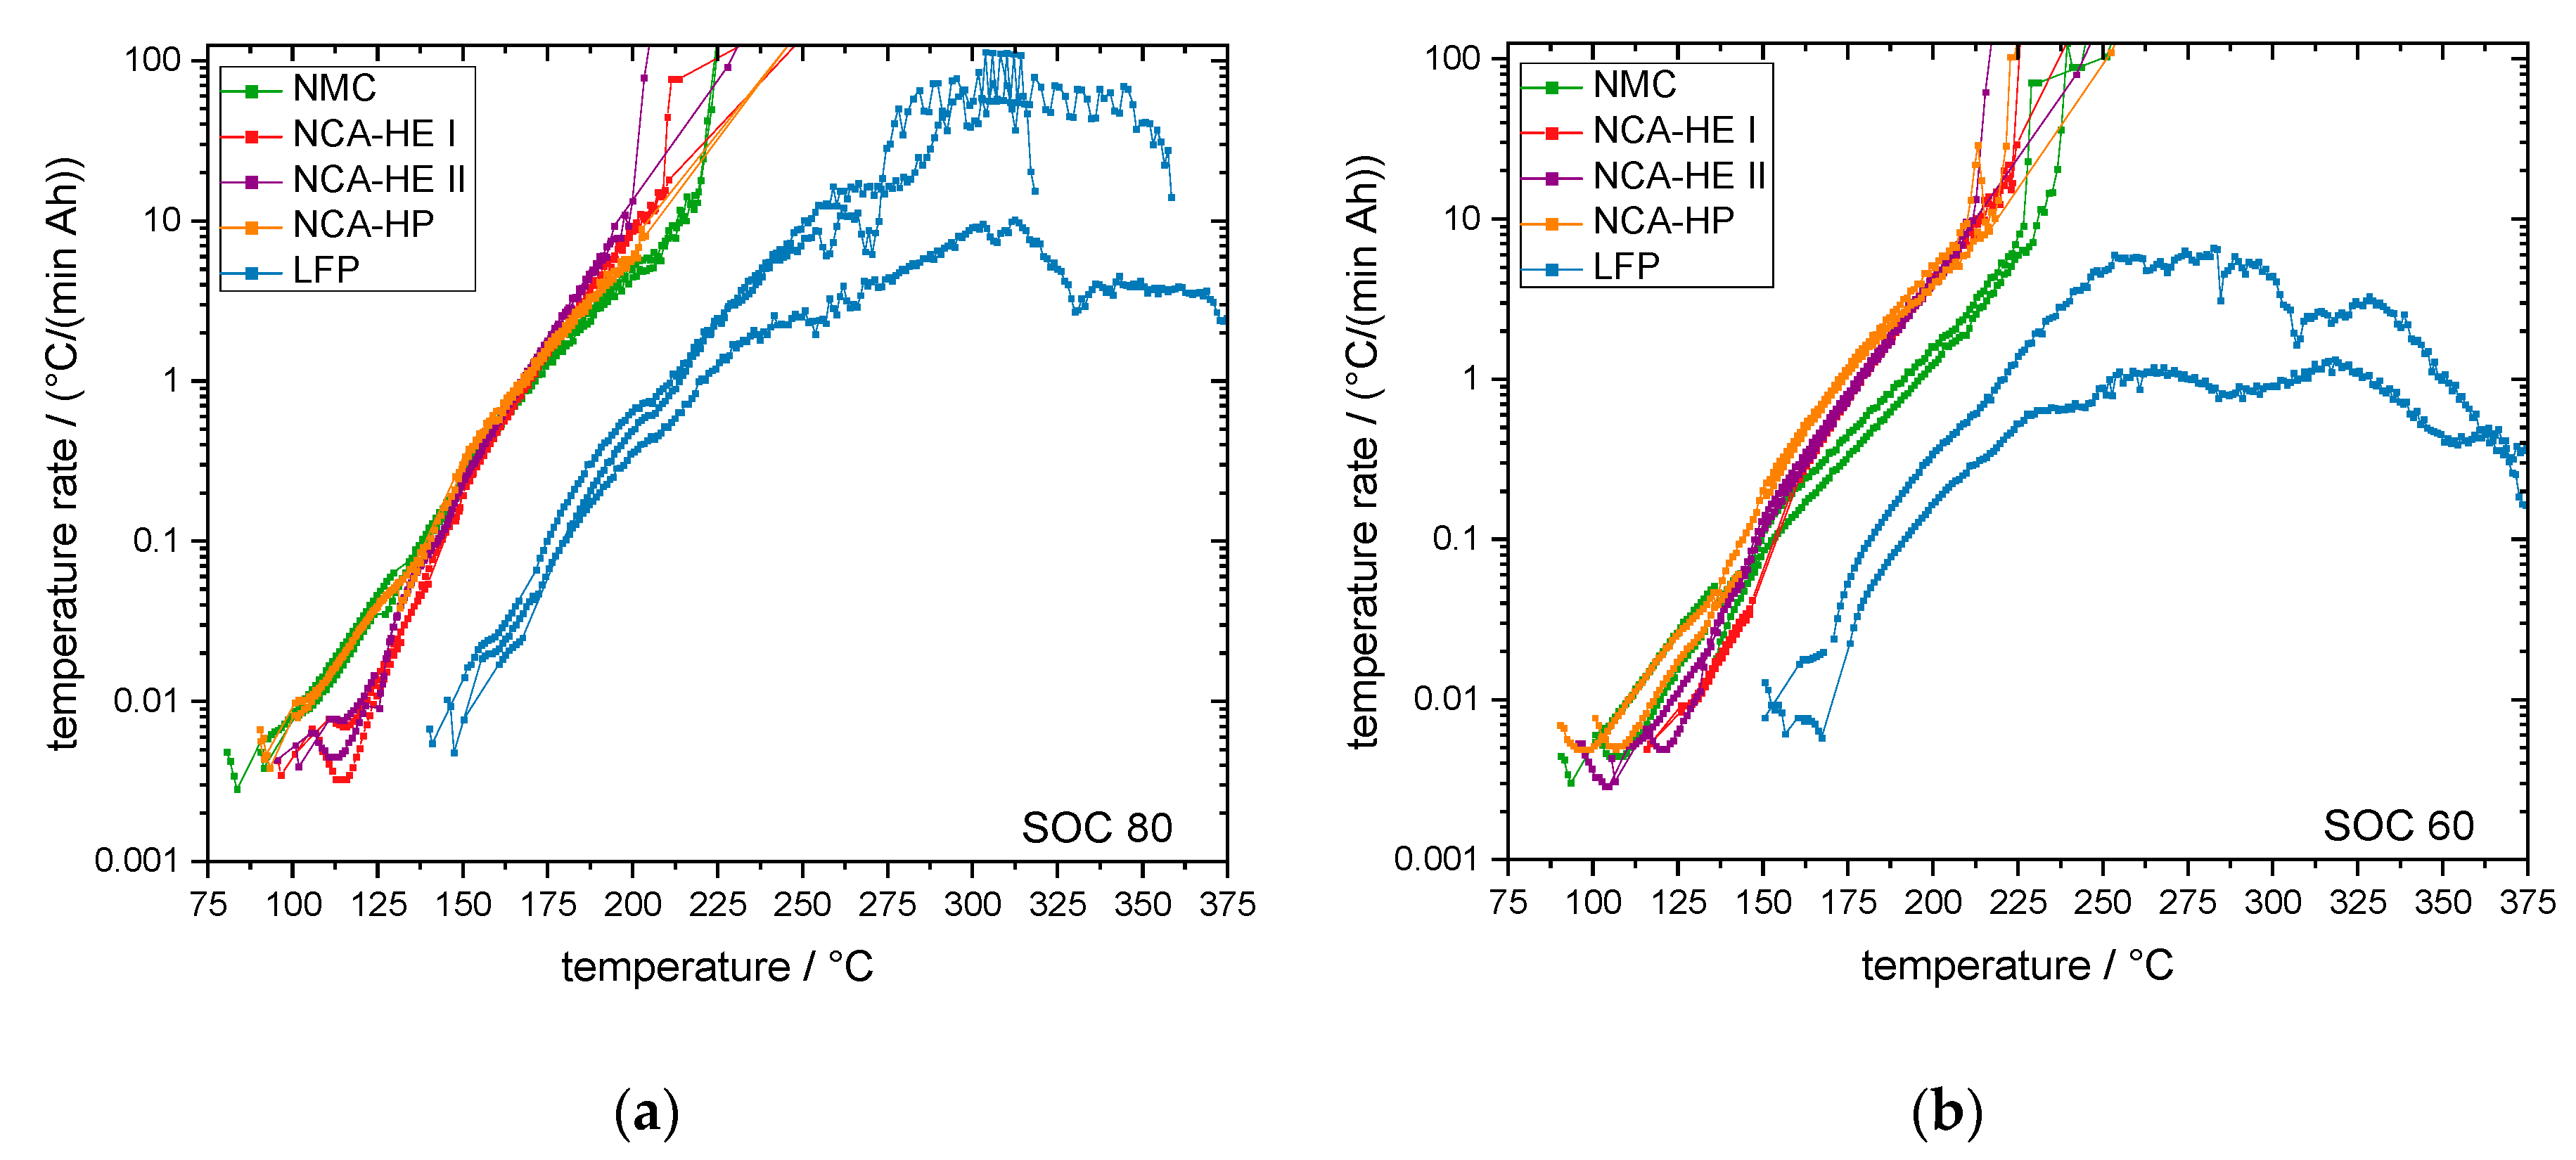
For most SOCs, and in the predominant regions of reaction, NMC cells showed the highest reactivity and reached critical temperatures the earliest. They had an earlier onset, CID trigger and venting temperature than NCA and LFP. The NCA cells were, depending on the temperature rate of the reaction, less reactive than the NMC cells below rates of 1 °C/min.
The start of thermal runaway occurred first for NCA, followed closely by NMC cells. The LFP cells always reacted at higher temperatures and at lower rates, and all critical points were undoubtedly later in time and at higher temperature. Thus, no thermal runaway occurred for SOC 0 under thermal abuse and for all tested SOCs under mechanical abuse. The latter is an outstanding behavior of LFP, making it significantly safer than the other chemistries.
Furthermore, we found through CT analysis important construction differences between NCA-HE and NCA-HP cells, the latter having thicker current collectors and more tabs. Additionally, the maximum capacity difference between the cells was 1 Ah, with about 20 % more capacity in NCA-HE cells, but comparing those cells under thermal abuse showed only small differences.
In addition, through CT analysis, we also found differences in the construction of the safety devices located near the positive terminal, such as the safety vent, CID, and PTC device. This raises the question of the influence of the construction on the cell behavior. All the cells were from different commercial suppliers, and, for NCA-HE, two cells with the same chemistry and capacity, but from two different manufacturers, were directly compared. Both cells reacted very similarly in their exothermal behavior and at the start of thermal runaway. The differences found mostly lay inside the variation range from cell to cell, indicated by the standard deviation in the provided graphs. However, the CID trigger temperature and the venting temperature over different SOCs were shifted between NCA-HE I and NCA-HE II, indicating that the different manufacturers have chosen different pressures to trigger these safety features, whereas NCA-HE II had lower critical temperatures. Interestingly, the different temperatures resulted in the same thermal runaway behavior seen in the exothermal data and a very close start of thermal runaway temperature. Further, for mechanical abuse, the cells behaved similarly, with only slightly higher maximum temperatures for NCA-HE II.

4.2. Influence of SOC

A cell at SOC 100 has a fully lithiated anode and a significant amount of electrical energy stored. However, a cell at SOC 0 has a fully delithiated anode and just a small amount of electrical energy stored, together with its chemical energy. For SOC 0, we found no thermal runaway for all chemistries with all abuse methods, and can, thus, conclude that thermal runaway requires a lithiated anode.
Additionally, analyzing NMC and NCA, for a higher SOC, most parameters were found to be at lower temperatures; however, for LFP the SOC influence was not always clear and sometimes a higher SOC resulted in a lower temperature, meaning higher reactivity. As the anode was the same for LFP cells, this indicates that here the lithiation state of the LFP cathode was relevant and influenced the behavior. A summary of the SOC influence on critical temperatures is provided in Table 19.
With a higher lithiation level of the anode, more hydrocarbons can be formed during the decomposition reactions. This results in a more severe thermal runaway reaction at high SOC and the earlier reaching of critical points, such as venting or the start of thermal runaway. While most parameters had a negative temperature coefficient with the SOC, meaning they occurred at lower temperatures for a higher SOC, there were some exceptions.
As mentioned, LFP stood out and had either no clear SOC influence or even a positive temperature coefficient, meaning low SOCs were more reactive, which was the case for the CID trigger temperature and the maximum temperature. For SOC 60, one of two LFP cells reached a rate of above 10 °C/min (not capacity standardized rate), and, additionally, met the criterion used to define thermal runaway given in Table 3, whereas the other cell tested did not. Heat damage, discoloration and soot was found on these cells after the test. We conclude that, at SOC 60, LFP cells went into thermal runaway but with very low rates; however, with a different definition of thermal runaway, a different conclusion is possible. At SOC 30, one of three LFP cells exceeded 10 °C/min (not capacity standardized rate) shortly, but none of the LFP cells reached the criterion defined for thermal runaway in Table 3. Reaction of all LFP cells stopped between 250 °C and 275 °C without further heating; therefore, we conclude that no thermal runaway occurred for SOC 30 for LFP cells. Post-mortem analysis showed blank aluminum casing but no internal cell components on the outside; thermal damage was expected to come from heating up to 350 °C during test and not from thermal runaway.
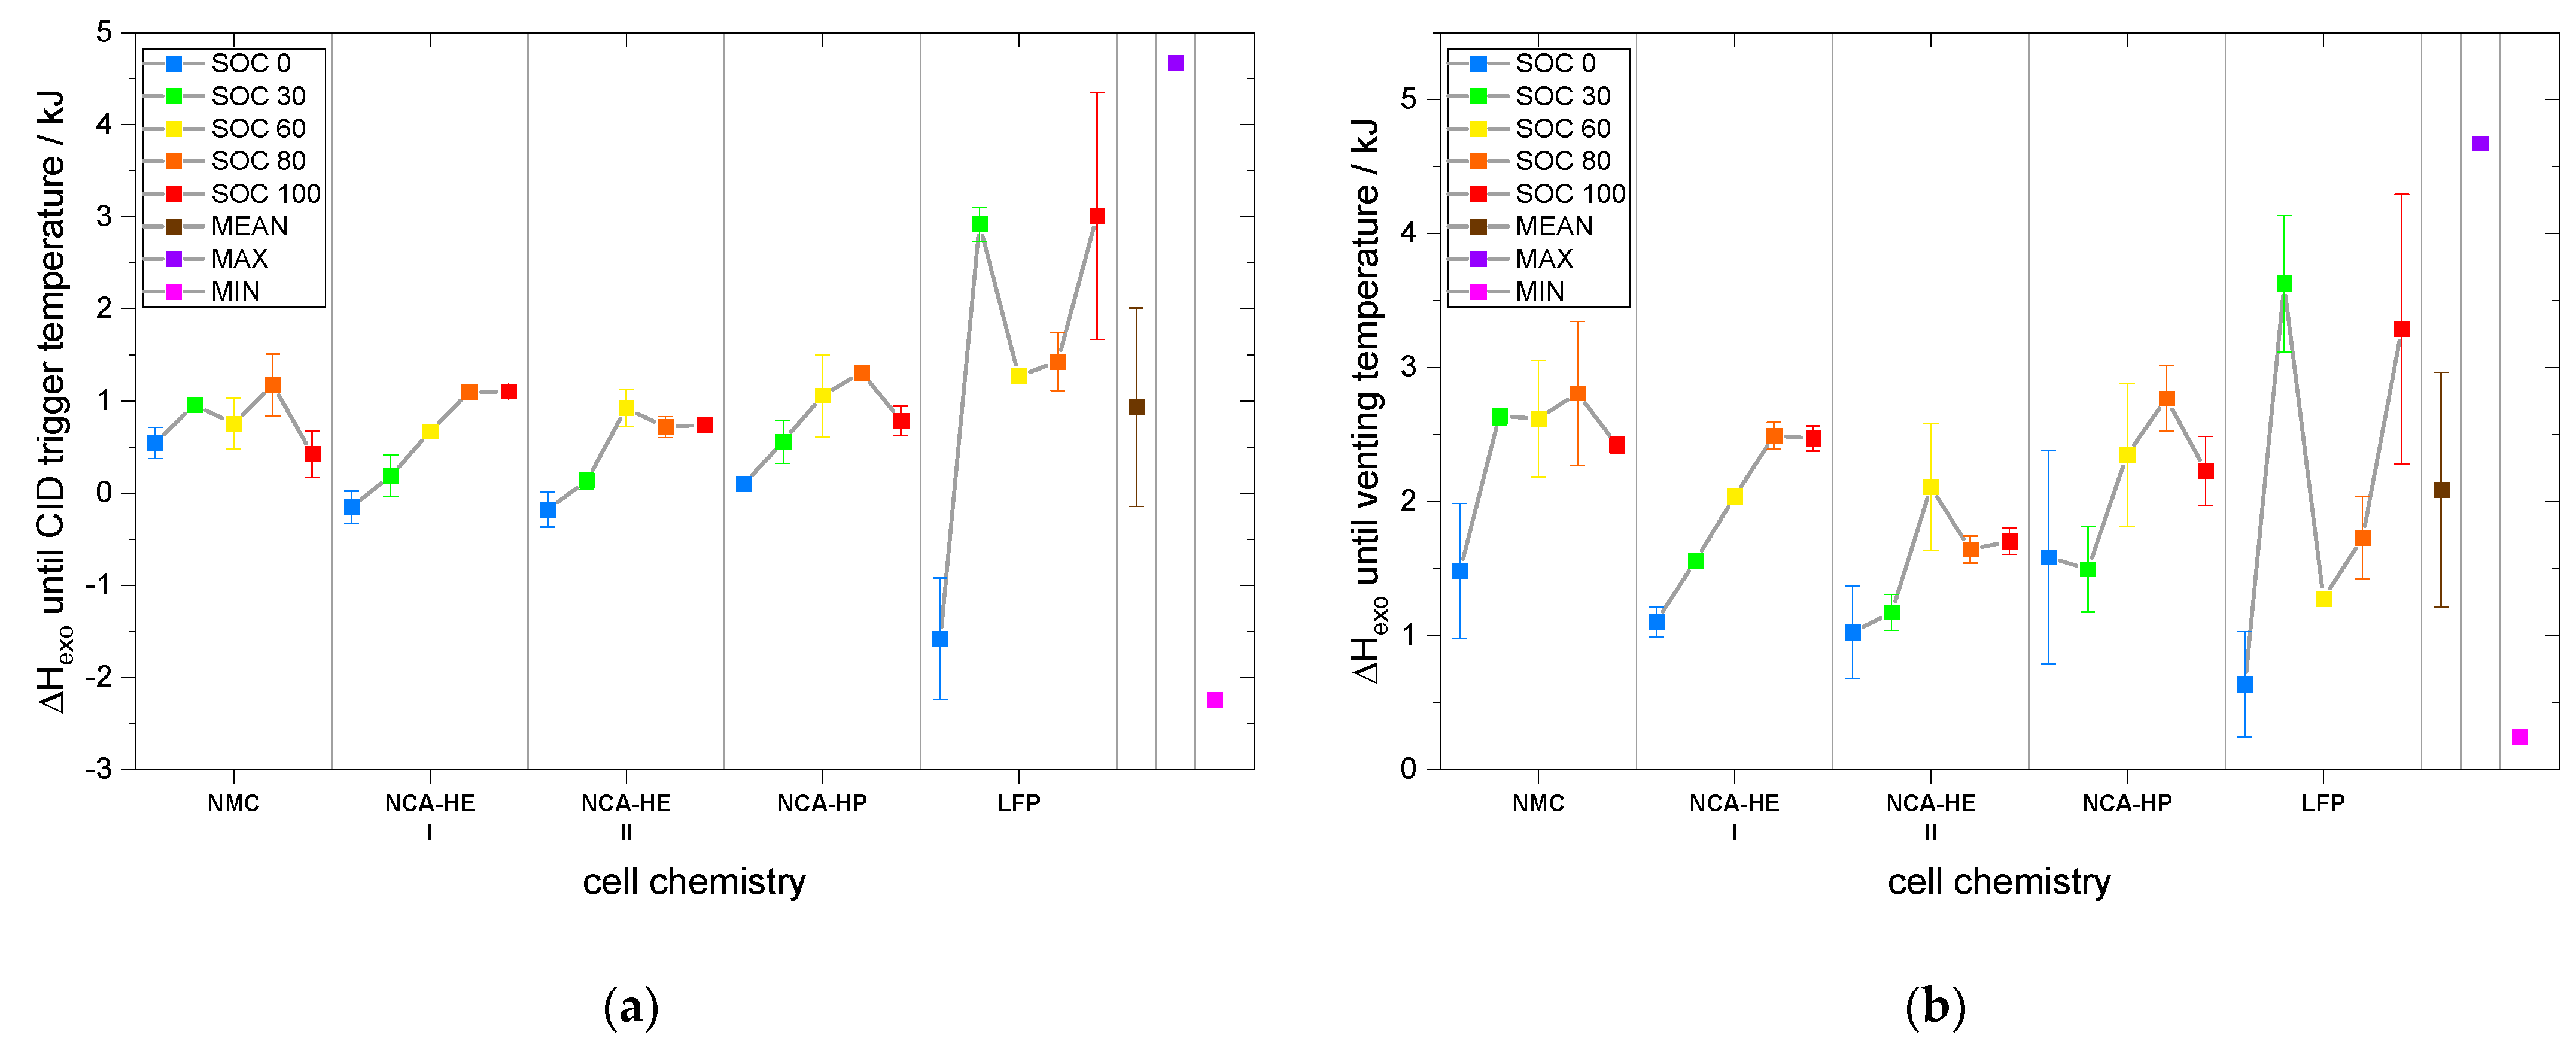
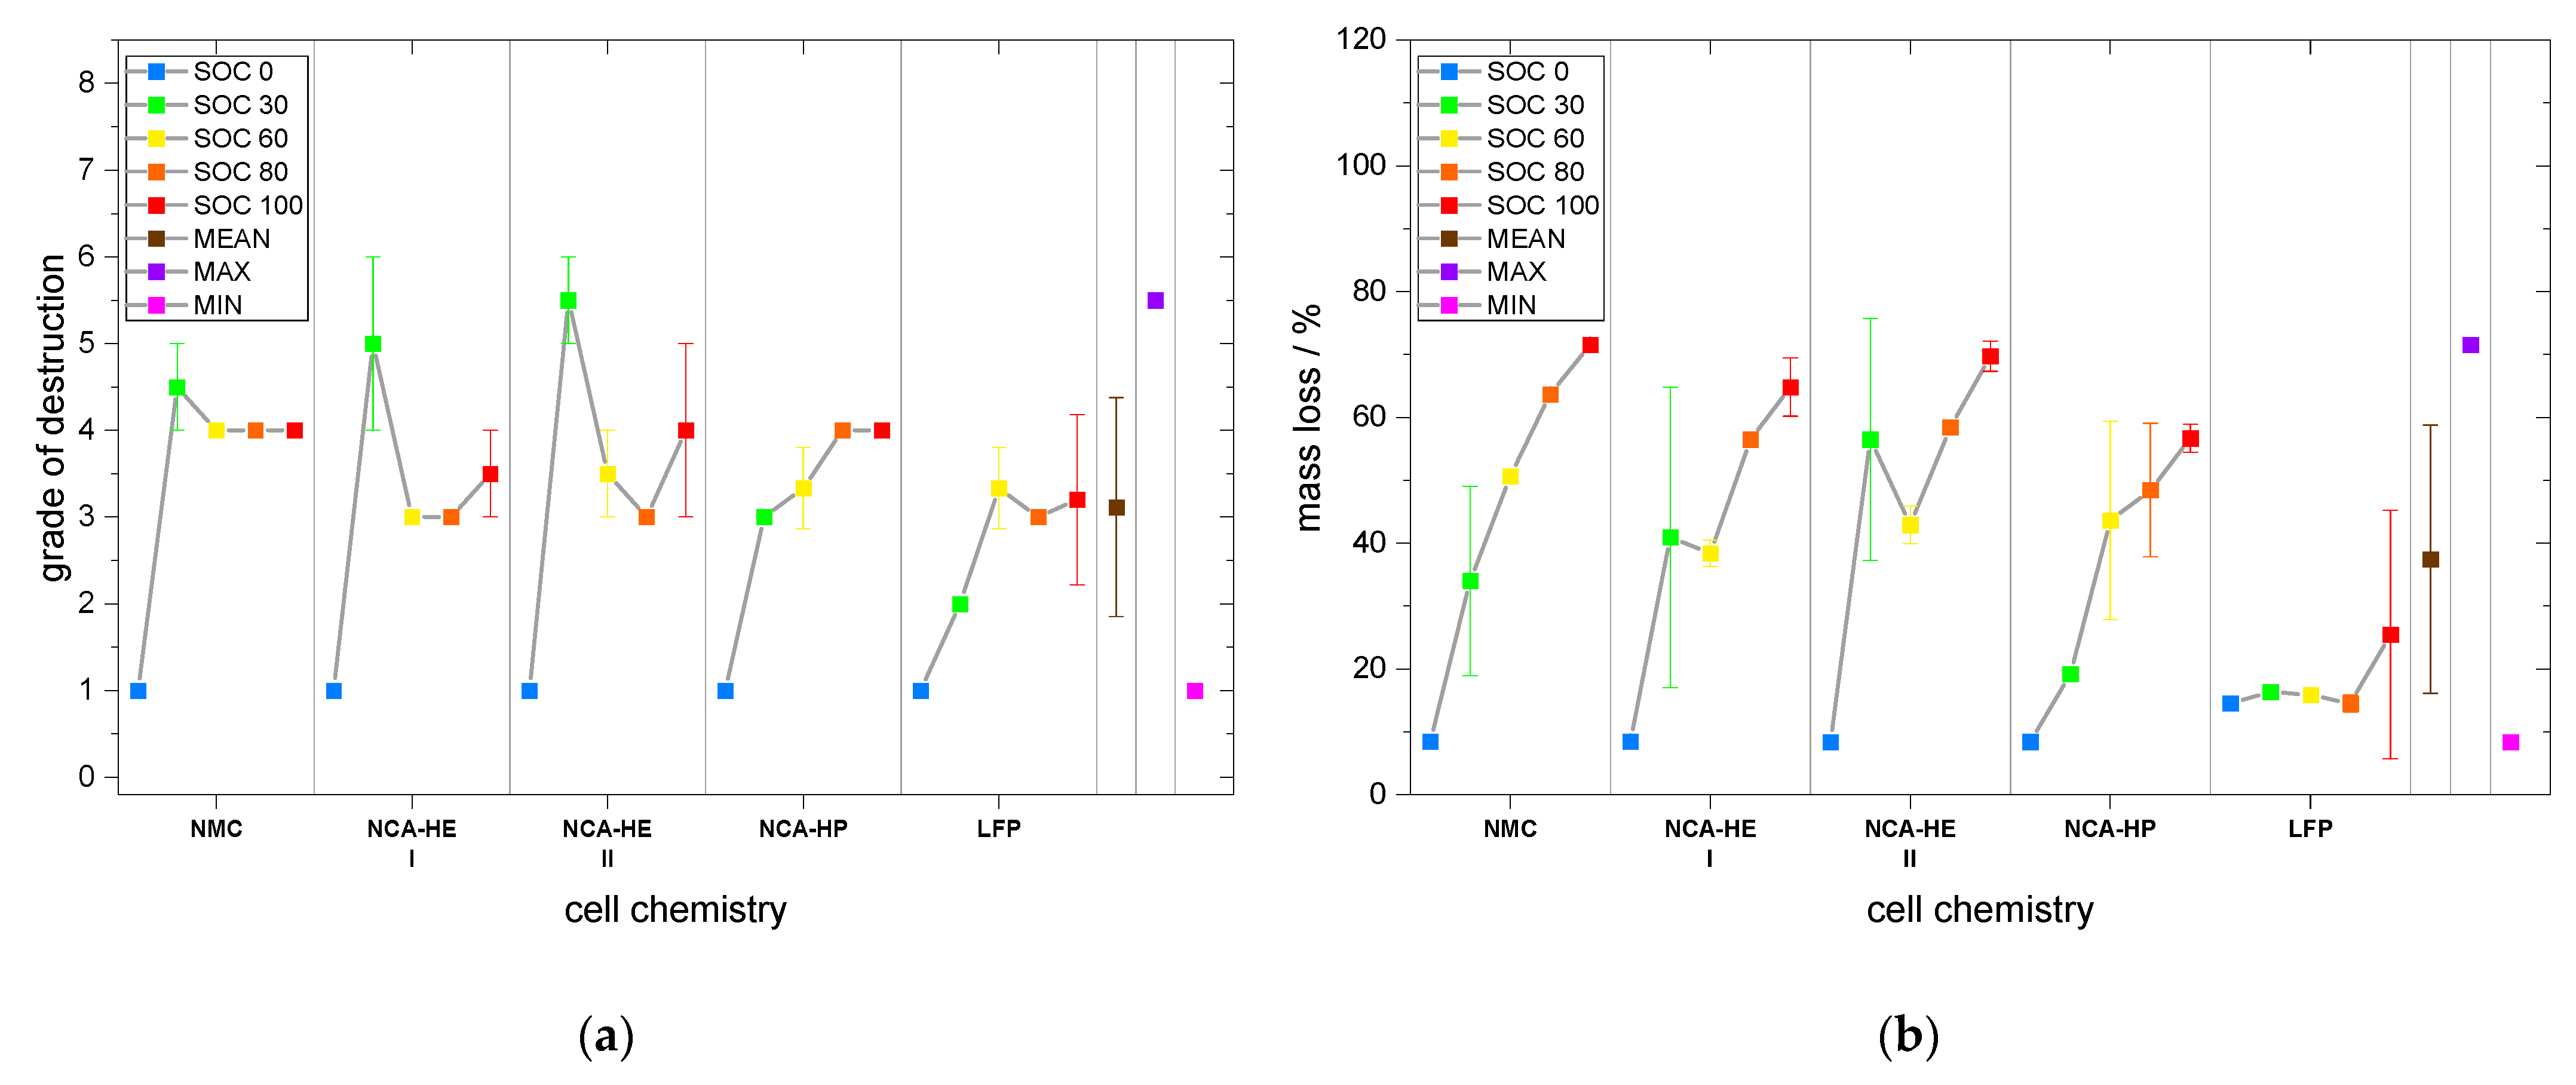
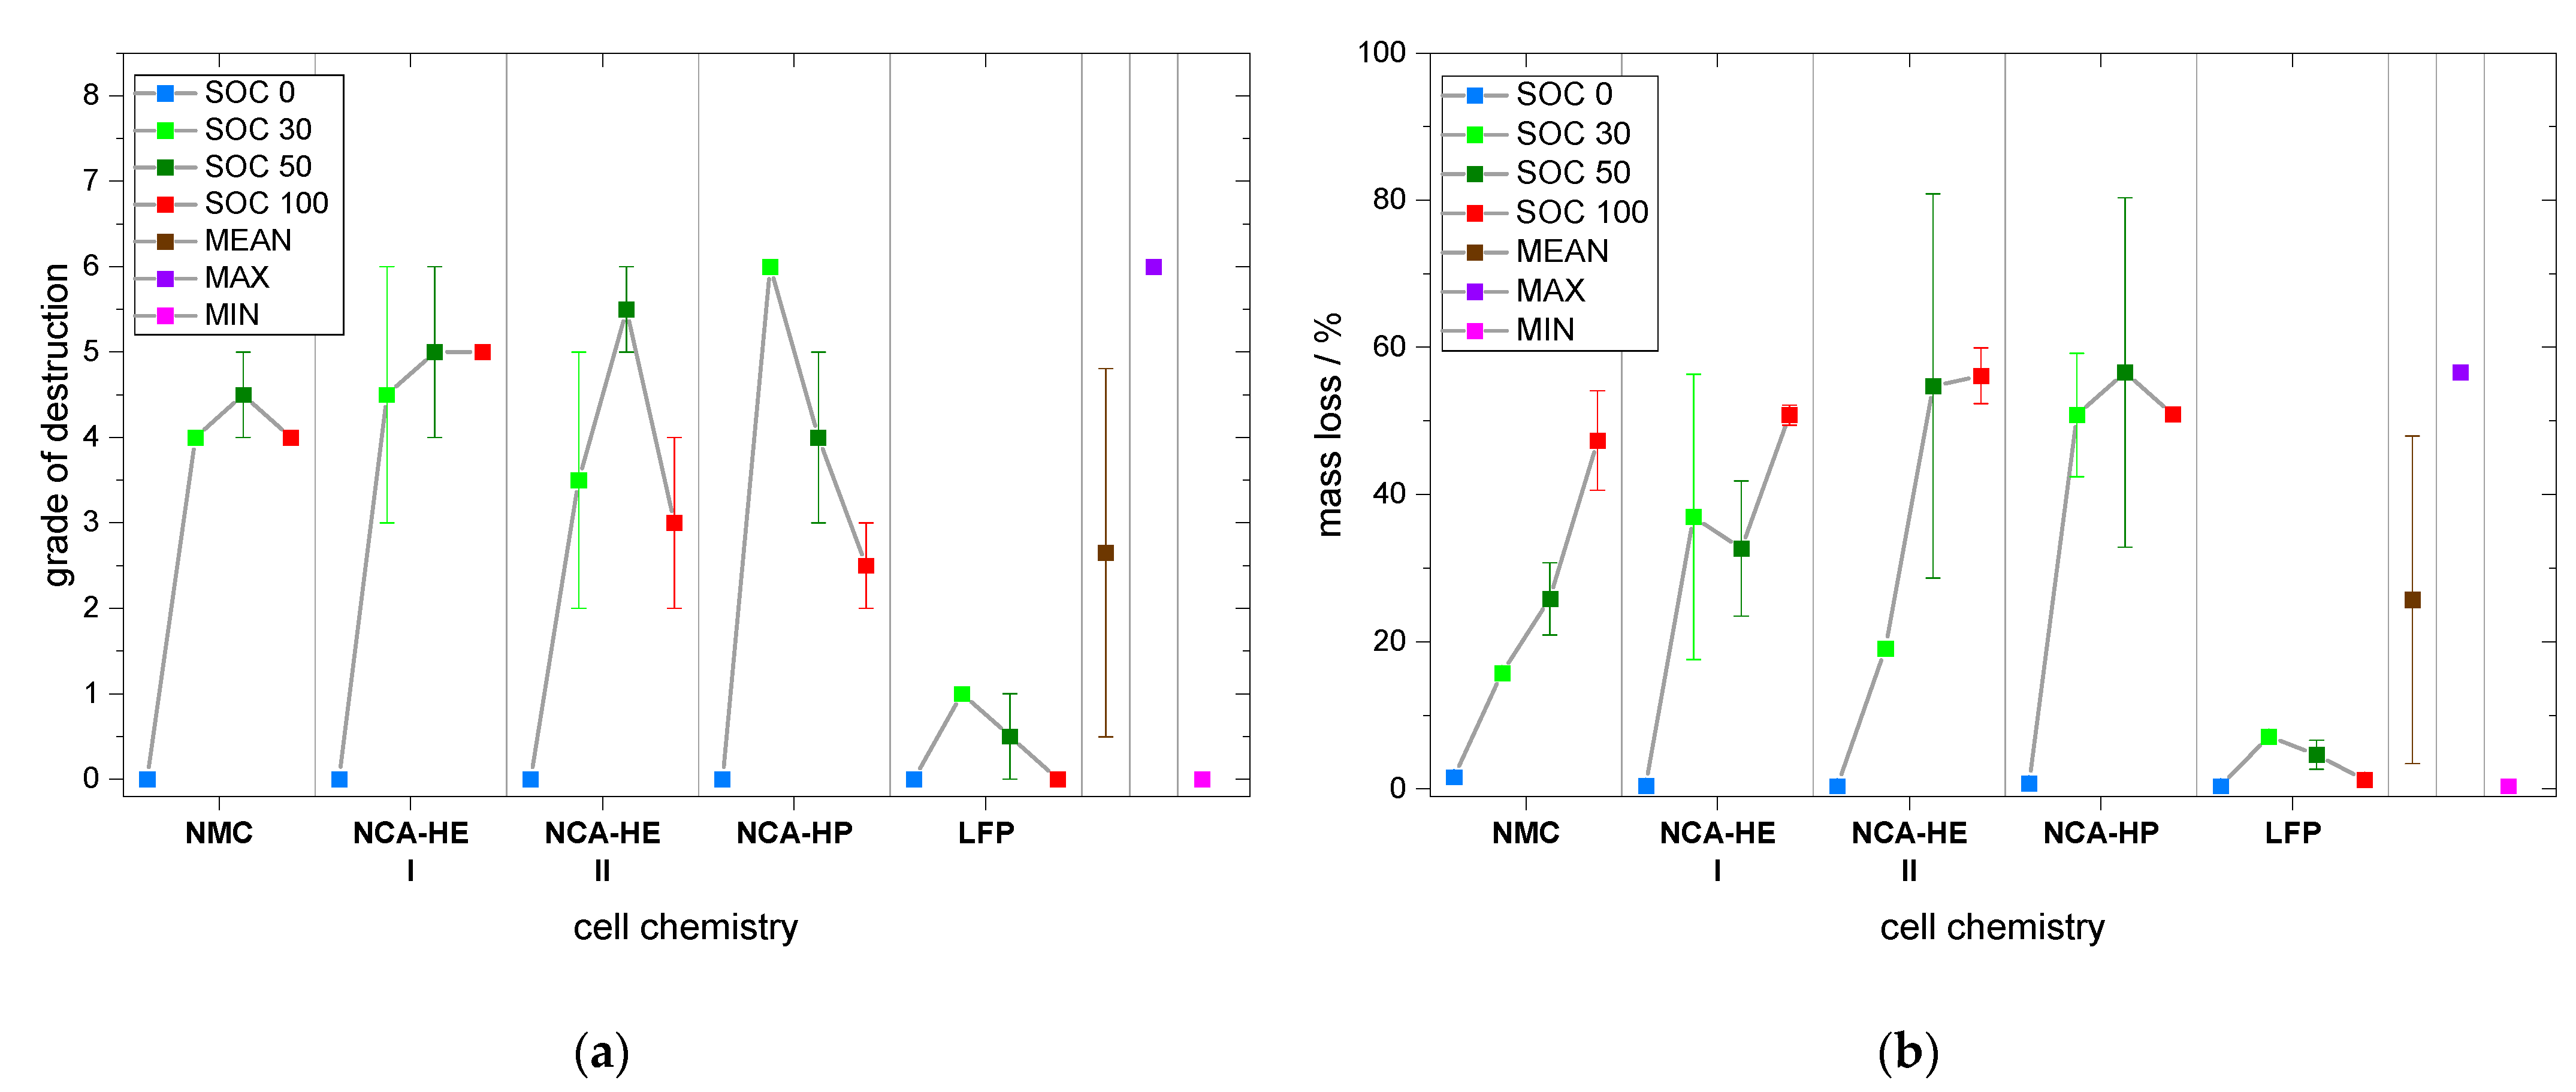
Moreover, for the grade of destruction for both abuse methods and mass loss for nail penetration, the highest was found for either SOC 30 or 50 for nearly all chemistries and tests. The grade of destruction was due to the explosion occurring during thermal runaway; thus, at lower SOC, we estimate a higher amount of hydrogen to be released or a different amount of oxygen, creating a more explosive gas mix than for SOC 100. It is also possible that at SOC 100 ignition occurred earlier with less hydrogen and was, thus, less violent than for SOC 30/50, where explosion could be triggered at a moment where more hydrogen was present. Thus, jelly roll ejection occurred more often at SOC 30 than at other SOC, which might indicate the formation of a more flammable vapor inside the cell. Moreover, the low reaction speeds at the beginning might have led to a different degradation process that resulted in a more powerful thermal runaway at the end for SOC 30. The mass loss indicates the combustion intensity as well as whether a lot of mass was ejected from the cell during runaway. It is partially coupled to the grade of destruction, e.g., with jelly roll ejection, a high grade of destruction goes hand-in-hand with extensive mass loss. We observed that mass loss was highest at SOC 100 for thermal abuse and conclude that combustion intensity and the quantity of components reacting during thermal runaway is higher for a more lithiated anode, resulting in higher mass loss during the experiment.
Furthermore, in the exothermal behavior of the cells with SOC 0, several decreases in exothermal behavior could be the consequence of endothermal reactions taking place. The influence of separator melting, and electrolyte evaporation was considered to be a possible factor; therefore, the melting point of PE at about 125–132 °C (which, however, was delayed by the Al2O3 coating), as well as the boiling point of all individual carbonates in the electrolytes, given in Table 20, was compared with the points of diminishing rates found in the exothermal data of SOC 0. However, it was not possible to correlate the observed slowing of rates with any of the known boiling or melting points. Therefore, we conclude that the cascade of reactions and the decomposition of the active material at SOC 0 itself consisted of several phases with diminishing rates and would stop by itself if no more heat was added.
The fact that at SOC 0 no thermal runaway occurred for all chemistries and abuse methods is useful for recycling processes and analysis that need cells to be disassembled. Additionally, the storage of a system that will not be put into service again should be undertaken at SOC 0 to prevent thermal runaway.
However, as prolonged SOC 0 storage can damage systems because of a further self-discharge of the cells over time, this state is not an option for the transport or shipping of new batteries and systems. Therefore, SOC 30 is more favorable, as, at this SOC, reactivity is slower and critical temperatures occur at higher points compared to a higher SOC. Nevertheless, at this SOC, a fire risk is present for mechanical and thermal abuse and preventive measures need to be considered to prevent and to detect a thermal runaway event.

4.3. Influence of Abuse Method

When comparing the results of thermal and mechanical abuse in this study, one must consider that not the exact same SOCs were tested. In consequence, the average SOC for thermal abuse was SOC 54 and the average SOC for mechanical abuse was SOC 45. Therefore, the average values cannot be perfectly compared for the impact of the abuse method on each chemistry. They can, however, be compared at specific SOC and for the overall behavior for all chemistries and SOC.
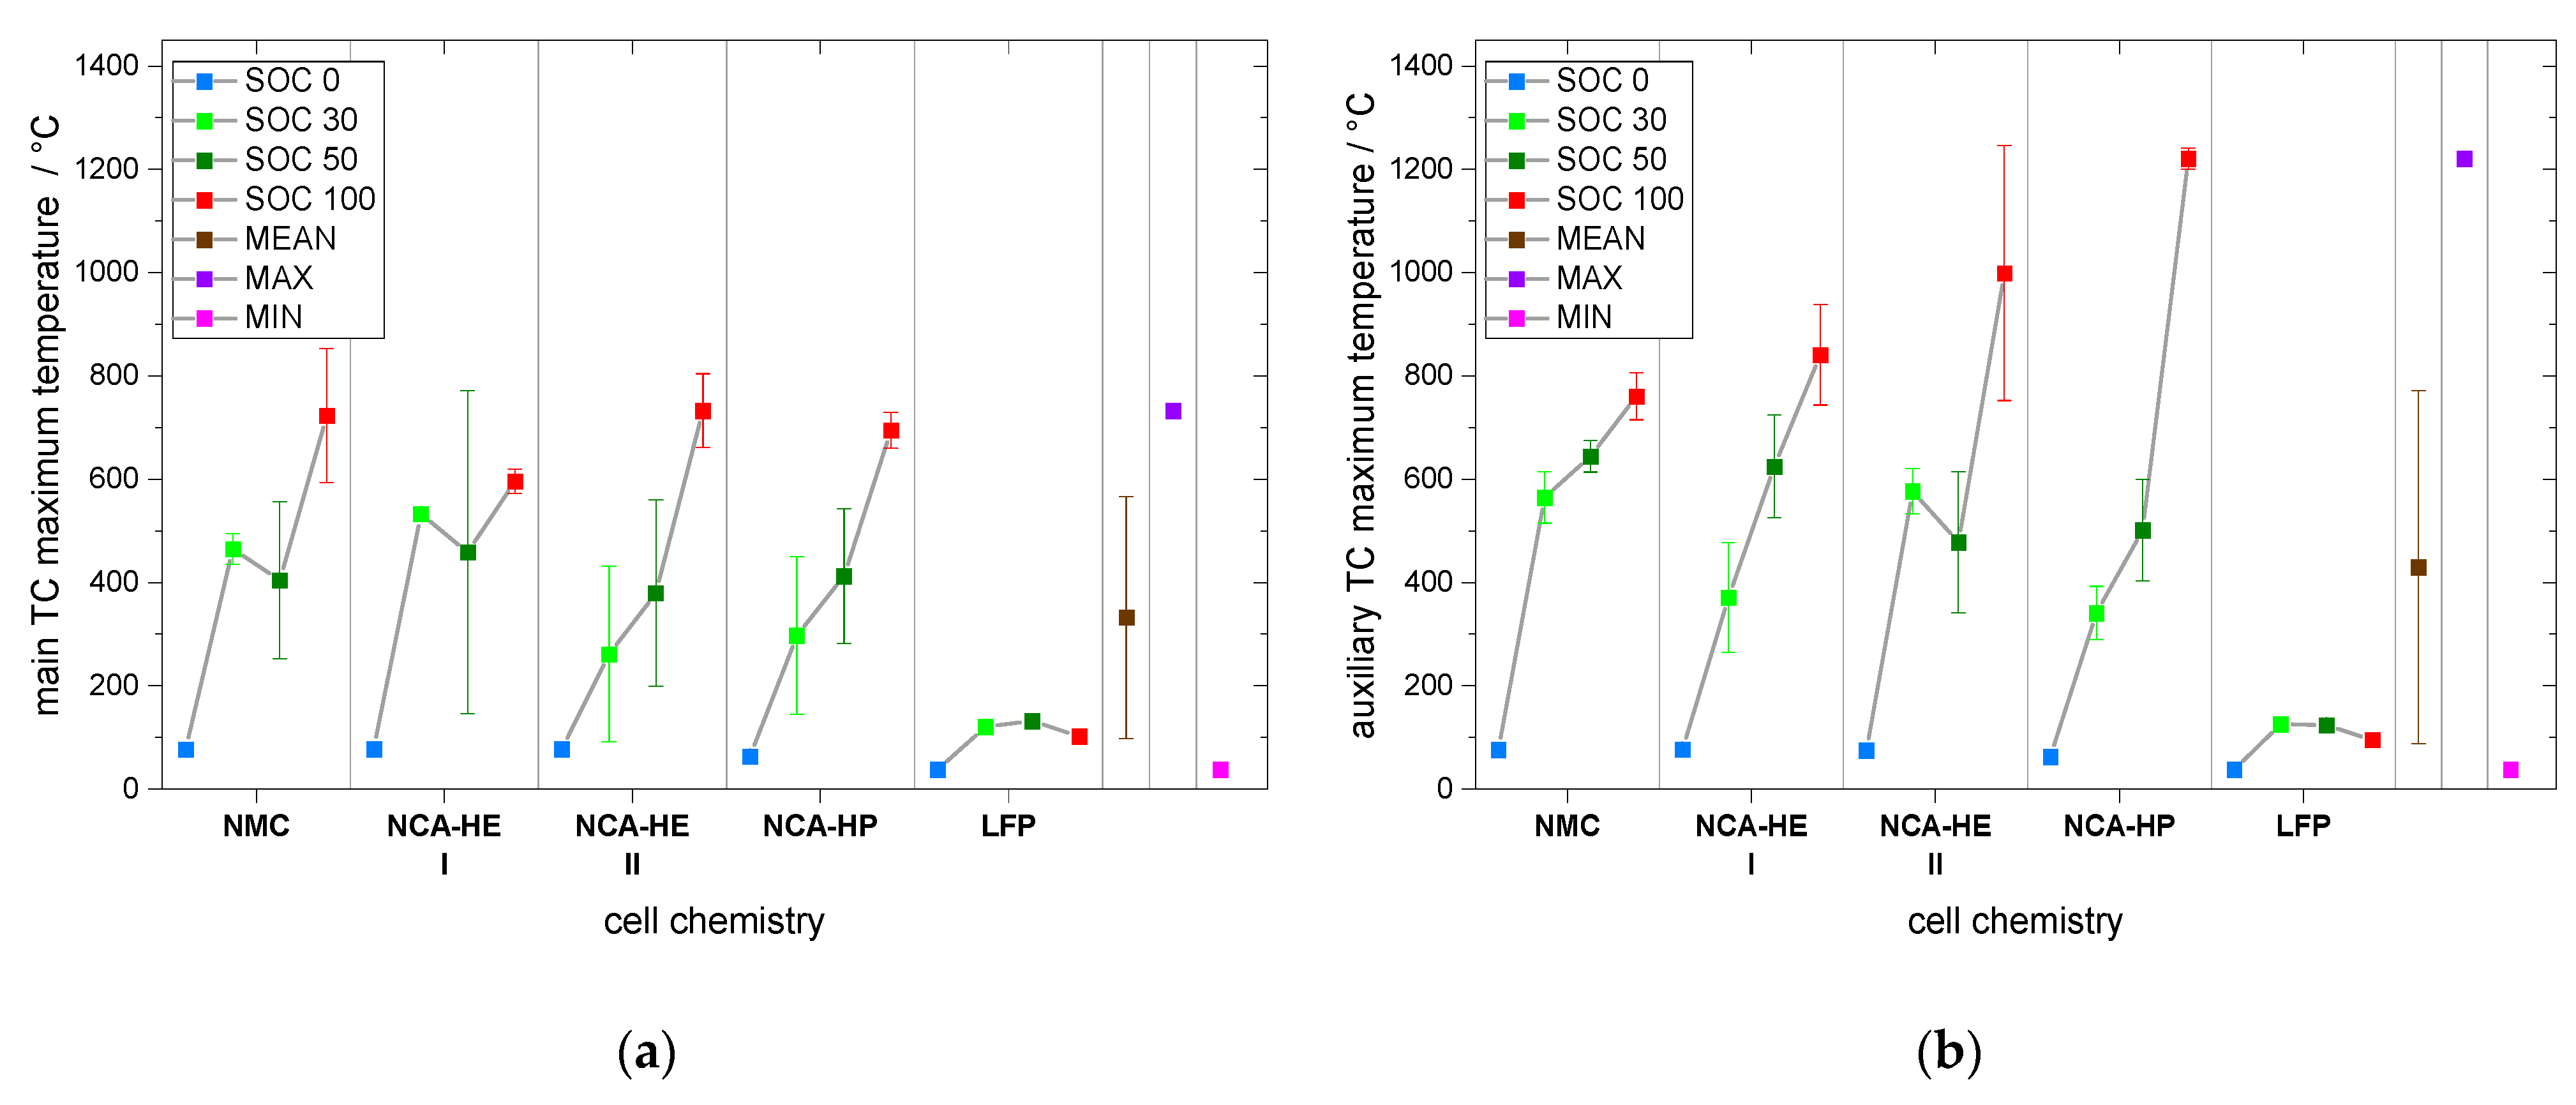
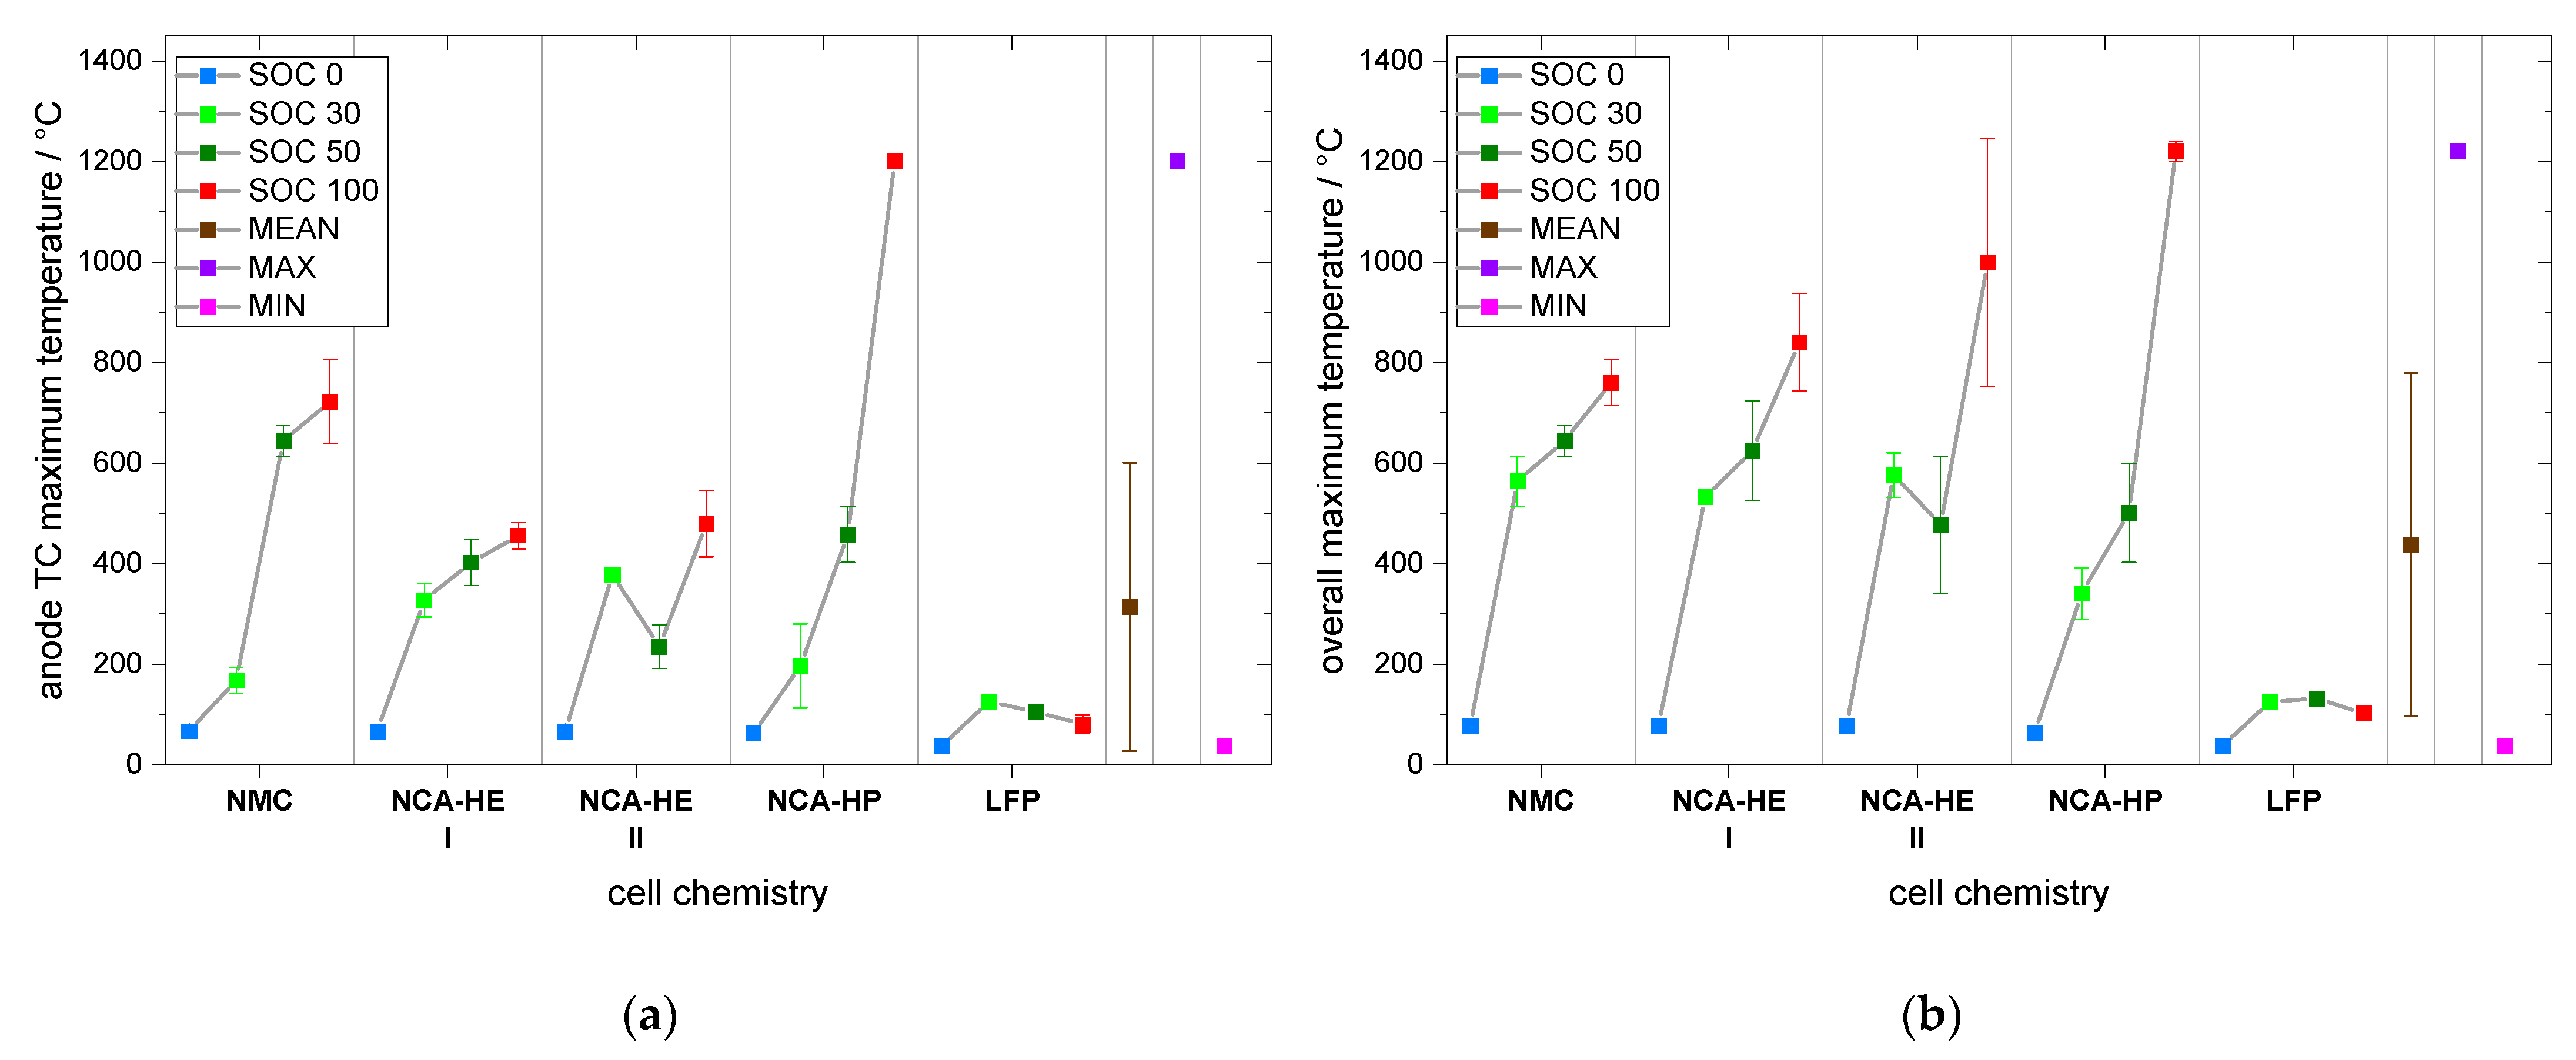
Furthermore, comparing the maximum temperatures, the exceptional maximum temperature value was found for mechanical abuse with 1220 °C, but also the lowest maximum temperature occurred for a mechanical abuse experiment at only 37 °C. While the average for mechanical abuse was 314 °C, over all tests at the center, and 439 °C at the auxiliary thermocouple location, for thermal abuse, it was found to be 492 °C, in a range of 359 °C to 837 °C. Thus, the average was close and a battery fire burned at similar temperatures for both abuse methods, but the extreme temperature above 1000 °C was only found for mechanical abuse.
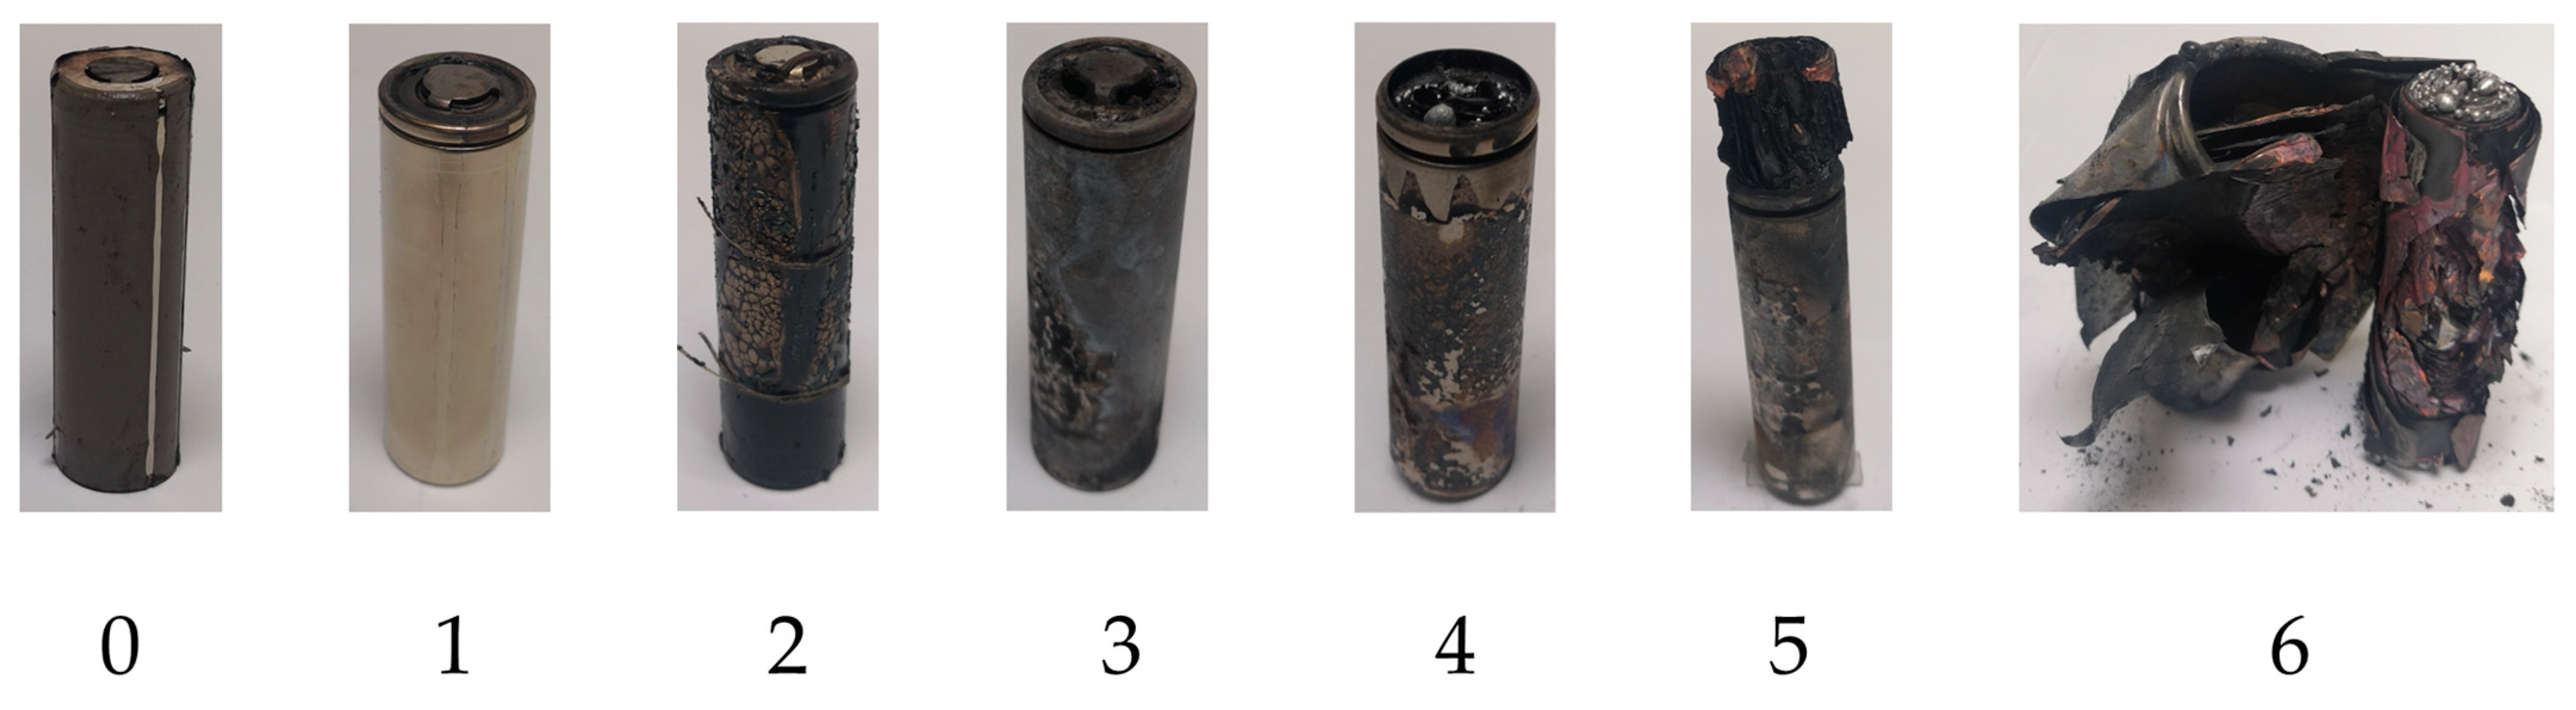
Moreover, the grade of destruction, on average, was of grade 2 for mechanical abuse; hence, it was lower than for thermal abuse, with an average grade of 3. This makes sense, because of the longer time the thermal abuse takes (several days compared to a few minutes) and since grade 3 represents a loss of components, such as molten aluminum on the top.
Subsequently, mass loss by nail penetration was on average 26%, also smaller than the 37 % we found for thermal abuse.

4.4. System Safety Design Based on the Critical Temperatures

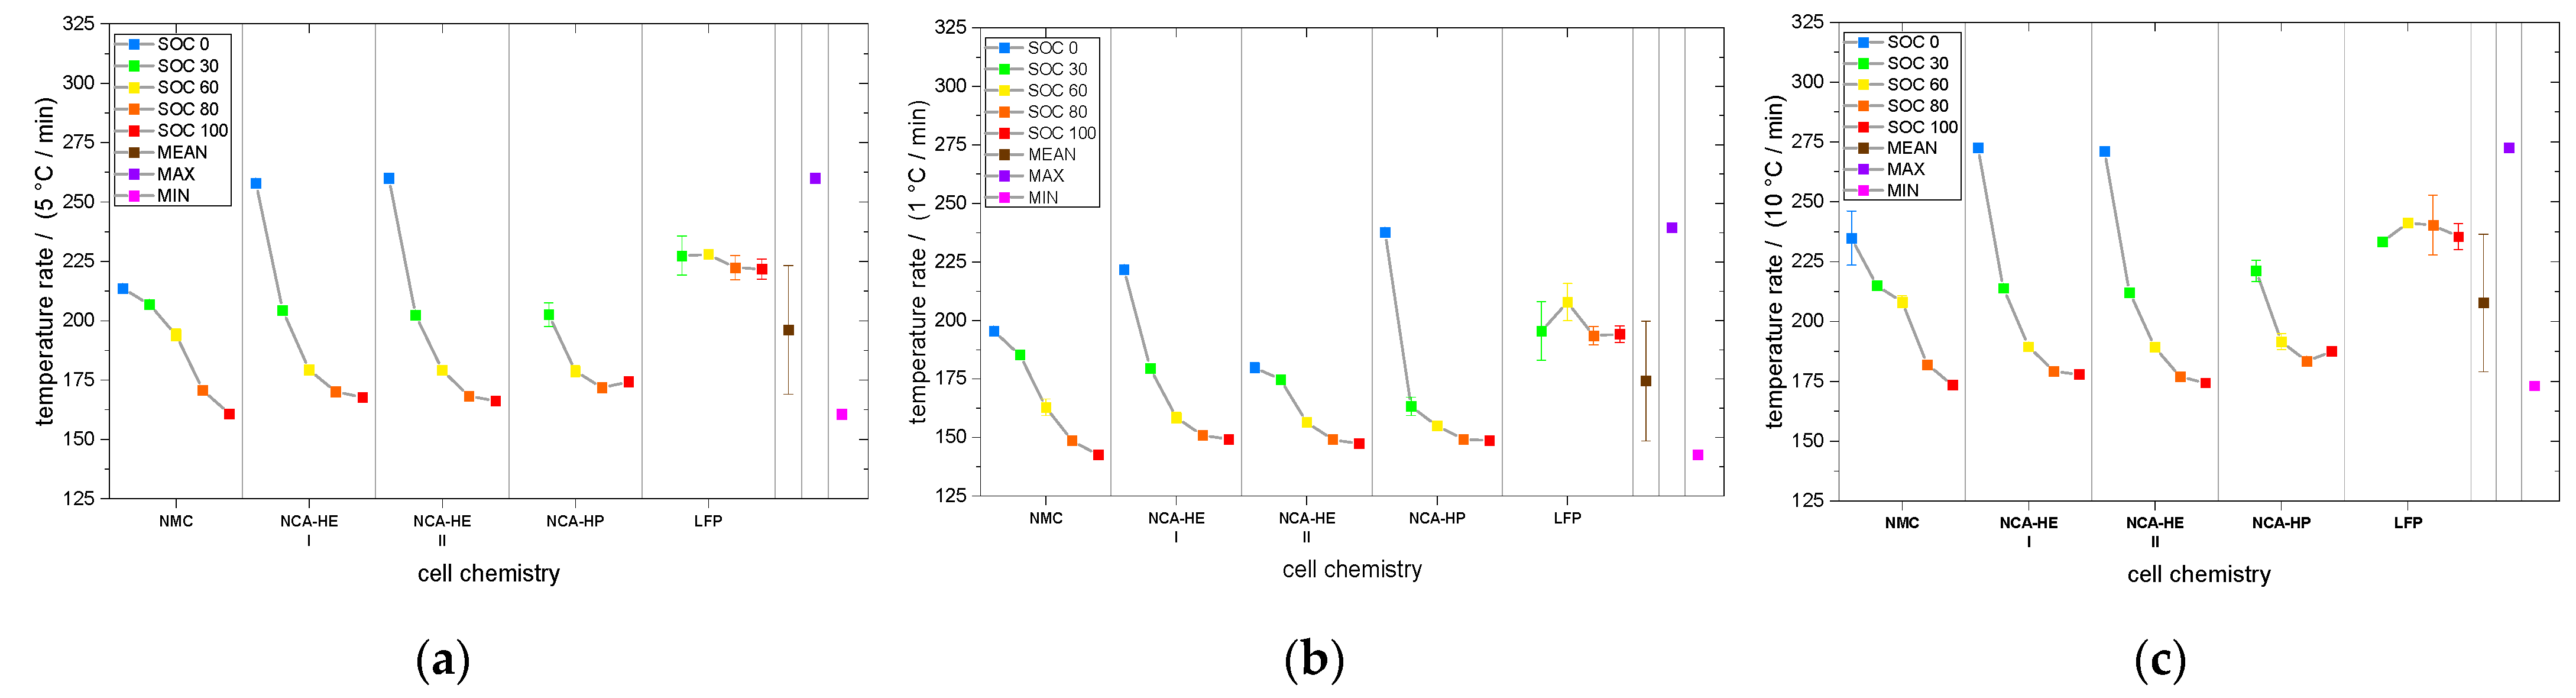
It can be inferred from this paper, that SOC 100 is not always the worst case, and that the SOC impact is different from chemistry to chemistry. In addition, in an emergency, the exact SOC of each cell and the chemistry of the system might not be known. Thus, for all measured and calculated values, the average, minimum and maximum values are given in this paper to enable them to be used for system design or safety analysis, which needs to be adapted to all SOC. Likewise, the critical temperatures are relevant and have an impact on the integrity of a system where the battery is included. Indeed, when reaching the CID trigger temperature of several cells, the high volt system of an electric car can shut down and significantly reduce the relevant functions of the car. Thereafter, at the venting temperature, toxic gases are emitted from the battery and there is an explosion hazard. The given critical temperatures for reaching temperature rates of 1, 5 and 10 °C/min can be used to trigger an emergency cooling system. Finally, at the start of the thermal runaway temperature, where a battery fire is inevitable, systems to stop thermal propagation need to be triggered.

4.5. Consequence for the Extinguishing of Battery Fires

To consider fire extinguishing based on this data, the maximum temperature is of most relevance, but also the start of the thermal runaway temperature.
The latter indicates when a battery fire can be anticipated and the former gives indications about the suitable extinguishing agents; both are presented in Section 3.3.
Hence, for LFP cells, the thermal runaway start occurred between 250 °C and 301 °C, and for the other chemistries between 189 °C and 270 °C; the average for all SOC and chemistry was 257 °C. Thus, a system heated to this temperature containing batteries can be expected to have a battery fire through thermal abuse.
Subsequently, for thermal abuse, an average maximum temperature for all SOC and chemistries was found to be 492 °C, with a minimum of 359 °C and a maximum of 837 °C. Furthermore, for mechanical abuse, the overall maximum temperature ranged from 38 °C to 1220 °C, averaging at 439 °C. It is remarkable that LFP cells did not go into thermal runaway from mechanical abuse.
Moreover, the recorded 1220 °C from mechanical abuse may have been due to the fire of metal components and this should be considered for battery fire extinguishing.

5. Conclusions

We can summarize that accelerating rate calorimetry is a proficient way to quantitatively determine the critical temperatures of thermal runaway and other safety relevant events during cell degradation through thermal and mechanical abuse. We can, therefore, assess cell safety and compare the different thermal runaway behavior observed for different active materials, SOC, cell construction and abuse method.
The severity and occurrence of thermal runaway depends on the active material and the state of charge. With the same active material, the SOC governs the thermal runaway reactions—the overall energy of cells, such as their capacity, is less relevant. The difference between NCA-HE and NCA-HP cells in terms of construction and capacity has only a little impact on thermal runaway behavior.
Moreover, comparing the chemistry, NMC cells were the most reactive and started exothermal reactions the earliest, experiencing most critical temperatures at lower values than for the other chemistries. Interestingly, this led to thermal runaway a little later than NCA because of a lower slope of the reaction or change in slope, indicating the reaction slowing down.
NCA cells reacted faster than NMC cells above 1 °C/min and, thus, reached thermal runaway a little earlier, but reacted slower than NMC cells below 1 °C/min. Thus, most critical temperatures were reached later by NCA. For mechanical abuse, NMC and NCA cells behaved comparably, except for a very high temperature, reached only by NCA-HP cells.
Further, the thermal runaway behavior of LFP cells was different; they only reacted at higher temperatures and much more slowly. The SOC corresponds to the lithiation state of the anode and cathode of the cell and, therefore, the ability to go into thermal runaway, which did not occur for thermal abuse and mechanical abuse at SOC 0 for all cells tested. For the LFP cathode material, no thermal runaway was observed for mechanical abuse and at SOC 0 and SOC 30 for thermal abuse. However, the higher temperatures and lower temperature rates for LFP cell reaction can make the detectability of runaway events harder and battery management systems need to be adapted.
Therefore, it can be concluded that LFP cells are inherently safer than NCA and NMC cells. This comes at the price of a lower capacity; the cells of same size 21700 of LFP cathode are only commercially available at a capacity of 3 Ah, while NMC and NCA are available with 5 Ah. This represents 2 Ah less and even 8.1 Wh less as the nominal voltage is lower as well:
W = Unom · C => WNCA/NMC = 3.6 V · 5 Ah = 18 Wh vs. WLFP = 3.3 V · 3 Ah = 9.9 Wh
Hence, redesign of the energy storage is needed when LFP cells are used. However, considering that during mechanical abuse for the NCA-HP cell a temperature of 1220 °C was measured for high SOC, and LFP cells did not reach temperatures above 136 °C, this creates room for a different, lightweight overall system design, with inclusion of more cells to obtain comparable capacity.
To conclude, whilst the critical temperatures were lower and the temperature rates highest at SOC 100, because of an overall higher reactivity at this SOC, the grade of destruction was observed to be higher at SOC 30 or 50, respectively. These parameters are relevant to assess the thermal propagation risk in a battery pack. Additionally, the maximum temperature of thermal runaway, which is higher for mechanical abuse than for thermal abuse, is relevant for full system design and safety evaluation.

Author Contributions

Conceptualization, S.O., P.F.; investigation, S.O., P.F., C.F., N.U., N.L.; data curation, S.O.; writing—original draft preparation, S.O., C.F.; writing—review and editing, S.O., P.F., C.F., C.Z., H.J.S.; visualization, S.O.; supervision, C.Z., H.J.S.; All authors have read and agreed to the published version of the manuscript.

Funding

This research was funded by the Helmholtz Association, in the programme Materials and Technologies for the Energy Transition (MTET), and we want to express our gratitude for the funding. We gratefully acknowledge the German Federal Ministry of Education and Research (BMBF) for the financial support of the project AnaLiBa (03XP0347B) within the AQua cluster as well as Projektträger Jülich (PTJ). This work contributes to the research performed at CELEST (Center of Electrochemical Energy Storage Ulm-Karlsruhe).

Data Availability Statement

The experimental data, consisting of the exothermal data for all tested cells in thermal abuse, which is presented in Section 3.4.1, is available at https://doi.org/10.5281/zenodo.7707929. As well as the maximum temperature from the same experiments presented in Section 3.3.1, is available at https://doi.org/10.5281/zenodo.7867730.

Acknowledgments

We want to thank Thomas Bergfeldt from the chemical analysis group of IAM-AWP for performing the ICP-OES, CGHE and CS analysis. In addition, we want to thank Freya Müller from IAM-WK for the GC-MS analysis and Andreas Meier for the CT analysis. We are thankful for the help in data treatment of Micha Dietrich and Sophia Heinzmann. Additionally, Alexandra Reif and Nils Löffelholz supported the experimental work.

Conflicts of Interest

The authors declare no conflict of interest. The funders had no role in the design of the study; in the collection, analyses, or interpretation of data; in the writing of the manuscript; or in the decision to publish the results.

Appendix A

The anode TC maximum temperature and the overall maximum temperature of all the thermocouple locations from nail penetration test, for all SOC and chemistries, is shown in Figure A1.
Figure A1. Maximum temperatures during mechanical abuse for all SOCs and cell types (a) recorded at anode TC; (b) overall maximum.
Batteries 09 00237 g0a1

References

  1. Mendoza-Hernandez, O.S.; Ishikawa, H.; Nishikawa, Y.; Maruyama, Y.; Umeda, M. Cathode material comparison of thermal runaway behavior of Li-ion cells at different state of charges including over charge. J. Power Sources 2015, 280, 499–504. [Google Scholar] [CrossRef]
  2. Zhao, W.; Rohde, M.; Mohsin, I.U.; Ziebert, C.; Du, Y.; Seifert, H.J. Combined Thermal Runaway Investigation of Coin Cells with an Accelerating Rate Calorimeter and a Tian-Calvet Calorimeter. Batteries 2022, 8, 15. [Google Scholar] [CrossRef]
  3. Hoelle, S.; Scharner, S.; Asanin, S.; Hinrichsen, O. Analysis on Thermal Runaway Behavior of Prismatic Lithium-Ion Batteries with Autoclave Calorimetry. J. Electrochem. Soc. 2021, 168, 120515. [Google Scholar] [CrossRef]
  4. Bugryniec, P.J.; Davidson, J.N.; Cumming, D.J.; Brown, S.F. Pursuing safer batteries: Thermal abuse of LiFePO4 cells. J. Power Sources 2019, 414, 557–568. [Google Scholar] [CrossRef]
  5. Duh, Y.S.; Sun, Y.; Lin, X.; Zheng, J.; Wang, M.; Wang, Y.; Lin, X.; Jiang, X.; Zheng, Z.; Zheng, S.; et al. Characterization on thermal runaway of commercial 18650 lithium-ion batteries used in electric vehicles: A review. J. Energy Storage 2021, 41, 102888. [Google Scholar] [CrossRef]
  6. Brand, M.; Gläser, S.; Geder, J.; Menacher, S.; Obpacher, S.; Jossen, A.; Quinger, D. Electrical safety of commercial Li-ion cells based on NMC and NCA technology compared to LFP technology. World Electr. Veh. J. 2013, 6, 572–580. [Google Scholar] [CrossRef]
  7. Larsson, F.; Andersson, P.; Mellander, B.E. Lithium-Ion Battery Aspects on Fires in Electrified Vehicles on the Basis of Experimental Abuse Tests. Batteries 2016, 2, 9. [Google Scholar] [CrossRef]
  8. Archibald, E.; Kennedy, R.; Marr, K.; Jeevarajan, J.A.; Ezekoye, O.A. Characterization of Thermally Induced Runaway in Pouch Cells for Propagation. Fire Technol. 2020, 56, 2467–2490. [Google Scholar] [CrossRef]
  9. Feng, X.; Fang, M.; He, X.; Ouyang, M.; Lu, L.; Wang, H.; Zhang, M. Thermal runaway features of large format prismatic lithium ion battery using extended volume accelerating rate calorimetry. J. Power Sources 2014, 255, 294–301. [Google Scholar] [CrossRef]
  10. Li, L.; Ju, X.; Zhou, X.; Peng, Y.; Zhou, Z.; Cao, B.; Yang, L. Experimental Study on Thermal Runaway Process of 18650 Lithium-Ion Battery under Different Discharge Currents. Materials 2021, 14, 4740. [Google Scholar] [CrossRef] [PubMed]
  11. Duh, Y.S.; Lin, Y.C.; Ho, T.C.; Kao, C.S. Experimental study on the runaway behaviors of Panasonic 21,700 LiNi0.8Co0.15Al0.05O2 battery used in electric vehicle under thermal failure. J. Therm. Anal. Calorim. 2022, 147, 12005–12018. [Google Scholar] [CrossRef]
  12. Duh, Y.S.; Theng, J.H.; Chen, C.C.; Kao, C.S. Comparative study on thermal runaway of commercial 14500, 18650 and 26650 LiFePO4 batteries used in electric vehicles. J. Energy Storage 2020, 31, 101580. [Google Scholar] [CrossRef]
  13. Feng, X.; Ouyang, M.; Liu, X.; Lu, L.; Xia, Y.; He, X. Thermal runaway mechanism of lithium ion battery for electric vehicles: A review. Energy Storage Mater. 2017, 10, 247–267. [Google Scholar] [CrossRef]
  14. Ding, M.S. Liquid-Solid Phase Diagrams of Ternary and Quaternary Organic Carbonates. J. Electrochem. Soc. 2004, 151, A731. [Google Scholar] [CrossRef]
  15. Golubkov, A.W.; Scheikl, S.; Planteu, R.; Voitic, G.; Wiltsche, H.; Stangl, C.; Fauler, G.; Thalera, A.; Hacker, V. Thermal runaway of commercial 18650 Li-ion batteries with LFP and NCA cathodes—Impact of state of charge and overcharge. RSC Adv. 2015, 5, 57171–57186. [Google Scholar] [CrossRef]
  16. Ziegler, A.; Oeser, D.; Hein, T.; Montesinos-Miracle, D.; Ackva, A. Run to Failure: Aging of Commercial Battery Cells beyond Their End of Life. Energies 2020, 13, 1858. [Google Scholar] [CrossRef]
  17. Horsthemke, F.; Winkler, V.; Diehl, M.; Winter, M.; Nowak, S. Concept for the Analysis of the Electrolyte Composition within the Cell Manufacturing Process: From Sealing to Sample Preparation. Energy Technol. 2020, 8, 1801081. [Google Scholar] [CrossRef]
  18. Takahashi, Y.; Azumi, T.; Sekine, Y. Heat capacity of aluminum from 80 to 880 K. Thermochim. Acta 1989, 139, 133–137. [Google Scholar] [CrossRef]
  19. Ziebert, C.; Melcher, A.; Lei, B.; Zhao, W.; Rohde, M.; Seifert, H.J. Chapter Six—Electrochemical–Thermal Characterization and Thermal Modeling for Batteries. In Emerging Nanotechnologies in Rechargeable Energy Storage Systems; Rodriguez-Martinez, L.M., Omar, N., Eds.; Elsevier: Amsterdam, The Netherlands, 2017; pp. 195–229. [Google Scholar] [CrossRef]
  20. Richard, M.N.; Dahn, J.F. Accelerating Rate Calorimetry Study on the Thermal Stability of Lithium Intercalated Graphite in Electrolyte. I. Experimental. J. Electrochem. Soc. 1999, 146, 2068. [Google Scholar] [CrossRef]
  21. Townsend, D.I.; Tou, J.C. Thermal hazard evaluation by an accelerating rate calorimeter. Thermochim. Acta 1980, 37, 1–30. [Google Scholar] [CrossRef]
  22. Vyazovkin, S.; Muravyev, N. Single heating rate methods are a faulty approach to pyrolysis kinetics. Biomass Conv. Bioref. 2023, 13, 1–3. [Google Scholar] [CrossRef]
  23. Al-Zareer, M.; Michalak, A.; Escobar, C.; Da Silva, C.M.; Davis, T.; Osio, I.; Amon, C.H. Heat Generation Rates and Anisotropic Thermophysical Properties of Cylindrical Lithium-Ion Batteries with Different Terminal Mounting Configurations. SSRN J. 2022. [Google Scholar] [CrossRef]
  24. O’Regan, K.; Brosa Planella, F.; Widanage, W.D.; Kendrick, E. Thermal-electrochemical parameters of a high energy lithium-ion cylindrical battery. Electrochim. Acta 2022, 425, 140700. [Google Scholar] [CrossRef]
  25. Sun, Z.; Guo, Y.; Zhang, C.; Whitehouse, J.; Zhou, Q.; Xu, H.; Wang, C. Experimental study of battery passive thermal management system using copper foam-based phase change materials. Int. J. 2023, 17, 100255. [Google Scholar] [CrossRef]
  26. Fang, J.; Cai, J.; He, X. Experimental study on the vertical thermal runaway propagation in cylindrical Lithium-ion batteries: Effects of spacing and state of charge. Appl. Therm. Eng. 2021, 197, 117399. [Google Scholar] [CrossRef]
  27. Al-Zareer, M.; Michalak, A.; Da Silva, C.; Amon, C.H. Predicting specific heat capacity and directional thermal conductivities of cylindrical lithium-ion batteries: A combined experimental and simulation framework. Appl. Therm. Eng. 2020, 182, 116075. [Google Scholar] [CrossRef]
  28. Murashko, K.A.; Pyrhönen, J.; Jokiniemi, J. Determination of the through-plane thermal conductivity and specific heat capacity of a Li-ion cylindrical cell. Int. J. Heat Mass Transf. 2020, 162, 120330. [Google Scholar] [CrossRef]
  29. Kim, W.-Y.; Kim, N.-J. Numerical Study on Thermal Runaway by Temperatures and Appearance Sizes in NCM622 and LFP Cylindrical Lithium-ion Batteries. J. Korean Soc. Geotherm. Hydrothermal. Energy 2021, 17, 46–58. [Google Scholar] [CrossRef]
  30. Bryden, T.S.; Dimitrov, B.; Hilton, G.; Ponce de León, C.; Bugryniec, P.; Brown, S.; Cumming, D.; Cruden, A. Methodology to determine the heat capacity of lithium-ion cells. J. Power Sources 2018, 395, 369–378. [Google Scholar] [CrossRef]
  31. Linstrom, P. NIST Standard Reference Database Number 69. In NIST Chemistry WebBook; National Institute of Standards and Technology: Gaithersburg, MD, USA, 1997. [Google Scholar] [CrossRef]
  32. Ding, M.S.; Jow, T.R. Properties of PC-EA Solvent and Its Solution of LiBOB Comparison of Linear Esters to Linear Carbonates for Use in Lithium Batteries. J. Electrochem. Soc. 2005, 152, 1199. [Google Scholar] [CrossRef]
  33. Aupperle, F.; von Aspern, N.; Berghus, D.; Weber, F.; Eshetu, G.G.; Winter, M.; Figgemeier, E. The Role of Electrolyte Additives on the Interfacial Chemistry and Thermal Reactivity of Si-Anode-Based Li-Ion Battery. ACS Appl. Energy Mater. 2019, 2, 6513–6527. [Google Scholar] [CrossRef]
Figure 1. Accelerating rate calorimeter set-up for thermal abuse.
Batteries 09 00237 g001
Figure 2. Determination of critical temperatures for thermal abuse.
Batteries 09 00237 g002
Figure 3. Mechanical abuse by nail penetration testing. (a) Determination of critical temperature; (b) picture of test setup in calorimeter. Picture: KIT/Riccardo Prevete.
Batteries 09 00237 g003
Figure 4. CT analysis comparison of positive electrodes with safety devices.
Batteries 09 00237 g004
Figure 5. CT images of (a) NCA-HE I cell with burrs on the negative tab circled in red; (b) NMC cell with non-circularity at jelly roll center; (c) distorted electrode on inner winding of LFP cell; (d) uneven distribution of active material in NCA-HP cell. All defects are circled in red.
Batteries 09 00237 g005
Figure 6. Critical temperature for: (a) onset; (b) CID triggering; for all SOC and chemistries.
Batteries 09 00237 g006
Figure 7. Critical temperature for: (a) venting and (b) start of thermal runaway for all SOC and chemistries.
Batteries 09 00237 g007
Figure 8. Temperature for reaching temperature rates of: (a) 1 °C/min; (b) 5 °C/min; (c) 10 °C/min, for all SOC and chemistries.
Batteries 09 00237 g008
Figure 9. Maximum temperature recorded at: (a) main TC and (b) auxiliary TC for all SOC and chemistries.
Batteries 09 00237 g009
Figure 10. Comparison of (a) measured and (b) normalized temperature rate vs. temperature curves for all cell types for state of charge 100.
Batteries 09 00237 g010
Figure 11. Comparison of normalized temperature rate vs. temperature curves for all cell types: (a) state of charge 80; (b) state of charge 60.
Batteries 09 00237 g011
Figure 12. Comparison of normalized temperature rate vs. temperature curves for all cell types: (a) state of charge 30; (b) state of charge 0.
Batteries 09 00237 g012
Figure 13. Thermal abuse data presented as (a) Arrhenius plots for all cell types at SOC 100; (b) activation energy after venting for all SOC and chemistries.
Batteries 09 00237 g013
Figure 14. Released heat for different SOC and mean cp for all cell types: (a) until CID trigger temperature; (b) until venting temperature.
Batteries 09 00237 g014
Figure 15. Grades of destruction example pictures.
Batteries 09 00237 g015
Figure 16. Comparison of cell damage after thermal abuse for all SOC and cell types: (a) grade of destruction; (b) mass loss.
Batteries 09 00237 g016
Figure 17. Comparison of cell damage after mechanical abuse (a) grade of destruction; (b) mass loss.
Batteries 09 00237 g017
Table 1. Thermocouple accuracy for the corresponding temperature range.
TC TypeAccuracy in °CCorresponding Temperature Range in °C
N 1 class 1±1.540–375
±0.004 · T>375
K 2 class 1± 1.540–375
±0.004 · T>375
1 Used in the center of the cell for all tests. 2 Used in nail penetration test on different positions.
Table 2. Parameters of Heat-Wait-Seek Test.
Heating Start in °CHeating Step in KWaiting Time in minSeek Time in minSeek Criterion for Exothermal Behavior in °C/min
50515–20100.02
Table 3. Definition of critical temperatures.
Critical TemperatureOnset
Temperature
Current Interrupt Device (CID) Trigger TemperatureVenting TemperatureStart Thermal Runaway TemperatureMaximum Temperature
Criteriontemperature rate bomb
> 0.02 °C/min
U < 1 VΔT < 0exothermal and
>1 °C step skipped in data log
maximum temperature at bomb during all the experiment
Indicationcell is “exothermal”voltage droppedshort cooling of the cell cell is about to experience runawaytemperature peak
Table 4. Parameters of nail penetration test.
Nail MaterialDiameter Nail
in mm
Speed of Nail
in mm/s
Penetration Depth
Stainless steel310>cell radius
Table 5. Comparison of electrical performance and limits.
ParameterNMCNCA-HE INCA-HE IINCA-HPLFP
Mean capacity49594893487338923117
SD capacity in mAh2726242516
Maximum discharge
rate in C
1.5 2–32–47–161–3
CC cut-off charging in V4.24.24.24.23.65
CC cut-off discharging in V2.52.52.52.52.0
CV cut-off charging in mA5098505060
Table 6. Materials composition and structure.
ParameterNMCNCA-HE INCA-HE IINCA-HPLFP
Cathode
chemistry
LixNi0.807
Mn0.092Co0.102 O2
LixNi0.879
Co0.107Al0.014O2
LixNi0.879
Co0.107Al0.014O2
LixNi0.878
Co0.107Al0.015O2
LiFePO4
Cathode microstructuresphericsphericsphericsphericspheric
Anode
chemistry
carbon +
1.6% silicon
carbon +
1.4% silicon
carbon +
1.4% silicon
carbon +
1% silicon
carbon
no silicon
Anode micro-structureflake-likeflake-likeflake-likesphericflake-like
Separator PEPEPEPEPE
Separator coatingAl2O3Al2O3Al2O3Al2O3Al2O3
Table 7. Electrolyte composition analyzed by means of GC-MS.
ElectrolyteNMCNCA-HE INCA-HE IINCA-HPLFP
DMC in mass %77.96765.774.10
EMC in mass %5.08.67.8029.5
DEC in mass %000037.9
FEC in mass %08.75.525.70
EC in mass % 17.115.7210.232.6
Table 8. Summary of thickness measurements made on CT scans for various features of each cell type using the myVGL software tools.
CellAverage Anode Thickness in mmAverage Cathode Thickness in mmPositive Tab Thickness in mmNegative Tab Thickness in mmCasing Thickness in mm
NMC0.220.160.340.170.24
NCA-HE I0.190.130.280.290.27
NCA-HE II0.190.130.330.210.23
NCA-HP0.130.200.260.240.24
LFP0.070.180.260.240.27
Table 9. Summary of the different kinds of defects displayed by the various cell types as observed from CT scans.
CellBurrs on the Negative TabNon-Circular Jelly Roll CenterUneven Distribution of Active MaterialBent/Distorted Electrodes
NMCYesYesNoNo
NCA-HE IYesYesNoYes
NCA-HE IIYesYesNoNo
NCA-HPNoNoYesYes
LFPYesNoYesYes
Table 10. Average critical temperatures for SOC 100 for all cells with their standard deviation.
CellOnset
Temperature
in °C
CID Trigger Temperature
in °C
Venting Temperature
in °C
Start Thermal Runaway Temperature
in °C
Maximum Temperature
in °C
NMC85.5 ± 4.991.9 ± 1.2121.5 ± 5.8198.0 ± 0.2591.6 ± 20.9
NCA-HE I95.3 ± 0.4112.3 ± 0.2133.3 ± 1.8203.1 ± 0.6644.3 ± 160.1 *
NCA-HE II93.1 ± 2.6104.6 ± 1.9119.3 ± 1.1196.3 ± 7.5418.8 ± 21.0
NCA-HP95.5 ± 5.1108.2 ± 2.5131.5 ± 0.9202.6 ± 1.3676.6 ± 98.3 *
LFP124.4 ± 14.4163.5 ± 5.0168.8 ± 1.8256.3 ± 10.3498.6 ± 43.9
* The high standard deviation of the maximum temperature is due to jelly roll ejection occurring in some of the experiments.
Table 11. Average temperatures for reaching different temperature rates for SOC 100 for all cells with their standard deviation, as well as the rate recorded at the start of thermal runaway.
CellTemperature
of Rate
1 °C/min
in °C
Temperature
of Rate
5 °C/min
in °C
Temperature
of Rate
10 °C/min
in °C
Rate Recorded
at Start of
Thermal Runaway
in °C/min
NMC142.7 ± 0.2160.8 ± 0.2173.4 ± 0.355 ± 2.6
NCA-HE I149.2 ± 0.1167.8 ± 0.4178.0 ± 0.589 ± 29.6
NCA-HE II147.4 ± 0.3166.2 ± 0.1174.4 ± 0.267 ± 34.4
NCA-HP148.7 ± 0.2174.3 ± 0.7187.5 ± 0.738 ± 11.6
LFP194.1 ± 3.5221.8 ± 4.2235.4 ± 5.4115 ± 16.7
Table 12. Thermal runaway occurrence through mechanical abuse depending on cathode chemistry and state of charge.
SOCNMCNCA-HE INCA-HE IINCA-HPLFP
100YesYesYesYesNo
50YesYesYesYesNo
30YesYesYesYesNo
0NoNoNoNoNo
Table 13. Maximum temperature at different locations for SOC 100.
CellMain TC Maximum Temperature in °CAux TC Maximum Temperature in °CAnode TC Maximum Temperature in °COverall Maximum Temperature in °C
NMC722.9760.3722.7760.3
NCA-HE I595.6840.7456.0840.7
NCA-HE II732.4998.8479.3998.8
NCA-HP694.31220.41200.81220.4
LFP101.995.180.5101.9
Table 14. Average activation energy after venting for thermal abuse for SOC 100 for all cell types.
CellActivation Energy in eV
NMC1.14 ± 0.05
NCA-HE I1.27 ± 0.01
NCA-HE II1.37 ± 0.00
NCA-HP1.11 ± 0.02
LFP1.09 ± 0.09
Table 15. Heat capacity (cp) values obtained for batteries with different chemistry from the literature.
Reference and YearChemistrycp in J/g · K
[23], 2022NMC1.021
[24], 2022NMC0.99
[25], 2022NMC0.91
[26], 2021NCA1.0488
[27], 2020NCA0.9585
[28], 2020NCA 0.83
[28], 2020LFP1.125
[29], 2021LFP1.26
[30], 2018LFP1.169
Table 16. Heat capacity (cp) values for different cells used for calculation.
CalculationChemistrycp in J/g·K
MeanNMC0.974
MeanNCA0.946
MeanLFP1.185
Table 17. Released heat until critical temperatures are reached for SOC 100 and mean cp for all cell types.
CellΔHexo until CID Trigger Temperature in kJΔHexo until Venting Temperature in kJΔHexo until Thermal Runaway Start Temperature in kJΔHexo until Maximum Temperature in kJ
NMC0.432.427.5734.06
NCA-HE I1.102.477.0135.68
NCA-HE II0.751.706.7121.19
NCA-HP0.792.236.6335.96
LFP3.013.2912.3727.71
Table 18. Grades of destruction used for classification.
Grade NumberCriterionExample
0nearly no damagefilm intact
1loss of outside insulatorbare casing
2optical damagesoot layer
3small loss of componentsmolten aluminum on outside
4casing damageddeformation, top missing
5loss of major components jelly roll ejection
6complete destruction of cellcasing destroyed
Table 19. Influence of SOC on critical temperatures of thermal abuse for all cell types: ▲ positive, ▼ negative temperature coefficient, ◄► no clear SOC to temperature correlation.
CellOnset
Temperature
in °C
CID Trigger Temperature
in °C
Venting Temperature
in °C
Start Thermal Runaway Temperature
in °C
Maximum Temperature
in °C
NMC
NCA-HE I ◄►
NCA-HE II ◄►
NCA-HP ◄►
LFP ◄► ◄►
Table 20. Boiling point of electrolytes.
SourceChemistryBoiling Point in °C
[31]DMC90.35
[32]EMC110
[32]DEC125.7
[33]FEC249.5
[33]EC248
Disclaimer/Publisher’s Note: The statements, opinions and data contained in all publications are solely those of the individual author(s) and contributor(s) and not of MDPI and/or the editor(s). MDPI and/or the editor(s) disclaim responsibility for any injury to people or property resulting from any ideas, methods, instructions or products referred to in the content.

