Article

Ultra-Thick Cathodes for High-Energy Lithium-Ion Batteries Based on Aluminium Foams—Microstructural Evolution during Densification and Its Impact on the Electrochemical Properties

1
Materials Research Institute Aalen (IMFAA), Aalen University, Beethovenstr. 1, 73430 Aalen, Germany
2
Institute for Applied Materials (IAM), Karlsruhe Institute of Technology, 76344 Eggenstein-Leopoldshafen, Germany
*
Authors to whom correspondence should be addressed.
Batteries 2023, 9(6), 303; https://doi.org/10.3390/batteries9060303
Submission received: 17 April 2023 / Revised: 25 May 2023 / Accepted: 26 May 2023 / Published: 31 May 2023
(This article belongs to the Special Issue Materials Design for Electrochemical Energy Storage)

Abstract

:
Using three-dimensional (3D) metal foams as current collectors is considered to be a promising approach to improve the areal specific capacity and meet the demand for increased energy density of lithium-ion batteries. Electrodes with an open-porous metal foam as current collector exhibit a 3D connected electronic network within the active mass, shortening the electron transport pathways and lowering the electrodes’ intrinsic electronic resistance. In this study, NMC622 cathodes using an aluminium foam as current collector with a measured areal capacity of up to 7.6 mAh cm−2 were investigated. To this end, the infiltrated foams were densified to various thicknesses between 200 µm and 400 µm corresponding to an electrode porosity between 65% and 30%. The microstructural analysis reveals (i) the elimination of shrinking cavities and a decrease in the porosity of the infiltrated active mass, (ii) an improved contact of active mass to the current collector structure and (iii) a pronounced clogging of the surface pores. The electrochemical properties such as capacity and rate capability are correlated to the electrode’s microstructure, demonstrating that densification is necessary to improve active material utilization and volumetric capacity. However, strong densification impairs the rate capability caused by increased pore resistance and hindered electrolyte accessibility.

1. Introduction

Since Sony introduced the first commercial lithium-ion battery (LiB) in 1991, they have become the benchmark for electrochemical energy storage systems [1]. LiBs exhibit the highest power and energy density of all kind of different rechargeable batteries that have made it to the market so far [2,3]. Despite all the technological advances in recent decades, the fundamental electrode structure consisting of a layer of active mass on top of a current collector foil has not changed. However, the demand for increased energy and power density, which applies besides automotive applications inter alia for medical technology systems and wearable devices, will reach the limits of LiB soon [4]. To meet these demands, several strategies, such as (i) novel active materials with higher specific capacities [5] or (ii) various post-lithium-ion technologies [6], are being investigated. Another more straightforward and evolutionary approach is to increase the areal loading of electrodes by increasing the electrode thickness [7,8]. By doing so, the ratio of active material to inactive compounds, such as the current collector and separator, is increased and the energy density can be significantly enhanced. However, layer thickness and compaction of conventional electrodes with a layer structure cannot be increased arbitrarily since the underlying electronic and ionic transport mechanisms are limited [9,10,11,12]. Due to this, thick film electrodes suffer from a high ohmic resistance causing a strong capacity fading, especially at higher current rates. In addition, e.g., cracks and exfoliation caused by the volume change within the coated layer are well-known failures that arise during the processing and cyclic (dis-)charging [13,14]. In contrast, electrodes with a 3D current collector such as (nano)fibers, nanotubes, nanorods and foams are considered to be a promising approach to overcome the capacity fading of thick electrodes [15,16,17,18,19,20]. From the several investigated 3D current collectors, metal foams are likely to be the most suitable with the state-of-the-art electrode slurry production and least expensive option [21].
Although the current collector is an essential component of electrodes, comparably little attention is given to it in terms of battery performance [13]. Compared to state-of-the-art electrodes using a cast layer of active mass on top of a current collector foil, 3D structured electrodes with an open-porous metal foam as current collector feature a 3D connected electronic network within the active mass. This shortens the transport pathways of the electrons and contributes to lower intrinsic resistance of the electrode [14,21,22]. Additionally, Yang et al. [23] proved that the high specific surface of the metal foam and consequently large contact area between the current collector and active mass leads to a faster redox reaction as well as a lower charge transfer resistance. Thus, using a metal foam as a 3D current collector can overcome the problems of thick electrodes described above and it is regarded as an alternative approach for high-energy electrodes.
Moreover, the metal foam supports the electrode and increases its mechanical stability. Therefore, new electrode designs are possible beyond the boundaries of conventional electrodes; e.g., the electrode can be miniaturized or bent and shaped for specific applications according to the device to be powered [24]. With regard to the requirements for foams used as current collectors, inter alia low mass density of the metal and high open-porosity of the foam as well as good adhesion to the active mass and low cost are important [13]. Additionally, the cell size of the metal foam is a crucial factor for the performance of the electrode [25]. For this reason, most research dealing with foam-type electrodes uses aluminium and nickel (or their alloys) foams as current collectors on the cathode and copper foams on the anode side [26,27,28].
In spite of foam-type electrodes providing many significant advantages, few publications deal with this topic. Some of them consider inter alia the effect of electrode thickness [29] or the impact of the carbon content on the electrochemical performance of the electrode [30]. Even though it is well known that the microstructure of layered electrodes has a huge effect on the electrochemical performance [31,32,33] and Yang et al. [34] postulated that the gravimetric and volumetric capacity can be adjusted by controlling the electrode density through a calendaring process, a detailed study of the correlation between electrode microstructure and the electrochemical performance is still missing to the best of our knowledge. In addition, most studies deal with LFP-based systems, whereas only a few use NMC as active material [21,22,26].
In the present study, the effect of the densification of foam-type electrodes is investigated in detail by viewing four different degrees of densification. First, the evolution of the microstructure of the electrodes with a high NMC loading of 43.6 mg cm−2 is analysed microscopically in detail looking at the electrode’s cross-section and surface (top-view). Second, the electrochemical performance of the cathode is investigated in terms of the intrinsic resistances and the rate capability. Finally, by correlating the electrochemical performance with the microstructure, we can propose the ideal densification according to specific applications and requirements.

2. Materials and Methods

2.1. Materials

LiNi0.6Mn0.2Co0.2O2 (NMC622, BASF, Ludwigshafen, Germany) was used as active material. Carbon black (C65, MTI Corporation, Richmond, CA, USA) together with conductive graphite powder (CGP, MTI Corporation, Richmond, CA, USA) and polyvinylidene (PVDF, MTI Corporation, Richmond, CA, USA) were used as conductive additive and binder, respectively. N-Methyl-2-pyrrolidion (NMP, 99.5, Extra Dry over molecular sieve, AcroSealTM, Acros Organics, Geel, Belgium) served as solvent of the cathode slurry. An aluminium foam from Sumitomo Electric Industries, Ltd. (Al-Celmet #6, Osaka, Japan) with an average cell size of 0.54 mm and a porosity of 95% was selected as the 3D current collector.

2.2. Electrode Preparation

Circular samples with a diameter of 10 mm were cut out of the foam sheets with an IR laser. The thickness of the circular samples was adjusted to 500 µm via mechanical polishing.
The electrode slurry was prepared by dissolving the binder (PVDF), the conductive additive (CGP and C65) and the active material (NMC622) stepwise in the solvent (NMP) using a planetary centrifugal mixer (Thinky ARM-310, Thinky Corporation, Tokyo, Japan). The NMC622/C65/CGP/PVDF ratio was set to 92/2/2/4 wt.-%.
Based on the vacuum-supported infiltration process presented by Fritsch et al. [22], the foams were loaded with the electrode slurry. To this end, a custom-built infiltration chamber, which consists of a bottom component connected to a vacuum pump, an intermediate component with a metal mesh and filter paper (Grade MN615) and a cover plate with boreholes (Figure 1a,b), was used. The infiltration chamber was heated up to 45 °C by placing it on top of a temperature-controlled heating plate in order to ensure consistent conditions for the infiltration process of different samples. The foams were placed inside the holes of the cover plate and on top of the filter paper. With a manual repeater pipette (AutoRep S Man Pipet, Mettler Toledo, Columbus, Ohio, USA), 500 µL electrode slurry was applied on top of the foams. The electrode slurry was soaked into the pores of the metal foam by applying an underpressure of −100 mbar for 30 min. After the surplus electrode slurry was removed manually, the infiltrated foams were dried for 24 h at room temperature inside a fume hood and afterwards for an additional 24 h inside a drying oven at 80 °C. The dried samples were densified to various thicknesses of 200, 250, 300 and 400 µm with a manual hydraulic press (Specac Ltd., Orpington, UK). The degree of densification was 60%, 50%, 40% and 20% with respect to the initial thickness, respectively.

2.3. Microstructure Analysis

The electrode porosity and density as well as the NMC622 loading were calculated gravimetrically by measuring the weight and size of the as-prepared samples and based on the mass densities and composition of the raw materials.
Cross-section and top-view images were taken for microstructural analysis with scanning electron microscopy (SEM). For the cross-section, the samples were embedded in a polymer resin and then mechanically grounded and polished according to [35,36]. The SEM investigations were done using a ZEISS Sigma 300 VP FE-SEM (Carl Zeiss Microscopy GmbH, Oberkochen, Germany).

2.4. Electrochemical Characterization

Half-cells were built using I-type Swagelok cells to determine the electrochemical performance of the foam-type cathodes. The cells were assembled under argon atmosphere inside a glove box with an oxygen and water content below 1 ppm. Lithium disks (Ø 11 mm) cut from lithium foil (ThermoFisher Scientific, Waltham, Massachusetts, USA) served as the counter electrode and two layers of borosilicate glass micro-fibre filter (Whatman GF/C), Cytiva, Marlborough, Massachusetts, USA) were used as a separator. A volume of 300 µL of electrode consisting of 1 M LiPF6 dissolved in ethylene carbonate (EC): diethyl carbonate (DEC) 3:7 v/v + 2% vinyl carbonate (VC) was added to each cell. After a resting period of 12 h, the testing of the half-cells was done using a BaSyTec CTS-lab battery tester. For C-rate tests, three cells for each densification were cycled with 0.05C/0.05C, 0.1C/0.1C, 0.2C/0.2C, 0.5C/0.5C, 1C/1C and 2C/2C within a potential range of 2.6 V–4.3 V. The charging was operated in CCCV mode and the discharging in CV mode only. Electrochemical impedance spectroscopy (EIS) was performed on symmetrical cells using pouch cells to evaluate the intrinsic resistances of the electrodes. Therefore, samples with a specific geometry (10 × 10 mm) and aluminium contact flags were fabricated. Two layers of separators separated two pristine electrodes and 400 µL electrolyte was used. After a resting period of 24 h, the EIS was carried out with a VMP-3 potentiostat (Biologic GmbH & Co. KG, Münster, Germany) at a frequency range from 500 kHz to 50 mHz with a 10 mV sinusoidal potential amplitude in galvanostatic mode. The EIS data were fitted with the software ZView (Scribner Associates Inc., Southern Pines, NC, USA) to calculate the contact and pore resistance. All electrochemical tests were carried out at constant 23 °C inside a climate chamber (Binder Labortechnik GmbH, Hebertshausen, Germany).

3. Results and Discussion

3.1. Microstructure Investigation

The properties of the as-prepared foam-type cathodes are given in Table 1. The electrode porosity εelectrode and density ρelectrode were calculated according to the following equations:
εelectrode = (Vpore,foamVactive mass)/Velectrode
ρelectrode = (melectrode)/Velectrode
melectrode = mfoam + mactive mass
Velectrode = t A
Vpore,foam = Velectrode εfoam
Vactive mass = mactive mass/ρ0, active mass
Here, the following definitions apply: εelectrode: porosity of the electrode including metal foam, εfoam: porosity of metal foam, ρ0,active mass: density of active mass, ρelectrode: density of electrode including metal foam, A: area of the electrode, mactive mass: mass of active mass, melectrode: mass of electrode including metal foam, mfoam: mass of metal foam, t: thickness of electrode, Vactive mass: volume of the infiltrated active mass, Velectrode: volume of the electrode including metal foam, Vpore,foam: pore volume of the metal foam.
In the following, the different electrodes are denoted by NFC-xx/yyy, where the first number xx specifies the degree of densification and the second number yyy states the electrode thickness.
The cathodes exhibit a porosity εelectrode (including the volume of the foam) between 30 vol.-% and 65 vol.-% with respect to the highest (NFC-60/200) and lowest (NFC-20/400) degree of densification. The density of the electrodes ρelectrode (again including the volume of the foam) increases by the degree of densification from 1.37 g cm−3 to 2.71 g cm−3. Independent of the degree of densification, all cathodes exhibit an NMC622 loading of 43.6 mg cm−2 (mean value) resulting in a theoretical capacity per unit area of 7.72 mAh cm−2 (based on the theoretical capacity of NMC622 of 177 mAh g−1).
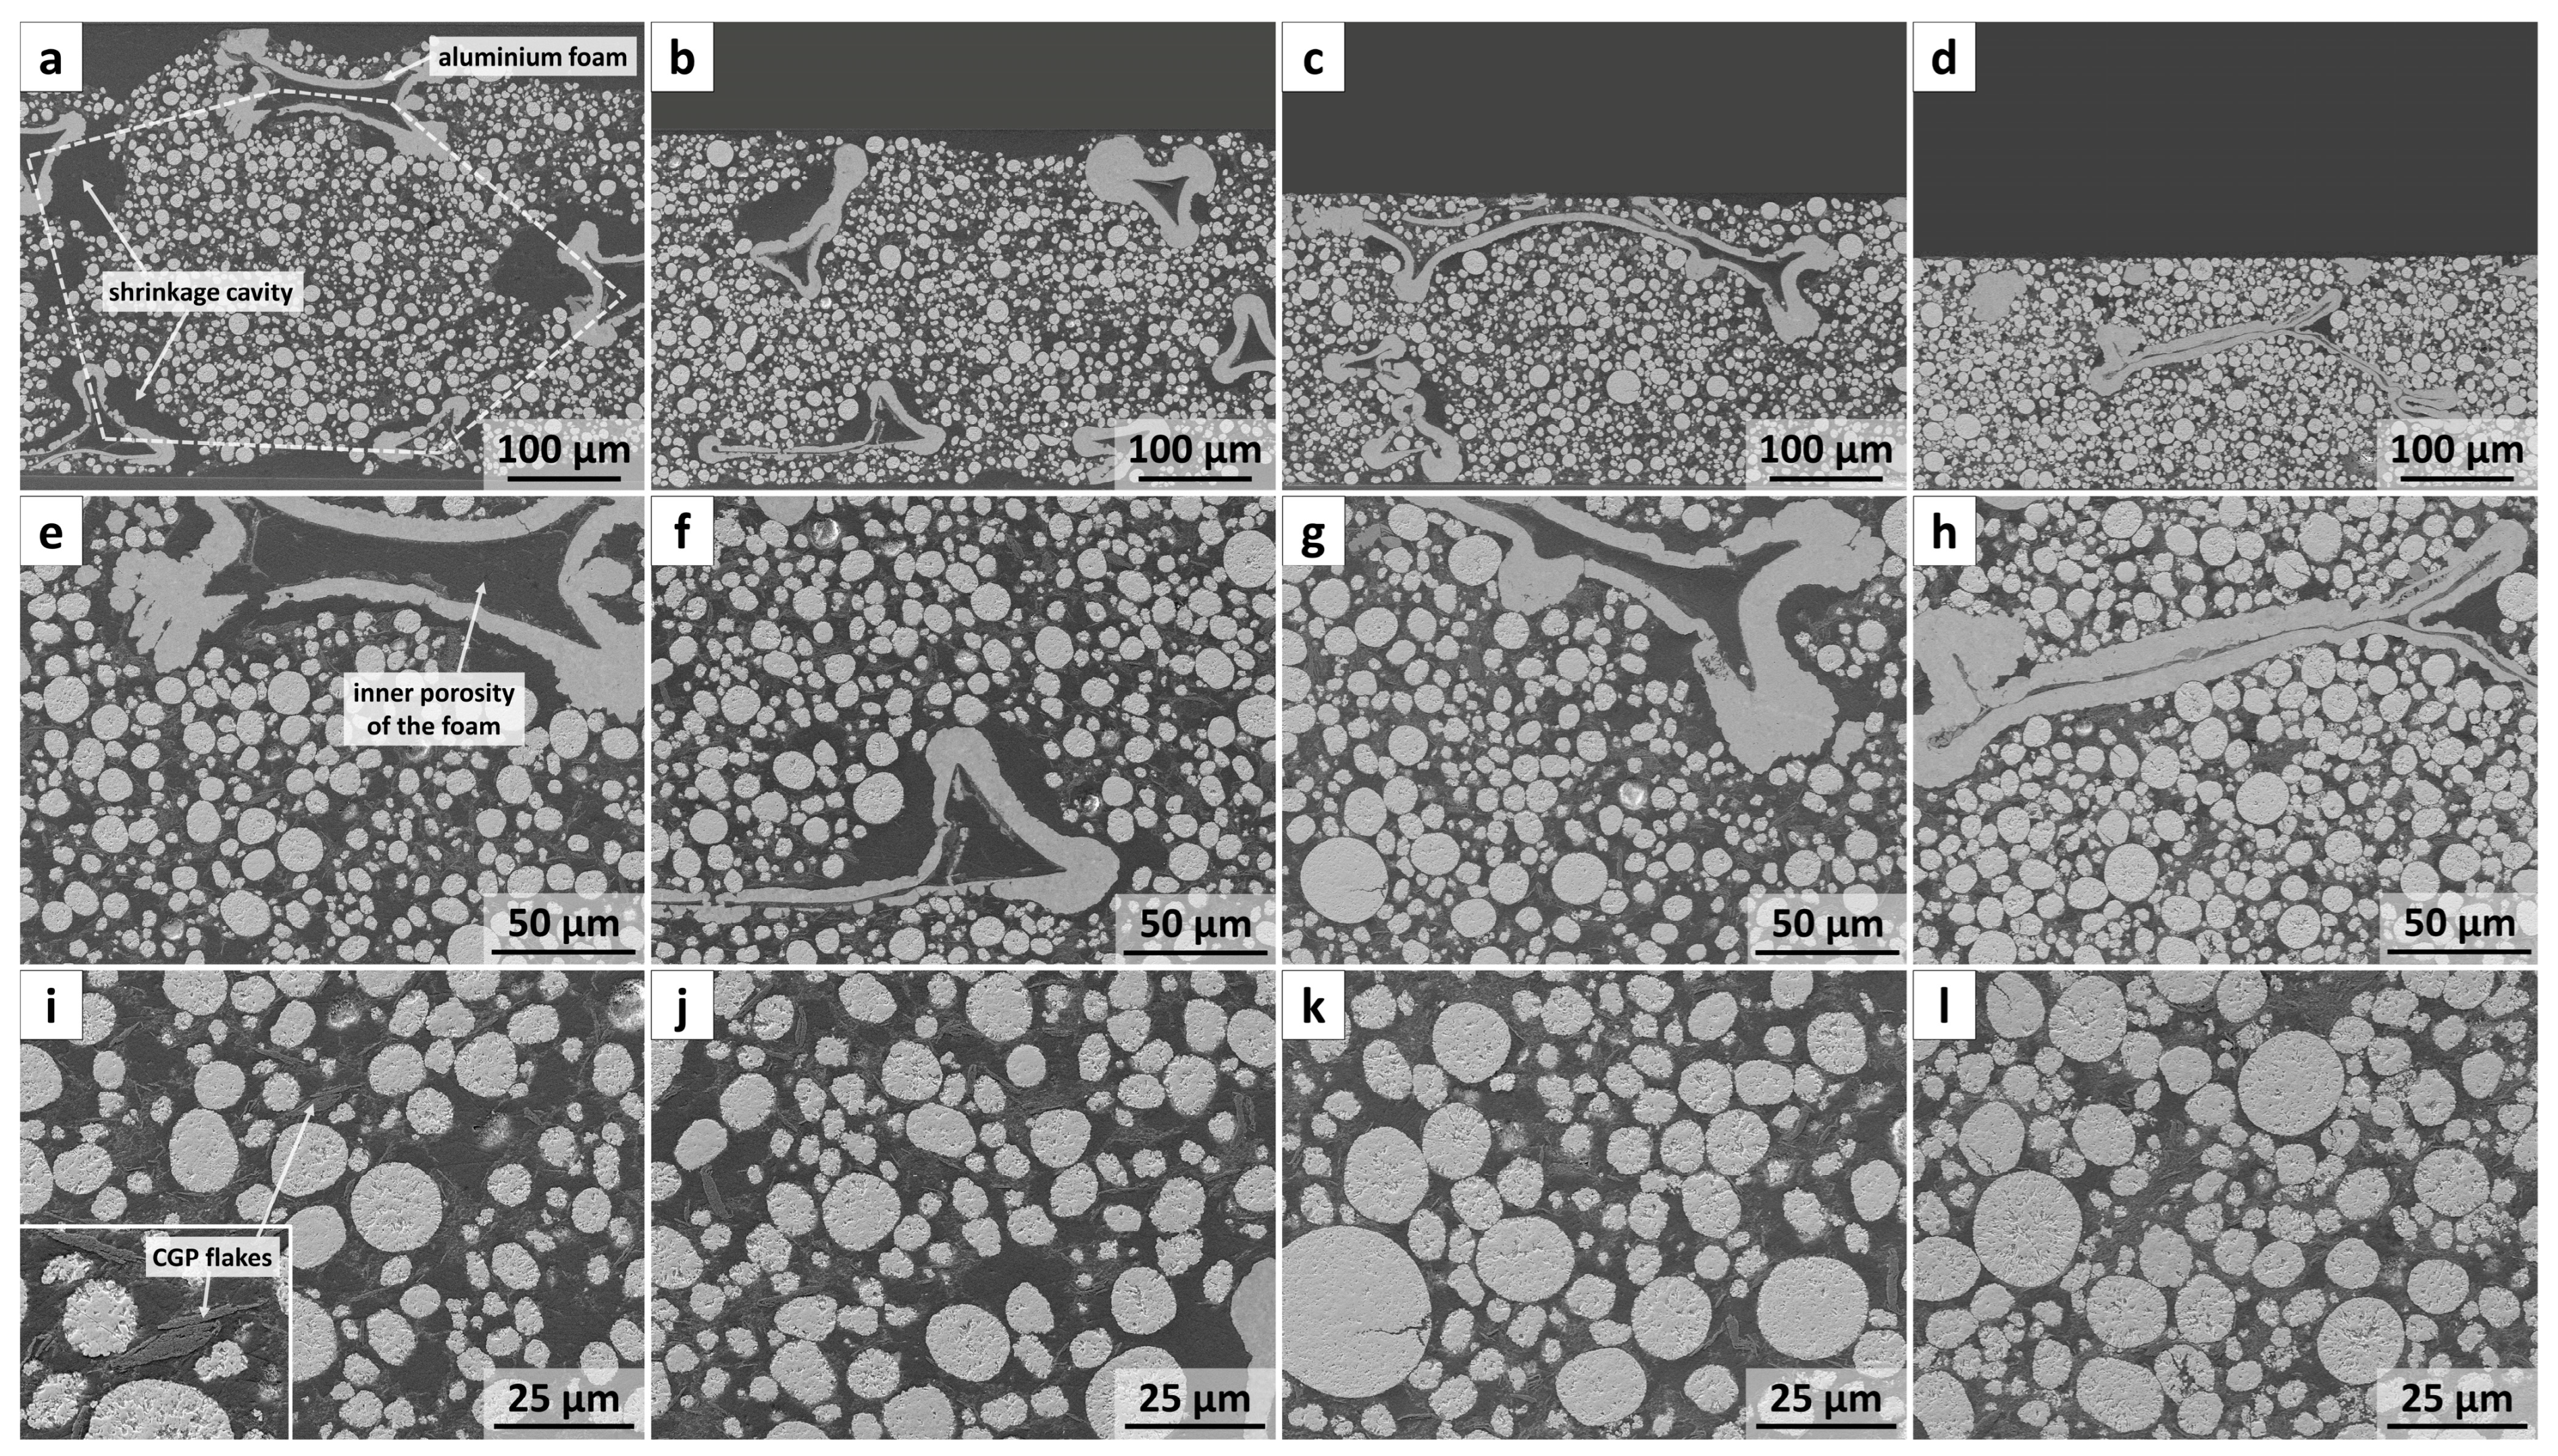
Figure 2 displays the SEM cross-section of the differently densified cathodes. Generally, the NMC particles are visible with a light grey, spherical shape and a diameter between several microns up to 30 µm (d50,powder = 10.5 µm, measured by laser diffraction). The slightly darker grey structure represents the aluminium foam. Depending on the cutting plane, a pentagonal or hexagonal structure is cognizable, revealing the quasi-dodecahedron structure of the aluminium foam (cf. Figure 1d). The dark grey background is the epoxy resin, which fills up the inner porosity of the active mass and cavities of the electrodes. It also includes the binder and C65 since it is not possible to distinguish between the epoxy resin and the binder–C65 compound as both phases mainly consist of carbon. Of the additives only the CGP are visible as light-grey flakes in the images with a magnification of 1000×.
NFC-20/400 exhibits lots of cavities causing a gap of up to 30 µm between the foam structure and the active mass. As a result, the active mass seems to have only a few contact points with the foam structure. These cavities are formed after the infiltration process during drying due to shrinkage of the active mass. The pronounced content of such shrinking cavities can be explained by the high-volume content of the solvent in the slurry (75 vol.-% NMP). The NFC-40/300 sample shows significantly fewer shrinkage cavities and these lunkers disappear almost completely with a higher degree of densification (NFC-50/250, NFC-60/200). As a consequence, the contact between the active mass and the foam is significantly improved. Additionally, with a higher degree of densification, the number of particle–particle contact increases indicating the reduction of the inner porosity of the active mass (cf. Figure 2i–l). Note, almost no particle cracking is observed, even at the highest degree of densification (NFC-60/200). Moreover, the foam has an inner porosity related to its manufacturing, which is not accessible for the slurry. This inner porosity of the foam is significantly reduced and the dodecahedron structure is partially deformed due to uniaxial compaction.
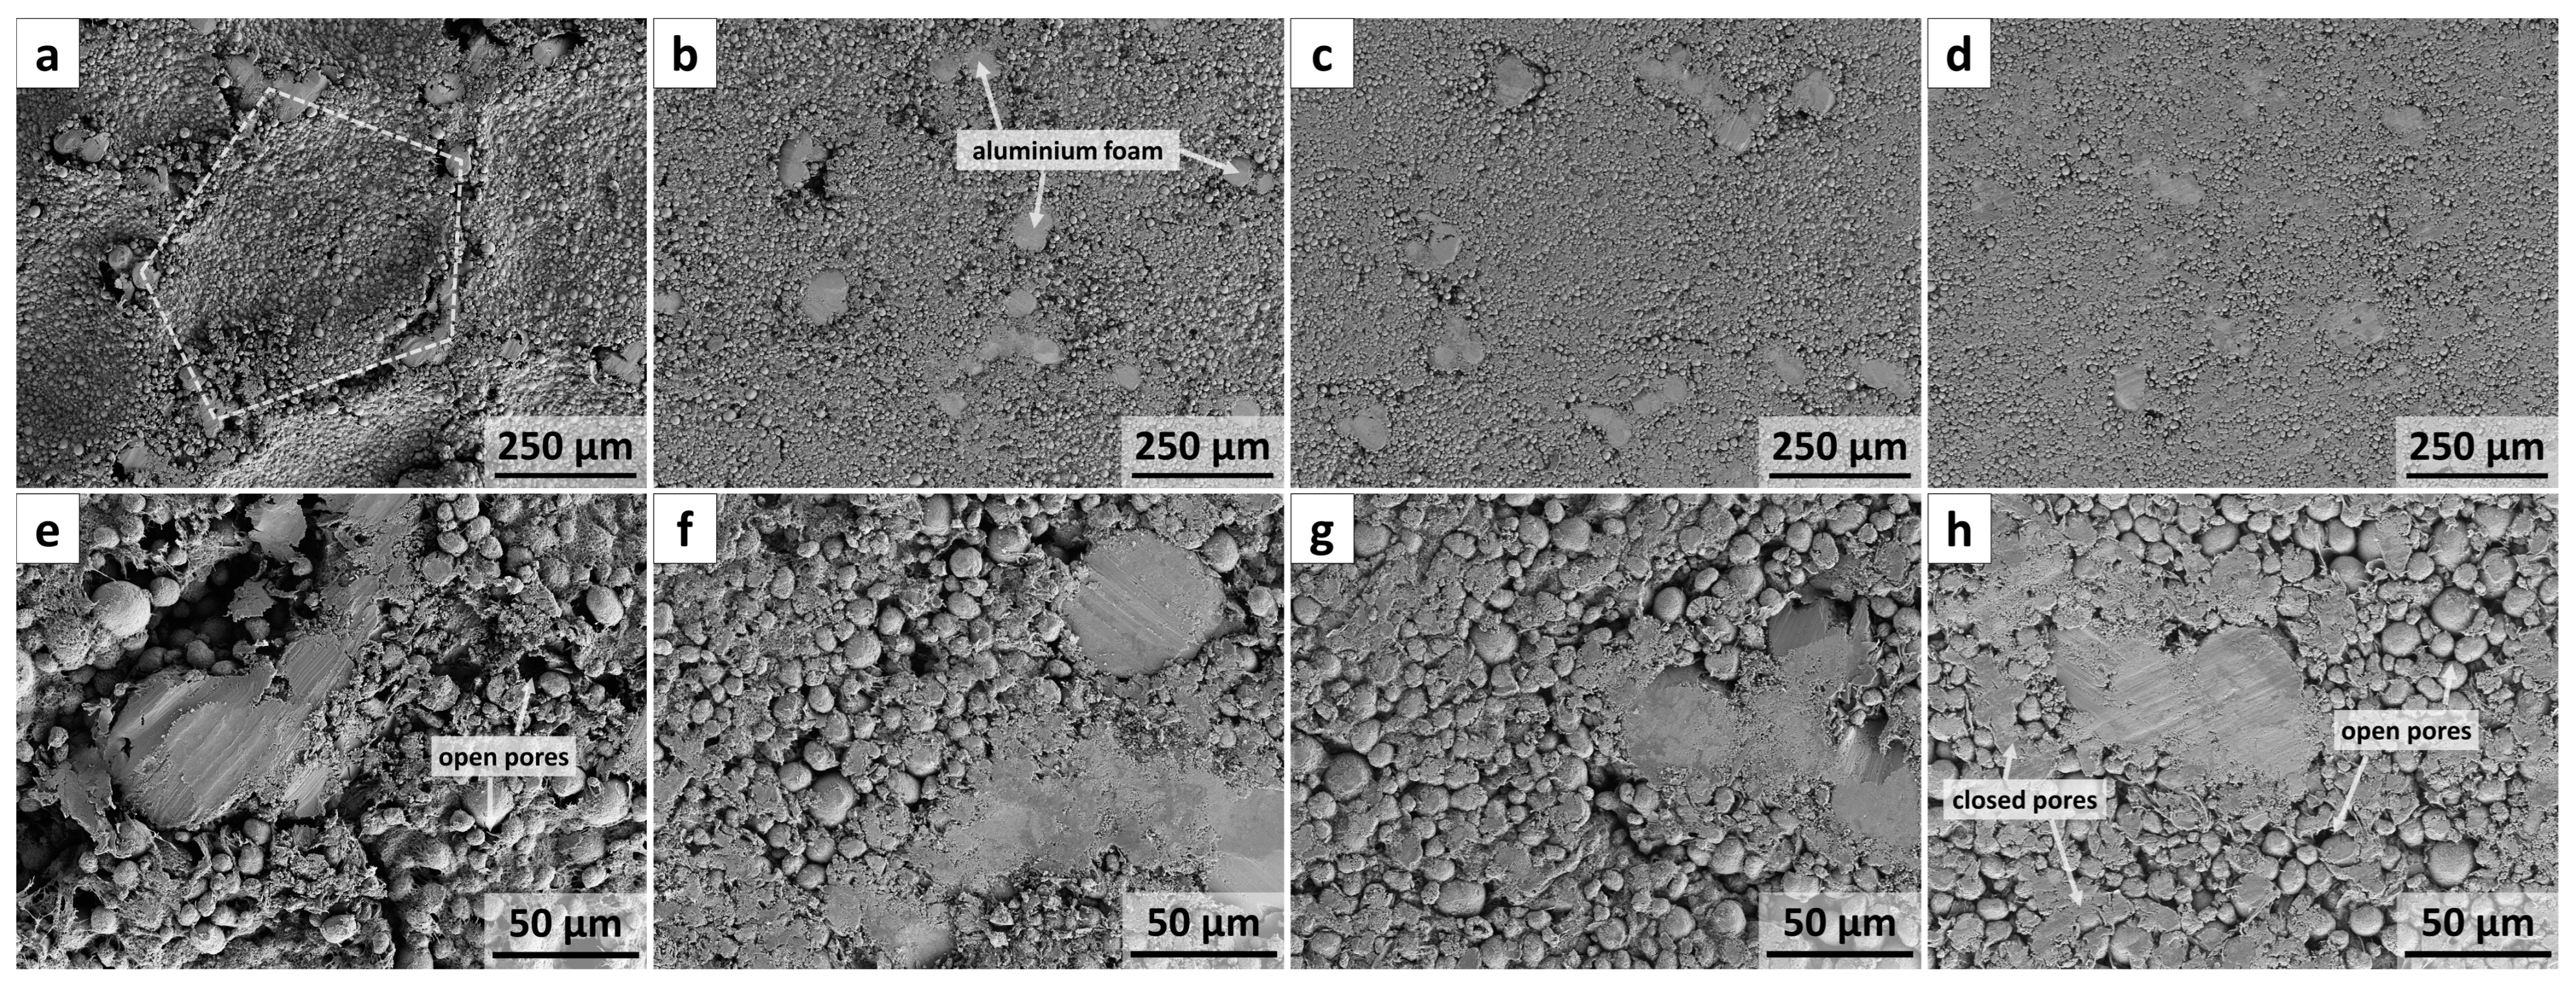
With exception of the lowest densified sample (NFC-20/400), the SEM top-view images, cf. Figure 3, show a smooth electrode surface. The aluminium foam is not entirely covered by the active mass and is visible at all various densifications which is essential for contacting the electrodes electrically. The gap between the foam structure and the active mass of the (slightly compacted) 400 µm thick sample is visible, providing a look inside the electrode (cf. Figure 3e). With respect to pore clogging due to compaction, the lowest densified electrodes exhibit the highest number of open surface pores. With higher densification, the surface pores are sealed by the binder and conductive additive components. However, the pore clogging is less pronounced compared to highly-calendared layer cathodes as was shown, for example, by Schmidt et al. [31] and Bolsinger et al. [37].

3.2. Electrochemical Impedance Spectroscopy

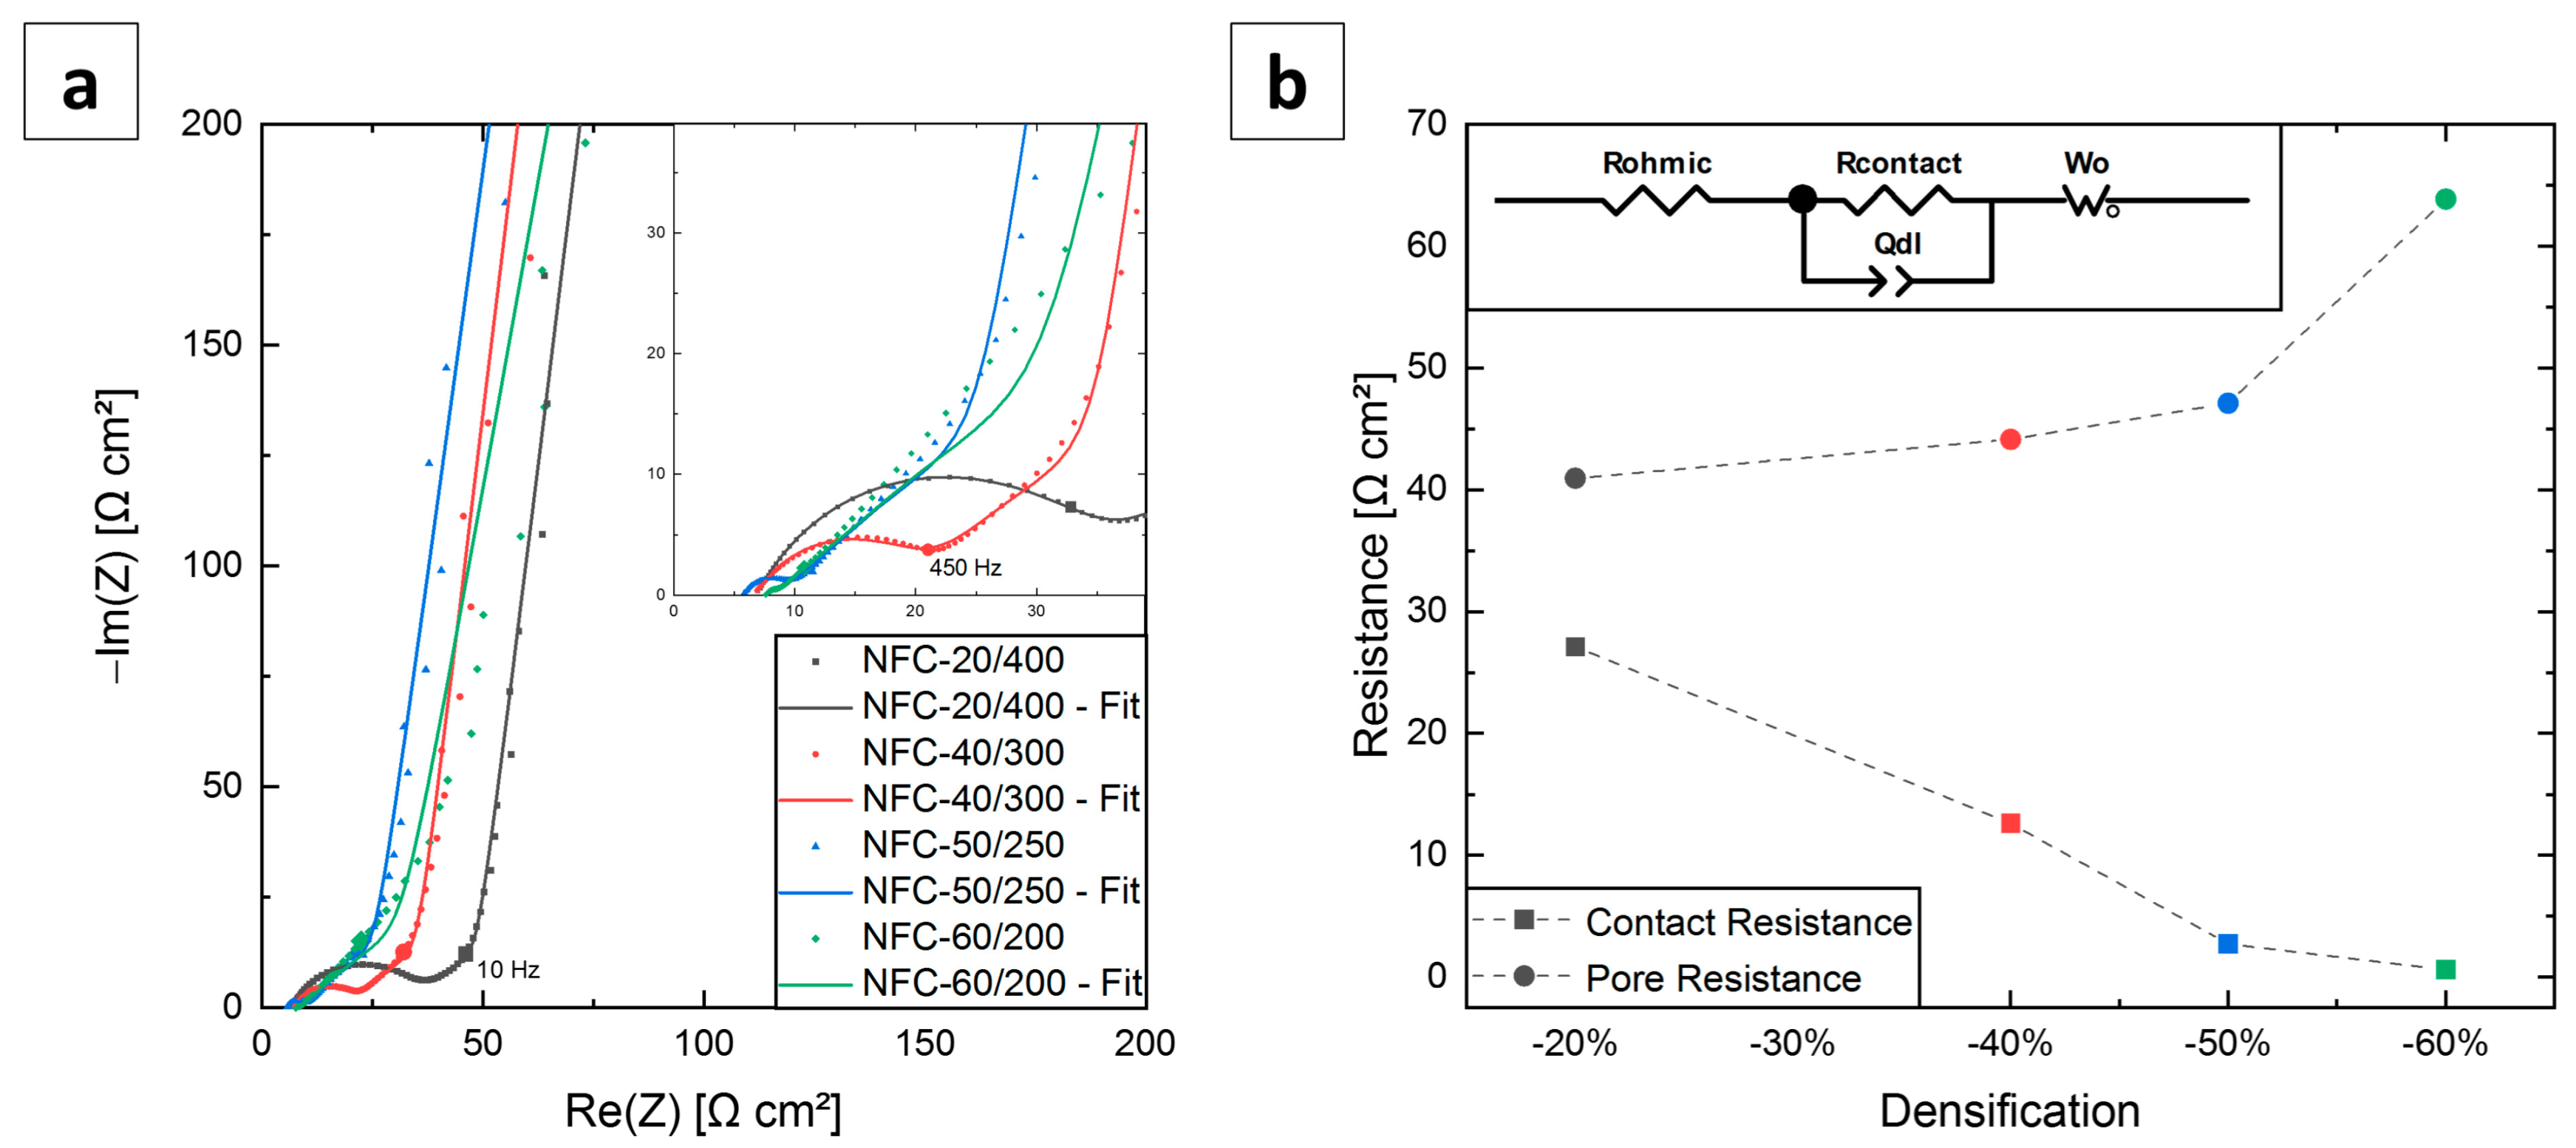
The electrodes used in the symmetrical cells were in a pristine state, i.e., the NMC particles were fully lithiated. Hence, quasi-blocking conditions and a resulting neglectable ionic charge transfer were assumed [38]. The Nyquist plot in Figure 4a shows for all densifications one semi-circle at high frequency, followed by a 45° slope in the middle frequency region and turning in an almost 90° slope at low frequencies. The size of the semi-circle describes the contact resistance Rcontact between the active mass and the current collector, whereas the length of the 45° slope is linked to the ionic resistance of the lithium-ions in the pores (pore resistance Rpore) [39,40]. To determine both resistances, the obtained EIS data were fitted using the equivalent circuit shown in Figure 4b. The ohmic resistance Rohmic includes inter alia the resistance of the separator, cell housing and measurement cables, and can be assumed to be constant for all different cells. The R/Q element represents of the contact resistance Rcontact between the active mass and the metal current collector and the double layer capacity QDL at this interface [39,41,42]. Wo serves as a simplified Transmission Line Model (TLM), which is commonly used to describe porous electrodes [38,41,43,44]. In our study, the WoR value of the Wo element is assumed to be equal to Rpore.
The EIS measurement indicates a decrease in Rcontact with a higher degree of densification (cf. Figure 4b, Table 2). In detail, it is reduced by more than 50% by densifying the electrode from 20% (27.1 Ω cm2) to 40% (12.6 Ω cm2). NFC-50/250 exhibits an even lower Rcontact of 2.7 Ω cm2, whereas Rcontact of the highest densified electrode (NFC-60/200) can be almost neglected (<1 Ω cm2) which becomes obvious due to the weakly pronounced and thus hard to detect semi-circle. In contrast, Rpore increases exponentially with increasing compaction. In detail, the change of Rpore between 20% (41 Ω cm2) and 50% densification (47 Ω cm2) is relatively small and the highest increase is observed between the 50% and 60% degree of densification (64 Ω cm2).
The EIS measurements are in a good agreement with the microscopic observation. On the one hand, the high Rcontact of NFC-20/400 can be attributed to the shrinkage cavities, and thus the poor contact of the active mass to the metal foam (cf. Figure 2a,e). By further densifying the cathodes, the shrinkage cavities are eliminated and the contact between active mass and foam structure is improved (cf. Figure 2f–h), lowering Rcontact. On the other hand, due to the decrease in porosity (cf. Table 1, Figure 2) the lithium-ion diffusion in the electrodes pores is impaired and thus Rpore increases. The relatively small increase of Rpore reveals that the change in microstructure has only a minor impact on the lithium-ion diffusion for low (20%) and moderate (40% and 50%) densifications. Hereby we have to consider that the electrodes thickness and thus diffusion paths are reduced by the densification, which is known to have a positive influence on Rpore [45]. However, the strong increase in Rpore between 50% and 60% densification suggests that the microstructural changes at this stage have a strong effect on the lithium-ion diffusion. Such behaviour was also observed by Schmidt et al. [31] and is likely to be due to a combination of a narrowed pore network and degraded electrolyte accessibility due to pore clogging at the surface (cf. Figure 3). In view of the opposing progression of both resistances, a densification of 50% seems to be the optimal degree of densification. Further compaction to 60% does not lead to any further significant reduction in contact resistance, whereas pore resistance increases considerably.

3.3. C-Rate Tests

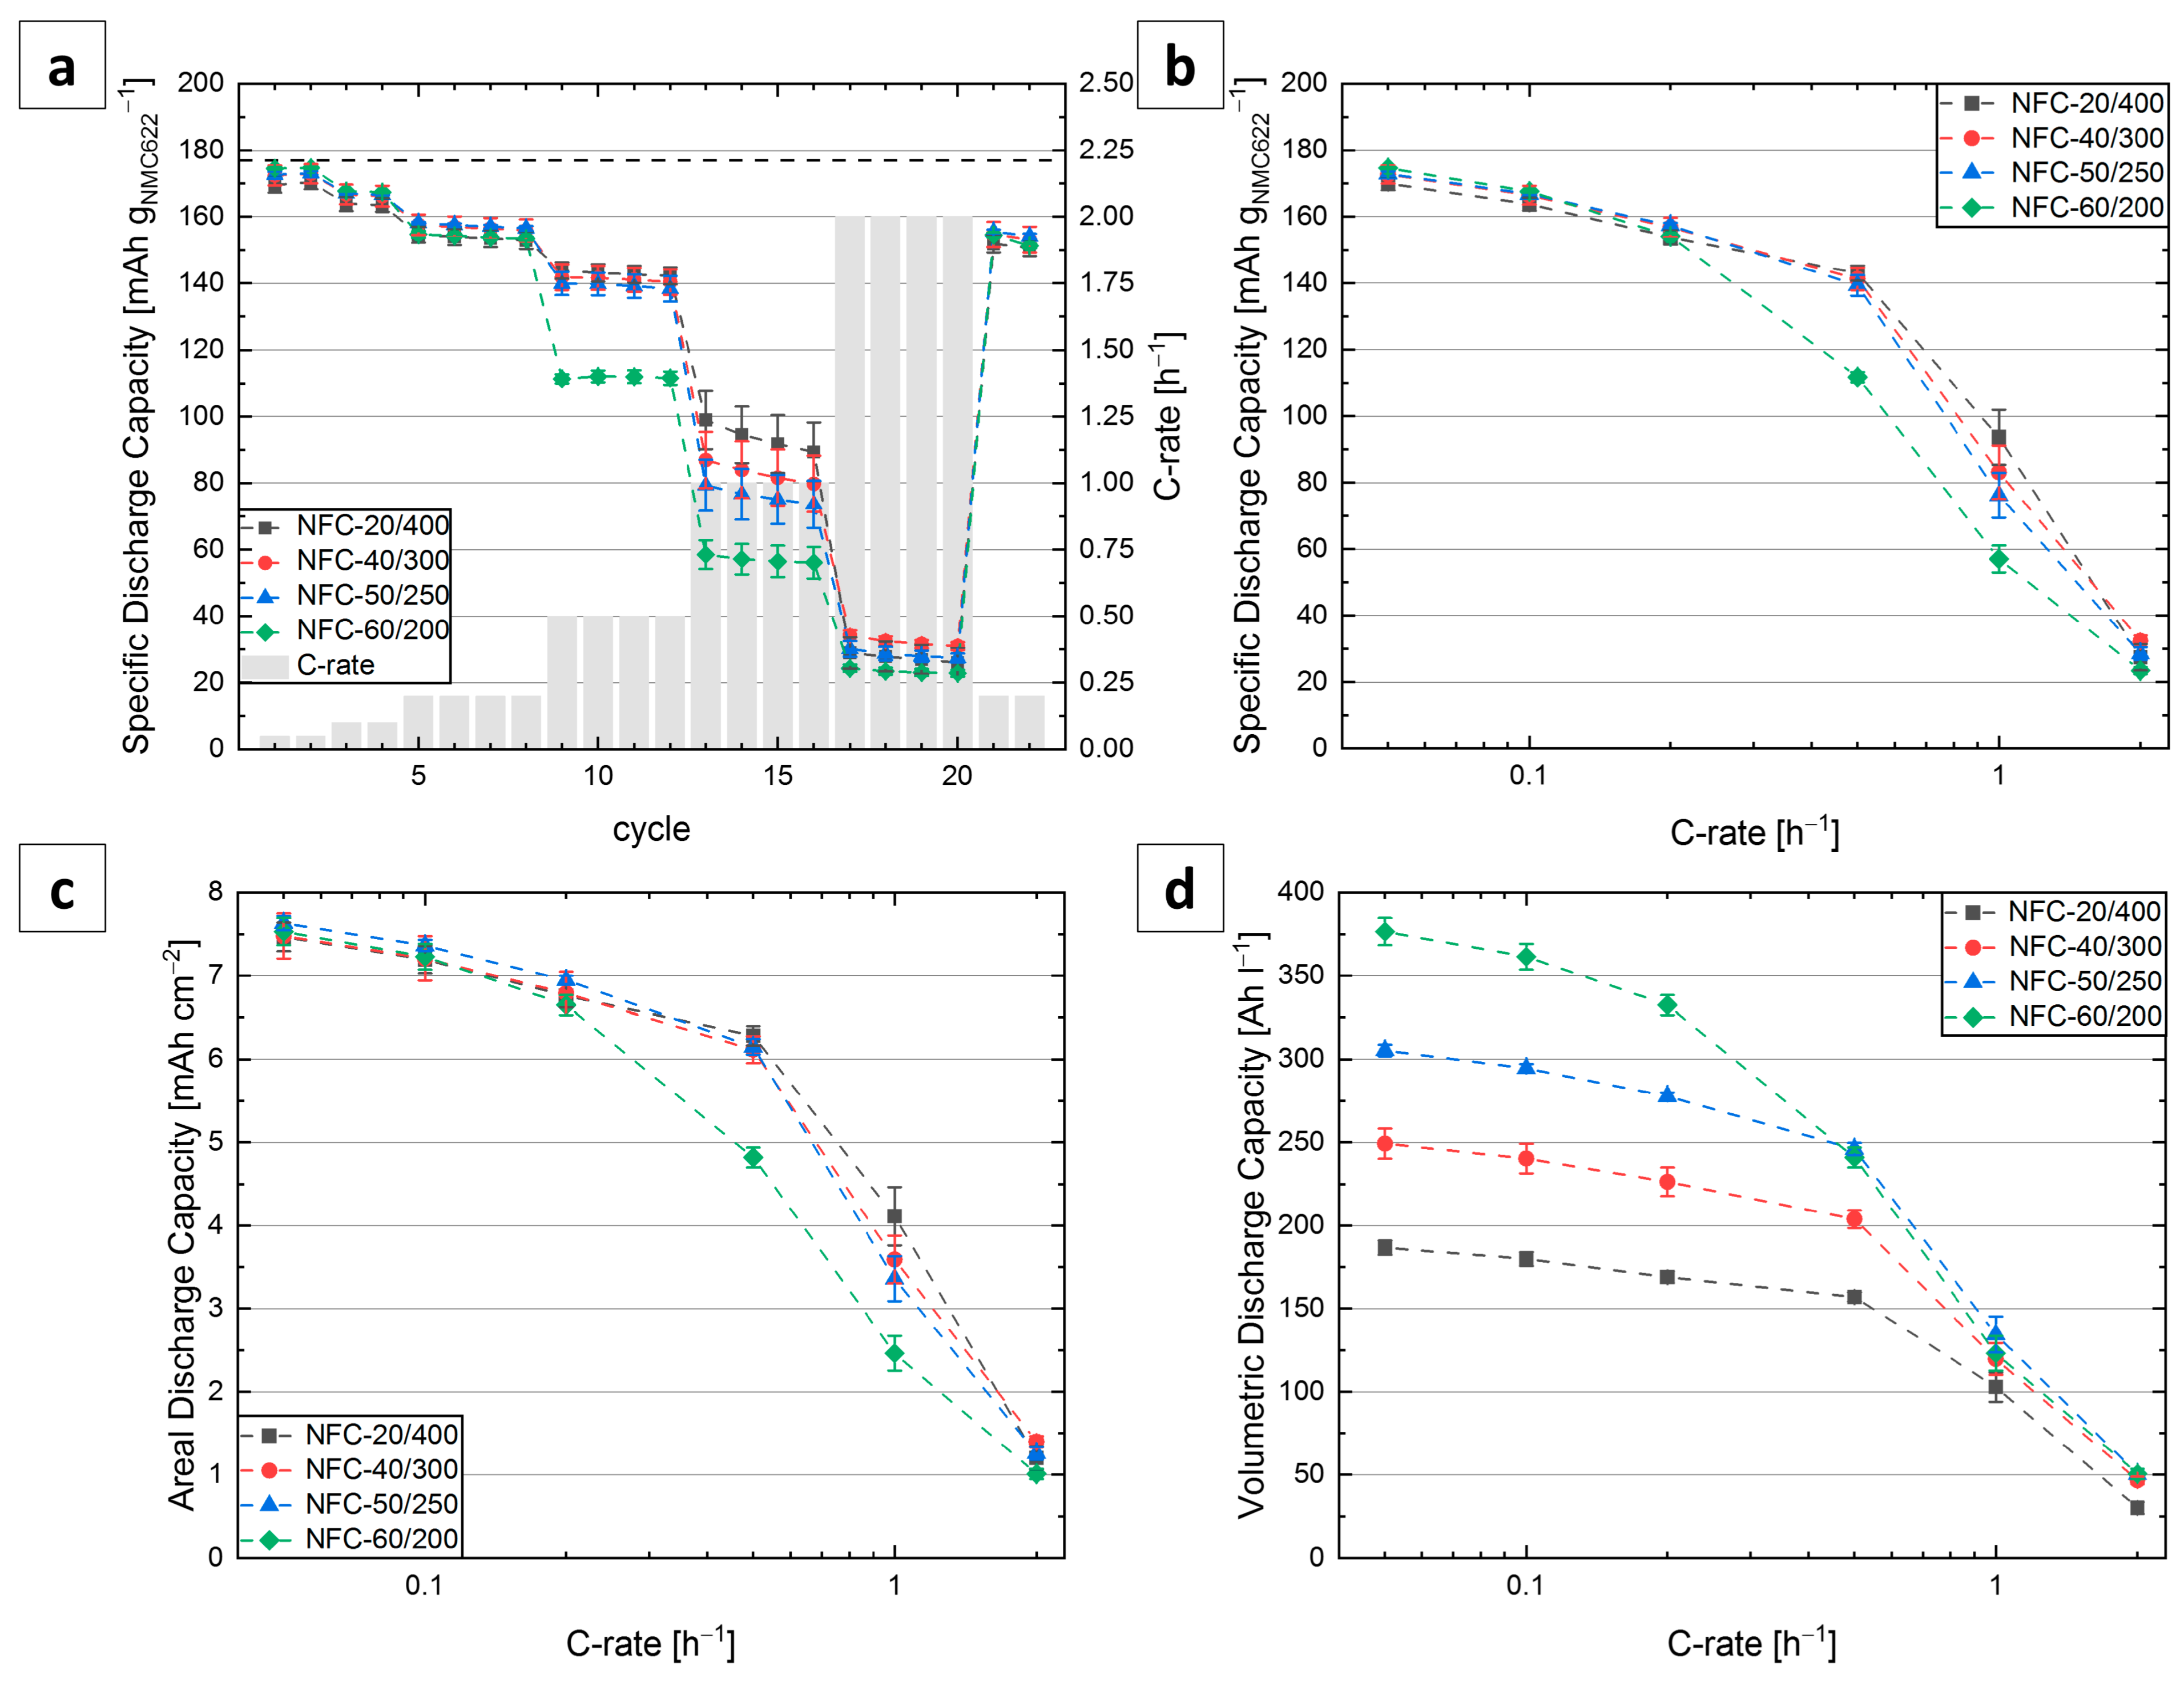
Figure 5 shows the rate capability of the foam-type cathodes related to the mass of active material (Figure 5a,b), electrode area (Figure 5c) and volume (Figure 5d). Since the Coulombic efficiency of each cycle is above 99% and the lithiation (discharge) process is kinetically more impeded than the delithiation (charge) reaction of NMC [46], only the discharge capacity is shown. First, we want to point out that the achieved capacity of the 0.2C cycles at the beginning (cycles 5–8) and at the end of the C-rate tests (cycles 21–22) is quite similar (Figure 5a), revealing that no ageing occurs during the C-rate tests. As for the specific capacity at a low C-rate of 0.05C, the difference amongst all samples is very low (cf. Figure 5b) with the highest value of 175 mAh g−1 exhibited by the strongest densified cathode (NFC-60/200) and the lowest specific capacity of 170 mAh g−1 by the lowest densified sample NFC-20/400. Even though all samples show a decrease in capacity with increasing C-rate, the difference among the differently densified cathodes is still relatively low, up to a moderate C-rate of 0.2C. The capacity of NFC-60/200 drops sharply between 0.2C and 0.5C, whereas the lower densified samples keep their kind of linear decline. For 1C, all samples exhibit a significant capacity fade and the most significant difference between all samples occurs. With this, the previously described tendency observed at a 0.05C turns around, meaning NFC-20/400 exhibits the highest specific capacity of 94 mAh g−1 and NFC-60/200 archives the lowest specific capacity of 57 mAh g−1. At a C-rate of 2C, the values of all samples are close together and below 33 mAh g−1 independent of the compaction.
Since the areal loading of all investigated samples is similar (around 43.6 mg cm2), the curves and tendencies of the areal discharge capacity are equal to the one of the specific discharge capacity (cf. Figure 5c). It should be noted that the samples reach an areal capacity of 7.6 mAh cm−2 at 0.05C and up to 6.3 mAh cm−2 at 0.5C.
Viewing the volumetric discharge capacity in Figure 5d, the difference between the differently compacted electrodes appears much more pronounced even at a low C-rate of 0.05C. Again, NFC-20/400 constitutes with 187 Ah L−1 the lowest volumetric capacity of all samples. With a higher degree of densification, the volumetric capacity is increased up to a factor of more than two (NFC-20/400 vs. NFC-60/200). As for the specific and areal capacity (cf. Figure 5a,c), the volumetric capacity of NFC-20/400, NFC-40/300 and NFC-50/250 declines almost linearly between 0.05C and 0.5C. In contrast, the 60% densified electrode shows a significant drop already at 0.5C and the measured capacity (241 mAh L−1) is similar to the one of NFC-50/250 (246 mAh L−1). At 1C, a fade of the volumetric capacity appears for all electrodes and at 2C, the volumetric capacity is almost the same. These findings agree well with previous studies on conventional electrodes for LiB, which also show that volumetric capacity can be increased at lower C-rates by densification, but that with increasing C-rate, less densified electrodes become superior in terms of volume utilization [31,47].
To compare the electrochemical properties of the foam-type electrodes with conventional, thick-film cathodes, the measured 1C capacity is viewed. Kremer et al. and Hoffmann et al. [48,49] both investigated ultra-thick NMC622 cathodes with a comparable active mass loading of 50 mg cm−2 corresponding to a theoretical areal capacity of 8 mAh cm−2. In both studies, the rate capability of those thick-film cathodes was investigated at different current densities, amongst others at 8 mAh cm−2 (i.e., 1C). Kremer et al. presented cathodes with a specific capacity of up to 82 mAh g−1 depending on the process parameter. At the current density of 8 mAh cm−2, Hoffmann et al. achieved an areal discharge capacity of up to 2.1 mAh cm−2. In comparison, the cathodes presented in this work exhibit a specific capacity of up to 94 mAh g−1 and an areal capacity of up to 4.1 mAh cm−2 at 1C. These findings demonstrate that foam-type electrodes might be beneficial compared to film-type ones if it comes to high active mass loadings since both specific and areal capacity can be increased significantly. Compared to other studies dealing with high-energy, foam-type cathodes, the trend of the rate capability of our electrodes is similar. For example, the foam-type cathodes investigated by Fritsch et al. [22], who used NMC111 as active material, show a strong capacity fade at 1C and 2C, as well. In contrast, other works which deal with LFP-based systems exhibit a better capacity retention with the increasing C-rate; however, at the cost of lower cell voltage and thus, reduced energy density [23,25,29]. When the pores of the metal foam are only partially filled with active mass, outstanding rate capability can be archived [22]. Ideally, only the surface of the metal foam is coated with the active material. Such high-power optimized cathodes are reported inter alia by Cui et al. [50] and others [51,52,53]. However, the areal capacity and energy density of these cathodes are quite poor, since the overall active material loading is low.
To evaluate the correlation between the electrodes microstructure, the intrinsic resistance and the rate capability more in detail, the charge and discharge curves of the densified electrodes at the different C-rates are plotted in Figure 6a,b, respectively. The shape of the curves reflects the overpotentials, which are linked directly to the intrinsic resistances, the microstructure and the C-rate. Although both the potential onset at charging and offset at discharging increase with a higher C-rate, the curves of all electrodes are almost congruent up to 0.2C. While the shift is usually related to ohmic drop and explained by Ohm’s law [54], the congruent curves of the (dis)charge can be interpreted to mean that no significant overvoltage occurs due to differences in microstructure and intrinsic resistances. At 0.5C and 1C, the slope of the constant current step (charging) between 3.8 and 4,2V, which is known to be related to diffusion overpotential [54], varies for the different electrodes. In detail, the lowest densified cathode (NFC-20/400) shows the flattest curves. Comparing this to NFC-40/300 and NFC-50/250, the slope increases with higher densification, whereas NFC-60/200 possesses a rather steep slope. The diffusion overvoltage can be explained by the consumption of reactants during the electrochemical reaction [47]. In particular, this means a depletion of lithium-ions, which is mainly caused by an impaired diffusion of lithium-ions into the pores of the electrodes. Consequently, this findings are in good accordance to the EIS-analyses which reveals a significantly higher pore resistance of the highly densified electrodes (NFC-60/200) compared to the less compact ones (cf. Figure 4b). At the highest C-rate (2C), the overpotentials are so high that the end-of-charge voltage is reached immediately and any differences between the samples cannot be detected. Due to the instantly reached end-of-charge voltage, only separator-near regions of the electrodes are electrochemically active.
To sum up, the charge and discharge curve reveals that at a low C-rate the difference in pore resistance does not have any effect, whereas at a moderate C-rate it determines the electrochemical performance. However, at a high C-rate of 2C, the high current density—which in turn causes high overpotentials—is the limiting factor.
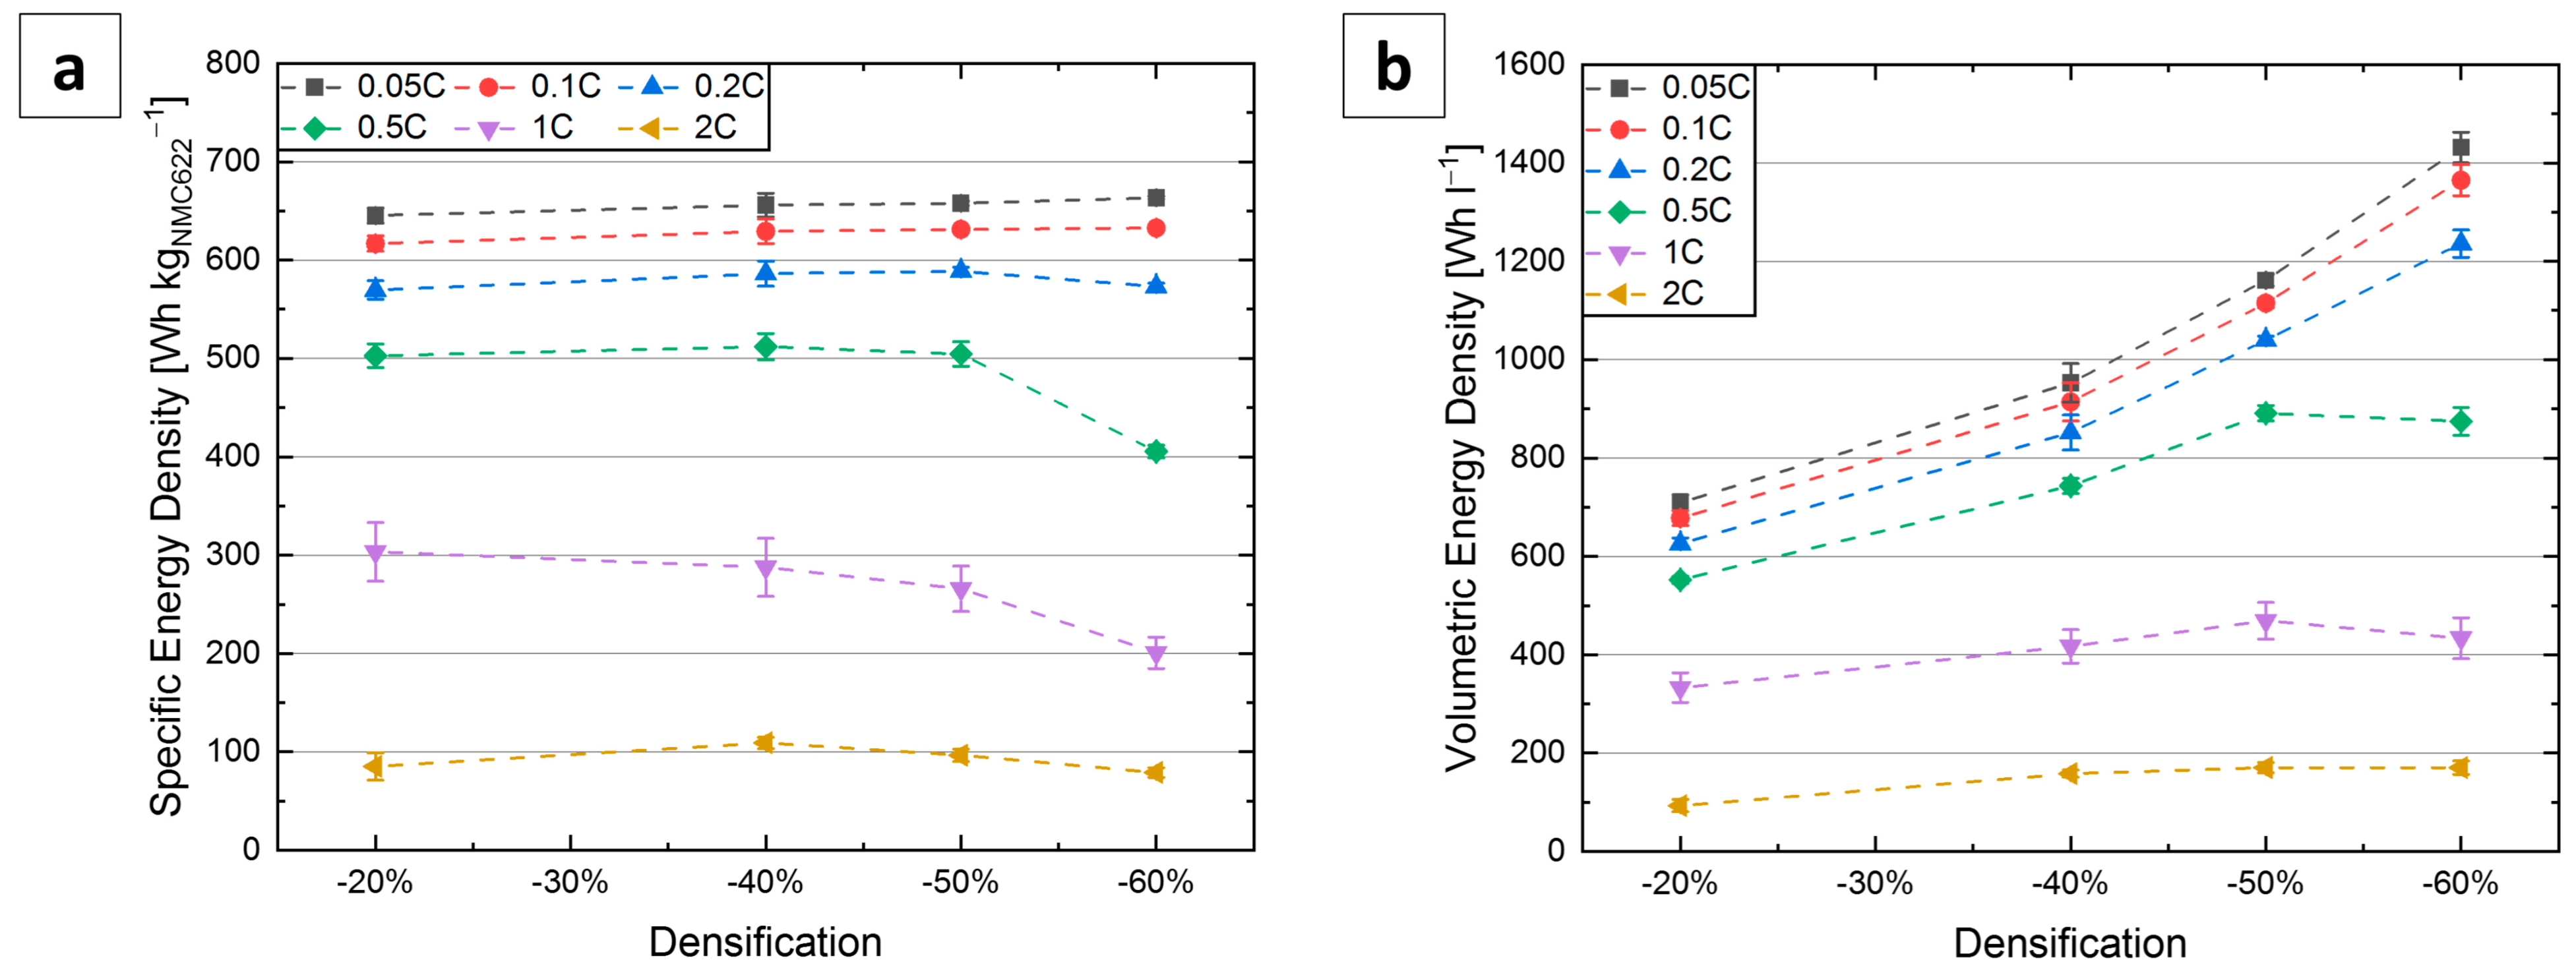
To review how the energy density can be optimized by a tailored microstructure, the specific and volumetric energy densities are plotted against the electrode porosity for the various C-rates in Figure 7. The specific energy density (related to the mass of active material) is almost independent of the densification for low C-rates (≤0.2C). Apparently, an increasing densification and thus an increase of the pore resistance (cf. Figure 4c) does not significantly impair the lithium-ion diffusion at such low C-rates. In contrast, an improved contact of the active mass and foam leads to a higher active material utilization and thus, a slightly higher specific energy density. Despite the extremely high active material loading, the cathode active material is almost fully utilized.
The volumetric energy density increases almost linear with increasing densification (i.e., lower porosity) for C-rates ≤ 0.2C. Obviously, the change in thickness during compaction mainly determines the volumetric energy density at low C-rates since the specific capacity is basically independent of the compaction. E.g., NFC-60/200 is half as thick as NFC-20/400 and consequently possesses for low C-rate a volumetric capacity twice as high as NFC-20/400. This behaviour is valid as long as the compaction has no significant influence on the specific capacity.
With higher C-rates, the diffusion overpotential referred to the pore resistance determines the electrochemical performance more and more. The significantly higher pore resistance of NFC-60/200 causes lithium-ion transport limitations to become relevant for the highly densified electrodes already at a C-rate of 0.5C resulting in significant energy losses. However, the volume reduction from 250 µm to 200 µm cancels out this energy loss so that the volumetric energy density does not change between NFC-50/250 and NFC-60/200 (respectively 44% and 30% porosity). At 1C, the diffusion overpotential dominates for all compacted electrodes. The specific energy density is significantly lower than at 0.5C and this effect is more pronounced with increasing compaction. In contrast, the volumetric energy density increases up to 50% densification. Supposedly, the decrease in the volume overcompensates the energy decrease for these electrodes. Note that for the highly compacted cathodes (NFC-60/200) it is the other way round; the decrease of the energy prevails over the additional volume reduction and volumetric energy density decreases.
To wrap our findings up: With respect to battery mass and utilization of a given volume, one would recommend the highly densified electrode (60% compaction) for C-rates lower than 0.5C. However, if the C-rate increases, the increased pore resistances limits lithium-ion diffusion and a 50% compaction seems to be favourable. At this densification, an optimum is found between both the contact (electrical) and pore resistance (ionic) (cf. Figure 4b). For applications where a high-energy density is more essential than fast charging (e.g., in medical technology systems and wearable devices), the achieved electrochemical properties up to moderate C-rates should be adequate and superior to a conventional layer electrode structure. Thus, using foam-type cathodes can fulfil the corresponding requirements. However, the low specific and volumetric energy density at the highest investigated C-rate of 2C reveal the limit of such electrodes.

4. Conclusions

In this study, foam-type cathodes with an areal capacity of 7.6 mAh cm−2 were fabricated by a vacuum-supported infiltration method. A detailed microscopic analysis reveals the microstructural evolution during compaction and enables correlation of the electrochemical performance with microstructural properties. We showed that densification leads to a lower contact resistance Rcontact, and thus to higher active material utilization. Additionally, densification eliminates shrinkage cavities and decreases the inner porosity of the foam and the porosity of the active mass, which is favourable from a volumetric view. However, densification leads to increased pore resistance Rpore. In particular, the highest densified cathode suffers from a strongly increased Rpore and clogging of the surface pores by the binder and conductive additive compound, impairing the accessibility of the electrolyte into the electrode and the lithium-ion diffusion inside the pores. This results in a significant capacity loss even at 0.2C and a poor rate capability of the highly densified samples. Using foam-type cathodes improves the capacity output by 95% compared with conventional ultra-thick cathodes from the literature at 1C. At high C-rates (2C), the limits of the electrode in terms of capacity retention and overpotentials are reached. Evaluating the volumetric and specific energy density, we can determine the optimum degree of densification depending on the requirements in terms of the C-rate. E.g., for a C-rate of 0.5C, a densification of 50% (corresponding to a porosity of 44%) is preferable. However, for low C-rates, the strongest compaction provides a much higher energy density.
Ongoing work in our labs is dealing inter alia with increasing the active mass loading by multiple infiltrations and tailoring the microstructure by laser modification to improve the kinetics of highly loaded and highly densified electrodes.

Author Contributions

Conceptualization, J.O. and V.K.; methodology, J.O.; formal analysis, J.O.; investigation, J.O.; data curation, J.O.; writing—original draft preparation, J.O.; writing—review and editing, M.K. and V.K.; visualization, J.O.; supervision, M.K. and V.K.; project administration, J.O. and V.K.; funding acquisition, V.K.; All authors have read and agreed to the published version of the manuscript.

Funding

This research was funded by the German Federal Ministry of Education and Research within the project “LiMaProMet” (No. 13FH4I02IA) and the Ministry of Science, Research and the Arts of Baden-Württemberg within the project “3D-Design-LIB”.

Data Availability Statement

Data are available upon request from the corresponding author.

Acknowledgments

The authors would like to thank VARTA Microbattery GmbH for supporting this research as well as Christian Weisenberger, Marius Bolsinger and Bernhard Auch (all Aalen University) for the helpful discussions.

Conflicts of Interest

The authors declare no conflict of interest.

References

  1. Li, M.; Lu, J.; Chen, Z.; Amine, K. 30 Years of Lithium-Ion Batteries. Adv. Mater. Weinheim. 2018, 30, 1800561. [Google Scholar] [CrossRef] [PubMed]
  2. Olabi, A.G.; Abbas, Q.; Shinde, P.A.; Abdelkareem, M.A. Rechargeable batteries: Technological advancement, challenges, current and emerging applications. Energy 2023, 266, 126408. [Google Scholar] [CrossRef]
  3. Winter, M.; Barnett, B.; Xu, K. Before Li Ion Batteries. Chem. Rev. 2018, 118, 11433–11456. [Google Scholar] [CrossRef] [PubMed]
  4. Fichtner, M.; Edström, K.; Ayerbe, E.; Berecibar, M.; Bhowmik, A.; Castelli, I.E.; Clark, S.; Dominko, R.; Erakca, M.; Franco, A.A.; et al. Rechargeable Batteries of the Future—The State of the Art from a BATTERY 2030+ Perspective. Adv. Energy Mater. 2022, 12, 2102904. [Google Scholar] [CrossRef]
  5. Zeng, X.; Li, M.; Abd El-Hady, D.; Alshitari, W.; Al-Bogami, A.S.; Lu, J.; Amine, K. Commercialization of Lithium Battery Technologies for Electric Vehicles. Adv. Energy Mater. 2019, 9, 1900161. [Google Scholar] [CrossRef]
  6. Tian, Y.; Zeng, G.; Rutt, A.; Shi, T.; Kim, H.; Wang, J.; Koettgen, J.; Sun, Y.; Ouyang, B.; Chen, T.; et al. Promises and Challenges of Next-Generation “Beyond Li-ion” Batteries for Electric Vehicles and Grid Decarbonization. Chem. Rev. 2021, 121, 1623–1669. [Google Scholar] [CrossRef]
  7. Singh, M.; Kaiser, J.; Hahn, H. Thick Electrodes for High Energy Lithium Ion Batteries. J. Electrochem. Soc. 2015, 162, A1196–A1201. [Google Scholar] [CrossRef]
  8. Gallagher, K.G.; Trask, S.E.; Bauer, C.; Woehrle, T.; Lux, S.F.; Tschech, M.; Lamp, P.; Polzin, B.J.; Ha, S.; Long, B.; et al. Optimizing Areal Capacities through Understanding the Limitations of Lithium-Ion Electrodes. J. Electrochem. Soc. 2016, 163, A138–A149. [Google Scholar] [CrossRef]
  9. Xu, M.; Reichman, B.; Wang, X. Modeling the effect of electrode thickness on the performance of lithium-ion batteries with experimental validation. Energy 2019, 186, 115864. [Google Scholar] [CrossRef]
  10. Yu, S.; Kim, S.; Kim, T.Y.; Nam, J.H.; Cho, W.I. Model Prediction and Experiments for the Electrode Design Optimization of LiFePO4/Graphite Electrodes in High Capacity Lithium-ion Batteries. B. Kor. Chem. Soc. 2013, 34, 79–88. [Google Scholar] [CrossRef]
  11. Zheng, H.; Li, J.; Song, X.; Liu, G.; Battaglia, V.S. A comprehensive understanding of electrode thickness effects on the electrochemical performances of Li-ion battery cathodes. Electrochim. Acta 2012, 71, 258–265. [Google Scholar] [CrossRef]
  12. Du, Z.; Wood, D.L.; Daniel, C.; Kalnaus, S.; Li, J. Understanding limiting factors in thick electrode performance as applied to high energy density Li-ion batteries. J. Appl. Electrochem. 2017, 47, 405–415. [Google Scholar] [CrossRef]
  13. Issatayev, N.; Nuspeissova, A.; Kalimuldina, G.; Bakenov, Z. Three-dimensional foam-type current collectors for rechargeable batteries: A short review. J. Power Sources Adv. 2021, 10, 100065. [Google Scholar] [CrossRef]
  14. Abe, H.; Kubota, M.; Nemoto, M.; Masuda, Y.; Tanaka, Y.; Munakata, H.; Kanamura, K. High-capacity thick cathode with a porous aluminum current collector for lithium secondary batteries. J. Power Sources 2016, 334, 78–85. [Google Scholar] [CrossRef]
  15. Jin, S.; Jiang, Y.; Ji, H.; Yu, Y. Advanced 3D Current Collectors for Lithium-Based Batteries. Adv. Mater. Weinheim. 2018, 30, 1802014. [Google Scholar] [CrossRef]
  16. Yue, Y.; Liang, H. 3D Current Collectors for Lithium-Ion Batteries: A Topical Review. Small Methods 2018, 2, 1800056. [Google Scholar] [CrossRef]
  17. Gaikwad, A.M.; Khau, B.V.; Davies, G.; Hertzberg, B.; Steingart, D.A.; Arias, A.C. A High Areal Capacity Flexible Lithium-Ion Battery with a Strain-Compliant Design. Adv. Energy Mater. 2015, 5, 1401389. [Google Scholar] [CrossRef]
  18. Shaijumon, M.M.; Perre, E.; Daffos, B.; Taberna, P.-L.; Tarascon, J.-M.; Simon, P. Nanoarchitectured 3D cathodes for Li-ion microbatteries. Adv. Mater. Weinheim. 2010, 22, 4978–4981. [Google Scholar] [CrossRef]
  19. Xu, X.; Li, F.; Zhang, D.; Ji, S.; Huo, Y.; Liu, J. FeF 3 @C nanotube arrays grown on carbon fabric as a free-standing cathode for lithium-ion batteries. Mater. Chem. Front. 2022, 6, 3512–3521. [Google Scholar] [CrossRef]
  20. Poetz, S.; Fuchsbichler, B.; Schmuck, M.; Koller, S. Development of a 3d current collector for the positive electrode in lithium-ion batteries. J Appl. Electrochem. 2014, 44, 989–994. [Google Scholar] [CrossRef]
  21. Wang, J.S.; Liu, P.; Sherman, E.; Verbrugge, M.; Tataria, H. Formulation and characterization of ultra-thick electrodes for high energy lithium-ion batteries employing tailored metal foams. J. Power Sources 2011, 196, 8714–8718. [Google Scholar] [CrossRef]
  22. Fritsch, M.; Standke, G.; Heubner, C.; Langklotz, U.; Michaelis, A. 3D-cathode design with foam-like aluminum current collector for high energy density lithium-ion batteries. J. Energy Storage 2018, 16, 125–132. [Google Scholar] [CrossRef]
  23. Yang, G.F.; Song, K.Y.; Joo, S.K. A metal foam as a current collector for high power and high capacity lithium iron phosphate batteries. J. Mater. Chem. A 2014, 2, 19648–19652. [Google Scholar] [CrossRef]
  24. Song, K.Y.; Joo, S.K. High electrochemical performance bendable Li secondary batteries based on a three-dimensional metal foam-type current collector. Mater. Res. Bull. 2017, 94, 328–334. [Google Scholar] [CrossRef]
  25. Yang, G.-F.; Song, K.-Y.; Joo, S.-K. Ultra-thick Li-ion battery electrodes using different cell size of metal foam current collectors. RSC Adv. 2015, 5, 16702–16706. [Google Scholar] [CrossRef]
  26. Feng, H.; Chen, Y.; Wang, Y. Electrochemical Performance of a Lithium Ion Battery with Different Nanoporous Current Collectors. Batteries 2019, 5, 21. [Google Scholar] [CrossRef]
  27. Noelle, D.J.; Wang, M.; Qiao, Y. Improved safety and mechanical characterizations of thick lithium-ion battery electrodes structured with porous metal current collectors. J. Power Sources 2018, 399, 125–132. [Google Scholar] [CrossRef]
  28. Yang, G.F.; Song, J.S.; Kim, H.Y.; Joo, S.K. Metal Foam as Positive Electrode Current Collector for LiFePO 4 -Based Li-Ion Battery. Jpn. J. Appl. Phys. 2013, 52, 10MB13. [Google Scholar] [CrossRef]
  29. Song, K.Y.; Jang, G.S.; Tao, J.; Lee, J.H.; Joo, S.K. Effects of Electrode Thickness on Three-Dimensional NiCrAl Metal Foam Cathode for Lithium Ion Battery. J. Nanosci. Nanotechnol. 2018, 18, 992–998. [Google Scholar] [CrossRef]
  30. Song, K.Y.; Jang, G.S.; Tao, J.; Lee, J.H.; Joo, S.K. Influence of Conductive Carbon Content Using a Three-Dimensional Foam-Type Current Collector for Lithium Ion Battery. J. Electrochem. Soc. 2016, 163, A2981–A2987. [Google Scholar] [CrossRef]
  31. Schmidt, D.; Kamlah, M.; Knoblauch, V. Highly densified NCM-cathodes for high energy Li-ion batteries: Microstructural evolution during densification and its influence on the performance of the electrodes. J. Energy Storage 2018, 17, 213–223. [Google Scholar] [CrossRef]
  32. Ademmer, M.; Prifling, B.; Weller, M.; Hilger, A.; Osenberg, M.; Manke, I.; Knoblauch, V.; Schmidt, V. Investigating the influence of the calendering process on the 3D microstructure of single-layer and two-layer cathodes in lithium-ion batteries using synchrotron tomography. J. Power Sources 2022, 548, 231960. [Google Scholar] [CrossRef]
  33. Choi, J.; Son, B.; Ryou, M.-H.; Kim, S.H.; Ko, J.M.; Lee, Y.M. Effect of LiCoO2 Cathode Density and Thickness on Electrochemical Performance of Lithium-Ion Batteries. J. Electrochem. Sci. Technol. 2013, 4, 27–33. [Google Scholar] [CrossRef]
  34. Yang, G.-F.; Joo, S.-K. Calendering effect on the electrochemical performances of the thick Li-ion battery electrodes using a three dimensional Ni alloy foam current collector. Electrochim. Acta 2015, 170, 263–268. [Google Scholar] [CrossRef]
  35. Hafner, C.; Bernthaler, T.; Knoblauch, V.; Schneider, G. The Materialographic Preparation and Microstructure Characterization of Lithium Ion Accumulators. Pract. Metallogr. 2012, 49, 75–85. [Google Scholar] [CrossRef]
  36. Weisenberger, C.; Guth, G.; Bernthaler, T.; Knoblauch, V. New Quality Evaluation Approaches for Lithium Ion Batteries Using the Interference Layer Metallography in Combination with Quantitative Structural Analysis. Pract. Metallogr. 2014, 51, 5–31. [Google Scholar] [CrossRef]
  37. Bolsinger, M.; Weller, M.; Ruck, S.; Kaya, P.; Riegel, H.; Knoblauch, V. Selective surface treatment by means of IR-laser—A new approach to enhance the rate capability of cathodes for Li-ion batteries. Electrochim. Acta 2020, 330, 135163. [Google Scholar] [CrossRef]
  38. Ogihara, N.; Kawauchi, S.; Okuda, C.; Itou, Y.; Takeuchi, Y.; Ukyo, Y. Theoretical and Experimental Analysis of Porous Electrodes for Lithium-Ion Batteries by Electrochemical Impedance Spectroscopy Using a Symmetric Cell. J. Electrochem. Soc. 2012, 159, A1034–A1039. [Google Scholar] [CrossRef]
  39. Landesfeind, J.; Pritzl, D.; Gasteiger, H.A. An Analysis Protocol for Three-Electrode Li-Ion Battery Impedance Spectra: Part I. Analysis of a High-Voltage Positive Electrode. J. Electrochem. Soc. 2017, 164, A1773–A1783. [Google Scholar] [CrossRef]
  40. Pritzl, D.; Landesfeind, J.; Solchenbach, S.; Gasteiger, H.A. An Analysis Protocol for Three-Electrode Li-Ion Battery Impedance Spectra: Part II. Analysis of a Graphite Anode Cycled vs. LNMO. J. Electrochem. Soc. 2018, 165, A2145–A2153. [Google Scholar] [CrossRef]
  41. Carbonari, G.; Müller, V.; Scurtu, R.-G.; Memm, M.; Hoffmann, A.; Wohlfahrt-Mehrens, M. Communication—Edge Quality Contribution on the Electrical Impedance of Lithium-Ion Batteries Electrodes. J. Electrochem. Soc. 2020, 167, 080504. [Google Scholar] [CrossRef]
  42. Gaberscek, M.; Moskon, J.; Erjavec, B.; Dominko, R.; Jamnik, J. The Importance of Interphase Contacts in Li Ion Electrodes: The Meaning of the High-Frequency Impedance Arc. Electrochem. Solid State Lett. 2008, 11, A170. [Google Scholar] [CrossRef]
  43. Raccichini, R.; Furness, L.; Dibden, J.W.; Owen, J.R.; García-Araez, N. Impedance Characterization of the Transport Properties of Electrolytes Contained within Porous Electrodes and Separators Useful for Li-S Batteries. J. Electrochem. Soc. 2018, 165, A2741–A2749. [Google Scholar] [CrossRef]
  44. Landesfeind, J.; Hattendorff, J.; Ehrl, A.; Wall, W.A.; Gasteiger, H.A. Tortuosity Determination of Battery Electrodes and Separators by Impedance Spectroscopy. J. Electrochem. Soc. 2016, 163, A1373–A1387. [Google Scholar] [CrossRef]
  45. Cronau, M.; Paulus, A.; Pescara, L.P.; Kroll, M.; Renz, D.; Mekontso, J.A.; Marx, A.; Roling, B. What Limits the Rate Capability of Ultrathick Composite Electrodes in Lithium-Ion Batteries? A Case Study on the Thickness-Dependent Impedance of LiCoO2 Cathodes. Batter. Supercaps 2022, 5, e202200194. [Google Scholar] [CrossRef]
  46. Kasnatscheew, J.; Evertz, M.; Streipert, B.; Wagner, R.; Klöpsch, R.; Vortmann, B.; Hahn, H.; Nowak, S.; Amereller, M.; Gentschev, A.-C.; et al. The truth about the 1st cycle Coulombic efficiency of LiNi1/3Co1/3Mn1/3O2 (NCM) cathodes. Phys. Chem. Chem. Phys. 2016, 18, 3956–3965. [Google Scholar] [CrossRef]
  47. Zheng, H.; Tan, L.; Liu, G.; Song, X.; Battaglia, V.S. Calendering effects on the physical and electrochemical properties of Li[Ni1/3Mn1/3Co1/3]O2 cathode. J. Power Sources 2012, 208, 52–57. [Google Scholar] [CrossRef]
  48. Kremer, L.S.; Hoffmann, A.; Danner, T.; Hein, S.; Prifling, B.; Westhoff, D.; Dreer, C.; Latz, A.; Schmidt, V.; Wohlfahrt-Mehrens, M. Manufacturing Process for Improved Ultra-Thick Cathodes in High-Energy Lithium-Ion Batteries. Energy Technol. 2020, 8, 1900167. [Google Scholar] [CrossRef]
  49. Hoffmann, A.; Heider, E.A.; Dreer, C.; Pfeifer, C.; Wohlfahrt-Mehrens, M. Influence of the Mixing and Dispersing Process on the Slurry Properties and the Microstructure and Performance of Ultrathick Cathodes for Lithium-Ion Batteries. Energy Technol. 2022, 11, 2200484. [Google Scholar] [CrossRef]
  50. Cui, S.; Zhang, J.; Fan, S.; Xing, X.; Deng, L.; Gong, Y. SiOxCy Microspheres with Homogeneous Atom Distribution for a High-Performance Li-Ion Battery. Nano Lett. 2022, 22, 9559–9565. [Google Scholar] [CrossRef]
  51. Wang, Q.; Wang, D.; Wang, B. Preparation and Electrochemical Performance of LiFePO4-based Electrode Using Three-Dimensional Porous Current Collector. Int. J.Electrochem. Sci. 2012, 7, 8753–8760. [Google Scholar]
  52. Zhang, H.; Yu, X.; Braun, P.V. Three-dimensional bicontinuous ultrafast-charge and -discharge bulk battery electrodes. Nat. Nanotechnol. 2011, 6, 277–281. [Google Scholar] [CrossRef] [PubMed]
  53. Nurpeissova, A.; Adi, A.; Aishova, A.; Mukanova, A.; Kim, S.-S.; Bakenov, Z. Synergistic effect of 3D current collector structure and Ni inactive matrix on the electrochemical performances of Sn-based anodes for lithium-ion batteries. Mater. Today Energy 2020, 16, 100397. [Google Scholar] [CrossRef]
  54. Ovejas, V.J.; Cuadras, A. State of charge dependency of the overvoltage generated in commercial Li-ion cells. J. Power Sources 2019, 418, 176–185. [Google Scholar] [CrossRef]
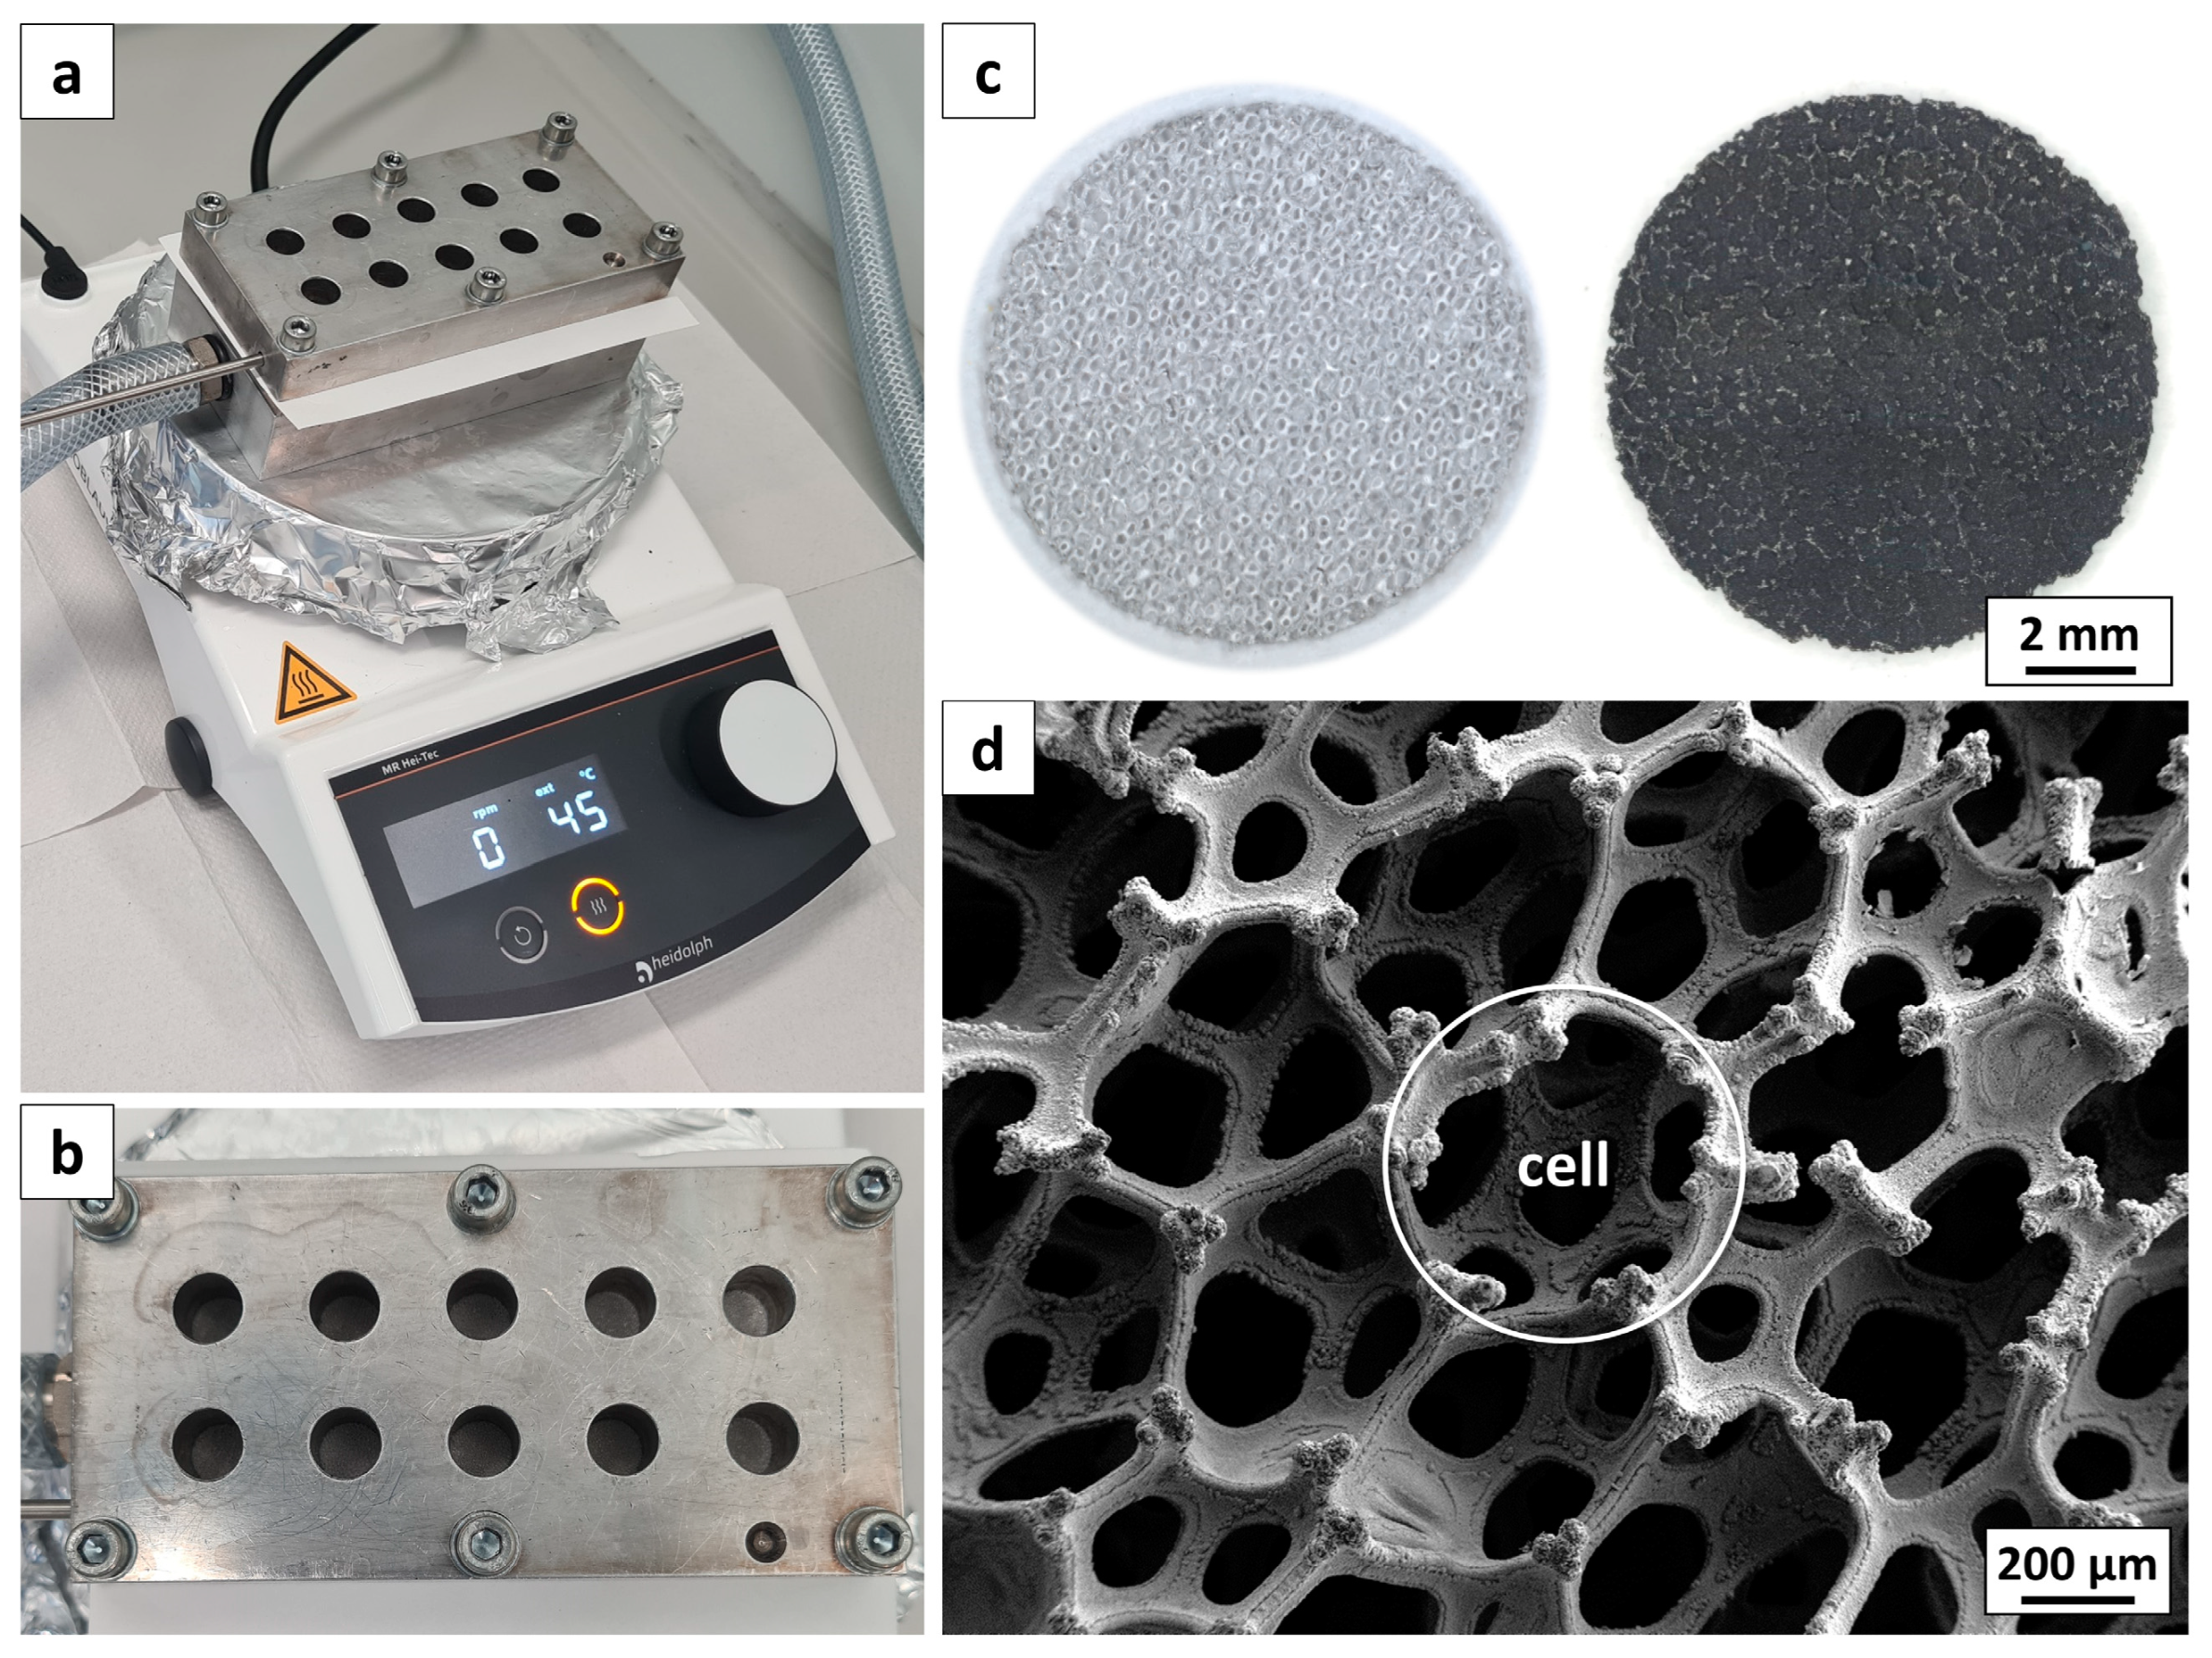
Figure 1. (a,b) Vacuum-supported infiltration chamber for loading the foams with the cathode slurry. (c) Comparison of an aluminium metal foam before (left) and after infiltration (right). (d) SEM image of the used aluminium foam with a cell size of around 540 µm.
Batteries 09 00303 g001
Figure 2. SEM cross-section of NFC-20/400 (a,e,i), NFC-40/300 (b,f,j), NFC-50/250 (c,g,k), and NFC-60/200 (d,h,l) at a magnification of 200× (ad), 500× (eh) and 1000× (il).
Batteries 09 00303 g002
Figure 3. SEM top-view of NFC-20/400 (a,e), NFC-40/300 (b,f), NFC-50/250 (c,g), and NFC-60/200 (d,h) at a magnification of 100× (ad) and 500× (eh).
Batteries 09 00303 g003
Figure 4. (a) Nyquist plot of the symmetrical cells consisting of pristine electrodes with quasi-blocking conditions; (b) Used simplified equivalent circuit to fit the EIS data and the calculated contact and pore resistances (Rcontact and Rpore).
Batteries 09 00303 g004
Figure 5. C-rate test of the foam-type cathode in half-cells vs. Li/Li+ in the range of 0.05C–2C within the potential of 2.6 V–4.3 V. (a) Specific discharge capacity (related to mass of active material) vs. cycle; (b) Specific discharge capacity (related to mass of active material) vs. C-rate; (c) areal discharge capacity vs. C-rate; (d) volumetric discharge capacity vs. C-rate.
Batteries 09 00303 g005
Figure 6. Potential curve of (a) charge and (b) discharge at the various C-rates for each degree of densification.
Batteries 09 00303 g006
Figure 7. (a) Specific and (b) volumetric energy density of the C-rate test vs. the densification for the various C-rates.
Batteries 09 00303 g007
Table 1. Properties of the prepared foam-type cathodes.
NotationDegree of
Densification [%]
Thickness t [µm]Electrode Porosity εelectrode [vol.-%]Electrode Density ρelectrode [g cm−3]NMC622 Loading [mg cm−2]
NFC-20/40020400651.3744.0
NFC-40/30040300531.8243.3
NFC-50/25050250442.2044.2
NFC-60/20060200302.7143.1
Table 2. Calculated resistances of the foam-typed cathodes from EIS measurement.
NotationRohmic [Ω cm2]Rcontact [Ω cm2]Rpore [Ω cm2]
NFC-20/4006.827.140.9
NFC-40/3006.712.644.1
NFC-50/2505.82.747.1
NFC-60/2007.50.663.9
Disclaimer/Publisher’s Note: The statements, opinions and data contained in all publications are solely those of the individual author(s) and contributor(s) and not of MDPI and/or the editor(s). MDPI and/or the editor(s) disclaim responsibility for any injury to people or property resulting from any ideas, methods, instructions or products referred to in the content.