Article

How Cell Design Affects the Aging Behavior: Comparing Electrode-Individual Aging Processes of High-Energy and High-Power Lithium-Ion Batteries Using High Precision Coulometry

by
Sebastian Michael Peter Jagfeld
1,*,
Kai Peter Birke
1,
Alexander Fill
1 and
Peter Keil
2
1
Electrical Energy Storage Systems, Institute for Photovoltaics, University of Stuttgart, Pfaffenwaldring 47, 70569 Stuttgart, Germany
2
Battery Dynamics GmbH, Lichtenbergstraße 8, 85748 Garching bei München, Germany
*
Author to whom correspondence should be addressed.
Batteries 2023, 9(4), 232; https://doi.org/10.3390/batteries9040232
Submission received: 17 March 2023 / Revised: 6 April 2023 / Accepted: 11 April 2023 / Published: 18 April 2023
(This article belongs to the Special Issue The Precise Battery—towards Digital Twins for Advanced Batteries)

Abstract

:
The aging behavior of lithium-ion batteries is crucial for the development of electric vehicles and many other battery-powered devices. The cells can be generally classified into two types: high-energy (HE) and high-power (HP) cells. The cell type used depends on the field of application. As these cells differ in their electrical behavior, this work investigates whether both cell types also show different aging behavior. More precisely, the occurring capacity loss and internal side reactions are analyzed via the charge throughput. For comparison, aging tests are carried out with a high-precision battery tester, allowing the application of High Precision Coulometry (HPC). This enables early detection of aging effects and also allows us to break down the capacity loss into electrode-individual processes. A total of two sub-studies are performed: (1) a cyclic study focusing on lithium plating; and (2) an accelerated calendar aging study. It is found that HE cells exhibit stronger cyclic aging effects (lithium plating) and HP cells exhibit stronger calendar aging effects. The higher lithium plating can be explained by the higher diffusion resistance of the lithium ions within the electrodes of HE Cell. The higher calendar aging fits to the larger electrode surfaces of the HP cell. These results give deep insights into the proceeding aging in a novel way and are interesting for the selection of the appropriate cell type in the context of battery development. In a next step, the measured capacity losses could also be used for a simple parameterization of battery aging models.

Graphical Abstract

1. Introduction

While lithium-ion batteries have conquered the market of consumer products, and the automotive industry, cells have become specialized for their individual usage. Whereas battery electric vehicles and smartphones require high-energy (HE) density, other fields such as power tools and hybrid electric vehicles require high-power (HP) cells. These cell types differ in their characteristics. As their name implies, HP cells are designed with a focus on low internal resistance for high power capability. HE cells are designed with a focus on maximizing the content of electrode active material for high energy density. This work investigates whether both cell types show different aging behavior. Empowered by High Precision Coulometry (HPC), multiple aging mechanisms are compared.

1.1. Literature Review

The typical characteristics of both cell types can be traced to differences in cell design: Thin layers of active material in combination with small particle sizes and a high porosity decrease internal resistance, which increases the power capability [1]. Most important is the diffusion resistance of lithium ions on their way from deintercalation at one electrode to intercalation at the other one, which makes up more than half of the total resistance [2]. This enables a higher power capability at the expense of energy content. HE cells are designed the other way around: Big active mass particles in thick layers with fewer pores and thinner collectors lead to higher energy density [1].
The different electrical properties of both cell types could also lead to different aging characteristics. Ecker gives an indication of this in [3], where different behavior regarding lithium plating is measured for both cell types. This work also calls for further investigation on this topic. Different lithium plating can be plausible, as a local negative potential of the negative electrode causes the plating itself. This is caused by a local high lithiation, as the potential of the negative half-cell decreases with lithiation. Mei et al. [4] show that this is the case at the electrode surface facing the separator. Linsenmann [5] finds a lithium gradient within the negative electrode created by the transport-limitation of lithium ions in the charging process of the cell. Lithium plating can be caused by charge transfer limitations as well as by limitations in the diffusion processes within the solid particles [6]. As both cell types differ in electrode thickness and diffusion length for the lithium ions, a different plating behavior seems reasonable.
Besides the cyclic aging effect of lithium plating, in the work of Li et al. [7] the time-dependent (and thus calendar) aging is measured. In their research, a connection between aging and the electrode surface is presented. With an increasing electrode surface, aging effects increase [7]. An increased electrode surface area while maintaining capacity correlates in turn with a stronger HP cell design [1]. Summarized, higher calendar aging is expected for HP cells.
As it is performed here, research differs between two general forms of aging, cyclic and calendar [8,9]. The focus of this work is lithium plating as a cyclic aging process since cyclic aging is expected to occur predominantly at the negative electrode. For calendar aging mechanisms, it is distinguished between aging processes at the negative electrode, at the positive electrode, and coupled aging processes, which affect both electrodes the same way. Dominant mechanisms in the background here are the Solid Electrolyte Interphase Layer (SEI) formation at the negative electrode and cover layer formation at the positive electrode. Coupled side reactions on the other hand involve processes where both electrodes are implicated, such as the oxidation and dissolution of transition metals at the positive electrode. The resulting positively charged transition metal ions migrate to the negative electrode, where they are reduced, which leads to an oxidation and deintercalation of lithium from the anode active material. The deintercalated Li+ cannot be discharged from the negative electrode anymore, resulting in a loss of cyclable lithium [10]. Further information on different aging processes can be found in the review of Han et al. [8,10].
To enable the measurement of electrode-individual aging processes, HPC is used as a measurement technique. Here, this technique is not just used to analyze single charge–discharge cycles by itself to obtain information on capacity loss, but more the sequence of multiple cycles. The cell is charged and discharged in between fixed voltage limitations and the continuous charge balance is recorded. In the next step, the slippage of the discharge and the charge end-points is evaluated. The slippage of the endpoints in the continuous charge balance is a capacity value, which describes the amount of side reactions occurring inside the cell. The slippage of the discharge endpoint hereby correlates with aging processes elapsed at the negative electrode, and the slippage of the charge endpoint with the positive electrode aging. The difference between discharge endpoint slippage and charge endpoint slippage corresponds to the overall irreversible capacity fade. Detailed explanations of the development of the method, as well as of the detection of different aging processes, can be found in the work of Smith et al., Fathi et al., Burns et al., and Keil et al. [10,11,12,13,14,15].

1.2. Present Work

It is expected that the cell designs of the different cell types HE and HP affect aging behavior. To gain better knowledge of the occurring effects and to understand in which way aging is influenced, aging studies were conducted. It is assumed that HE cells are more prone to cyclic aging and so on lithium plating because of their higher diffusion resistance. It is also assumed that HP cells show higher calendar aging, caused by their bigger electrode surface. The generated information can help select a proper cell type for different use cases and can be used for simulations in the next step.

2. Materials and Methodology

To obtain information about the ongoing aging reactions, different tests were conducted. In Section 2.1, the selected sample cells are presented, and the test setup used to conduct the experiments is shown. Section 2.2 explains the test procedure, containing a cyclical and a calendar aging test.

2.1. Materials

To compare the aging behavior of HE and HP cells, it is important to find a pair of sample cells to represent their individual species. These cells should only differ in their HE and HP properties (e.g., electrode thickness, porosity), while all the other parameters (e.g., electrode chemistry, manufacturer, year) should be as similar as possible. For this reason, the cells shown in Table 1 are selected. Both cells are cylindrical 18650 cells with a positive nickel–manganese–cobalt electrode, produced by the same manufacturer and brought to market in a similar time. To have the chemistry as similar as possible, Open-Circuit-Voltage (OCV) data provided by [16] were used for pre-selection. In this OCV data, no big differences were visible, and the OCV curves over the normalized capacity seemed very congruent. For the final decision, cells were ordered and a Differential Voltage Analysis (DVA) was conducted. The dV/dQ via Q plot in Figure 1a showed that both cells do not contain silicon in the negative electrode, which can be recognized in the steep slope between 0 and 0.05 C N , as the silicon would be discharged in this area (at high half-cell potentials/lower full cell potential/lower State-of-charge) [17,18]. Furthermore, both cells do not show nickel-rich positive-electrode characteristics, as this would be visible in a step-like appearance at higher state-of-charge areas. Adding silicon in the negative electrode as well as increasing the nickel part in the positive electrode are both measures to increase energy density in modern cells, but are expected to even more influence aging behavior [19,20].
Figure 1a also indicates the differences between the cell types: The central graphite peak of the HE cell in blue is at a relative capacity of ca. 53%, and the one of the HP cell in cyan at ca. 62%. This point indices a phase transition within the graphite electrode, when it is lithiated ca. 50% and points out that the negative electrode of the HE cell is more utilized than with the HP cell [14,17]. The internal resistance in Figure 1b confirms the differences between both cell types. The HE cell in blue shows about two times as much resistance as the HP cell in cyan, whereas the HP cell (1.5 Ah) only shows a bit more than the half capacity of the HE cell (2.5 Ah). All these measurements were conducted at a temperature of 25 C and the resistance was calculated in the relaxation phase 10 s after a 1 A current pulse.
For measuring the aging behavior of the cells, HPC is used. To enable this kind of measurement, battery testers with high accuracy and high precision are required. A low measuring error is required to differentiate the occurring aging effects from a drift of the measurement device. In total, six battery testers of the company Battery Dynamics are used. The testers provide a relative measuring precision of 0.0035% related to the full scale range at a sampling rate of 10 ms [21]. The testers have a voltage measurement range of 5 V and current ranges between ±20 mA for the calendar tests and ±10 A for the cyclic tests. Each tester provides between 8 and 16 individual channels.
To ensure stable temperatures during the measurements, all experiments are carried out in Peltier-based climate chambers of the company Memmert. During the tests, the environment temperature was regulated and kept constant by the climate chamber. Within the cycling tests, the cell temperature increased slightly and decreased back to the climate chamber during the breaks in between.

2.2. Methods: Experiment Design

To obtain comprehensive knowledge about the aging processes, a cyclic and calendar aging study was performed. Both studies are presented in the following.

2.2.1. Cyclic Aging: Lithium Plating

Differences in the occurring aging behavior are expected, especially with respect to lithium plating. For this reason, a cyclic study is carried out.
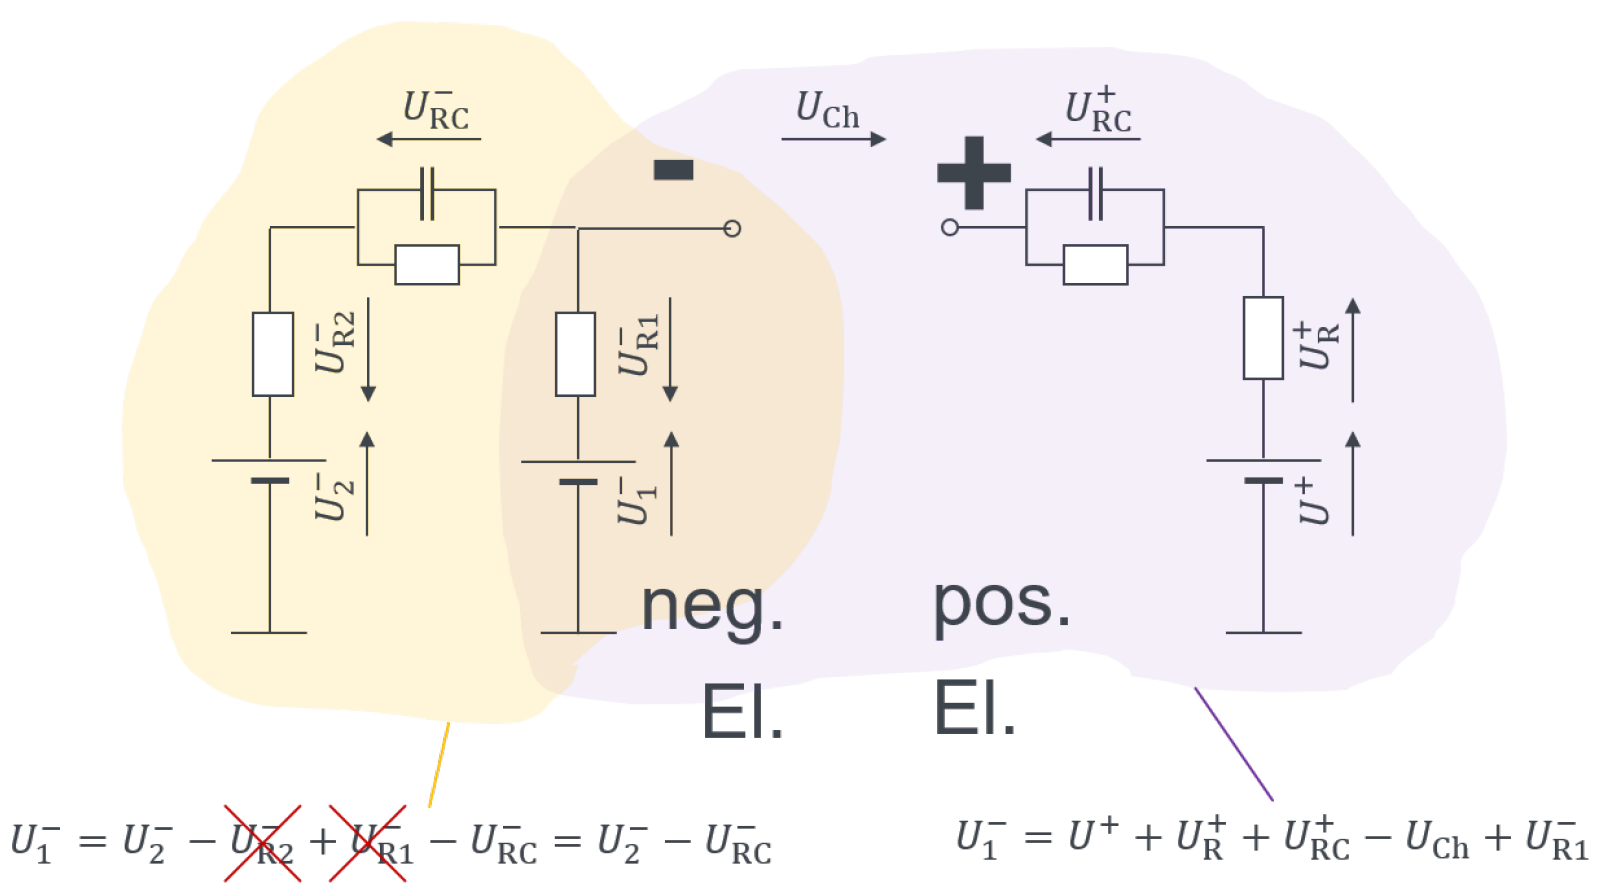
It is assumed that the different plating is caused by the different diffusion resistances of the cells. To derive how diffusion resistance can affect lithium plating via different cyclization parameters, an equivalent circuit model was set up (Figure 2). Each electrode consists of a voltage source, representing the half-cell potential, an ohmic resistance, and a RC circuit representing the diffusion behavior of the lithium ions within the electrode material. Since lithium plating is expected to happen on the surface of the negative electrode, the negative electrode is represented by two voltage sources, separated by the diffusion resistance. If the cell is being charged, the lithium ions are moving to the negative electrode and can either intercalate in the first layer of the electrode, or, they can overcome the diffusion resistance, move to the rear layers of the electrode and intercalate there. Following this model, lithium plating will occur, if the potential U A 1 of the surface layer falls below 0 V vs. L i / L i + .
Considering this, four parameters can be identified to influence lithium plating. The first one is the charging voltage, corresponding with the State of Charge (SoC) of the battery. If the battery shows a high SoC, the degree of lithiation of the negative electrode is high and so the negative half-cell potential is closest to 0 V vs. L i / L i + . The second parameter is the diffusion resistance of the lithium ions within the negative electrode. If the resistance is high, the voltage drop at R A , Diff will be higher, leading to an increasing voltage gradient within the electrode and so increasing the chance to decrease the local negative electrode voltage below 0 V vs. L i / L i + . This parameter—the diffusion resistance—is meant to be different for HE and HP cells. Parameter three is the charging current. A high charging current, the same as a high diffusion resistance, also leads to a higher voltage drop within the electrode. The fourth influencing parameter is cell temperature. As it is widely known, low temperature, which slows down diffusion processes, amplifies lithium plating [22,23]. This behavior seems a little counterintuitive, as all other aging mechanisms increase with higher temperatures. The effect becomes oblivious by knowing that the diffusion resistance of ions in the electrolyte increases with the increasing viscosity of the electrolyte. Viscosity increases at lower temperatures, leading to a higher voltage drop at the increased diffusion resistance and so ends in more lithium plating.
Based on this model, the influence of these four parameters on lithium plating is examined. The previously presented cell pair consisting of a HE and an HP cell is cycled to different charging voltages, with different charge currents at different temperatures.
In a previously internally performed parameter study, according to Design-of-Experiment (DoE) guidelines, the influence of these parameters was confirmed. Furthermore, this study was used to identify the set of parameters, when lithium plating first occurs, to define the parameter space in the main experiment. This happens at a load of 2 A at 10 °C and charging to 4.2 V at the HE cell. Since it is assumed that the HP cell can withstand significantly more load, the current is increased for this cell type.
In this study, both cell types are cycled with different parameters to avoid and also stimulate lithium plating.The HE cell is charged with 1 A, 1.5 A, 2 A, and 2.5 A at 0 °C, 5 °C, 10 °C, and 15 °C. The HP cell is charged with 6 A, 7 A, 8 A, and 10 A at 0 °C and 10 °C. Both cells are charged to 3.8 V, 3.9 V, 4.0 V, and 4.1 V. The charge end voltage is increased every 72 h by about 0.1 V. All cells are discharged with 2.5 A to 3.3 V with a constant-current/constant-voltage process. As the scope of the study is to compare the aging of both cell types, the cells are not cycled until end-of-life criteria. Instead, cells are cycled for a specific period of 72 h for each charge end voltage, when the onset of lithium plating is expected under the examined conditions. To identify the occurring aging mechanisms, the slippage of the (dis-)charge endpoints is evaluated.

2.2.2. Calendar Aging

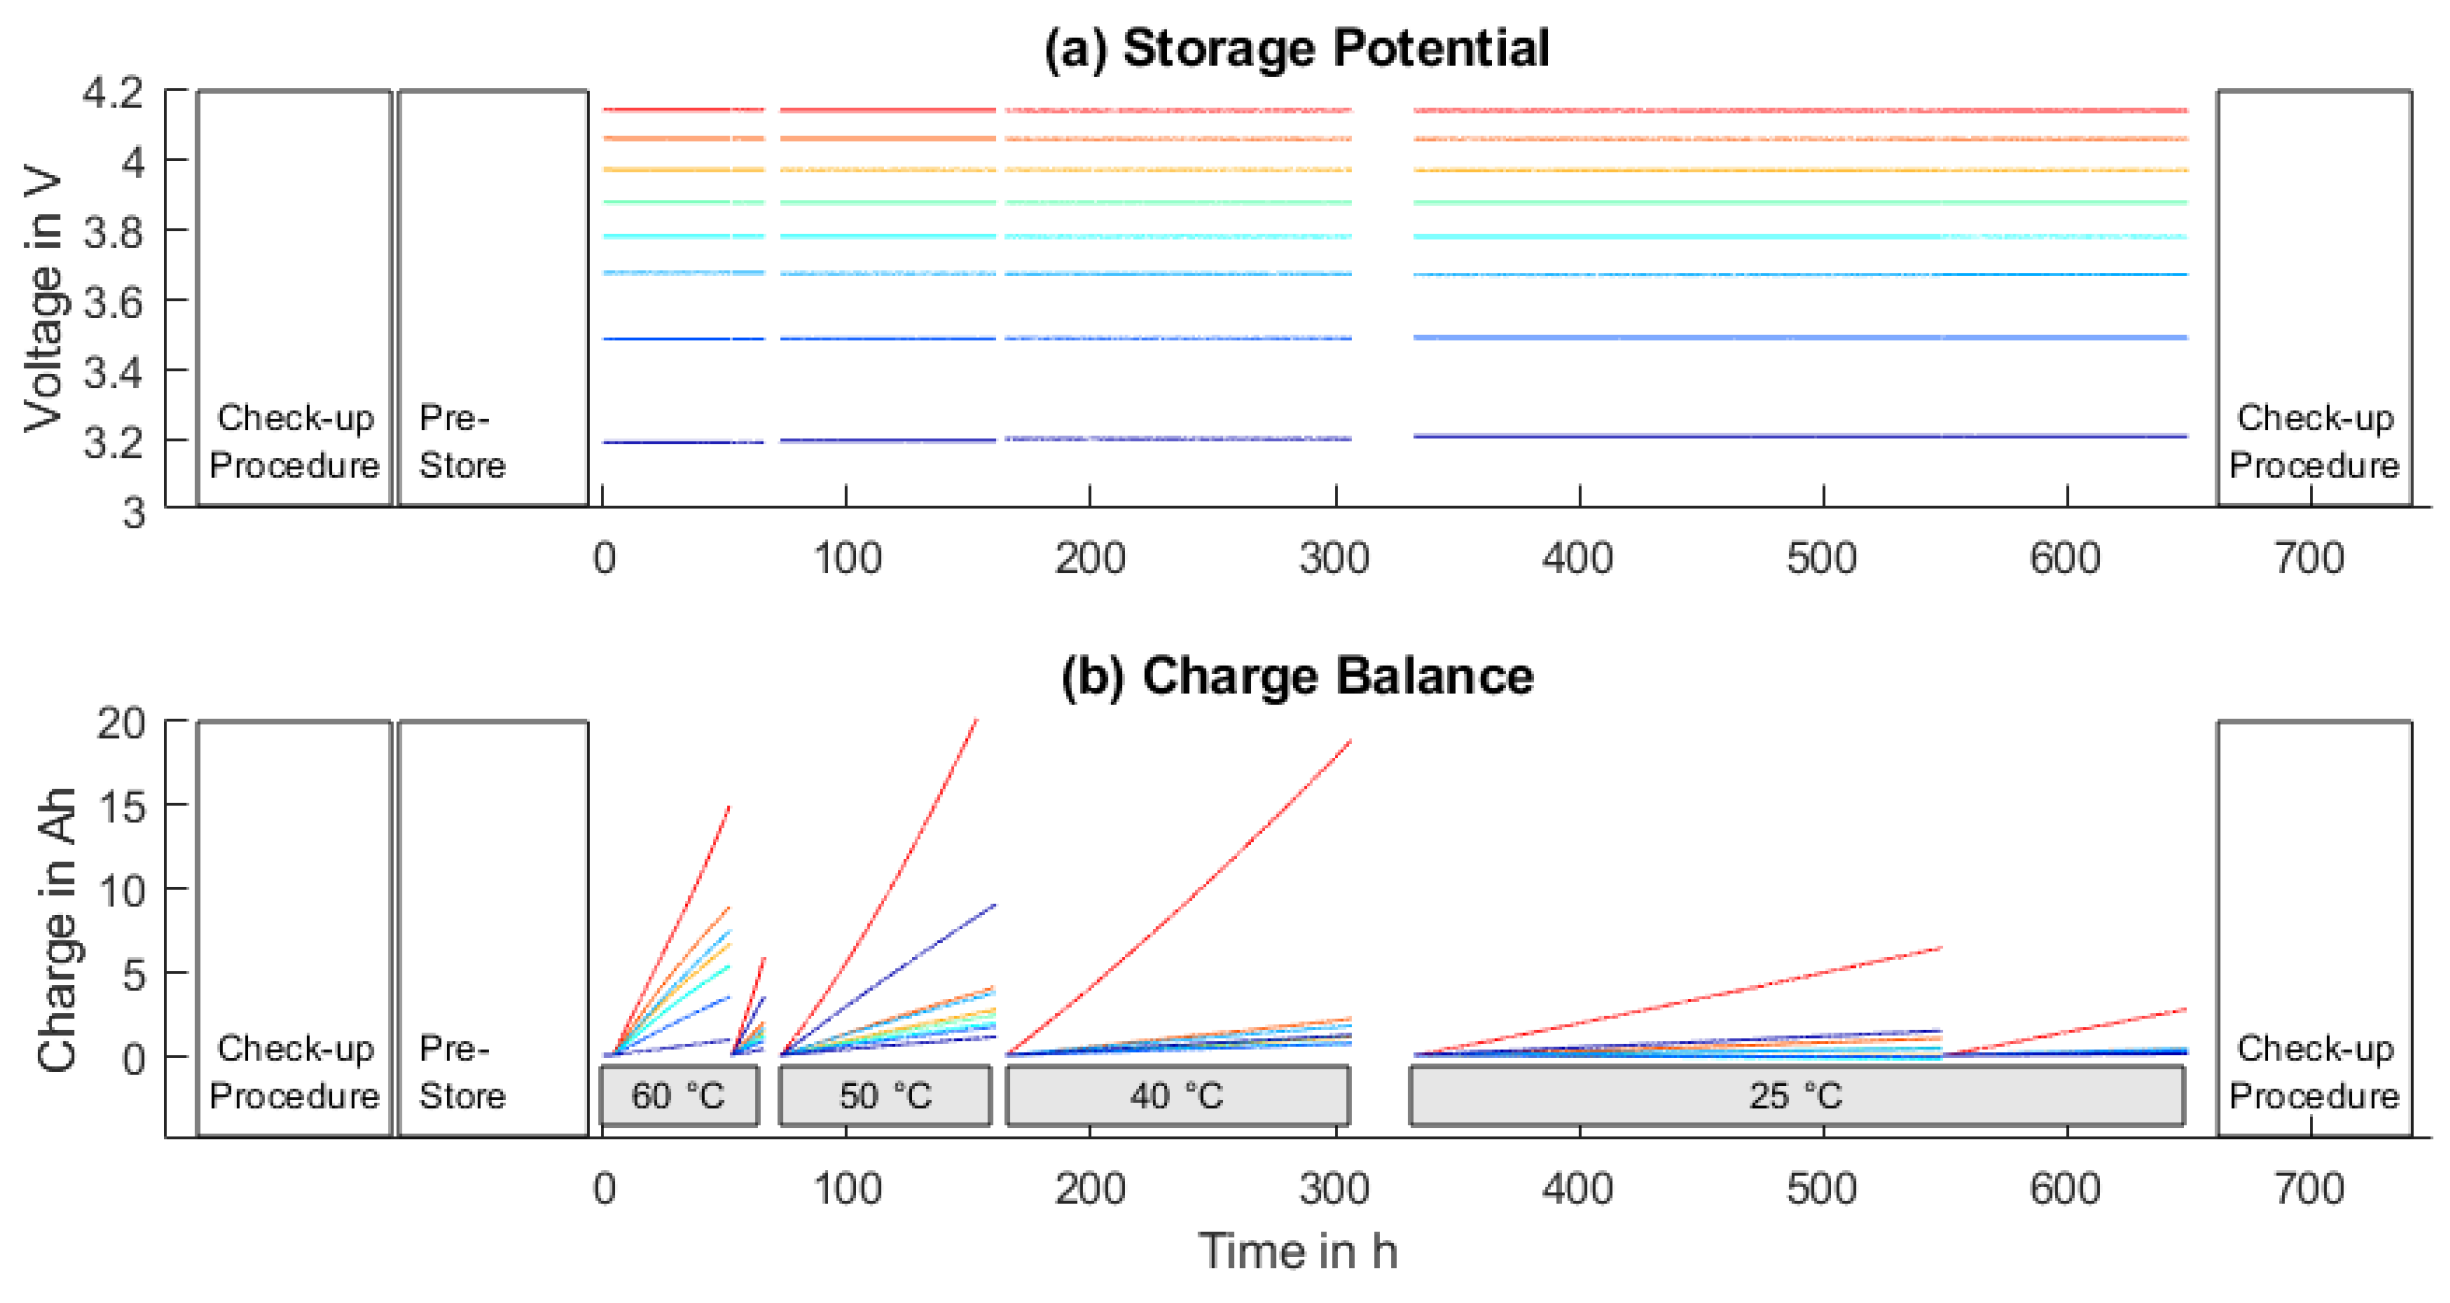
A potential-hold study is carried out to identify, measure, and compare the calendar aging processes. The intention of the study is to compare the occurring calendar aging of both cell types and to distinguish between different aging mechanisms. The procedure is shown in Figure 3. Doing this, the occurring aging effects are measured at fixed cell potentials. The cell potential is held constant, as seen in Figure 3a through small charging currents. In combination with measurements at different temperatures, this re-charged capacity shown in Figure 3b can be used to determine the temperature dependency of calendar aging. The total occurring electrode-individual capacity loss is identified through the slippage of the charge endpoints between the pre-check-up and the post-check-up. As it is assumed that more aging will happen at higher temperatures and so linear effects can be determined sooner, the measuring time per temperature increases with decreasing temperatures, as visible in Figure 3. For each cell type, eight storage potentials are examined, 3.0 V, 3.5 V, 3.7 V, 3.8 V, 3.9 V, 4.0 V, 4.1 V, and 4.2 V. These storage potentials are distributed over the whole operating area of the cells and show a finer resolution at higher potentials, where more calendar aging is expected. To minimize the effect of anode overhang areas [24] during the aging phase, the cells are pre-stored for 168 h at 55 °C for electrode equilibration. This happens after the pre-check-up procedure and the first potential-hold phase and is also shown within Figure 3. During this equilibration time, cell voltages slightly change from the values mentioned here. A more detailed description of this study design is given by Streck et al. [25]. Summarized, the electrode-individual aging can be investigated in relation to constant cell potential and in dependency of the temperature.

3. Results and Discussion

This section presents the results of the aging studies. In the first part, a comparison of the cycling aging behavior of both cell types is given, and the second part compares calendar aging.

3.1. Cyclic Aging: Lithium Plating

Figure 4 shows the slippage of the charge endpoints (Figure 4a) and the discharge endpoints of the HE cell (Figure 4b) and the HP cell (Figure 4c) over test time. As the discharge endpoint for both cells is initially set to zero, the different energy content of the cells is visible in the charge endpoint diagram Figure 4a. Through the increase of the charging voltage every 72 h, the charge endpoint rises, which leads to the step-like shape in Figure 4a.
Comparing the Figure 4a–c shows that the charge endpoints remain constant for each charging voltage, whereas the discharge endpoints are moving towards higher values. This is a sign of the occurring lithium plating, as it only affects the negative electrode and confirms the lithium plating evoking test parameters.
Comparing Figure 4b,c gives the first impression of the different aging processes of the cell types. Even if the HP cells are cycled with up to quadruple charging currents, they show less shifting of the discharge endpoints and thus less lithium plating.
A closer look at the endpoint shifts in Figure 4b,c also confirms the influencing factors: higher currents, visualized by symbols of increasing order, show a higher shift of the discharge endpoints. Lower temperatures also show a higher shift of the discharge endpoints and thus more lithium plating. These trends are discussed in more detail below.
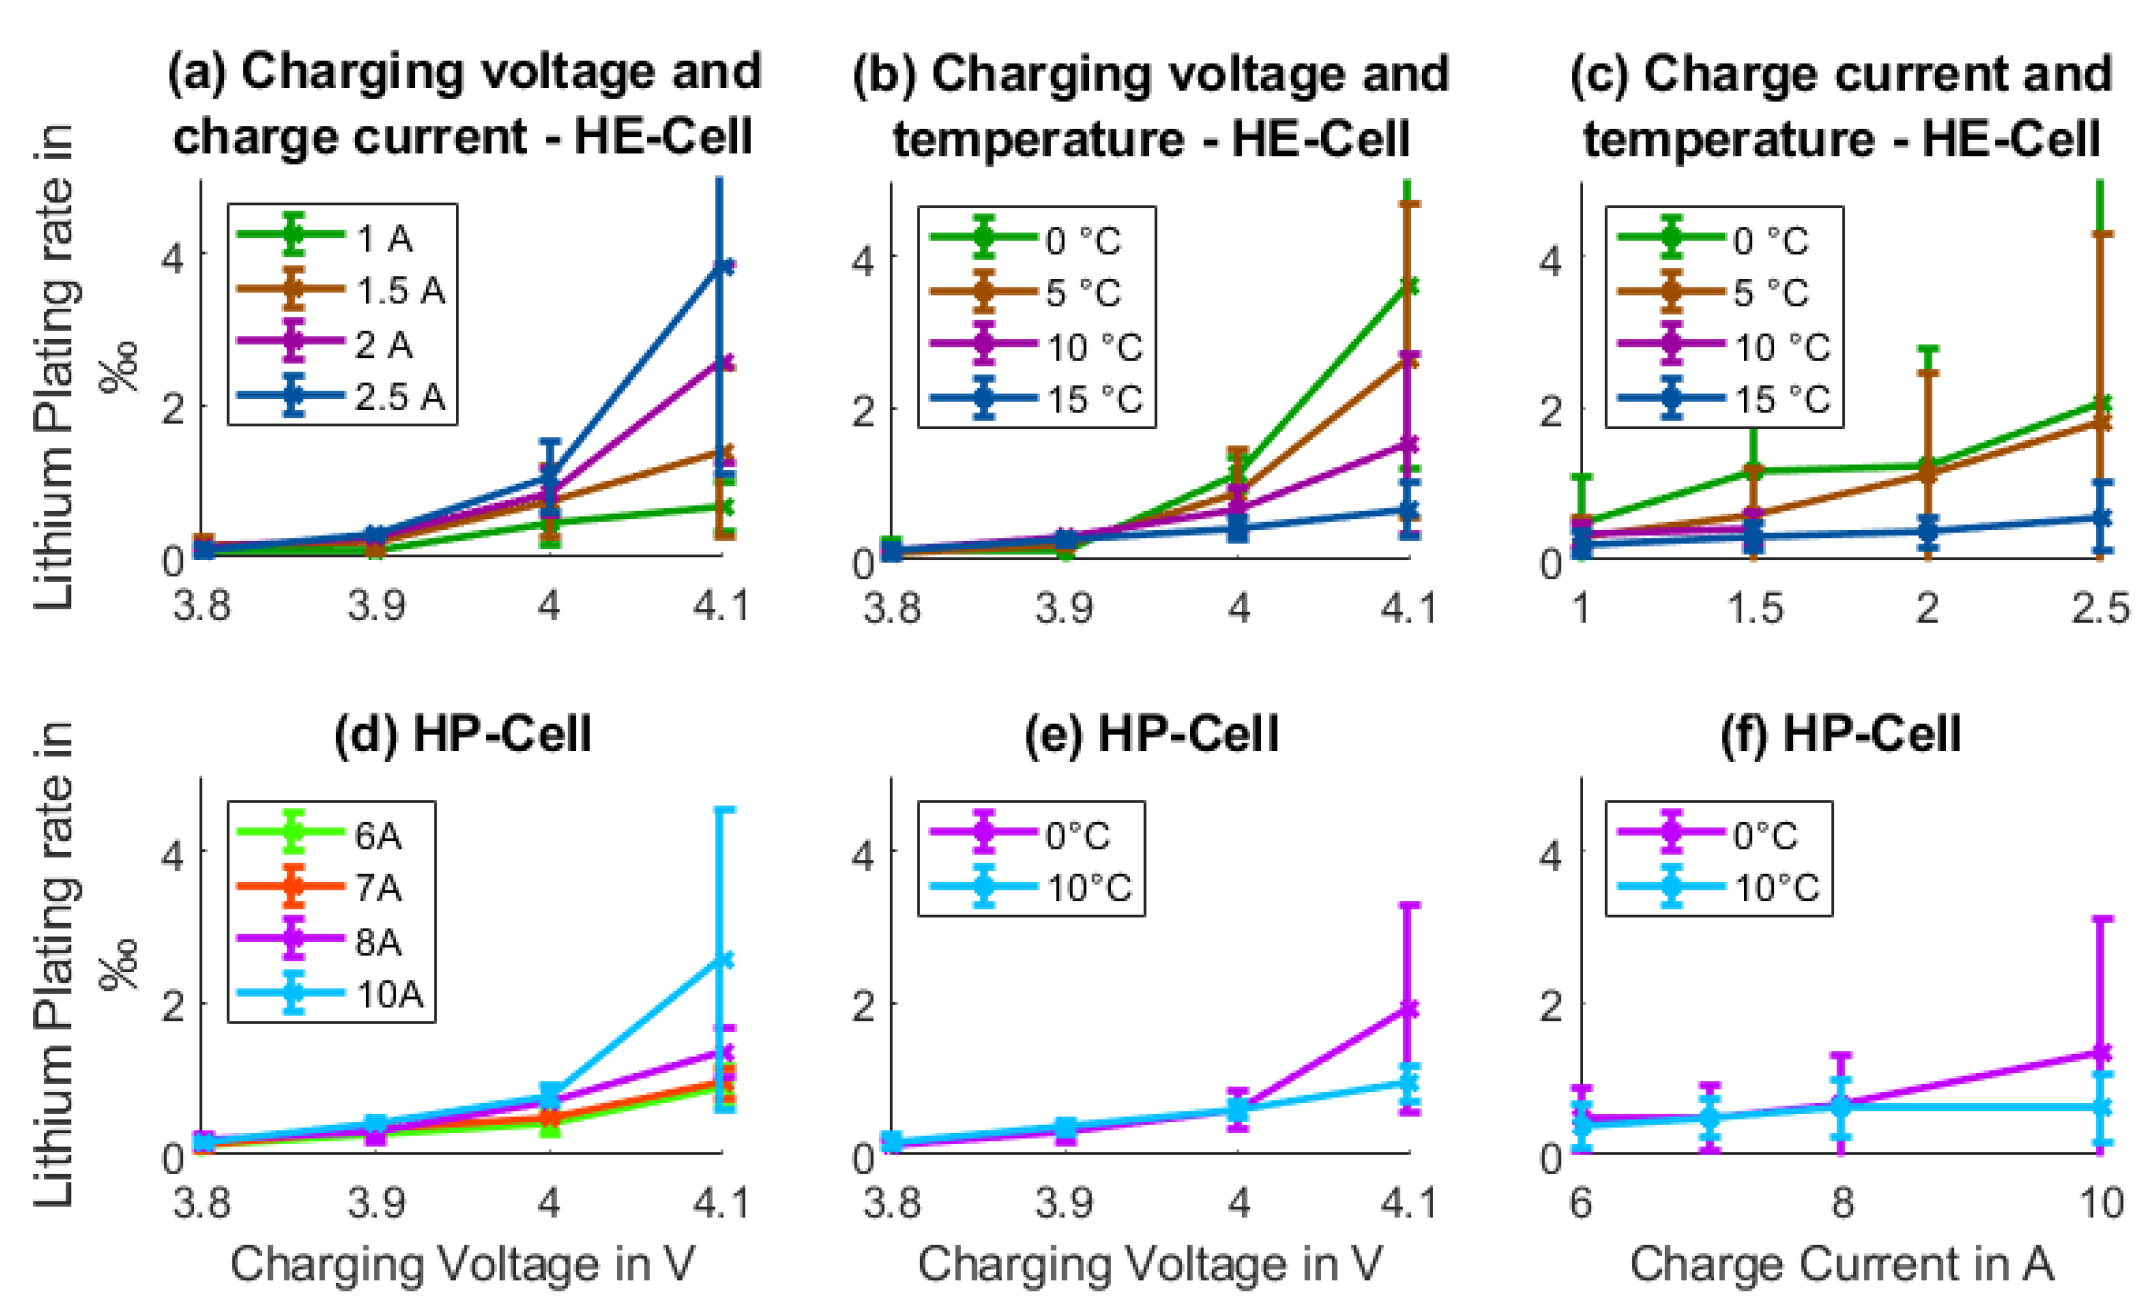
To analyze the influence of the different examined parameters, the effects are plotted in Figure 5. Therefore, the slippage of the discharge endpoints over a period with constant charging voltage is evaluated. For the sake of simplicity, linear aging processes are assumed. As the red line in Figure 4b indicates, this is a valid assumption. The effects are evaluated after the same charge throughput for all cells (After recharge of 35 Ah). As cells with a higher charging current reach the same charge throughput sooner than those with a lower charging current, the evaluation time differs for the different cells. The non-constant evaluation time for all cells is visualized by the opened red brackets in Figure 4. For example, the HP cell charged with 10 A reaches the target charge-throughput much earlier than the HE cell charged with 1 A. The resulting endpoint slippage is nominated to the charge throughput, resulting in a lithium plating rate in C Lithium - Plated / C Charge - throughput = 1 mAh/Ah = 1. The Figure 5a–f each show the interaction of two of the three examined parameters on the occurring lithium plating. The change of the respective third parameter is always averaged for higher statistical accuracy.
Figure 5 conforms with the previously presented lithium plating model. As it is visible in Figure 5a,b,d,e, plating mainly occurs at high charging voltages. This fits the model, as the negative electrode potential is closest to 0 V vs. L i / L i + at high cell voltages ≥4.0 V. In this region, it requires just a small voltage drop at the diffusion resistance to activate lithium plating reactions. Without considering the charging voltage, the other parameters current and temperature do not show much influence, which can be seen in Figure 5c,f. This also means that in lower SoC regions and so lower charge end voltages, the battery can be heavily loaded with high currents and low temperatures without risking a lot of lithium plating.
The difference of both cell types, which is identified as a second influence parameter, is also visible in the same subplots, see Figure 5a,b,d,e. Whereas the HE cell, with the assumed higher diffusion resistance already shows signs of lithium plating at relatively low currents and not so low temperatures, the HP cell can resist higher loads (e.g., higher current, lower temperature, higher charging voltage) showing a lower lithium plating rate. For example, the HE cell in Figure 5a shows twice as much lithium plating at a current of 2.5 A than the HP cell in Figure 5d, even if it is charged with the quadruple current. These differences in the lithium plating rate can be explained by the higher voltage drop, caused by a higher diffusion resistance within the electrode, forcing the potential of the front layers below 0 V vs. L i / L i + and so causing more plating.
The higher charging currents and lower temperatures seem only to affect the lithium plating in interaction with the higher charging voltage. This can be seen in Figure 5a,b,d,e in comparison to Figure 5c,f. Whereas in Figure 5a,b,d,e higher currents and lower temperatures lead to more plating at higher charging voltages, a combination of low temperature and high current does not show too much of an effect on lithium plating, if the influence of the charging voltage is not observed, which is shown in Figure 5c,f. Both parameters—current and temperature—act in a similar way. If the respective parameter is increased, the voltage drop at the diffusion resistance increases. In the case of charging current, the voltage drop increases directly, in the case of the temperature, the voltage drop increases indirectly, over the diffusion resistance. The resistance increases with the increasing viscosity at lower temperatures [26]. If the charging voltage remains low, lithium plating is too affected by this effect, because the voltage gap to reach 0 V vs. L i / L i + is too high to be overcome by high currents and low temperature. This also means that in lower SoC regions, cells can be charged fast, without limitations on the allowed charging current concerning lithium plating.
Finally, the relatively large error bars in the diagrams should be mentioned: In Figure 5, the error becomes bigger with an increased effect at higher charging voltages. This indicates that lithium plating depends not only on the double interaction, but actually on the triple interaction of charging voltage, current, and temperature.
Summarized, cyclic aging, in this case, lithium plating is affected by the underlying cell design and can be explained by a simplified equivalent circuit model.

3.2. Calendar Aging

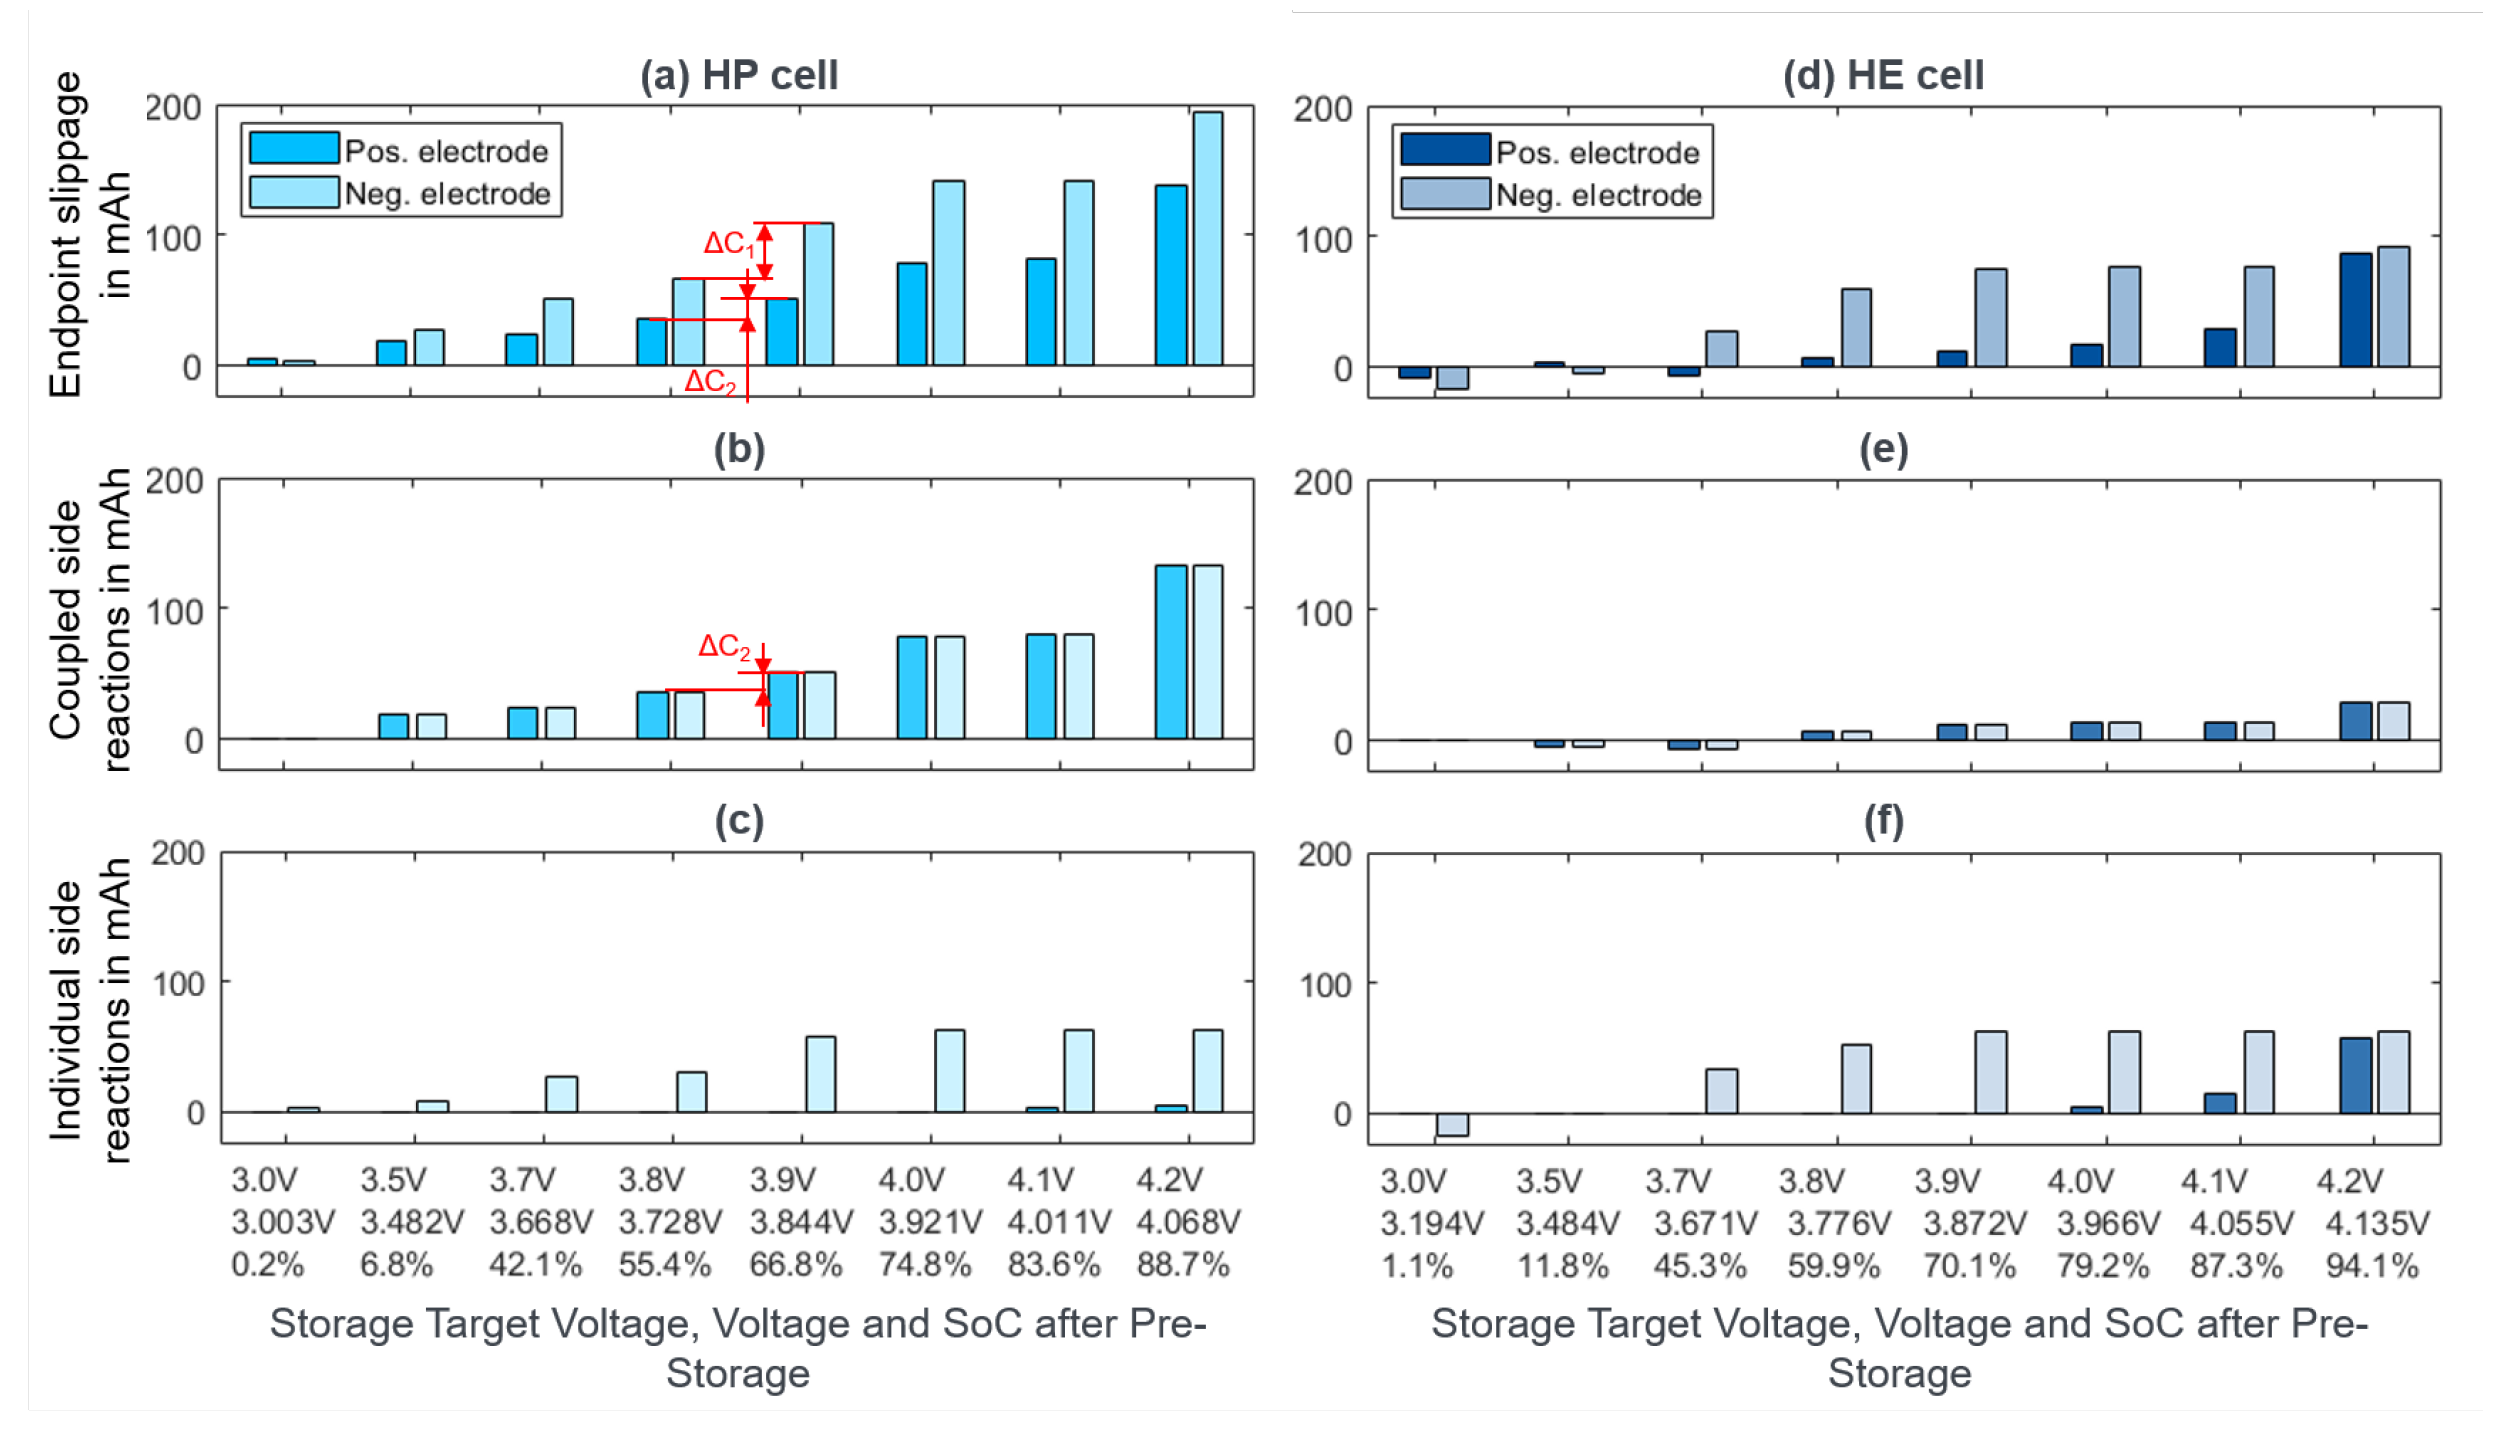
The calendar aging is examined with the previously described potential-hold study. The main results are shown in Figure 6a,d. The bars show the overall slippage of the charge and the discharge end points between the post-check-up procedure and the pre-check-up procedure (see Figure 3). The values represent the electrode-individual aging at the negative electrode and the aging at the positive electrode. As can be seen in the bar lengths in Figure 6a,d, the HP cell shows higher aging at both electrodes than the HE cell. This is in good agreement with the results of Mei et al. [7], which identify faster aging for cells with bigger electrode surfaces.
The corresponding capacity loss, which results from the difference between the slippage of the discharge endpoint and the slippage of the charge endpoint, on the other hand, is similar for both cells. This demonstrates that solely evaluating the capacity fade does not provide the full information about the aging reactions taking place inside the cells. The higher overall aging reactions can lead to an earlier cell failure of the HP cell in comparison to the HE cell. Detecting the overall amount of reversible and irreversible aging reactions can be seen as an advantage of the used HPC. Standard measuring techniques can only determine the irreversible capacity loss.
In general, the measured aging differs between both electrodes at each cell and the aging is continuously increasing with increasing storage potential. The darker bars in Figure 6d, representing the aging at the positive electrode, can be seen as in some way exponential with cell potential. The brighter bars in Figure 6a,d, representing the aging at the negative electrode, somehow show a step-like characteristic. These observed effects correspond with recent research results [27,28] and are the basis for further evaluations to split up the measured aging.
The literature usually discerns between three types of aging processes: aging reactions at the negative electrode, corresponding with the build-up of the SEI layer at the negative electrode; aging reactions at the positive electrode; and coupled side reactions linked to transition metal dissolution at the positive electrode and its diffusion to and reaction at the negative electrode, which cause a slippage of the charge and discharge endpoint. Against this background, the measured electrode-individual capacity-aging in Figure 6a,d is split into coupled aging mechanisms in Figure 6b,e, and two electrode-individual agings mechanisms in Figure 6c,f.
The first step in this splitting process is to separate the coupled aging reactions. The rule applied here is that the corresponding amount of charge increases continuously with increasing potential. Additionally, the charge amount is equal for both electrodes. So, the amount of the coupled aging reactions increases for each voltage the minimum increase of total aging from the predecessor voltage to the actual voltage. This is marked in Figure 6a: The aging at the positive electrode rises by the capacity Δ C 2 , which is smaller than the rise at the negative electrode Δ C 1 . The coupled aging reaction increases so by the charge amount Δ C 2 and is shown in Figure 6b.
To compute the electrode-individual aging reactions, the coupled aging reaction is subtracted from the total aging, visible in Figure 6c. The described process is also applied to the HE cell in Figure 6d–f. One further rule is applied for the HE cell: The aging reaction at the negative electrode must not decrease with increasing storage potential, to conform with the results of Keil et al. [15].
The resulting coupled and electrode-individual calendar aging mechanisms in Figure 6b,c,e,f show plausible trends and also allow a deeper comparison of the aging of both cell types: The coupled side reaction increases continuously with an increasing storage voltage. This fits the results of Pieczonka et al., as diffusion metal dissolution occurs increasingly at a higher (half) cell potential [29], which promotes electrolyte oxidation at the positive electrode and electrolyte reduction at the negative electrode and so a loss of active lithium. The step-like trend of the electrode-individual aging at the negative electrode matches the literature, as this fits the theory that SEI formation is dependent on the negative half-cell potential, which changes at the main graphite peak at about ~3.8 V [14] (see DVA in Figure 1). The increasing aging reactions at the positive electrode is also plausible.
Further to be mentioned is the negative shift of the endpoints in Figure 6. This, which comes with an increasing capacity, can be explained by cyclable lithium diffusing back from the overhang areas into the active part of the electrode and participating in the cycling process again. The phenomenon is expected to occur particularly in the HE cell due to their larger capacity in the overhang areas. When cyclable lithium is regained from the overhang areas, this often also leads to a shift of the charge endpoint because of an altered balance between the lithiation of the positive and negative electrode near the edges of the active electrode areas.
Coming back to the comparison of the aging of both cell types, it is very striking that differences mainly occur in the aging reaction identified as “coupled”. On the other hand, the individual aging reaction at the negative electrode shows similar values for both cells. This is partly surprising, as more aging at the HP cell seems feasible because of its higher electrode surface, but this would also be valid for the SEI formation at the negative electrode. The shown results and the evaluated separation of the different aging reactions could mean that coupled side reactions are more dependent on the electrode surface. In contrast, this could mean that SEI formation is more dependent on different parameters that are the same for both cell types. Further investigations are required on this point, e.g., the analysis of the active mass, the particle surface, etc.
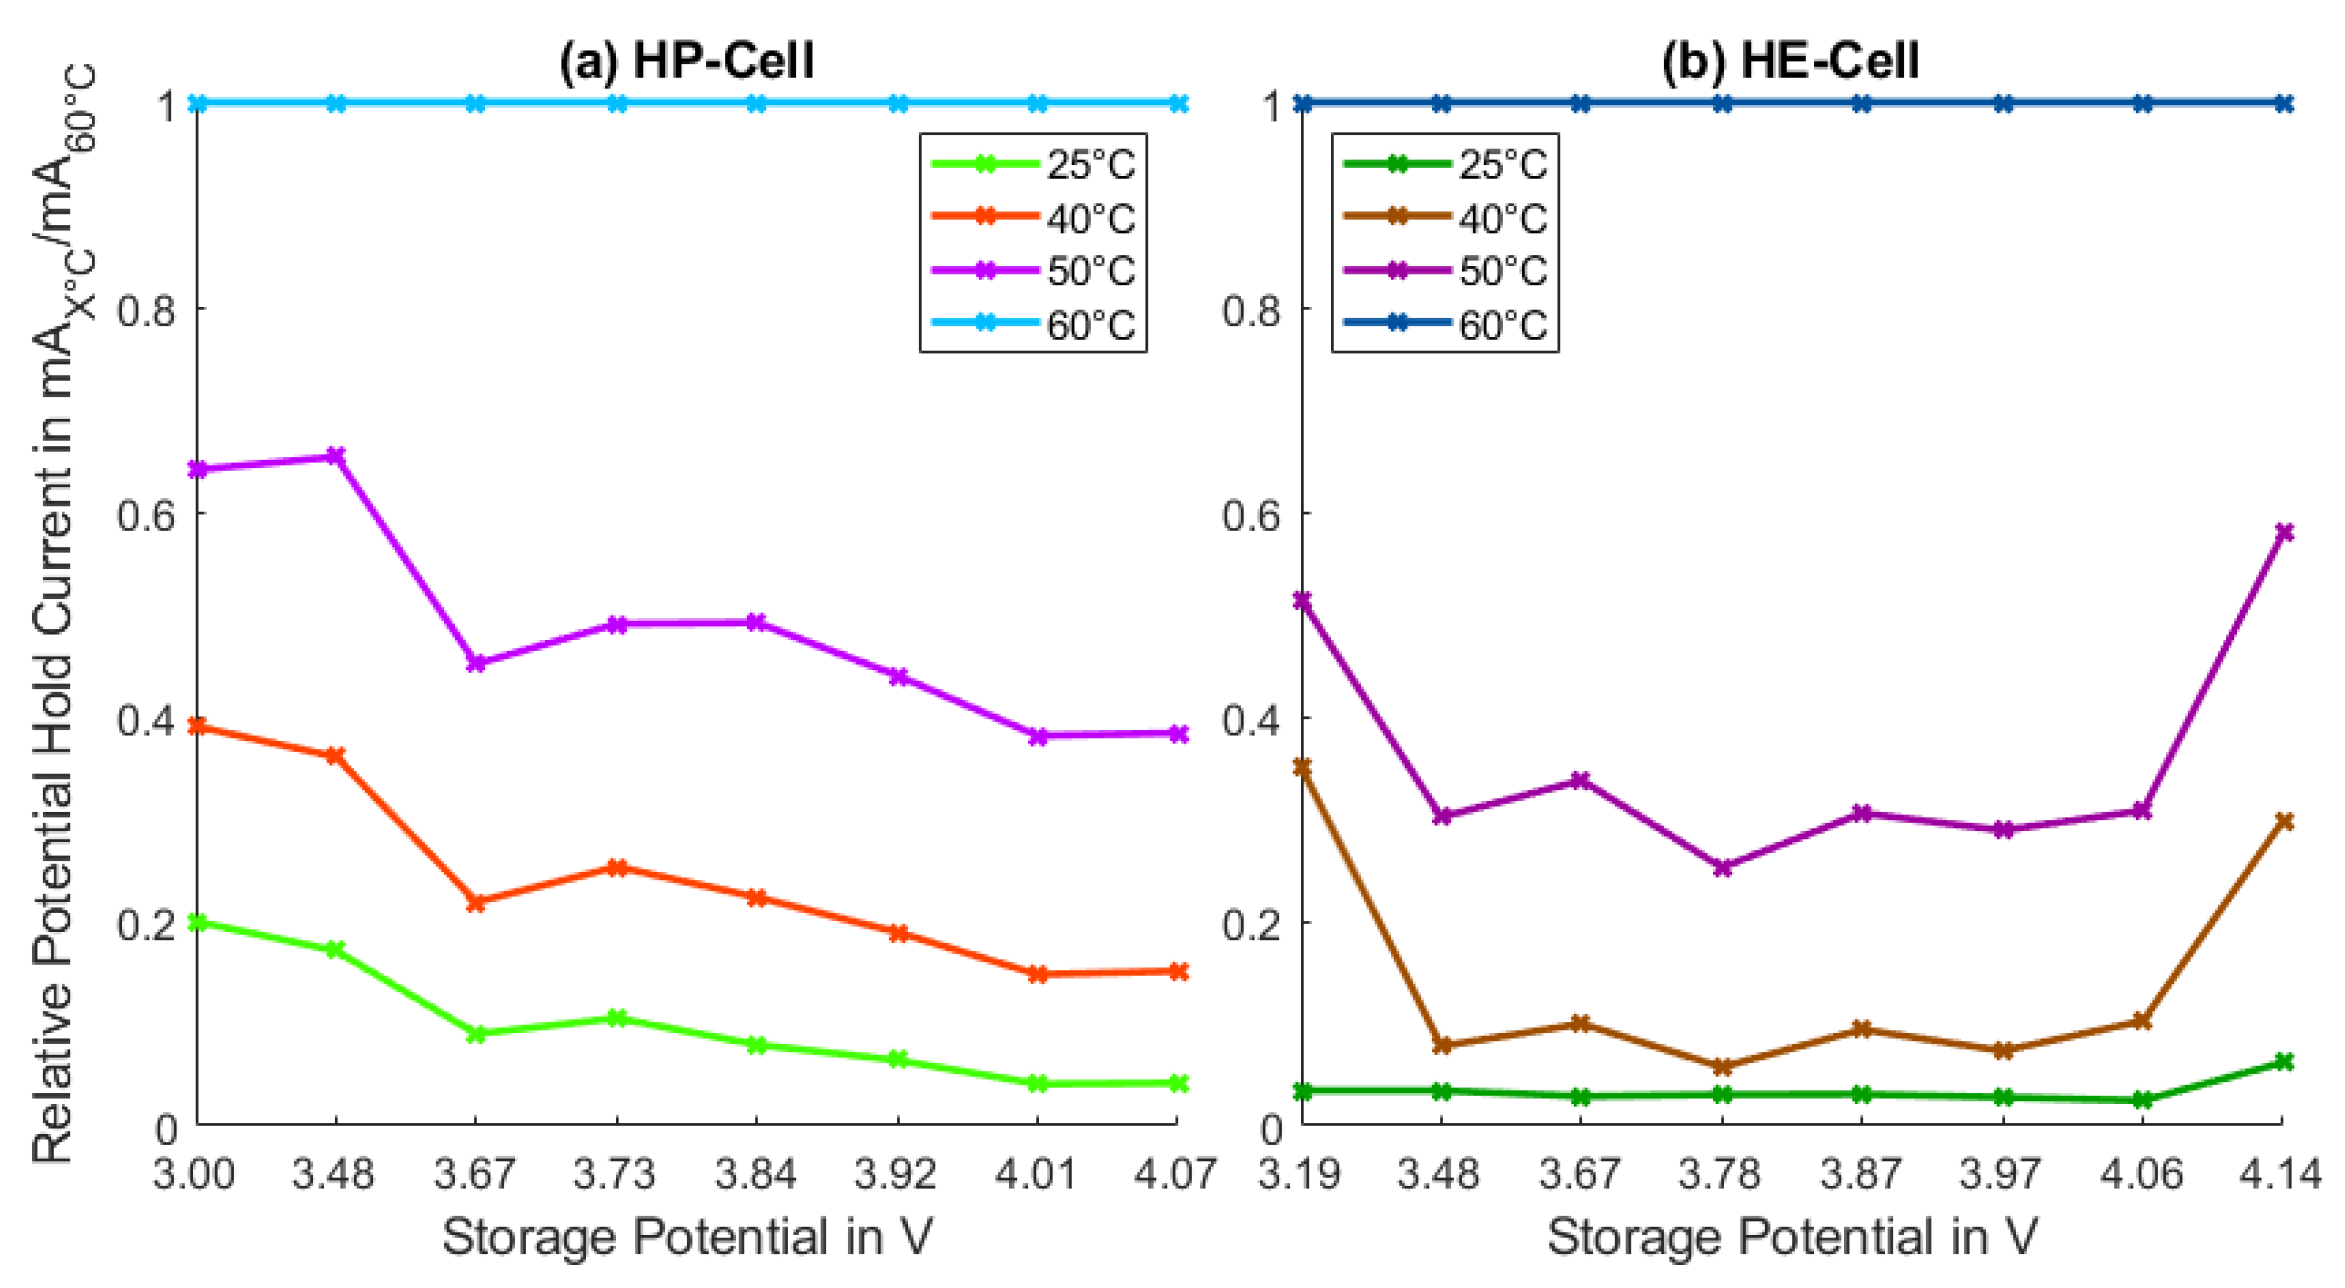
Next to the cell potential dependency, the dependency of the storage temperature is examined. Therefore, the recharged capacity of both cells during the potential-hold phases is examined for the different temperatures (see Figure 3b). This capacity indicates the amount of ongoing aging reactions. As expected, the capacity values are higher for higher temperatures, as well as for higher storage potentials. This is visible, e.g., in the steeper ramp of the red curve belonging to the 4.2 V cell in the 60 °C phases in comparison to the blue curve in the 25 °C phase, belonging to the 3.0 V cell. To evaluate the influence of temperature on aging, the mean recharging current is computed for each temperature and voltage and the current values are normed to the maximum current at 60 °C. This is shown in Figure 7a for the HP cell and b for the HE cell. The slopes of the red lines in Figure 3b, belonging to the recharging/aging current at 60 °C, is for both cells constant at the value “1” because all values are normed to this maximum recharging current. The diagram shows an explicit relation between aging and temperature, which can roughly be explained by Arrhenius law. Because of the nearly horizontal shape of the lines for different temperatures, the same Arrhenius equation can be assumed for all voltage values. Comparing both diagrams reveals that at the HP cell already at lower temperatures, more aging happens.
All in all, our aging experiments were able to disclose differences in aging characteristics between HE and HP cells.

3.3. Outlook: Parameterization of Battery Aging Model

The presented results of the cyclic and the calendar aging study can be used for the parameterization of a battery aging model. The electrode-individual aging results allow us to model at least four different aging reactions: lithium plating at the negative electrode for cyclic aging, two electrode-individual, and one coupled calendar aging reaction. These aging mechanisms can be described depending on their main affecting parameters: Current, temperature, and corresponding voltage. Using HPC provides deeper insights into the occurring aging reactions on the one hand, but on the other hand, it also reduces the required effort for aging parameterization substantially. Modeling the here-explored different aging behaviors of both cell types will allow the selection of the best-fitting cell type for each individual use case.

4. Conclusions

This work highlights how cell design affects aging behavior. Through the conducted studies, it could be shown that HE and HP lithium-ion batteries differ in the upcoming aging effects. This was made possible by the use of HPC, which allowed us to distinguish between several electrode-individual aging processes.
High-energy cells have been shown to be more affected by cyclic lithium plating. An explanation could be found in the higher diffusion resistance of HE cells, leading to a higher voltage gradient within the electrode and, thus, an earlier drop below the critical voltage of 0 V vs. L i / L i + . At the same time, the dependence of the lithium plating on the interaction of charging current, temperature and charging voltage could be shown. At low charging voltages, both cells can be charged fast without having to limit the charging current due to lithium plating.
HP cells are more affected by calendar aging mechanisms, which generally fits to their larger electrode surfaces. Through a split-up procedure, different calendar aging mechanisms were identified. In this case, HPC additionally made it possible to determine the total aging that takes place, not just the irreversible aging associated with absolute capacitance loss that could be measured using standard measurement techniques. As a result, it is shown that significant differences in calendar aging mainly occur in the coupled side reaction, whereas the SEI formation is on a similar level. At this point, more research is required to identify its cause.
The generated data provide deep insights into the aging process in a novel way. The knowledge gained can further help to select the appropriate cell type for individual use cases. In addition, the results are very suitable for semi-physical aging models and offer further deep dives into the different aging behavior on a simulative level. In summary, differences in occurring aging can be shown, which can be explained by their different mechanical designs.

Author Contributions

Conceptualization, S.M.P.J., A.F. and P.K.; methodology, S.M.P.J. and P.K.; investigation S.M.P.J.; writing—original draft preparation, S.M.P.J.; writing—review and editing, S.M.P.J., A.F. and P.K.; supervision, K.P.B., P.K. and A.F. All authors have read and agreed to the published version of the manuscript.

Funding

This research received no external funding.

Data Availability Statement

Not applicated.

Conflicts of Interest

The authors declare no conflict of interest.

Abbreviations

The following abbreviations are used in this manuscript:
DVADifferential Voltage Analysis
HE cellHigh-energy cell
HP cellHigh-power cell
LiLithium
OCVOpen Circuit Voltage
SEISolid Electrolyte Interphase
SoCState of Charge

References

  1. Lain, M.J.; Brandon, J.; Kendrick, E. Design Strategies for High Power vs. High Energy Lithium Ion Cells. Batteries 2019, 5, 64. [Google Scholar] [CrossRef]
  2. Zhou, X.; Huang, J.; Pan, Z.; Ouyang, M. Impedance characterization of lithium-ion batteries aging under high-temperature cycling: Importance of electrolyte-phase diffusion. J. Power Sources 2019, 426, 216–222. [Google Scholar] [CrossRef]
  3. Ecker, M. Lithium Plating in Lithium-Ion Batteries—An Experimental and Simulation Approach. Ph.D. Thesis, RWTH Aachen University, Aachen, Germany, 2016. [Google Scholar]
  4. Mei, W.; Jiang, L.; Liang, C.; Sun, J.; Wang, Q. Understanding of Li-plating on graphite electrode: Detection, quantification and mechanism revelation. Energy Storage Mater. 2021, 41, 209–221. [Google Scholar] [CrossRef]
  5. Linsenmann, F. Operando and In Situ Characterizations of Fundamental Electrochemical Processes in Lithium-and Sodium-Ion Batteries. Ph.D. Thesis, Technical University of Munich, Munich, Germany, 2021. [Google Scholar]
  6. Legrand, N.; Knosp, B.; Desprez, P.; Lapicque, F.; Raël, S. Physical characterization of the charging process of a Li-ion battery and prediction of Li plating by electrochemical modelling. J. Power Sources 2014, 245, 208–216. [Google Scholar] [CrossRef]
  7. Li, S.R.; Chen, C.H.; Camardese, J.; Dahn, J.R. High Precision Coulometry Study of LiNi0.5 Mn1.5 O4/Li Coin Cells. J. Electrochem. Soc. 2013, 160, A1517–A1523. [Google Scholar] [CrossRef]
  8. Han, X.; Lu, L.; Zheng, Y.; Feng, X.; Li, Z.; Li, J.; Ouyang, M. A review on the key issues of the lithium ion battery degradation among the whole life cycle. eTransportation 2019, 1, 100005. [Google Scholar] [CrossRef]
  9. Bloom, I.; Cole, B.; Sohn, J.; Jones, S.; Polzin, E.; Battaglia, V.; Henriksen, G.; Motloch, C.; Richardson, R.; Unkelhaeuser, T.; et al. An accelerated calendar and cycle life study of Li-ion cells. J. Power Sources 2001, 101, 238–247. [Google Scholar] [CrossRef]
  10. Smith, A.J.; Burns, J.C.; Xiong, D.; Dahn, J.R. Interpreting High Precision Coulometry Results on Li-ion Cells. J. Electrochem. Soc. 2011, 158, A1136–A1142. [Google Scholar] [CrossRef]
  11. Smith, A.J.; Burns, J.C.; Dahn, J.R. A High Precision Study of the Coulombic Efficiency of Li-Ion Batteries. Electrochem.-Solid-State Lett. 2010, 13, A177. [Google Scholar] [CrossRef]
  12. Fathi, R.; Burns, J.C.; Stevens, D.A.; Ye, H.; Hu, C.; Jain, G.; Scott, E.; Schmidt, C.; Dahn, J.R. Ultra High-Precision Studies of Degradation Mechanisms in Aged LiCoO2/Graphite Li-Ion Cells. J. Electrochem. Soc. 2014, 161, A1572–A1579. [Google Scholar] [CrossRef]
  13. Burns, J.C.; Stevens, D.A.; Dahn, J.R. In-Situ Detection of Lithium Plating Using High Precision Coulometry. J. Electrochem. Soc. 2015, 162, A959–A964. [Google Scholar] [CrossRef]
  14. Keil, P.; Jossen, A. Calendar Aging of NCA Lithium-Ion Batteries Investigated by Differential Voltage Analysis and Coulomb Tracking. J. Electrochem. Soc. 2017, 164, A6066–A6074. [Google Scholar] [CrossRef]
  15. Keil, P. Aging of Lithium-Ion Batteries in Electric Vehicles. Ph.D. Thesis, Technical University of Munich, Munich, Germany, 2017. [Google Scholar]
  16. Lygte. Battery Test-Review 18650 Comparator. 2022. Available online: https://lygte-info.dk/review/batteries2012/Common18650comparator.php (accessed on 11 April 2022).
  17. Asenbauer, J.; Eisenmann, T.; Kuenzel, M.; Kazzazi, A.; Chen, Z.; Bresser, D. The success story of graphite as a lithium-ion anode material—Fundamentals, remaining challenges, and recent developments including silicon (oxide) composites. Sustain. Energy Fuels 2020, 4, 5387–5416. [Google Scholar] [CrossRef]
  18. Zilberman, I.; Sturm, J.; Jossen, A. Reversible self-discharge and calendar aging of 18650 nickel-rich, silicon-graphite lithium-ion cells. J. Power Sources 2019, 425, 217–226. [Google Scholar] [CrossRef]
  19. Xie, Q.; Li, W.; Dolocan, A.; Manthiram, A. Insights into Boron-Based Polyanion-Tuned High-Nickel Cathodes for High-Energy-Density Lithium-Ion Batteries. Chem. Mater. 2019, 31, 8886–8897. [Google Scholar] [CrossRef]
  20. Zhao, Y.; Pohl, O.; Bhatt, A.I.; Collis, G.E.; Mahon, P.J.; Rüther, T.; Hollenkamp, A.F. A Review on Battery Market Trends, Second-Life Reuse, and Recycling. Sustain. Chem. 2021, 2, 167–205. [Google Scholar] [CrossRef]
  21. Battery Dynamics GmbH. High Resolution Battery Testers—HRT-Series M; Battery Dynamics GmbH: Munich, Germany, 2020. [Google Scholar]
  22. Petzl, M.; Danzer, M.A. Nondestructive detection, characterization, and quantification of lithium plating in commercial lithium-ion batteries. J. Power Sources 2014, 254, 80–87. [Google Scholar] [CrossRef]
  23. Petzl, M.; Kasper, M.; Danzer, M.A. Lithium plating in a commercial lithium-ion battery—A low-temperature aging study. J. Power Sources 2015, 275, 799–807. [Google Scholar] [CrossRef]
  24. Lewerenz, M.; Fuchs, G.; Becker, L.; Sauer, D.U. Irreversible calendar aging and quantification of the reversible capacity loss caused by anode overhang. J. Energy Storage 2018, 18, 149–159. [Google Scholar] [CrossRef]
  25. Streck, L.; Roth, T.; Keil, P.; Strehle, B.; Ludmann, S.; Jossen, A. A Comparison of Voltage Hold and Voltage Decay Methods for Side Reactions Characterization. J. Electrochem. Soc. 2023. submitted. [Google Scholar] [CrossRef]
  26. Korth, W.; Jess, A.; Kern, C. Bestimmung der elektrischen Leitfähigkeit und der Viskosität von ionischen Flüssigkeiten. Chem. Ing. Tech. 2005, 77, 985–986. [Google Scholar] [CrossRef]
  27. Wilhelm, J.; Seidlmayer, S.; Keil, P.; Schuster, J.; Kriele, A.; Gilles, R.; Jossen, A. Cycling capacity recovery effect: A coulombic efficiency and post-mortem study. J. Power Sources 2017, 365, 327–338. [Google Scholar] [CrossRef]
  28. Keil, P.; Schuster, S.F.; Wilhelm, J.; Travi, J.; Hauser, A.; Karl, R.C.; Jossen, A. Calendar Aging of Lithium-Ion Batteries. J. Electrochem. Soc. 2016, 163, A1872–A1880. [Google Scholar] [CrossRef]
  29. Pieczonka, N.P.W.; Liu, Z.; Lu, P.; Olson, K.L.; Moote, J.; Powell, B.R.; Kim, J.H. Understanding Transition-Metal Dissolution Behavior in LiNi0.5Mn1.5O4 High-Voltage Spinel for Lithium Ion Batteries. J. Phys. Chem. C 2013, 117, 15947–15957. [Google Scholar] [CrossRef]
Figure 1. (a) OCV and DVA plot for both cell types, and (b) DC resistance of both cell types. The resistance R DC , 10 s was calculated in the relaxation phase after an applied current pulse (cyan: HP cell, blue: HE cell).
Batteries 09 00232 g001
Figure 2. Explanation for the different plating rates of both cell types with an equivalent circuit model. If the negative electrode is modeled by different voltage sources, separated by the diffusion resistance, it can be explained that the potential of the electrode becomes locally negative.
Batteries 09 00232 g002
Figure 3. Procedure of the potential-hold study. (a) Both cell types are stored after a check-up procedure at different temperatures at a constant cell potential. (b) Amount of charge recharged to maintain the constant voltage level. The length of the check-up and the pre-storage is non-scale.
Batteries 09 00232 g003
Figure 4. Slippage of charge and discharge endpoints over cycling time. The slippage of the discharge endpoints corresponds to the occurring lithium plating. The step-like shift of the charge endpoints is triggered by the rise of the charging voltage every 72 h. The red brackets show the periods for evaluation in which at least 35 Ah are recharged. The raw data presented here provide the basis for the further analysis.
Batteries 09 00232 g004
Figure 5. Effect of the examined parameters on lithium plating. The parameters examined are charge end voltage, charge current, and temperature. The figures show two-way interactions, and the third parameter is averaged. The occurring plating is normalized over the charge throughput resulting in . (ac): HE cell, (df): HP cell.
Batteries 09 00232 g005
Figure 6. Calendar capacity aging and split up of aging processes. Occurring calendar aging within the potential-hold study. (a,d) show the total aging, (b,e) the coupled aging, and (c,f) the electrode-individual aging. Horizontal axis shows potential after check-up/real storage potential after pre-storage/corresponding SoC.
Batteries 09 00232 g006
Figure 7. Relative potential-hold current for different temperatures. Current is normed to potential-hold current at 60 °C. The horizontal axis shows the real storage potential present after pre-storage.
Batteries 09 00232 g007
Table 1. Selected cell types for aging tests and their properties.
CellSpeciesCapacityInternal ResistanceMax. Discharge CurrentMax. Charge CurrentYear
LG INR 18650 M26HE2600 mAh<60 m Ω 10 A2.5 A2013
LG INR 18650 HB6HP1500 mAh<20 m Ω 30 A4 A2015
Disclaimer/Publisher’s Note: The statements, opinions and data contained in all publications are solely those of the individual author(s) and contributor(s) and not of MDPI and/or the editor(s). MDPI and/or the editor(s) disclaim responsibility for any injury to people or property resulting from any ideas, methods, instructions or products referred to in the content.