Article

Numerical Study on Cross-Linked Cold Plate Design for Thermal Management of High-Power Lithium-Ion Battery

School of Mechanical Engineering and Automation, Harbin Institute of Technology, Shenzhen 518055, China
*
Author to whom correspondence should be addressed.
Batteries 2023, 9(4), 220; https://doi.org/10.3390/batteries9040220
Submission received: 7 February 2023 / Revised: 21 March 2023 / Accepted: 29 March 2023 / Published: 5 April 2023
(This article belongs to the Special Issue Thermal Management System for Lithium-Ion Batteries)

Abstract

:
Liquid cooling strategies such as cold plates have been widely employed as an effective approach for battery thermal management systems (BTMS) due to their high cooling capacity and low power consumption. The structural design of the cold plates is the key factor that directly determines the thermal performance of the liquid cooling system. In this study, seven Z-type parallel channel cold plate and two novel cross-linked channel cold plate designs are proposed for the cooling of high-power lithium-ion batteries using two different cooling strategies. The average battery temperature, battery temperature uniformity and energy consumption of all designs are firstly analyzed holistically by three-dimensional conjugated simulation under the scheme of continuous cooling. Two selected designs that demonstrated superior performance (i.e., a Z-type parallel channel cold plate with 8-branches and an improved cross-linked channel design) are further analyzed to explore their integrative performance under different cooling schemes. The results show that within a battery temperature limit of 40 °C, employing the delayed cooling strategy can save 23% energy consumption compared to the continuous cooling strategy. Besides, the cold plate with an improved cross-linked channel configuration requires 13% less pumping power and provides a better temperature uniformity than the Z-type parallel channel cold plate with 8-branches. These results are of great significance to advance the cooling design of BTMS.

1. Introduction

The last decade has witnessed a fast-growing popularity of electric vehicles (EVs) owing to the increasing concern regarding fossil fuel consumption and tailpipe carbon emissions. Unlike traditional vehicles that run on gasoline, EVs are powered exclusively by rechargeable battery packs such as lead-acid, nickel-cadmium, nickel-metal-hydride, zinc-bromine, sodium sulfur, and lithium batteries. Among them, the lithium-ion battery has been the leading choice for EV manufacturers owing to its high energy density, minimum self-discharging behavior, robust performance, long service lifespan, and relatively small impact on vehicle weight [1,2,3]. Despite these merits, lithium-ion batteries must be operated at suitable temperature condition to avoid catastrophic failure [4]. Studies have shown that it is desirable to control the temperature of lithium-ion batteries within the range from 25 to 40 °C. Furthermore, the temperature nonuniformity between different cells should be controlled within less than 5 °C [5]. Working in either a low or high temperature environment will lead to poor battery performance, reduced lifespan, or even explosion [6]. Considering these issues, it is a critical task to develop effective battery thermal management systems (BTMS) to ensure that the EVs can run safely over a long period of time under different conditions.
Based on the cooling media, BTMSs can generally be divided into four different types including air cooling [7,8,9], liquid cooling [10,11,12,13], phase change material cooling [14,15,16,17], and heat pipe cooling [18,19,20,21]. Passive air cooling has a very low cooling capacity, which makes it unsuitable for cooling lithium-ion batteries at high charging or discharging rates. The active air-cooling method can provide a significantly higher heat transfer coefficient, but still suffers from a low cooling capacity resulting from the poor thermophysical property of air. Phase change material (PCM) allows for temporal storage and release of large amounts of heat during the process of melting and freezing. Heat pipes have a very high effective thermal conductivity (>100,000 W·m−1·K−1), which allows them to transfer thermal energy with a small temperature gradient. However, both PCM and heat pipes only allow temporary storage or transport of the thermal energy. Therefore, an active cooling device such as air or liquid cooling must be used in combination with PCM or heat pipe to further dissipate the thermal energy from the battery. Liquid cooling has become the most popular for BTMSs in EVs due to its remarkable cooling performance and high compactness [22,23]. So far, liquid-cooled battery systems have already been used in a number of commercial EVs including Tesla, VW, Hyundai, and BYD.
Cold plate is a widely used component in liquid-cooled battery systems for removing the heat generated during the charge–discharge process of battery packs. The cold plates can be installed either between the cells or on the lateral surfaces of the battery pack [24,25]. Many studies have investigated the pattern of fluid flow in cold plates, such as the straight, serpentine, and mini-channel structures. Zhu et al. [26] designed sixteen models using an orthogonal array to quantify and analyze the main and secondary factors of the cooling effect of a liquid-cooled BTMS. It was reported that channel number has the most important effect on the average temperature of batteries, while the channel number and inlet velocity are two major factors controlling the temperature uniformity. Huo et al. [27] also found that the maximum battery temperature increases with increasing channel number in a straight-shaped channel cold plate. Qian et al. [28] showed that the cooling efficiency of a straight channel cold plate can be improved by increasing the channel number. However, the improvement in the cooling performance becomes insignificant when the channel number exceeds five. Li et al. [29] investigated the performance of silicon cold plates based natural air cooling, forced air cooling, and liquid cooling with U-type tubes for BTMSs experimentally. Deng et al. [30] numerically studied the effect of the layout of channels, channel number, and inlet temperature on the performance of a serpentine-channel cooling plate. Kong et al. [31] proposed a divergent-shaped channel cold plate for BTMSs. They found that the divergent-shaped channels can provide enhanced cooling performance, which is characterized by a lower pressure drop and a smaller maximum temperature difference. Huang et al. [32] introduced the streamline concept to design and optimize the performance of an inner mini channel cooling plate. Mo et al. [33] designed a novel cooling plate using the topology optimization method and further analyzed the influences of the flow rate and inlet temperature on the performance of the optimized cooling plate. Kalkan et al. [34] performed experimental studies to explore the thermal performance of different water-cooled cold plates including conventional serpentine tube and novel mini channel designs for thermal management of lithium-ion batteries with a discharging rate from 1C to 5C. Amalesh and Narasimhan [35] proposed seven distinct mini-channel cold plates to analyze the effect of channel profile on the performance of the cold plate. It was found that mini-channels with zigzag and circular slot channels exhibit an exceptional performance.
In addition to the straight and serpentine channel configuration, the Z-type parallel channel cold plate has also been investigated by a significant number of studies. Compared with the traditional serpentine-channel cold plates, the flow path in the Z-type parallel channel cold plate is reduced, which decreases the overall pressure drop in the cooling system. Chen et al. [36] designed a novel cold plate consisting of mini parallel channels (PMCP) to enhance the uniformity of temperature distribution in large battery pack systems. As shown in their results, the proposed Z-type parallel channel design can significantly improve the temperature uniformity and reduce the power consumption of BTMSs. Gungor et al. [37] proposed an efficient liquid cooling system consisting of Z-type parallel channels between different cells in a battery pack by using the constructal canopy-to-canopy architectures. It was found in their study that the cold plate with five branch channels has the best cooling performance while the cold plates with more than seven branch channels require greater pumping power without significant thermal improvement. Sun et al. [38] designed a tapered inlet and outlet channel configuration to further enhance the thermal performance of their cold plate containing Z-shaped parallel minichannels. Guo et al. [39] studied the performance of serpentine channel cooling plates for BTMS. The results showed that the parallel-spiral serpentine channel cooling plate has the best performance. Shen et al. [40] used a tilted Z-shaped air-cooling system for BTMS. Compared to the vertical Z-shaped construction, the maximum battery temperature of the tilted Z-shaped channel was decreased from 38.15 to 34.14 °C. Faizan et al. [41] proposed a cold plate grooved with converging twisted serpentine mini-channels for BTMSs. Guo et al. [42] studied the performance of BTMS with a mini-channel cold plate. While the cold plate with Z-shaped channels has been the most popular for thermal management application, other geometric designs including U-shaped and mixed configuration (i.e., combining Z-shaped and U-shaped) have also been explored by a significant number of studies [43,44,45,46]. In addition to the geometric consideration, the controlling strategy can also play an important role in improving the thermal performance of cold plates. For example, Cao et al. [47,48] proposed activating liquid cooling only after the temperature of the battery exceeds certain threshold. Such a method, also known as the delayed cooling scheme, was found to reduce the temperature nonuniformity and power consumption without sacrificing the cooling performance when applied to hybrid cold plates containing phase change materials (PCM).
While cold plates have been extensively studied in past literature studies to address the cooling issue of lithium-ion batteries, most existing cold plate designs only feature long and straight cooling channels. Such a design concept is advantageous in reducing the flow resistance, but fails to maximize the convective heat transfer performance. Furthermore, most existing studies employed continuous flow to cool down the battery, which is not a power efficient solution. On the other hand, the delayed cooling strategy opens a new pathway to simultaneously enhance the uniformity of battery temperature and to reduce energy consumption. In this study, a novel cross-linked channel configuration was proposed for cold plate design. A cross-linked channel cold plate consists of parallel longitudinal and transverse channels which facilitate better fluid mixing and help disrupt the thermal and hydraulic boundary layers. Consequently, such a fluid routing structure has the potential to achieve better temperature uniformity and enhanced heat transfer performance. To the best of the authors knowledge, the concept of cross-linked channel design in cold plates has not been explored in BTMS. The main objective of this study is to investigate the effectiveness of cross-linked channel cold plates coupled with a delayed cooling scheme for thermal management of battery packs at a high discharge rate. We first analyzed seven traditional cold plate designs containing Z-shaped minichannels of different geometries. The thermal performances of these designs were then evaluated and compared with two novel cold plate designs containing cross-linked minichannels. The average temperature of the battery surface, the temperature uniformity, and energy consumption of each cold plate design were studied systematically under the scheme of continuous cooling. Finally, the two best performing cold plate designs (i.e., a Z-shaped parallel channel cold plate with eight-branches and an improved cross-linked channel cold plate) were selected to analyze and compare the thermal performance of a continuous cooling strategy and a delayed cooling strategy.

2. Physical Model

Figure 1 illustrates the geometric model of the BTMS explored in this study. The main components of the BTMS include the batteries (which are also the heat source), the cold plates sandwiched between the neighboring battery cells, and a manifold used for routing the liquid into and out of each single cold plate. As shown in the figure, multiple inlets and outlets were installed on the manifold for connecting the cold plate to an external liquid supply and recirculating system. A commercial prismatic lithium-ion battery with a 45 Ah nominal capacity and 3.2 nominal voltage was selected to construct the battery pack in this study. The positive electrode is made of LiFeO4 and the negative electrode is graphite. The electrolyte consists of 1 M LiPF6–PC/EC/EMC (1/3/5 in weight ratio). The lithium-ion battery has a dimension of 150 mm in length, 200 mm in height, and 30 mm in width. Each cold plate is 3 mm thick and assumed to be manufactured from aluminum. Because of the symmetric geometry of the BTMS, a control volume comprising a half section of the battery and cold plate (shown by the blue dashed line in Figure 1) was selected as the computational domain in this study for analyzing the thermal performance. The cooling medium, selected to be 40% (volume fraction) ethanol solution, is assumed to flow into the cold plate at 25 °C from the top inlet ports and leave via the bottom exit ports. The specifications and thermo-physical properties of the battery, aluminum plate, and the coolant are summarized in Table 1.
Nine cold plate configurations were proposed and analyzed in this work. Based on the geometrical characteristics, these cold plates can be divided into two categories: (1) Z-type parallel channel cold plates (as shown in Figure 2a,b) and (2) cross-linked channel cold plates (as shown in Figure 2c,d). In the Z-type parallel channel cold plate, the coolant flows from the top inlet channel to the bottom outlet channel through a series of long and straight parallel channels without any disruption. Seven different Z-type parallel channel cold plates, each containing 3, 4, 5, 6, 7, 8, and 9 parallel channels, were explored in this work. These designs were referred to as D1 to D7 in the subsequent analysis. In the cross-linked channel cold plate, the coolant is routed through a series of interconnected longitudinal and transverse channels while flowing from the top inlet channel towards the bottom outlet channel. These interconnected channels form a hierarchical flow network which provides greater contact area for convection heat transfer as well as continuous disruption of the boundary layer along the flow path.
The dimensions of the inlet and outlet channels in all cold plate designs were set as 15 mm × 1 mm. The cross section of the parallel channels in Z-type parallel channel cold plates were designed to be 10 mm × 1 mm. The width of the fin (d) separating two neighboring channels’ changes based on the number of parallel channels in different designs. In the cross-linked channel cold plates, the transverse flow channels were designed to be 5 mm wide (labeled as f) and separated by 3 mm wide fins (labeled as e). The neighboring two rows of fins are separated by 12 mm (labeled as c1). The spacing between the leftmost/rightmost row of fins and the lateral boundary of the cold plate is 10 mm (labeled as c).
The average temperature and temperature uniformity of the battery pack are two key parameters for assessing its thermal performance. In this study, a temperature maldistribution parameter was introduced to quantify the temperature uniformity of the battery surface. The temperature maldistribution parameter ST is defined as follows:
S T = 1 N 1 j = 1 N T j T a v e 2
where N stands for the number of temperature detection points, Tj is the temperature measured at the jth detection point, and Tave is the average temperature. Figure 3 shows the locations of the 12 temperature detection points on the battery surface. These points are evenly distributed with a spacing of 50 mm.

3. Mathematical Model

3.1. Governing Equations

The computational domain encompasses the battery, aluminum plate, and coolant. The thermal and hydraulic transport behavior in the computational domain are modeled by the continuity, momentum, and energy equations given by
ρ l t + ρ l v l = 0 ,
ρ l v l t + v l v l = p + μ l 2 v l ,
ρ l c p , l T t + ρ l c p , l v l T = k l T ,
where ρl, μl, cp,l, and kl are the density, dynamic viscosity, specific heat capacity, and thermal conductivity of the cooling medium, respectively; p is the liquid pressure; t is the time; v l is the velocity vector; and T is the temperature.
The heat transport in the aluminum plate is governed exclusively by conduction, which can be modeled by the following energy equation:
ρ w c p w T t = k w T ,
where ρw, cp,w, and kw are the density, specific heat capacity, and thermal conductivity of the aluminum plate, respectively.

3.2. Battery Model

The heat transport process in the battery is modeled by the following energy equation:
ρ b c p , b T t = k b T + Q g e n ,
where ρb, cp,b, and kb are the density, specific heat capacity, and thermal conductivity of the battery. Qgen is the source term, which represents the volume-specific heat generation rate of the battery during operation.
For simplicity, the material properties and heat generation rate are assumed to be constant throughout the battery. Battery heat generation contains both reversible and irreversible components. The irreversible heat contribution is often the dominating heat source resulting from the Joule heating of the electron and ionic flow resistance. The reversible heat contribution is less significant and caused by the electrochemical reactions. Combining these two terms yields the total heat generation rate Qgen as:
Q g e n = Q i r + Q r e = I E V I T d E d T = I 2 R I T d E d T ,
where I is the current, E is open circuit voltage, V is cell potential, T is the temperature, R is the internal resistance, and dE/dT is the entropy coefficient, which changes with the state of charge (SOC).
Equation (7) indicates that the rate of heat generation inside the battery is dependent on many different parameters, which can vary significantly from one type of battery to another. For a specific type of battery with fixed properties, however, the heat generation rate is often only a strong function of the charging or discharging rate (also known as the C-rate) [49]. The battery C rating is the measurement of current in which a battery is charged and discharged. In general, a charging rate of nC represents that the battery is charged from 0 to 100% within 1/n hour’s time. A plethora of correlations have been developed to predict the heat generate rate as a function of the charging rate. In this study, the empirical time-dependent model developed by Li [50] was selected to estimate the heat generation rate at different charging rates as:
Q g e n = A 1 t 6 + A 2 t 5 + A 3 t 4 + A 4 t 3 + A 5 t 2 + A 6 t + A 7 ,
where A1 to A7 are the polynomial coefficients as listed in Table 2 [50].

3.3. Initial and Boundary Conditions

The entire BTMS was set at a uniform temperature of 25 °C prior to the simulation as
t = 0 , T x , y , z = T i n i = 25   ° C .
The thermal and hydraulic boundary conditions enforced on the inlet section of the BTMS are given by Equations (10)–(12). When using the continuous cooling strategy, a fixed velocity condition was imposed on the inlet. When the delayed cooling strategy is adopted, a temperature-dependent velocity condition is imposed in the inlet.
v = v i n ,
v = v i n , if T a v e 40   ° C v = 0 , if T a v e 30   ° C ,
T = T i n = 25   ° C ,
where Tave is the average temperature of the battery. Different values of the vin were selected in this study to explore the effect of flow rate on the thermal performance. The corresponding Reynolds number varies from 100 to 1000.
A zero-pressure boundary condition was set on the outlet port of the BTMS as:
p = 0   p a .
The thermal transport processes in the aluminum and battery were coupled by the energy balance condition at the interface given as:
k w T w n = k b T b n ,
where n is the normal vector of interfaces.
The convective heat transfer across the interface between the cooling medium and the aluminum cold plate was modeled on the following heat flux continuity condition and no-slip boundary as:
k w T w n = k l T l n , v = 0
An adiabatic thermal boundary condition was imposed on the rest of the solid walls of the cold plate and battery pack as:
k w T w n = 0 k b T b n = 0 .
The central cross-sectional planes of the BTMS (including the cold plate, battery, and cooling medium) were set as symmetric boundary conditions.

3.4. Numerical Method and Validations

The continuity, momentum, and energy equations were solved numerically using Ansys Fluent 2020 R1 commercial software. The differential equations were discretized using the third order MUSCL scheme and solved iteratively with the SIMPLE algorithm. A second order scheme was applied for pressure correction. The iteration was considered to reach convergence when the normalized residues in the momentum and energy equations become smaller than 1 × 10⁻⁶ and 1 × 10⁻¹², respectively.
A structured hexahedral mesh was used in the numerical simulation. For illustration purpose, the front view of the grids is shown in Figure 4. Prior to the numerical simulation, a mesh independent test was conducted on cold plate D1 with six different mesh sizes. In this test, the Reynolds number at the inlet channel was set as 500 and the discharging rate was set to be 3C. The total number of cells was increased from 3,900,000 to 7,500,000 and the non-dimensional distance y+ between the first interior node and solid wall was set in the range of 2 to 4.8. Figure 5a shows the average battery temperature of design D1 at time t = 500 and 1080 s as well as the pressure difference between the inlet and outlet at t = 1080 s calculated in the mesh independent test. The results indicate that the deviations between the average battery temperatures obtained with different grid numbers was less than 0.1 °C at t = 500 and 1080 s. Meanwhile, the difference in the pressure drop was less than 0.5 Pa when using different mesh sizes. To balance the computational cost and accuracy, a cell number of 5,690,000 with y+ = 3.0 was finally selected for the computational analysis of cold plate D1. Similar steps have been followed to determine the mesh size for the analyses of other cold plate designs. Furthermore, a time-step independent study has also been performed to ensure that the time step used in the computational analysis is small enough to capture the transient thermal response of the BTMS accurately. The time step ∆t was increased from 0.2 to 2.0 s and the results are shown in Figure 5b. It is evident that changing the time step has negligible impact on the average battery temperature and pressure drop. Therefore, a time step of 1 s was selected for the computational analysis of all cold plate designs in this study.
To further validate the computational model, we compared the numerical results obtained for cold plate D1 against the experimental results obtained by Li [50] in the literature as shown in Figure 6. The experimental work was conducted using LiFePO4 batteries (3.2 V, 45 Ah) at three different discharging rates. The battery temperature was measured on the surface using five thermocouples and reported as an average value. The comparison shown in Figure 6 reveals a highly consistent change in the average battery temperature between the numerical results and the experimental measurements taken by Li [50]. This agreement confirms the accuracy and reliability of the computational model developed in this study.

4. Results and Discussion

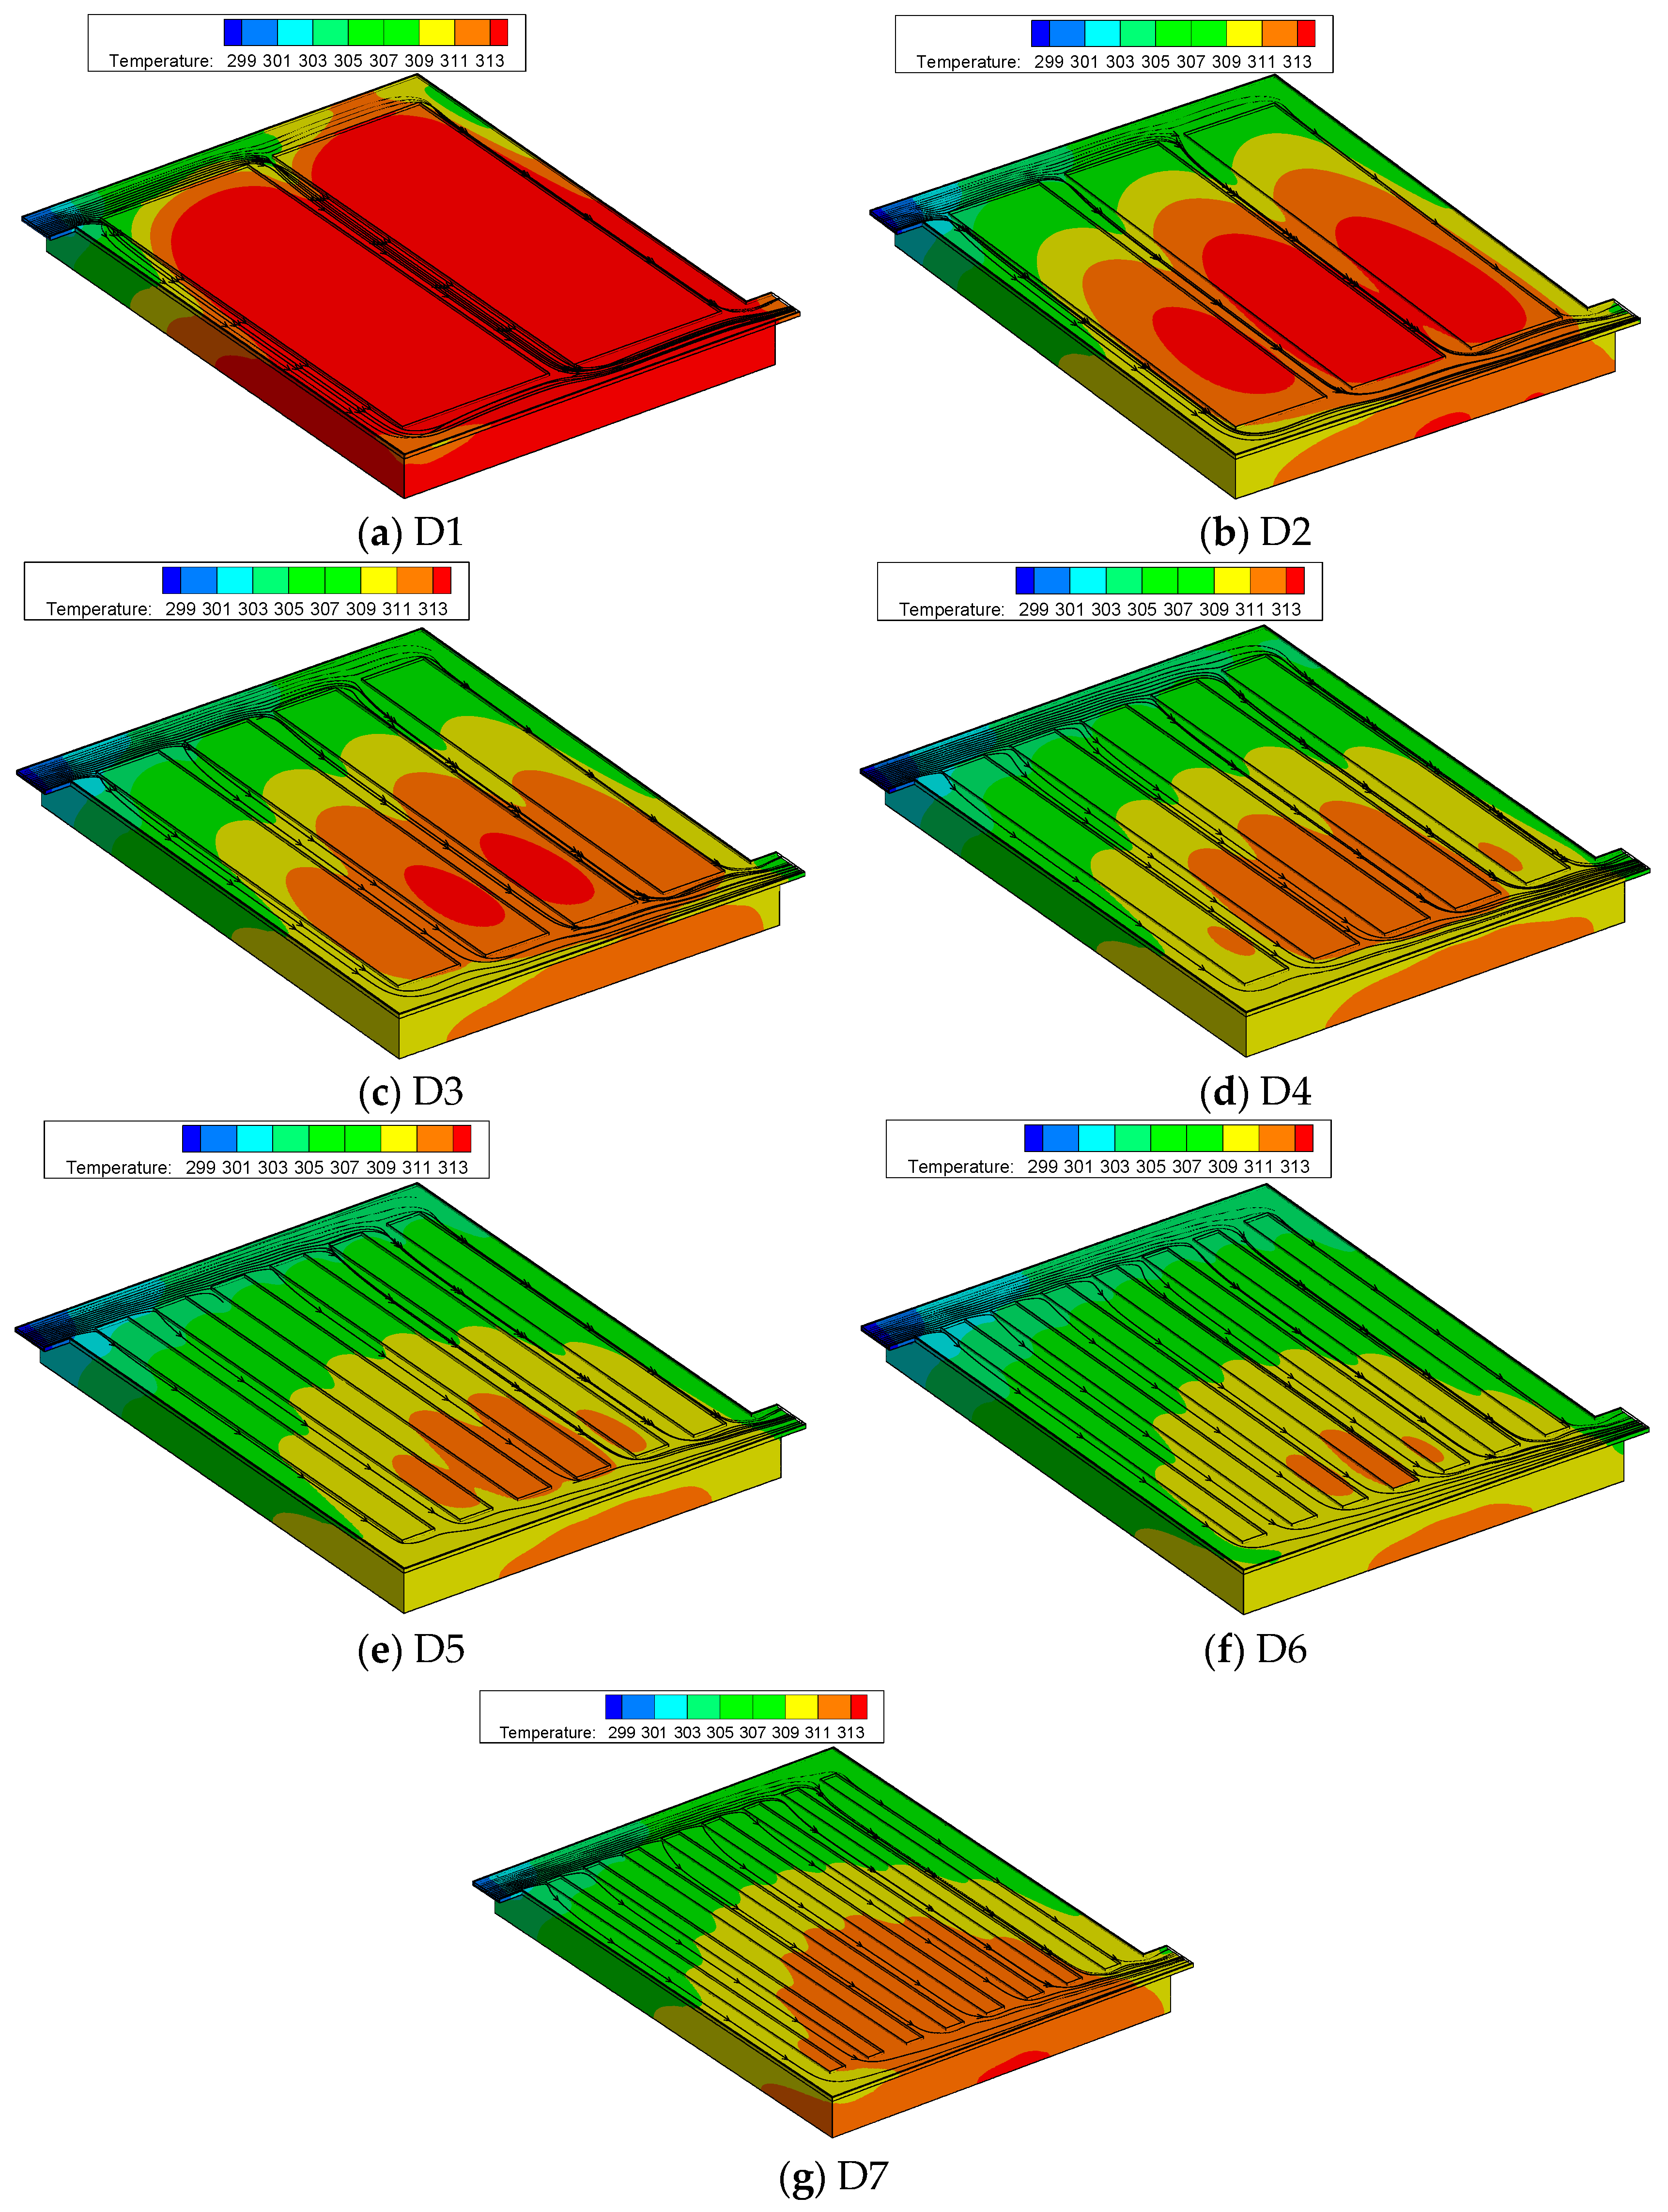
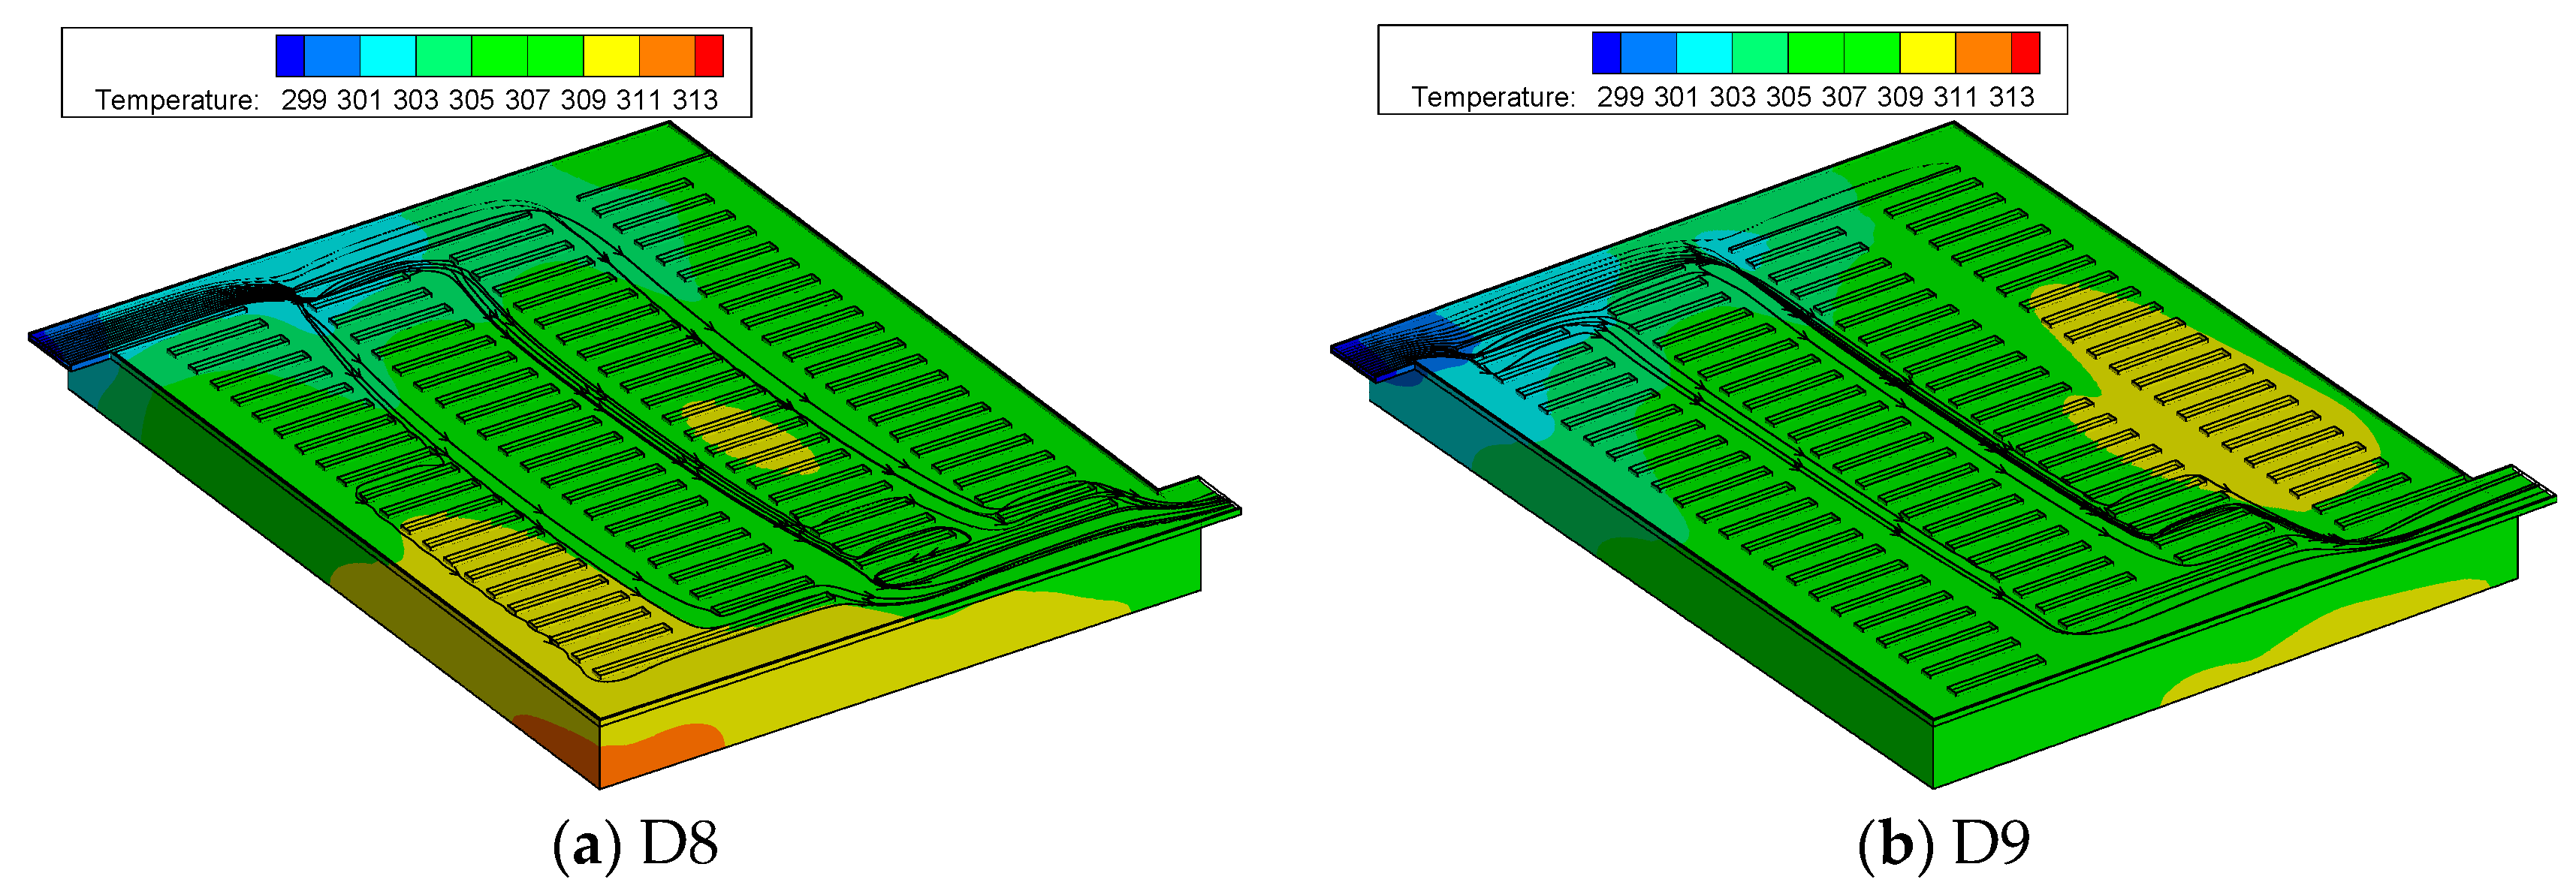
4.1. Temperature Distribution in Different Designs

Figure 7 and Figure 8 separately show the temperature contour with superimposed streamline for Z-type parallel channel cold plates and cross-linked channel cold plates at a discharge rate of 3C when the discharging cycle was completed (t = 1080 s). The Reynolds number was kept constant at 500 and the continuous cooling scheme was employed. As shown in Figure 7a–g, the surface temperatures of the cold plate and battery were found to decrease dramatically with increasing numbers of parallel channels until reaching a total number of 8 (i.e., design D6 shown in Figure 7f). Such a trend was expected since increasing number of cooling channel represents a greater contact area between the coolant and heated surface for convective cooling. However, with a fixed flow rate at the inlet, the velocity and Reynolds number in each parallel channel also becomes smaller with increasing number of channels, which will result in a lower convective heat transfer coefficient in each individual channel. Therefore, when the number of parallel cooling channels is sufficiently large, the reduction in the heat transfer coefficient will start to deprive the merit of greater cooling area and deteriorate the overall cooling performance. As shown by Figure 7f,g, further increasing the number of parallel channels from 8 (i.e., design D7) to 9 leads to a poorer thermal performance represented by a higher surface temperature. Thus, design D6 has the best heat dissipation performance in the Z-type parallel channel cold plates. In addition, the maximum temperature was observed at the middle and lower portions of battery due to the gradual heating of the coolant along the flow path. According to the numerical result, the highest temperatures obtained for cold plate designs D1 to D7 are 50.6 °C, 42.5 °C, 40.9 °C, 40 °C, 39.3 °C, 38.8 °C, and 40.4 °C, respectively.
The dilemma between a greater number of cooling channels and a smaller flow rate in each individual channel can be overcome by introducing the concept of cross-linked channel configuration, which includes two hierarchical levels of interconnected channels. The coolants were first distributed in long and wide parallel longitudinal channels and subsequently routed into short and narrowly spaced transverse channels. Such a design not only allows a greater surface area to be exposed to the convective cooling liquid, but also ensures a sufficiently high heat transfer coefficient in the transverse cooling channels. As shown by Figure 8, the surface temperatures of the battery and aluminum plate obtained for cold plate designs D8 and D9 are significantly lower and more uniform than those obtained for designs D1 to D7. The highest temperature of design D8 was observed in the lower left corner, while that of design D9 was observed in the middle right region. The corresponding maximum surface temperatures of designs D8 and D9 are 38.5 °C and 38.4 °C, respectively. These results demonstrated that the cross-linked channel cold plates have a superior cooling performance than the Z-type parallel channel cold plates.

4.2. Thermal-Hydraulic Performance in Different Designs

Figure 9a shows the temporal variation of average battery temperature for all designs. The Reynolds number was still kept at 500 while the discharging rate was set as 3C. As shown in the figure, the average battery temperatures increase rapidly during the initial period of time (about 300 s) followed by a slow and gradual rise for all cold plate designs. Near the end of the discharging cycle (after around 900 s), the average battery temperature started to experience a rapid rise again (about after 900 s). The fast temperature rise at the initial stage is attributed to the slow heat absorption rate by the convective coolant as a result of the small temperature difference between the coolant and battery. At the final stage of the discharge process, the heat generation rate rises sharply which leads to a surge in the battery temperature. As shown in Figure 9a, the average battery temperature calculated for Z type parallel channel cold plates decreases gradually with increasing branch numbers from design D1 to D6 and started rising with increasing branch number from design D6 to D7. In addition, the battery temperatures calculated for designs D8 and D9 are substantially lower than those for the rest of the designs. To better understand such a trend, the effective thermal resistance of all cold plate designs was calculated when the discharging cycle completed (t = 1080 s). The corresponding results are shown in Figure 9b. It is found that the effective thermal resistance decreases monotonically from designs D1 to D9 except for design D7. A smaller thermal resistance represents a smaller temperature difference between the battery surface and the coolant and therefore manifests a better heat transfer performance. It is surprising to notice that the effective thermal resistance of design D7 is even larger than that of design D4, which suggests that convective heat transfer is suppressed severely by the low mass flow rate in each individual channel for design D7. Thus, the average battery temperature becomes significantly higher in design D7. On the other hand, both designs D8 and D9 demonstrated a superior thermal performance than all Z-type cold plates.
Non-uniform temperature distribution has a significant impact on battery performance and lifetime. To analyze the nonuniformity of temperature distribution for different designs, we calculated the variation of the temperature maldistribution parameter over time according to Equation (1) for different cold plate designs as shown in Figure 10. The change of the temperature maldistribution parameter was found to follow a similar trend with that of the average battery temperature. In particular, the temperature maldistribution parameters first increase rapidly, followed by a gradual and slow rise and finally increase quickly again near the end of the discharging process. Among all the designs, D9 has the smallest temperature maldistribution parameter during most of the discharging process. Thus, it can be concluded that design D9 has the best thermal performance than the rest of the designs in terms of both the thermal resistance and temperature uniformity.
The cooling efficiency, which is evaluated based on the energy consumption and heat removal rate, is also another important factor in a practical battery temperature management system. A better cooling performance can always be achieved at a higher flow rate, but at a cost of significantly greater power consumption. The energy consumption can be calculated based on the flow rate and pumping pressure by:
Q = Δ p V t ,
where Δp is the difference between the inlet and outlet pressure, V is the volumetric flow rate of the cooling medium, and t is the operating time of the cold plate. Figure 11 shows the energy consumption and the average temperature of the battery when the discharging cycle completed (t = 1080 s) for comparing the integrative performance of different designs. The inlet Reynolds number was kept constant at Re = 500 and the batteries were operated at a discharge rate of 3C. Because the fluid properties are independent of the temperature, the pressure and velocity distribution remained constant during the entire discharge process. Therefore, the pressure values obtained at the end of discharging (t = 1080 s) were used to calculate the pumping power. As shown in Figure 11, the power consumption kept decreasing monotonically with increasing number of channels in the Z-type parallel channel cold plates. This is because increasing number of channel numbers results in a lower mass flow rate in each channel, which reduces the pressure drop through each individual channel. Considering that the total pressure drop across the parallel channel system is equal to that across each single channel, the total energy consumption can therefore be reduced by distributing the cooling medium into a greater number of channels. The minimum power consumption was obtained in design D7 which contains nine branches of parallel channels. Furthermore, the cross-linked channel cold plates, due to their longer, narrower, and more tortuous flow path, require a significantly higher pumping power to achieve the same flow rate compared with cold plates containing Z-shaped parallel channel. However, by adjusting the structure of the cross-linked flow path slightly from design D8 to design D9, the total power consumption can be reduced by more than 20% without significant impact on the cooling performance. Therefore, based on the comprehensive consideration of the thermal-hydraulic performance, cold plate designs D6 and D9 were identified as the optimum channel designs in this study.

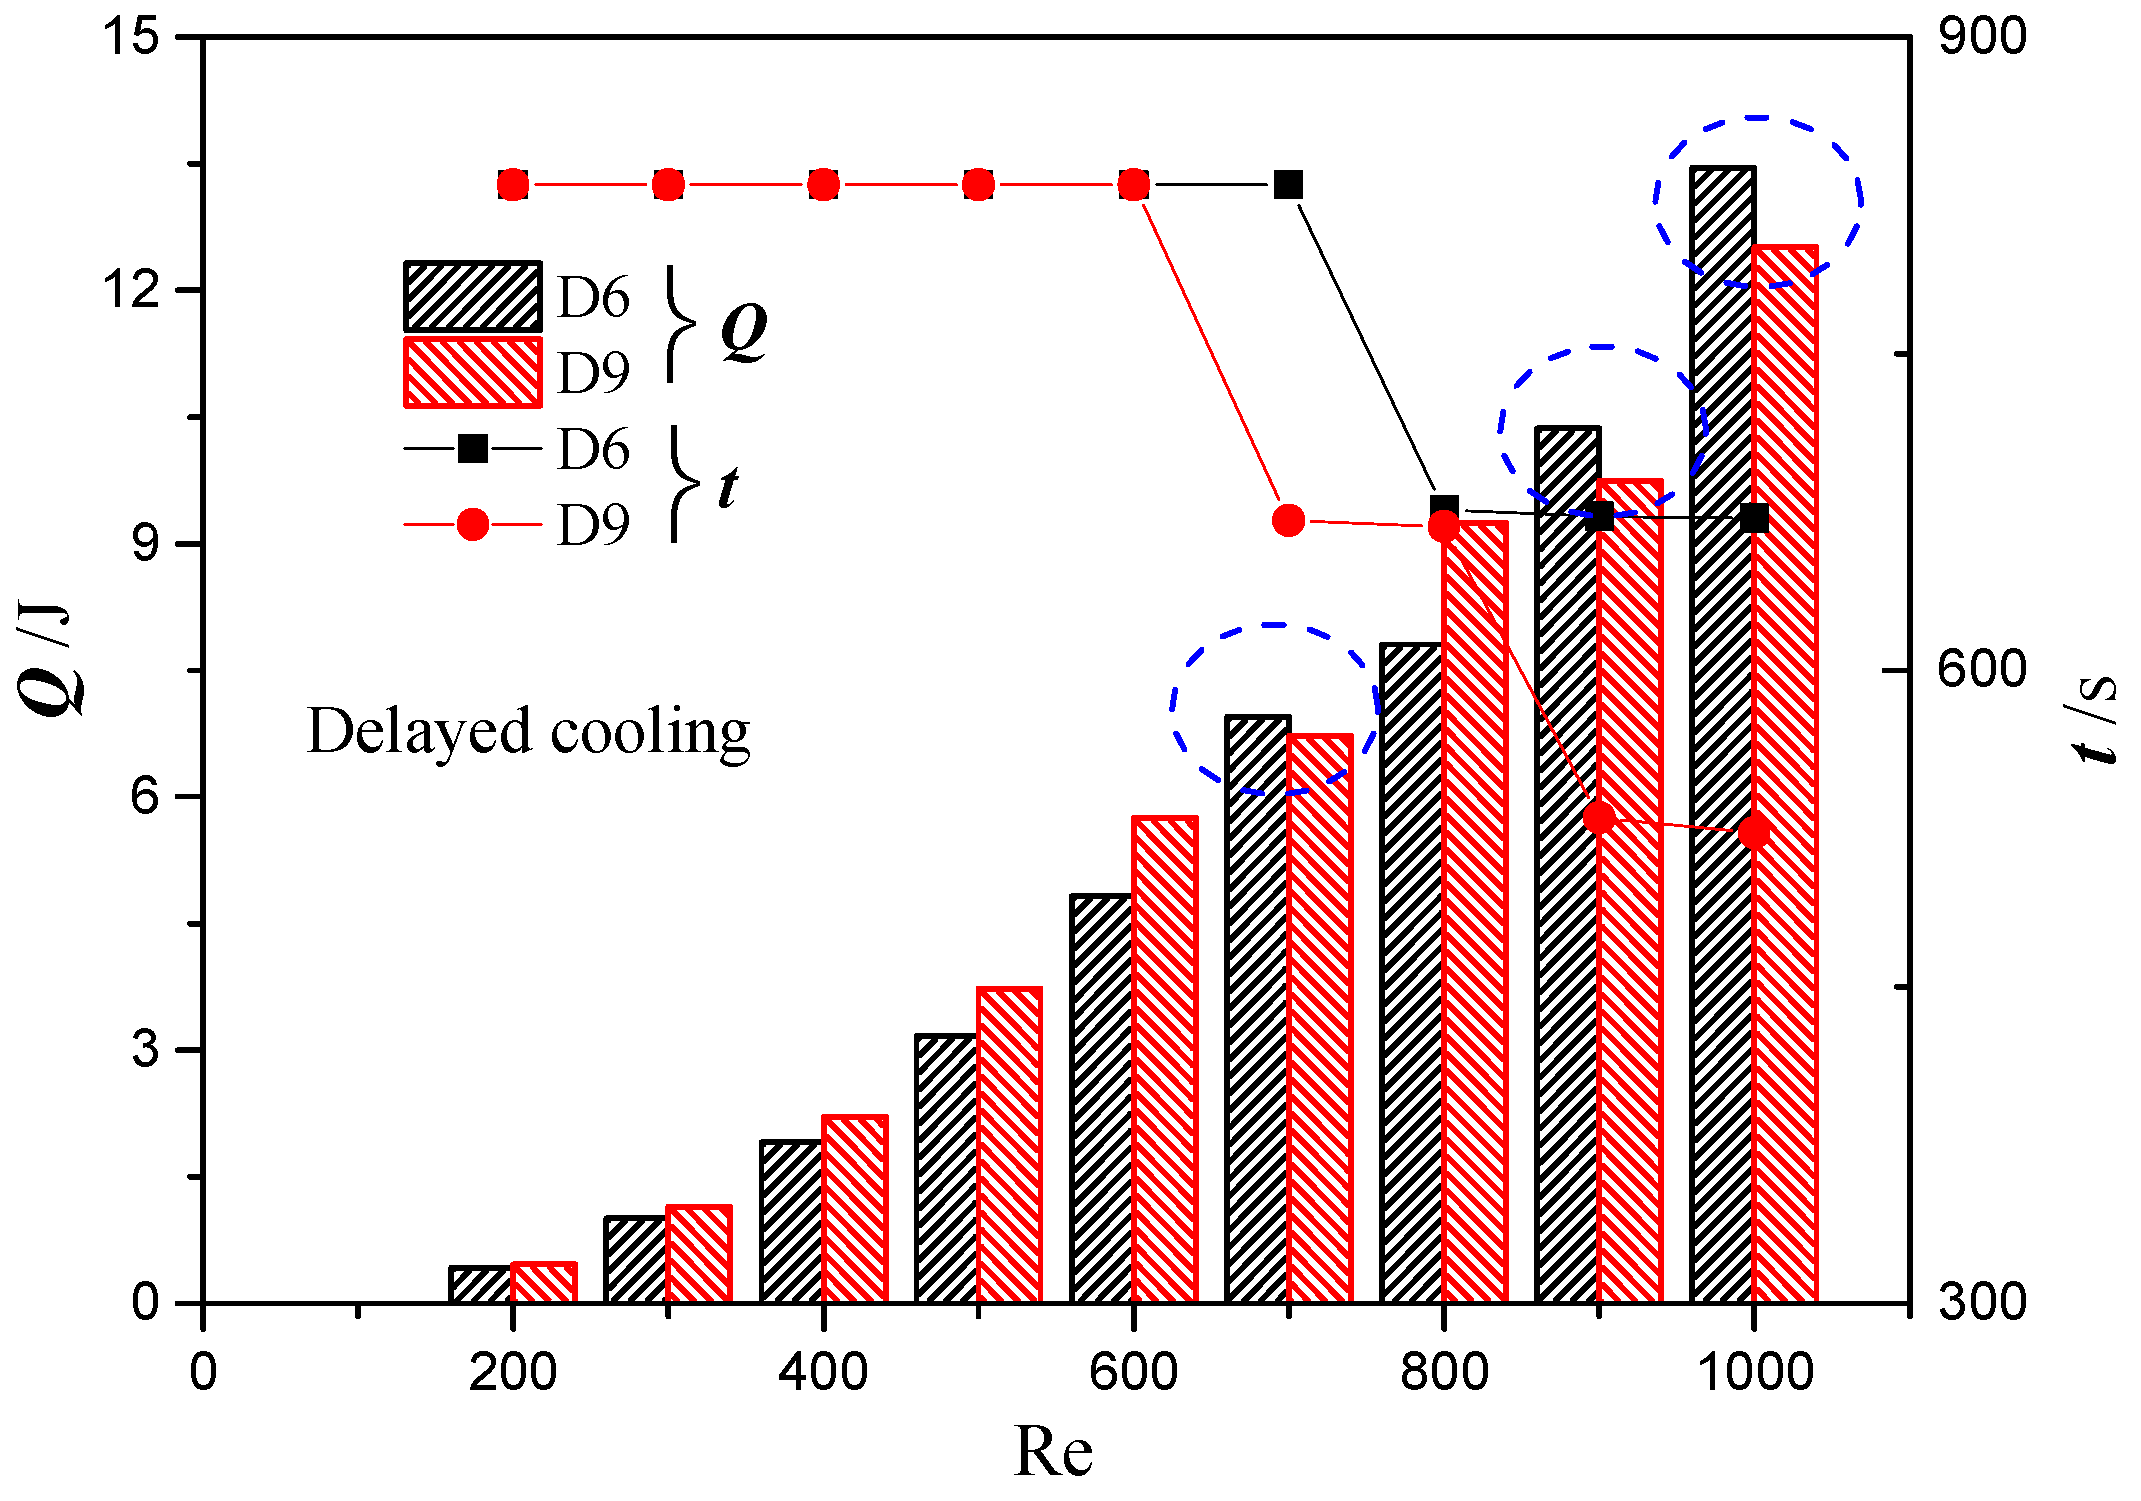
4.3. Performance Comparison under Different Cooling Strategies

The performances of continuous and delayed cooling strategies were compared using the best performing cold plate designs (i.e., designs D6 and D9). In the delayed cooling scheme, a constant flow of coolant will be provided into the cold plate to cool the battery when the average temperature of battery reaches an upper limit of 40 °C. Once the average temperature of the battery drops below 30 °C, the coolant flow will be stopped (i.e., vin = 0). Figure 12a,b shows the temperature change of the battery for designs D6 and D9 at different flow rates when the continuous cooling strategy and delayed cooling strategy were employed. The results indicate that increasing flow rate will cause the battery temperature to rise more slowly for both cooling strategies. When the continuous cooling strategy was employed with the flow rate set at Re = 100, the battery temperature in cold plate designs D6 and D9 was found to exceed the upper limit of 40 °C at t = 591 s and 669 s, respectively. This maximum temperature limit was breached much earlier when adopting the delayed cooling strategy. However, it is interesting to observe that for both designs D6 and D9, the average temperature of the battery measured at the end of discharging process remained almost unchanged for both cooling strategies.
Figure 12c shows the battery temperature in cold plate designs D6 and D9 under both cooling strategy when the discharging cycle completed (t = 1080 s). At the same flow rate, the battery temperature in cold plate design D6 is always higher than that in design D9. In addition, there is very marginal change in the average battery temperature when changing from the continuous to the delayed cooling strategy. The average temperature of the battery at the end of the discharging process is 40.1 °C at Re = 200 in design D6 and 39.8 °C at Re = 180 in design D9. These results suggest that the battery temperature can always be controlled within a safe limit by either operating cold plate D6 at Re = 200 or cold plate D9 at Re = 180 under both cooling strategies.
Figure 13 shows the temperature maldistribution parameter and power consumption for cold plate design D6 at Re = 200 and design D9 at Re = 180 when adopting the two different cooling strategies. Similar to the trend observed for average battery temperature, the temperature maldistribution parameter kept increasing over time under the scheme of continuous cooling. However, when switching to the delayed cooling strategy, the temperature maldistribution parameter remained almost zero during the initial period due to the zero flow rate of the coolant. Subsequently, the battery temperature reached the upper limit and the coolant started being pumped into the cold plate, which resulted in a large temperature difference between the entrance and exit areas. This stage is represented by a sharp rise of the temperature maldistribution parameter shown in Figure 13a. As the coolant got heated up by the battery, the temperature maldistribution parameter experienced a slow drop followed by a gradual rebound towards the end of the discharging process. As shown in the results, the temperature maldistribution parameters of design D6 is always greater than that of design D9 regardless of the cooling strategy being employed. In addition, the power consumption of design D9 is also 13% lower than that of design D6. More importantly, changing from the continuous to the delayed cooling strategy allows the power consumption to be reduced significantly due to the temporal interruption of the cooling flow. In particular, the power consumption was decreased by 23% for both designs D6 and D9 after switching from the continuous to the delayed cooling schemes. All these findings demonstrate that the delayed cooling strategy is a more energy efficient method to control the battery temperature within a safe operating limit compared to the continuous cooling strategy. Furthermore, design D9 was proven to have the best cooling performance than the rest of the designs in terms of a lower battery temperature, a smaller temperature non-uniformity, and a lower power consumption.
The effect of inlet Reynolds number on the power consumption and total duration of coolant flow was further analyzed for designs D6 and D9 under the delayed cooling scheme, as shown in Figure 14. It is evident to notice that the power consumption kept rising with increasing Reynolds number. For cold plate design D9, the total duration of coolant flow was reduced twice when the Reynolds number was increased from 600 to 700 and from 800 to 900. For design D6, however, the total duration of coolant flow was only reduced once when increasing the Reynolds number from 600 to 700. The reduced flow duration provides a direct indication of a better energy efficiency since the battery temperature can be controlled effectively with a lower amount of coolant flow. As shown in Figure 14, the power consumption of design D9 becomes lower than that of D6 at Re = 700, 900, and 1000 due to the shorter duration of coolant flow. However, it should also be noted that a reduced flow duration may also represent an overcooling scenario because the battery temperature has been kept below 30 °C (instead of the upper limit of 40 °C) for a substantial amount of time. Therefore, operating at a higher flow rate for a reduced amount of time does not necessarily provide a better energy efficiency. In fact, a greater pumping power is still required at a higher Reynolds number to ensure that the battery temperature is less than the upper limit of 40 °C. If more stringent operating temperature is required in the practical scenario, then design D9 could potentially provide a much better performance than design D6 by using a high mass flow rate and a shorter cooling period.

5. Conclusions

In this study, seven Z-type parallel channel cold plates and two cross-linked channel cold plates were proposed for the cooling of high-power lithium-ion batteries under continuous and delayed cooling schemes. The main conclusions made are as follows:
(1)
The best thermal performance was obtained at a channel number of eight in the Z-type parallel channel cold plates. Cross-linked channel cold plates show a significantly better cooling performance than Z-type parallel channel cold plates at the price of a higher power consumption.
(2)
The operating temperature of a battery can be maintained within a safe range at Re = 200 and 180 for designs D6 and D9, respectively, under both continuous and delayed cooling schemes. At these operating conditions, design D9 requires 13% less pumping power and provides a better temperature uniformity than design D6. Therefore, design D9 has the best thermo-hydraulic performance than the rest of the designs.
(3)
Under the premise that the battery temperature is kept within the safe range, the delayed cooling strategy can greatly reduce the power consumption by shortening the duration of liquid cooling. In particular, the power consumption of design D9 can be decreased by 23% after switching from the continuous cooling scheme to the delayed cooling scheme.

Author Contributions

H.Y. wrote the main manuscript text; Z.W., M.L. and F.R. prepared figures; B.M. reviewed the manuscript. All authors have read and agreed to the published version of the manuscript.

Funding

This work was supported by the National Natural Science Foundation of China (No. 52106004), Guangdong Basic and Applied Basic Research Foundation (No. 2020A1515110270), and Science, Technology and Innovation Commission of Shenzhen Municipality (GXWD20220811165249002, GXWD20201230155427003-20200801212235001) for which the authors are thankful.

Data Availability Statement

The datasets generated during and/or analyzed during the current study are available from the corresponding author on reasonable request.

Conflicts of Interest

We declare that we do not have any commercial or associative interest that represents a conflict of interest in connection with the work submitted.

Nomenclature

Latin symbols
binlet and outlet channel width, mm
c, c1fin space of longitudinal channel, mm
cpheat capacity, J·K−1·kg−1
dfin thickness of longitudinal channel, mm
efin thickness of transverse channel, mm
ffin space of transverse channel, W·m−2·K−1
ppressure, Pa
Qpower consumption, J
Qgenheat generation rate, W·m−3
Rconvection thermal resistance, °C·W−1
STtemperature maldistribution parameter,
ttime, s
Ttemperature, °C
vvelocity, m·s−1
Greek symbols
ρdensity, kg·m−3
kthermal conductivity, W·m−1·K−1
μdynamic viscosity, kg·m−1·s−1
Subscripts
aveaverage
bbattery
jserial number
lliquid
wwall

References

  1. Feng, X.; Zheng, S.; Ren, D.; He, X.; Wang, L.; Cui, H.; Liu, X.; Jin, C.; Zhang, F.; Xu, C.; et al. Investigating the thermal runaway mechanisms of lithium-ion batteries based on thermal analysis database. Appl. Energy 2019, 246, 53–64. [Google Scholar] [CrossRef]
  2. Chen, J.; Kang, S.; E, J.; Huang, Z.; Wei, K.; Zhang, B.; Zhu, H.; Deng, Y.; Zhang, F.; Liao, G. Effects of different phase change material thermal management strategies on the cooling performance of the power lithium ion batteries: A review. J. Power Sources 2019, 442, 227228. [Google Scholar] [CrossRef]
  3. Zheng, C. Examining the Benefits of Using Boron Compounds in Lithium Batteries: A Comprehensive Review of Literature. Batteries 2022, 8, 187. [Google Scholar] [CrossRef]
  4. Kim, J.; Oh, J.; Lee, H. Review on battery thermal management system for electric vehicles. J. Appl. Therm. Eng. 2019, 149, 192–212. [Google Scholar] [CrossRef]
  5. Pesaran, A.A. Battery thermal models for hybrid vehicle simulations. J. Power Sources 2002, 110, 377–382. [Google Scholar] [CrossRef]
  6. Zhang, L.; Zhao, P.; Xu, M.; Wang, X. Computational identification of the safety regime of Li-ion battery thermal runaway. Appl. Energy 2020, 261, 114440. [Google Scholar] [CrossRef]
  7. Chen, K.; Song, M.; Wei, W.; Wang, S. Design of the structure of battery pack in parallel air-cooled battery thermal management system for cooling efficiency improvement. Int. J. Heat Mass Transf. 2019, 132, 309–321. [Google Scholar] [CrossRef]
  8. Chen, W.; Hou, S.; Shi, J.; Han, P.; Liu, B.; Wu, B.; Lin, X. Numerical Analysis of Novel Air-Based Li-Ion Battery Thermal Management. Batteries 2022, 8, 128. [Google Scholar] [CrossRef]
  9. Liu, Y.; Zhang, J. Self-adapting J-type air-based battery thermal management system via model predictive control. Appl. Energy 2020, 263, 114640. [Google Scholar] [CrossRef]
  10. Lloyd, R.; Akrami, M. A Critical Analysis of Helical and Linear Channel Liquid Cooling Designs for Lithium-Ion Battery Packs. Batteries 2022, 8, 236. [Google Scholar] [CrossRef]
  11. Park, S.; Jang, D.S.; Lee, D.; Hong, S.H.; Kim, Y. Simulation on cooling performance characteristics of a refrigerant-cooled active thermal management system for lithium ion batteries. Int. J. Heat Mass Transf. 2019, 135, 131–141. [Google Scholar] [CrossRef]
  12. Lan, C.; Xu, J.; Qiao, Y.; Ma, Y. Thermal management for high power lithium-ion battery by minichannel aluminum tubes. Appl. Therm. Eng. 2016, 101, 284–292. [Google Scholar] [CrossRef] [Green Version]
  13. Xiong, M.; Wang, N.; Li, W.; Garg, A.; Gao, L. Study on the Heat Dissipation Performance of a Liquid Cooling Battery Pack with Different Pin-Fins. Batteries 2023, 9, 44. [Google Scholar] [CrossRef]
  14. Ping, P.; Zhang, Y.; Kong, D.; Du, J. Investigation on battery thermal management system combining phase changed material and liquid cooling considering non-uniform heat generation of battery. J. Energy Storage 2021, 36, 102448. [Google Scholar] [CrossRef]
  15. Yang, H.; Li, Y.; Zhang, L.; Zhu, Y. Thermal performance enhancement of phase change material heat sinks for thermal management of electronic devices under constant and intermittent power loads. Int. J. Heat Mass Transf. 2021, 181, 121899. [Google Scholar] [CrossRef]
  16. Sun, Z.; Fan, R.; Yan, F.; Zhou, T.; Zheng, N. Thermal management of the lithium-ion battery by the composite PCM-Fin structures. Int. J. Heat Mass Transf. 2019, 145, 118739. [Google Scholar] [CrossRef]
  17. Yang, H.; Li, Y.; Yang, Y.; Chen, D.; Zhu, Y. Effective thermal conductivity of high porosity open-cell metal foams. Int. J. Heat Mass Transf. 2020, 147, 118974. [Google Scholar] [CrossRef]
  18. He, L.; Tang, X.; Luo, Q.; Liao, Y.; Luo, X.; Liu, J.; Ma, L.; Dong, D.; Gan, Y.; Li, Y. Structure optimization of a heat pipe-cooling battery thermal management system based on fuzzy grey relational analysis. Int. J. Heat Mass Transf. 2022, 182, 121924. [Google Scholar] [CrossRef]
  19. Wu, W.; Yang, X.; Zhang, G.; Chen, K.; Wang, S. Experimental investigation on the thermal performance of heat pipe-assisted phase change material based battery thermal management system. Energy Convers. Manag. 2017, 138, 486–492. [Google Scholar] [CrossRef]
  20. Yang, H.; Li, M.; Wang, Z.; Ma, B. A compact and lightweight hybrid liquid cooling system coupling with Z-type cold plates and PCM composite for battery thermal management. Energy 2023, 263. [Google Scholar] [CrossRef]
  21. Widyantara, R.D.; Zulaikah, S.; Juangsa, F.B.; Budiman, B.A.; Aziz, M. Review on Battery Packing Design Strategies for Superior Thermal Management in Electric Vehicles. Batteries 2022, 8, 287. [Google Scholar] [CrossRef]
  22. Akbarzadeh, M.; Jaguemont, J.; Kalogiannis, T.; Karimi, D.; He, J.; Jin, L.; Xie, P.; Van Mierlo, J.; Berecibar, M. A novel liquid cooling plate concept for thermal management of lithium-ion batteries in electric vehicles. Energy Convers. Manag. 2021, 231, 113862. [Google Scholar] [CrossRef]
  23. Yue, Q.; He, C.; Wu, M.; Zhao, T. Advances in thermal management systems for next-generation power batteries. Int. J. Heat Mass Transf. 2021, 181, 121853. [Google Scholar] [CrossRef]
  24. Lin, J.; Liu, X.; Li, S.; Zhang, C.; Yang, S. A review on recent progress, challenges and perspective of battery thermal management system. Int. J. Heat Mass Transf. 2021, 167, 120834. [Google Scholar] [CrossRef]
  25. Mousavi, S.; Siavashi, M.; Zadehkabir, A. A new design for hybrid cooling of Li-ion battery pack utilizing PCM and mini channel cold plates. Appl. Therm. Eng. 2021, 197, 117398. [Google Scholar] [CrossRef]
  26. E, J.; Han, D.; Qiu, A.; Zhu, H.; Deng, Y.; Chen, J.; Zhao, X.; Zuo, W.; Wang, H.; Chen, J.; et al. Orthogonal experimental design of liquid-cooling structure on the cooling effect of a liquid-cooled battery thermal management system. Appl. Therm. Eng. 2018, 132, 508–520. [Google Scholar] [CrossRef]
  27. Huo, Y.; Rao, Z.; Liu, X.; Zhao, J. Investigation of power battery thermal management by using mini-channel cold plate. Energy Convers. Manag. 2015, 89, 387–395. [Google Scholar] [CrossRef]
  28. Qian, Z.; Li, Y.; Rao, Z. Thermal performance of lithium-ion battery thermal management system by using mini-channel cooling. Energy Convers. Manag. 2016, 126, 622–631. [Google Scholar] [CrossRef]
  29. Li, X.; Zhou, D.; Zhang, G.; Wang, C.; Lin, R.; Zhong, Z. Experimental investigation of the thermal performance of silicon cold plate for battery thermal management system. Appl. Therm. Eng. 2019, 155, 331–340. [Google Scholar] [CrossRef]
  30. Deng, T.; Zhang, G.; Ran, Y. Study on thermal management of rectangular Li-ion battery with serpentine-channel cold plate. Int. J. Heat Mass Transf. 2018, 125, 143–152. [Google Scholar] [CrossRef]
  31. Kong, W.; Zhu, K.; Lu, X.; Jin, J.; Ni, M. Enhancement of lithium-ion battery thermal management with the divergent-shaped channel cold plate. J. Energy Storage 2021, 42, 103027. [Google Scholar] [CrossRef]
  32. Huang, Y.; Mei, P.; Lu, Y.; Huang, R.; Yu, X.; Chen, Z.; Roskilly, A.P. A novel approach for Lithium-ion battery thermal management with streamline shape mini channel cooling plates. Appl. Therm. Eng. 2019, 157, 113623. [Google Scholar] [CrossRef]
  33. Mo, X.; Zhi, H.; Xiao, Y.; Hua, H.; He, L. Topology optimization of cooling plates for battery thermal management. Int. J. Heat Mass Transf. 2021, 178, 121612. [Google Scholar] [CrossRef]
  34. Kalkan, O.; Celen, A.; Bakirci, K.; Dalkilic, A.S. Experimental investigation of thermal performance of novel cold plate design used in a Li-ion pouch-type battery. Appl. Therm. Eng. 2021, 191, 116885. [Google Scholar] [CrossRef]
  35. Amalesh, T.; Narasimhan, N.L. Introducing new designs of minichannel cold plates for the cooling of Lithium-ion batteries. J. Power Sources 2020, 479, 228775. [Google Scholar] [CrossRef]
  36. Chen, Y.; Chen, K.; Dong, Y.; Wu, X. Bidirectional symmetrical parallel mini-channel cold plate for energy efficient cooling of large battery packs. Energy 2021, 242, 122553. [Google Scholar] [CrossRef]
  37. Gungor, S.; Cetkin, E.; Lorente, S. Canopy-to-canopy liquid cooling for the thermal management of lithium-ion batteries, a constructal approach. Int. J. Heat Mass Transf. 2022, 182, 121918. [Google Scholar] [CrossRef]
  38. Sun, H.; Dixon, R. Development of cooling strategy for an air cooled lithium-ion battery pack. J. Power Sources 2014, 272, 404–414. [Google Scholar] [CrossRef]
  39. Guo, R.; Li, L. Heat dissipation analysis and optimization of lithium-ion batteries with a novel parallel-spiral serpentine channel liquid cooling plate. Int. J. Heat Mass Transf. 2022, 189, 122706. [Google Scholar] [CrossRef]
  40. Shen, X.; Cai, T.; He, C.; Yang, Y.; Chen, M. Thermal analysis of modified Z-shaped air-cooled battery thermal management system for electric vehicles. J. Energy Storage 2023, 58, 106356. [Google Scholar] [CrossRef]
  41. Faizan; Pati, S.; Randive, P. Effect of channel configurations on the thermal management of fast discharging Li-ion battery module with hybrid cooling. Energy 2023, 267, 126358. [Google Scholar] [CrossRef]
  42. Guo, Z.; Xu, Q.; Ni, M. A numerical study on the battery thermal management system with mini-channel cold plate considering battery aging effect. Appl. Therm. Eng. 2023, 219, 119564. [Google Scholar] [CrossRef]
  43. Chen, K.; Song, M.; Wei, W.; Wang, S. Structure optimization of parallel air-cooled battery thermal management system with U-type flow for cooling efficiency improvement. Energy 2018, 145, 603–613. [Google Scholar] [CrossRef]
  44. Lu, Z.; Yu, X.; Wei, L.; Qiu, Y.; Zhang, L.; Meng, X.; Jin, L. Parametric study of forced air cooling strategy for lithium-ion battery pack with staggered arrangement. Appl. Therm. Eng. 2018, 136, 28–40. [Google Scholar] [CrossRef]
  45. Liu, Y.; Zhang, J. Design a J-type air-based battery thermal management system through surrogate-based optimization. Appl. Energy 2019, 252, 113426. [Google Scholar] [CrossRef]
  46. Cao, J.; Feng, J.; Fang, X.; Ling, Z.; Zhang, Z. A delayed cooling system coupling composite phase change material and nano phase change material emulsion. Appl. Therm. Eng. 2021, 191, 116888. [Google Scholar] [CrossRef]
  47. Cao, J.; Ling, Z.; Fang, X.; Zhang, Z. Delayed liquid cooling strategy with phase change material to achieve high temperature uniformity of Li-ion battery under high-rate discharge. J. Power Sources 2020, 450, 227673. [Google Scholar] [CrossRef]
  48. Cao, W.; Zhao, C.; Wang, Y.; Dong, T.; Jiang, F. Thermal modeling of full-size-scale cylindrical battery pack cooled by channeled liquid flow. Int. J. Heat Mass Transf. 2019, 138, 1178–1187. [Google Scholar] [CrossRef]
  49. Pan, Y.-W.; Hua, Y.; Zhou, S.; He, R.; Zhang, Y.; Yang, S.; Liu, X.; Lian, Y.; Yan, X.; Wu, B. A computational multi-node electro-thermal model for large prismatic lithium-ion batteries. J. Power Sources 2020, 459, 228070. [Google Scholar] [CrossRef]
  50. Li, T. Study on thermal effects of lithium-ion battery in electric vehicle and battery package dissipation structural optimization. Master’s Thesis, Chongqing University, Chongqing, China, 2013. [Google Scholar]
Figure 1. The diagram showing the structure and components of the BTMS for the lithium-ion battery.
Batteries 09 00220 g001
Figure 2. The diagrams showing the geometry of the simulated cold plate. (a) Z-type parallel channel design with 3-branches (D1); (b) Z-type parallel channel design with 8-branches (D6); (c) cross-linked channel design (D8); (d) cross-linked channel design with improved topology (D9). The characteristic dimensions associated with each design are marked by geometric parameters a, b, c, c1, d, e, and f in each image.
Batteries 09 00220 g002
Figure 3. The distribution of the temperature detection points (T1, T2, … T12) on the battery surface.
Batteries 09 00220 g003
Figure 4. The mesh scheme of design D1 in front view.
Batteries 09 00220 g004
Figure 5. The change in the average battery temperature and pressure difference between inlet and outlet for cold plate with increasing (a) grid numbers and (b) time step.
Batteries 09 00220 g005
Figure 6. The comparison of the change in the average battery temperature between the simulation results and the experimental measurement taken by Li [50].
Batteries 09 00220 g006
Figure 7. Temperature contours with superimposed streamline at t = 1080 s for Z-type parallel channel cold plates.
Batteries 09 00220 g007
Figure 8. Temperature contours with superimposed streamline at t = 1080 s for cross-linked channel cold plates.
Batteries 09 00220 g008
Figure 9. (a) The change of average temperature of battery surface during the discharging cycle and (b) thermal resistance for different cold plate designs at Re = 500.
Batteries 09 00220 g009
Figure 10. Temporal variation of temperature maldistribution parameter for different designs at Re = 500.
Batteries 09 00220 g010
Figure 11. The comparison of the total energy consumption and battery temperature between different cold plate designs at Re = 500.
Batteries 09 00220 g011
Figure 12. The change in the average temperature of battery for cold plate designs D6 and D9 between the two different cooling strategies: (a) D6; (b) D9; (c) at t = 1080 s.
Batteries 09 00220 g012
Figure 13. Temporal variation of power consumption for cold plate designs D6 and D9 with the average battery temperature controlled within the allowable range.
Batteries 09 00220 g013
Figure 14. The variation of power consumption and liquid cooling time for designs D6 and D9 under delayed cooling scheme at different Reynolds numbers.
Batteries 09 00220 g014
Table 1. Main performance parameters and thermo-physical properties of the battery, coolant, and cold plate explored in this study.
Parameters Battery AluminumCoolant (40% Ethanol Solution)
Nominal Capacity (Ah)45
Nominal Voltage (V)3.2
Charge Cut-off Voltage (V)3.6
Discharge Cut-off Voltage (V)2.5
Maximum charging current (A)≤3
Maximum discharge current (A)≤4
Internal resistance (mΩ)≤10
Size (mm)150 × 200 × 30
Density ρ (kg·m−3)209027191055.39
Heat capacity cp (J·K−1·kg−1)1014.48713502
Thermal conductivity k (W·m−1·K−1)kx = 1.696
ky = kz= 29.94
202.40.412
Dynamic viscosity μ (kg·m−1·s−1) 0.00226
Table 2. The empirical coefficients used to model the heat generation rate of the battery during the discharging cycle [50].
Discharge RatesA1A2A3A4A5A6A7
1C4.9132 × 10−16−3.7742 × 10−121.0679 × 10⁻⁸−1.3417 × 10−50.0076−2.220817,151.7482
2C1.2578 × 10−13−4.8310 × 10−106.8347 × 10⁻⁷−4.2934 × 10−40.1216−17.763066,623.3365
3C3.2235 × 10−12−8.2542 × 10−97.7851 × 10−6−3.2303 × 10−30.6157−59.9607148,414.7651
Disclaimer/Publisher’s Note: The statements, opinions and data contained in all publications are solely those of the individual author(s) and contributor(s) and not of MDPI and/or the editor(s). MDPI and/or the editor(s) disclaim responsibility for any injury to people or property resulting from any ideas, methods, instructions or products referred to in the content.

