Abstract
Lithium-ion batteries prove to be a promising technology for achieving present and future goals regarding energy resources. However, a few cases of lithium-ion battery fires and failures caused by thermal runaway have been reported in various news articles; therefore, it is important to enhance the safety of the batteries and their end users. The early detection of thermal runaway by detecting gases/volatile organic compounds (VOCs) released at the initial stages of thermal runaway can be used as a warning to end users. An interdigitated platinum electrode spin-coated with a sub-micron thick layer of poly(3,4-ethylenedioxythiophene) polystyrene sulfonate (PEDOT: PSS) showed sensitivity for two VOCs (ethyl-methyl carbonate and methyl formate) released from Li-ion batteries during thermal runaway, as well as their binary mixtures at elevated temperatures, which were measured using impedance spectroscopy over a frequency range of 1 MHz to 1 Hz. The sensor response was tested at three different high temperatures (40 °C, 55 °C, and 70 °C) for single analytes and binary mixtures of two VOCs at 5 ppm, 15 ppm, and 30 ppm concentrations. Equivalent electrical parameters were derived from impedance data. A machine learning approach was used to classify the sensor’s response. Classification algorithms classify the sensor’s response at elevated temperatures for different analytes with an accuracy greater than 70%. The success of the reported sensors will enhance battery safety via the early detection of thermal runaway.
1. Introduction
With lithium-ion batteries being employed worldwide, advances since their creation have made them a revolutionary invention [1]. These developments of Li-ion batteries have led to their use in countless portable electronic devices and storage for renewable resources, as well as an ongoing increase in the use of electric vehicles (EVs) [2]. As the common greenhouse gas, carbon dioxide (CO2) increases yearly due to the burning of fossil fuels during transportation and energy generation, renewable resources such as solar and wind energy, in combination with electric vehicles, are becoming increasingly preferable for reducing greenhouse gas emissions [3,4]. Along with the surge in EV usage, concerns for safety and reliability also arise, especially the likelihood of cataclysmic thermal runaway in lithium-ion batteries [5]. With a high demand for safe batteries, application areas of Li-ion batteries other than EVs include in domestic gadgets, military applications, space applications, etc. The multiphase thermal runaway of this scale can occur through multiple means, including short-circuiting, overcharging, overheating, and penetration due to a vehicular collision. The onset of the mechanism of thermal runaway starts with the decomposition of the solid electrolyte interphase (SEI) layer, which typically occurs at 80–120 °C but can occur at temperatures as low as 57 °C. After the decomposition of the SEI, the anode and cathode react with the electrolyte, further increasing the temperature with its continuous reactions. Although the decomposition of the anode and cathode ends, the separator melts at temperatures of 170 °C for a typical polypropylene separator, which leads to internal short circuiting. This internal short circuiting drastically increases the temperature and heat flux, proceeding to possible combustion [6]. The combustion of a lithium-ion battery can lead to a chain reaction in EV battery packs, causing fire and explosions, especially since heat cannot fully escape from large battery packs [2]. Before complete combustion, venting occurs in the battery, allowing gases from the electrolyte decomposition to escape, including potentially toxic vented gases, such as carbon dioxide, carbon monoxide, hydrogen fluoride, and phosphorous oxyfluoride. Along with these toxic gases, volatile organic compounds (VOCs) can also be released, such as propylene carbonate, ethyl methyl carbonate, dimethyl carbonate, diethyl carbonate, methyl formate, and fluorinated hydrocarbons [7,8]. The venting of these VOCs occurs at approximately 60 °C, which is below the average point at which thermal runaway is initiated [7]. To prevent this, gas sensing can be utilized in order to avoid the high temperatures at which thermal runaway occurs, therefore entirely preventing thermal runaway and its impact. Wenger et al. have already demonstrated the detection of VOCs, from lithium-ion batteries, shortly after the temperature limit of 60 °C, using a MEMS MOS gas sensor [9]. Their work also demonstrates how such sensors can be equipped in battery management systems (BMS), such as those already used in EVs [2,9]. Other research specifically focused on preventing gas leaks with the use of metal oxides, which have also been used to detect thermal runaway by venting carbon dioxide [10,11], carbon monoxide, propane, methane [11,12,13], and various VOCs [11,12,14]. The difficulty that often comes with metal oxide gas sensors is their high temperature (>200 °C) requirements during sensing [15], which are counterintuitive to the application of this sensor in the prevention of thermal runaway. Contrary to metal oxides, conductive polymers have gas-sensing abilities at room temperature [16,17,18,19], which make them much more suitable for thermal runaway detection, particularly for LIBs.
In this study, previous research [20,21] is expanded upon using the conductive polymer poly(3,4-ethylenedioxythiophene) polystyrene sulfonate (PEDOT: PSS) as a gas-sensing material for the detection of two VOCs at higher temperatures to further understand the sensing properties of this polymer. PEDOT: PSS is chosen as the sensing material because of its stability at high temperatures (up to 120 °C) [22]. Other properties supporting the candidature of PEDOT: PSS as the sensing material include tunability, compatibility with miniaturization, low power consumption, fast response and recovery time, and ease of fabrication [19,23]. In this study, sensing evaluates the effects of temperature on the sensitivity of PEDOT: PSS towards three different concentrations (5 ppm, 15 ppm, and 30 ppm) of ethyl methyl carbonate (EMC), methyl formate (MF), and three binary mixtures of EMC and MF. Previous research was performed using ethanol as a baseline in order to verify the sensitivity of the material toward VOCs in general, and then this research was expanded to other VOCs specifically found in battery venting. The reported sensor showed an abrupt response of 6 s to EMC and a 159 s response to MF at a frequency of 100 kHz. Electrochemical impedance spectroscopy (EIS) is used as the detection method over a frequency range from 1 Hz to 1 MHz because of its multidimensional response. Unlike conventional gas sensors that rely solely on changes in resistance, impedance spectroscopy provides a more comprehensive view by examining the complex impedance of the sensor material across a range of frequencies. This approach allows for the simultaneous detection and differentiation of multiple gases and their concentration levels. By analyzing the frequency-dependent response of the sensor, researchers can extract valuable information about gas interactions, kinetics, and even the chemical composition of the gas mixture [24,25,26,27]. This versatility makes impedance spectroscopy a valuable tool for applications ranging from environmental monitoring and industrial safety to medical diagnostics, where the need to detect and identify multiple gases in real-time is of paramount importance. Furthermore, its non-invasive nature and potential for miniaturization make it an attractive choice for the development of compact and efficient multi-variable gas-sensing devices for a wide range of applications. Impedance data were used to complete equivalent electrical circuits in unary and binary circumstances to further understand the relationships between sensing materials. With this relationship, the sensing capabilities for the battery venting conditions that occur around 60 °C can be predicted more feasibly since the sensing conditions test reaches 70 °C. These tests further confirm the known viability of PEDOT: PSS, as a candidate for safety response combined with battery management systems within EVs, to accurately and dependably detect the venting of VOCs and allow for the prevention of thermal runaway. Furthermore, to differentiate between different classes of analytes, multivariate data analysis methods were employed.
2. Materials and Methods
The sensor was prepared by using dry, re-dispersible pellets of PEDOT: PSS purchased from Sigma Aldrich, St. Louis, MO, USA without additional purification [21]. Then, 1 wt.% solution of PEDOT: PSS was prepared using Millipore water. In the next step, ethanol (200 proof), purchased from KOPTEC, Decon labs, King of Prussia, PA, USA was added to the 1 wt.% solution of PEDOT: PSS and stirred under sonication for 15 min to obtain a homogeneous 0.3 wt.% solution. Then, 10 ul of prepared solution was spin-coated on an interdigitated platinum electrode (size: 5 mm × 5 mm, purchased from Case western university, Cleveland, MI, USA) at a speed of 4000 rpm. The coating process was repeated for a second layer on the substrate. The sensor preparation flow chart is provided in Figure S1.
Two VOCs and their binary mixtures were chosen as the analyte to test the sensor response at high temperatures (40 °C, 55 °C, and 70 °C): ethyl methyl carbonate (EMC) and methyl formate (MF). The three concentrations of the selected VOCs are 5 ppm, 15 ppm, and 30 ppm. Table 1 lists the subsumed individual analytes with their respective concentrations in each binary mixture. The concentration of the VOCs was calculated using equations given below:
where P is the vapor pressure (kPa), is the enthalpy of vaporization (kJ/mol), R is the gas constant (J/K.mol), and T is the temperature (K).

Table 1.
List of binary mixtures with subsumed analytes.
Concentration of the analyte was calculated using Equations (2) and (3) [21].
where is the vapor pressure (kPa), R the gas constant (J/K.mol), T the temperature (K), M the molecular weight (g/mol), and the density (g/mL).
The sensor was placed inside a 25 mL three-neck round-bottom flask. One opening of the flask holds the sensor, the second opening holds the thermometer to continuously monitor the temperature inside the flask (closed with a septum), and the third opening is closed and purged with nitrogen after each experiment. The temperature inside the chamber was maintained using an oil bath method [28], for which mineral oil was used. Figure 1 shows the experimental setup of the sensor testing. For testing the VOCs using PEDOT: PSS sensor (Sigma-Aldrich, St. Louis, MO, USA and Case Western Reserve University, Cleveland, OH, USA), a specified concentration of analyte was collected from the headspace of a 5 mL autosampler vial and inserted into the chamber using a gas tight syringe. To prepare the binary mixture, two respective concentrations were injected inside the chamber, and the environment inside a chamber was homogenized using a magnetic spinner at 500 rpm for 10 s. The response of the sensor was recorded using a Gamry Reference 600+ potentiostat in a frequency range from 1 Hz to 1 MHz. Each experiment was repeated three times, and in each experiment, five consecutive readings were taken at intervals of five minutes. The chamber was purged five minutes after each experiment using nitrogen.
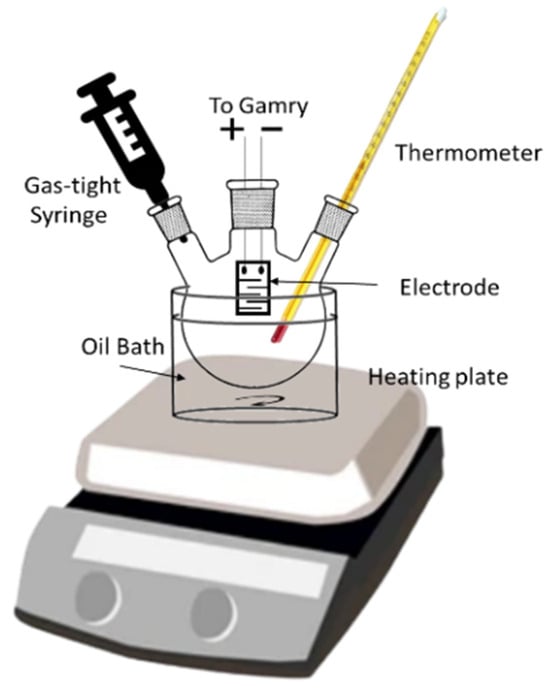
Figure 1.
Experimental setup of testing PEDOT: PSS sensor response to VOCs at high temperatures.
The impedance response of the PEDOT: PSS sensor for different analytes at different temperatures was graphically visualized using Nyquist plot. The sensor’s impedance response was further analyzed using Gamry echem analyst software version 7.8 to obtain an equivalent electrical circuit, and Python was used for multivariate analysis of the data. Discrimination among data was visualized using the principal component analysis (PCA) method. The supervised machine learning method, which employs the Support Vector Machine algorithm (SVM), was used for the classification of data in a different group.
3. Results and Discussion
3.1. Impedance Data Analysis
Figure 2 shows the impedance response of the sensor for two different VOCs (15 ppm of EMC and 15 ppm of MF) and their binary mixtures at three different temperatures (40 °C, 55 °C, and 70 °C) as a Nyquist plot. The impedance responses of 5 ppm and 30 ppm for EMC and MF at three different temperatures are shown in Figure S2. Impedance data were collected over a frequency range from 1 Hz to 1 MHz and decrease from left to right on the Nyquist plot. An open circuit voltage of 10mV was applied to obtain the impedance response of the sensor over the specified frequency range. The observed current flow was in microamperes. The horizontal axis of the Nyquist plot describes real impedance, while the vertical axis describes negative imaginary impedance only in the case of a capacitive element present along with a resistive element. In this case, impedance response lies in the fourth quadrant of the Nyquist plot. High temperatures decrease the percentage of humidity, thus reducing the impact of humidity on sensor. Additionally, purging the chamber with nitrogen decreases the humidity by up to 10%. In the case of analyte injection, a significant change in impedance is observed with respect to concentration. The observed change indicates the increase in the impedance of the sensor while interacting with the analyte. The change in the impedance of the sensor upon interaction with the analytes depends on the adsorption/desorption sensing phenomenon. However, the change in impedance at a similar concentration of specific analyte decreases with the increasing temperature. The inverse relationship between the rate of change in impedance and temperature can be explained by the inverse relationship between temperature and the number of molecules adsorbed on the surface of sensing material [29]. Adsorption is an exothermic process. Hence, as per Le Chatelier’s principal, at a standard pressure, a low temperature increases adsorption. In contrast, with the increase in temperature, adsorbed molecules are removed. In other words, with the increase in temperature, the number of molecules adsorbed on the surface of the sensing material decreases, decreasing the rate of change in impedance. However, there is significant change in impedance at the highest temperature of 70 °C. A decrease in the impedance at baseline is observed with the increasing temperature. A plausible explanation for such a phenomenon could be a decrease in humidity.
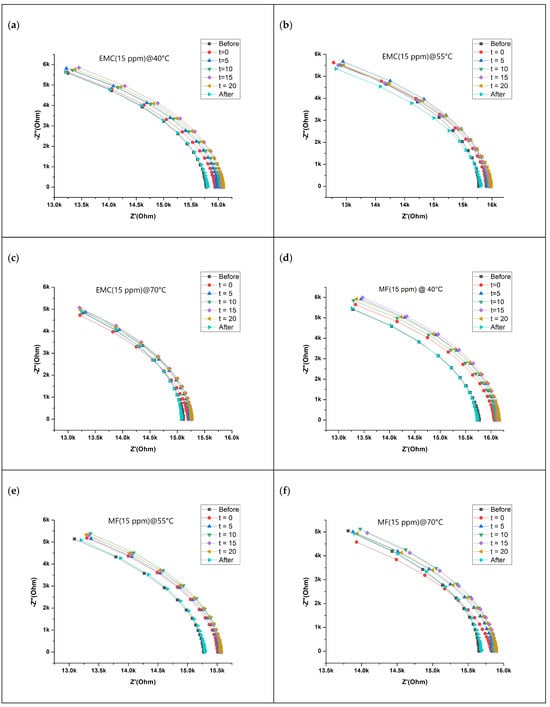
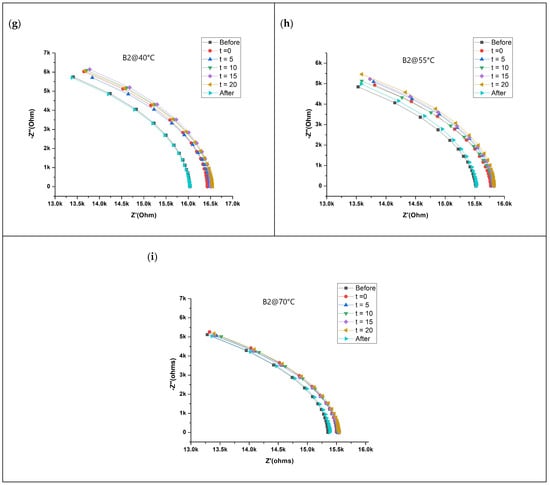
Figure 2.
Nyquist plot of impedance response of the sensor to VOCs: (a–c) EMC (15 ppm), (d–f) MF (15 ppm), and (g–i) binary mixture B2 at three different temperatures.
Figure 3 shows the equivalent electrical circuit derived from the impedance response of the sensor to different analytes. The derived equivalent electrical circuit is a parallel combination of charge transfer resistance (Rct) and constant phase element (Q) with a goodness of fit value <10−5. In the impedance response of the RQ or RC circuit, real impedance is positive and imaginary impedance is negative since current surpasses the voltage by 90°. The Nyquist plot shown in Figure 2 uses impedance data values derived from the equivalent circuit. A similar convergence was obtained for all fits. The derived equivalent circuit is best described in Equation (4):
where Z is total impedance and ω represents angular frequency. Here, RCT is the charge transfer resistance. This represents electron impedance with the small applied potential perturbation of 10 mV [30], as given in Equation (5):
where R is the universal gas constant, T is the temperature, η is the activation overpotential, and i0 is the exchange current density (A/m2). i0 represents the intrinsic rates of electron transfer between an analyte and the electrode, hence impacting charge transfer resistance. Pseudolinear behavior of the sensor is obtained by selecting a small applied perturbation (10 mV). The constant phase element (Q) impedance represents the capacitive charge storage of the electric double layer and is best described by Equation (6) [31].
Figure 3.
Equivalent electrical circuit derived from the impedance response of the sensor with a frequency range from 1 Hz to 1 MHz.
Here, Q0 is the admittance and n is the exponent with a value between 0 and 1, where 1 represents an ideal capacitor and 0 represents the pure resistor. The obtained value of n for the derived circuit is greater than 0.95, equivalent to the value obtained for the sensor response under room temperature conditions. This value indicates the pseudo capacitive behavior of the sensor. Elements like molecular weight and double bonds in the molecules of the analytes play significant roles in the sensing mechanism as these properties hinder the adsorption phenomenon.
3.2. Multivariate Data Analysis
Equivalent electrical circuit parameters do not have enough information for the classification of multi-analytes; therefore, multivariate data analysis tools play a decisive role, specifically with regard to datasets with large numbers of features. Electrochemical impedance spectroscopy data can be used as a multivariable dataset recorded within a range of frequencies. Here, a frequency range from 1 Hz to 1 MHz was used to collect the EIS response of the PEDOT: PSS sensor with a total of 61 frequencies. At each frequency, real impedance and imaginary impedance were recorded individually, with 122 independent variables (features) in total. The rate of change in impedance for each analyte at different temperatures was used as the sample value. The rate of change in impedance was calculated by subtracting the impedance response of the sensor in the presence of nitrogen from the impedance response of the sensor in the presence of an analyte at a specific frequency. Next, the PCA method was used to visualize and discriminate the sensor response of a single analyte with the same concentration at different temperatures. Figure 4 shows the PCA of three concentrations of EMC, three concentrations of MF, and three binary mixtures with different temperatures as a category at time (t) = 20 min. The impedance response of the sensor at t = 20 min was chosen as the sensor response saturates [21]. Principal Component Analysis (PCA) is a dimensionality reduction technique used in statistics and machine learning to extract the most important information from a dataset while minimizing information loss [32]. This is achieved by transforming the original features into a new set of orthogonal variables called principal components (PCs). These components are ordered in terms of their variance, with the first principal component capturing the most variance and each subsequent component capturing progressively less variance. PCs are the orthogonal vectors describing the variance of the data in p space, while reducing the n-dimensional dataset into the p-dimensional dataset. In Figure 4, two PCs describe more than 60% of the total explained variance of the original dataset with 122 features. From the visual inspection of the PCA, the sensor response is classified into different categories based on the temperature of the sensor environment. Although there is less discrimination in low concentrations of MF (5 ppm and 15 ppm), EMC (5 ppm), and binary (B3), it is probable that the third PCs may help in discrimination among these samples. To verify the classification of samples in different categories, an SVM classifier was used to classify data into respective classes or categories based on concentration and temperature.
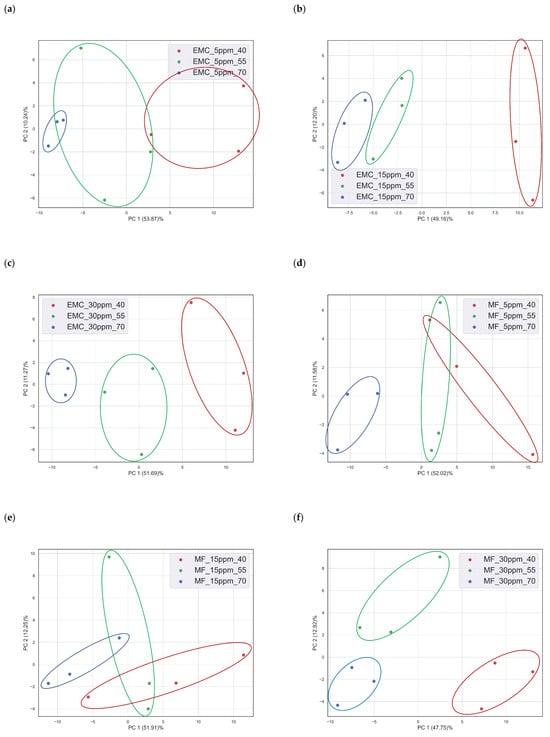
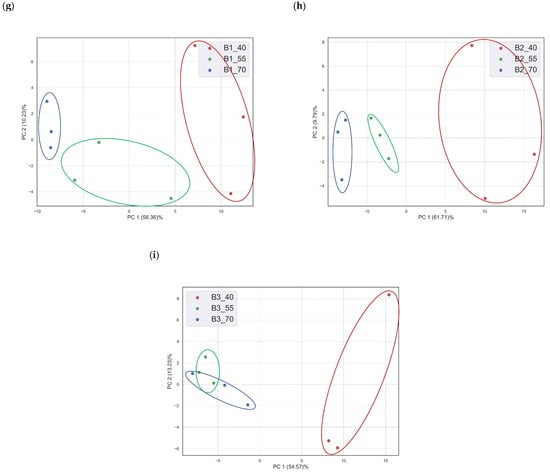
Figure 4.
PCA of different concentrations of two VOCs and binary mixtures at different temperatures: (a) EMC (5 ppm), (b) EMC (15 ppm), (c) EMC (30 ppm), (d) MF (5 ppm), (e) MF (15 ppm), (f) MF (30 ppm), (g) B1, (h) B2, and (i) (B3).
SVM classifier is a supervised learning method used for classification or regression. It is used for linear as well as non-linear data [33]. A Support Vector Machine (SVM) is a powerful supervised machine learning algorithm used primarily for classification tasks. It operates by finding the optimal hyperplane that best separates data points belonging to different classes within a dataset. The key innovation of SVM is its ability to maximize the margin, which is the distance between the hyperplane and the nearest data points from each class, ensuring robust generalization to new, unseen data. SVM can handle both linearly separable and non-linearly separable data through the use of different kernel functions, such as polynomial, radial basis function (RBF), and sigmoid kernels. By effectively transforming data into higher-dimensional spaces, SVM can handle complex decision boundaries and achieve a high classification accuracy. Here, we used the EIS dataset with 122 independent variables and a total of 25 samples for each class. The used sample data were for the rate of change in impedance at five consecutive readings taken at intervals of five minutes. Each dataset was divided into a training dataset (60%) and a test dataset (40%). Initially, training data were standardized using a standard scalar method to obtain data with univariate means, followed by a grid search method for hyperparameter tuning. The samples were categorized based on the environmental temperature for a specific concentration, as well as the concentration of an analyte at a specific temperature. The classifier was trained using the training dataset, and the test dataset was used for the prediction of different classes. Table 2 lists the classification parameters for evaluating the performance of the classifier. The lowest observed accuracy was 72.22% for the classification of nine classes, including three different concentrations at three different temperatures. The highest classification of 100% was achieved for the classification of MF (15 ppm) at three different temperatures, binary mixture B1, and binary mixture B2, with a total of three classes in each dataset. Accuracy is the percentage of correct classifications of analytes. Other parameters like cross-validation (CV), Mathew’s correlation coefficient (MCC), F1-score value, and area under the curve (AUC)–receiver operating curve (ROC) value validate the performance of the classifier [34]. A CV tests the performance of the classification by portioning the complete datasets in multiple datasets known as folds. In the next step, different combinations of folds were used as test and training datasets to evaluate the performance of the classification model. The aim of the CV test was to estimate the performance of the algorithm on unseen data and minimize the probability of overfitting and underfitting. In the given dataset, a CV with three folds was performed. MCC or the phi coefficient is specifically used for the binary classification of imbalanced classes. The MCC value lies in the range from −1 to +1, where −1 indicates the worst performance of the classifier and +1 indicates the best performance of the classifier. In the applied algorithm, the MCC value was calculated using a one vs. rest method. Another metric that measures the performance of the classification algorithm is F1-score. F1-score is helpful when both precision and recall need to be considered since it balances the trade-off between these two factors. One of the most important parameters determining the performance of the classification model is the receiver operating curve (ROC), which is a graphical representation employed to evaluate the binary classification model’s performance. Here, we obtain the AUC-ROC value of the ROC, a scale value that quantifies the model performance, where a value equal to 1 indicates the best performance of the model and value equal to or less than 0.5 indicates a performance no better than random choices.
Table 2.
Classification parameters of SVM classifier.
Figure 5 describes the normalized confusion matrix, another method to evaluate the performance of the classifier and summarize it visually. A confusion matrix is a fundamental tool in the field of machine learning and statistics used for assessing the performance of classification models, such as those used in binary or multiclass classification tasks. It provides a tabular representation of a model’s predictions compared to the actual ground truth values. The confusion matrix is particularly useful for understanding the types and quantities of errors that a classification model makes. By using a confusion matrix, the classification accuracy of each class in a specific dataset can be observed. A binary mixture (B1) at 55 °C has the lowest accuracy, which is predicted as B1 at 40 °C, B2 at 40 °C, and B2 at 70 °C. Such true negative or false positive predictions could be due to the noise in data or time variables, as the data were taken over a time interval of twenty-five minutes. Many other classes, even at a temperature of 70 °C, have a 100% true positive prediction rate, verifying the good sensitivity of the sensor at high temperatures.
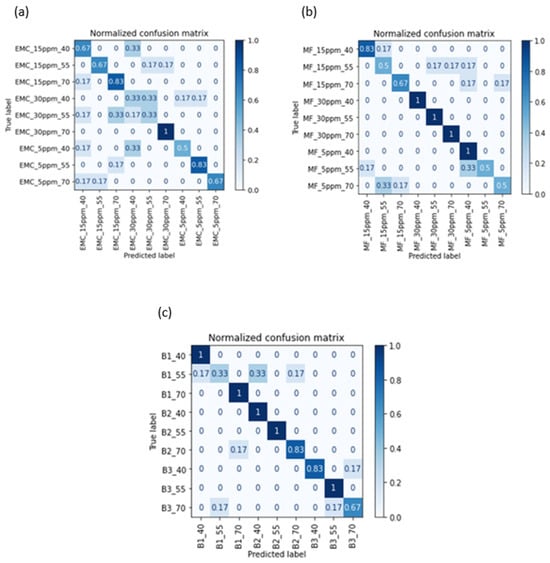
Figure 5.
Confusion matrix for the classification of different analytes: (a) EMC, (b) MF, and (c) binary mixtures.
The application of a machine learning algorithm in battery management systems (BMS) for the classification or prediction of vented gases/VOCs from Li-ion batteries during thermal runaway is an advantageous tool to ensure the safety of battery-dependent gadgets and electric vehicles.
4. Conclusions
An interdigitated platinum electrode with spin-coated PEDOT: PSS was used for the detection of two VOCs, namely EMC and MF, at three different temperatures: 40 °C, 55 °C, and 70 °C. The sensor displayed a significant response to the analytes in terms of impedance data collected in the range from 1 Hz to 1 MHz. The derived equivalent electrical circuit indicates the presence of charge transfer resistance and constant phase element as the major elements contributing to the sensor’s sensitivity. The aid of impedance spectroscopy in sensing applications enhances the performance of multivariable sensors as different factors have significant effects at different frequencies. The obtained results show that PEDOT: PSS-based sensors have the potential to be used as sensors for ensuring battery safety. They can generate early warnings of thermal runaway by detecting VOCs released at high temperatures (up to 70 °C). However, there is a lack of prediction accuracy for a few samples, and thus an improvement in sensors or sensing material is required. Sensors showed a significant difference in the rate of change in impedance for different concentrations at the same temperature as well as the same concentration of a particular analyte at different temperatures. Impedance data at high temperatures show the equivalent electrical circuit as the impedance data under room temperature conditions. It indicates that temperatures have no significant effect on the physical properties of the reported PEDOT: PSS sensor. Using a machine learning method (SVM classifier), maximum and minimum accuracies of 100% and 72%, respectively, were obtained for multivariate data in the classification. In future research, modifying the chemistry of the sensing material (PEDOT:PSS) may tackle issues like selectivity and accuracy. The improved chemistry may include PEDOT:PSS composites with nanomaterials/graphene/metal oxides. Safer batteries play a crucial role in maintaining a safe, clean, and green environment. The application of a gas/VOC sensor in a battery management system sets the stage for safe batteries capable of the early detection of thermal runaway.
Supplementary Materials
The following supporting information can be downloaded at: https://www.mdpi.com/article/10.3390/batteries9120562/s1, Figure S1: Sensor Preparation Methodology; Figure S2: Nyquist Plot of impedance response of the sensor to VOCs (a–c) EMC (5 ppm), (d–f) EMC 30 ppm, (g–i) MF 5 ppm, (j–l) MF 30 ppm, (m–o) binary mixture (B1), and (p–r) binary mixture (B3) at three different temperatures (40 °C, 55 °C, and 70 °C), respectively.
Author Contributions
Conceptualization, P.K. and V.G.P.; methodology, P.K., S.B., V.G.P. and A.P.B.; software, P.K.; validation, P.K. and V.G.P.; formal analysis, P.K.; investigation, P.K. and I.K.S.; resources, V.G.P.; data curation, P.K. and S.B.; writing—original draft preparation, P.K.; writing—review and editing, S.B., V.G.P. and A.P.B.; visualization, P.K.; supervision, S.B., V.G.P. and A.P.B.; project administration, V.G.P.; funding acquisition, V.G.P. All authors have read and agreed to the published version of the manuscript.
Funding
This research received no external funding.
Informed Consent Statement
Not applicable.
Data Availability Statement
The data presented in this study are available on request from the corresponding author. The data are not publicly available as data is still under research.
Conflicts of Interest
The authors declare no conflict of interest.
References
- The Nobel Prize in Chemistry 2019. Available online: https://www.nobelprize.org/prizes/chemistry/2019/summary/ (accessed on 3 October 2023).
- Verma, J.; Kumar, D. Metal-Ion Batteries for Electric Vehicles: Current State of the Technology, Issues and Future Perspectives. Nanoscale Adv. 2021, 3, 3384–3394. [Google Scholar] [CrossRef]
- Benefits of Electric Cars on Environment|EV & Petrol Cars|EDF. Available online: https://www.edfenergy.com/energywise/electric-cars-and-environment (accessed on 4 October 2023).
- Carbon Dioxide Peaks near 420 Parts per Million at Mauna Loa Observatory—NOAA Research. Available online: https://research.noaa.gov/2021/06/07/coronavirus-response-barely-slows-rising-carbon-dioxide/ (accessed on 4 October 2023).
- Arora, S. Selection of Thermal Management System for Modular Battery Packs of Electric Vehicles: A Review of Existing and Emerging Technologies. J. Power Sources 2018, 400, 621–640. [Google Scholar] [CrossRef]
- Feng, X.; Ouyang, M.; Liu, X.; Lu, L.; Xia, Y.; He, X. Thermal Runaway Mechanism of Lithium Ion Battery for Electric Vehicles: A Review. Energy Storage Mater. 2018, 10, 246–267. [Google Scholar] [CrossRef]
- Fernandes, Y.; Bry, A.; de Persis, S. Identification and Quantification of Gases Emitted during Abuse Tests by Overcharge of a Commercial Li-Ion Battery. J. Power Sources 2018, 389, 106–119. [Google Scholar] [CrossRef]
- Sturk, D.; Rosell, L.; Blomqvist, P.; Tidblad, A.A. Analysis of Li-Ion Battery Gases Vented in an Inert Atmosphere Thermal Test Chamber. Batteries 2019, 5, 61. [Google Scholar] [CrossRef]
- Wenger, M.; Waller, R.; Lorentz, V.R.H.; März, M.; Herold, M. Investigation of Gas Sensing in Large Lithium-Ion Battery Systems for Early Fault Detection and Safety Improvement. In Proceedings of the IECON 2014—40th Annual Conference of the IEEE Industrial Electronics Society, Dallas, TX, USA, 29 October–1 November 2014; pp. 5654–5659. [Google Scholar]
- Cai, T.; Valecha, P.; Tran, V.; Engle, B.; Stefanopoulou, A.; Siegel, J. Detection of Li-Ion Battery Failure and Venting with Carbon Dioxide Sensors. eTransportation 2021, 7, 100100. [Google Scholar] [CrossRef]
- Essl, C.; Seifert, L.; Rabe, M.; Fuchs, A. Early Detection of Failing Automotive Batteries Using Gas Sensors. Batteries 2021, 7, 25. [Google Scholar] [CrossRef]
- Koch, S.; Birke, K.P.; Kuhn, R. Fast Thermal Runaway Detection for Lithium-Ion Cells in Large Scale Traction Batteries. Batteries 2018, 4, 16. [Google Scholar] [CrossRef]
- Mateev, V.; Marinova, I.; Kartunov, Z. Gas Leakage Source Detection for Li-Ion Batteries by Distributed Sensor Array. Sensors 2019, 19, 2900. [Google Scholar] [CrossRef]
- Hill, D.; Gully, B.; Agarwal, A.; Nourai, A.; Thrun, L.; Swartz, S.; Koslowske, M.; Cummings, S.; Butkowski, J.; Moore, B.; et al. Detection of Off Gassing from Li-Ion Batteries. In Proceedings of the 2013 IEEE Energytech, Cleveland, OH, USA, 21–23 May 2013; pp. 1–7. [Google Scholar]
- Dhall, S.; Mehta, B.R.; Tyagi, A.K.; Sood, K. A Review on Environmental Gas Sensors: Materials and Technologies. Sens. Int. 2021, 2, 100116. [Google Scholar] [CrossRef]
- Kaur, P.; Bagchi, S.; Bhondekar, A.P. Impedimetric Study of Poly-Butyl Thiophenebased Sensor for Detection of VOCs and Mixtures. In Proceedings of the 2023 IEEE Applied Sensing Conference (APSCON), Bengaluru, India, 23–25 January 2023; pp. 1–3. [Google Scholar]
- Kaur, P.; Bagchi, S.; Bhondekar, A.P. Impedimetric Study of Polypyrrole Coated Zinc Oxide Fibers for Ammonia Detection. In Proceedings of the 2019 6th International Conference on Signal Processing and Integrated Networks (SPIN), Noida, India, 7–8 March 2019; Volume 1, pp. 613–616. [Google Scholar]
- Miah, M.R.; Yang, M.; Khandaker, S.; Bashar, M.M.; Alsukaibi, A.K.D.; Hassan, H.M.A.; Znad, H.; Awual, M.R. Polypyrrole-Based Sensors for Volatile Organic Compounds (VOCs) Sensing and Capturing: A Comprehensive Review. Sens. Actuators A Phys. 2022, 347, 113933. [Google Scholar] [CrossRef]
- Gao, N.; Yu, J.; Tian, Q.; Shi, J.; Zhang, M.; Chen, S.; Zang, L. Application of Pedot:Pss and Its Composites in Electrochemical and Electronic Chemosensors. Chemosensors 2021, 9, 79. [Google Scholar] [CrossRef]
- Kaur, P.; Bagchi, S.; Pol, V.G.; Bhondekar, A.P. Early Detection of Mixed Volatile Organic Compounds to Circumvent Calamitous Li-Ion Battery Thermal Runaway. J. Phys. Chem. C 2023, 127, 8373–8382. [Google Scholar] [CrossRef]
- Kaur, P.; Bagchi, S.; Gribble, D.; Pol, V.G.; Bhondekar, A.P. Impedimetric Chemosensing of Volatile Organic Compounds Released from Li-Ion Batteries. ACS Sens. 2022, 7, 674–682. [Google Scholar] [CrossRef]
- Hokazono, M.; Anno, H.; Toshima, N. Thermoelectric Properties and Thermal Stability of PEDOT:PSS Films on a Polyimide Substrate and Application in Flexible Energy Conversion Devices. J. Electron. Mater. 2014, 43, 2196–2201. [Google Scholar] [CrossRef]
- Hakimi, M.; Salehi, A.; Boroumand, F.A. Fabrication and Characterization of an Ammonia Gas Sensor Based on PEDOT-PSS With N-Doped Graphene Quantum Dots Dopant. IEEE Sens. J. 2016, 16, 6149–6154. [Google Scholar] [CrossRef]
- Vaghela, C.; Kulkarni, M.; Haram, S.; Karve, M.; Aiyer, R. Biopolymer-Polyaniline Composite for a Wide Range Ammonia Gas Sensor. IEEE Sens. J. 2016, 16, 4318–4325. [Google Scholar] [CrossRef]
- Cai, H.; Xu, Y.; He, P.-G.; Fang, Y.-Z. Indicator Free DNA Hybridization Detection by Impedance Measurement Based on the DNA-Doped Conducting Polymer Film Formed on the Carbon Nanotube Modified Electrode. Electroanalysis 2003, 15, 1864–1870. [Google Scholar] [CrossRef]
- Potyrailo, R.A.; Go, S.; Sexton, D.; Li, X.; Alkadi, N.; Kolmakov, A.; Amm, B.; St-Pierre, R.; Scherer, B.; Nayeri, M.; et al. Extraordinary Performance of Semiconducting Metal Oxide Gas Sensors Using Dielectric Excitation. Nat. Electron. 2020, 3, 280–289. [Google Scholar] [CrossRef]
- Aberg, P.; Geladi, P.; Nicander, I.; Hansson, J.; Holmgren, U.; Ollmar, S. Non-Invasive and Microinvasive Electrical Impedance Spectra of Skin Cancer—A Comparison between Two Techniques. Ski. Res. Technol. 2005, 11, 281–286. [Google Scholar] [CrossRef] [PubMed]
- 4H: Water, Sand, and Oil Baths-Chemistry LibreTexts. Available online: https://chem.libretexts.org/Bookshelves/Organic_Chemistry/Organic_Chemistry_Lab_Techniques_(Nichols)/01%3A_General_Techniques/1.04%3A_Heating_and_Cooling_Methods/1.4H%3A_Water_Sand_and_Oil_Baths (accessed on 22 July 2022).
- Jakubov, T.S.; Kabanova, O.N.; Serpinsky, V.V. Temperature Dependence of Adsorption. J. Colloid Interface Sci. 1981, 79, 170–177. [Google Scholar] [CrossRef]
- Orazem, M.E.; Tribollet, B. Electrochemical Impedance Spectroscopy; John Wiley & Sons: New York, NY, USA, 2008; ISBN 9780470041406. [Google Scholar]
- Kochowski, S.; Nitsch, K. Description of the Frequency Behaviour of Metal–SiO2–GaAs Structure Characteristics by Electrical Equivalent Circuit with Constant Phase Element. Thin Solid Film. 2002, 415, 133–137. [Google Scholar] [CrossRef]
- Jollife, I.T.; Cadima, J. Principal Component Analysis: A Review and Recent Developments. Philos. Trans. R. Soc. A 2016, 374, 20150202. [Google Scholar] [CrossRef]
- Wilson, M.D. Support Vector Machines. Encycl. Ecol. Five-Vol. Set 2008, 13, 3431–3437. [Google Scholar] [CrossRef]
- Singh, P.; Singh, N.; Singh, K.K.; Singh, A. Diagnosing of Disease Using Machine Learning. Mach. Learn. Internet Med. Things Healthc. 2021, 1, 89–111. [Google Scholar] [CrossRef]
Disclaimer/Publisher’s Note: The statements, opinions and data contained in all publications are solely those of the individual author(s) and contributor(s) and not of MDPI and/or the editor(s). MDPI and/or the editor(s) disclaim responsibility for any injury to people or property resulting from any ideas, methods, instructions or products referred to in the content. |
© 2023 by the authors. Licensee MDPI, Basel, Switzerland. This article is an open access article distributed under the terms and conditions of the Creative Commons Attribution (CC BY) license (https://creativecommons.org/licenses/by/4.0/).