Article

A Numerical and Experimental Investigation on a Gravity-Assisted Heat-Pipe-Based Battery Thermal Management System for a Cylindrical Battery

1
School of Mechanical Engineering Sciences, University of Surrey, Guildford GU2 7XH, UK
2
School of Mechanical Engineering, University of Leeds, Leeds LS2 9JT, UK
*
Author to whom correspondence should be addressed.
Batteries 2023, 9(9), 456; https://doi.org/10.3390/batteries9090456
Submission received: 3 August 2023 / Revised: 23 August 2023 / Accepted: 29 August 2023 / Published: 5 September 2023
(This article belongs to the Special Issue Advances in Thermal Management for Batteries)

Abstract

:
A thermal management system for lithium-ion batteries is an essential requirement for electric vehicle operation due to the large amount of heat generated by these cylindrical batteries during fast charging/discharging. Previously, researchers have focused mostly on pouch and prismatic cells with heat pipes arranged in the horizontal direction. The current study introduces a novel vertically-oriented heat-pipe-based hybrid cooling battery thermal management system (BTMS) that numerically evaluates the thermal performance of the cylindrical batteries and the flow pattern within the cooling channel at C rates as high as 8C. The model was experimentally validated using five round heat pipes in a vertical orientation utilizing the effect of gravity to assist condensate flow through the heat pipe. The heat pipes were arranged in a staggered pattern to improve the overall heat transfer performance by means of forced convective cooling. This design allowed for maximizing the heat transfer process despite the lack of contact between the cylindrical-shaped batteries and round-shaped heat pipes. During this study, the temperatures of the evaporator end and the condenser end of the heat pipes and battery surfaces were monitored, and the thermal performances of the system were determined at varying inlet cooling liquid temperatures (15, 20, 25 °C) and high rates of 4C and 8C. Representatively, the proposed hybrid BTMS could maintain a maximum battery surface temperature of around 64 °C and a temperature difference between cells under 2.5 °C when the inlet velocity was 0.33 L/min and the cooling liquid temperature was 25 °C. The high temperatures reached the fourth and fifth heat pipes because they are part of the backflow design and are affected by backflow temperature. Nevertheless, the current design shows that the proposed system can maintain battery surface temperatures well within 5 °C.

1. Introduction

Over the past two decades, the automobile industry has undergone a significant transformation from internal combustion engines (ICEs) to electric vehicles (EVs). Even though EV sales were 120,000 cars in 2012, a similar number of cars were sold every week in the last year around the world [1]. EVs are becoming more popular due to their technological improvements, environmental advantages, and support from government policies. Nowadays, governments are incentivizing the adoption of EVs with subsidies and other incentives, which will likely accelerate the transition from ICEs to EVs in the coming years [2]. As electric vehicles have developed, rechargeable batteries, particularly lithium-ion batteries, have become the most popular choice for the automobile industry. Lithium-ion batteries are lightweight, durable, have a low self-discharge rate, and offer a long range. They also have a relatively short recharge time of around 15 min to 1 h, depending on the size and power output of the battery, compared to nickel–metal batteries, making them ideal for electric vehicles [3]. Despite having these advantages, these batteries produce a large amount of heat during high C rates, around 9 W for a 26,650 cylindrical battery at 8C [4], resulting in a sharp temperature increase that negatively impacts the performance of batteries. In order to overcome the temperature rise of the battery due to high heat generation rates, BTMS is a vital requirement for electric vehicles to regulate the entire battery pack’s operating temperature at its optimal level.
In general, there are two primary requirements of a BTMS: maintaining a battery surface temperature between 20 and 40 °C and a temperature difference of no more than 5 °C between the batteries in the battery pack [5]. A battery that operates within the stated operating temperature ranges performs efficiently and functions longer. In order to achieve the two tasks, different battery thermal management systems have been developed and proposed. There are six main types of BTMS cooling systems that have already been investigated by various researchers for electric vehicles. These are air [6], liquid [7], heat pipe (HP) [8], phase-change material (PCM) [9], and immersion cooling [10], as well as hybrid cooling systems [11], which combine two of these cooling structures.
An air-cooling system is a common type of thermal management system applied in battery packs that is not expensive or complex [12]. However, air cooling has a low convection heat transfer coefficient, which makes it inefficient for achieving a high heat dissipation rate [13]. By replacing air cooling with liquid cooling, the drawbacks of air cooling can be overcome, as liquid cooling is capable of high heat transfer rates [14]. However, in most liquid cooling systems, the liquid cooling channels are located within the battery pack, which may result in leaks and short circuits [15]. A new cooling method in BTMS is immersion cooling, in which the battery is cooled by dielectric liquid directly touching all surfaces. Although some studies have already been conducted [10], the current method is a new field and has not been widely developed. Another method is thermoelectric cooling, which is considered as effective, but this is complex and cannot stand alone in a battery pack. PCM can maintain a uniform temperature throughout the battery pack [16]. This can be particularly helpful in keeping batteries warm during a short stop in sub-zero weather conditions. Despite uniformity, PCM’s low thermal conductivity prevents it from being used as the primary cooling system for BTMSs. Furthermore, the phase-change process alters the volume of the PCM, which limits its application in electric vehicles. Alternatively, researchers have attempted to enhance thermal conductivity through combining PCM with metal [17], fins [18], and heat pipes [19], as well as graphite [20].
Heat-pipe-based BTMSs have several advantages over traditional cooling methods, including air and liquid cooling. They require less maintenance, are lightweight, have a long lifespan, and have high thermal conductivity [21]. Additionally, the heat pipe is capable of transferring a significant amount of heat in a short period of time, even at minimal temperature ranges, and it is passive in nature, so it does not require any power to operate. However, it is worth noting that the application of heat pipes in BTMS is mostly integrated with other traditional cooling systems, which can be a negative aspect of heat pipes, resulting in a hybrid cooling system. Moreover, the contact surface area between a heat pipe’s evaporation section and a battery is a tremendous issue for heat transfer from batteries to heat pipes, which needs to be further investigated [22]. The condenser side mainly relies on increasing the heat transfer area by adding fins and on liquid flow patterns to enhance the heat transfer coefficient depending on the combined air or liquid cooling methods. Furthermore, only the condenser end of the heat pipe is integrated with traditional cooling methods, while the evaporation section is designed to accommodate the various shapes of batteries, including prismatic and cylindrical batteries. Ye et al. [23] numerically studied adding fins to the condenser side of heat pipes integrated with air cooling to further enhance thermal conductivity. Zhao et al. [24] developed BTMS based on heat pipes without fins using coupled air, and wet cooling. Authors concluded that heat pipes with wet cooling systems are more efficient. On the evaporation end, the contact surface area between heat pipes and batteries is the primary concern [25]. Consequently, many researchers have primarily concentrated their efforts on heat pipe assisted BTMS for prismatic batteries [26]. Liang et al. studied developed a hybrid BTMS with half-flattened heat pipes positioned in the horizontal direction for cooling prismatic batteries [27], while Wang et al. [26] placed heat pipes integrated with rectangular shaped aluminum plates between batteries and positioned the condenser end of the heat pipe under the battery. Despite the contact surface area being smaller, researchers have been working on the effective integration of heat pipes with cylindrical batteries such as 18650 and 2170 batteries. Gan et al. [28] applied aluminum sleeves between the heat pipes and cylindrical batteries to enhance surface area and integrated with cooling channel under the battery module. Furthermore, Feng et al. [29] applied copper sheets on the evaporation section and fins on the condenser section integrated with air cooling. However, research on heat-pipe-based BTMS with cylindrical battery cells is still under development to enhance thermal cooling performance and increase the lifespan of cylindrical battery cells and is the focus of this work.
For this reason, in the present study, a novel gravity assisted heat-pipe-based BTMS coupled with liquid channel cooling is proposed for a battery module with five heater cartridges. Copper sheets are designed and inserted between heater cartridges as a means of increasing the thermal contact area. The evaporation sections of heat pipes are incorporated among heater cartridges in a staggered arrangement, while the condenser end is inserted into the cooling channel. This study considers the a gravity-assisted vertically oriented heat pipe arrangement to enhance thermal performance of the cooling system. In addition, a complete thermal equivalent circuit network model of the system is provided. Finally, the numerically investigated heat-pipe-based BTMS was validated by experimental results at several working conditions such as inlet coolant temperatures and different C rates. In the current article, Section 2 explains a methodology of the numerical model and calculations, while Section 3 describes an experimental setup and procedure.

2. Modelling Methodology

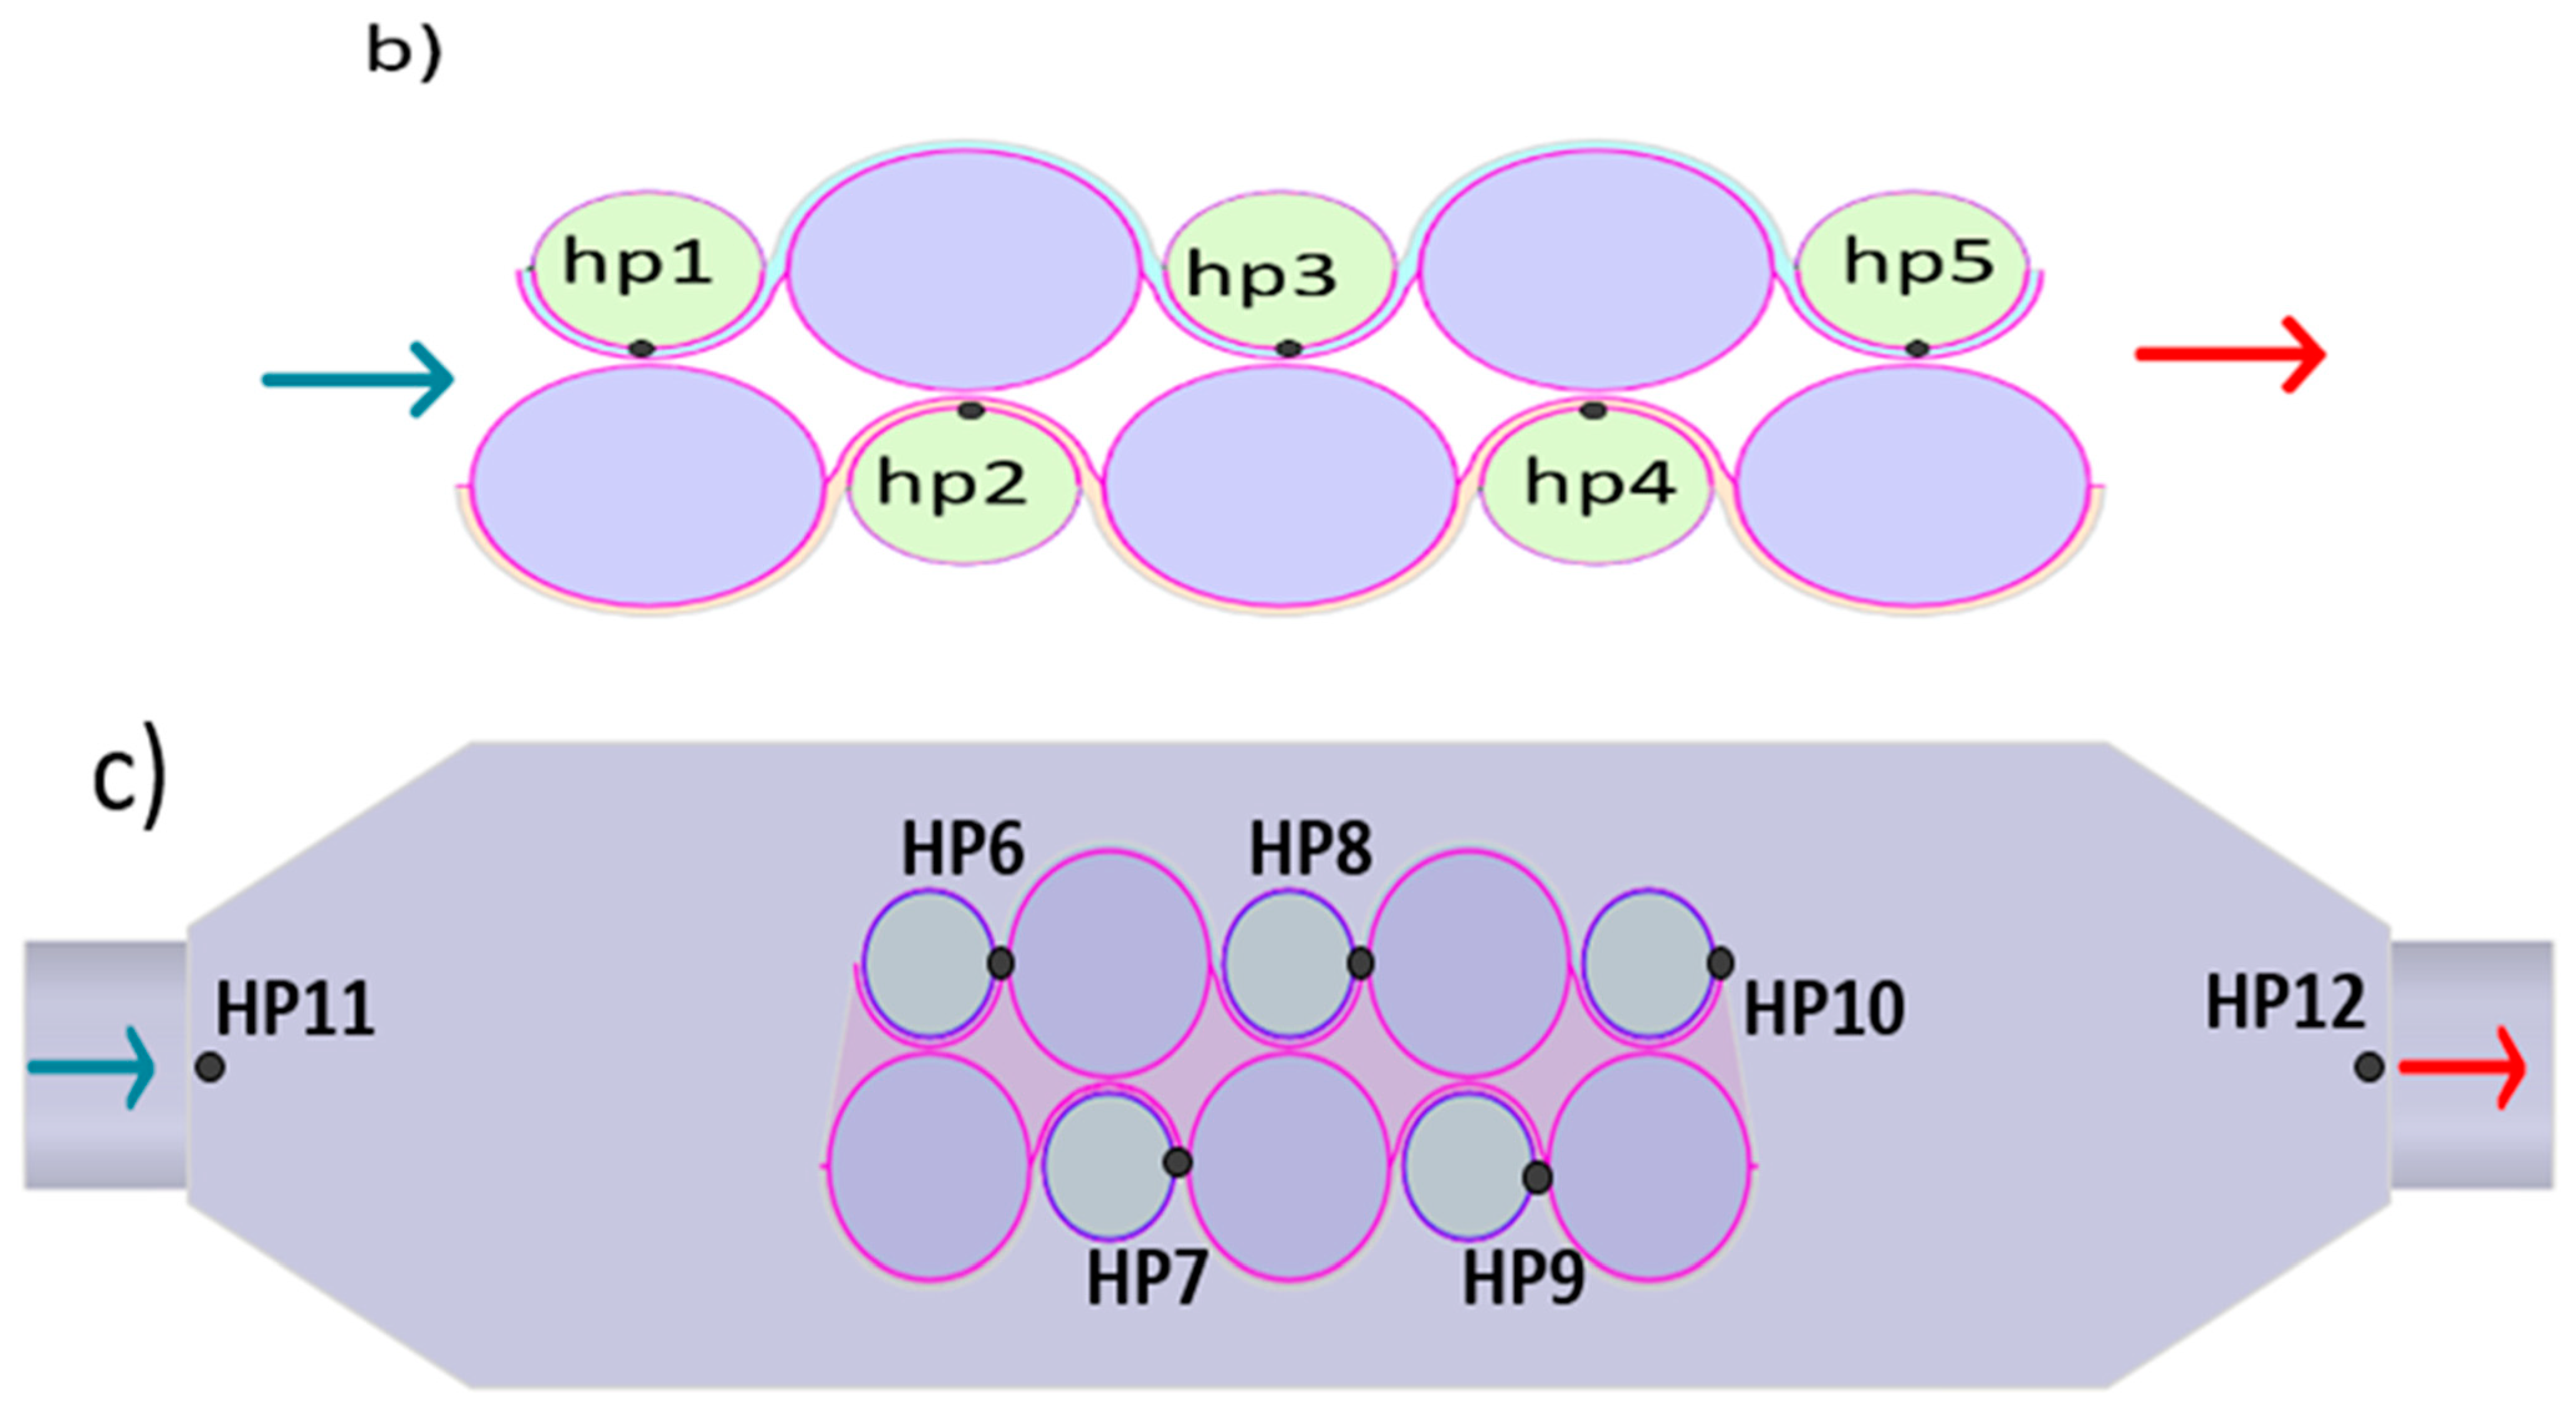
2.1. Geometrical Model

The heat pipe assisted BTMS is shown in Figure 1, which comprises of heat pipes, heater cartridges to simulate cylindrical batteries, a cooling channel, and copper sheets. The heater cartridges are arranged in a staggered arrangement to increase the contact area. Two copper sheets are designed in a curved shape to enhance the contact area between the heat pipe and heater cartridge surfaces and maintain the compactness of the system. The height of the copper sheets were designed to be 75 mm to match the height of the heater cartridges. Thermal grease was applied between the battery, copper sheets and the heat pipes to enhance the thermal contact between surfaces. Moreover, the sintered copper heat pipes have a diameter of 8 mm and a length of 150 mm. The condenser end of the heat pipe was set to 13 mm, while the evaporation end was maintained at 75 mm, to match the height of the heater cartridges. Finally, the cooling channel is constructed of transparent acrylic material and is designed with an elliptical shape to ensure proper water flow. The detailed geometrical description of all these elements of the proposed heat pipe assisted BTMS is shown in Figure 1a–d.
The process begins by generating heat from heater cartridges. The heat is then further transferred through thermal grease and copper sheets to the surface of the heat pipe evaporation end. Next, water further transfers the heat from the condenser end of the heat pipe to the cooling tank. It is worth nothing that, several factors play a key role in the efficiency of the heat transfer in the process, including the contact angle ( θ ) between the battery, copper sheets and heat pipes, the thickness ( δ ) of the curved shaped copper sheets and the arrangement of cartridges with heat pipes. The current geometrical model was designed to enhance the heat transfer rate between batteries and liquid cooling system.

2.2. Numerical Model

Computational fluid dynamics (CFD) numerical simulation was performed to investigate the cooling performance of the proposed heat-pipe-based BTMS. In the current study, Ansys Fluent (CFD) software (Ansys 2023) was employed to numerically investigate the flow pattern of the liquid and its effect on the heat transfer in the BTMS. Both heat pipes and heater cartridges in the simulation were considered as solid materials as it reduces the modelling complexity of heat pipe and the computation cost [1]. The thermal behavior of the heat pipes were modelled based on the equivalent thermal resistances of the three constituent components; copper, wick and the vapor region, while a total energy source of 1,144,656 W/ m 3 was applied for each heater cartridge. The energy source per heat cartridge was calculated using Equation (1). All the thermophysical properties used in the current simulation are provided below in Table 1 and the equivalent thermal resistances of each constituent component of the heat pipe are given in Table 2.
In this section, the simulation parameters in Fluent are provided. Initially, a conjugate heat transfer model was performed in double precision mode with the local parallel solver. A convergence criterion for residuals was set at 1 ×   10 12 for all momentum, continuity, and thermal energy governing equations. The appropriate time and iterations were selected to reach independent and accurate numerical results. Furthermore, a coupled scheme is chosen for pressure-velocity coupling, and the momentum, energy, pressure, and potential equations are formulated applying the second-order scheme. Due to its predictability, robustness, and computational efficiency, the k- ω   S S T model was selected as a turbulent model in the simulation. Next, the outlet boundary conditions were set to a pressure outlet, while the inlet was set to a pressure inlet. Finally, all exterior surfaces of the numerical test block were set to have an adiabatic surface, indicating that there is no heat released to the surrounding environment.

2.2.1. Governing Equations

Heater cartridges were used as heat sources instead of cylindrical cells to experimentally validate the numerical model as they are much safer to use in laboratory conditions. A constant heat generation was considered for each battery and it was assumed to be uniform throughout the battery. The main parameter that determines the heat generation was calculated using Equation (1) and was defined as the source term ( θ ˙ ) (W/m3) in the battery model.
θ ˙ = Q g e n V h . c
Here, Q g e n is heat generated from heater cartridge and V h . c is volume of the heater cartridge. The energy equation for the heater cartridge, was defined using Equation (2).
ρ C p T τ = k T + θ ˙
Water was used as the working fluid in the cooling channel. Based on the assumption that water is incompressible, the equations for cooling water, including continuity, momentum, and energy conversation equations, can be expressed by Equations (3)–(5).
ρ w τ + ρ w v = 0
τ p w v + p w v v = P
τ ρ w C p w T w + ρ w C p w v T w = λ w T w
In the above equations, parameters C p w ,   λ w , T w ,   ρ w are the specific heat capacity, thermal conductivity, temperature, and density of water, respectively, while v is the velocity vector.
During the numerical study, the proposed heat pipe was divided into three constituent components, namely the copper shell, sintered copper powder as a wick and the vapor core. When a heat pipe is operating, water evaporates at the evaporation side and is transported to the condenser through the vapour core, where it condenses to water once again at the condenser end by releasing heat. This condensate is driven back to the evaporator section by capillary force. The heat pipe reaches a capillary limit when the capillary force is unable to return water to the evaporation end and the operation of the heat pipe is limited by the maximum capillary pressure. As a general rule, the working principle of the internal circulation process can be summarized by Equation (6).
Δ p c p Δ p v + Δ p l ± Δ p g
However, since the maximum possible heat transfer rate of the current heat pipes is 65 W, and the maximum power applied to a single battery in the numerical model is 9 W, the limits of heat pipes can be ignored. Furthermore, a heat pipe’s thermal behavior involves an extremely complex mass transfer processes, such as phase transitions and two-phase flow, making it extremely difficult to mathematically model the detailed operation of a heat pipe. This promotes the development of a simplified model of heat conduction to simulate the heat pipe’s thermal behavior. The circular heat pipe is constructed primarily of a shell, wick, and vapor core. The shell is assumed to be made of pure copper and to have heat conduction properties, while the wick is assumed to be porous in nature. The thermal behavior of the wick can be defined by Equations (7)–(9).
λ w i c k = λ l λ l + λ s 1 ε λ l λ s λ l + λ s 1 ε λ l λ s
ρ w i c k = ε ρ l + 1 ε ρ s
C w i c k = ε ρ l C l + 1 ε ρ s C s / ρ w i c k
λ v a p o r = r v 2 L 2 ρ P v 8 μ R T 2
where, λ is the thermal conductivity, ρ is the density, and C is the specific heat capacity. In this study the wick porosity E was considered to be 0.6 Thermal conductivity, density and specific heat capacity of the wick and the vapour core were calculated and defined as material properties in Fluent. In this study, the vapor core of the heat pipe was considered as given in Equation (10).

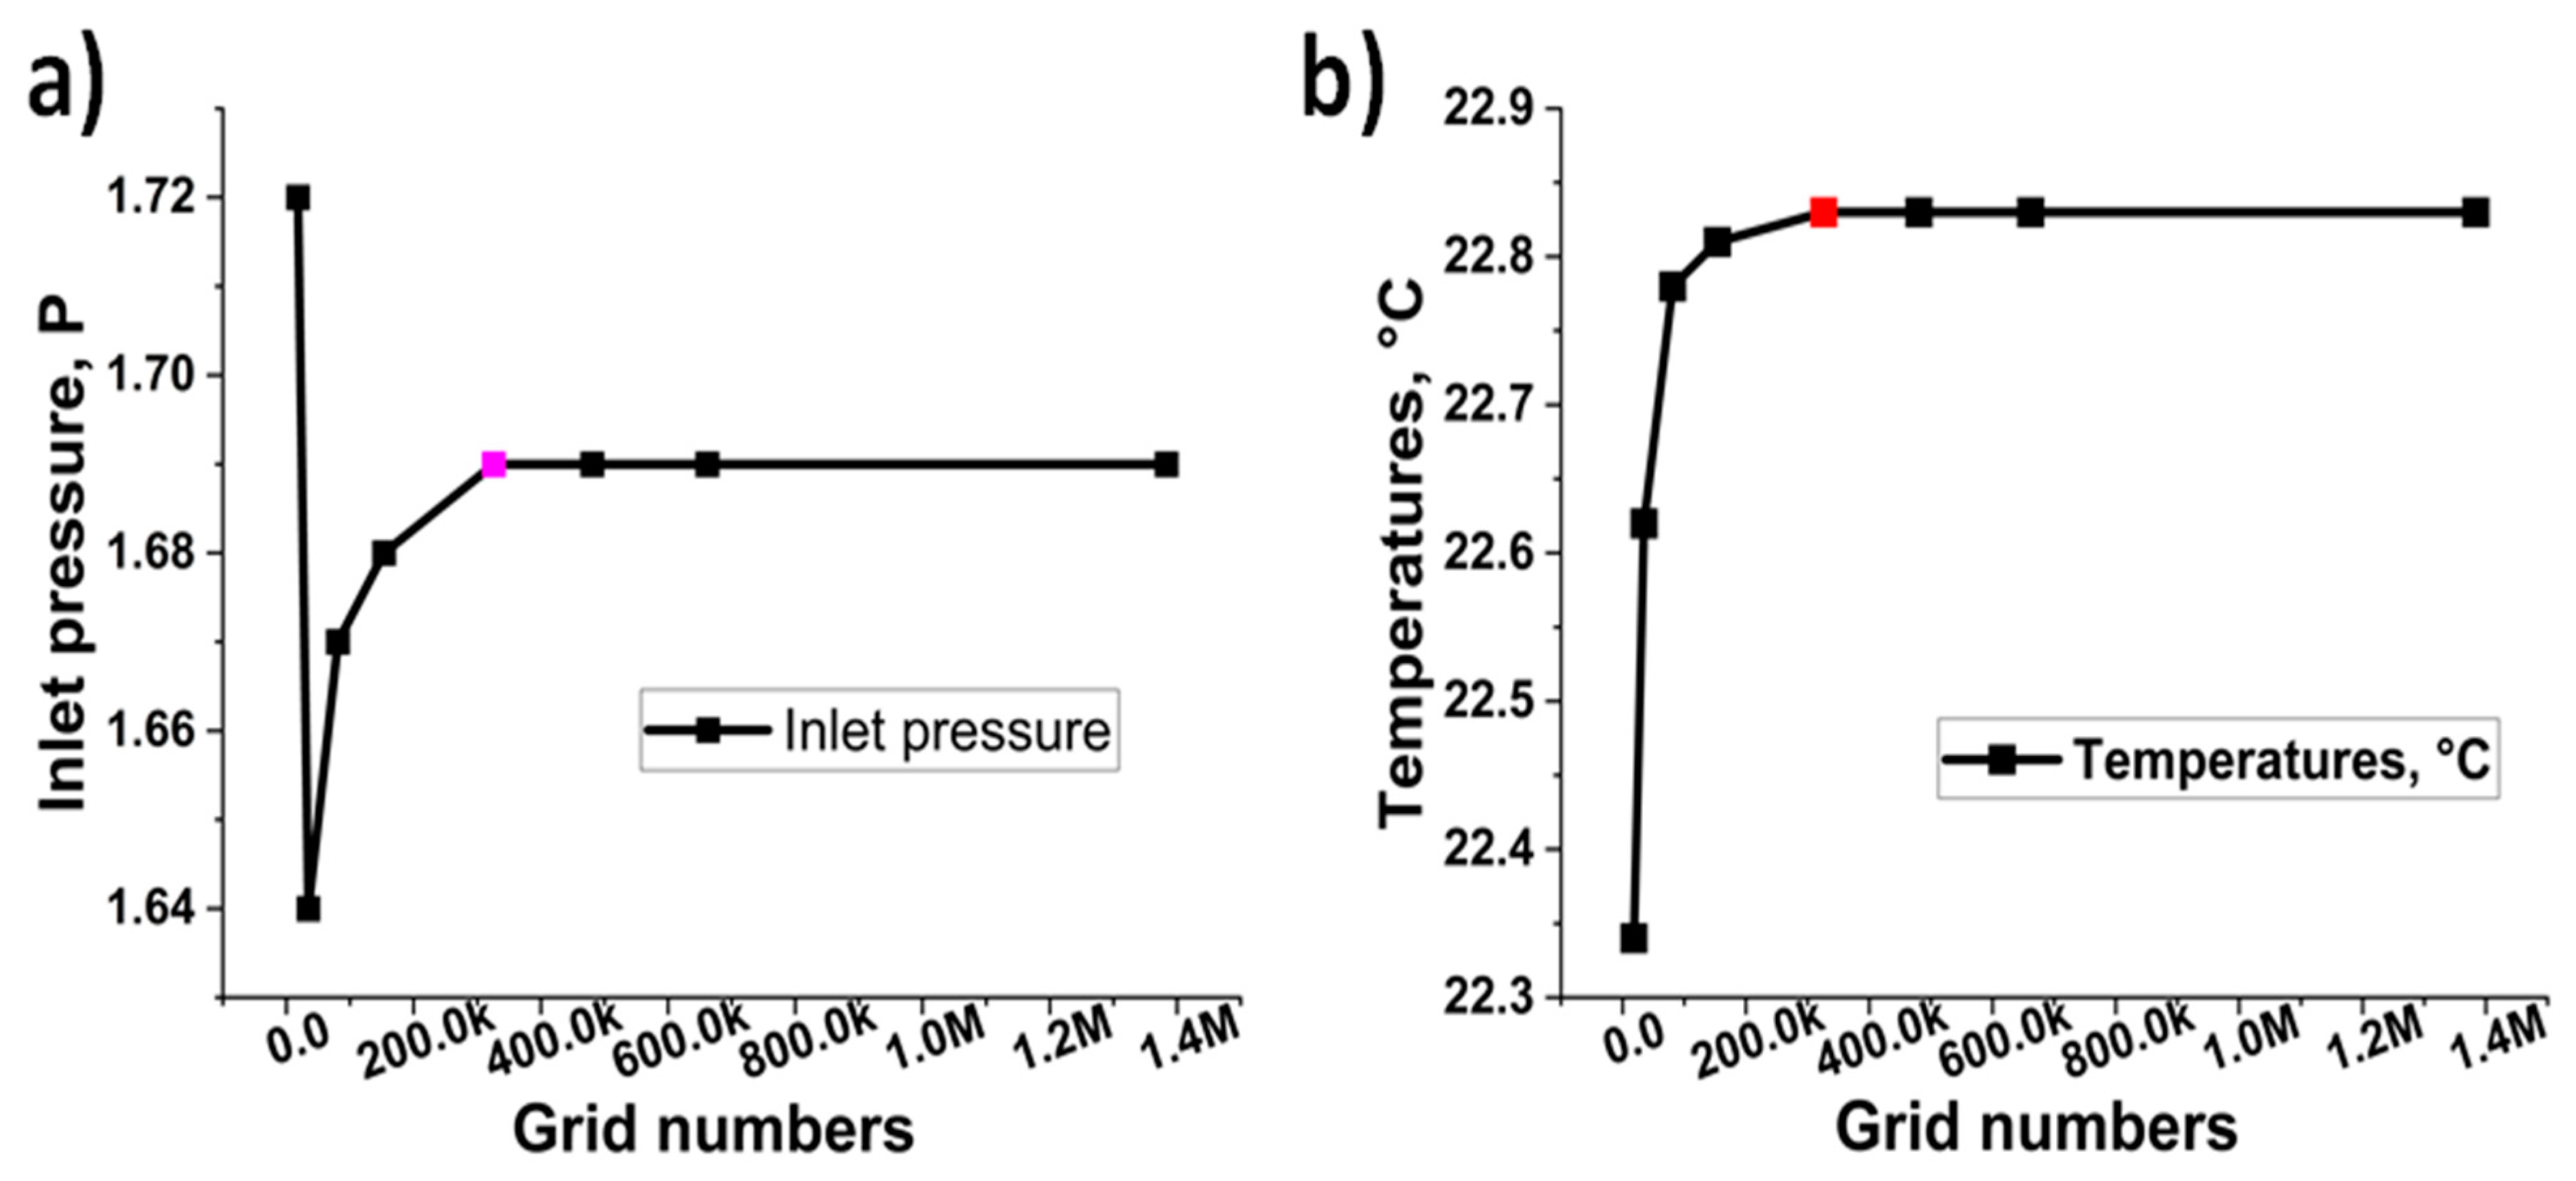
2.2.2. Grid Independent Test

In order to verify the accuracy of the results of the numerical model, a grid independence test was performed by gradually refining the mesh size of the computational domain. It is intended to discretize the mesh of the computational domain using Ansys Advanced Watertight Geometry Workflow. Initially, a numerical model with eight different mesh numbers were considered to minimize the dependency of grid size and computational cost of the numerical model. The test parameters considered in this study were outlet temperature and the inlet pressure of the cooling channel. As shown in Figure 2a,b, a mesh number of 326,098 marked in red was selected, since neither a change in pressure nor a change in temperature was observed.

2.2.3. Initial and Boundary Conditions

In the cooling channel, the inlet mass flow rate was set to 0.0055 kg/s and the temperature was set to 15 °C, 20 °C and 25 °C for three different test cases The outlet boundary condition was specified as outlet pressure at zero-gauge pressure. This is because the operating pressure is set to 101,325 Pa. Surfaces between copper sheets, heater cartridges and heat pipes are all set as coupled surfaces in order to exchange data between connected surfaces. Additionally, outside surfaces of the test block and the adiabatic section of the heat pipes are all set to adiabatic boundary condition. The k-omega SST model was used for the flow module and the convergence criterion of the energy and continuity equations was set to 10 12 . The k-omega SST was selected due to accuracy in predicting the boundary layer behavior near walls and free shear layers and wakes, and the convergence criterion was selected to be as high as possible to enhance the accuracy of the results.

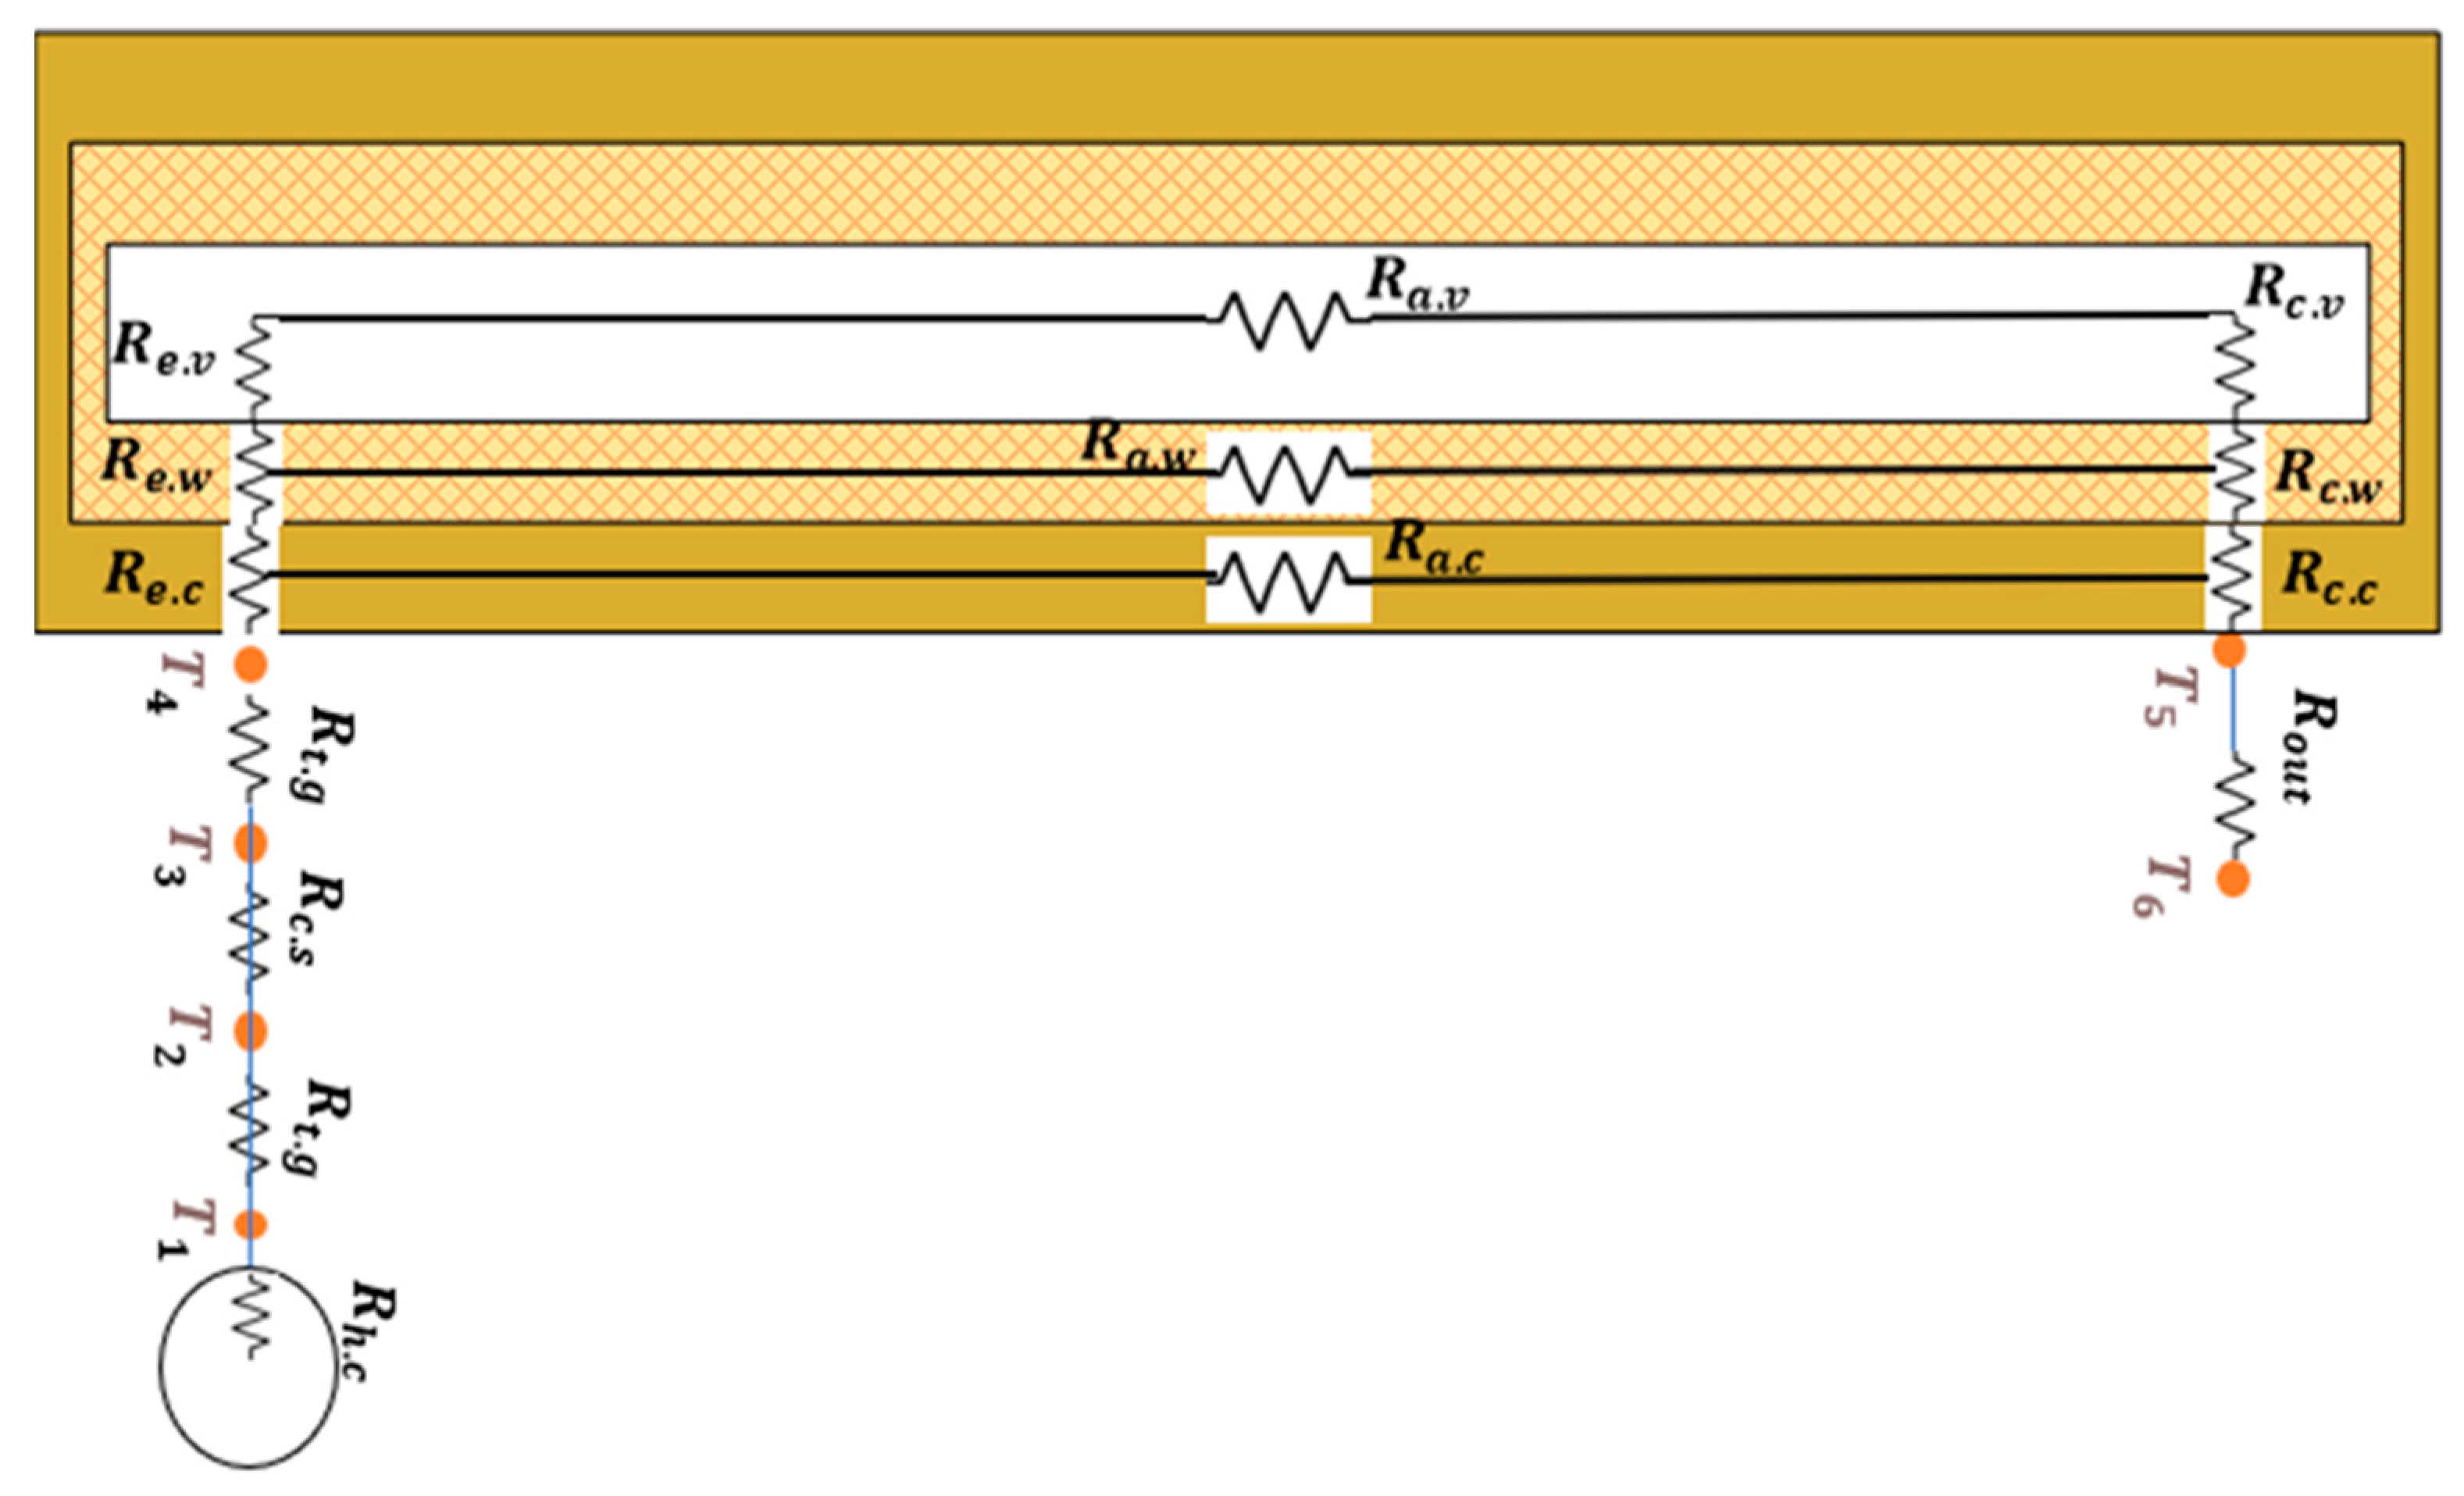
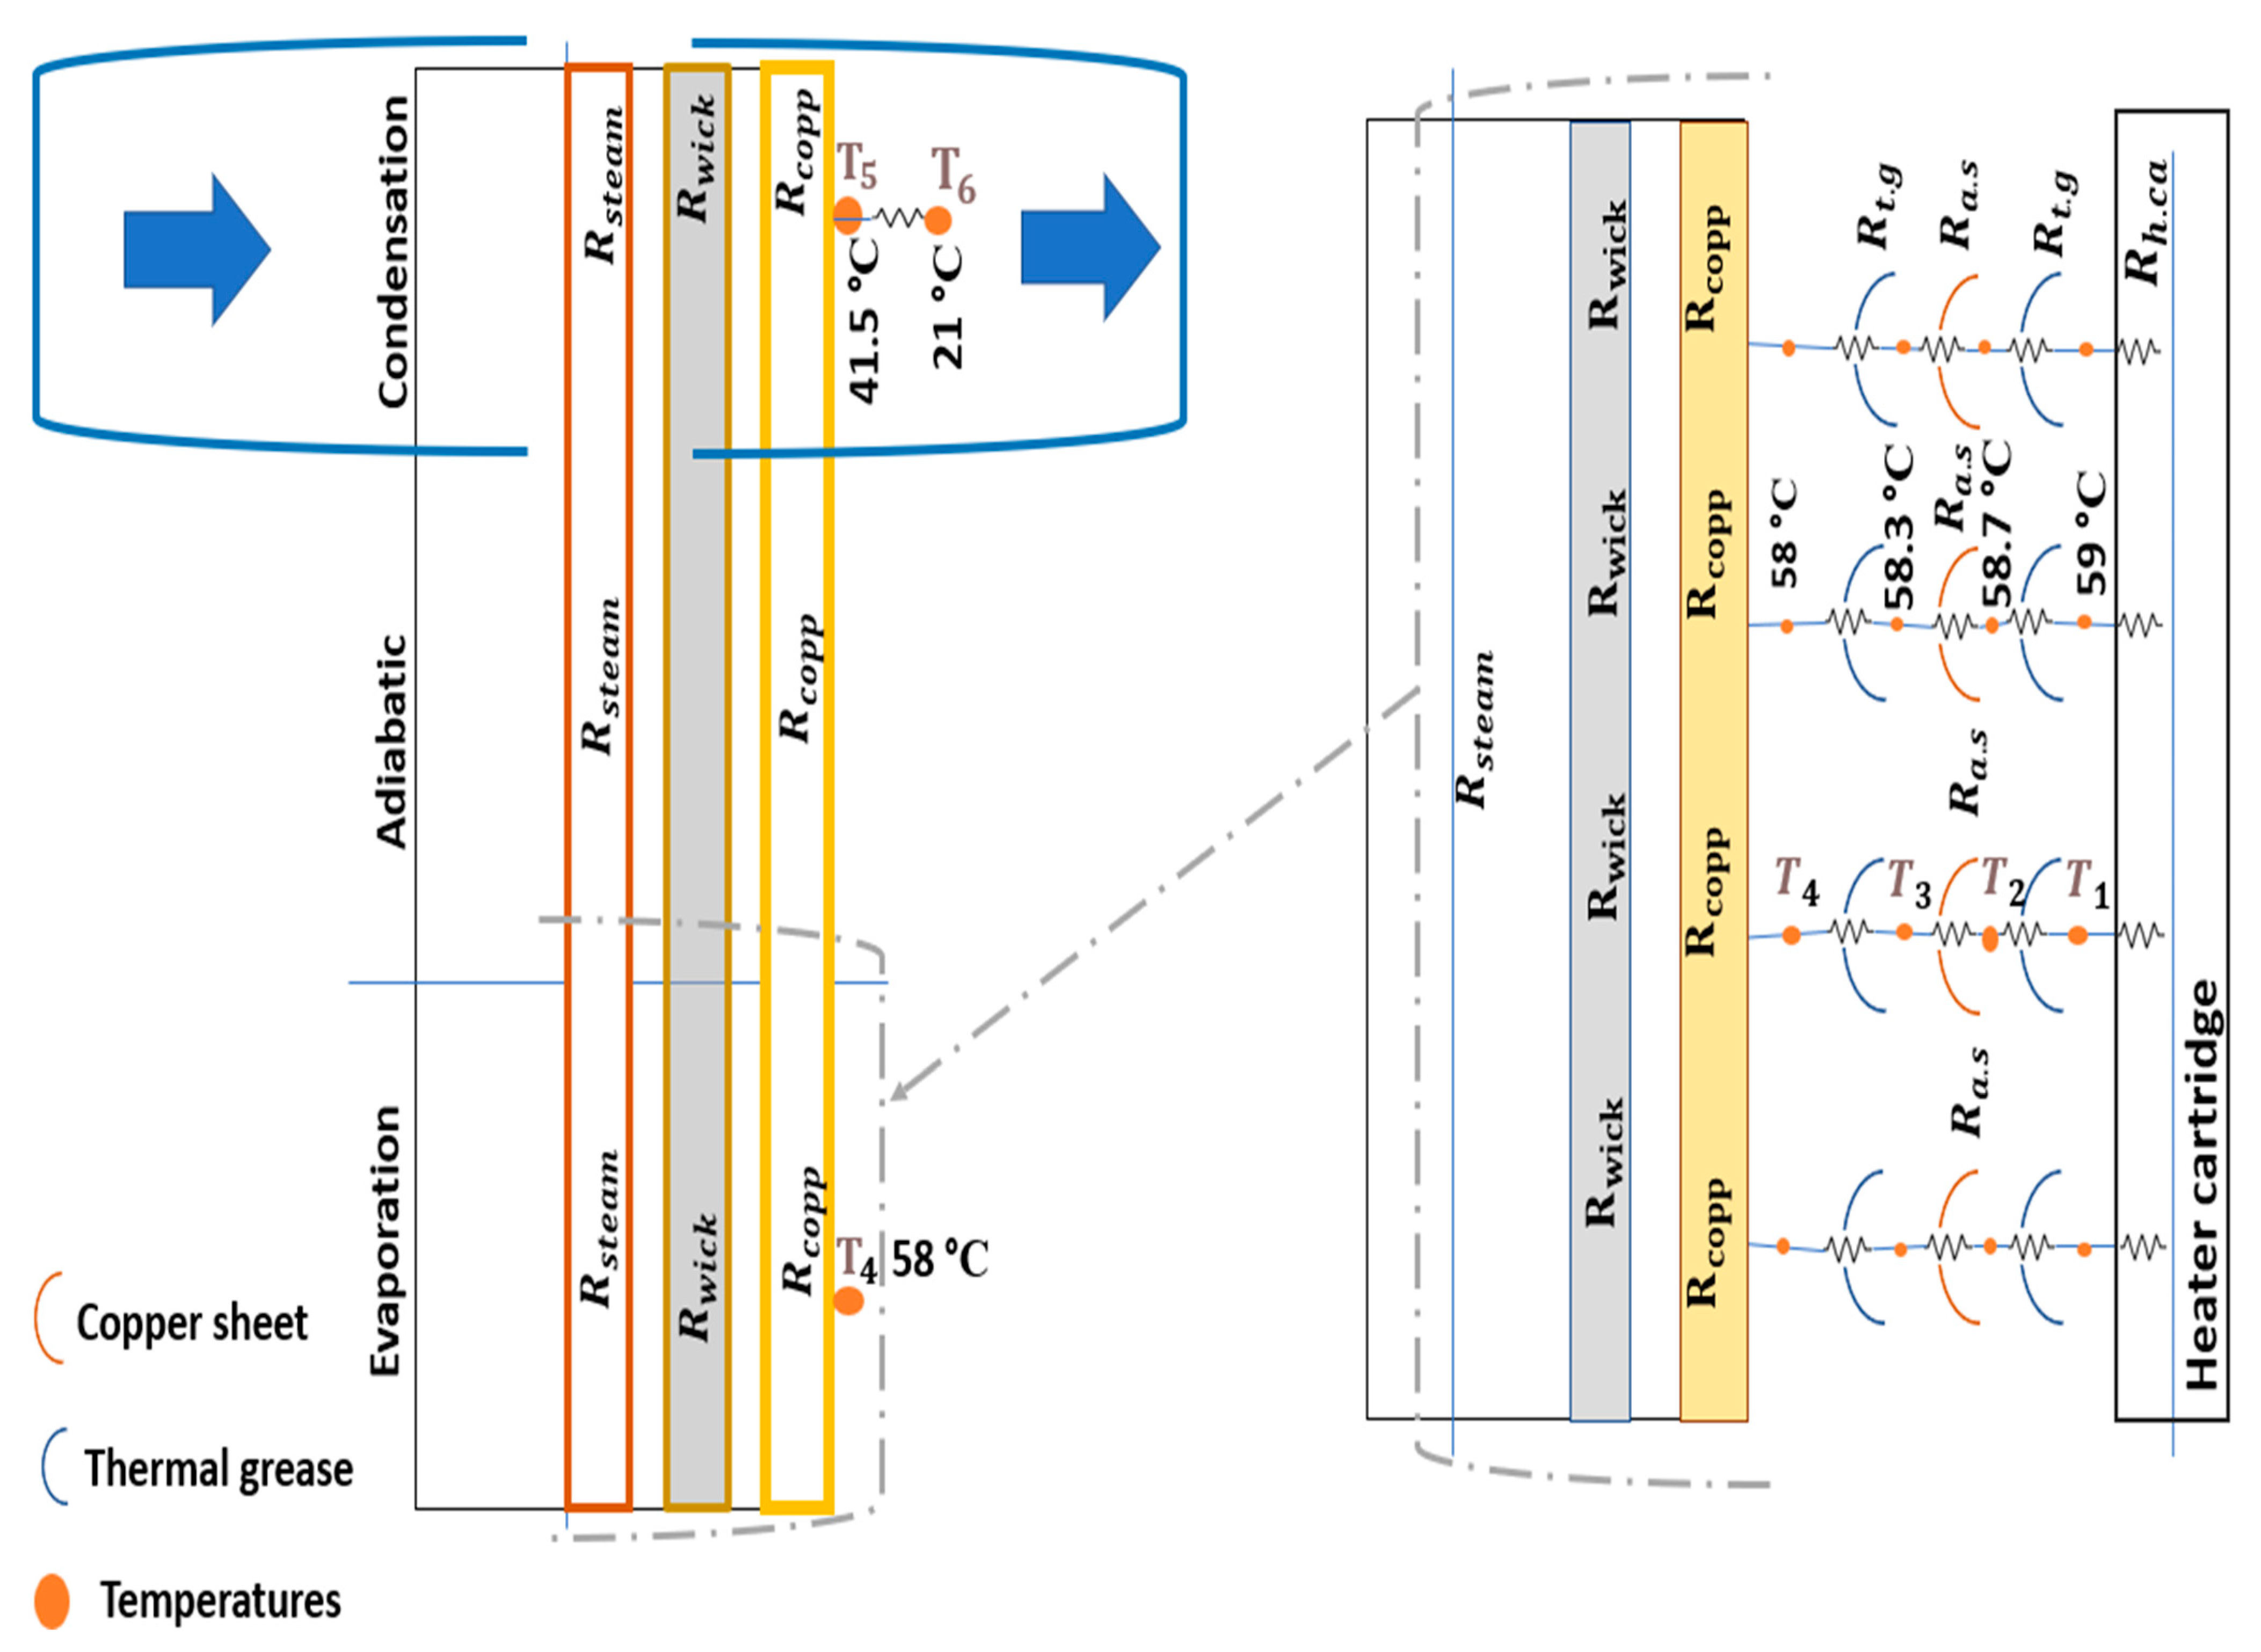
2.2.4. Thermal Resistance Network Model

Figure 3 illustrates the overall thermal resistance of the heat-pipe-based BTMS. It consists of thermal resistances of thermal grease, copper sheets, nine heat pipe components arranged in a parallel and serial combination. The corresponding equivalent thermal resistance are given in Table 2.
Initially, the total thermal resistance of circular heat pipe is described as follows:
R t = R e . c + R e . w + R a . v + R c . c + R w . c + 1 R a . c + 1 R a . w
The thermal resistances of the adiabatic sections are considered as an axial thermal resistance, whereas the wicks and copper conductors are considered as radial thermal resistance.

3. Model Validation

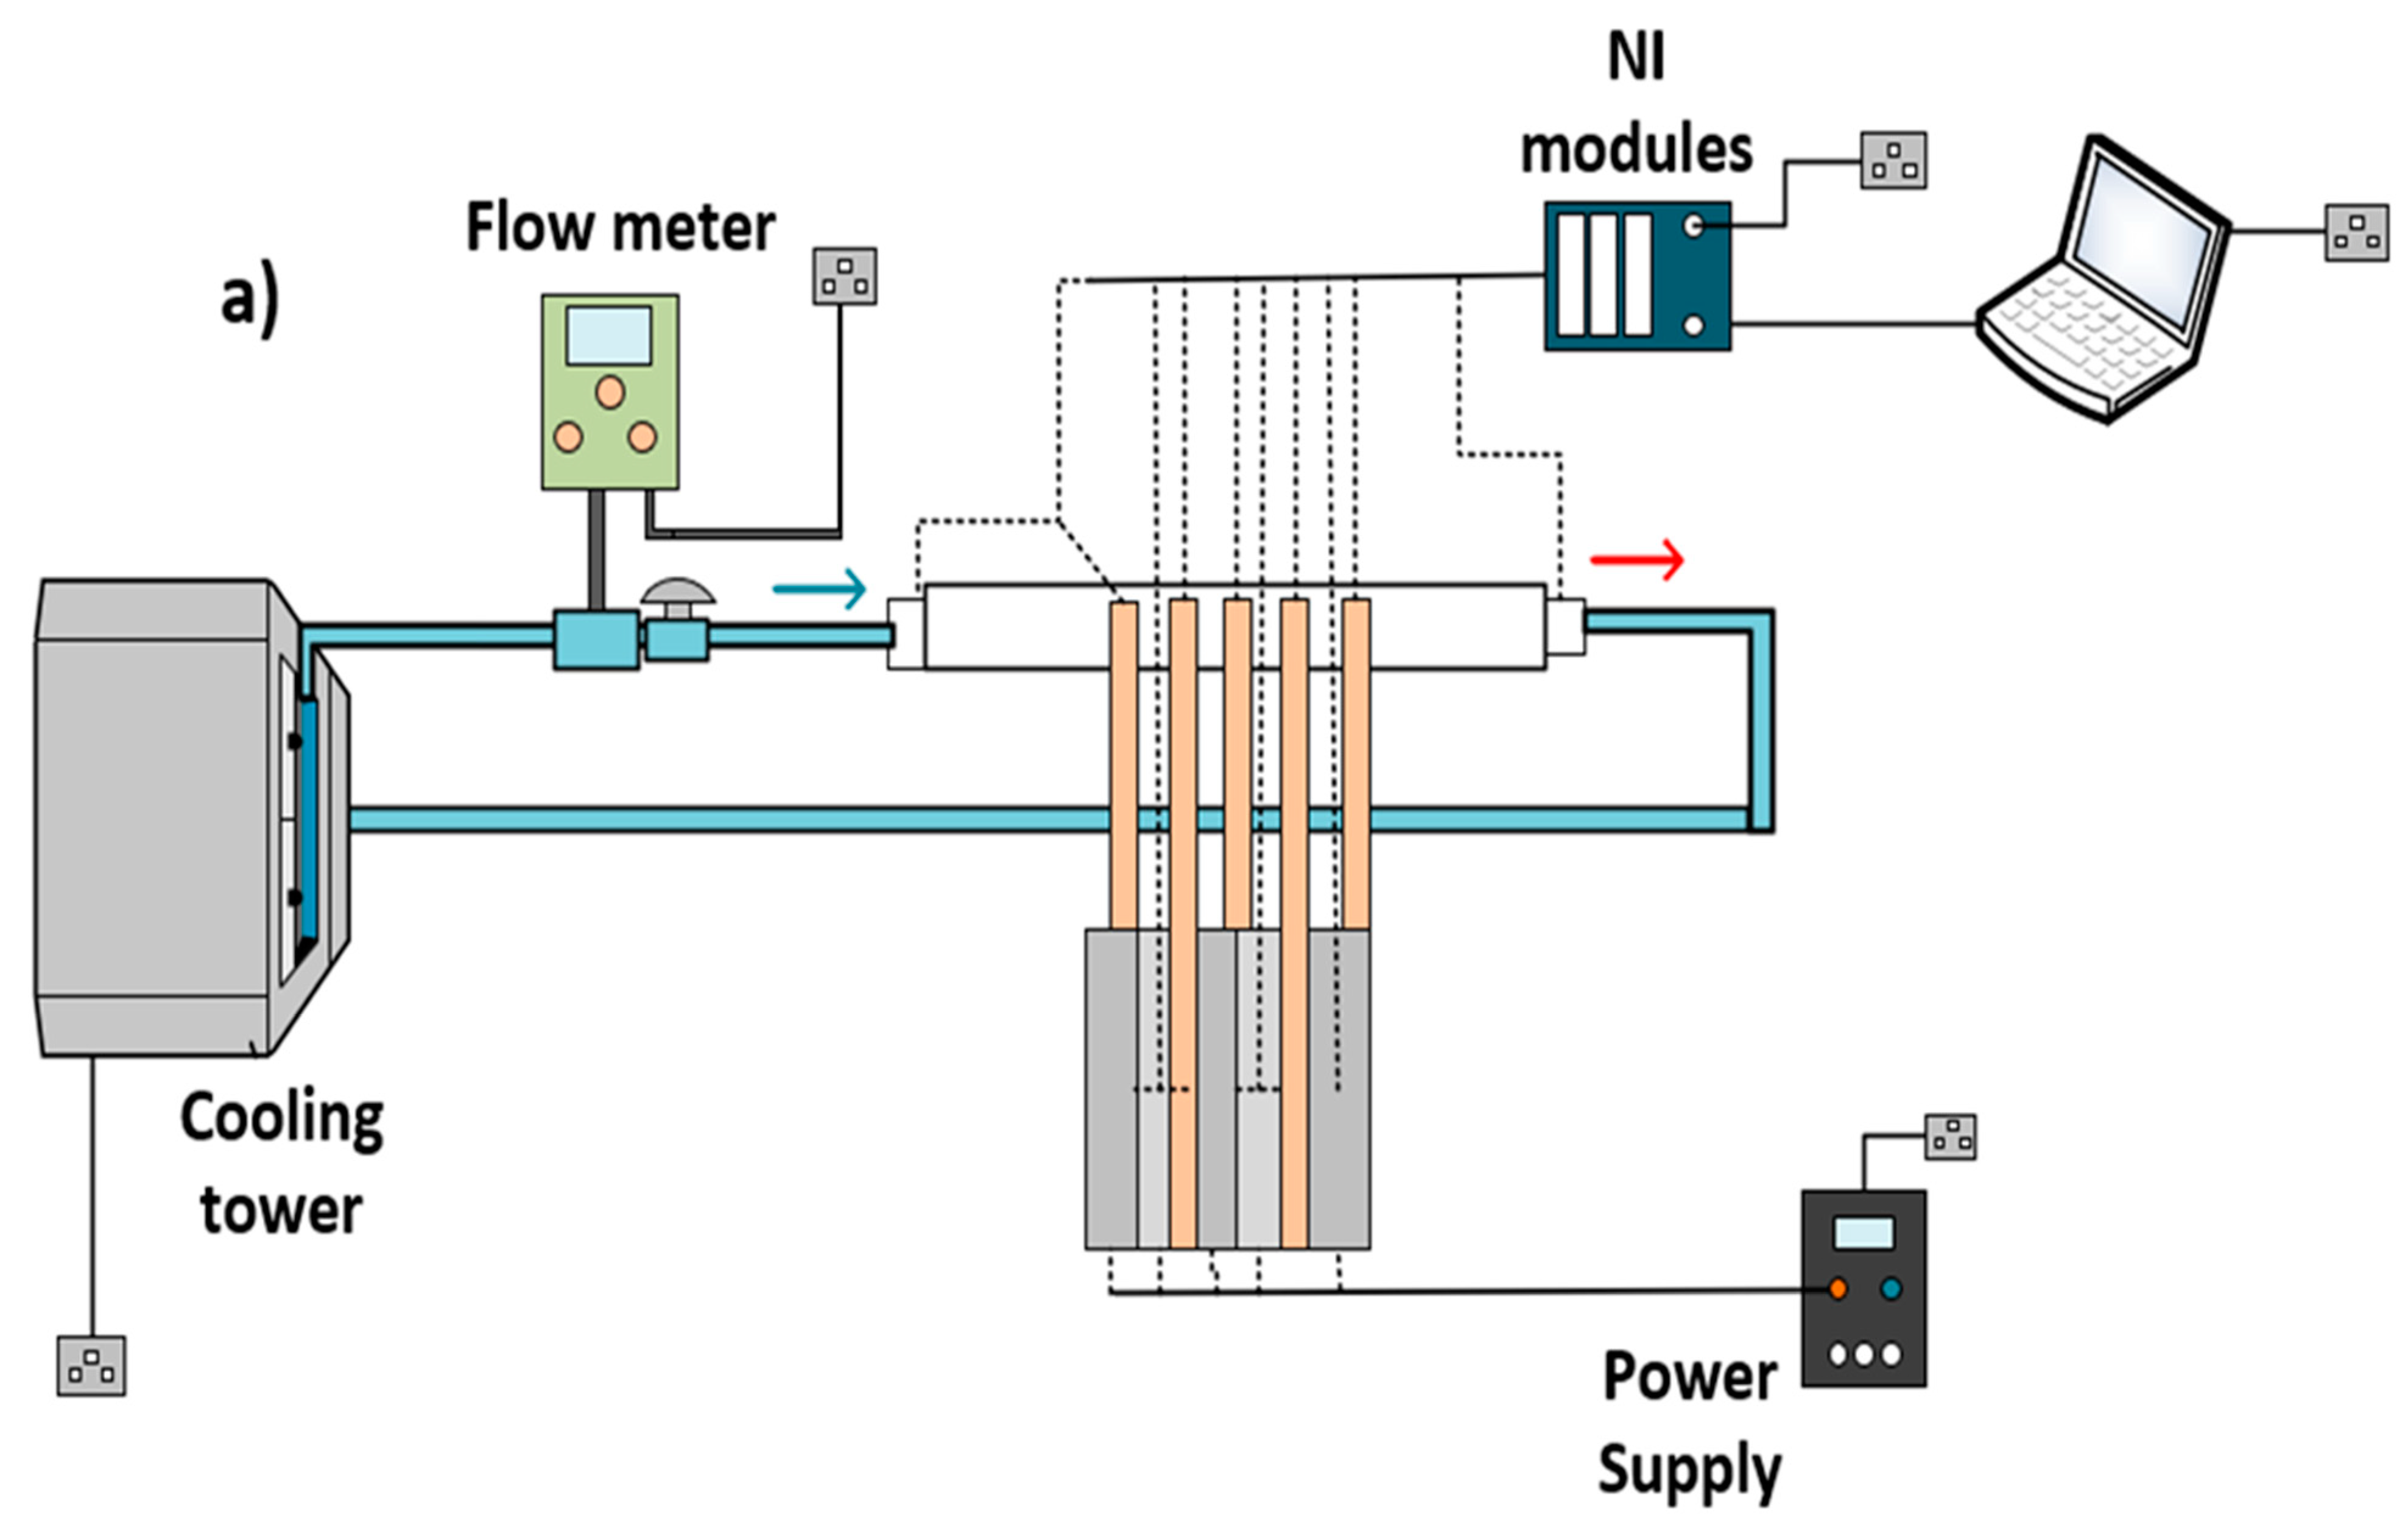
3.1. Experimental Setup

To verify the accuracy of the numerical model, the vertically oriented experimental setup was designed. As shown in Figure 4, an experimental test rig primarily comprising of five 300 W heater cartridges, a 300 W DC power supply, five ϕ   8   mm × 150   mm round heat pipes (RHPs), two NI data acquisition modules with chassis (NI9210 and NI9211), and an octagon-ellipse shape cooling channel was set up. Initially, the DC power supply is used to feed power to five heater cartridges which were connected in parallel. Thermal and electrical tapes were tightly wrapped around the connectors in order to make sure that they are properly insulated. To increase the contact surface area, two 0.5 mm thick, 75 mm × 120 mm copper sheets are inserted between the heat pipes and heater cartridges (75 mm ×   ϕ   12.3   mm ). In order to ensure proper thermal contact, thermal grease (Easycargo, 1.42 W/m-k) was applied to either sides of the copper sheets before placing them between the batteries and the heat pipes. The entire setup as well as the adiabatic section of the heat pipes were entirely wrapped with a 4 mm thick insulation tape with a thermal conductivity around 0.02 0.04   W   m 1 K 1 to prevent any heat loss.
The cooling channel was built using transparent acrylic material to visualize the flow pattern and to ensure that the heat pipe condenser sections are within the liquid flow through the cooling channel. Since the established system is in vertical position, the cooling channel is placed above the heat cartridges as shown in Figure 4a. Five ϕ   8.2 mm holes were drilled on the bottom side of the cooling channel to insert the condenser end of the heat pipes, and open grommets were used to prevent any leakages. As a result of the placement of the heater cartridges, the heat pipes were arranged in a staggered arrangement, which affects both the design of the test block on the bottom and the cooling channel on the top. All the physical parameters of the heat pipe are given in Table 3. The inlet and outlet diameters of the cooling channel were design to connect 1/4 BSPT hose tail adapters to ensure the connection between the cooling channel and the cooling tower. On the top of the channel, five ϕ   2 mm holes were drilled, through which seven K-Type thermocouples were inserted to monitor the temperature at the condenser end of heat pipe surfaces, and the inlet and the outlet of the cooling channel. In addition, another five thermocouples were inserted between the evaporation end of the heat pipes and copper sheets in the test block to monitor the heat source end. The twelve thermocouples were connected to the NI modules through which the data were transmitted to the PC. A LabVIEW based temperature monitoring program was used to record the variation of temperature throughout all the test cases.
In the test setup, the cooling tower was used to pump, regulate, and maintain the temperature of the water. A hydraulic control valve was used to maintain a constant flow rate, preventing any sudden changes in velocity and pressure that could possibly affect the results. A flow meter with valve (Digiten flow control) was installed to monitor the volumetric flow rate of the water continuously. The flow meter accurately monitors the amount of water passing through the flow valve, ensuring the right amount of water is circulated during the test. Finally, the experimental test rig was held and maintained in its vertical position by using an aluminum extrusion.

3.2. Experimental Procedure

In the current study, six experimental tests were conducted considering different heat loads and water cooling temperatures as shown in Table 4. Three commonly used cooling temperatures 15 °C, 20 °C and 25 °C were selected for the circulating water at a volumetric flow rate of 0.33 L/min [31]. The heat loads considered for this study were 5 W and 10 W The heat loads were based on typical ranges of heat generated from cylindrical cells such as 18650, 2170, and 26650 at high C-rates around at 5–8C [4,22,32]. The laboratory’s ambient temperature was maintained at around 20 °C.
Initially, water was pumped from the cooling tower (HAOCHENG HC3 chiller) at a volumetric flow rate of 0.33 L/min at a temperature of 20 °C, then passed through a flow meter’s valve to the hydraulic control valve (DIGITEN FL-408). In general, the flow valve’s primary purpose is to monitor the volumetric flow rate of the water and display the data on the flow meter’s monitor, whereas a hydraulic control valve regulates the same mass of water passing. Afterwards, the water flows to the cooling channel and then back to the cooling tower to complete the cooling cycle.
In the insulated evaporation part, the power applied by the power supply was converted into the heat via the heater cartridges (Stainless steel 75 mm, 300 W) and then transferred to the heat pipe surface via copper sheets and thermal grease. The heat is then transferred to the condenser end of the heat pipes where it was dissipated to the flowing water. Finally, the same process was repeated for all five left test scenarios.

3.3. Uncertainty Analysis

The uncertainties of the measured quantities are based on the accuracy of the measuring devices. The uncertainties are then propagated through calculations to determine the total uncertainty values. Table 5 presents maximum uncertainty parameters for each device that is used in the experimental setup.
The voltage and current were used to estimate the uncertainity of the DC power supply was estimated to be around 1.5%. While the uncertainity of each heater cartridge was around 2%. The K-type thermocouples that were used to measure temperature points had an uncertainty of 0.6 °C each, and the error of the temperature data transfer process from the NI modules were around 1%. It is worth noting that NI modules inserted to NI chassis, which had an uncertainty of 0.3%. The flow meter sensor used to measure the flow rate of the circulating water had a maximum inaccuracy of 2%. Finally, the test block was insulated with the assumption that heat is slightly released depending on the room temperature and insulation material. The room temperature in the laboratory was around 20–22 °C. The Kapton tape and the insulating tape had a 0.5% uncertainties but due to they were wrapped several times, they were ignored. The condenser side of the heat pipes are within the cooling channel working liquid, therefore any heat loss to the surrounding is negligible. The adiabatic section of heat pipes were also wraped totally by thermal heat resistance tapes with 0.5% accuracy. The total uncertainty of the results were within ±8–9%.

3.4. Experimental Validation

The accuracy of the CFD model was validated using the experimental results. Figure 5 presents a comparison between the numerical and experimental temperatures during a heat load of 10 W at a flow rate of 0.33 L/min and a temperature of 25 °C. It can be clearly seen that the experimental results recorded correlate with the numerical results at the 10 W heat input test case. The numerical boundaries and initial conditions have been adapted to the experimental test-rig. Due to the uncertainty of the devices, heater cartridges, and insulation materials, the 10 W heat load is assumed to be 9 W in the numerical setup. Using the energy balance equation shown in Equation (12), the temperature difference between the outlet and inlet sections of the cooling channel were found to be 1.97 °C and 1.95 °C in the experimental and numerical models respectively. Therefore, we can conclude that the heat losses in the experimental setup are negligible. Furthermore, comparing the experimental and numerical results in Figure 5, it can be seen that the model can predict the temperature of the BTMS to within ±1 °C. The slight difference between the experimental and numerical results, could due to the non-uniformity of the thermal grease layer in the experimental setup. Therefore, from this comparison we can conclude that the numerical model is reliable and capable of predicting the performance of the heat-pipe-based BTMS to an acceptable level.
Q ˙ = m c Δ T

4. Results and Discussion

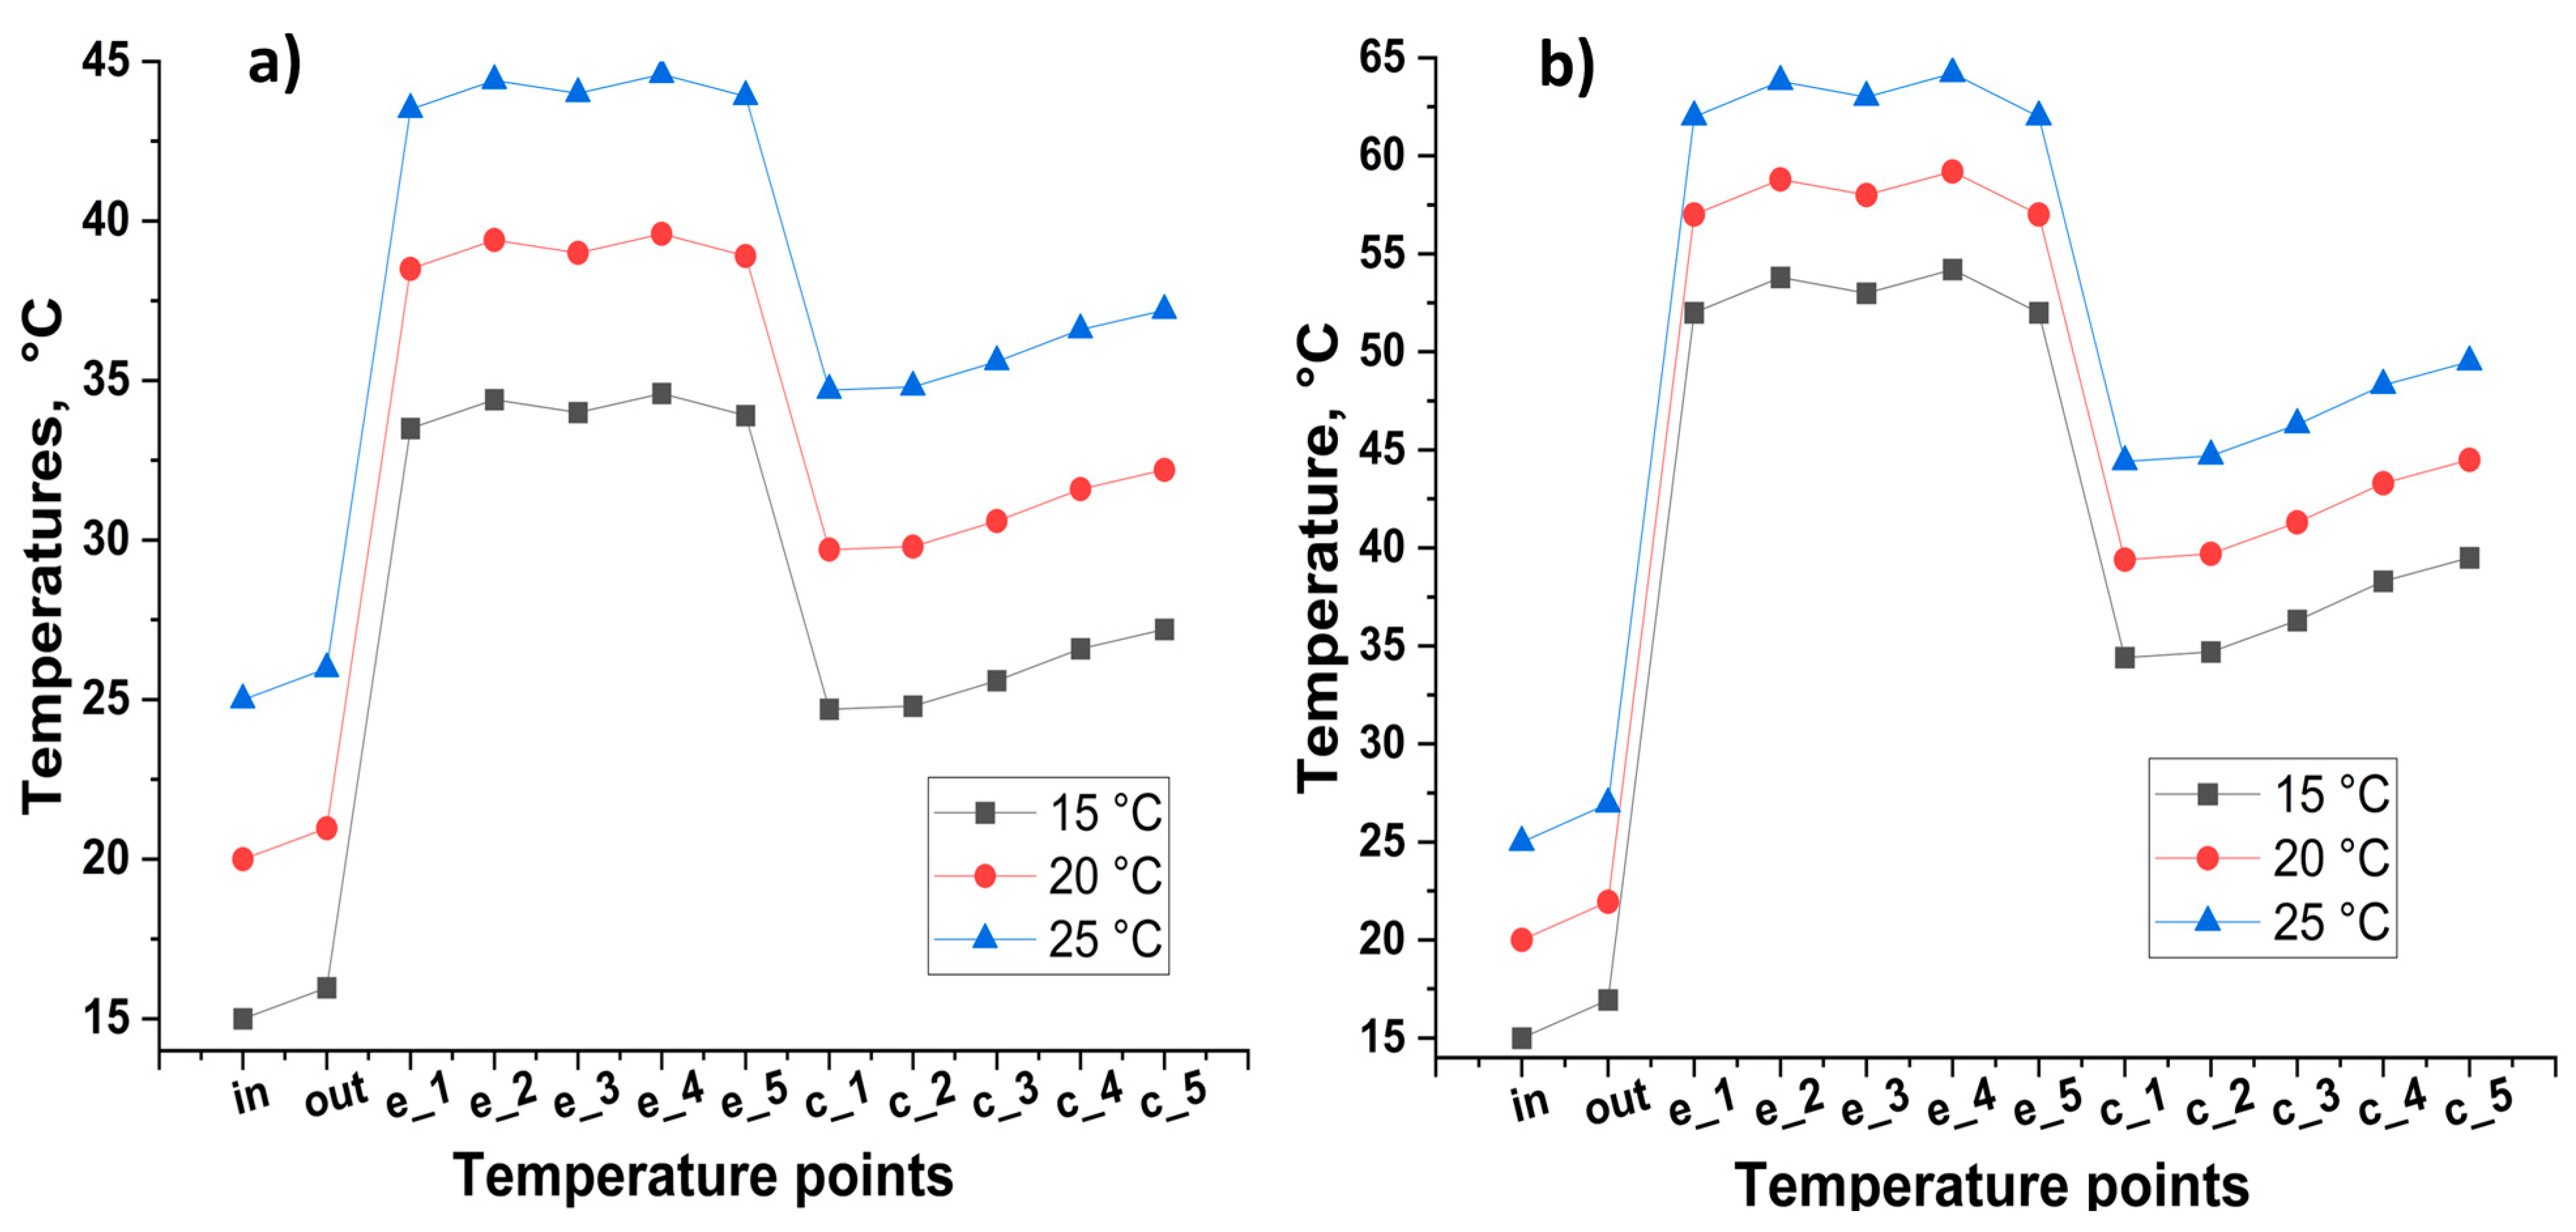
4.1. Effects of Coolant Flow Temperature and Input Power

The results in Figure 6a indicate that the evaporation section at the heat pipes have recorded a temperature around 64 °C at a cooling temperature of 25 °C and heat load of 10 W., This high temperature at the heat pipe evaporator end will further increase the temperature of the battery and could result in reduced battery lifespan and performance as the temperatures are above the optimum operating temperature of around 40 °C [33]. Consequently, the proposed HP-BTMS is examined numerically in this section to determine the impact of varying liquid temperatures (15 °C, 20 °C, 25 °C) in order to further reduce the battery temperature. Throughout all three test scenarios, the ambient temperature and cooling flow velocity remained the same. In the numerical study, three temperatures are recorded; the evaporator temperature ( T e v a p ) , condenser temperature T c o n d , and the outlet temperature ( T o u l e t ) of the cooling channel. When a 10 W heat load is applied at 25 °C, the temperature variation in the evaporation section was recorded to be between 62 °C and 64.2 °C, with temperature difference ( Δ T ) under 2.2 °C, while the condenser end temperature variation was found to be between 44.5 and 49.5 °C. The difference in temperature at the evaporation end of the heat pipes can be explained by the number of heater cartridges surrounding each heat pipe. The heat pipes, hp2 and hp4 are surrounded by three heater cartridges while hp1, hp3 and hp5 are only surrounded by two heat pipes as shown in Figure 4b. As a result, these points demonstrate higher temperatures, though it will be slightly higher on the surface of the heater cartridges, which will be addressed in the next section. A gradual increase in temperature is observed from heat pipes 1 through 5 on the condenser end with the last two heat pipes, hp4 and hp5 showing higher temperatures. This trend is explained in the following Section 4.3 in relation to the liquid flow pattern. Moreover, according to current results, it shows that reducing the inlet cooling temperature reduces the surface temperature of the battery by almost the same degree of reduction. Finally, the different between the inlet and the outlet temperature of the cooling channel in the experimental setup was found to 2.07 °C, while different between the inlet and the outlet temperature of the numerical model was recorded to be 1.97°. Furthermore, from this difference in temperature the heat absorbed by the cooling water was determined using the energy balance equation given by Equation (12) which was found to be closer to the total heat input to the system from the heater cartridges.
In this section, the effect of 5 W and 10 W input power on the heat pipe surface temperature is investigated and the main difference between them is discussed. As shown in Figure 6, the same trend can be seen for all the temperature points in the three test scenarios under a heat load of 5 W. Furthermore, it can be observed that for a heat load of 10 W, the difference in temperature at the heat pipe evaporation and condenser ends is 16 °C; while at a heat load of 5 W, a difference was only 8 °C. Hence, it can be concluded that the variation of the temperature is linear, indicating that the thermal conductivity of the heat pipe is almost constant throughout different heat loads. Moreover, at a heat load of 5W, we can observe that the temperature of the evaporator section has dropped by almost 15 °C compared to the 10 W heat load test case. Under a heat load of 5 W per heater cartridge and a cooling temperature of 20 °C, the evaporator end temperature can be maintained around 40 °C and the different in temperature can be maintained within 1 °C, indicating that the cooling system meets the requirements of a battery thermal management system.

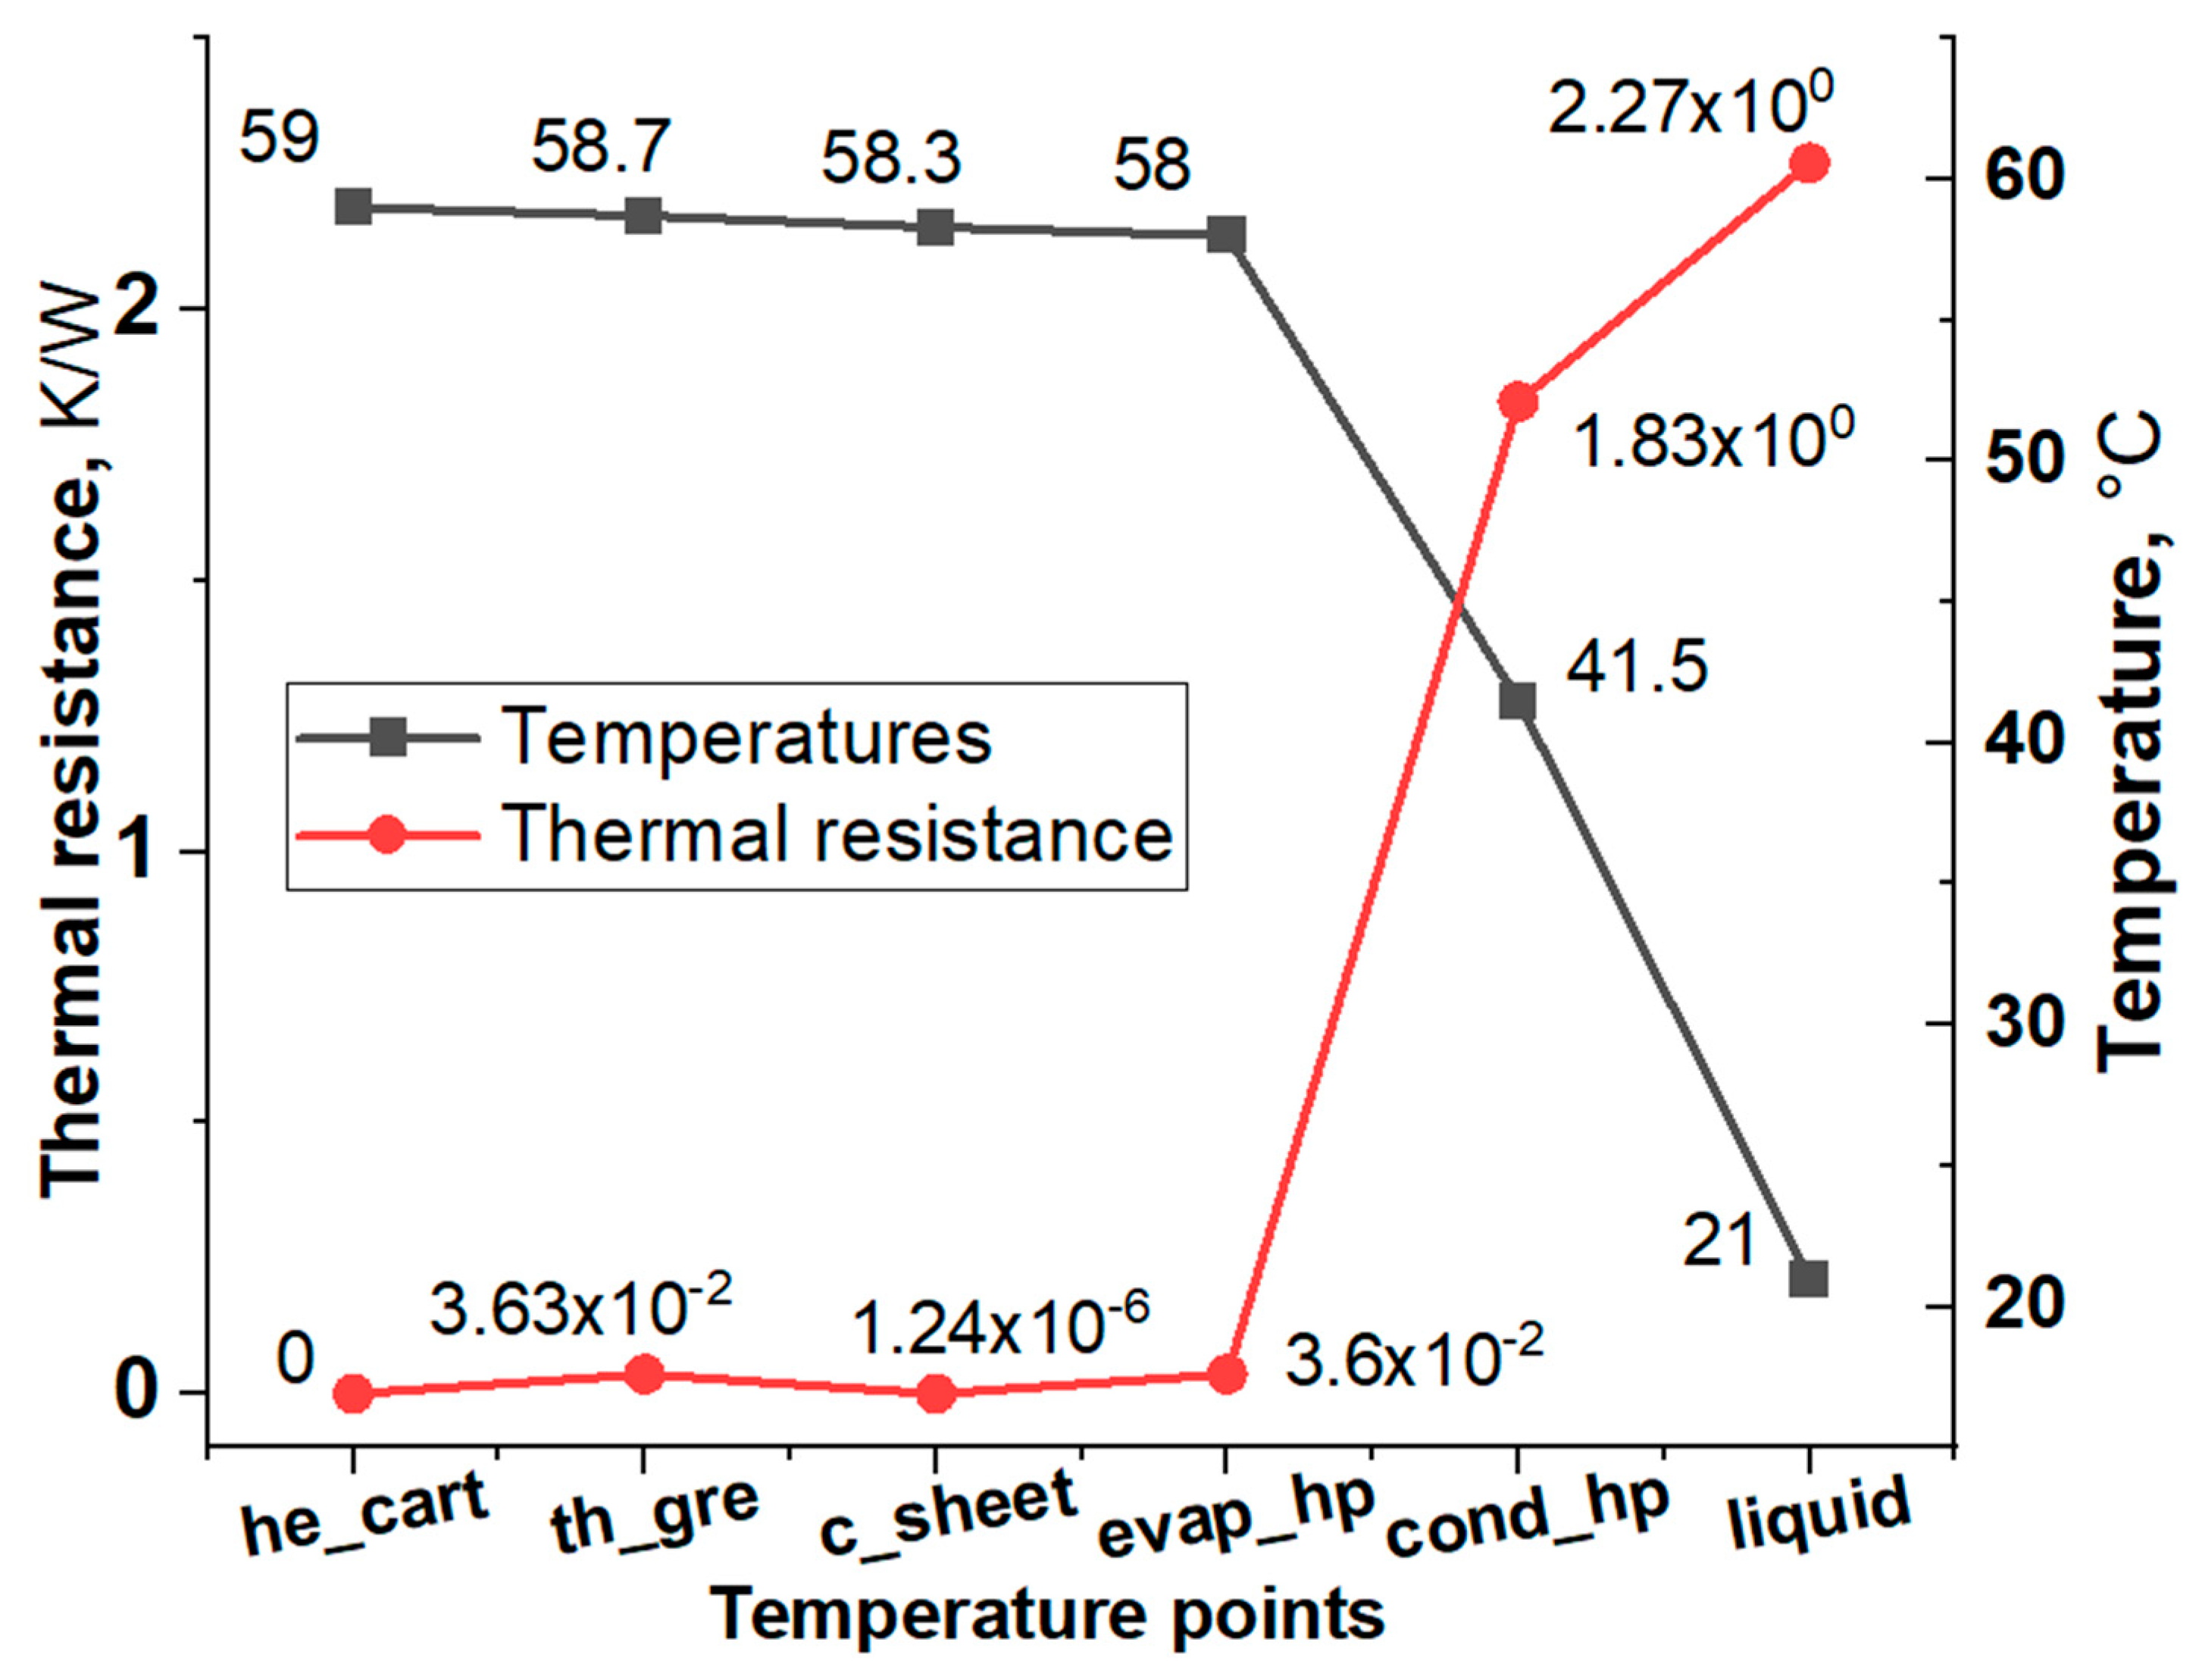
4.2. Determination of High Temperature Range in HP-BTMS Thermal Resistance Model

The overall thermal resistance model of the HP-BTMS ( R t o t a l ) is presented in Figure 7, and the total thermal resistance of the system can be determined using Equation (13).
R t o t a l = T 1 T 6 Q ˙ t h r ;
where T 1 and T 6 are the maximum surface temperature of the heater cartridge and the liquid temperature after boundary layer thickness. Q ˙ t h r represents total heat transfer rate, through the heat pipe and can be calculated using Equation (14).
Q ˙ t h r = m w a t e r C s h c T o u t l e t T i n l e t
where T o u t l e t and T i n l e t are the outlet and the inlet temperatures of the water in the cooling channel, while m w a t e r   and   C s h c are the mass flow rate and specific heat capacity of used water at 20 °C.
This section introduces a one dimensional thermal resistance network model of the system, although heat transfer occurs in three dimensions in the simulation. The network model is based on a single dimension in order to reduce the complexity of the system. Furthermore, the model considers the thermal resistance and thermodynamics properties of each element and calculates temperature distribution in order to identify, the highest thermal resistance and the largest temperature difference on the network. In the future, the results obtained from the model can used to reduce the temperature range and resistance by optimizing the design of the system and its thermal performance. All the thermal resistance used in the network are given in Table 2.
As can be seen in Figure 7 and Figure 8, and Table 2, the highest temperature ranges are between T 4 T 5 and T 5 T 6 . Similarly, the highest thermal resistances are related to those temperature ranges. In future research, these current challenges will be addressed by incorporating fins to improve the heat transfer efficiency, optimize the design of the cooling channel, and reducing the height of the heat pipes.

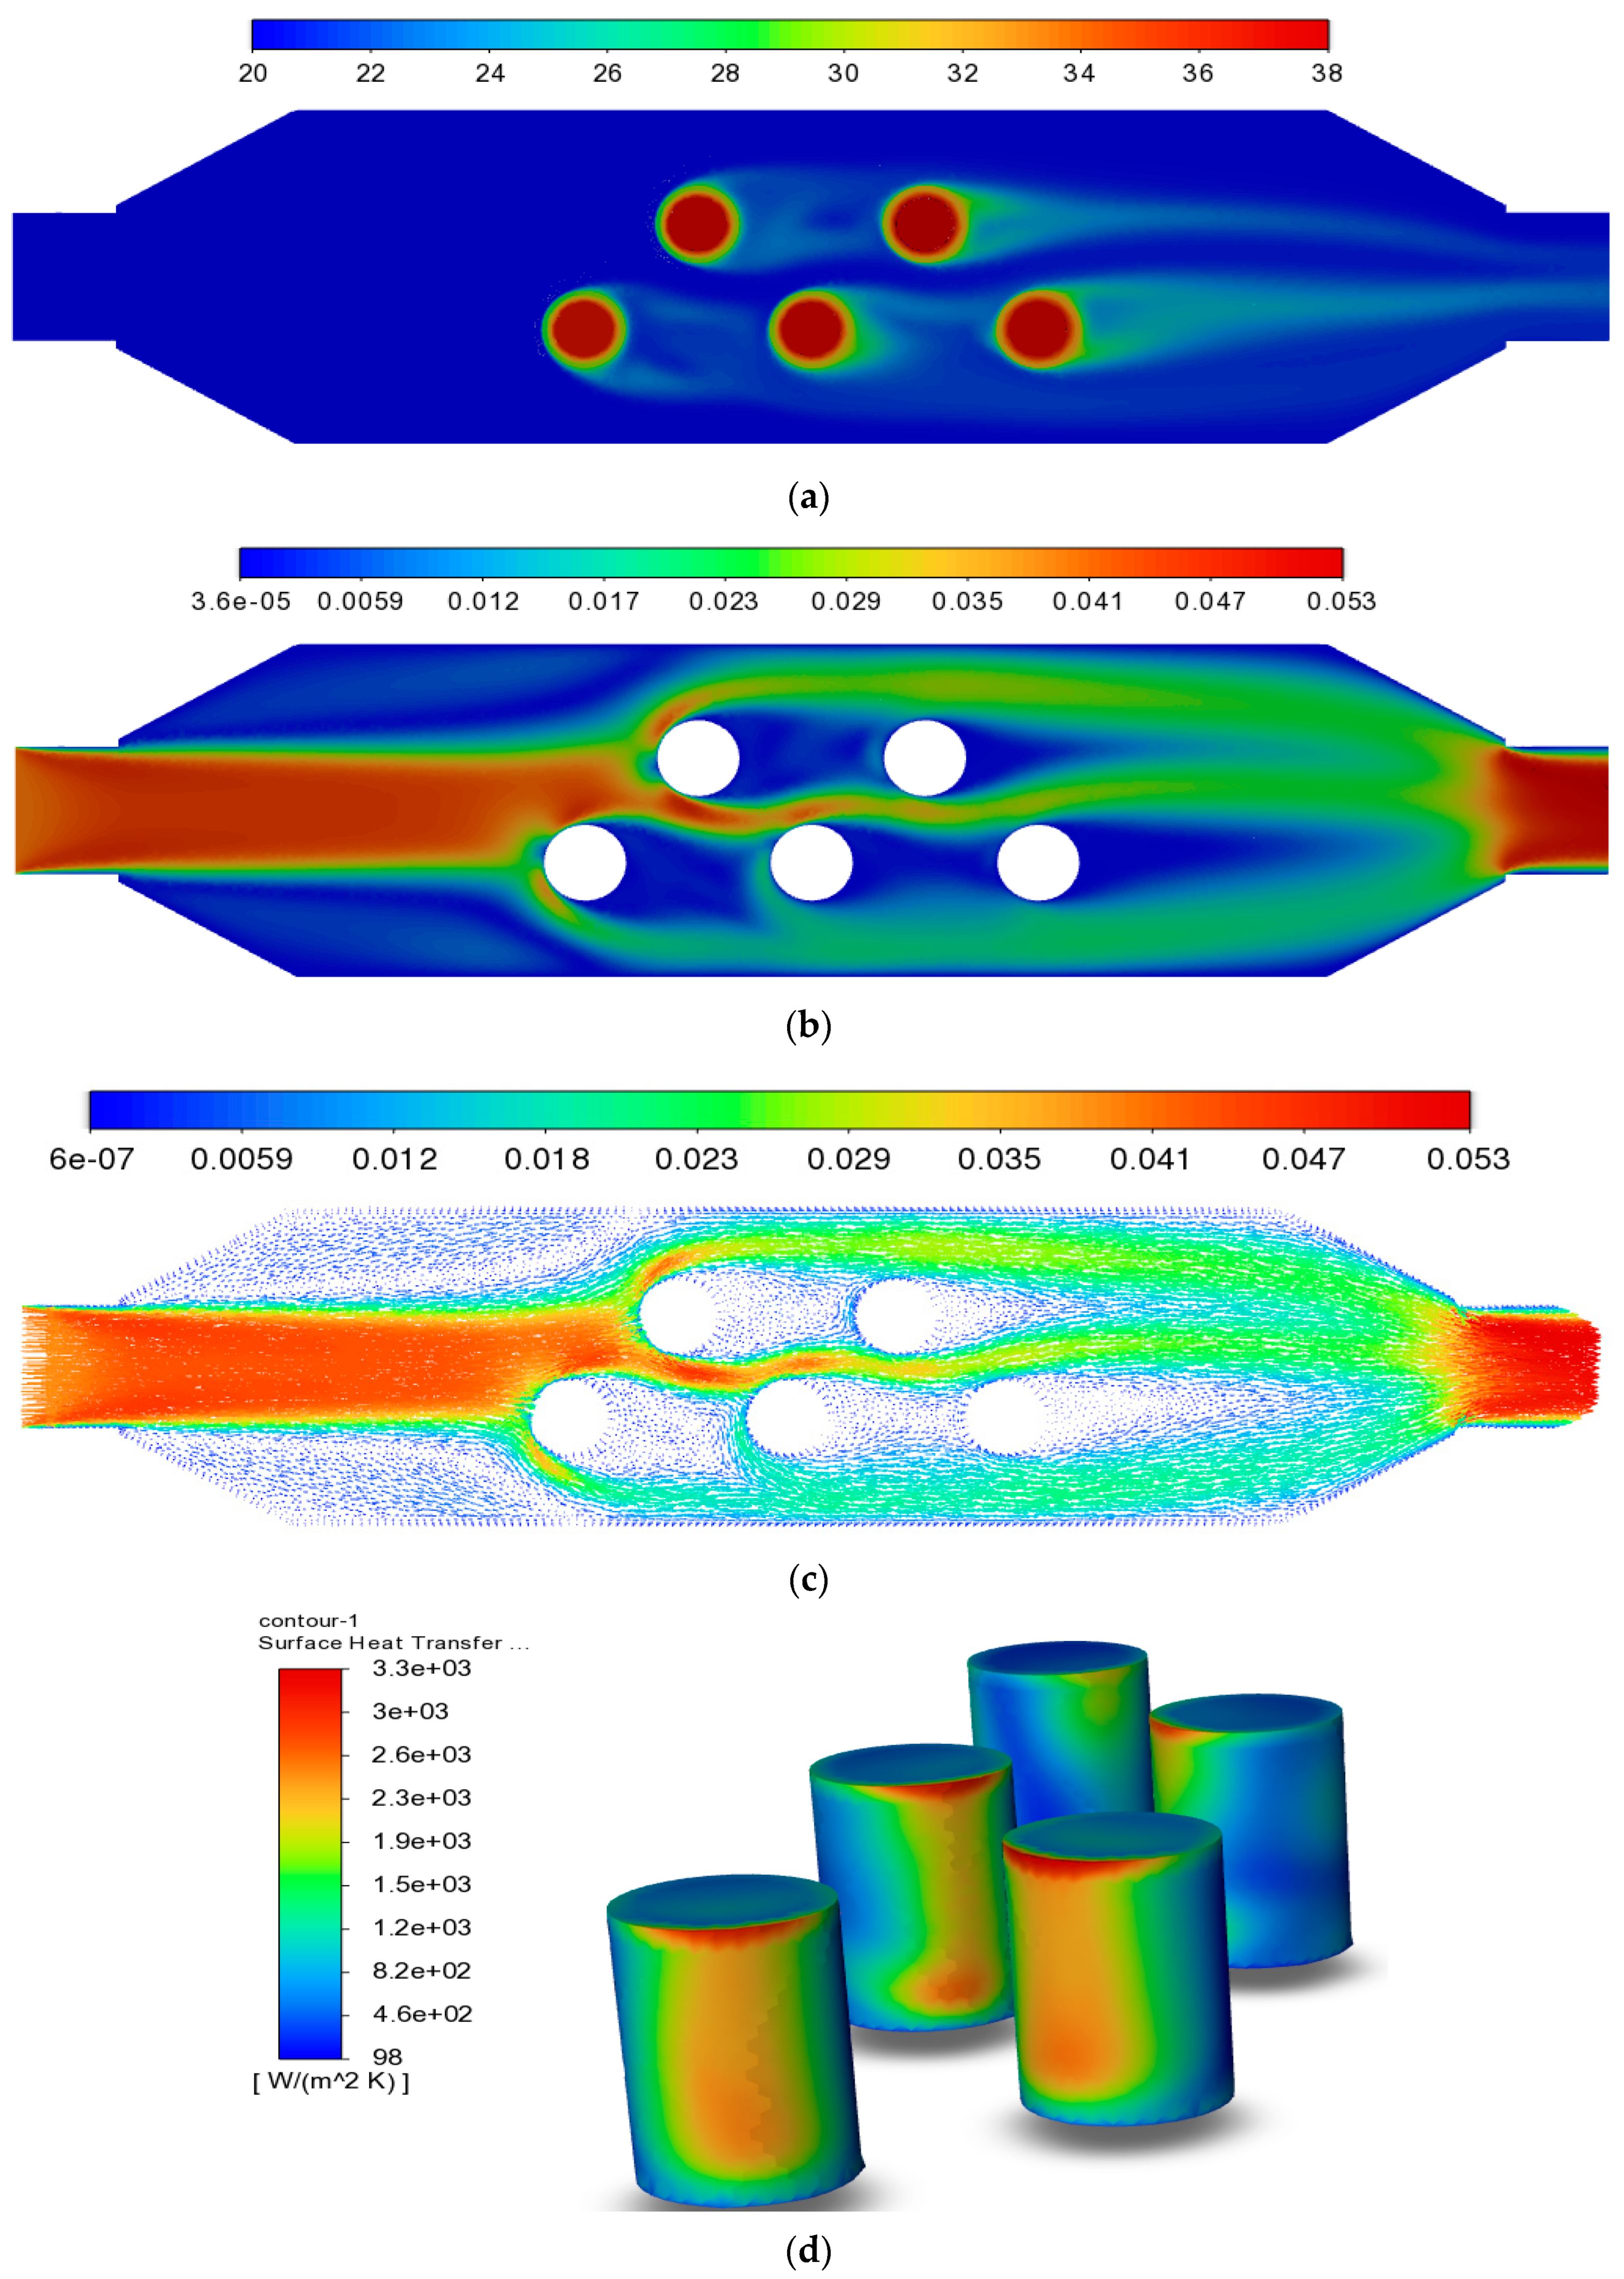
4.3. Flow Pattern and Heat Transfer

In HP-BTMS, convection heat transfer between the condenser surface of the heat pipes and the water significantly impacts the performance of the system. Hence this section focuses on the flow pattern and temperature variation in the cooling channel. Figure 8 illustrates of the liquid flow velocity, velocity vectors and temperature profile in the cooling channel. Here a heat load of 10 W and a cooling temperature of 20 °C was considered for the analysis, and the wall boundary conditions of the channel are set to no-slip. Mathematically, the heat flux is calculated using Fourier’s law.
q i = k i T i l
In this case, k is the thermal conductivity of water, q is the heat flux on the heat pipes, and Ti/∂l is the temperature gradient. Furthermore, Newton’s law is applied for heat exchange from condenser to liquid and it is given by Equation (16):
Q = h × A × ∆T
where, A is heat transfer surface area, h is heat transfer coefficient, Δ T is temperature difference between surface of the heat pipe and liquid temperature and Q is the rate of heat transfer from the heat pipe.
Zukauskas’ correlation was applied to determine the convection heat transfer coefficient. It is also used as a mode of validation of the heat transfer process. In order to calculate, the Nusselt number Equations (17) and (18) were used.
Nu = 0.52 × R e 0.5 × P r 0.36 ;   Re   =   10     50 ;
h = N u × k d h p
The heat pipes in the cooling channel are arranged in a staggered arrangement as shown in Figure 9, in which the tubes are offset from each other creating a zig-zag pattern and forces a liquid to follow a tortuous path as presented in Figure 9b. The water flowing from the inlet at 20 °C temperature at a flow rate of 0.33 L/min, flow through around the five heat pipes absorbing heat and reaches the outlet of the cooling channel. Initially, the undisturbed flow appears uniformly parallel to the channel before it encounters the first heat pipe. However, after reaching the first heat pipe, a boundary layer forms around the heat pipe due to no-slip condition, and flow creates stagnation region at the upstream surface, where the velocity decreases to zero. After passing through the boundary layer thickness of the first pipe, the flow increases its velocity from zero to free stream velocity. Next, as presented in Figure 9c, due to the boundary layer failing to follow the surface contour, flow develops a wake region on the downstream of the cylinder where it creates vortices. As the water flows toward the second pipe, passing downstream of the first heat pipe, a similar flow pattern is observed.
Next, water continues to flow through the second, third and fourth pipes through a tortuous path depending on the distance between each pipe. Flow patterns around pipes can be affected by the location of neighboring pipes and the wall in the cooling channel. In the wake region of the pipes, fluid can separate and reattach, forming vortices. Consequently, the vortices increase mixing within the boundary layer and facilitate heat transfer between the tube and water. Due to water flowing primarily between pipes in a central line, heat flux occurs significantly on the inner side of the pipes as presented in Figure 9c,d. As a result, it increases the heat transfer coefficient on the inner surface of the heat pipes as shown in Figure 9d. Moreover, the heat transfer rate depends on the location of pipes, the space between the pipes and the wall, diameter and Reynolds number. Despite the effectiveness of the staggered arrangement, it also provides an unequal distribution of water flow inside and makes it difficult to keep an equal battery surface temperature.
Figure 10 presents the temperature points on the evaporation section of the heat pipes and heater cartridge surface temperatures. This section explores the reasons behind the temperature difference between the two. Theoretically, a heater cartridge’s surface temperature should be higher than the temperature of the heat pipe evaporation section due to the thermal resistances of the copper sheet and thermal grease, which corresponds with the temperatures of the first, third, and fifth cartridges. There is, however, a lower surface temperature for some cartridges, specifically the second and fourth, due to two specific reasons. First, the second and fourth heat pipes are surrounded by three heater cartridges. Second, the flow pattern in the cooling channel may have also affected the temperature variation on the evaporation side. In general, the temperature difference is 2.5 °C, which was to be expected.

5. Conclusions

In the current study, a hybrid cooling battery thermal management system with gravity-assisted round heat pipe cooled by a cooling channel was numerically developed for a lithium-ion battery module to remove heat generated from batteries during the constant operating scenarios. A HP-BTMS with a novel design in the vertical orientation has been proposed to enhance the heat transfer performance of the heat pipe by utilizing the effect of gravity and a staggered arrangement to enhance the heat transfer from the condenser end to the cooling liquid. Furthermore, the thermal performance of the batteries have been numerically assessed under 4C and 8C rates with varying liquid temperatures at the inlet. Representatively, the following outcomes have been achieved during 8C charge/discharge rate:
  • The design is capable of keeping a temperature difference among batteries under 5 °C when the volumetric flow rate and inlet temperature was maintained at 0.33 L/min and 25 °C, respectively.
  • The maximum temperature was under 64 °C at the same test condition.
  • The heat transfer rate is different on each heat pipe due to the flow pattern and the curved shaped copper sheet. As it was expected, the first, second and third heat pipes transferred slightly more heat power than the forth and fifth.
  • The system level one dimensional thermal resistance network model was used to identify the regions of high thermal resistance in the system.
These valuable results indicate the current hybrid cooling design can keep a temperature difference between batteries within acceptable limits and control maximum temperature under 64 °C at 8C rates for cylindrical shape batteries such as 18650, 2170 and 26650. In the future, it is planned to use fins to enhance the cooling efficiency find determine the fin efficiency and study various designs of the condenser section of the heat pipes with cooling channel to further enhance the heat transfer coefficient and improve the performance of the design to the batteries at pack level.

Author Contributions

Conceptualization, methodology, software, validation and writing original draft preparation, A.B.; reviewing and editing, D.M.W., F.C. and G.T.; supervision, G.T., F.C. and K.H.L.; project administration, resources, and funding acquisition, G.T. All authors have read and agreed to the published version of the manuscript.

Funding

This research received funding from Bolashak scholarship.

Data Availability Statement

Not applicable.

Conflicts of Interest

The authors declare no conflict of interest.

Nomenclature

A surface   area   ( m 2 ) Abbreviations
C heat   capacity   ( J   K 1 ) TECMthermal resistant
network model
Cp specific   heat   ( J   kg 1 K 1 ) PCMphase change materials
ddiameter (mm)EVselectric vehicles
H latent   heat   ( kJ   kg 1 ) BTMSbattery thermal management system
h convective   heat   transfer   coefficient   ( W   m 2 K 1 )
Idischarge current (A) Subscripts
Lthickness (mm)fflow
llength (m)gthermal grease
NuNusselt numberhheat pipe
Qheat (W)rradial
Uvoltage (V)sShell of heat pipe
m mass   flow   rate   of   liquid   ( kg   s 1 ) vvapor
Volumetric flow rate (L/min)wwick
R thermal   resistance   ( K   W 1 ) eevaporation of heat pipe
T temperature   ( ° C ) ccondenser of heat pipe
V volume   ( m 3 )
Greek symbols
μ Dynamic   vapor   viscosity   ( kg   m 1 s 1 )
τ time (s)
ρ density   ( kg   m 3 )
λ thermal   conductivity   ( W   m 1 K 1 )

References

  1. Global EV Outlook 2022—Data Product—IEA. Available online: https://www.iea.org/data-and-statistics/data-product/global-ev-outlook-2022 (accessed on 10 April 2023).
  2. The Influence of Government Incentives on Electric Vehicle Adoption: Cross-National Comparison. Available online: https://www.researchgate.net/publication/348687386_The_Influence_of_Government_Incentives_on_Electric_Vehicle_Adoption_Cross-national_Comparison (accessed on 10 April 2023).
  3. Lang, J.; Zhang, X.; Liu, B.; Wang, R.; Chen, J.; Yan, X. The roles of graphene in advanced Li-ion hybrid supercapacitors. J. Energy Chem. 2018, 27, 43–56. [Google Scholar] [CrossRef]
  4. Specific Heat Capacity of Lithium Ion Cells—Battery Design. Available online: https://www.batterydesign.net/specific-heat-capacity-of-lithium-ion-cells/ (accessed on 27 March 2023).
  5. Rao, Z.; Wang, S. A review of power battery thermal energy management. Renew. Sustain. Energy Rev. 2011, 15, 4554–4571. [Google Scholar] [CrossRef]
  6. Zhang, F.; Lin, A.; Wang, P.; Liu, P. Optimization design of a parallel air-cooled battery thermal management system with spoilers. Appl. Therm. Eng. 2021, 182, 116062. [Google Scholar] [CrossRef]
  7. Saw, L.H.; Tay, A.A.O.; Zhang, L.W. Thermal management of lithium-ion battery pack with liquid cooling. In Proceedings of the 2015 31st Thermal Measurement, Modeling & Management Symposium (SEMI-THERM), San Jose, CA, USA, 15–19 March 2015; pp. 298–302. [Google Scholar] [CrossRef]
  8. Greco, A.; Cao, D.; Jiang, X.; Yang, H. A theoretical and computational study of lithium-ion battery thermal management for electric vehicles using heat pipes. J. Power Sources 2014, 257, 344–355. [Google Scholar] [CrossRef]
  9. Liu, C.; Xu, D.; Weng, J.; Zhou, S.; Li, W.; Wan, Y.; Jiang, S.; Zhou, D.; Wang, J.; Huang, Q. Phase Change Materials Application in Battery Thermal Management System: A Review. Materials 2020, 13, 4622. [Google Scholar] [CrossRef] [PubMed]
  10. Roe, C.; Feng, X.; White, G.; Li, R.; Wang, H.; Rui, X.; Li, C.; Zhang, F.; Null, V.; Parkes, M.; et al. Immersion cooling for lithium-ion batteries—A review. J. Power Sources 2022, 525, 231094. [Google Scholar] [CrossRef]
  11. Ling, Z.; Wang, F.; Fang, X.; Gao, X.; Zhang, Z. A hybrid thermal management system for lithium ion batteries combining phase change materials with forced-air cooling. Appl. Energy 2015, 148, 403–409. [Google Scholar] [CrossRef]
  12. Fan, Y.; Bao, Y.; Ling, C.; Chu, Y.; Tan, X.; Yang, S. Experimental study on the thermal management performance of air cooling for high energy density cylindrical lithium-ion batteries. Appl. Therm. Eng. 2019, 155, 96–109. [Google Scholar] [CrossRef]
  13. Chen, D.; Jiang, J.; Kim, G.-H.; Yang, C.; Pesaran, A. Comparison of different cooling methods for lithium ion battery cells. Appl. Therm. Eng. 2016, 94, 846–854. [Google Scholar] [CrossRef]
  14. Zhou, H.; Zhou, F.; Zhang, Q.; Wang, Q.; Song, Z. Thermal management of cylindrical lithium-ion battery based on a liquid cooling method with half-helical duct. Appl. Therm. Eng. 2019, 162, 114257. [Google Scholar] [CrossRef]
  15. Huo, Y.; Rao, Z.; Liu, X.; Zhao, J. Investigation of power battery thermal management by using mini-channel cold plate. Energy Convers. Manag. 2015, 89, 387–395. [Google Scholar] [CrossRef]
  16. Jiang, Z.; Qu, Z. Lithium–ion battery thermal management using heat pipe and phase change material during discharge–charge cycle: A comprehensive numerical study. Appl. Energy 2019, 242, 378–392. [Google Scholar] [CrossRef]
  17. Coleman, B.; Ostanek, J.; Heinzel, J. Reducing cell-to-cell spacing for large-format lithium ion battery modules with aluminum or PCM heat sinks under failure conditions. Appl. Energy 2016, 180, 14–26. [Google Scholar] [CrossRef]
  18. Wang, Z.; Zhang, H.; Xia, X. Experimental investigation on the thermal behavior of cylindrical battery with composite paraffin and fin structure. Int. J. Heat Mass Transf. 2017, 109, 958–970. [Google Scholar] [CrossRef]
  19. Wu, W.; Yang, X.; Zhang, G.; Chen, K.; Wang, S. Experimental investigation on the thermal performance of heat pipe-assisted phase change material based battery thermal management system. Energy Convers. Manag. 2017, 138, 486–492. [Google Scholar] [CrossRef]
  20. Mortazavi, B.; Yang, H.; Mohebbi, F.; Cuniberti, G.; Rabczuk, T. Graphene or h-BN paraffin composite structures for the thermal management of Li-ion batteries: A multiscale investigation. Appl. Energy 2017, 202, 323–334. [Google Scholar] [CrossRef]
  21. Zheng, M.; Liu, Y.; Ma, Z.; Li, Y.; Li, D.; Lu, Z.; Song, H.; Guo, X.; Shao, W. Numerical study on power battery thermal management system based on heat pipe technology. Energy Rep. 2023, 9, 350–361. [Google Scholar] [CrossRef]
  22. Hwang, F.S.; Confrey, T.; Scully, S.; Callaghan, D.; Nolan, C.; Kent, N.; Flannery, B. Modelling of heat generation in an 18650 lithium-ion battery cell under varying discharge rates. In Proceedings of the 5th Thermal and Fluids Engineering Conference (TFEC), New Orleans, LA, USA, 5–8 April 2020. [Google Scholar] [CrossRef]
  23. Ye, Y.; Saw, L.H.; Shi, Y.; Tay, A.A. Numerical analyses on optimizing a heat pipe thermal management system for lithium-ion batteries during fast charging. Appl. Therm. Eng. 2015, 86, 281–291. [Google Scholar] [CrossRef]
  24. Zhao, R.; Gu, J.; Liu, J. An experimental study of heat pipe thermal management system with wet cooling method for lithium ion batteries. J. Power Sources 2015, 273, 1089–1097. [Google Scholar] [CrossRef]
  25. Zhao, C.; Cao, W.; Dong, T.; Jiang, F. Thermal behavior study of discharging/charging cylindrical lithium-ion battery module cooled by channeled liquid flow. Int. J. Heat Mass Transf. 2018, 120, 751–762. [Google Scholar] [CrossRef]
  26. Wang, Q.; Jiang, B.; Xue, Q.; Sun, H.; Li, B.; Zou, H.; Yan, Y. Experimental investigation on EV battery cooling and heating by heat pipes. Appl. Therm. Eng. 2015, 88, 54–60. [Google Scholar] [CrossRef]
  27. Liang, J.; Gan, Y.; Li, Y. Investigation on the thermal performance of a battery thermal management system using heat pipe under different ambient temperatures. Energy Convers. Manag. 2018, 155, 1–9. [Google Scholar] [CrossRef]
  28. Gan, Y.; He, L.; Liang, J.; Tan, M.; Xiong, T.; Li, Y. A numerical study on the performance of a thermal management system for a battery pack with cylindrical cells based on heat pipes. Appl. Therm. Eng. 2020, 179, 115740. [Google Scholar] [CrossRef]
  29. Feng, L.; Zhou, S.; Li, Y.; Wang, Y.; Zhao, Q.; Luo, C.; Wang, G.; Yan, K. Experimental investigation of thermal and strain management for lithium-ion battery pack in heat pipe cooling. J. Energy Storage 2018, 16, 84–92. [Google Scholar] [CrossRef]
  30. Reay, D.; Kew, P.; McGlen, R. Heat pipe components and materials. In Heat Pipes; Elsevier: Amsterdam, The Netherlands, 2014; pp. 65–94. [Google Scholar] [CrossRef]
  31. Zichen, W.; Changqing, D. A comprehensive review on thermal management systems for power lithium-ion batteries. Renew. Sustain. Energy Rev. 2021, 139, 110685. [Google Scholar] [CrossRef]
  32. Drake, S.J.; Martin, M.; Wetz, D.A.; Ostanek, J.K.; Miller, S.P.; Heinzel, J.M.; Jain, A. Heat generation rate measurement in a Li-ion cell at large C-rates through temperature and heat flux measurements. J Power Sources 2015, 285, 266–273. [Google Scholar] [CrossRef]
  33. Smith, J.; Singh, R.; Hinterberger, M.; Mochizuki, M. Battery thermal management system for electric vehicle using heat pipes. Int. J. Therm. Sci. 2018, 134, 517–529. [Google Scholar] [CrossRef]
Figure 1. Geometric model of heat-pipe-based BTMS. (a) front view of the cooling channel, (b) bottom view of the cooling channel, (c) a total view of the test-rig, (d) top view of the cooling channel.
Batteries 09 00456 g001
Figure 2. Mesh independent test: (a) Outlet point temperature and (b) inlet pressure.
Batteries 09 00456 g002
Figure 3. Thermal resistance network model of the HP based BTMS.
Batteries 09 00456 g003
Figure 4. (a) an experimental test-rig, (b) bottom view of the test block with temperature points, (c) top view of the cooling channel with temperature points (blue arrow is the sign of inlet direction while red arrow is outlet).
Batteries 09 00456 g004aBatteries 09 00456 g004b
Figure 5. Numerical and experimental data at each temperature point at 10 W, 0.33 L/min and 25 °C temperature test-case scenario.
Batteries 09 00456 g005
Figure 6. Temperature at different locations (a) at 5 W and (b) 10 W head load at 0.33 L/min for three different cooling temperatures 15 °C, 20 °C, and 25 °C.
Batteries 09 00456 g006
Figure 7. System level thermal resistance network model with heat pipes and cooling channel, heat pipe thermal resistance with heater cartridge and copper sheet.
Batteries 09 00456 g007
Figure 8. Thermal resistances and temperature points in each body and surfaces.
Batteries 09 00456 g008
Figure 9. Flow pattern in the cooling channel, (a) temperature flow, (b) velocity, (c) velocity vectors and (d) surface heat transfer coefficients of the five heat pipes pattern repeats continuously.
Batteries 09 00456 g009
Figure 10. Temperature points and difference between the evaporation section of heat pipes and heater cartridge surface temperatures at 10 W and 15 °C.
Batteries 09 00456 g010
Table 1. Thermodynamics material properties [30].
MaterialP (kg m−3)K (W m−1 K−1)Cp (J kg−1 K−1)
Air1.2250.02421006
Aluminum2719202.4871
Copper8978387.6381
Vapor0.030372,044,2011874
Wick35001.5790
Thermal grease16001.421700
Table 2. Equations and calculated equivalent thermal resistances of the heat pipe and system.
PartSymbolEquation
Thermal grease R t h e r m . g r e L/ λ A
Copper sheet R c o p p . s h ln r o / r i 2 π λ c l c
Evap. Copper R r a d i a l ln r c / r w 2 π λ c l e
Cond. Copper R c o n d . c ln r c / r w 2 π λ c l c
Evap. Wick R e v . w ln r o / r i 2 π λ c l e
Cond. Wick R c o n d . w ln r w / r v 2 π λ w l c
Adiab. Wick R a d . w i c k L/ λ w A
Adiab. Copper R a d . c o p p L/ λ w A
Convective R c o n v 1 2 π r o u t l h
Table 3. Geometrical properties of round heat pipes.
ParameterValues (mm)
Outer diameter, d o 8
Adiabatic length, L a 62
Evaporation length, L e 75
Condenser length, L c 13
Total length, L t 150
Table 4. Test matrix.
NoHeat InputFlow RateCooling Temperature
15 W0.33 L/min15, 20, 25 °C
210 W0.33 L/min
Table 5. Experimental uncertainty.
ParametersUncertainty
K-Type thermocouples0.6 °C
NI modules1%
DC power supply1.5%
Heater cartridges2%
Pressure device1%
Flow meter with valve1%
Disclaimer/Publisher’s Note: The statements, opinions and data contained in all publications are solely those of the individual author(s) and contributor(s) and not of MDPI and/or the editor(s). MDPI and/or the editor(s) disclaim responsibility for any injury to people or property resulting from any ideas, methods, instructions or products referred to in the content.

