Article

Online Fast Charging Model without Lithium Plating for Long-Dimensional Cells in Automotive Applications

1
School of Mechanical Engineering, University of Shanghai for Science and Technology, Shanghai 200093, China
2
School of Vehicle and Mobility, Tsinghua University, Beijing 100084, China
*
Authors to whom correspondence should be addressed.
Batteries 2023, 9(12), 563; https://doi.org/10.3390/batteries9120563
Submission received: 19 October 2023 / Revised: 17 November 2023 / Accepted: 21 November 2023 / Published: 22 November 2023

Abstract

:
The internal negative electrode potential in lithium-ion batteries (LIBs) is intricately linked to the lithium-ion intercalation and plating reactions occurring within the cell. With the expansion of cell sizes, the internal negative electrode potential distribution gradually becomes inconsistent. However, the existing negative electrode potential estimation models and fast charging strategies have not yet considered the impact of consistency, and the model estimation accuracy will be greatly influenced by different temperatures and charging rates. This study proposes an online lithium-free fast charging equivalent circuit model (OLFEM) for estimating the negative electrode potential terminal voltage and developing fast charging strategies of long-dimensional LIBs in real vehicles. This study employs distributed reference electrodes integrated into long-dimensional LIBs and compares the negative electrode potential measured in the vicinity of both the negative and positive tabs. Subsequently, based on the lowest negative electrode potential point, model parameters were obtained at different temperatures and charging rates. This model is further verified under different operating conditions. Finally, a fast-charging strategy without lithium plating is developed in real-time based on the negative electrode potential estimated by the model. The results demonstrate that long-dimensional cells exhibit a lower negative electrode potential on the positive tab side. Across various temperatures and charging rates, the calibrated model achieves a negative electrode potential estimated error within 25 mV, and the estimation error for terminal voltage is within 5 mV. The proposed fast-charging method prevents lithium plating and charges the cell up to 96.8% within an hour. After 100 cycles, the cell experiences a capacity degradation of less than 2%, and the disassembly results indicate that no lithium precipitation has occurred. The methods outlined in this study provide valuable insights for online fast charging of large-dimensional batteries without lithium plating.

Graphical Abstract

1. Introduction

Electric vehicles (EVs) are rapidly evolving in the context of global carbon neutrality and environmental protection [1,2]. They have the potential to replace traditional fuel vehicles due to their zero emissions, low noise, and high energy conversion efficiency [3,4,5]. However, the use of LIBs as the primary power source for EVs comes with the drawbacks of long charging times and safety problems. Conventional fuel vehicles can be refueled in a matter of minutes, typically within five minutes, whereas EVs require charging times that are generally measured in hours. Therefore, there is an imperative requirement for EVs to have the capability to charge quickly [6,7,8]. However, when LIBs are charged too quickly and improperly, as can occur during low-temperature fast charging [9,10], uncontrolled extreme fast charging [11,12], or overcharging [13,14], the lithium ions contained within the cell can be reduced to lithium metal on the negative electrode surface, leading to a phenomenon known as lithium plating [15,16]. Both the lifecycle and safety of LIBs are significantly impacted by lithium plating. On the one hand, the lithium metal plated on the cell’s surface cannot be fully converted back to lithium ions during cycling [17], resulting in irreversible degradation of cell capacity. On the other hand, if lithium metal deposits continually, the separator will be punctured, which will cause a short circuit between the positive and negative electrodes and potentially trigger thermal runaway in the cell [18,19]. Therefore, preventing lithium plating during the fast-charging process of the cell is of paramount importance.
The conventional approach to charging typically employs constant-current and constant-voltage charging (CC-CV). Although it is simple and easy to implement [20], the charging time is too long. To enhance the charging speed of LIBs and prevent lithium plating, it is essential to refine and optimize the charging strategy. In recent years, several charging strategies based on CC-CV have been proposed, such as multi-stage constant-current and constant-voltage charging (MCC-CV) schemes [21]. Nevertheless, precise experimental calibration is required to determine the optimal timing for current reduction and the duration of each constant-current phase. Linear current decay (LCD) protocols involve charging the cell at an initial high current rate followed by a linear decrease to mitigate polarization. These protocols offer short charging durations and extended cycle life. However, randomly initiating charging from a state of charge (SOC) in this manner can result in lithium plating and overcharging. There are also fast-charging strategies that rely on cell feedback and model simulations. Considering the relationship between lithium plating and the negative electrode potential of the cell, one approach involves implanting a reference electrode in the cell to measure the negative electrode potential and achieve fast charging without lithium plating by controlling this potential [22,23,24]. However, it is not feasible for real cells to constantly carry reference electrodes for negative electrode potential measurements in practical scenarios. To simulate the negative electrode potential of a cell, it is necessary to establish a model that accurately describes the reaction processes within the lithium-ion cell [25]. The most used electrochemical models for simulating cells include the pseudo-two-dimensional (P2D) model [26], the simplified pseudo-two-dimensional (SP2D) model [27], and the single particle (SP) model [28]. These models are based on material and charge transfer phenomena within the cell, enabling high-accuracy simulations of the cell’s state. Nonetheless, the calibration process for these models can be laborious, and solving partial differential equations demands substantial computational resources. Therefore, implementing these models in actual vehicle battery management systems (BMS) is challenging. Other commonly used equivalent circuit model for cell simulation includes the internal resistance model (Rint) [29], the first-order RC model (Thevenin) [30], and the dual polarization model (DP) [31]. The Rint model represents the most fundamental equivalent circuit model, allowing for simple parameter identification but exhibiting low accuracy. It fails to account for critical characteristics such as cell polarization and depolarization. The first-order RC model can simulate the dynamic processes while also having straightforward parameter identification and low computational requirements, making it suitable for BMS applications. Lastly, the dual-polarization model offers a slight improvement in accuracy, but it comes at the cost of doubled computational load.
Zhao et al. [32] introduce a half-cell equivalent circuit model based on reference electrodes. The simulated negative electrode potential exhibits an exceptionally precise correlation with the electrochemical model. Lu et al. [33] have further refined this model with reference electrodes, which have been experimentally verified and improved. The divide-equivalent circuit model (DEM) is built upon the first-order RC model and the extended Kalman filter (EKF), allowing for online prediction of negative electrode potential to optimize fast charging. However, this model is only suitable for cells in specific states. If the cell experiences changes in aging, temperature, or charge rate, the simulation accuracy significantly diminishes. It should be noted that the negative electrode potential only reflects the potential of the specific region where the reference electrode is implanted, and it does not represent the distribution of the entire cell’s negative electrode potential. Currently, cell sizes are continuously increasing in pursuit of higher energy density, leading to increasingly uneven internal potential distribution. Therefore, it is crucial to comprehensively consider the potential distribution across the entire cell when designing a more rational fast-charging strategy.
In this study, a distributed reference electrode implantation experiment is conducted on an elongated cell, revealing that the negative electrode potential on the positive tab side of the cell is lower during the charging process. Based on this, an equivalent circuit model is established for online fast charging without lithium plating at multiple temperatures and charge rates. The choice for modeling is the first-order RC equivalent circuit model, which is better suited for BMS applications. The online closed-loop estimation of the negative electrode potential is proposed based on the EKF, and a current control algorithm is employed to develop a fast-charging strategy that prevents lithium plating.
The remainder of the study is organized as follows. In Section 2, the principle of OLFEM in this study is presented. Section 3 outlines the fabrication, activation, calibration, and validation experiments of the reference electrode and OLFEM parameters. In Section 4, the experimental results and offers explanations are analyzed in detail. Finally, the conclusions are provided in Section 5.

2. Methodology

This section introduces the principles of OLFEM, which can be divided into two main components: the closed-loop estimation of the negative electrode potential based on the EKF and current control based on the negative electrode potential [24]. Subsequent sections will provide detailed explanations for each of these components.

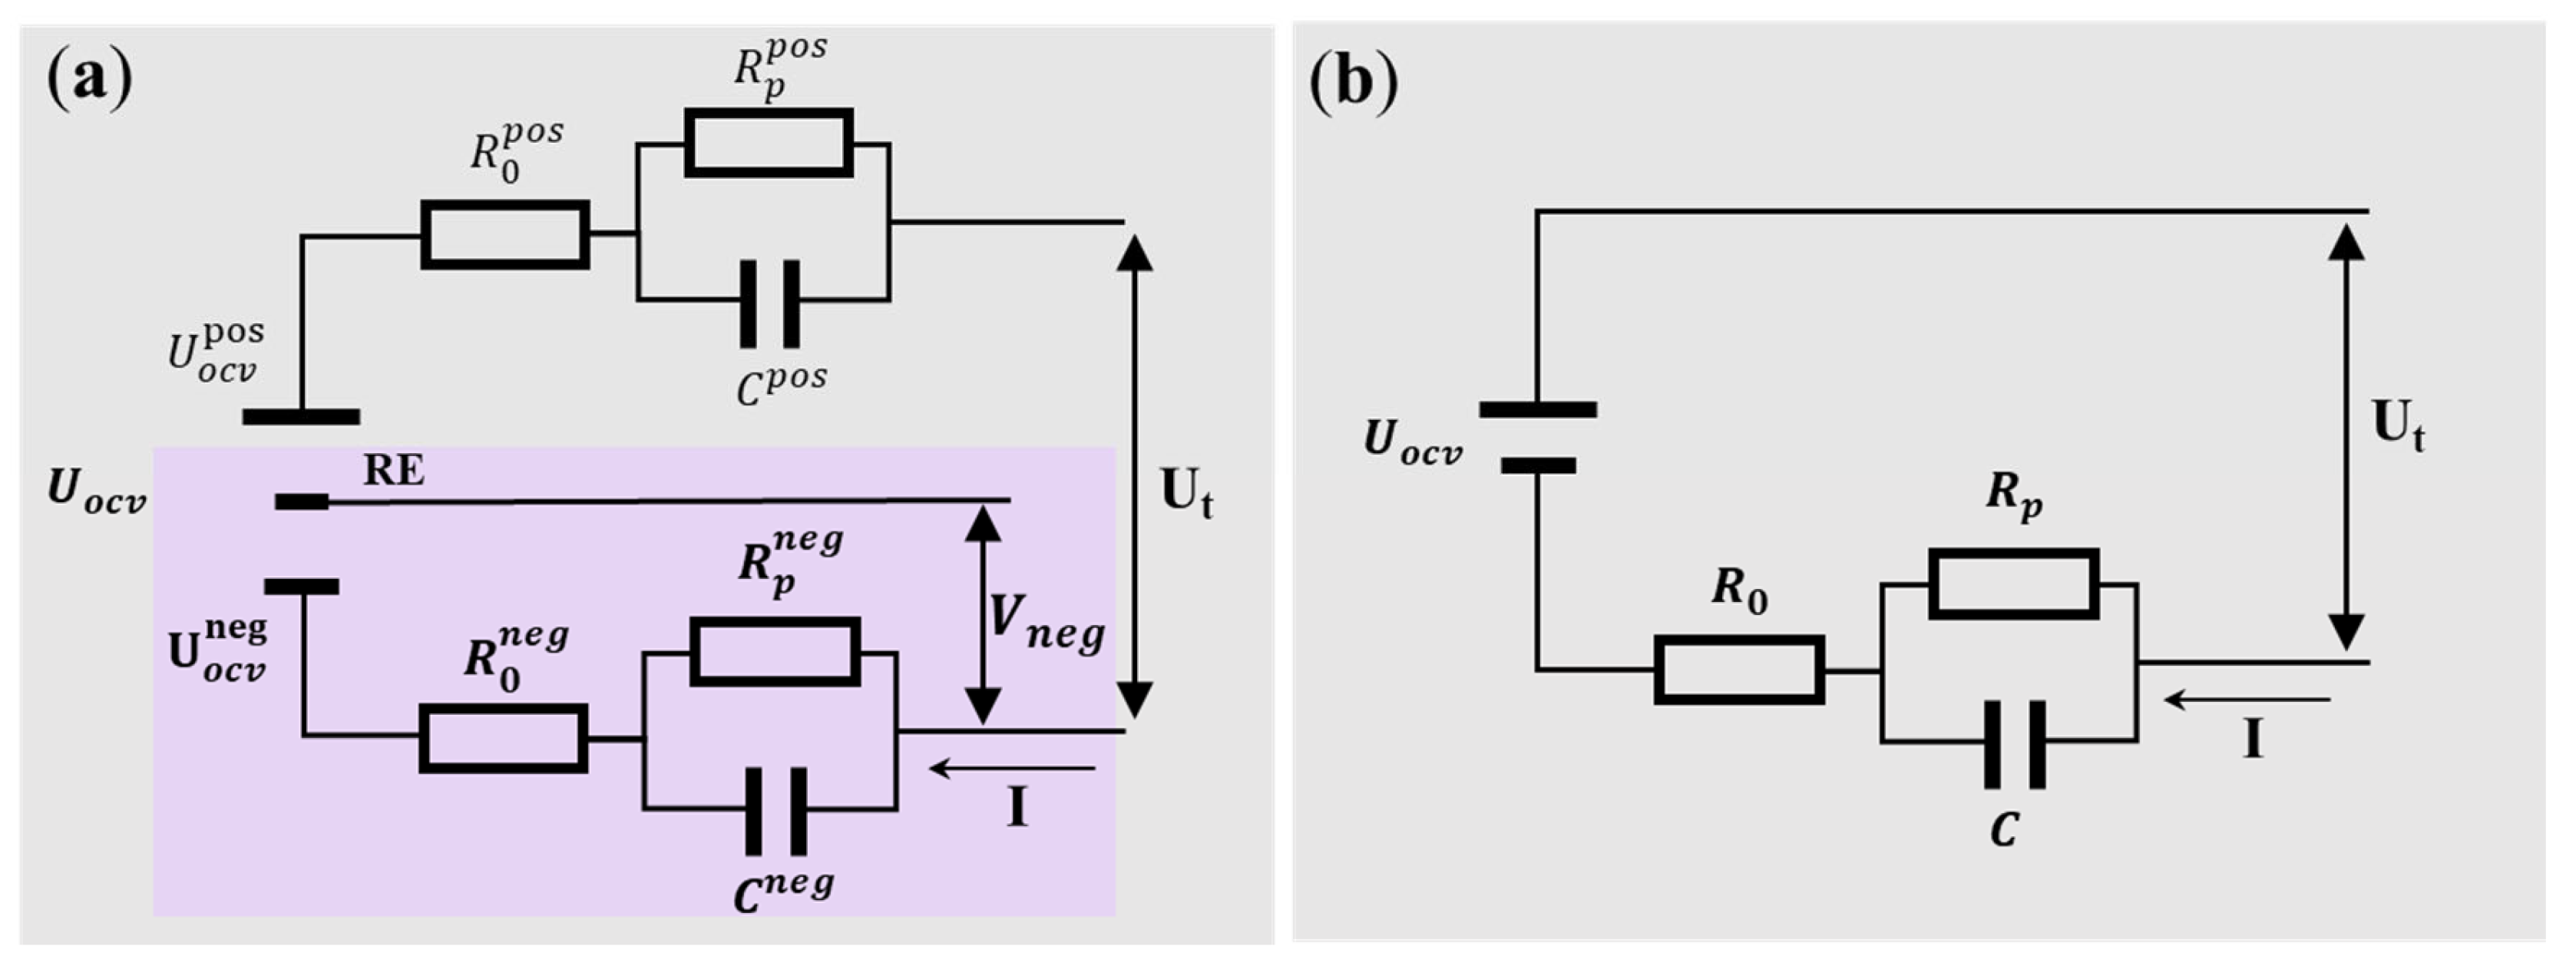
2.1. Theory of Negative Electrode Potential Closed-Loop Estimation

The installation of reference electrodes within the cell divides the cell into two sections: positive and negative. To simulate the negative electrode potential ( V neg ), it is necessary to consider the open-circuit voltage ( U ocv neg ), ohmic resistance ( R 0 neg ), polarization resistance ( R p neg ), and capacitance ( C p neg ) on the negative side of the cell, as shown in Figure 1a, where the superscript pos indicates the positive electrode and neg indicates the negative electrode. At present, the model can perform a simple open-loop estimation of the negative electrode potential. However, if the initial state provided by the BMS is incorrect, meeting the accuracy requirements of the open-loop method based on the equivalent circuit becomes challenging [34]. To improve the accuracy and robustness of the model, a closed-loop correction of the negative electrode potential estimate based on the EKF algorithm is proposed in this study. During real vehicle operation, it can be challenging to obtain cell signals beyond current, voltage, and temperature. Hence, the discrepancy between real-time measured cell terminal voltage and the model-estimated terminal voltage serves as a feedback signal [35]. The EKF promptly corrects the simulation results using this signal to ensure precise monitoring of cell dynamics. Meanwhile, it is also necessary to obtain the overall cell parameters such as U o c v , R 0 , R p and C p to simulate the cell terminal voltage ( U t ), as shown in Figure 1b. The output potential can be calculated using the overpotential and the additional voltage drop caused by ohmic resistance and polarization, as shown in Equations (1) and (2). V p is the polarization voltage, and V p n e g is the polarization voltage on the negative side. The cell’s current is denoted as ‘ I ‘. In this study, the charging current is positive and the discharging current is negative.
U t = U O C V + I R 0 + V p
V n e g = U O C V n e g I R 0 n e g V p n e g
The current is one of the model inputs, and it can only be obtained from the current sensor of the experimental platform at a fixed frequency. Consequently, current data are discrete. Assume V P ( t ) is the voltage across the capacitor at time t , and V c is the capacitor’s voltage when fully charged. The description of the capacitor’s voltage over time t is shown in Equation (3).
V p ( t + Δ t ) = V p ( t ) + ( V c V p ( t ) ) × [ 1 exp ( Δ t R p C ) ]
where Δ t is the sampling time interval. The voltage of a fully charged capacitor is equal to the voltage across the polarizing resistor ( R P ) when I flows through it, as shown in Equation (4).
V c = I × R p
Upon inputting the RC parameters of the overall cell and the negative portion into Equations (3) and (4), the respective polarization voltages for their respective RC branches can be obtained as shown in Equations (5) and (6).
V p ( t + Δ t ) = V p ( t ) exp ( Δ t τ ) + I ( t ) R p ( t ) [ 1 exp ( Δ t τ ) ]
V p n e g ( t + Δ t ) = V p n e g ( t ) exp ( Δ t τ n e g ) + I ( t ) R p n e g ( t ) [ 1 exp ( Δ t τ n e g ) ]
τ = R p C p and τ n e g = R p n e g C p n e g represent the overall and negative time constants of the polarization process. Then, the calculated values for the terminal voltage U ^ t and negative electrode potential V ^ n e g of the cell can be directly obtained, as shown in Equations (7) and (8).
U ^ t ( t + Δ t ) = U O C V ( t + Δ t ) + I ( t ) R 0 ( t ) + V p ( t + Δ t )
V ^ n e g ( t + Δ t ) = U O C V n e g ( t + Δ t ) I ( t ) R 0 n e g ( t ) V p n e g ( t + Δ t )
For parameter identification of OLFEM, Particle Swarm Optimization (PSO), Genetic Algorithm (GA), and Least Squares (LS) can be used. In this study, the model’s parameters are optimized and identified using the LS algorithm implemented in MATLAB. Training data are obtained by measuring cells with reference electrodes, which enables a connection to be established between circuit dynamics and chemical mechanisms within the cell. When OLFEM is implemented in BMS, it can predict the negative electrode potential of a cell with identical parameters, even without reference electrodes. This is because the cell with implanted reference electrodes is used and tested during the model calibration process. At the same time, information about the parameters of both the overall and negative electrodes is obtained during the model parameterization process.

2.2. Current Control Theory

After obtaining the estimation model of the negative electrode potential, an appropriate charging current can be selected based on the estimated negative electrode potential to ensure that the negative electrode potential remains above 0 V during the charging process. The current prediction can be adjusted at different intervals according to vehicle conditions. The specific algorithm for controlling the current is outlined below.
This study focuses on the constraints of negative electrode potential and the determination of the maximum charging current for a duration of Δt seconds. Meanwhile, the negative electrode potential remains above 0 throughout the charging process. Assume V min n e g is the cell’s negative electrode potential threshold and I max c h is the maximum charging current within Δ t seconds. According to the first-order RC model on the negative portion, the negative electrode potential can be calculated after Δ t seconds, as shown in Equation (9).
V n e g ( t + Δ t ) = O C V n e g ( S O C ( t + Δ t ) ) V p n e g t + Δ t R 0 n e g I ( t )
where the negative polarization is as shown in Equation (10).
V p n e g ( t + Δ t ) = V p n e g ( t ) exp ( Δ t / R p n e g / C n e g ) + I ( t ) R p n e g ( 1 exp ( Δ t / R p n e g / C n e g ) )
The nonlinear term OCV a n ( S O C ( t + Δ t ) ) in Equation (9) is estimated using the first-order Taylor formula shown in Equation (11). Where C b a t is the capacity of the cell in Ah, and η is the Coulomb efficiency.
O C V n e g ( t + Δ t ) = O C V n e g ( t ) I ( t ) η × Δ t 3600 C b a t d O C V n e g d S O C
Upon substituting Equations (9) and (10) into Equation (11) and then setting V n e g ( t + Δ t ) = V min n e g , the following Equation (12) can be used to determine I max c h at which the negative electrode potential does not exceed the limit after continuous charging for t seconds.
I max c h = O C V n e g V min n e g V p n e g exp ( Δ t / R p n e g / C n e g ) η × Δ t 3600 C b a t d O C V n e g d S O C + R p n e g ( 1 exp ( Δ t / R p n e g / C n e g ) ) + R 0 n e g
After calculating I max c h in Δ t using Equation (12), the cell can be charged at this current for Δ t seconds. Then, repeat the above process until the cell terminal voltage ( U t ) reaches the cut-off voltage ( U max ). This concludes the estimation of negative electrode potential and current control by OLFEM and achieves fast charging without lithium plating in the cell.

3. Experiment

The long-dimensional cell used for the experiment measures 620 mm × 102 mm × 23 mm and is composed of a lithium iron phosphate (LFP) positive material and graphite negative material. It has a rated capacity of 188 Ah and operates at a voltage between 2.0 V and 3.8 V. A temperature sensor is installed in the middle of the cell’s largest surface, and the cell is placed in a temperature chamber (SAN WOOD) for temperature management. Performance testing of these cells is conducted using a specialized instrument (Arbin 5 V 1000 A), which is used for charging and discharging. The current and voltage resolution of the device is ±0.0003% FS (full scale). Details of the cell and equipment can be found in Figure S1. Data processing is carried out using MATLAB R2021b.

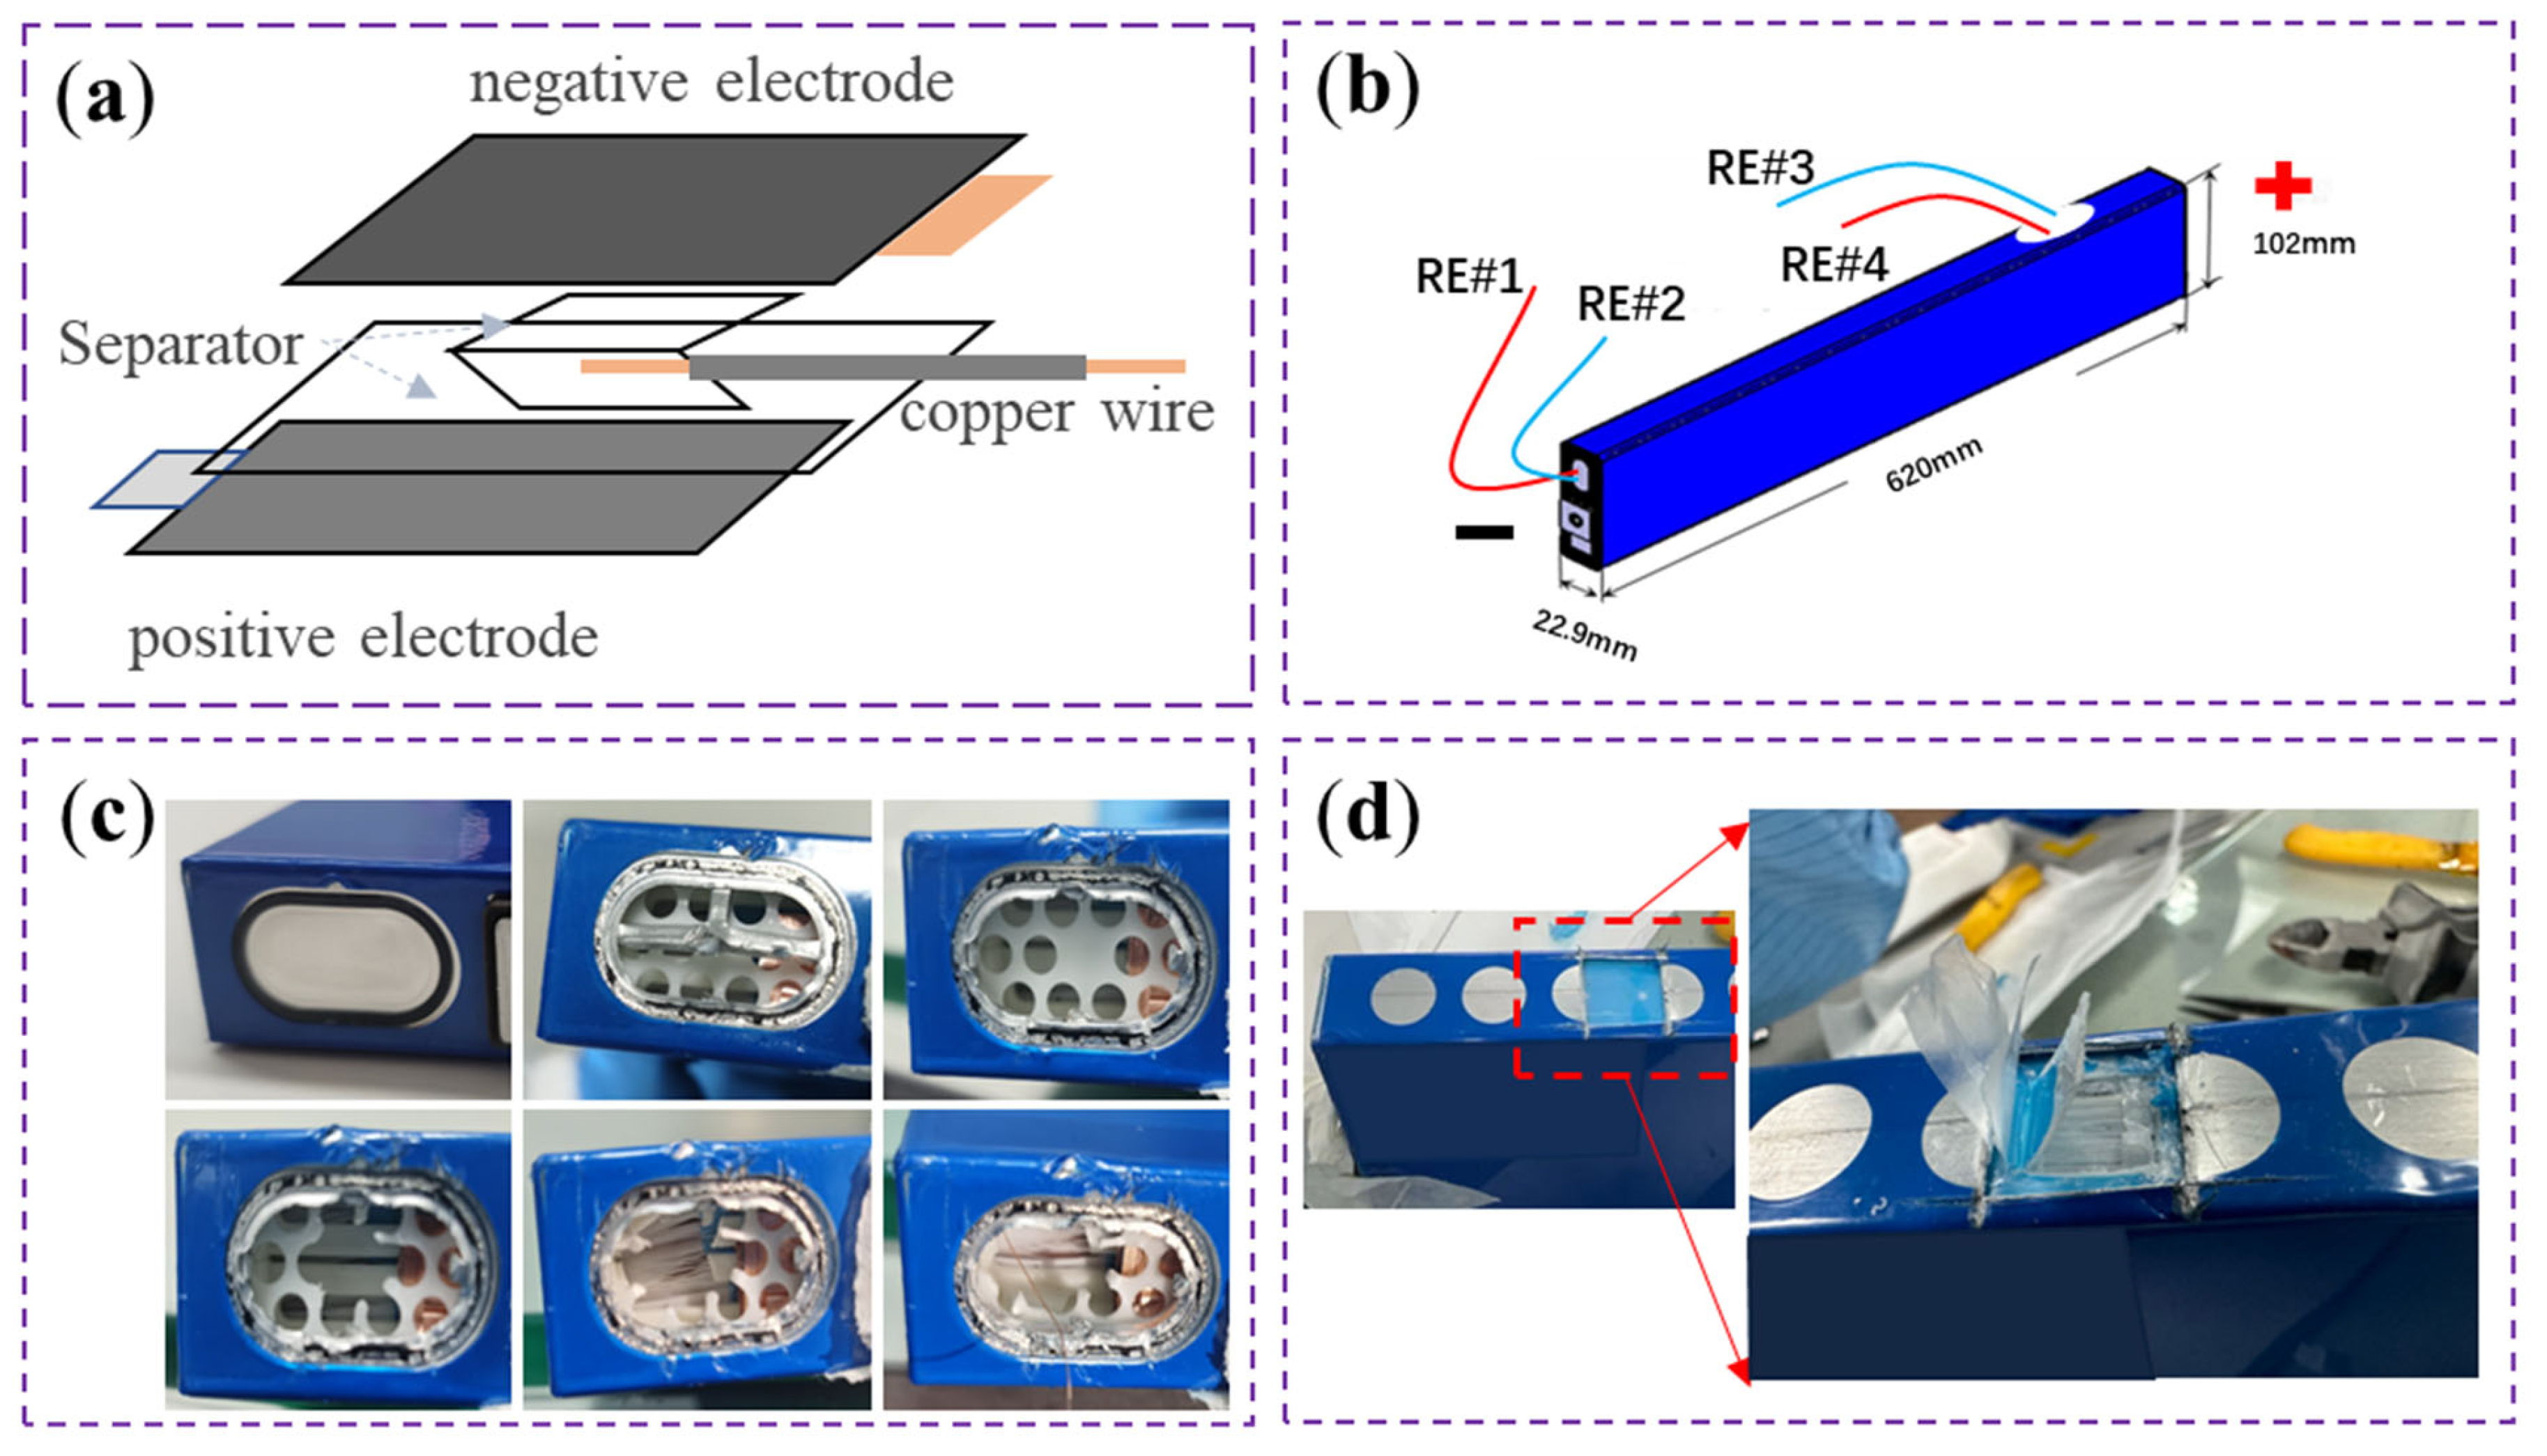
3.1. Reference Electrode Implantation, Activation, and Stability Testing

A reference electrode serves to compare the potential of different electrodes, as demonstrated by multiple studies that have installed reference electrodes in commercial cells to develop charging strategies [36] and state estimation [37]. The cell’s negative electrode potential is monitored at various charge rates to prevent it from dropping below 0 V (vs Li/Li+). Below this potential, lithium ions will preferentially gain electrons on the negative electrode surface and form a lithium plate [22,23,38]. Currently, the electroplating of a lithium metal layer on a copper wire surface is the most widely used and mature reference electrode preparation process for LIBs. Liu et al. designed a three-stage current plating method to electrochemically deposit copper onto the wire, enhancing the stability of the lithium layer and extending its service life to more than 400 h [24].
The reference electrodes are implanted following the procedure outlined in Figure 2. Before the implantation of the reference electrode, the cell is discharged to the cut-off voltage at room temperature. Subsequently, the explosion-proof valve of the cell is opened in a dry room, and both the aluminum alloy holder and the plastic spacer are removed. Insulated tweezers are then carefully inserted between the electrode and the separator to create a sufficiently large gap. To prevent any short circuits resulting from contact between the reference electrode and the cell electrode, a copper wire with the insulation part removed is wrapped in the separator. Then, it is placed between the negative electrode of the cell and the separator, as shown in Figure 2a, after which the explosion-proof valve is sealed to complete the implantation of the reference electrode. The long-dimensional cell in this study has an extremely elongated electrode, and the internal resistance of the collector on the electrode is considered homogeneous. Therefore, current flowing from one end of the electrode to the other results in an uneven distribution of current density and potential across the electrode. To verify the negative electrode potential difference between the negative and positive tabs of the cell, four reference electrodes are inserted into the cell, two at the positive tab side and two at the negative tab side, as shown in Figure 2b–d. For each electrode, only one reference is activated and used during the experiment, while the other is used as a backup in case of failure.
After implanting the reference electrodes, it is necessary to activate it with lithium deposition. To ensure the uniformity and density of the lithium metal layer on the surface of the copper wire, a continuous current of 200 µA, 100 µA, and 40 µA is applied between the negative and reference electrodes for one hour each, with an hour rest period between each current stage. The current and negative electrode potential distribution during the lithium plating process is shown in Figure 3a. After completing the lithium plating process, 10 h are allocated to verify the stability of the reference electrode during the resting period. The reference electrode produced using this method provides precise measurement of negative electrode potential with a lifespan of more than two weeks. Subsequent capacity cycling of the cell at 1/3 C, utilizing the reference electrode, as shown in Figure 3b. It confirms the reliability and accuracy of the reference electrode throughout cell cycling. This is achieved by comparing the repeatability of the negative electrode potential during the charging phase in the last two stable cycles, as shown in Figure 3c. The consistency of the terminal voltage is also evaluated to demonstrate that the introduction of the reference electrode does not impact the cell, as shown in Figure 3d.

3.2. OLFEM Parameter Calibration and Validation

Cells are tested under various temperature and current conditions, including capacity tests, Hybrid Pulse Power Characterization (HPPC) tests, Multi-Rate Constant Current (MRCC) tests, and New European Driving Test Cycle (NEDC) tests. In this study, the HPPC test is enhanced by establishing multiple rate pulses based on various temperatures instead of a single pulse, as shown in Figure 4a. It is used for parameter identification under multiple temperatures and multiple charge rates of OLFEM. During the HPPC test, the SOC is reduced by 10% each time, followed by a 3 h rest period to obtain the change curve between OCV and SOC. As shown in Figure 4b, the MRCC test involved charging the cell at varying rates using a constant current until the cut-off voltage of 3.8 V is reached, confirming the model’s performance under static working conditions. As shown in Figure 4c,d, The dynamic condition test employed the NEDC standard to assess the model’s behavior under dynamic conditions. Specific test information and experiments are presented in Table 1.

4. Results and Discussions

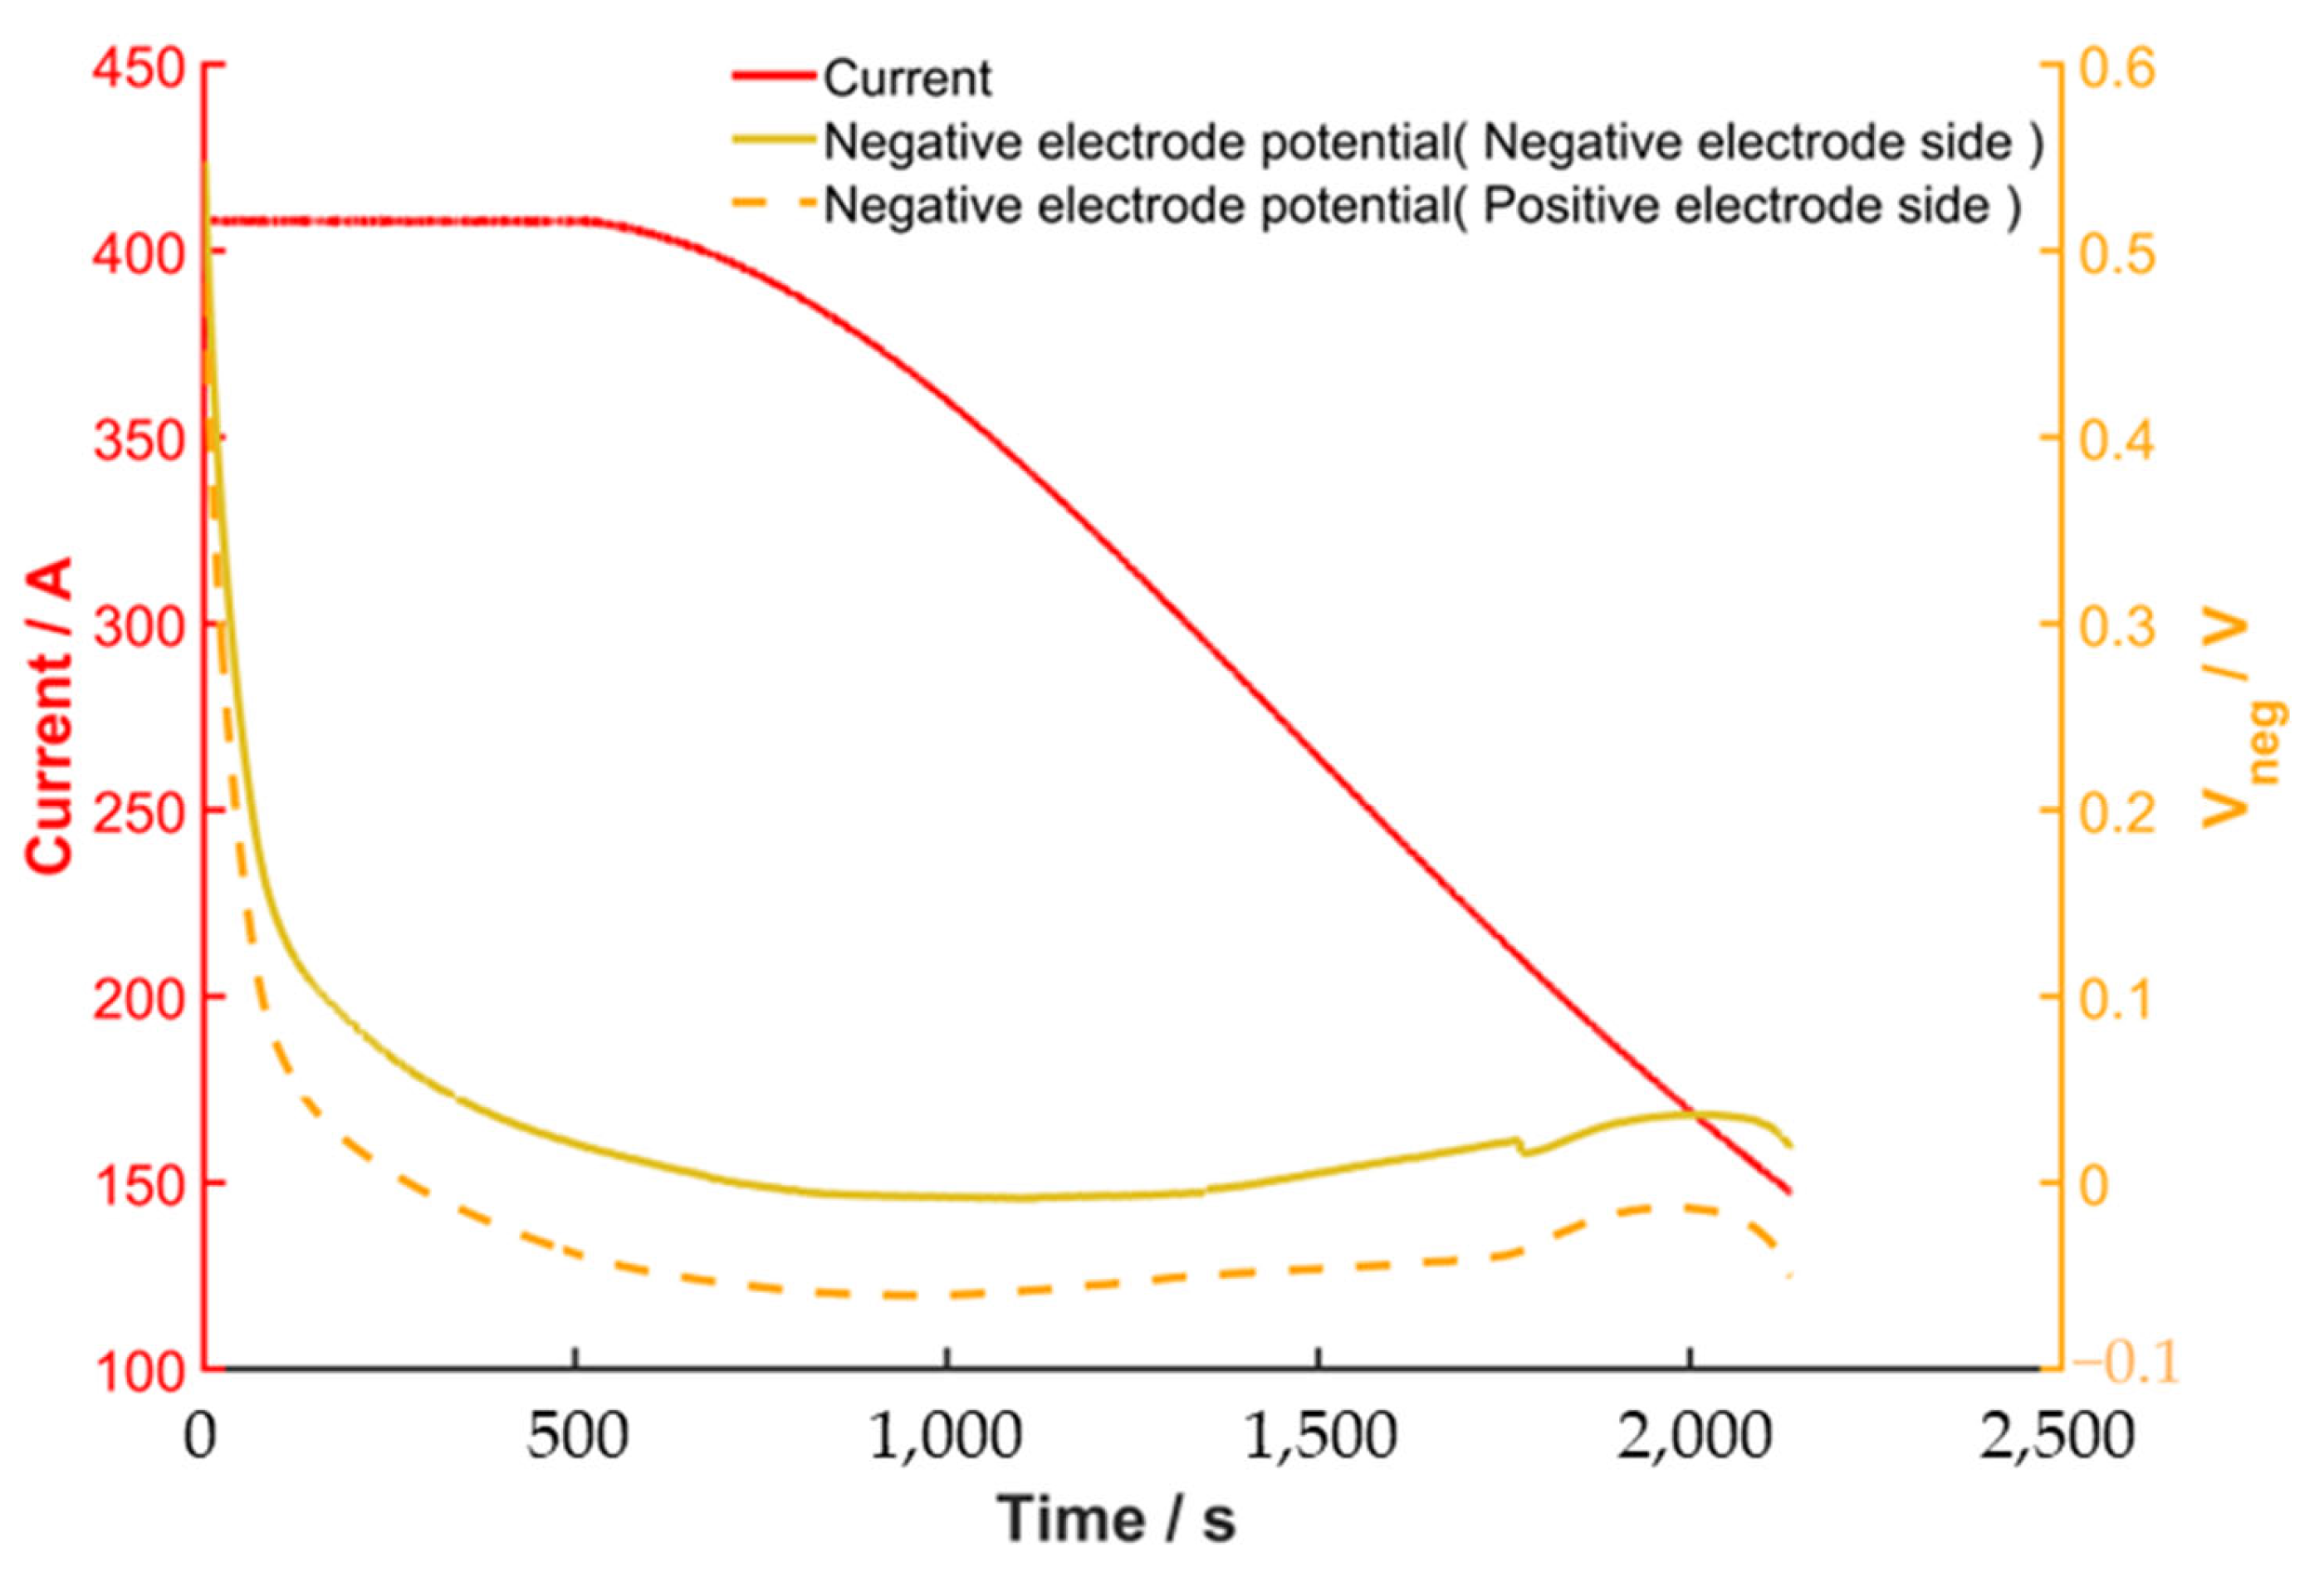
4.1. Stability and Comparison of Negative Electrode Potential Results on the Positive and Negative Sides

After the implantation of the reference electrode, the cell was subjected to a prolonged period of shelving and charging/discharging cycles to ensure the stability of the reference electrode. During the long shelving period, the negative electrode potential only decreased by 2.95 mV, as shown in Figure 3a. As shown in Figure 3c,d, the RMSE of the negative electrode potential and the terminal for the last two charging cycles are 4.3 mV and 2.8 mV, respectively. These results demonstrate that the reference electrodes implanted in long-dimensional cells used in this experiment are reliable and have no discernible impact on the cells. In Figure 5, a comparison of the negative electrode potentials between the positive and negative sides during the charging process is presented. The red solid line represents the charging current curve, the yellow solid line represents the negative electrode potential on the negative side, and the yellow dashed line represents the negative electrode potential on the positive side. It can be observed that the negative electrode potential on the positive tab side is consistently lower than on the negative tab side throughout the charging process. The potential monitored by the positive-side reference electrodes was used in the subsequent calibration and validation of the model parameters in this study. To ensure that the negative electrode potential in each region of the long-dimensional cell’s pole piece remains above 0 V during the charging process.

4.2. Validation of OLFEM

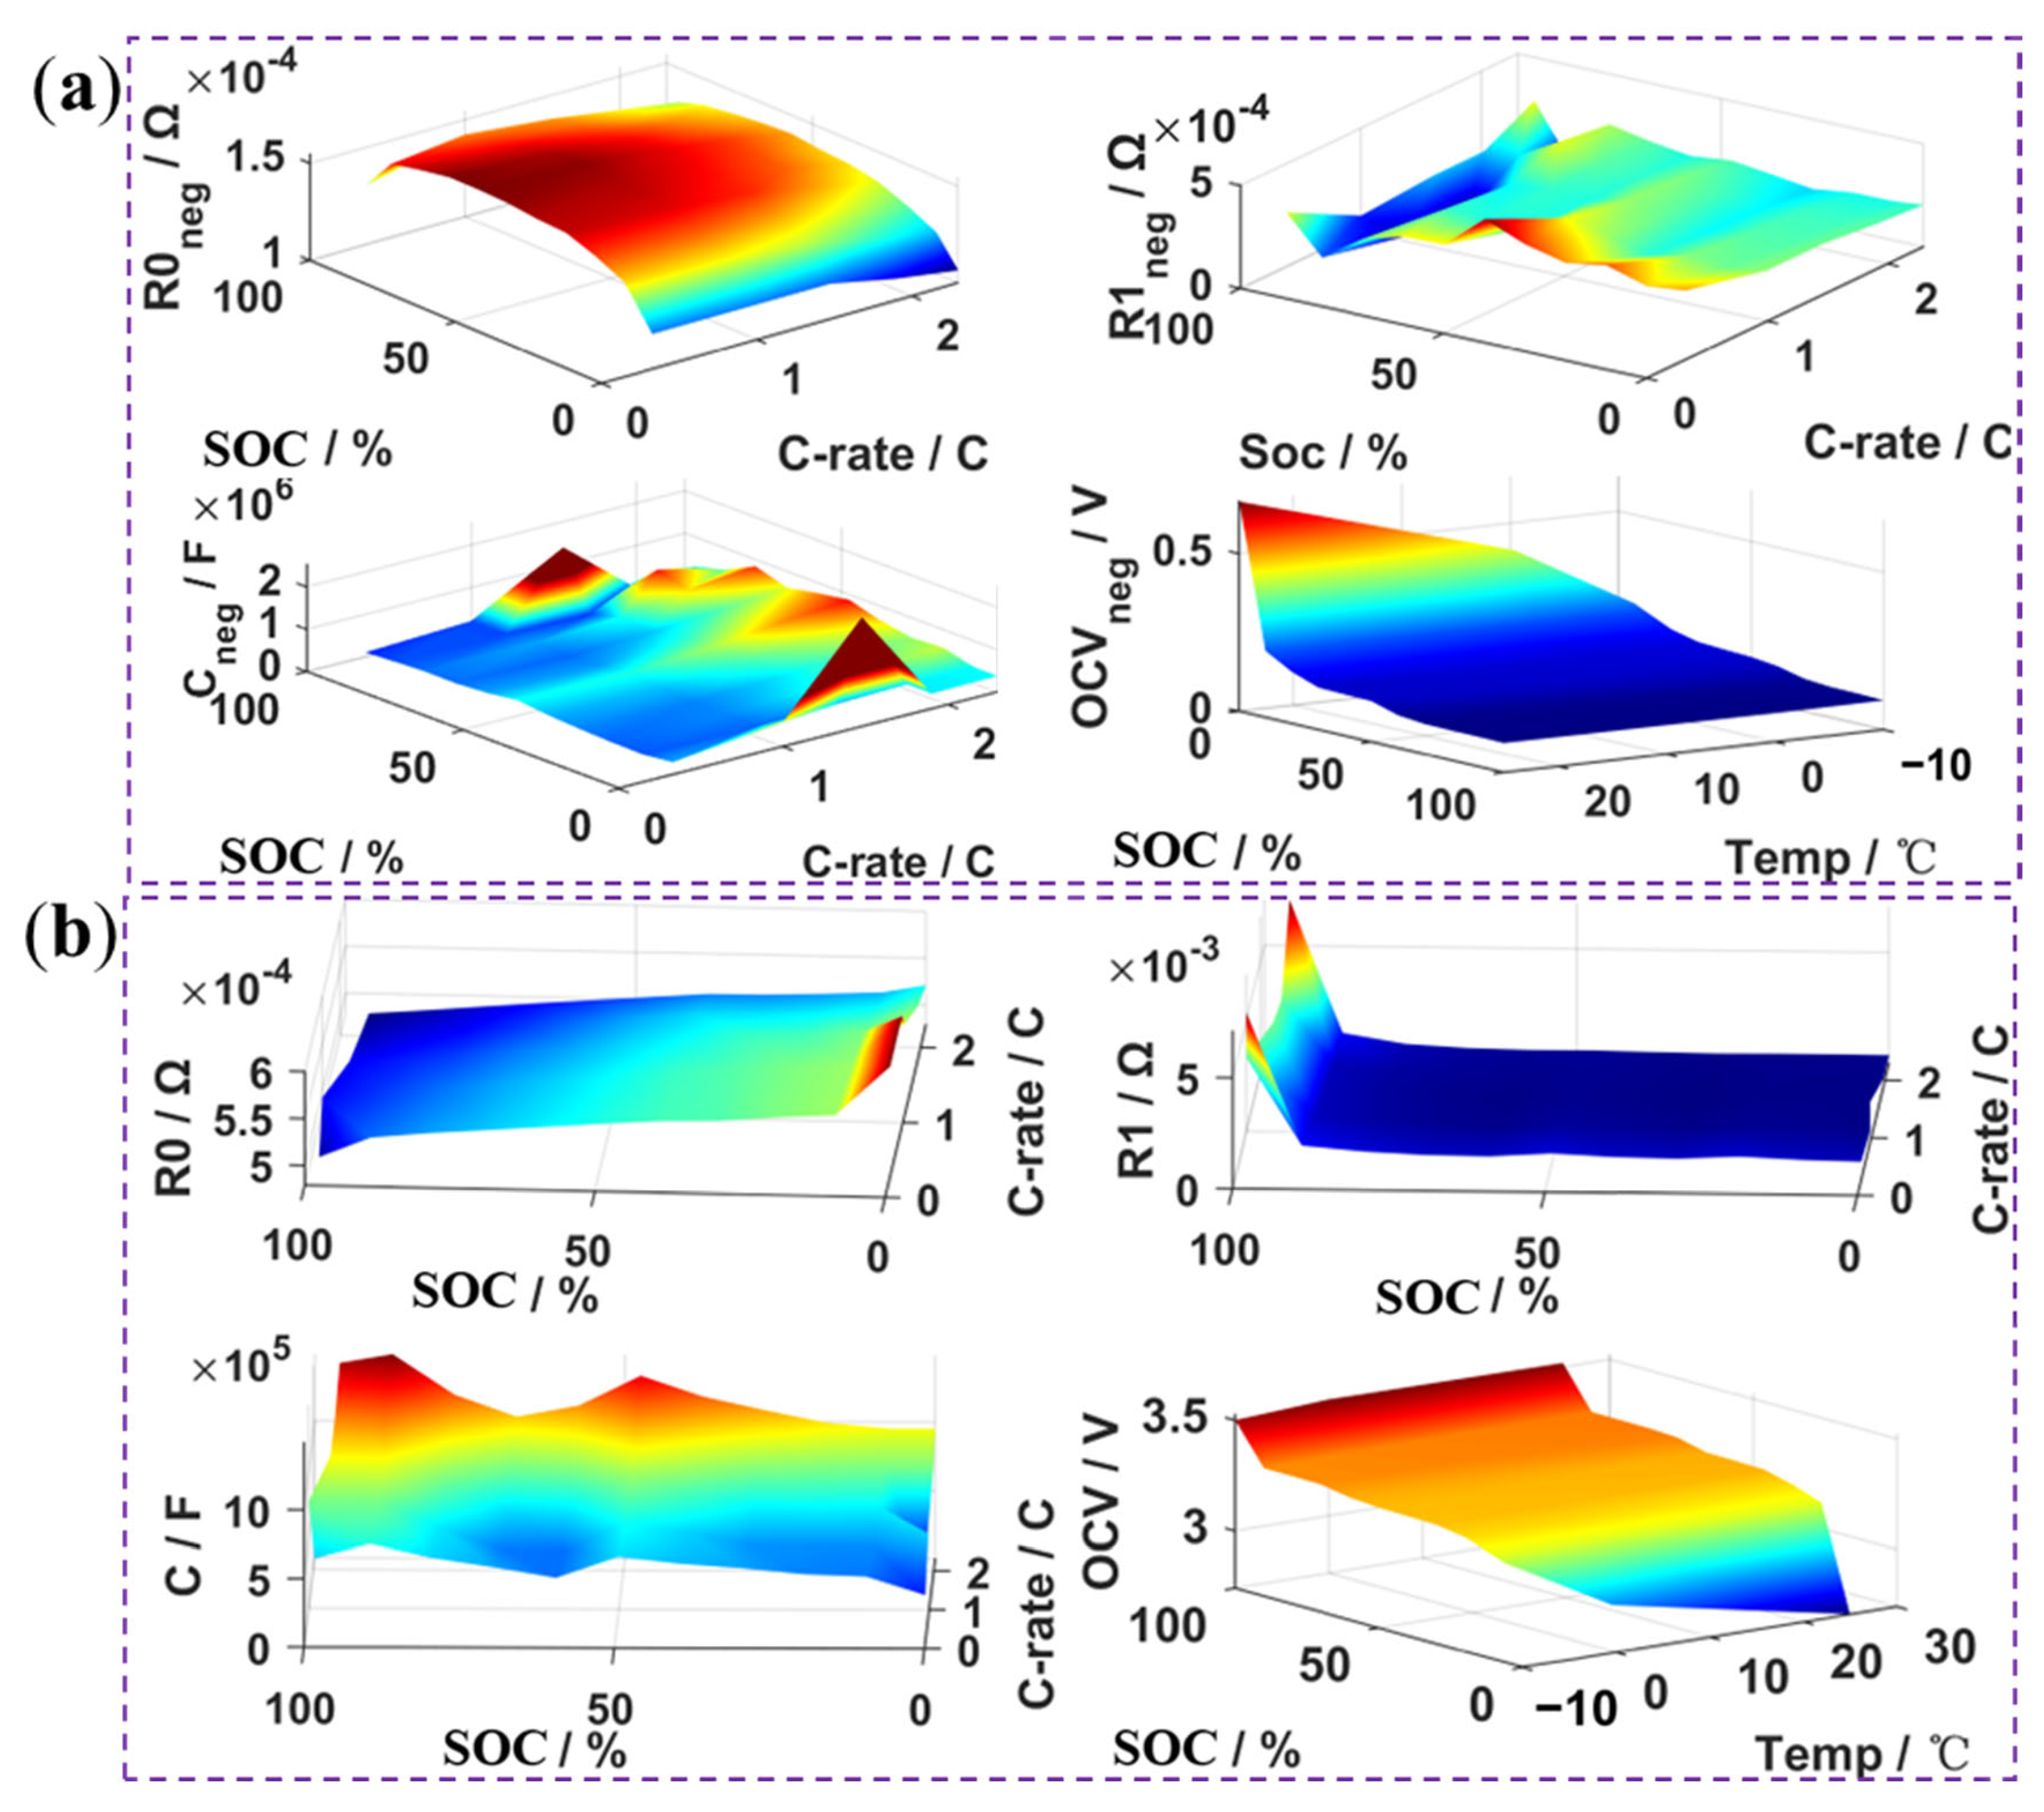
4.2.1. Results of Parameter Identification

Based on the experiments in Table 1, the parameters R 0 , R 1 , C , and OCV were obtained using the LS parameter identification method in MATLAB. As shown in Figure 6a, which shows the relationship between R 0 , R 1 , C , SOC, and the charge rate (C-rate) of the negative portion at 25 °C, as well as the relationship between OCV, SOC, and temperature (Temp). Figure 6b shows the corresponding parameters of the overall portion. Additional temperature parameters can be found in the Supplementary Materials, as shown in Figures S2 and S3. In this way, OLFEM was developed. In practical application, appropriate model parameters are selected by referencing a table based on the current cell Temp, SOC, and C-rate, allowing for accurate simulation of the negative electrode potential and terminal voltage of the cell.

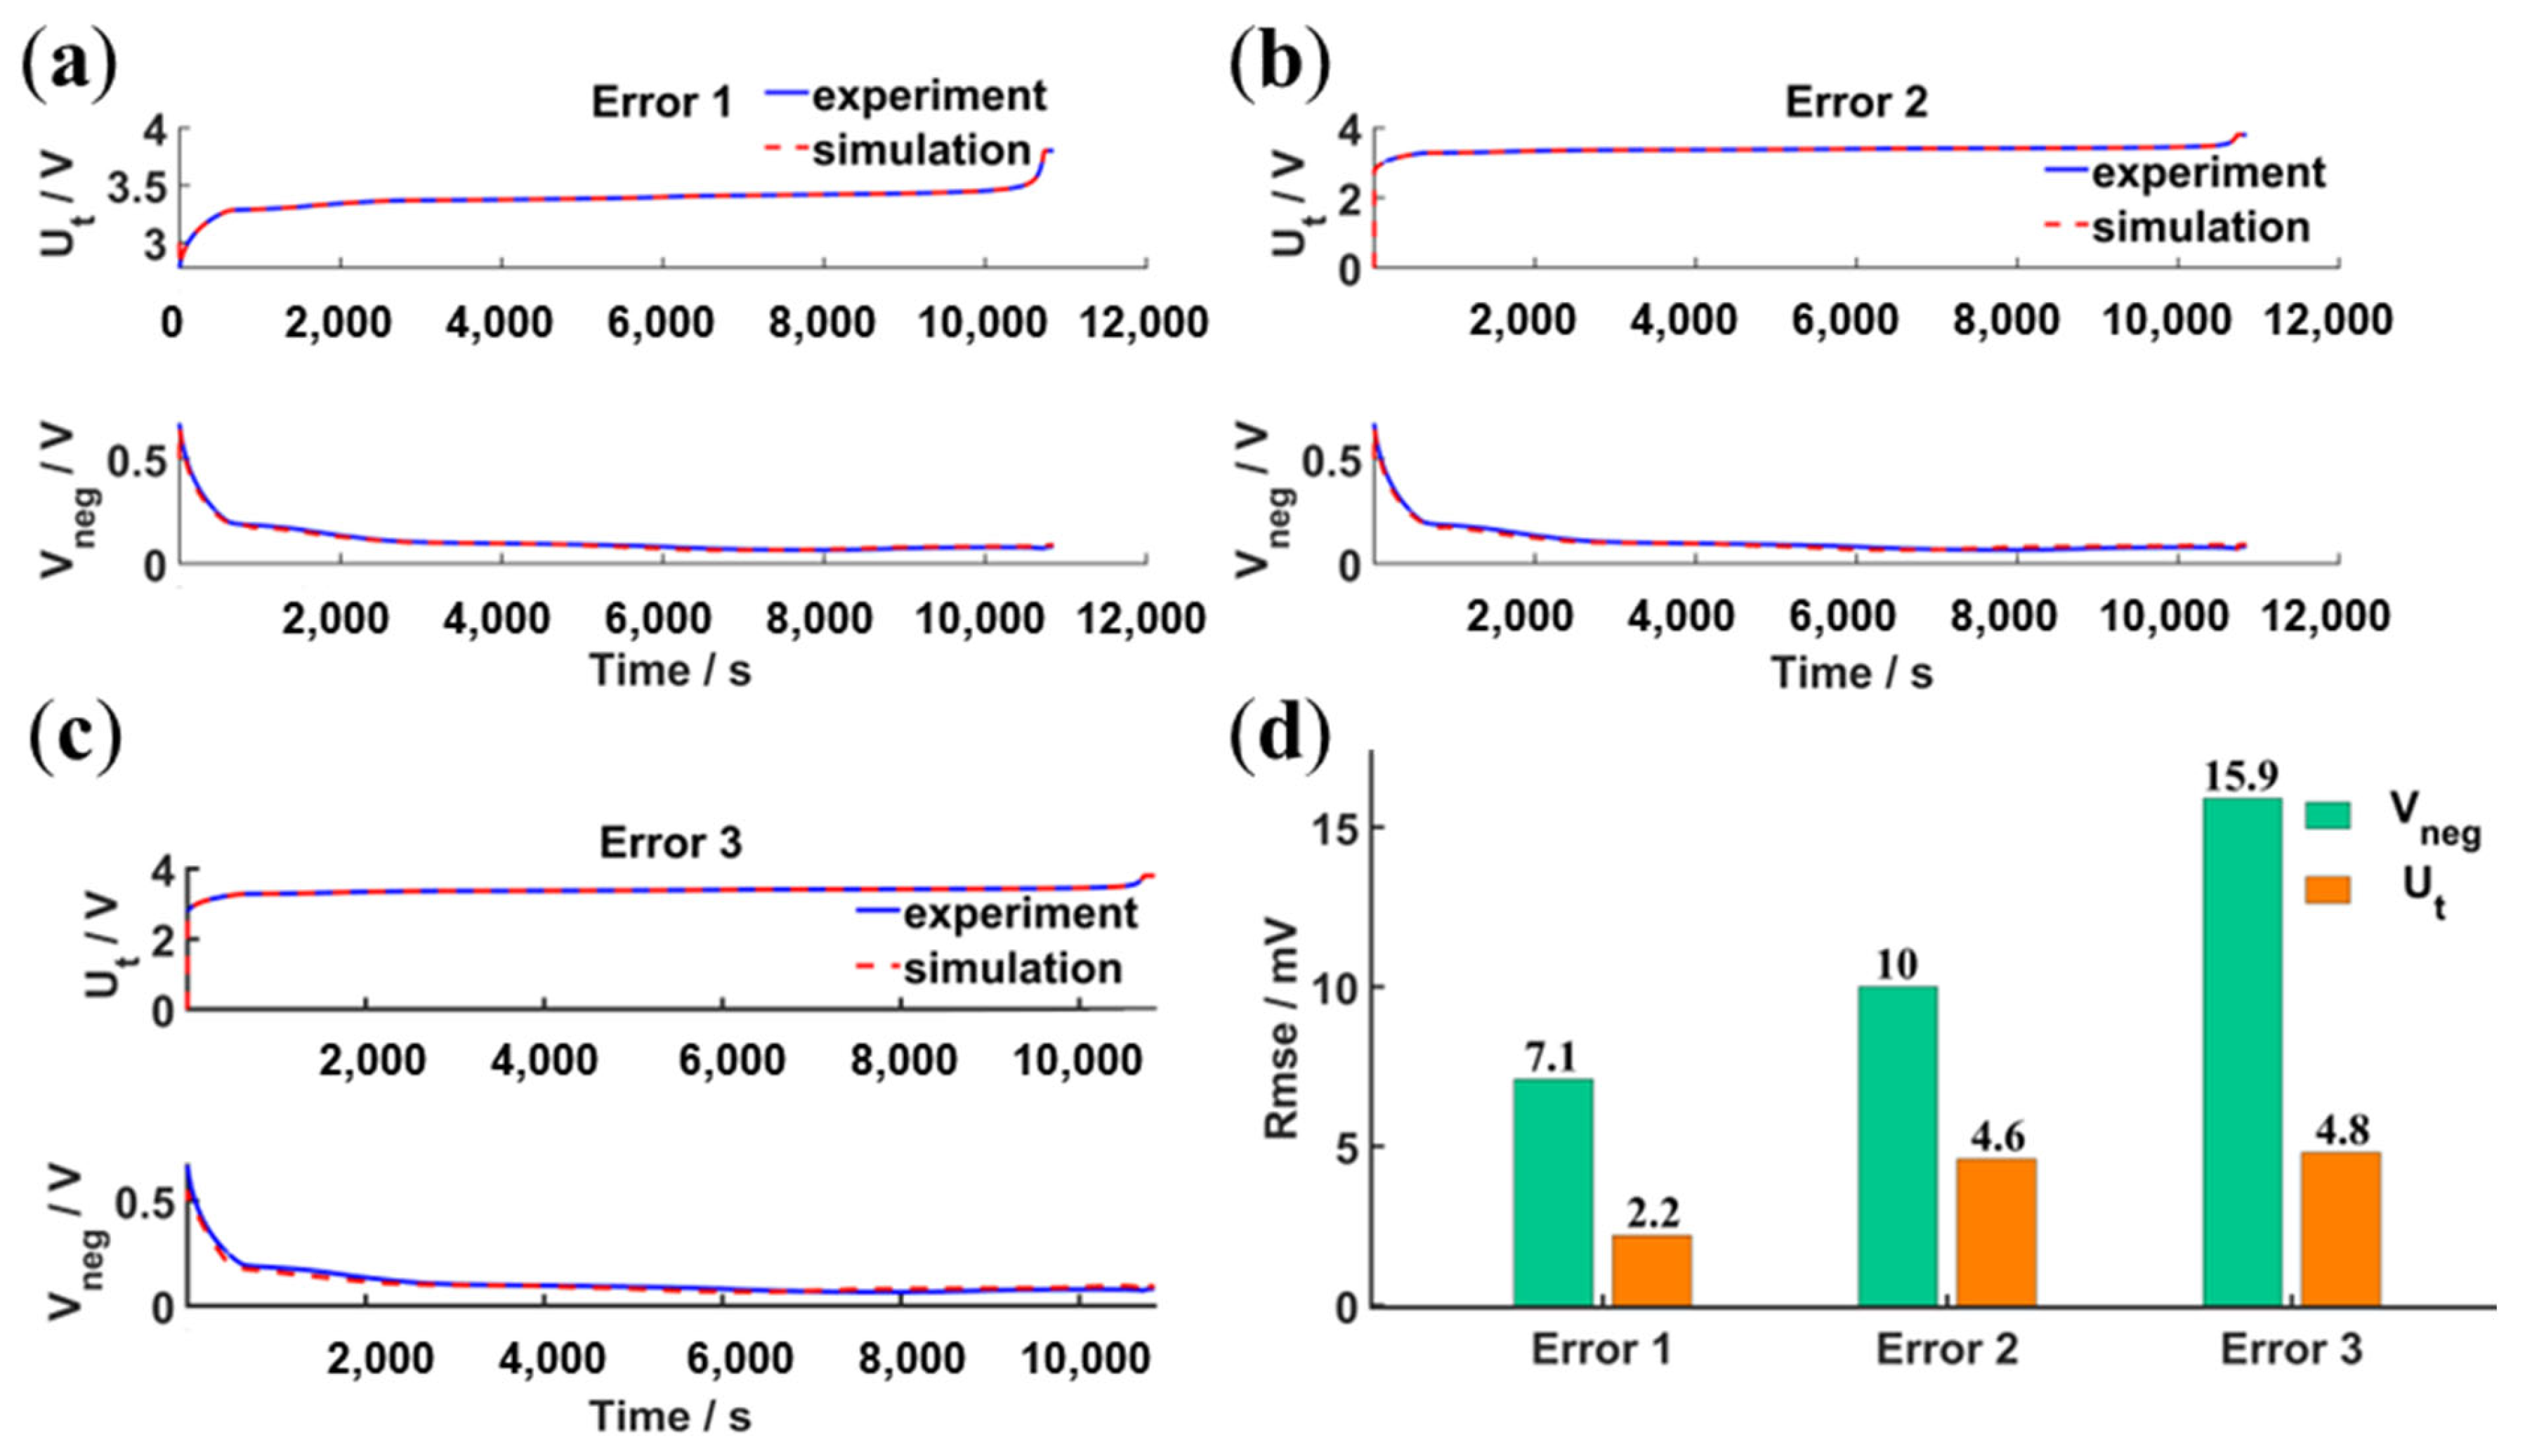
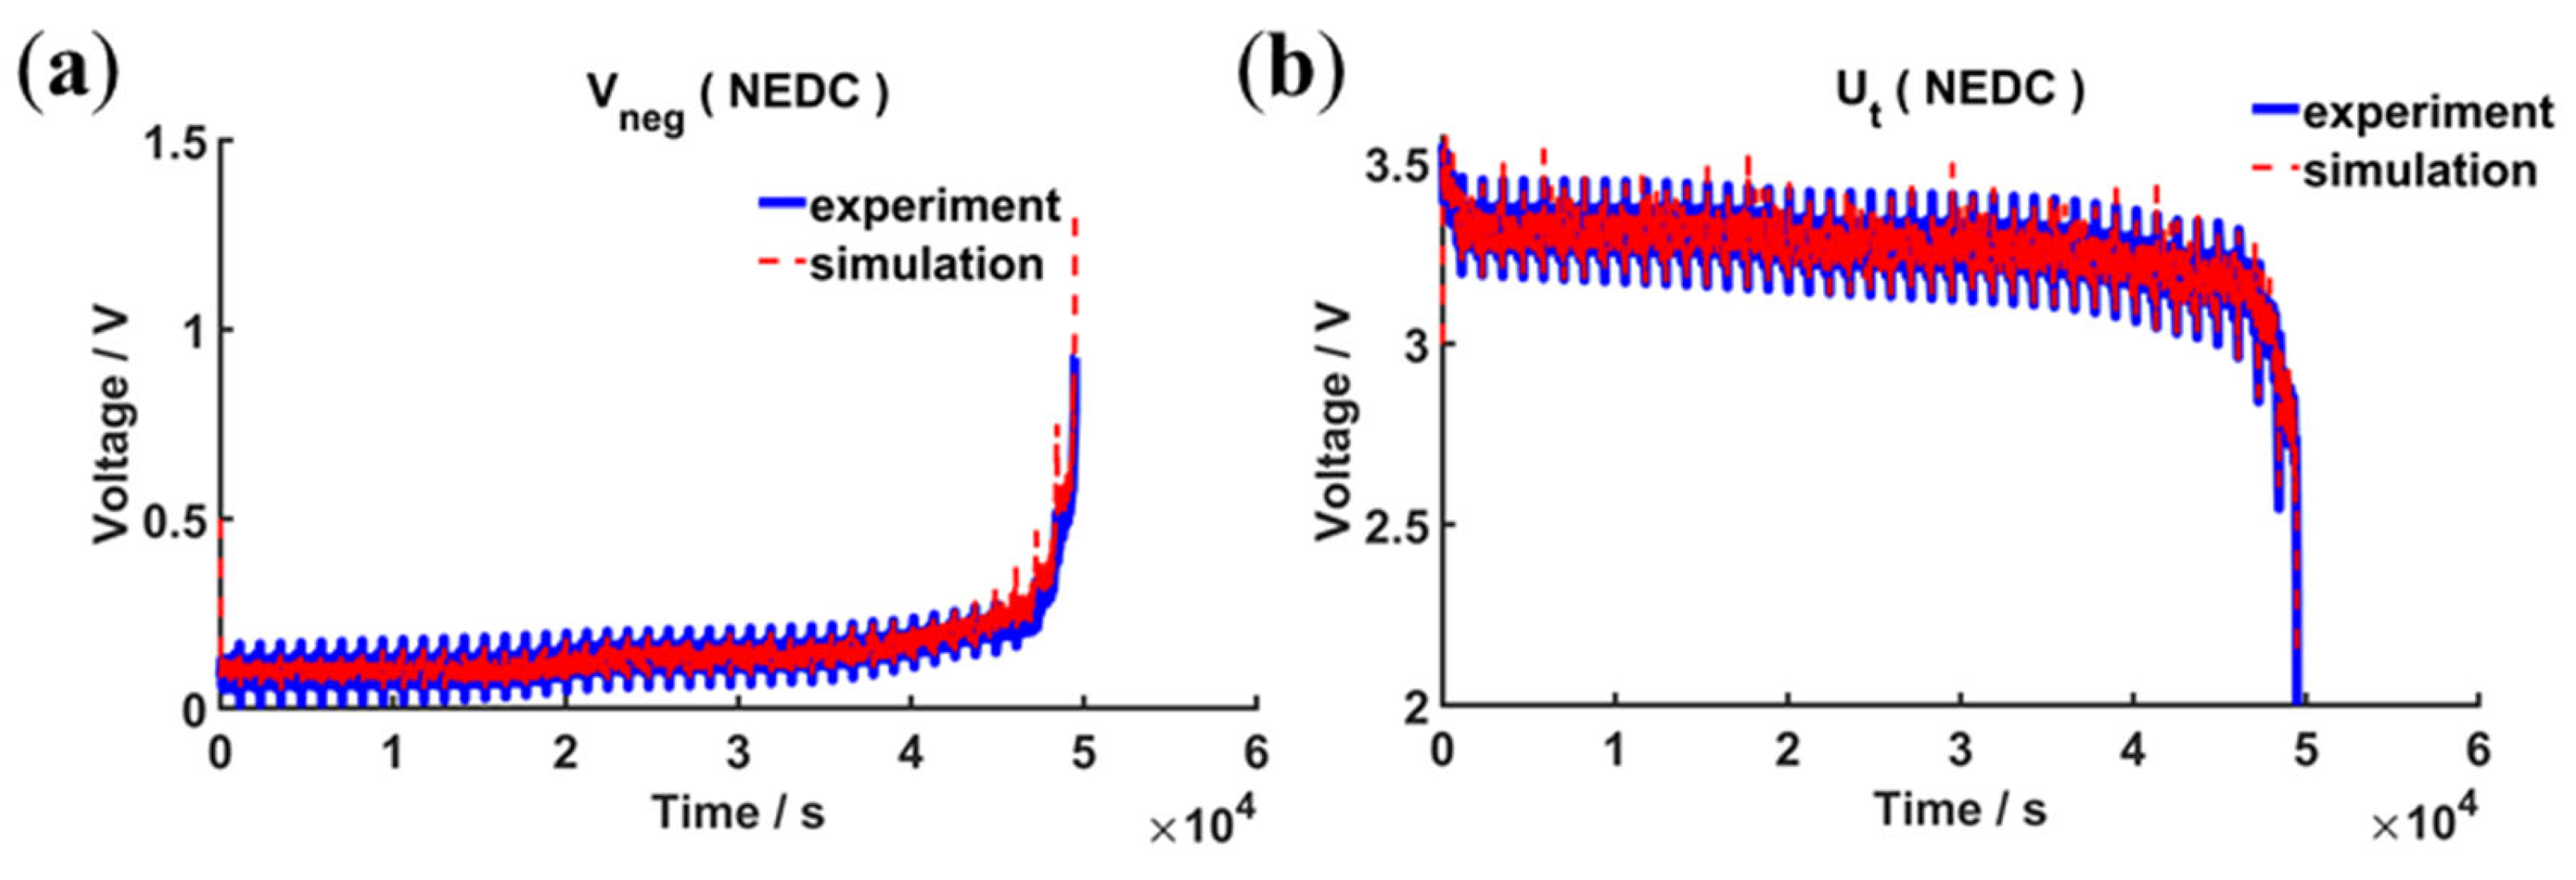
4.2.2. Validation under Static and Dynamic Operating Conditions

The model is applied to the BMS. Therefore, the primary focus is on the simulation accuracy of the model’s terminal voltage and negative electrode potential. Comparison between the simulation results and measurements at different temperatures and charging rates are shown in Figure 7a–e. Figure 7f displays the RMSE of the terminal voltage and negative electrode potential for various temperatures and charging rates. It is observed that, at the same temperature, the simulation error of the negative electrode potential increases as the charge rate rises. The model uses the linear relationship of Ohm’s law for the internal resistance and capacitance of the polarization, along with the correlation parameter obtained through linear interpolation. However, there is still a certain level of RMSE in the simulation. This is because solid phase diffusion can become the primary controlling factor of the electrochemical reaction in the cell under high current conditions, resulting in a more nonlinear relationship between cell polarization and the current. The large SOC adjustment interval in the HPPC experiment, as well as the nonlinearity of actual OCV and other cell parameters at the beginning or end of charging, contribute to significant simulation errors. Additionally, increments of cell temperature during large rate charging also play a role in causing these errors. Currently, the simulation results of this model’s terminal voltage maintain an RMSE of approximately 3 mV, and the error in the negative electrode potential is kept below 25 mV at various temperatures and charging rates. The model’s closed-loop simulation of terminal voltage and negative electrode potential under static operating conditions is relatively satisfactory, making the proposed OLFEM an ideal voltage prediction model.
During vehicle operation, the cell’s SOC and SOH are predicted based on the existing model, and the sensors are inevitably imprecise [39,40]. Due to inherent biases in these two parameters, which are incorporated as inputs into OLFEM, the model experiences greater discrepancies in its open-loop estimation of terminal voltage and negative electrode potential. Therefore, this study introduces an initial error to the initial SOC or SOH based on the 1/3 C constant current charging condition. Subsequently, error correction is performed based on the estimated terminal voltage and the actual measured terminal voltage using the EKF. As shown in Figure 8a, a 10% reduction in the rated capacity is set as the first error mode. After correction by the EKF, the estimation error of the negative electrode potential is 7.1 mV, and the estimation error of the terminal voltage is 2.2 mV. As shown in Figure 8b, the second mode error indicates a 20% reduction in the rated capacity of the cell input, and the corrected estimation shows an error of 10.0 mV for the negative electrode potential and an error of 4.6 mV for the terminal voltage. As shown in Figure 8c, the third error indicates that based on a 20% capacity reduction, the initial SOC has increased by 5%. This represents Error 3, and the corrected estimation shows an error of 15.9 mV for the negative electrode potential and an error of 4.8 mV for the terminal voltage. OLFEM model with the EKF closed-loop correction algorithm effectively mitigates the influence of certain initial errors, where the RMSE of the negative electrode potential remains within 20 mV, and the RMSE of the terminal voltage remains within 5 mV, as shown in Figure 8d. Consequently, this closed-loop estimation method is highly applicable to real vehicle BMS as it adeptly addresses system errors and signal interference.
The simulation performance of OLFEM under dynamic current conditions is further validated. The NEDC includes one suburban cycling condition and four urban cycling conditions. In the experiment, the maximum charging current used is 241.8 A. As shown in Figure 9, it shows a comparison of the model simulation and experimental results. The blue solid line in Figure 9a represents the negative electrode potential recorded by the experimental equipment, and the red dashed line depicts the negative electrode potential obtained by inputting the NEDC current and voltage into OLFEM. The difference in RMSE between the experiment and simulated negative electrode potential is only 10.8 mV. Figure 9b compares the experiment and simulated terminal voltages, with the RMSE being less than 10 mV. The test results above demonstrate that the simulation result error under the dynamic condition test is acceptable for BMS applications, whether it pertains to negative electrode potential or terminal voltage.

4.2.3. Model Analysis

The previous two sections offer a comprehensive analysis of the model’s parametric results under various temperatures and charging rates. Following that, the accurate OLFEM is constructed step by step under both dynamic and static conditions. The model’s error remains within an acceptable range, enabling it to provide a relatively accurate negative electrode potential. Under static operating conditions and with artificial errors introduced into the model, the proposed model’s accuracy is little affected. This indicates that the model can be successfully applied to the actual BMS of a vehicle and provides the basis for fast charging without lithium plating.

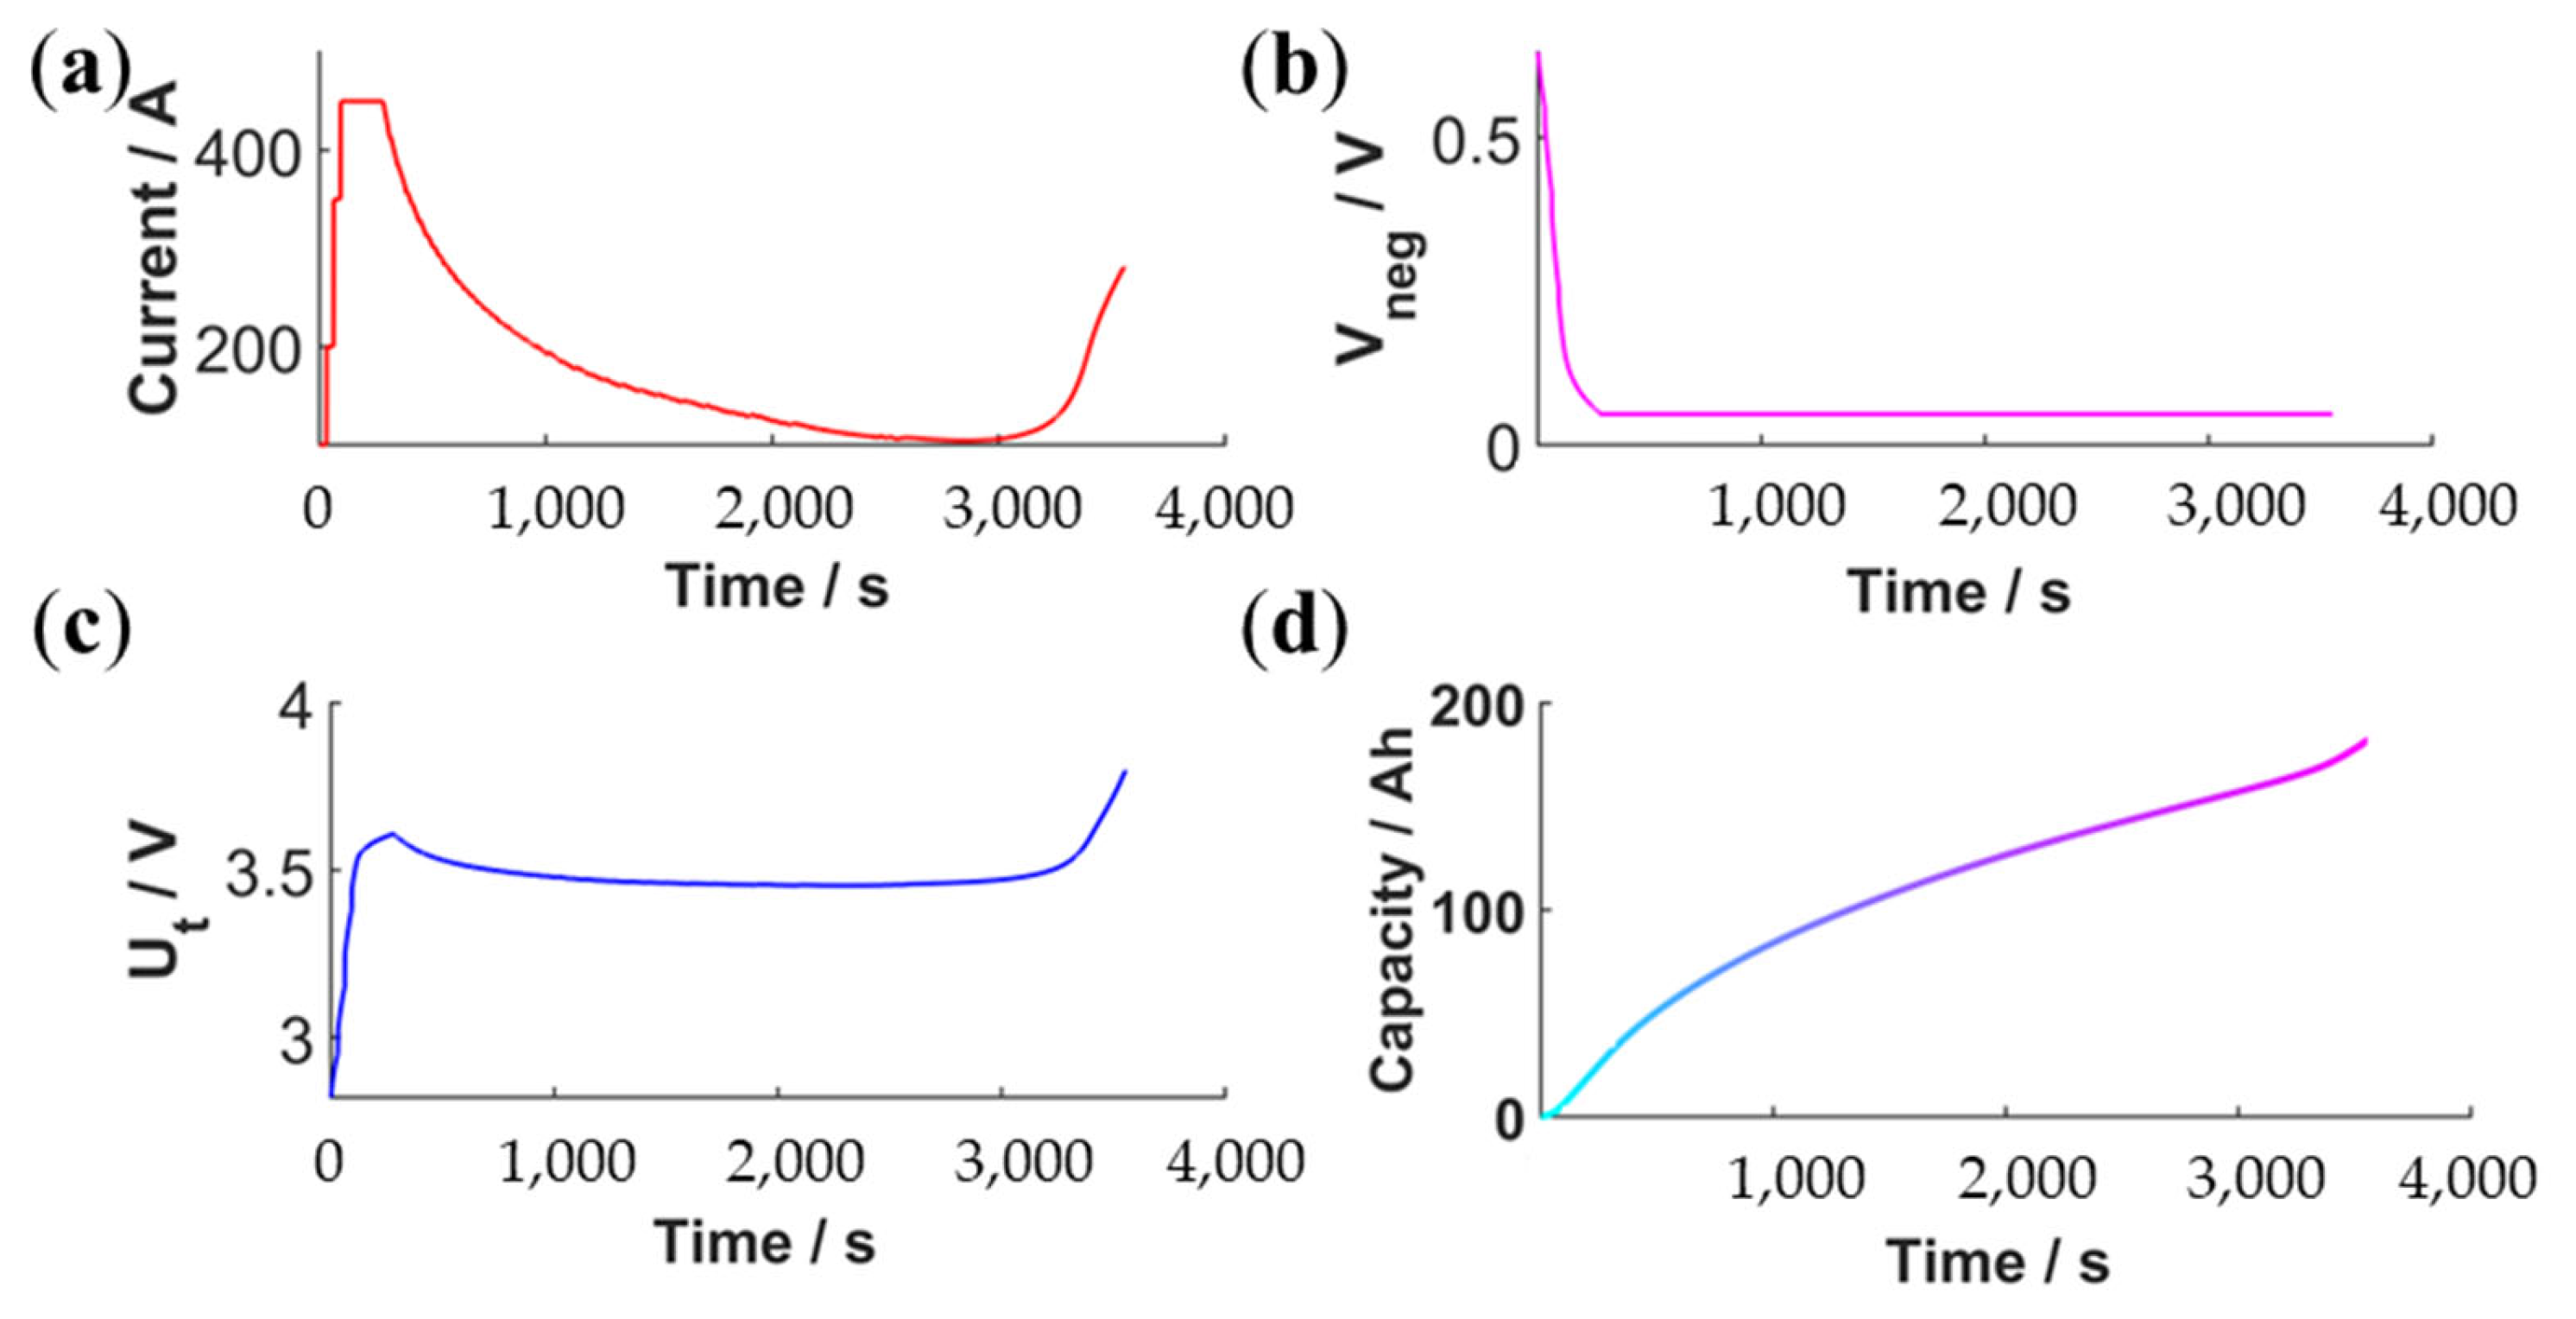
4.3. OLFEM-Based Fast-Charging Calibration and Cycle Verification

The objective of fast charging is to reduce the charging time while minimizing cell damage caused by high charge currents. The primary cause of severe damage to LIBs during fast charging is the lithium plating reaction, which accelerates capacity degradation and poses safety concerns. To prevent this undesired reaction, it is crucial to maintain a negative electrode potential above 0 V (vs. Li/Li+) throughout the charging process.
Based on OLFEM’s estimated negative electrode potential, a fast-charging strategy can be developed without lithium plating for this long-dimensional cell according to the current control theory discussed in Section 2.2. At 25 °C, the simulation is initiated at 0% SOC. V min neg is 50 mV, I max c h is 2.3 C, and Δ t is 1 s. During the simulation process, the system calculates the maximum charging current every second. As the cell charges, the initial current remains steady while the negative electrode potential decreases over time. Once the negative electrode potential drops to 50 mV, the current gradually reduces to maintain the negative electrode potential at that level, as shown in Figure 10a,c. Upon reaching 3.8 V, as shown in Figure 10b, the charging process ends. The cell achieves a final charging capacity of 183 Ah, as shown in Figure 10d. The entire charging process takes 3555 s.
A cell is cycled under the proposed charging strategy 100 times. A one hour rest is conducted between each charging and discharging cycle to ensure uniform cell temperature. By comparing the capacity degradation before and after this cycling process, the influence of fast charging on the cell’s life is proven. After 100 cycles of fast charging test, the cell’s capacity decreased from 193.9 Ah to 190.4 Ah, representing a 1.8% reduction. This reduction reflects typical aging characteristics without any lithium plating occurrence. Subsequently, the cell is disassembled, and the negative electrode is detected using a scanning electron microscope (SEM), as shown in Figure S4, and no significant lithium precipitation was detected.

5. Conclusions

In this study, a new fast-charging model is proposed that eliminates lithium plating and allows the current to be adjusted based on the estimated negative electrode potential. The goal is to develop a calibration for the lithium-plating-free fast charging strategy, which reduces charging time compared with conventional CC-CV and other charging strategies. Unlike other fast charging calibration strategies, this study takes into account the inconsistency of the cell negative electrode potential distribution, which ensures better safety during the charging process of large-size cells. It accurately estimates negative electrode potential and terminal voltage at varying conditions, reducing fast charging calibration workload.
In this study, distributed reference electrodes were successfully implanted in a long-dimensional cell. During the charging process, an innovative comparison of the negative electrode potential at both ends of the cell was conducted. The results show that in the lengthwise direction for the long-dimensional cell, the negative electrode potential on the positive tab side averaged 30 mV lower than on the negative tab side during charging.
Based on the negative electrode potential on the positive tab side, the cell with implanted reference electrodes was subsequently tested under various operating conditions. Model calibration was performed by conducting improved HPPC experiments at various temperatures to obtain model parameters. To validate the accuracy of the model’s negative electrode potential and terminal voltage estimations in static conditions, MRCC experiments were conducted at different temperatures. Meanwhile, to assess the model’s precision in predicting negative electrode potential and terminal voltage predictions under dynamic loading conditions, an NEDC experiment was conducted. The results indicated that the proposed model maintains high accuracy across various working conditions, temperatures, and charging rates. The estimation error of negative electrode potential did not surpass 25 mV, and that for terminal voltage did not exceed 5 mV. Additionally, to test the model’s robustness against initial errors, three modes of errors were manually introduced to the model inputs. The results demonstrated that the model still maintained high estimation accuracy.
Finally, the model was used to devise a fast-charging strategy for a long-dimensional cell. The negative electrode potential threshold was set to 50 mV. The cell is charged to 183 Ah within 355 s under the proposed strategy. To evaluate the effect of the fast-charging strategy on cell life, a cycling test of 100 laps was conducted on another fresh long-dimensional cell. After the cycle, the cell’s capacity declined by 1.8%. The cell was disassembled, and the microstructure of the negative electrode was analyzed using SEM. The results showed that there was no lithium plating on the negative electrode.
It is important to note that the calibration methods mentioned for OLFEM in this study can be applied to other types and structures of cells, not just long-dimensional LFP cells. This provides a reference for LIBs offline and online fast charging without lithium plating. In future research, it is important to monitor and compare the negative electrode potential of not only long-sized but also large-sized cells in the direction of both length and width to ensure that the model estimation and control of the negative electrode potential are closely related to the point with the lowest negative electrode potential of the cell. This will help prevent lithium plating during cell charging. Additionally, it is necessary to study the model and charging strategy of the cell’s full cycle life.

Supplementary Materials

The following supporting information can be downloaded at https://www.mdpi.com/article/10.3390/batteries9120563/s1, Figure S1. Detailed experimental configuration. (a) The temperature chamber (left) for temperature management, and the Arbin battery performance testing equipment (right). (b) long-dimensional cell; Figure S2. The three-dimensional parameters of the negative electrode portion at 0 °C and −10 °C. (a) R 0 n e g (0 °C). (b) R 0 n e g (−10 °C). (c) R 1 n e g (0 °C). (d) R 1 n e g (−10 °C). (e) C n e g (0 °C). (f) C n e g (−10 °C); Figure S3. Three-dimensional parameters of the overall portion at 0 °C and −10 °C. (a) R 0 (0 °C). (b) R 0 (−10 °C). (c) R 1 (0 °C). (d) R 1 (−10 °C). (e) C (0 °C). (f) C (−10 °C); Figure S4. Disassembly and characterization results. (a) Photos of the negative electrode plates from inside the long-dimensional cell. (b) SEM characterization results of negative electrode plates.

Author Contributions

Conceptualization, Y.W.; Methodology, Y.W. and S.M.; Software, Y.W.; Validation, Y.W., S.M., F.C. and X.Z.; Formal analysis, Y.W. and S.M.; Investigation, Y.W.; Resources, M.O.; Writing—original draft, Y.W.; Writing—review & editing, Y.W., S.M., Q.C., F.C., X.H. and Y.Z.; Supervision, S.M., X.H. and Y.Z.; Project administration, M.O., X.H. and Y.Z. All authors have read and agreed to the published version of the manuscript.

Funding

This research was funded by National Natural Science Foundation of China under No. 52177217.

Data Availability Statement

The data presented in this study are available on request from the corresponding author. The data are not publicly available due to that all individuals involved in this study have signed confidentiality agreements, prohibiting casual dissemination.

Conflicts of Interest

The authors declare no conflict of interest.

References

  1. Harichandan, S.; Kar, S.K.; Bansal, R.; Mishra, S.K.; Balathanigaimani, M.S.; Dash, M. Energy transition research: A bibliometric mapping of current findings and direction for future research. Clean. Prod. Lett. 2022, 3, 100026. [Google Scholar] [CrossRef]
  2. Wang, G.; Chen, C.; Beshiwork, B.A.; Lin, B. Developing a low-carbon hybrid of ammonia fuel cell and internal combustion engine for carbon neutrality. Appl. Energy Combust. Sci. 2023, 16, 100214. [Google Scholar] [CrossRef]
  3. Cai, T.; Valecha, P.; Tran, V.; Engle, B.; Stefanopoulou, A.; Siegel, J. Detection of Li-ion battery failure and venting with Carbon Dioxide sensors. eTransportation 2021, 7, 100100. [Google Scholar] [CrossRef]
  4. Waseem, M.; Amir, M.; Lakshmi, G.S.; Harivardhagini, S.; Ahmad, M. Fuel Cell-based Hybrid Electric Vehicles: An Integrated Review of Current Status, Key Challenges, Recommended Policies, and Future Prospects. Green Energy Intell. Transp. 2023, 100121. [Google Scholar] [CrossRef]
  5. Wu, L.; Lyu, Z.; Huang, Z.; Zhang, C.; Wei, C. Physics-based battery SOC estimation methods: Recent advances and future perspectives. J. Energy Chem. 2023, 89, 27–40. [Google Scholar] [CrossRef]
  6. Liu, T.; Yang, X.-G.; Ge, S.; Leng, Y.; Wang, C.-Y. Ultrafast charging of energy-dense lithium-ion batteries for urban air mobility. eTransportation 2021, 7, 100103. [Google Scholar] [CrossRef]
  7. Wang, X.; Jiang, B. Multi-objective optimization for fast charging design of lithium-ion batteries using constrained Bayesian optimization. J. Power Sources 2023, 584, 233602. [Google Scholar] [CrossRef]
  8. Zhong, C.; Weng, S.; Wang, Z.; Zhan, C.; Wang, X. Kinetic limits and enhancement of graphite anode for fast-charging lithium-ion batteries. Nano Energy 2023, 117, 108894. [Google Scholar] [CrossRef]
  9. Piao, N.; Gao, X.; Yang, H.; Guo, Z.; Hu, G.; Cheng, H.-M.; Li, F. Challenges and development of lithium-ion batteries for low temperature environments. eTransportation 2022, 11, 100145. [Google Scholar] [CrossRef]
  10. Tian, Y.; Lin, C.; Chen, X.; Yu, X.; Xiong, R.; Zhang, Q. Reversible lithium plating on working anodes enhances fast charging capability in low-temperature lithium-ion batteries. Energy Storage Mater. 2023, 56, 412–423. [Google Scholar] [CrossRef]
  11. Yang, Z.; Charalambous, H.; Lin, Y.; Trask, S.E.; Yu, L.; Wen, J.; Jansen, A.; Tsai, Y.; Wiaderek, K.M.; Ren, Y.; et al. Extreme fast charge aging: Correlation between electrode scale and heterogeneous degradation in Ni-rich layered cathodes. J. Power Sources 2022, 521, 230961. [Google Scholar] [CrossRef]
  12. Chinnam, P.R.; Tanim, T.R.; Dufek, E.J.; Dickerson, C.C.; Li, M. Sensitivity and reliability of key electrochemical markers for detecting lithium plating during extreme fast charging. J. Energy Storage 2022, 46, 103782. [Google Scholar] [CrossRef]
  13. Mei, W.; Zhang, L.; Sun, J.; Wang, Q. Experimental and numerical methods to investigate the overcharge caused lithium plating for lithium ion battery. Energy Storage Mater. 2020, 32, 91–104. [Google Scholar] [CrossRef]
  14. Liu, J.; Peng, W.; Yang, M.; Jin, K.; Liu, P.; Sun, J.; Wang, Q. Quantitative analysis of aging and detection of commercial 18650 lithium-ion battery under slight overcharging cycling. J. Clean. Prod. 2022, 340, 130756. [Google Scholar] [CrossRef]
  15. Gao, Z.H.; Xie, H.C.; Yu, H.Q.; Ma, B.; Liu, X.H.; Chen, S.Y. Study on Lithium-Ion Battery Degradation Caused by Side Reactions in Fast-Charging Process. Front. Energy Res. 2022, 10, 905710. [Google Scholar] [CrossRef]
  16. Hein, S.; Danner, T.; Latz, A. An Electrochemical Model of Lithium Plating and Stripping in Lithium Ion Batteries. ACS Appl. Energy Mater. 2020, 3, 8519–8531. [Google Scholar] [CrossRef]
  17. You, H.; Jiang, B.; Zhu, J.; Wang, X.; Shi, G.; Han, G.; Wei, X.; Dai, H. In-situ quantitative detection of irreversible lithium plating within full-lifespan of lithium-ion batteries. J. Power Sources 2023, 564, 232892. [Google Scholar] [CrossRef]
  18. Liu, Z.; Li, K.; Zhang, W.; Xie, Y.; Liu, J.; Sun, L.; Zan, J. Research on safe charging strategy of lithium-ion battery based on three-electrode equivalent circuit model. J. Energy Storage 2023, 72, 108563. [Google Scholar] [CrossRef]
  19. Gao, X.-L.; Liu, X.-H.; Xie, W.-L.; Zhang, L.-S.; Yang, S.-C. Multiscale observation of Li plating for lithium-ion batteries. Rare Met. 2021, 40, 3038–3048. [Google Scholar] [CrossRef]
  20. Al-Haj Hussein, A.; Batarseh, I. A Review of Charging Algorithms for Nickel and Lithium Battery Chargers. IEEE Trans. Veh. Technol. 2011, 60, 830–838. [Google Scholar] [CrossRef]
  21. Liu, Y.H.; Teng, J.H.; Lin, Y.C. Search for an Optimal Rapid Charging Pattern for Lithium–Ion Batteries Using Ant Colony System Algorithm. IEEE Trans. Ind. Electron. 2005, 52, 1328–1336. [Google Scholar] [CrossRef]
  22. Rangarajan, S.P.; Barsukov, Y.; Mukherjee, P.P. Anode potential controlled charging prevents lithium plating. J. Mater. Chem. A 2020, 8, 13077–13085. [Google Scholar] [CrossRef]
  23. Epding, B.; Rumberg, B.; Mense, M.; Jahnke, H.; Kwade, A. Aging-Optimized Fast Charging of Lithium Ion Cells Based on Three-Electrode Cell Measurements. Energy Technol. 2020, 8, 2000457. [Google Scholar] [CrossRef]
  24. Liu, J.; Chu, Z.; Li, H.; Ren, D.; Zheng, Y.; Lu, L.; Han, X.; Ouyang, M. Lithium-plating-free fast charging of large-format lithium-ion batteries with reference electrodes. Int. J. Energy Res. 2021, 45, 7918–7932. [Google Scholar] [CrossRef]
  25. Li, X.; Yuan, C.; Wang, Z.; He, J.; Yu, S. Lithium battery state-of-health estimation and remaining useful lifetime prediction based on non-parametric aging model and particle filter algorithm. eTransportation 2022, 11, 100156. [Google Scholar] [CrossRef]
  26. Doyle, M.; Fuller, T.F.; Newman, J. Modeling of Galvanostatic Charge and Discharge of the Lithium/Polymer/Insertion Cell. J. Electrochem. Soc. 1993, 140, 1526. [Google Scholar] [CrossRef]
  27. Jokar, A.; Rajabloo, B.; Désilets, M.; Lacroix, M. Review of simplified Pseudo-two-Dimensional models of lithium-ion batteries. J. Power Sources 2016, 327, 44–55. [Google Scholar] [CrossRef]
  28. Li, J.; Adewuyi, K.; Lotfi, N.; Landers, R.G.; Park, J. A single particle model with chemical/mechanical degradation physics for lithium ion battery State of Health (SOH) estimation. Appl. Energy 2018, 212, 1178–1190. [Google Scholar] [CrossRef]
  29. Wu, M.Y.; Qin, L.L.; Wu, G. State of power estimation of power lithium-ion battery based on an equivalent circuit model. J. Energy Storage 2022, 51, 104538. [Google Scholar] [CrossRef]
  30. Ding, X.; Zhang, D.; Cheng, J.; Wang, B.; Luk, P.C.K. An improved Thevenin model of lithium-ion battery with high accuracy for electric vehicles. Appl. Energy 2019, 254, 113615. [Google Scholar] [CrossRef]
  31. Zhang, C.; Allafi, W.; Dinh, Q.; Ascencio, P.; Marco, J. Online estimation of battery equivalent circuit model parameters and state of charge using decoupled least squares technique. Energy 2018, 142, 678–688. [Google Scholar] [CrossRef]
  32. Zhao, T.Z.; Zheng, Y.J.; Liu, J.H.; Zhou, X.; Chu, Z.Y.; Han, X.B. A study on half-cell equivalent circuit model of lithium-ion battery based on reference electrode. Int. J. Energy Res. 2021, 45, 4155–4169. [Google Scholar] [CrossRef]
  33. Lu, Y.; Han, X.; Chu, Z.; Feng, X.; Qin, Y.; Ouyang, M.; Lu, L. A decomposed electrode model for real-time anode potential observation of lithium-ion batteries. J. Power Sources 2021, 513, 230529. [Google Scholar] [CrossRef]
  34. Chen, D.; Gao, W.; Zhang, C.; Chen, L. SOC estimation of lithium battery based on double modified ampere-hour integral method. In Proceedings of the 2022 37th Youth Academic Annual Conference of Chinese Association of Automation (YAC), Beijing, China, 19–20 November 2022; pp. 1093–1098. [Google Scholar]
  35. Mao, S.; Han, X.; Lu, Y.; Wang, D.; Su, A.; Lu, L.; Feng, X.; Ouyang, M. Multi sensor fusion methods for state of charge estimation of smart lithium-ion batteries. J. Energy Storage 2023, 72, 108736. [Google Scholar] [CrossRef]
  36. Drees, R.; Lienesch, F.; Kurrat, M. Fast Charging Formation of Lithium-Ion Batteries Based on Real-Time Negative Electrode Voltage Control. Energy Technol. 2022, 11, 2200868. [Google Scholar] [CrossRef]
  37. Rahman, A.; Lin, X. Li-ion battery individual electrode state of charge and degradation monitoring using battery casing through auto curve matching for standard CCCV charging profile. Appl. Energy 2022, 321, 119367. [Google Scholar] [CrossRef]
  38. Bohinsky, A.; Rangarajan, S.P.; Barsukov, Y.; Mukherjee, P. Preventing lithium plating under extremes: An untold tale of two electrodes. J. Mater. Chem. A 2021, 9, 17249–17260. [Google Scholar] [CrossRef]
  39. Zou, B.; Xiong, M.; Wang, H.; Ding, W.; Jiang, P.; Hua, W.; Zhang, Y.; Zhang, L.; Wang, W.; Tan, R. A Deep Learning Approach for State-of-Health Estimation of Lithium-Ion Batteries Based on a Multi-Feature and Attention Mechanism Collaboration. Batteries 2023, 9, 329. [Google Scholar] [CrossRef]
  40. Chen, Y.; Xiong, H.; Guo, Y. SOC Estimation of Lithium-ion Batteries at Different Temperatures. J. Phys. Conf. Ser. 2022, 2401, 012055. [Google Scholar] [CrossRef]
Figure 1. Model parameters for OLFEM. (a) The purple area indicates the model parameters of the negative portion; (b) The model parameters of the overall cell portion.
Batteries 09 00563 g001
Figure 2. Reference electrode implantation method and process. (a) Copper wire type reference fabrication method; (b) Reference electrode implantation position in the long-dimensional cell; (c) The implantation position and process of the reference electrode on the negative tab side; (d) The implantation position of the reference electrode on the positive tab side.
Batteries 09 00563 g002
Figure 3. Stability verification of the reference electrode. (a) Current and negative electrode potential during reference electrode activation; (b) First capacity cycle after reference activation; (c) Comparison of negative electrode potential repeatability during capacity cycle charging; (d) Comparison of terminal voltage repeatability during capacity cycle charging.
Batteries 09 00563 g003
Figure 4. Experiments to calibrate and validate OLFEM parameters (a) 25 °C HPPC; (b) 25 c MRCC; (c) NEDC; (d) Single-cycle NEDC.
Batteries 09 00563 g004
Figure 5. Negative electrode potential comparison of the positive and negative sides during the charging process.
Batteries 09 00563 g005
Figure 6. All parameters of OLFEM at 25 °C, including the R 0 , R 1 , C , and OCV. (a) Parameters of the negative portion; (b) Parameters of the overall portion.
Batteries 09 00563 g006
Figure 7. Comparison of simulated and measured terminal voltage and negative electrode potential under static conditions. (a) −10 °C 1/5 C; (b) 0 °C 1/3 C; (c) 25 °C 1/3 C; (d) 25 °C 1 C; (e) 25 °C 2.3 C; (f) Verification errors at various temperatures and charge rates.
Batteries 09 00563 g007
Figure 8. Simulation results with different initial errors. (a) Error 1: the rated capacity has been reduced by 10%; (b) Error 2: the rated capacity has been reduced by 20%; (c) Error 3: the initial SOC increased by 5% while the rated capacity decreased by 20%; (d) RMSE of the three initial errors.
Batteries 09 00563 g008
Figure 9. Comparison of NEDC simulation results: the blue solid line represents the actual value, while the red dashed line represents the simulation estimate. (a) Negative electrode potential simulation results; (b) Terminal voltage simulation results.
Batteries 09 00563 g009
Figure 10. Fast charging without lithium plating. (a) Current vs. time curve; (b) Terminal voltage vs. time curve; (c) Negative electrode potential vs. time curve; (d) Charge capacity vs. time curve, the change in color temperature indicates the level of charged capacity in the battery.
Batteries 09 00563 g010
Table 1. Model calibration and validation experiments.
TestTemperature/°CDetails
Capacity251/3 C CC-CV charge, 1/3 C discharge
HPPC25Pulse rates include 0.33 C, 1 C, 1.5 C, 1.9 C and 2.3 C
HPPC0Pulse rates include 0.1 C, 0.3 C and 0.55 C
HPPC−10Pulse rates include 0.05 C, 0.1 C and 0.22 C
MRCC250.167 C, 0.33 C, 0.5 C, 1 C, 1.5 C, 1.9 C and 2.3 C
CC charge
MRCC00.1 C, 0.3 C and 0.55 C CC charge
MRCC−100.05 C, 0.1 C and 0.22 C CC charge
NEDC25Maximum charge rate 1.23 C
Disclaimer/Publisher’s Note: The statements, opinions and data contained in all publications are solely those of the individual author(s) and contributor(s) and not of MDPI and/or the editor(s). MDPI and/or the editor(s) disclaim responsibility for any injury to people or property resulting from any ideas, methods, instructions or products referred to in the content.

