1. Introduction
Increasing safety requirements for the power supply in a 12 V on-board power supply system, also known as powernet, requires novel approaches through which to verify the robustness and reliability of the 12 V battery. During normal operation, the alternator in conventional combustion vehicles, or the DCDC converter in electric vehicles, work together with the 12 V battery. Jointly, they supply the necessary energy to the powernet. In particular, the 12 V battery stabilizes the voltage in the powernet. However, if the primary component for the continuous power supply—which is the alternator or the DCDC converter—fails, then the 12 V battery must provide the overall power supply [
1].
There are several technologies that can serve as a solution for power supply in the 12 V powernet [
2,
3]. Recent developments in lithium ion batteries may be relevant for future applications [
4,
5]. Although there are improvements in other technologies [
6,
7], lead batteries are the most common energy storage devices in low-voltage powernets. Millions of current vehicles worldwide rely on lead batteries, and this technology is expected to remain in conventionally powered vehicles for the foreseeable future. The lead battery could also prove to be a good solution for future vehicles with other propulsion systems, as well as in partially or fully automated driving applications. Therefore, the 12 V lead battery, which is already common in electric vehicle powernets, must prove its performance and reliability.
A first milestone toward this goal was achieved in our previous paper, ‘Electrical non-invasive determination of aging progress and failure mechanisms of field aged automotive lead batteries’ [
1]. The differences found when compared to previous studies were already extensively presented in that preceding paper, and they are therefore not repeated herein.
The results of the electrical tests of the total investigated sample are summarized in this paper. The data provided herein are suitable as a basis for further reliability analysis and validation of diagnostic algorithms for electronic battery sensors.
The sample presented consists of batteries collected from the field that have aged due to conventional usage profiles, and which have, consequently, partially failed. In terms of their applicability for upcoming automotive demands, their performances needed to be evaluated with respect to new requirements. These requirements were derived from the vehicle architectures, as presented in the following section, and were imposed on the battery.
1.1. E/E Systems
The powernet is a crucial part of the vehicle’s system architecture, which mainly consists of electrical and/or electronic systems and are called E/E systems. These E/E systems are essential for the safe operation of the vehicle, so they must be designed in accordance with functional safety standards.
If a fault in the battery leads to a limited performance (with respect to voltage response when under load), then this might not directly lead to a loss of the power supply because the additional continuous power supply (from the alternator or DCDC converter) stabilizes the system. However, high consumer loads or an additional fault in the independent energy source could lead to an overall failure of the power supply system.
Thus, Kurita et al. discussed the design of vehicle power supply systems and focused on future driving applications like assisted and automated driving (AD) [
8]. Kilian et al. [
9] recently derived guidelines on how to develop E/E systems based on the ISO 26262 standard to fulfill safety requirements for future power supply systems. This topic of power supply design is also addressed by Köhler et al. [
10] by focusing on development according to the functional safety aspects based on the ISO 26262 series of standards. In this work, the focus is on electric power steering (EPS) for manual assisted driving with an automotive safety integrity level (ASIL) of C—thus requiring a safe power supply rated with ASIL C. When distinguishing between reliability and safety, as Mullazzani [
11] described, a reliable system is desirable but a safe system is necessary to avoid critical issues. This is of particular relevance if availability becomes safety related, whereby a high reliability is beneficial to achieve a high safety in this case [
12]. Furthermore, Köhler et al. developed a method for handling failures in vehicle power supply systems based on cyclic safety mechanisms in an ISO 26262-compliant manner [
13,
14,
15]. Although the vehicular powernet was designed according to the ISO standard, the battery was not addressed in more detail as a crucial power supply for normal, as well as emergency, operations. Batteries are handled as an element of other technology; hence, they are outside the direct scope of ISO 26262 [ISO 26262-4:2018(E)] [
16].
Besides this ISO standard, the latest work in VDA 450 deals with the powernet and the requirements it places on passive sources, which can be the 12 V battery, as well as highlights the importance of a safe power supply from the battery for future vehicle architectures [
17].
VDA 450 defines the functional requirements regarding the passive source in the powernet, i.e., the energy storage device. The requirements resulting from the availability are dependent on the duration of the ‘minimal risk maneuver’ (MRM) or safe stop maneuver; in addition, the diagnostic interval and the diagnostic coverage of this maneuver lead to three functional safety requirements. The performance and energy content in terms of energy output and energy consumption of the energy storage device must be predictable for at least the MRM’s duration. The energy storage device including the diagnostic unit with isolating elements must ensure uninterrupted power for at least the duration of the safe stop maneuver. In the event of an initial fault in the source network, the energy storage device must close the isolating element and establish a connection to the safe onboard powernet. Furthermore, the battery needs to be safe during normal operation to comply with functional safety redundancy and decomposition approaches.
The functional requirements imply the necessity of a complete understanding of the failure behavior of the energy storage device. Moreover, the diagnostic coverages for the diagnostic functions of these observable aging effects and failure reasons is essential to achieve a consistent safety concept.
In addition, battery failure rates are also decisive for a complete safety assessment of a vehicle powernet. Electrochemical components, which include batteries, are subject to aging from the beginning of operational life, and they therefore directly start with the third part of the bathtub curve with increasing failure rates over time. Electrochemical components have multiple influencing factors that make the aging behavior complex and result in different, time-varying failure rates for different failure modes. However, these failure behaviors and the resulting failure rates must be included in the functional safety concept, as well as in the quantitative safety analysis, according to the ISO 26262 standard. Battery failures and resulting failure rates are therefore becoming increasingly important for the safety assessment of current and future vehicle applications.
1.2. Objective of This Approach
Several studies have been conducted to analyze the lifetime and failure rates of lead batteries, as discussed in detail in the preceding paper [
1]. However, a suitable, comprehensibly determined sample and an objective identification of the cause of failure is missing, even though these are basic preconditions for having confidence in the subsequent reliability analyses. Therefore, the novel electrical test was introduced to test field-aged 12 V automotive lead batteries in the same manner repeatedly, as well as to objectively determine the causes of failure using parameters and equations [
1]. The results of this electrical analysis are presented in this paper. An overview of the different failure modes of actual lead batteries in the field is given by a probability distribution. To achieve a suitable sample, the necessary sample size firstly needs to be calculated, and this is presented in the following chapter.
2. Derivation of Sample Size for Lifetime Analyses
There are two requirements for a sample to be used in life data analysis. To ensure that every aging condition of the battery can be identified correctly, the sample must reflect the field behavior very well, i.e., it must be representative. Since the battery has a decisive role as the last fallback level in the vehicle powernet, it must meet high requirements. This is the reason for the requirement that the total sample should be able to demonstrate 99% reliability with 99% confidence.
Since the total failure distribution of a battery is unknown, the sample size cannot be determined using a statistical power analysis, as described e.g., by Grundler et al. [
18]. Therefore, the only remaining approach is to specify the sample size via binomial distribution. From a reliability perspective, binomial distribution is defined as follows [
19]:
where
R(
t) corresponds to the reliability,
C to the confidence level,
n to the required sample size and
x to the number of failures. If one plans only with intact batteries and without already failed ones, Equation (
1) can be simplified. This simplification results in the following relation:
If we transform Equation (
2) in accordance with the required sample size and insert the reliability requirement, we obtain the following:
These 459 specimens must now be used to approximate the overall field behavior as best as possible in a test field. However, a battery is subject to a variety of aging conditions that can change during operation. The most important continuous factors were determined as follows: increased internal resistance, reversible capacity loss, irreversible capacity loss, cell shorts and nominal capacity. Furthermore, two categorical factors can be added as follows: the battery manufacturer and the battery technology. All possible battery conditions resulting from these factors must be present in the sample according to the field data. Field data that describe the distribution of the aging states, i.e., the continuous factors, are available. Four of the five continuous factors can be described very well by a Weibull distribution (with
T being the scale and
b being the shape parameter).
Table 1 shows an overview of the example parameters that should be focused on:
For the cell short, it is known that 94% of batteries have no cell short at all. The remaining 6% are equally distributed between 10% and 100%. The distribution of manufacturers was also assumed to be uniformly distributed with 10 different manufacturers. The technologies were only differentiated between the absorbent glass matt batteries (AGM) and flooded batteries (FLD), which included enhanced flooded batteries (EFB), uniformly.
Latin hypercube sampling (LHS) methods are particularly suitable for such problems [
20]. Due to the grid of the test field, the parameter space can be covered very well, even with many of the factors not generating correlations within the factors (orthogonality requirement).
A Latin hypercube design is a
nr ×
nf matrix
M, where each column describes a parameter and each row describes the respective parameter setting.
nr describes the number of parameter levels, and
nf the number of parameters. Thus, a 459 × 7 matrix was created for the batteries. As a first step, a uniformly distributed test field was created in the unit space since this can be used very flexibly. For this purpose, each row contained a random permutation of the numbers {1, 2, 3, …,
nr}. To convert the permutations
into unit space, a uniformly distributed random number between 0 and 1 was subtracted from each number and divided by
nr, as follows:
Therefore, the operator
in Equation (
4) provides a uniform random variate in the interval [0, 1]. The result is an equally distributed test field in unit space, which serves as a basis for the definition of the representative test field. Non-equally distributed test fields can be generated directly from equally distributed test fields. For this purpose, the inverse cumulative distribution function (cdf) of the objective function
was used. Since the ranges of values of
and the uniformly distributed test field were identical—they were both in the range [0, 1]—the uniformly distributed test field could be used as a direct input for the calculation [
21]. The inverse cdf
was thus calculated using a numerical approximation.
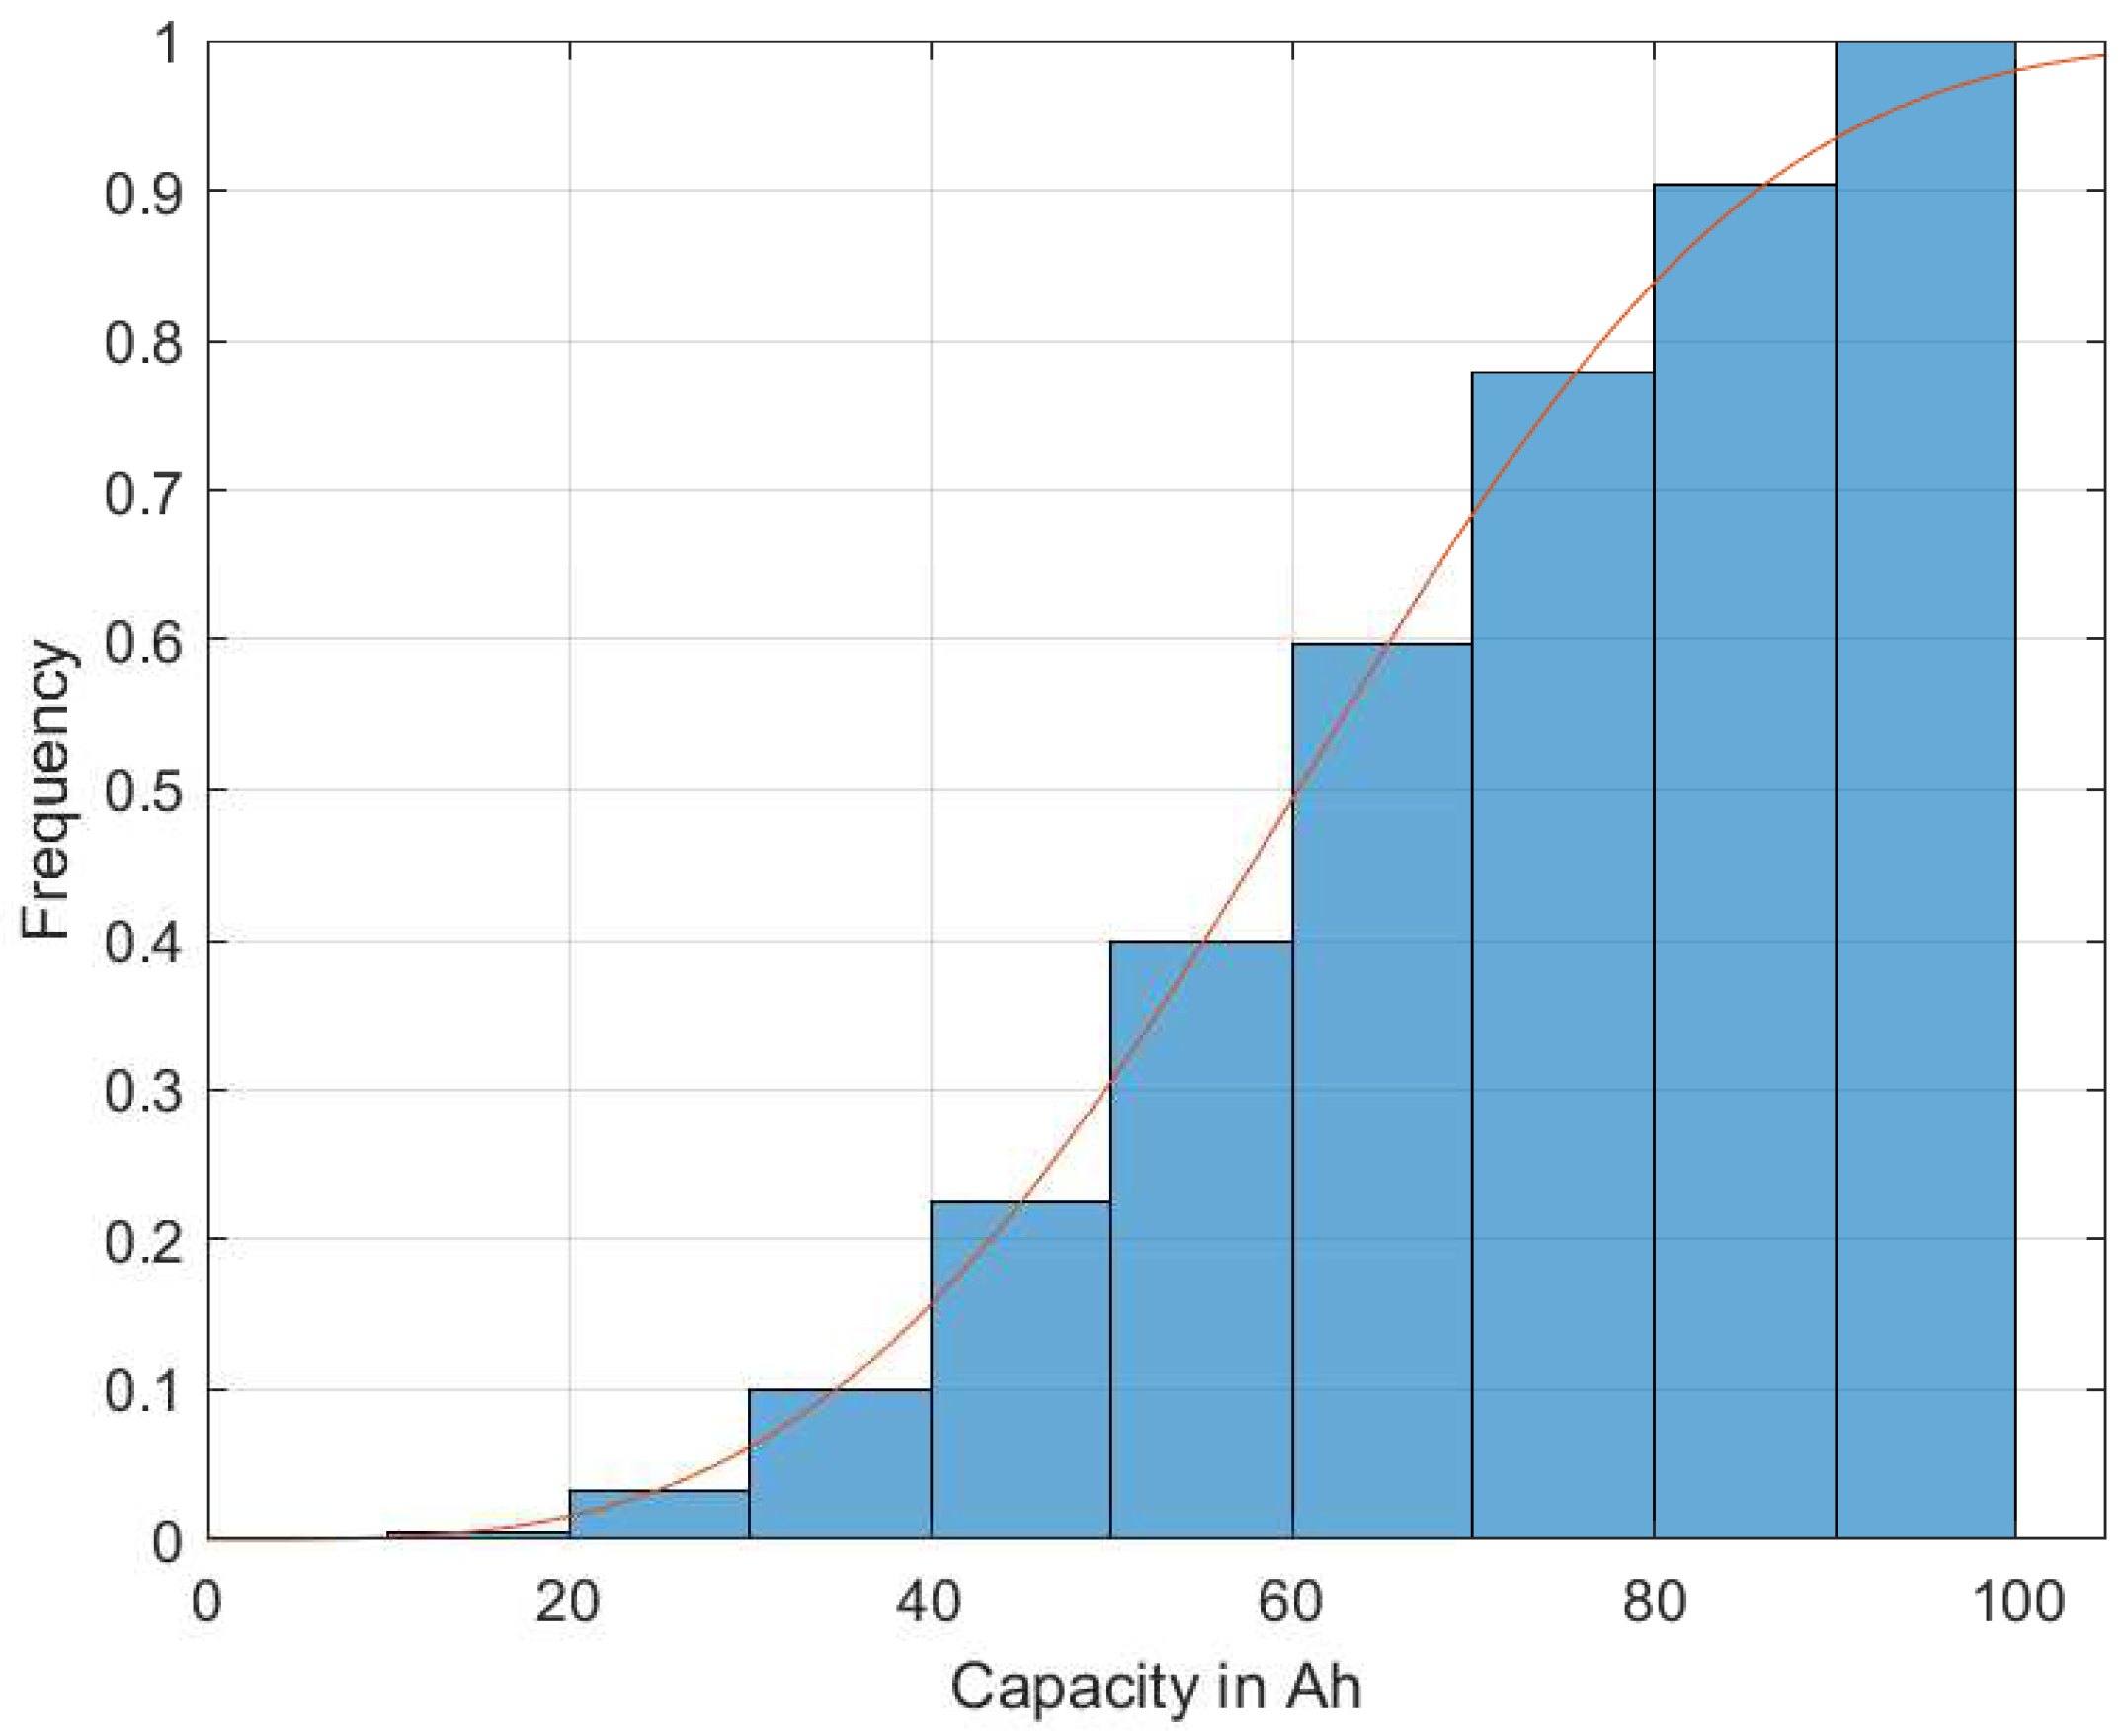
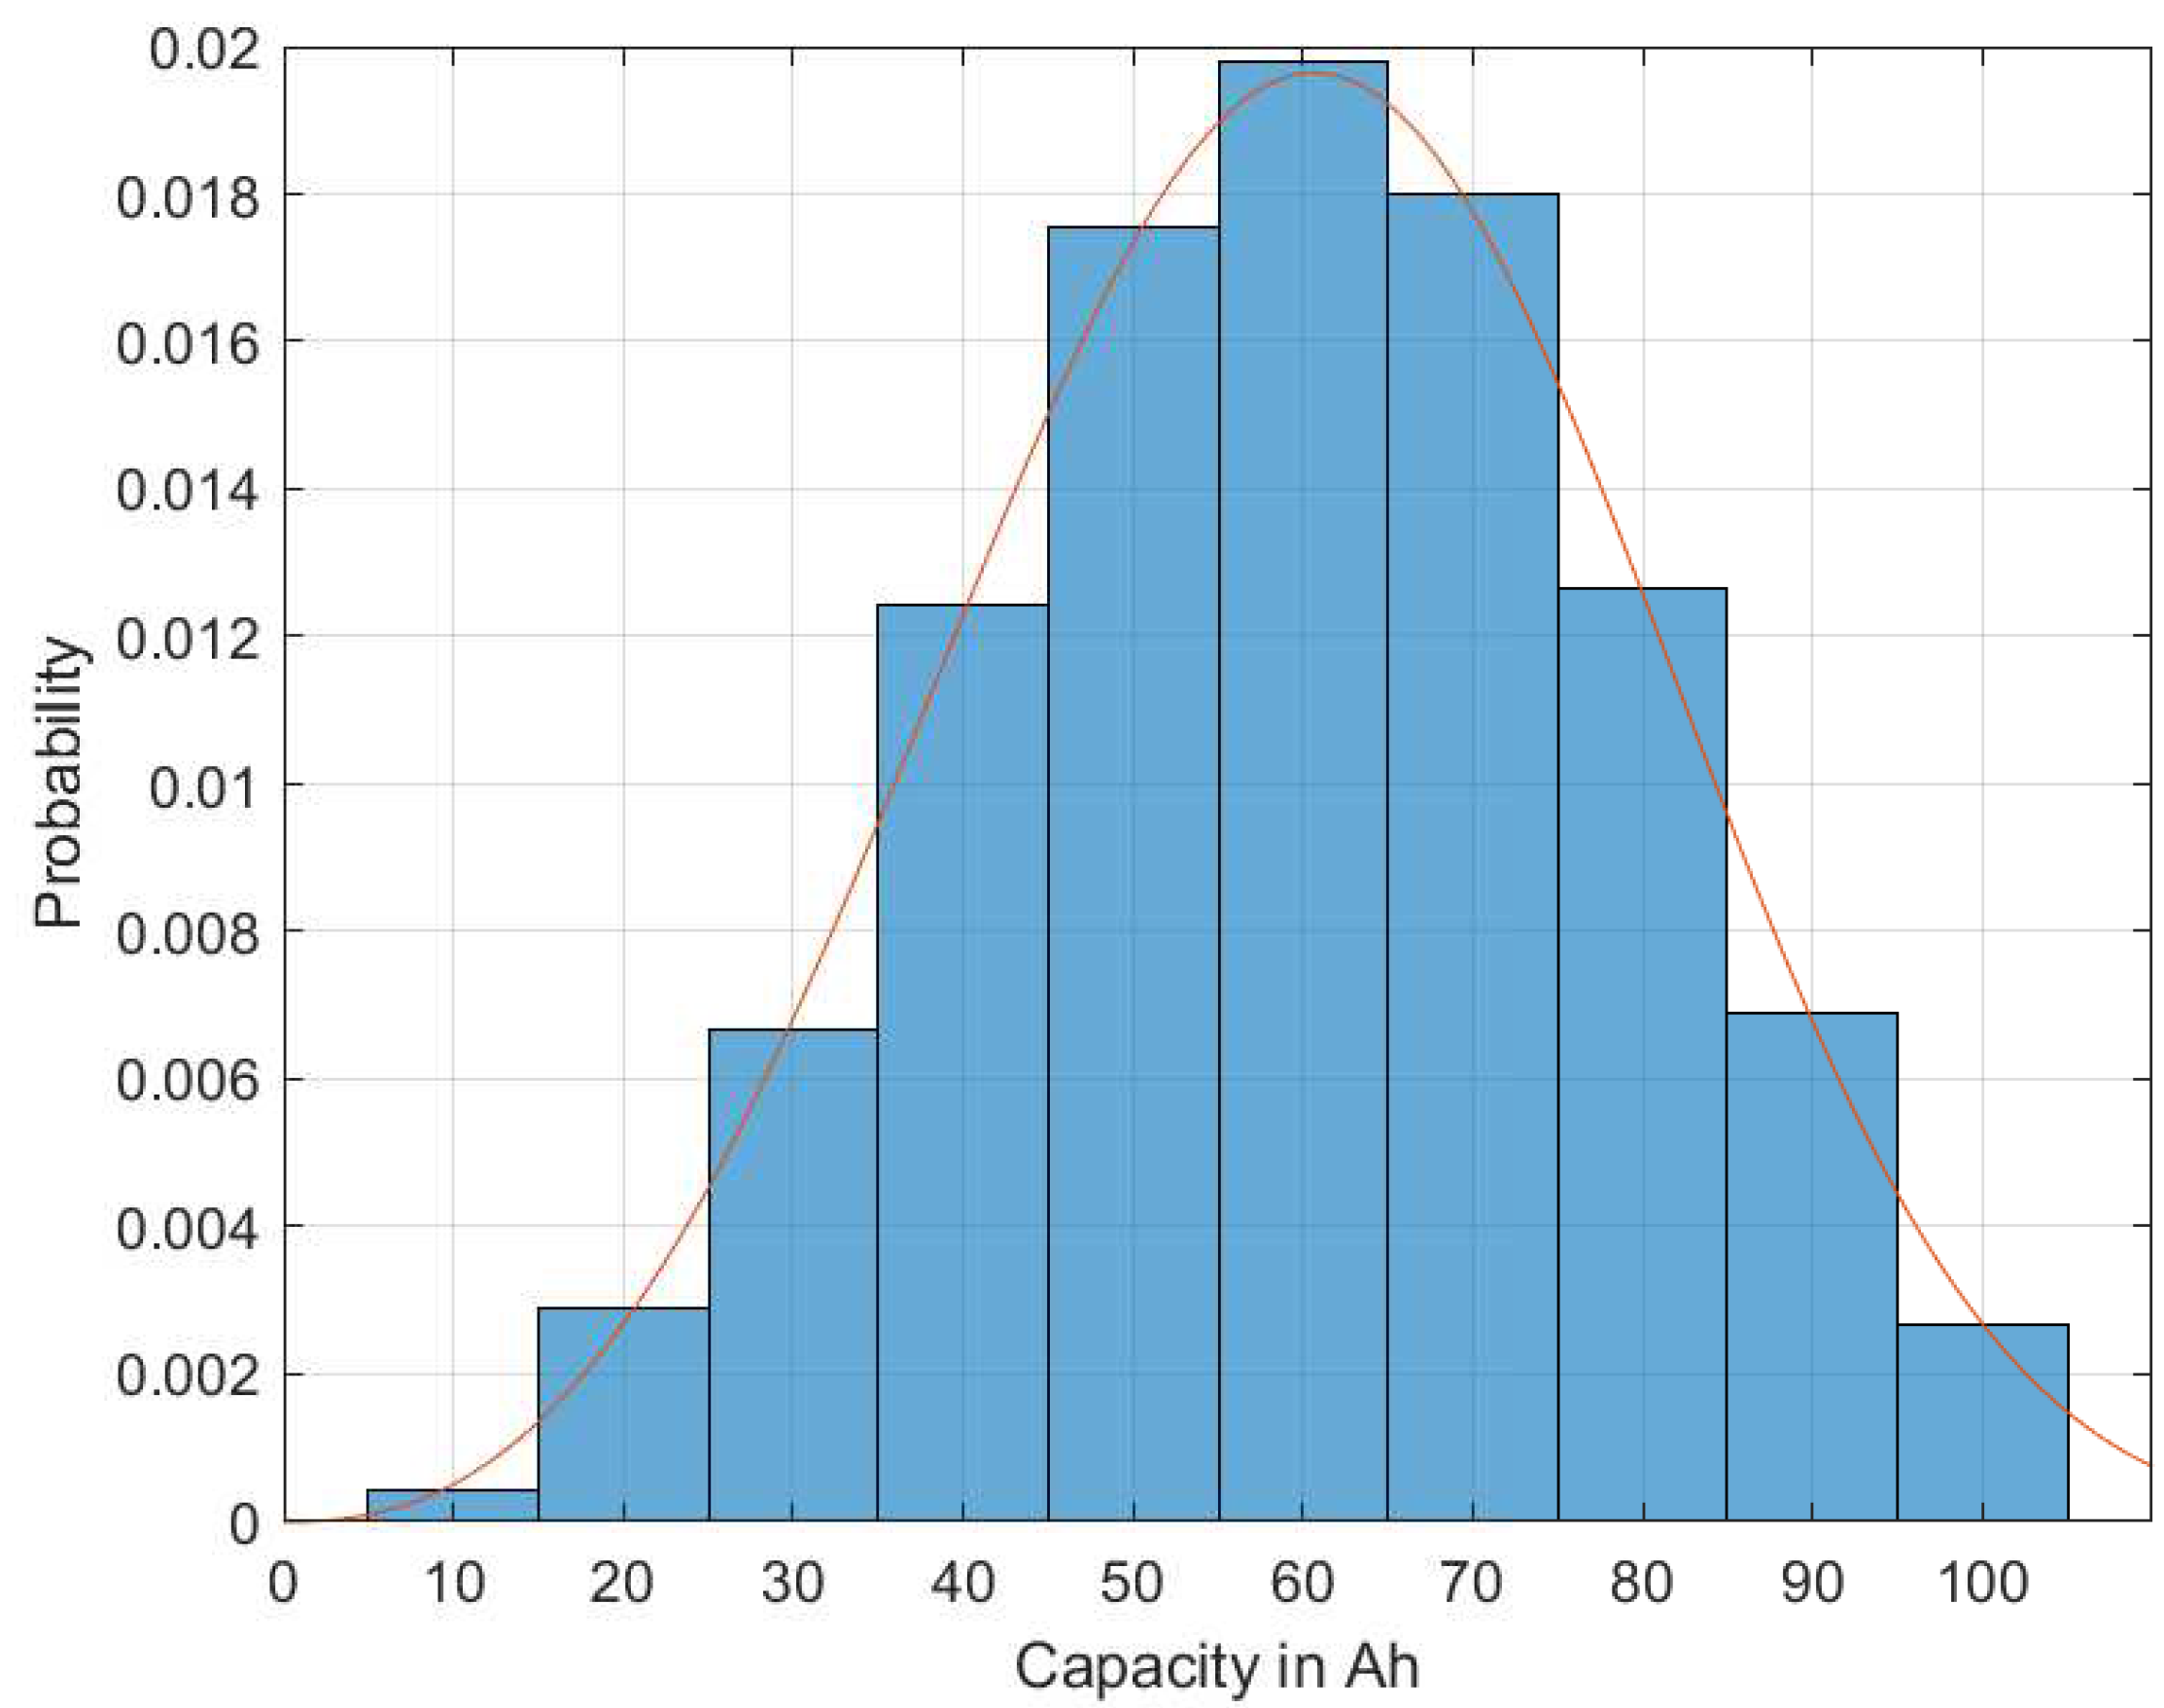
Using this procedure, a discrete representative test field was generated for each failure mechanism, which followed the specified field distribution. The result was a nearly orthogonal representative test field for all the considered failure mechanisms. The result is shown as an example for the capacity in
Figure 1 as cdf, and a probability density function as pdf in
Figure 2.
The solid line represents the given Weibull distribution, and the blue bars show the discretized levels of the calculated test design. In both the pdf and cdf plots, the discretized test design matches the specification very well. The result is a test matrix for all the seven factors with the predefined 459 parameter settings. All the factors that followed the given field conditions were very good, as is exemplarily shown for the capacity in
Figure 2. Due to simplification, all parameters in the generated sample test matrix were assigned to a maximum of 10 predefined discrete parameter values (e.g., capacity in the interval of [0, 1], see
Figure 2).
3. Results
The electrical test results of the field-aged batteries observed with the equation-based aging estimation [
1] are presented in the following chapters. General information about the sample is followed by an overview of the identified battery characteristics. Finally, the investigated failure modes of the sample are also presented.
3.1. General Information about the Sample
The preliminary sample was collected over a 2-year period, and it thus covers all seasonal effects and the different reasons for failure. Therefore, only the failure mechanisms were taken into account, and the manufacturer and type were left out. The majority (52.6%) of batteries were obtained from car workshops; these batteries had aged but were mostly still able to start a car and bring it to the workshop. Other batteries were collected from roadside assistance services (46.0%) and are therefore mostly breakdowns on the road or highway. Both the car workshops and roadside assistance services were independent of any specific car manufacturer and consequently delivered batteries of diverse manufacturers. With this split in the origin of the field-aged batteries, the sample contained a wide variety of types and qualities, as well as covered many aging effects and reasons for failure.
Moreover, 1.4% of the batteries were new and thus served as reference batteries; as such, they were analyzed in the same manner but considered separately.
Besides the electrical test presented in [
1], more information was available than just the collected characteristic parameters. Most important, apart from the reason for failure, was the time the battery was in service until it failed or was replaced.
The oldest battery in the sample for which the service life could be identified by the pole stamp or the serial number was 20.3 years old, thus resulting in a significantly higher average battery service life of 7.2 years compared to the median battery service life of 6.1 years.
All these batteries, with their various aging histories, were tested in the same manner as described in [
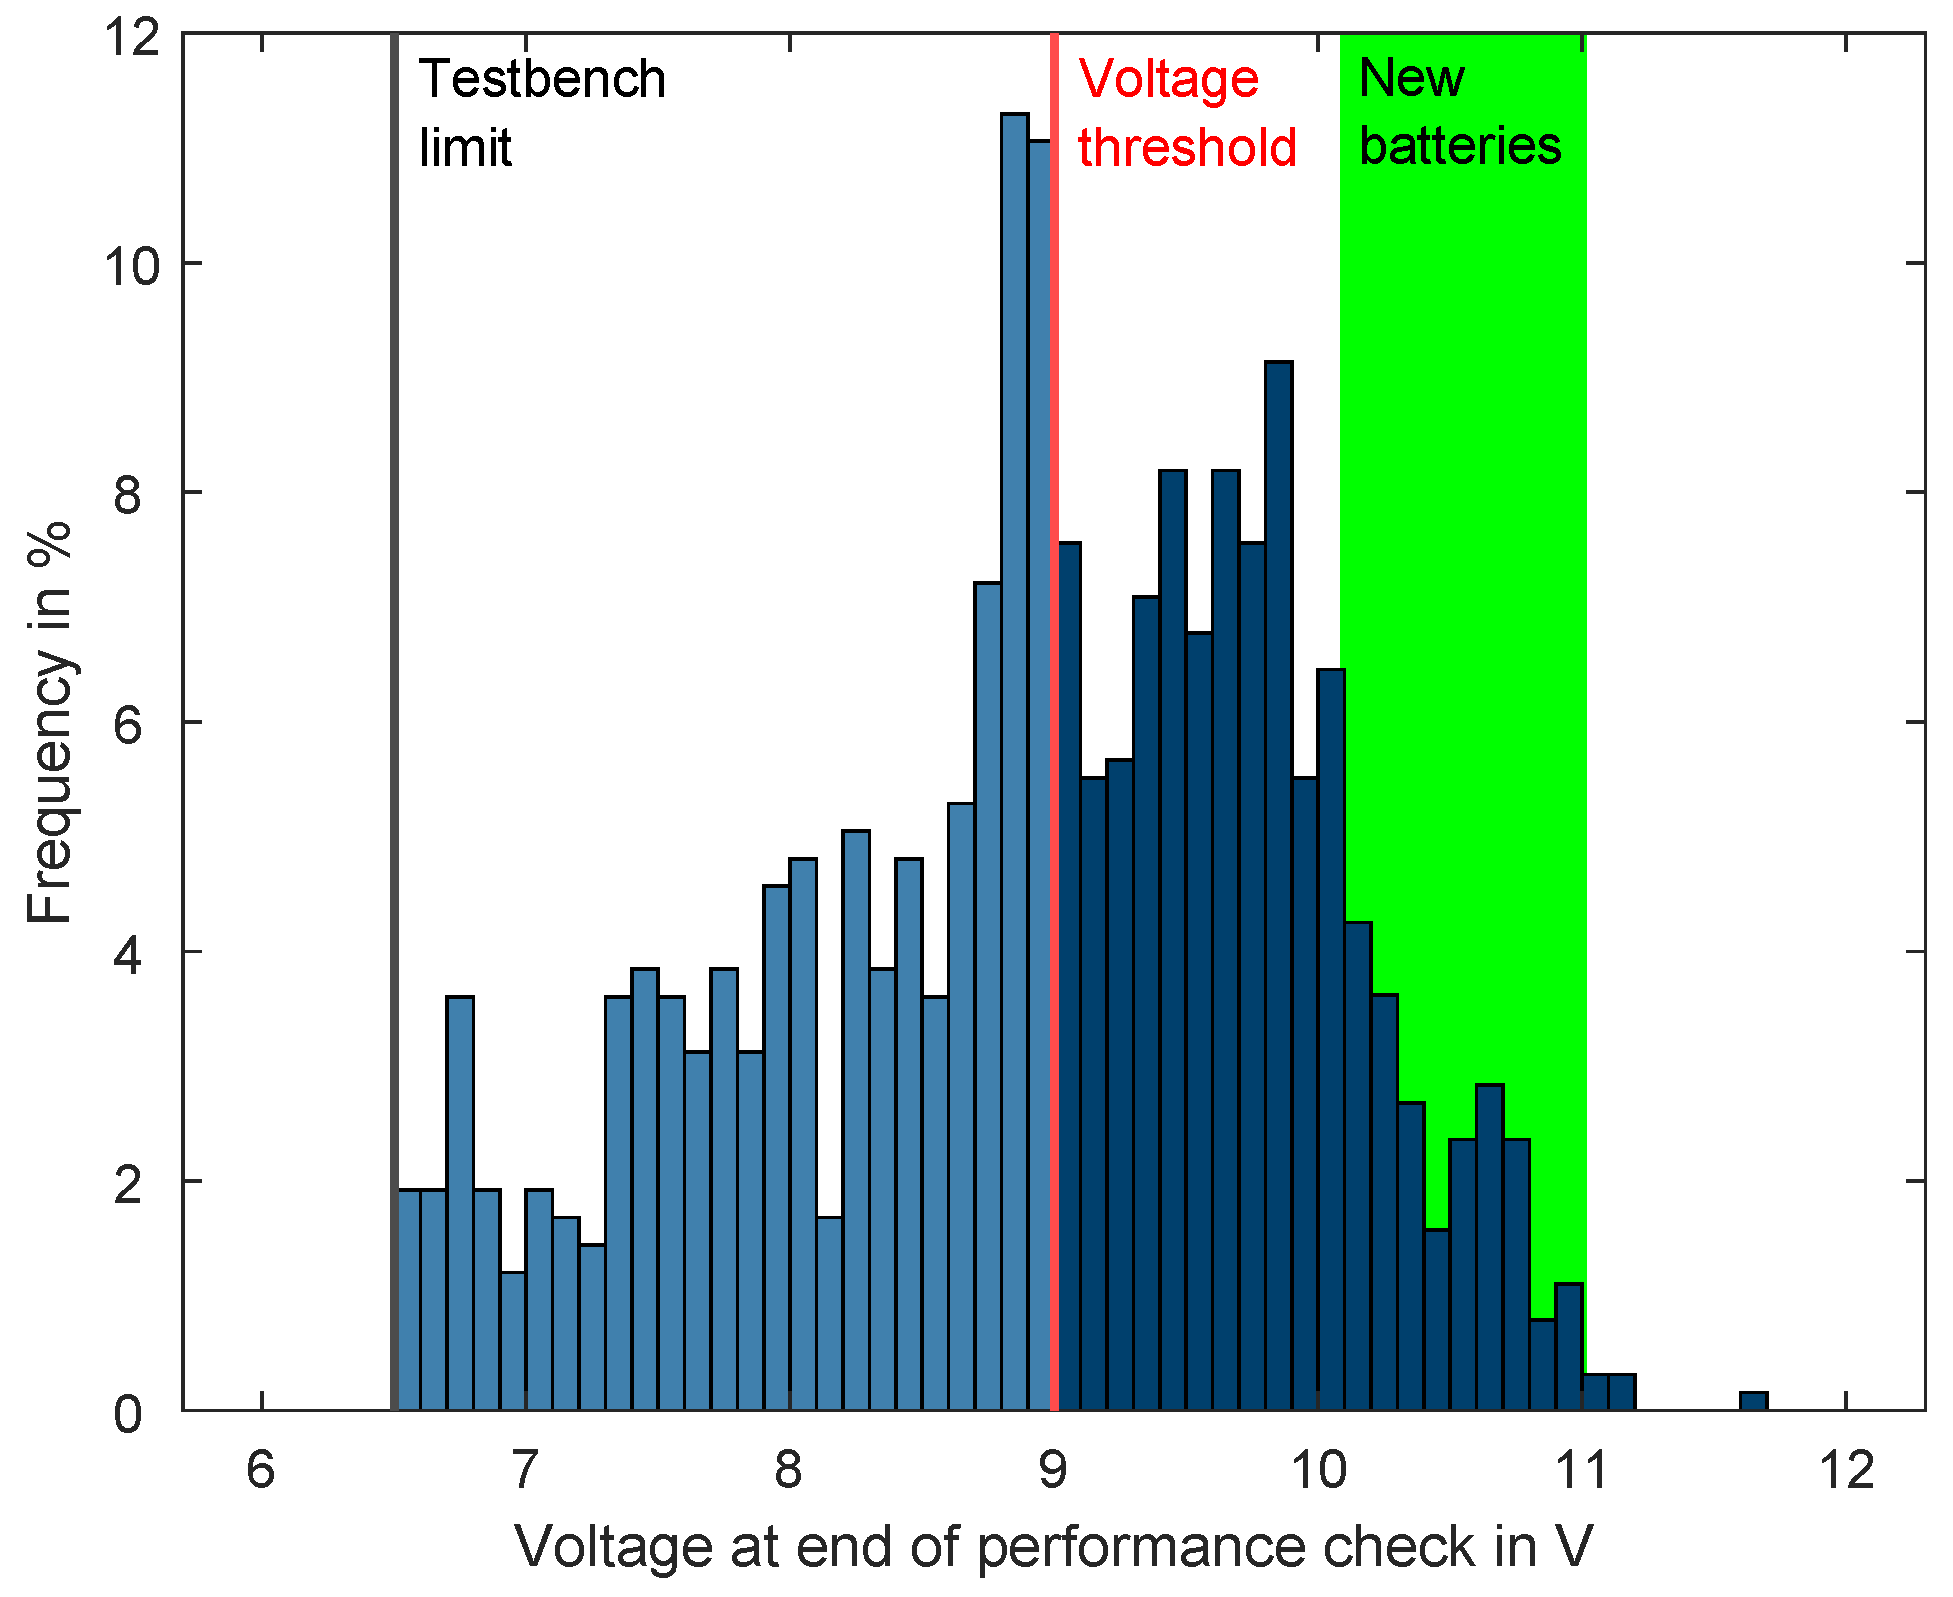
1]. During the electrical test, the performance was tested with an alternative load profile called the performance check. This check represented the ‘safe stop maneuver’, and this was performed as it is crucial for future automotive applications. Each battery that went through the electrical test was tested with this performance check. If the battery was able to keep the voltage above the predefined threshold of 9 V while applying the load, the performance check was rated as managed successfully. If the voltage dropped below this threshold, the performance check was rated as failed. Some batteries were severely aged, so they were not able to keep the voltage above the test bench limit of 6.5 V; as such, the test bench aborted the performance check and instead continued with the next step. Of course, if this happened in the performance check, then the battery was rated as failed as well.
Figure 3 shows the distribution of the battery end voltages of all the conducted performance checks. The blue bars represent the aged field batteries. In comparison, the green area represents the end voltages that the new batteries, which were used as references, could achieve. The histogram reveals that a good number of successful performance checks did not violate the defined voltage threshold of 9 V. A comparable number of performance checks could not be managed by the batteries. These batteries reached end voltages between 6.5 V and 9 V. Due to strong aging, some of the battery voltages dropped extremely fast when the performance check was applied. In this case, the test bench was no longer able to measure the low end voltage, so this performance check was also rated as not managed.
3.2. Overview on Battery Characteristics
The sample consisted of a large number of different batteries. In this chapter, the basic characteristics of the collected batteries will be discussed.
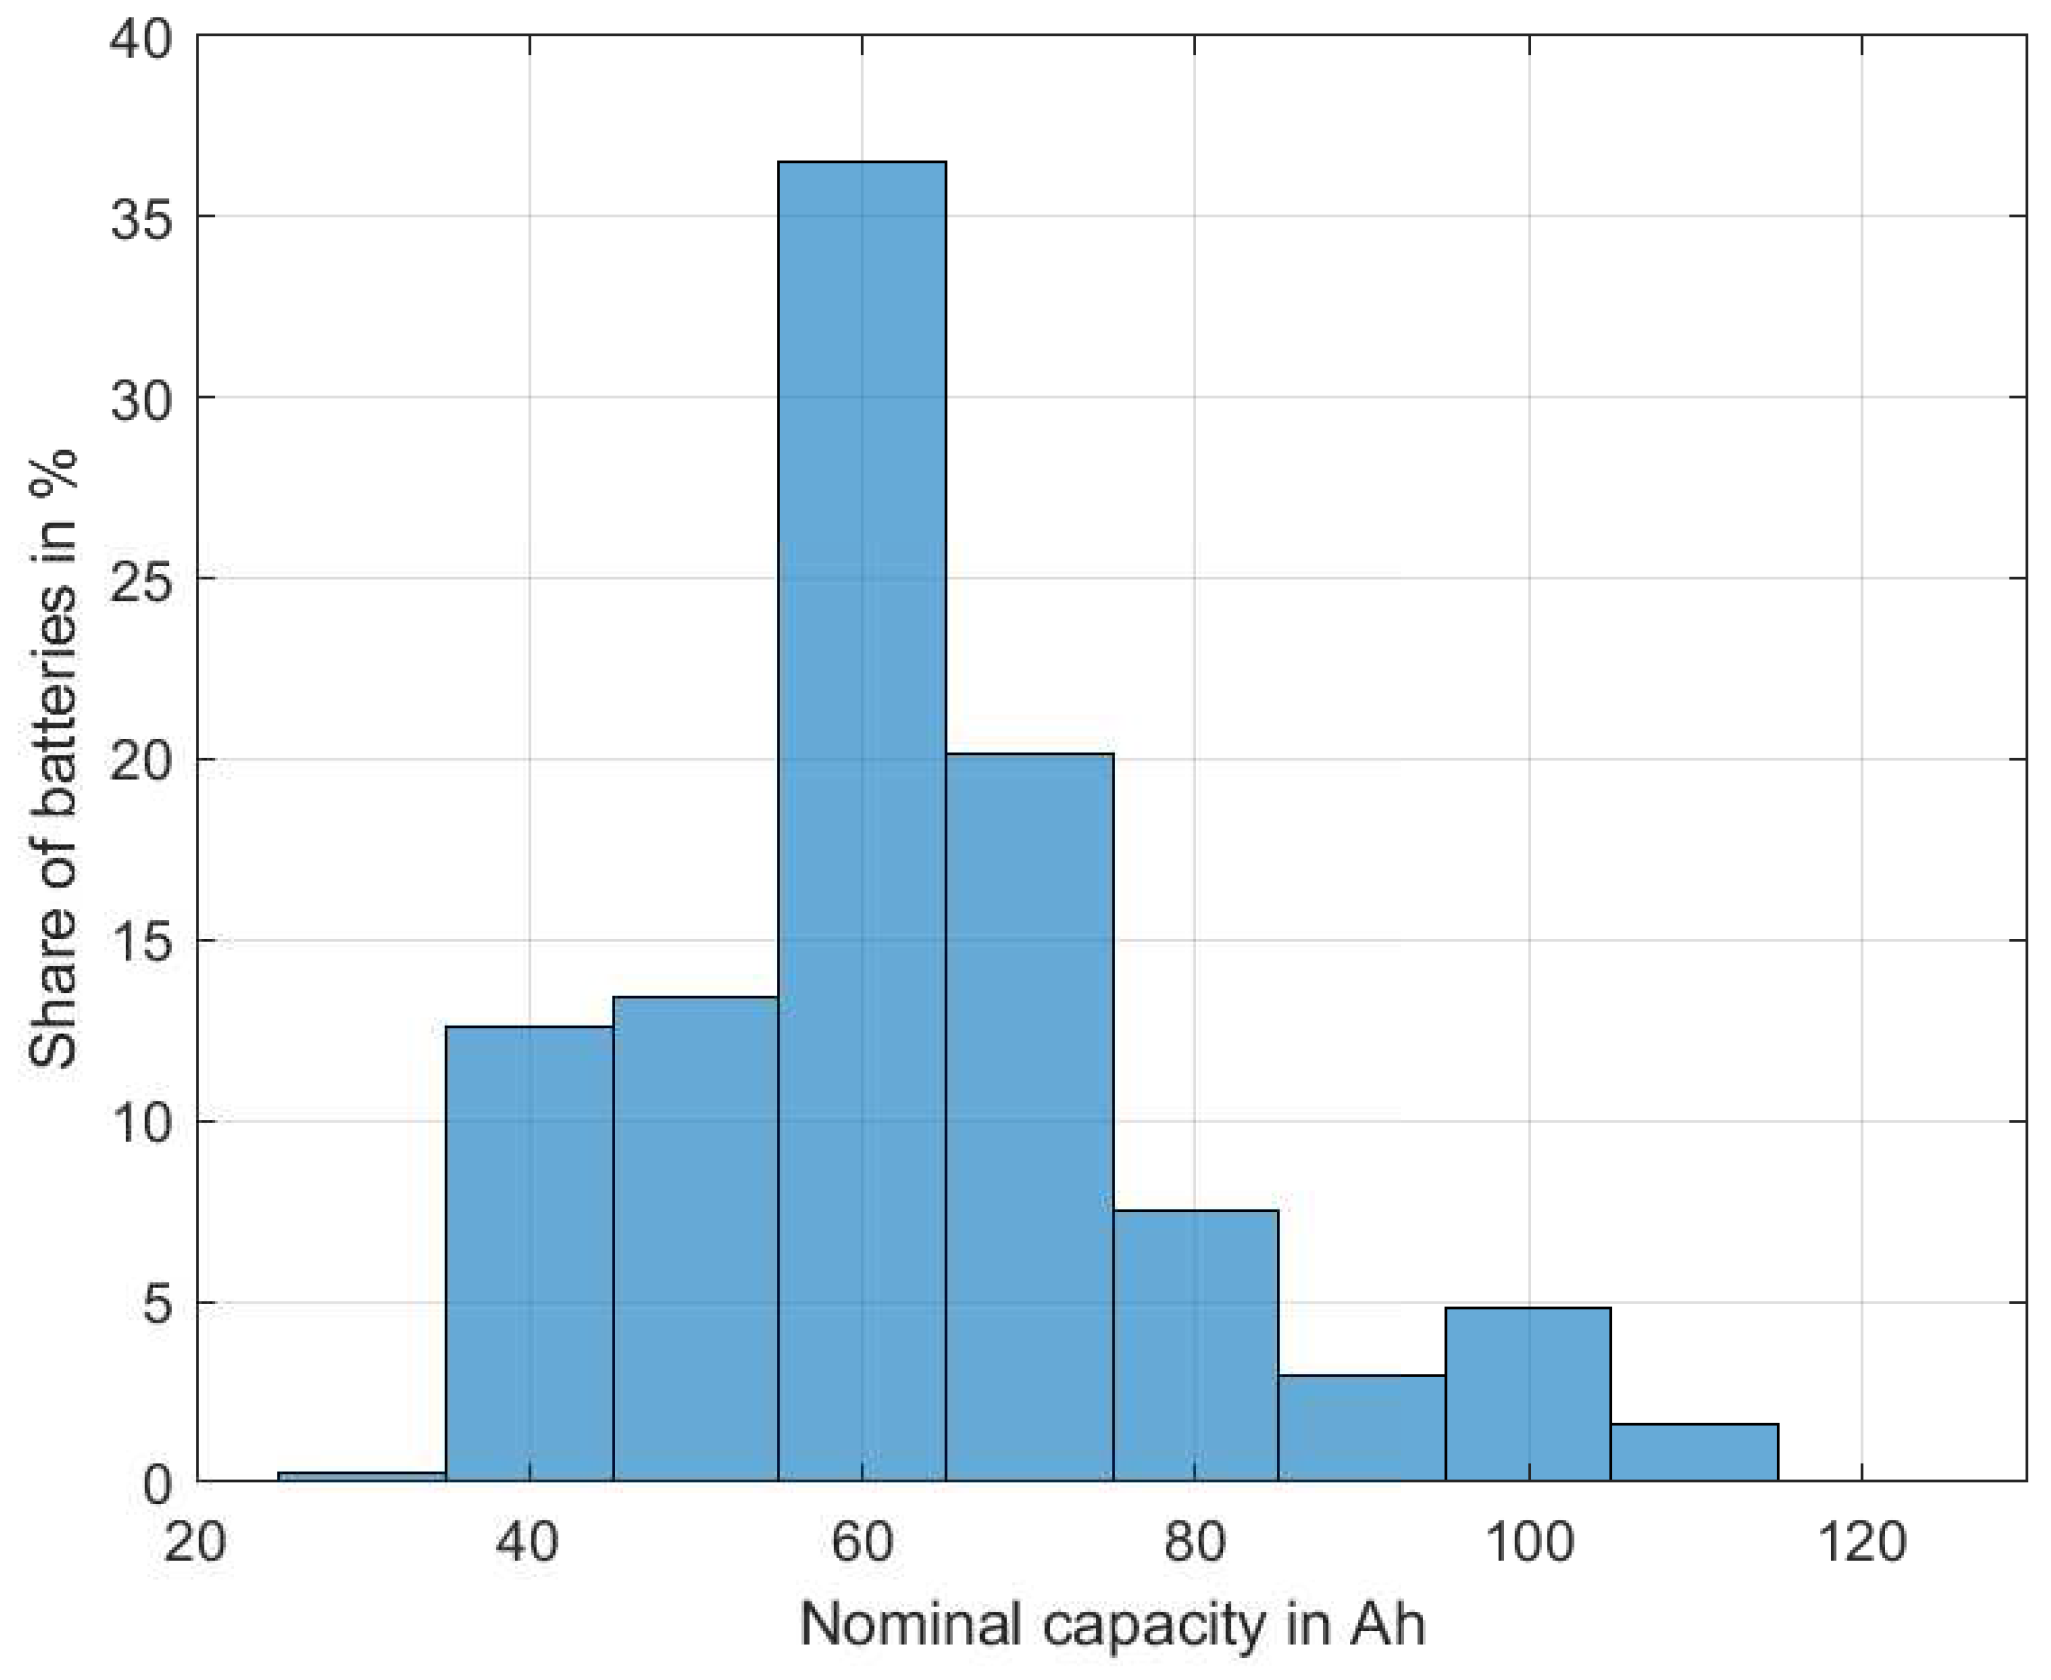
In
Figure 4, the distribution of the battery capacities is shown. There was a clear predominance in batteries with ∼60 Ah (36.6%), while smaller (35…54 Ah, 26.1%) and slightly larger batteries (65…74 Ah, 20.2%) were also very common. Batteries that were 80 Ah or larger, as are present in premium cars, only represented a smaller share (16.9%).
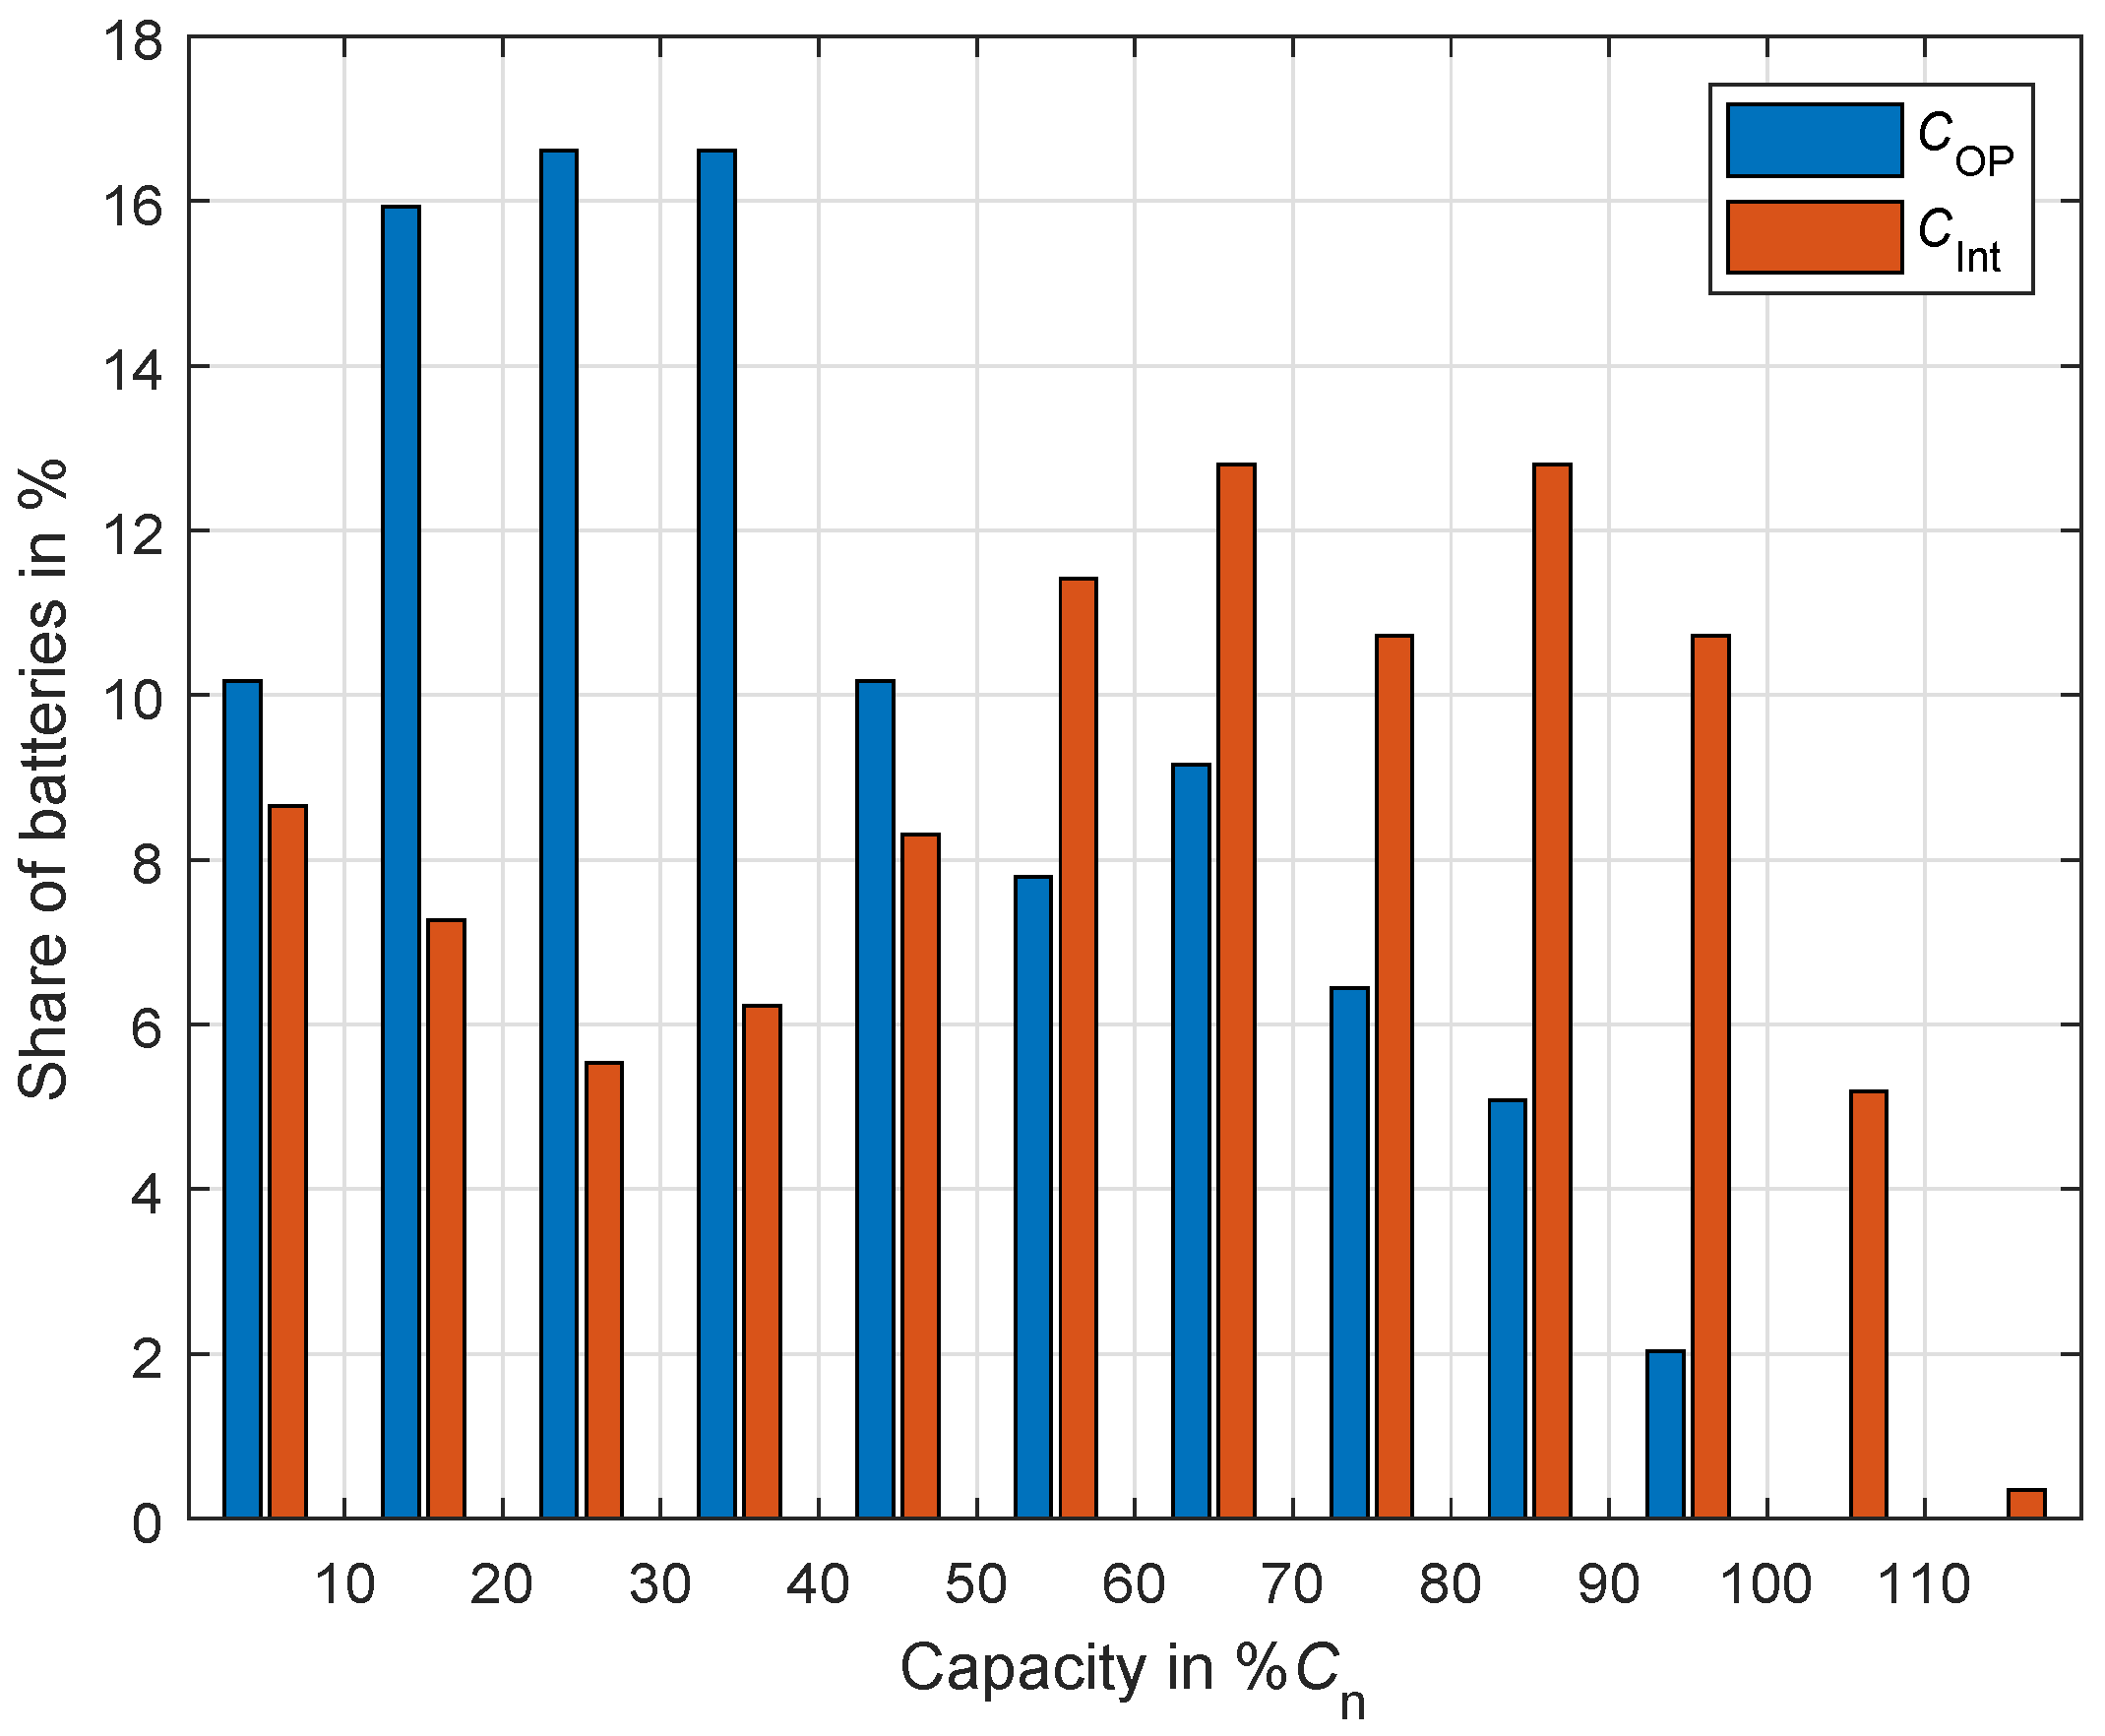
In
Figure 5, the measured capacities after operational charge and intensive charge are shown. While the operational charge (14.8 V for 6 h) mimics a good charge in a car and shows the capacity that can be reached in practice, the intensive charge (14.8 V for 24 h plus 0.5
for 6 h without voltage limitation) determines the technically achievable capacity, as well as supplies valuable information about the nature of the capacity loss.
Reversible capacity loss due to, e.g., soft sulfation (temporal);
Irreversible capacity loss due to, e.g., loss of active mass, water loss and hard sulfation (persistent).
An interesting fact is that most batteries can recover a significant amount of capacity with an intensive charge applied. While the sample shows an average capacity after an operational charge of 38.8% , this value increased after the intensive charge to 58.4% (+ 50.6%). While charging opportunities might be limited in combustion engine cars, especially if short trips are dominant, the electrification of the powertrain offers opportunities for more frequent or longer recovery charging out of a high voltage battery, even if not driving.
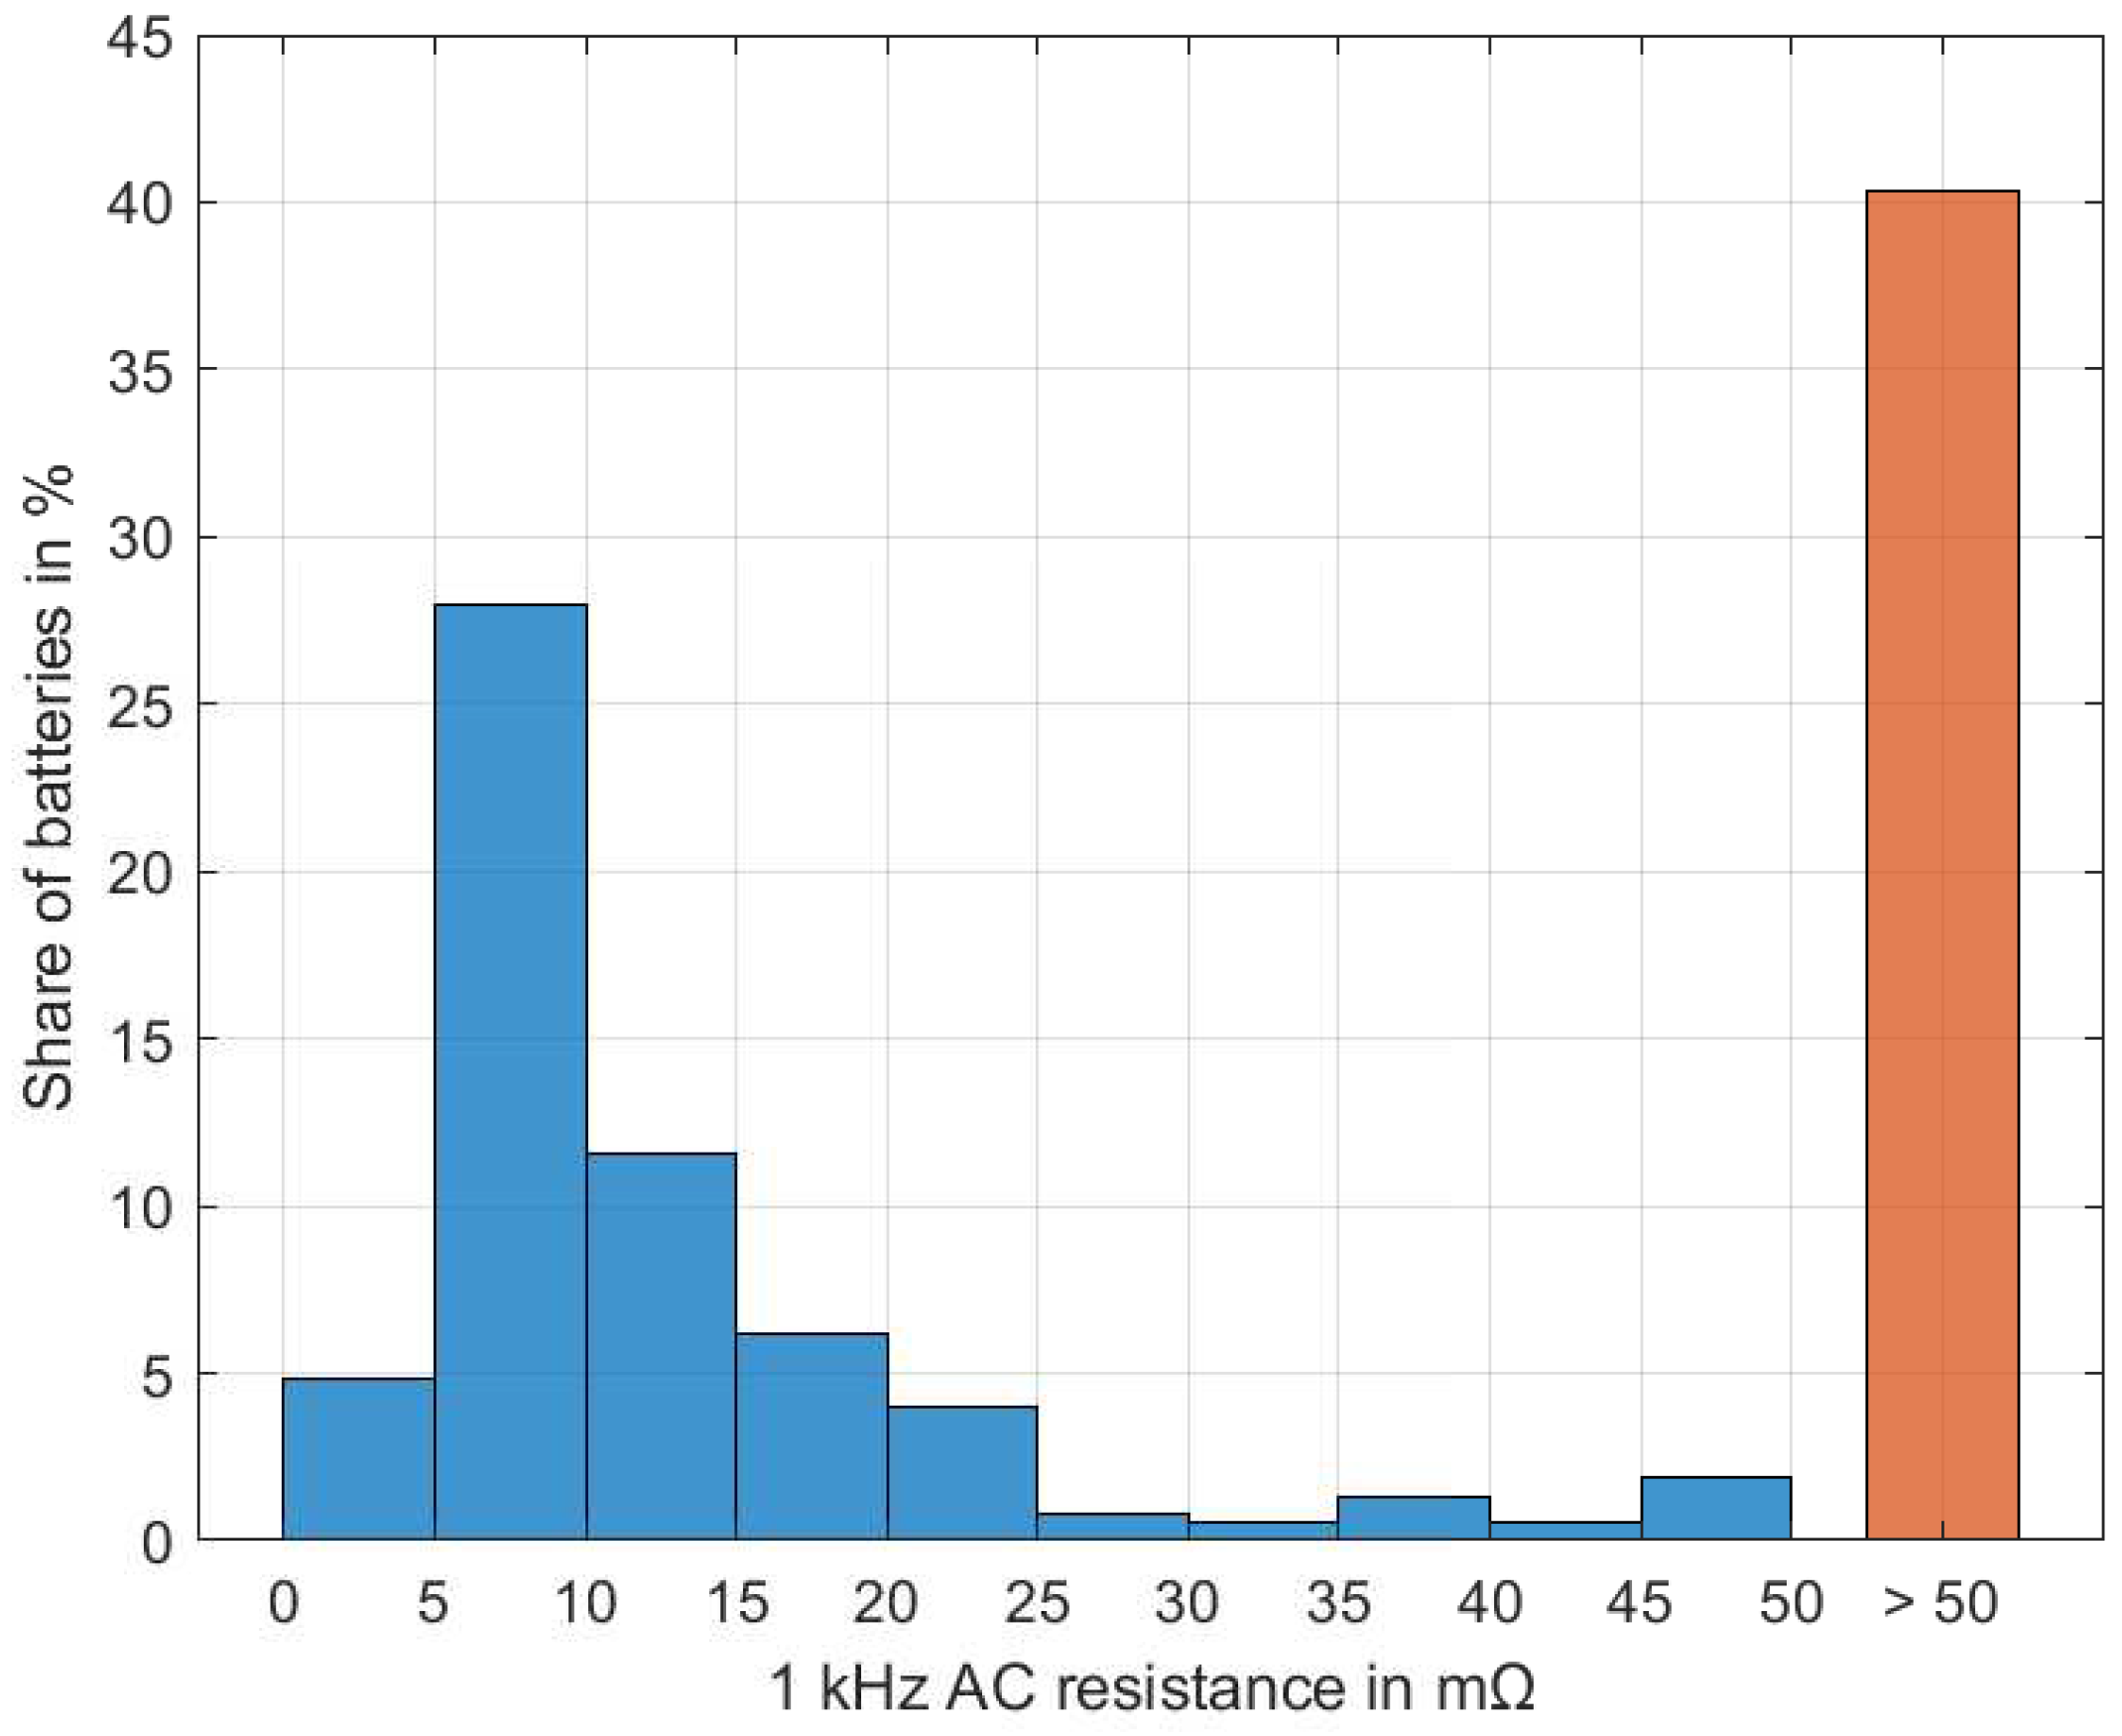
Figure 6 shows the distribution of the 1 kHz AC resistance, which was measured after collection at room temperature without previous charging. Approximately 5% of the batteries showed a very good internal resistance that was less than 5
, while a significant number showed a moderately increased internal resistance of up to
. These moderately increased values may cause issues when starting a combustion engine, especially if low temperatures additionally increase them. The majority, however, were severely aged or deeply discharged, i.e., slightly more than 40% had an internal resistance of
.
3.3. Failure Modes in the Field
The results from the equation-based aging estimation used in [
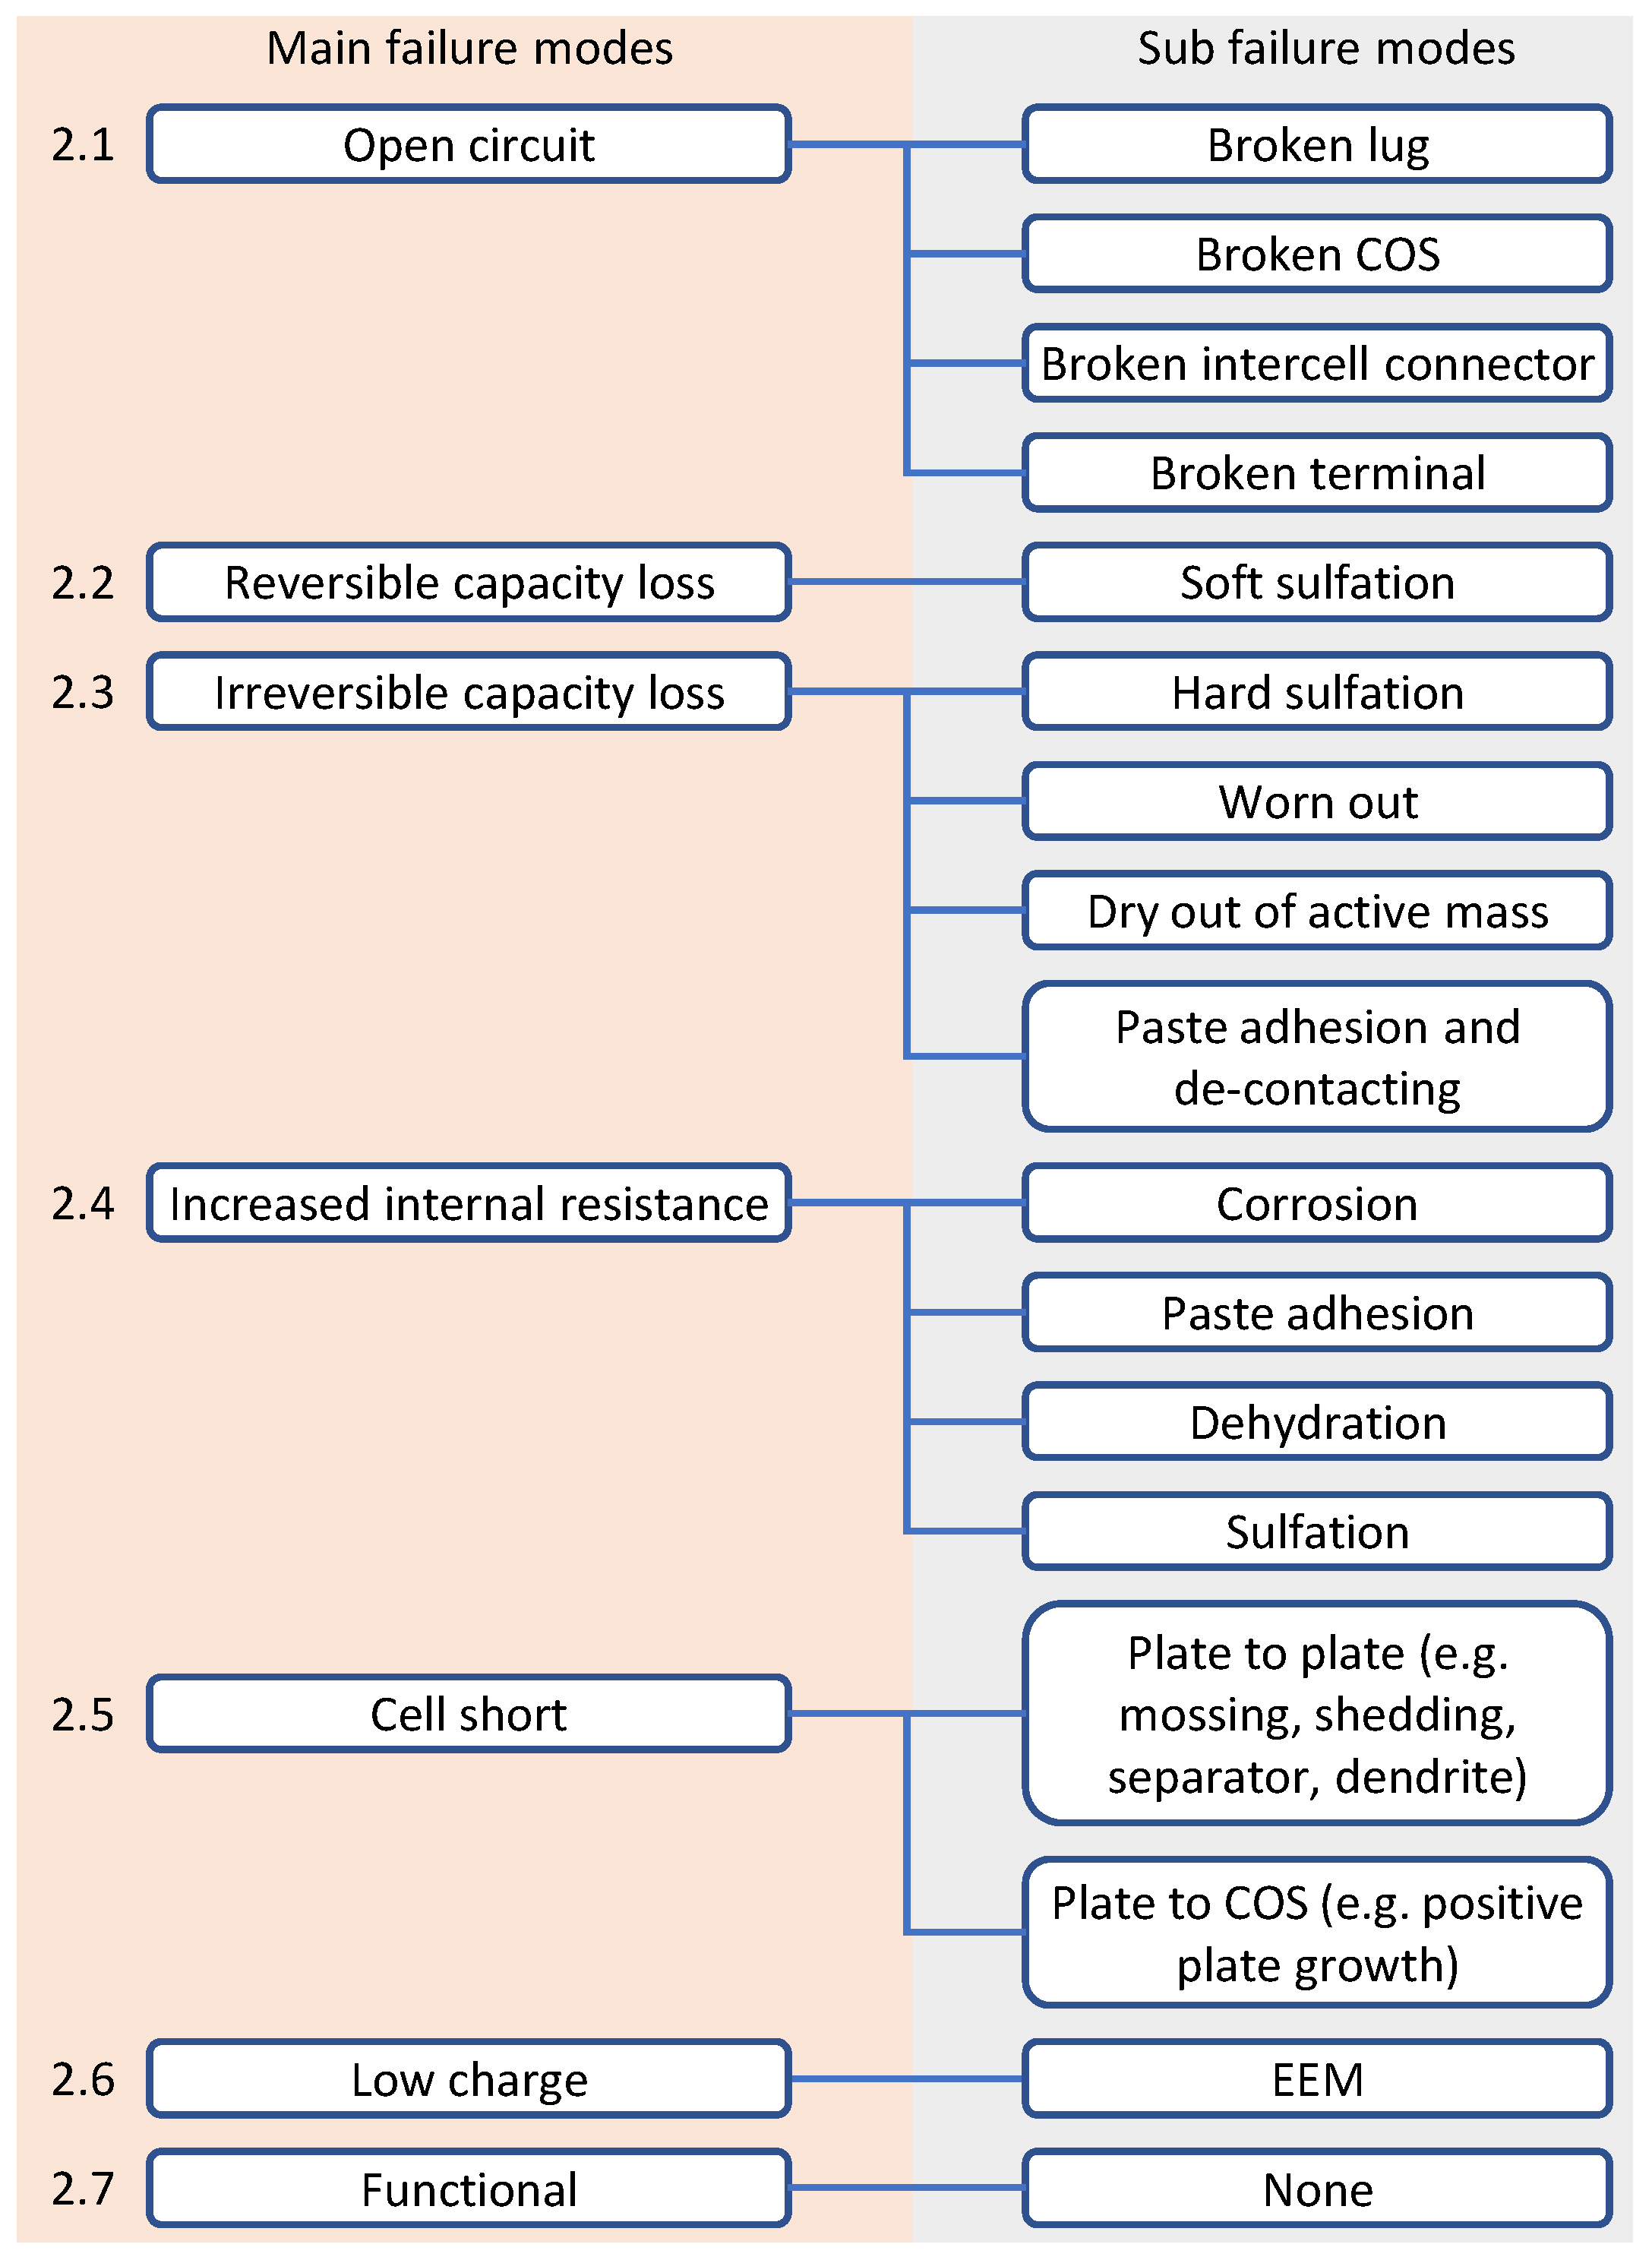
1] enabled various analysis possibilities for the tested batteries. The main objective was to identify the dominant failure reason that primarily lead to the failure of the batteries, which, in the preceding paper [
1], has been defined as the ‘main failure mode’ (further detail in
Figure 7). The ‘sub failure modes’ describe the root cause; it is also known as the aging mechanism that leads to the failure of the battery with regard to the applied load profile (cf.
Figure 7).
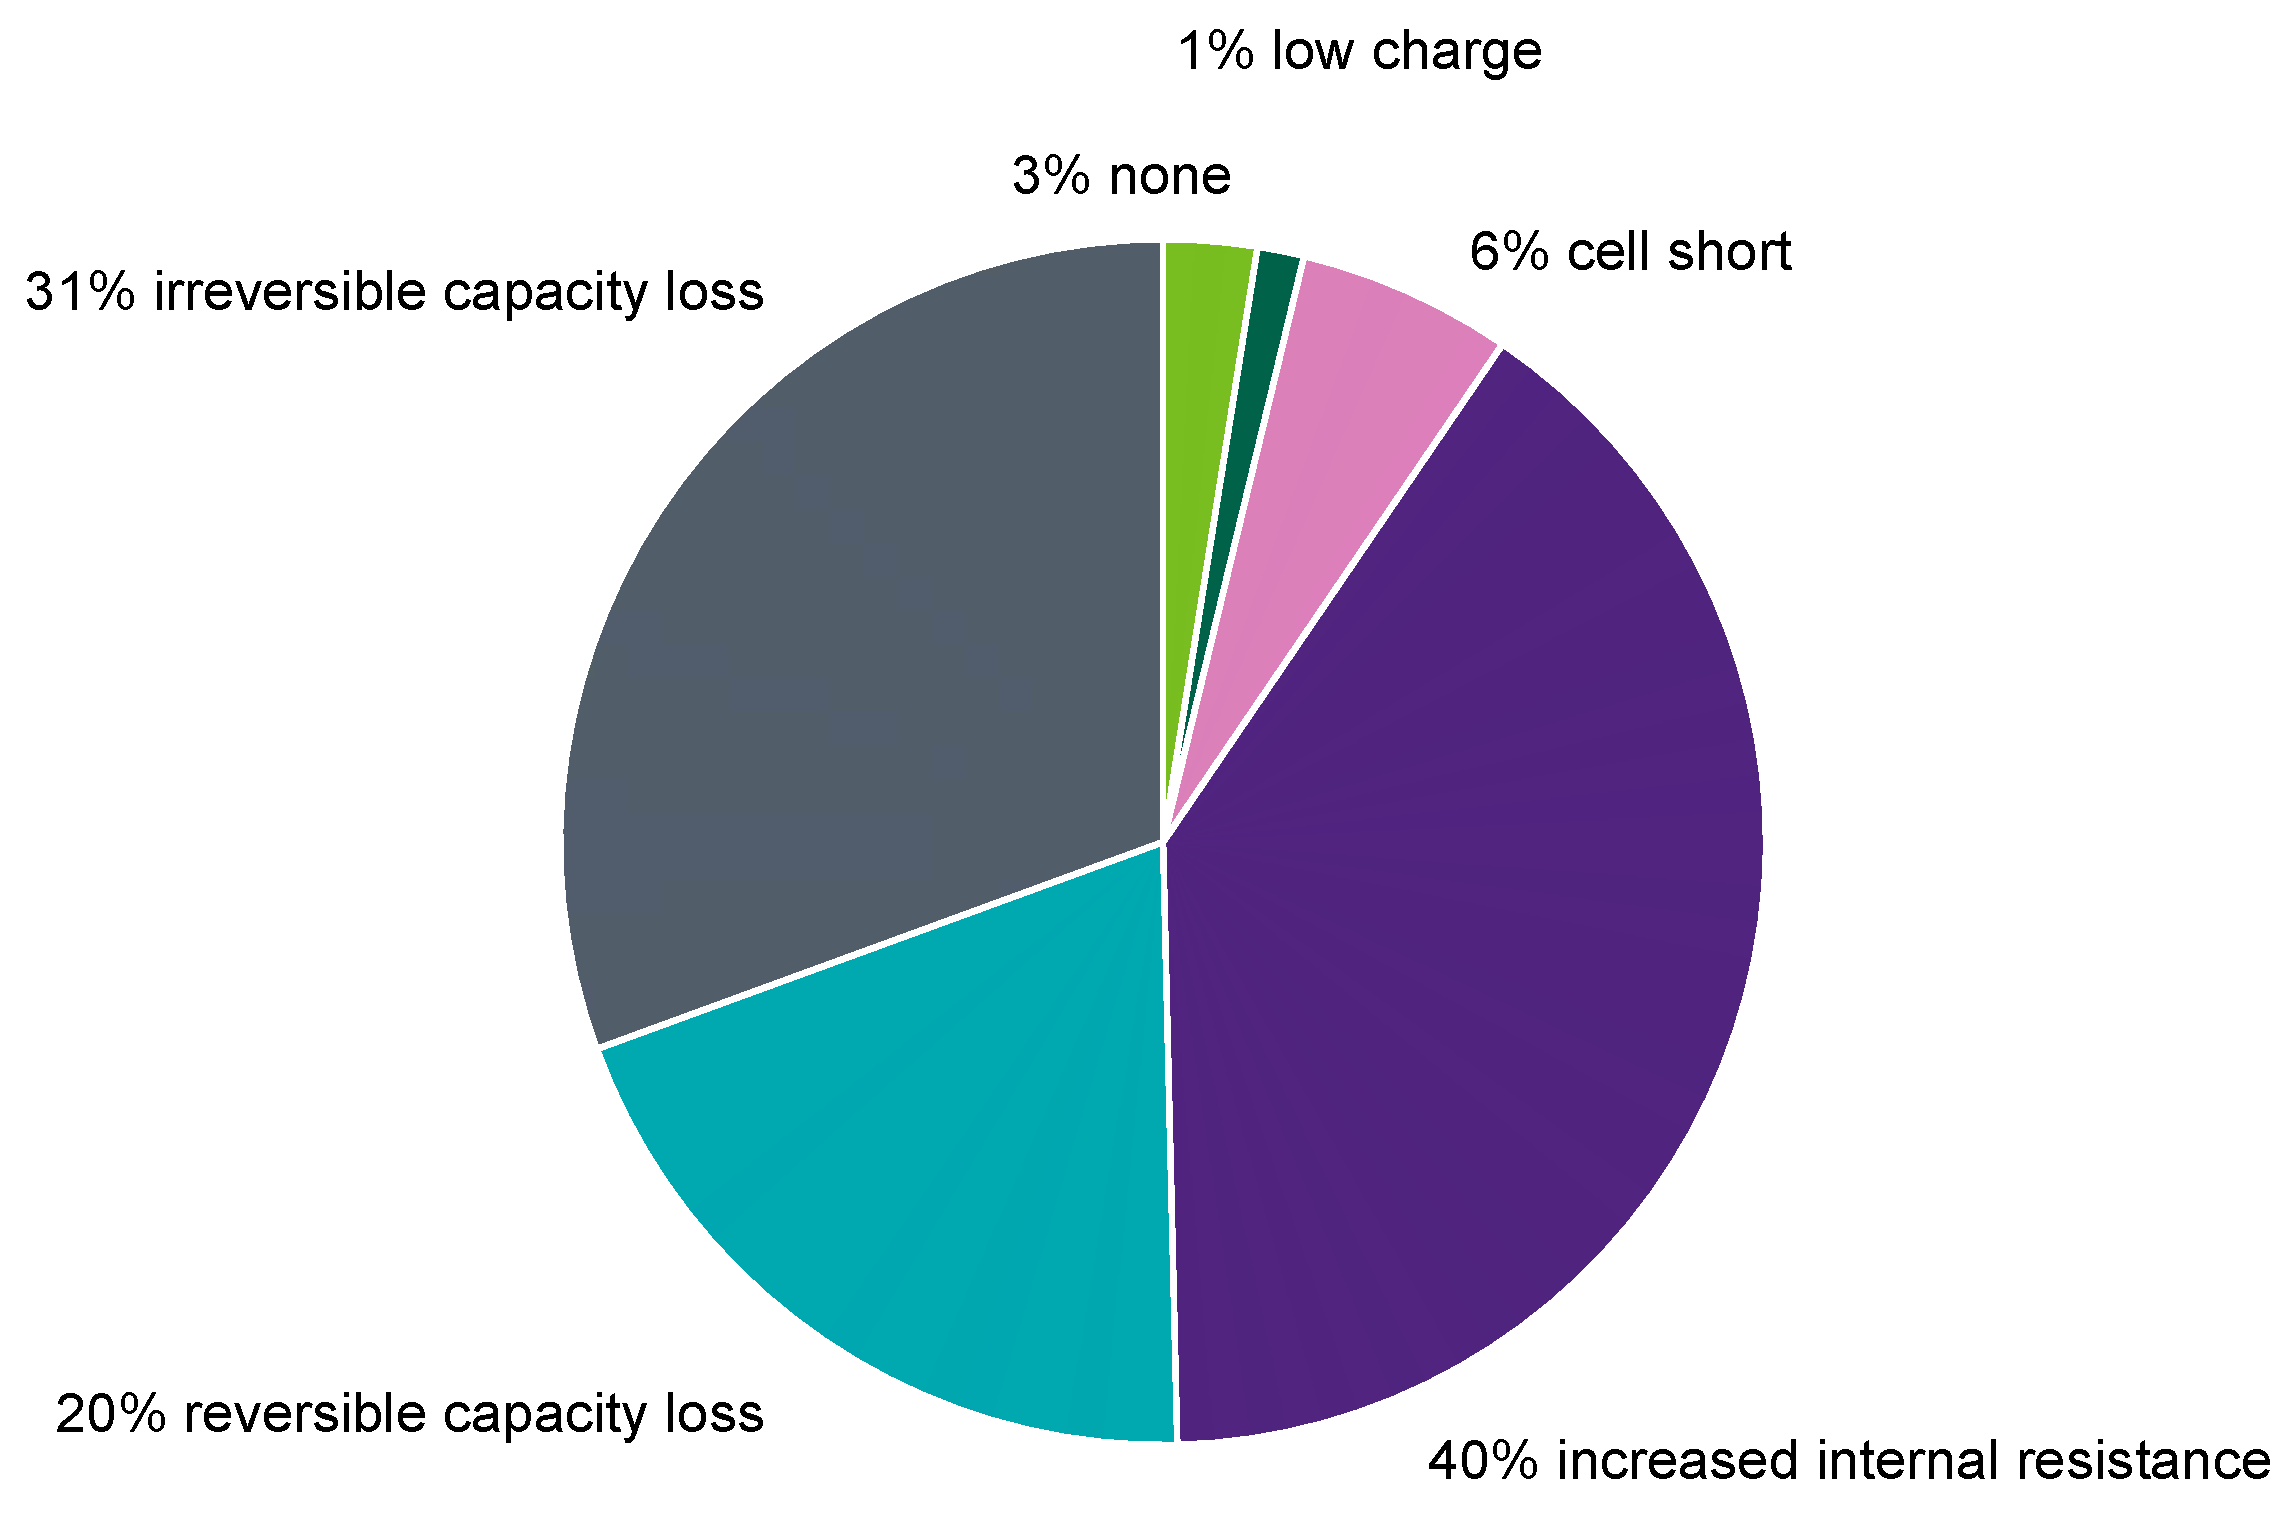
The occurrence in the field for the dominant failure reason is shown in
Figure 8.
The analysis revealed that the majority (51%) of batteries failed due to the non-availability of capacity: 31% failed because of strong irreversible capacity loss, and 20% failed because of reversible capacity loss (sulfation). Both aging mechanisms reduced the available capacity, but the reversible capacity could have been avoided by a proper energy management and charging strategy in the vehicle.
Figure 5 shows the available capacities of the batteries after removal from the car, as well as the recovered capacities after an intensive charge, as described in [
1].
Apart from capacity-related failures, increased internal resistance also largely contributed to the failure of batteries in the field with 40%.
The remaining parts were represented by cell shorts with 6%. According to [
1], cell shorts can occur due to plate-to-plate connections, e.g., dendrites, or by connections between a plate and cast-on-strap (COS), which result from the positive grid growth caused by corrosion.
Low charge represented 1%. Low charge means that the batteries were deep discharged but only after an operational charge. As this was performed in cars, these batteries were capable of managing all of the tested performance checks.
Lastly the tag of ‘none’ represented 3%. ‘None’ meant that the batteries did not reach any of the end-of-life criteria of the aging mechanisms and that they managed all of the performance checks properly.
3.4. Comparison to Previous Investigations
For other studies on batteries collected in Germany, comparable results can be found in Albers et al. [
22]. However, their sample consisted of AGM batteries only and were collected exclusively from car workshops. About 60% of their batteries showed the failure mode of ‘wear-out’, which is the expected aging mechanism when reaching the end of a life cycle. In another publication with the same data set, Albers et al. [
23] differentiated the failure mode ‘wear-out’ into ‘mass wear-out’ with about 48%, and ‘increase of internal resistance’ represented about 13%. The first failure mode refers to batteries with a decreased available capacity, which was observed in 51% of the batteries in the present study. The other parts of the batteries that had increased internal resistance were lower than the 40% observed in the present study. One main reason for this could be that the sample consisted of high-quality AGM batteries with typically low internal resistances that were mainly exchanged during service, whereas the present sample consists of all battery types and qualities, including batteries that were obtained by roadside assistance services (which are typically in a worse condition). Around 15% of the batteries showed no signs of deterioration, but this was explained by warranty reasons. Compared to the present study, there were far more batteries in the other study that were determined as without an identified failure reason. This could be due to the fact that there was no in-depth electrical examination and that the batteries were only visually examined. There may also be several aging mechanisms with only minor progress leading to performance problems, but these may not be clearly visible. A considerable proportion of 23% were found to be deeply discharged, and these were only indicated by their open-circuit voltage. In the present study, only 1% exhibited the comparable failure mode of low charge. These 1% of the batteries definitely could not perform the desired test criterion of ‘safe stop maneuver’ in a delivery state, but they were able to provide enough power after recharge and showed no other aging mechanisms.
The results observed by the BCI studies in 2020 [
24] and 2015 [
25] can be explained by different climatic conditions in the USA. Due to higher average temperatures, other aging mechanisms are more pronounced, e.g., cell shorts (‘shorted’) with 23% and 30%, respectively. It is likely that a significant number of cell shorts are as a consequence of severe corrosion that would have caused plate growth, as well as eventual contact between the plate and the COS. Corrosion, which had an additional contribution of about 31% in both studies, could be the underlying primary failure mechanism in these cases. Compared to the 40% increased internal resistance (predominantly due to corrosion) and 6% cell shorts observed in the present study, the BCI values were slightly higher, but this was probably due to the warmer climate.
To summarize, the present study shows results in the same order of magnitude as in previous studies, as well as provides an up-to-date sample of electrically examined field-aged batteries. The main difference with prior studies is most likely due to the following: all of the previous studies observed the aging mechanisms only visually by teardown analyses, but they did not take the actual performance of the battery into consideration as was performed in this study. However, this is the most important factor if the battery has to ensure a safe supply.
4. Discussion of the Results Regarding the Application
As outlined in
Section 1.1, the increasing electrification and automation of vehicles means that a performant battery in the powernet is essential. The presented sample can serve as a basis for electronic battery sensor validation. The knowledge of the different aging states and the measured electrical data provide a rich basis through which to test electronic battery sensors against all of the obtainable combinations of aging progression that can occur in the field.
Modern electronic battery sensors are able to determine various battery parameters. If the vehicle’s energy management system works sufficiently with the electronic battery sensor and the usage profile is normal, it may be possible to observe the battery’s aging condition. Irreversible capacity aging is a normal process, which is caused by cycling the battery, that occurs when using a car; therefore, the expected aging progress could be tracked by an ampere hour counter or more sophisticated with via a rainflow approach [
26]. Sulphation can also be prevented if the battery is used in its intended operating range with a sufficient charging strategy provided by the vehicle’s energy management system. The third failure reason, an increased internal resistance, was found to be mainly caused by corrosion. Severe corrosion can also lead to grid growth and could eventually cause a cell short. An increased internal resistance could be observed with high accuracy by modern electronic battery sensors so that these failure causes can be prevented as well, and this process could be performed with thresholds for the increase that would be implemented in the vehicle’s energy management system. However, cell shorts can also occur due to dendrite growth, which primarily grow in deep discharge states. With a rainflow counter approach and strict operating ranges with respect to the lowest acceptable state of charge being implemented in the vehicle’s energy management system, this failure cause might be preventable as well. Plug-in hybrid and battery electric vehicles (PHEV and BEV, respectively) may also allow for more flexibility in maintaining operating ranges by charging the 12 V battery from the high-voltage battery.
This means that, with state-of-the-art electronic battery sensors, the detection of the majority of these failure reasons would be possible. If the driver’s usage profile is not uncommon, a strict energy management in the car could use the parameters determined by the electronic battery sensor, and it could also limit the use of the battery with end-of-life criteria like a maximum acceptable internal resistance or charge throughput. A combination of high-quality lead batteries, modern electronic battery sensors and energy management can lead to high availability, as well as sufficient safety, so that the increasing importance of safety in current vehicle architectures could be considered.
5. Conclusions
This article presents the results that were obtained with the newly introduced non-invasive aging characterization method that was outlined in [
1]. With this method, it is possible to achieve a comprehensible sample; one that is statistically calculated by the Latin hypercube sampling method. Consequently, it gives an objective insight into the aging state of current lead batteries in the field. This information is important for various developments that are ongoing in the automotive industry.
This investigation reveals a majority of capacity-aged batteries in the field: on the one hand, there is irreversible capacity loss, which might take place mostly due to cyclic aging and occurs during normal use; on the other hand, there is reversible capacity loss, which covers the reversible process of sulfation and also limits the available capacity. The third prominent failure cause is increased internal resistance. In addition, in this sample, some cell shorts also occurred, albeit with a lower share.
A safe supply in the low-voltage power supply system requires a reliability analysis of all the components involved. With respect to the lowest level of the safety concept, but as one part of the power supply besides the alternator or DCDC converter, it is important to know the failure rate of the battery. Consequently, a comprehensibly determined sample of batteries, like the one presented in this study, is necessary.
This sample can be used as a basis for reliability analysis, as outlined in [
27]. With the sample obtained in this investigation, a valuable step forward toward current demands can be reached compared to previous investigations, like those performed by BCI [
24,
25] and others [
22,
28]. Compared to these investigations, the presented sample covers all seasonal effects with up-to-date batteries from the field. The comprehensible, non-invasive aging characterization prevents subjective influences from interfering in the judging of the aging processes. Thus, every battery in the sample was treated equally with predefined end-of-life criteria.
Moreover, the electrical data collected can be used to test the abovementioned state-of-the-art electronic battery sensors with field-aged batteries so as to cover all aging combinations and further improve the algorithms. Both the sample itself and the electrical data contribute to improve the safety when using lead batteries in the low-voltage powernet.

 ,
, 


