Article

Brominated Porous Nitrogen-Doped Carbon Materials for Sodium-Ion Storage

by
Yuliya V. Fedoseeva
1,*,
Elena V. Shlyakhova
1,
Svetlana G. Stolyarova
1,
Anna A. Vorfolomeeva
1,
Mariya A. Grebenkina
1,
Anna A. Makarova
2,
Yuriy V. Shubin
1,
Alexander V. Okotrub
1 and
Lyubov G. Bulusheva
1,*
1
Nikolaev Institute of Inorganic Chemistry SB RAS, 3 Acad. Lavrentiev Ave., 630090 Novosibirsk, Russia
2
Physical Chemistry, Institute of Chemistry and Biochemistry, Free University of Berlin, 14195 Berlin, Germany
*
Authors to whom correspondence should be addressed.
Batteries 2022, 8(9), 114; https://doi.org/10.3390/batteries8090114
Submission received: 30 July 2022 / Revised: 22 August 2022 / Accepted: 1 September 2022 / Published: 5 September 2022
(This article belongs to the Special Issue High-Performance Sodium-Ion Batteries)

Abstract

:
Chemical modification improves the performance of the carbon anode in sodium-ion batteries (SIBs). In this work, porous nitrogen-doped carbon (PNC) was obtained by removing template nanoparticles from the thermal decomposition products of calcium glutarate and acetonitrile vapor. The treatment of PNC with a KOH melt led to the etching of the carbon shells at the nitrogen sites, which caused the replacement of some nitrogen species by hydroxyl groups and the opening of pores. The attached hydroxyl groups interacted with Br2 molecules, resulting in a higher bromine content in the brominated pre-activated sample (5 at%) than in the brominated PNC (3 at%). Tests of the obtained materials in SIBs showed that KOH activation has little effect on the specific capacity of PNC, while bromination significantly improves the performance. The largest gain was achieved for brominated KOH-activated PNC, which was able to deliver 234 and 151 mAh g−1 at 0.05 and 1 A g−1, respectively, and demonstrated stable long-term operation at 0.25 and 0.5 A g−1. The improvement was related to the separation of graphitic layers due to Br2 intercalation and polarization of the carbon surface by covalently attached functional groups. Our results suggest a new two-stage modification strategy to improve the storage and high-rate capability of carbon materials in SIBs.

1. Introduction

Lithium-ion batteries (LIBs) are the most widely used electrochemical energy storage systems due to their high reversible capacity and excellent rate stability [1,2]. However, limited lithium resources hinder the widespread use of LIBs, in particular for electric vehicles. Sodium-ion batteries (SIBs) are currently being extensively investigated as an alternative to LIBs because sodium is cheap and abundant in nature [3,4,5,6]. The development of suitable anode materials that provide high Na-storage capacity, fast ion diffusion, and long cycling capability is crucial for the practical application of SIBs.
Graphite, used as an anode material in industrial LIBs, is unsuitable for SIBs due to the poor intercalation of both bare and solvated Na+ ions into the interlayer space [7,8,9]. However, disordered carbon materials have high reversible capacity and outstanding cycling performance for SIBs. For example, for hard and soft carbon and expanded graphite, the maximum reversible Na capacity of about 300 mAh g−1 has been achieved [10,11,12]; this value is similar to the theoretical lithium capacity of 372 mAh g−1 for graphite [13]. Vacancy defects and large interlayer distances can enhance the intercalation of Na+ ions into the interlayer space of graphitic materials [14,15]. However, the main contribution to the storage capacity is made by the surface adsorption of Na+ at defects and edges [16].
Among various carbon materials, highly porous non-graphitized carbons (for example, hard and soft carbon) proved to be the most promising for SIBs [17,18]. Sodium ions and solvated sodium ions can be adsorbed on an ideal graphitic surface via cation-π interactions [19], while randomly oriented and short-range ordered graphitic domains, micro and nanovoids, pores, and defects provide more diverse adsorption sites and facilitate the diffusion of ions [20]. The meso- and macroporous structures facilitate the rapid transport of Na+ ions at a high rate, and the micropores provide a large surface area for the adsorption.
The sodium storage capacity of carbon materials can be improved by doping with heteroatoms and surface functionalization. For example, nitrogen-doped carbon materials show improved electrochemical performance in SIBs as compared to undoped materials since edge nitrogen atoms increase defectiveness, porosity, and reduce the volumetric expansion of carbon, while substitutional nitrogen atoms enhance the electrical conductivity of carbon by adding valence electrons [21,22,23]. An effective approach for obtaining porous nitrogen-doped carbon (PNC) with a high content of mesopores and a large specific surface area is the deposition of acetonitrile vapor on the template nanoparticles formed during the pyrolysis of calcium salts [24,25].
However, little attention has been paid to modifying carbon samples with halogens for use in SIBs. The strong covalent bonds between carbon and halogen atoms, the polarization of these bonds, and the high reactivity of halogens to alkali metals make halogenation an attractive approach for the functionalization of carbon anodes. Kong et al. showed that fluorine-doped hard carbon obtained by mild fluorination with F2 at 100 °C provides an increased specific capacity (100 mAh g−1 at 50 mA g−1) as compared to the original carbon [26]. The authors attributed this improvement to the expanded interlayer distance, which facilitates Na+ intercalation, and to the presence of semi-ionic C–F bonds, which guarantee the electrical conductivity of the electrode. Hong et al. reported that an increase in the fluorine content in fluorocarbon produced by carbonization of polyvinylidene fluoride causes growth of the specific capacity for both LIBs and SIBs [27]. This result was explained by the high electronegativity of fluorine, which creates new electrochemically active sites. The bromination of carbon nanohorns increased their gravimetric capacity by ~20 mAh g−1 due to the reversible adsorption of Na+ ions near C–Br groups and intercalated bromine molecules [28]. In addition, electron transfer between graphite and intercalated Br2 molecules can increase the conductivity of the material [29].
Herein, we report the effect of the functionalization of PNC with bromine on its electrochemical performance in SIBs. Bromination was carried out with Br2 vapor at room temperature, and to increase the degree of functionalization, PNC was preliminarily activated with potassium hydroxide at 750 °C [30,31]. It was expected that such pre-activation would increase the porosity of the sample and shorten the diffusion length of Na+ ions, and the subsequent bromination would create additional sites for the adsorption of Na+ ions and the polarization of the surface to facilitate ion transport and electrolyte penetration into the bulk of the material.

2. Results and Discussion

Figure 1a illustrates the synthesis of the materials. The PNC was prepared by the template-assisted chemical vapor deposition (CVD) method using acetonitrile and calcium glutarate at 750 °C. Scanning electron microscopy (SEM) and transmission electron microscopy (TEM) showed that the PNC material has a sponge-like structure (Figure 1b,c). Hollow extended carbon nanoparticles consist of thin shells less than 10 nm in size. The activation of PNC was carried out using KOH at 750 °C in an argon atmosphere (Figure 1a). The resulting sample is referred to as aPNC. The KOH treatment can increase the number of defects and oxygen-containing functional groups on the surface of carbon materials [31,32] and open internal pores. Indeed, the N2 adsorption/desorption measurements showed an increase in specific surface area from 384 m2 g−1 for PNC to 1201 m2 g−1 for aPNC. According to the literature data, this increase is due to the formation of micropores [33,34]. PNC and a-PNC were brominated with saturated Br2 vapor at room temperature (Figure 1a). The activation and bromination procedures did not cause visible changes in the spongy PNC morphology (Figure S1).
The XRD patterns of the samples showed two broad peaks at 2θ equal to 24° and 43° (Figure 2a). These peaks correspond to diffraction from the (002) and (100, 101) graphitic-like planes, respectively [35]. The interlayer distance in PNC and aPNC, determined from the position of the (002) peak, is about 0.37 nm, and the weak intensity of the peak indicates a low order of layers along the crystallographic c-axis. The intensity of the (002) peak increases for brominated samples. The improvement in the ordering of the layers is provided by their partial defunctionalization under the action of gaseous Br2. This is supported by Raman and Fourier transform infrared (FTIR) spectroscopy data, which are discussed below. The shift of the (002) peak towards smaller 2θ angles, which is especially noticeable for the Br-aPNC sample, indicates the expansion of the layers due to Br2 intercalation.
The Raman spectra of all the studied materials contained a G band at 1589 cm−1 and a D band at 1351 cm−1 (Figure 2b), which are the attributed to stretching vibrations of C=C bonds and disorder in sp2-carbon, respectively [36]. The ratio of the relative intensities of these bands (ID/IG) usually characterizes the degree of graphitization of porous carbon. The KOH activation of PNC slightly increases the ID/IG ratio from 0.89 to 0.92 due to the oxidation of carbon shells. The spectra of Br-PNC and Br-aPNC show lower ID/IG values of 0.84 and 0.85 compared to those for the starting materials. This fact may be associated with the removal of amorphous carbon from PNC and some functional groups from a-PNC. The Br-aPNC spectrum has a peak at 244 cm−1, which corresponds to Br–Br stretching vibrations in Br2 [28,37,38,39]. This peak is very weak in the Raman spectrum of Br-PNC (inset in Figure 2b), which is due to the low concentration of Br2 molecules in this sample, as we show below.
FTIR spectroscopy was used to detect functional groups presented in the samples (Figure 2c). The spectra contain the bands at 3432 cm−1, 3247 cm−1, 2856–2971 cm−1, 1721 cm−1, 1452 cm−1, and 1050–1128 cm−1 from the stretching vibrations of the O–H bonds, N–H bonds, CHx groups, C=O, C–N, and C–O bonds, respectively [40,41,42,43]. The vibrations of the aromatic C=C and C=N bonds in the basal plane, the bending of O–H in the carboxyl groups, and C–H in the CHx groups appear at 1627 cm−1, 1401 cm−1, and 720 cm−1, respectively. A comparison of the FTIR spectra indicates an increase in the amount of hydrogenated carbon and hydroxyl groups in the activated sample aPNC and a decrease in the amount of C–O and CHx groups after the bromination of aPNC.
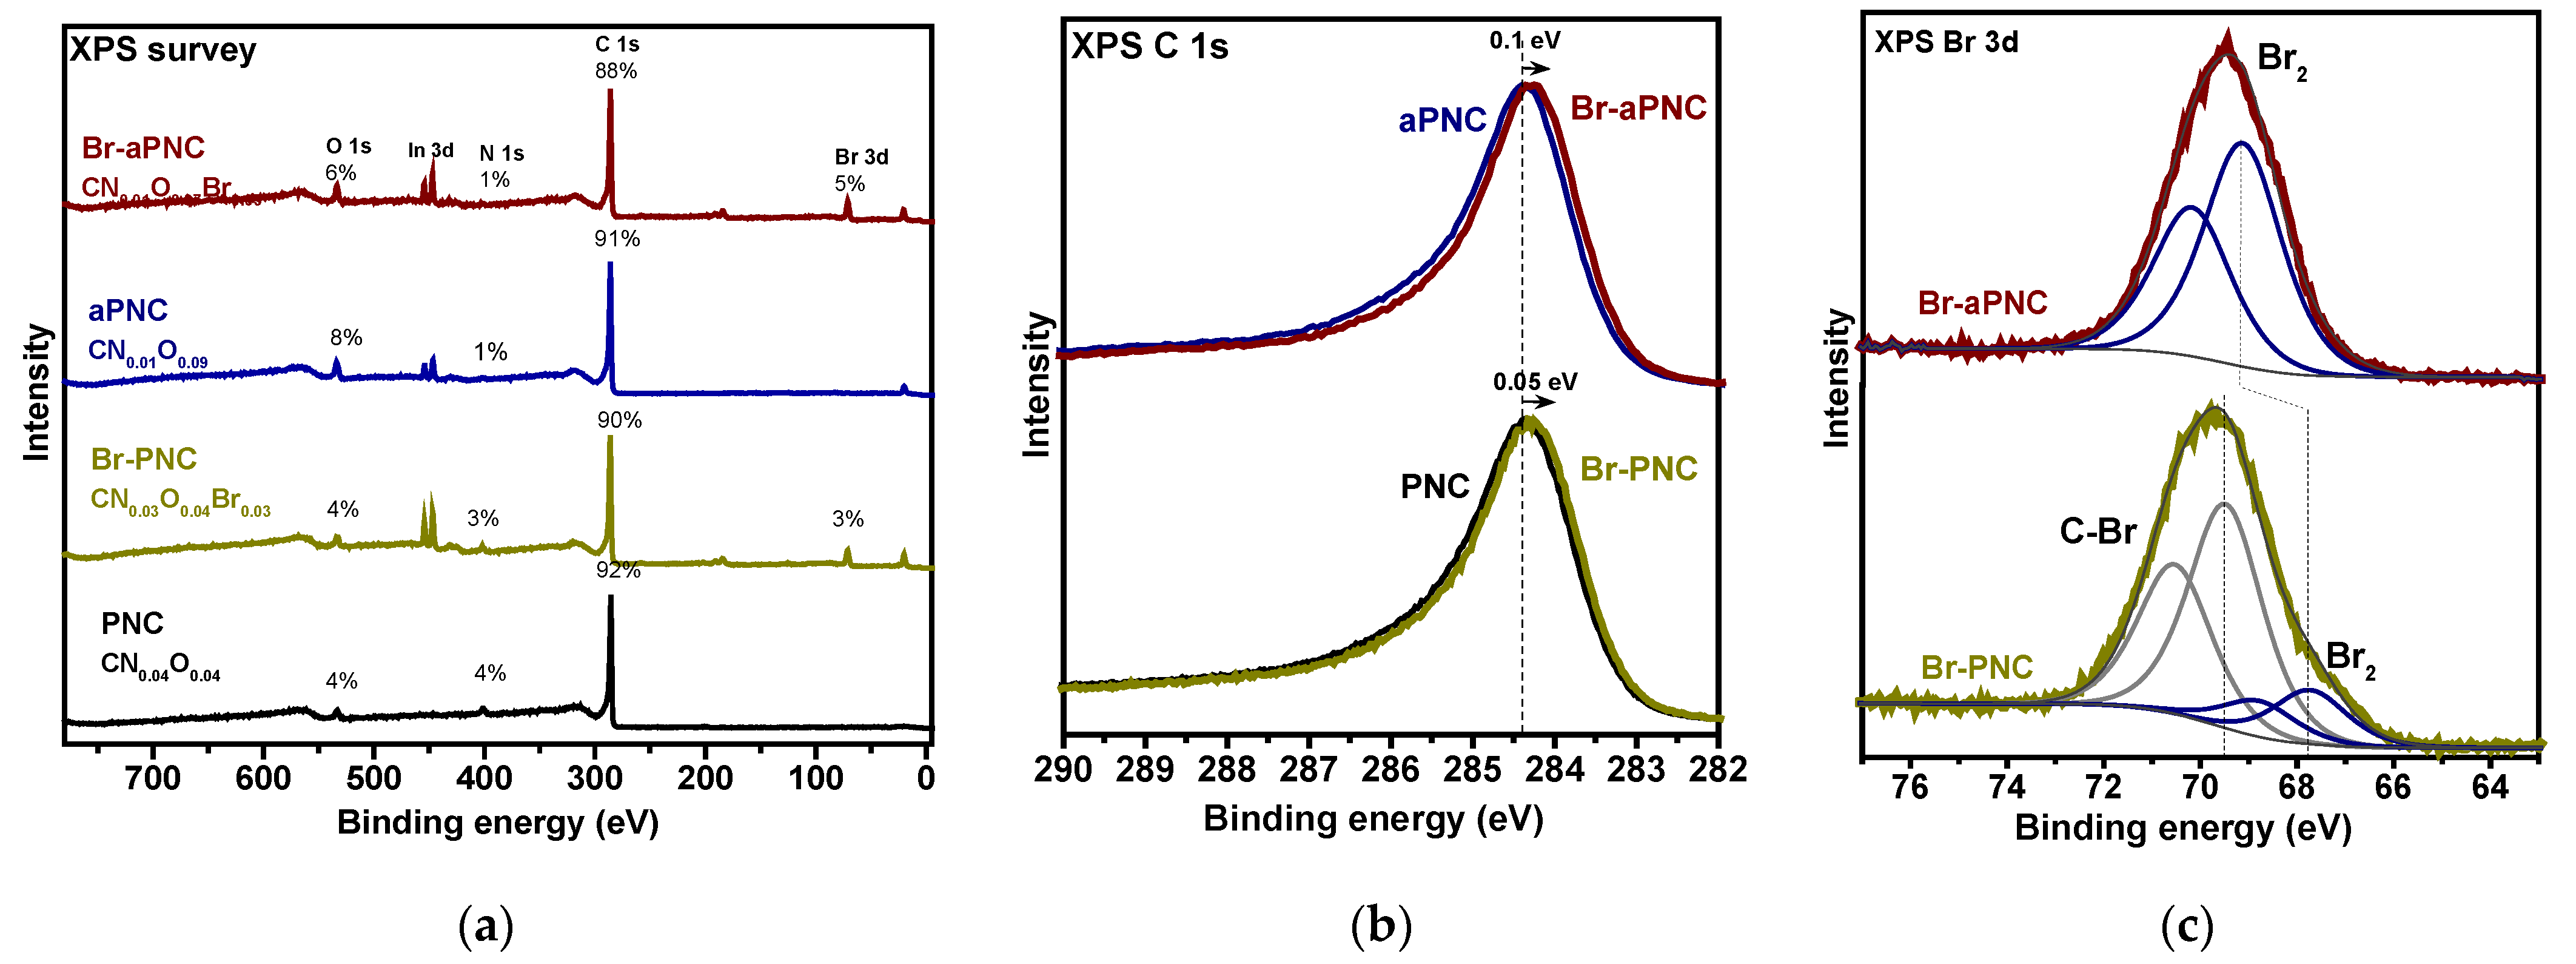
The surface composition and the chemical state of the elements were examined using X-ray photoelectron spectroscopy (XPS). The survey XPS spectra of the samples (Figure 3a) show the presence of carbon, nitrogen, and oxygen in all samples and bromine in the brominated samples. The In 3d line comes from the indium metal substrate. After PNC activation, the nitrogen content decreases from 4 to 1 at%, but the oxygen content increases from 4 to 8 at% (aPNC sample). The bromination of PNC and aPNC does not cause significant changes in the concentration of nitrogen but reduces the oxygen content to 6 at% in Br-aPNC. Samples Br-PNC and Br-aPNC contain 3 and 5 at% of bromine, respectively. The energy-dispersive X-ray spectroscopy elemental mapping shows a uniform distribution of nitrogen and bromine in the Br-aPNC sample (Figure S2).
The only asymmetric peak centered at 284.4 eV represents the C 1s lines of the PNC and aPNC samples (Figure 3b). Defect states and carbon bound to nitrogen, oxygen, bromine, and hydrogen affect the asymmetric tail of the C 1s line in the region of 285–289 eV [44], and their contribution to the spectral profile cannot be unambiguously identified. A downshift of the C 1s line by ~0.05 for Br-PNC and ~0.1 eV for Br-aPNC compared to the spectra of PNC and aPNC is due to the phenomenon of electron exchange between carbon matrices and bromine molecules, and it was observed early for brominated carbon nanotubes [38] and nanohorns [28].
The Br 3d line of the Br-PNC sample contains two doublets with the 3d5/2 component located at binding energies of 67.8 and 69.5 eV (Figure 3c). The low-energy doublet can be assigned to negatively charged Br2 or Br3 species as well as bromine in the form of physically adsorbed BrH [39,45]. The next intense doublet is associated with covalent C–Br bonds. The Br 3d5/2 binding energy in such bonds can vary from 70 to 70.5 eV [37,46,47]. The Br 3d spectrum of the Br-aPNC sample exhibits one doublet with the 3d5/2 component at 69.1 eV (Figure 3c). Since the Raman spectrum of Br-aPNC has an intense peak from Br2 molecules, and the XPS C 1s line shows the largest shift caused by electron density transfer between carbon and Br2, the observed Br 3d doublet belongs to Br2 rather than to other bromine forms. Br2 acts as an electron acceptor during the formation of carbon–Br2 complex species, and its Br 3d binding energy strongly depends on the chemical environment. The Br 3d5/2 binding energy of Br2 on carbon surfaces is in the range of 68.4–68.9 eV (67.4 eV for the complexes of Br2 with carbon black [45], 68.4–68.9 eV for plasma brominated highly oriented pyrolytic graphite [46], and 68.5 eV for Br2 molecules adsorbed on the surface of double-walled carbon nanotubes (DWCNTs)) [37]. A downshift of the Br 3d line by ∼0.8 eV to 69.0 eV was observed for Br2 molecules located near hydroxyl groups at the edges of pre-sonicated DWCNTs. Density functional theory calculations revealed that, due to the electron-withdrawing ability, the edge hydroxyl groups are attractive for Br2 adsorption [37]. The present study confirms this conclusion. The aPNC sample enriched in vacancy defects and hydroxyl-terminated edges (Figure 2c) incorporates more Br2 molecules and forms fewer C–Br bonds than the PNC sample.
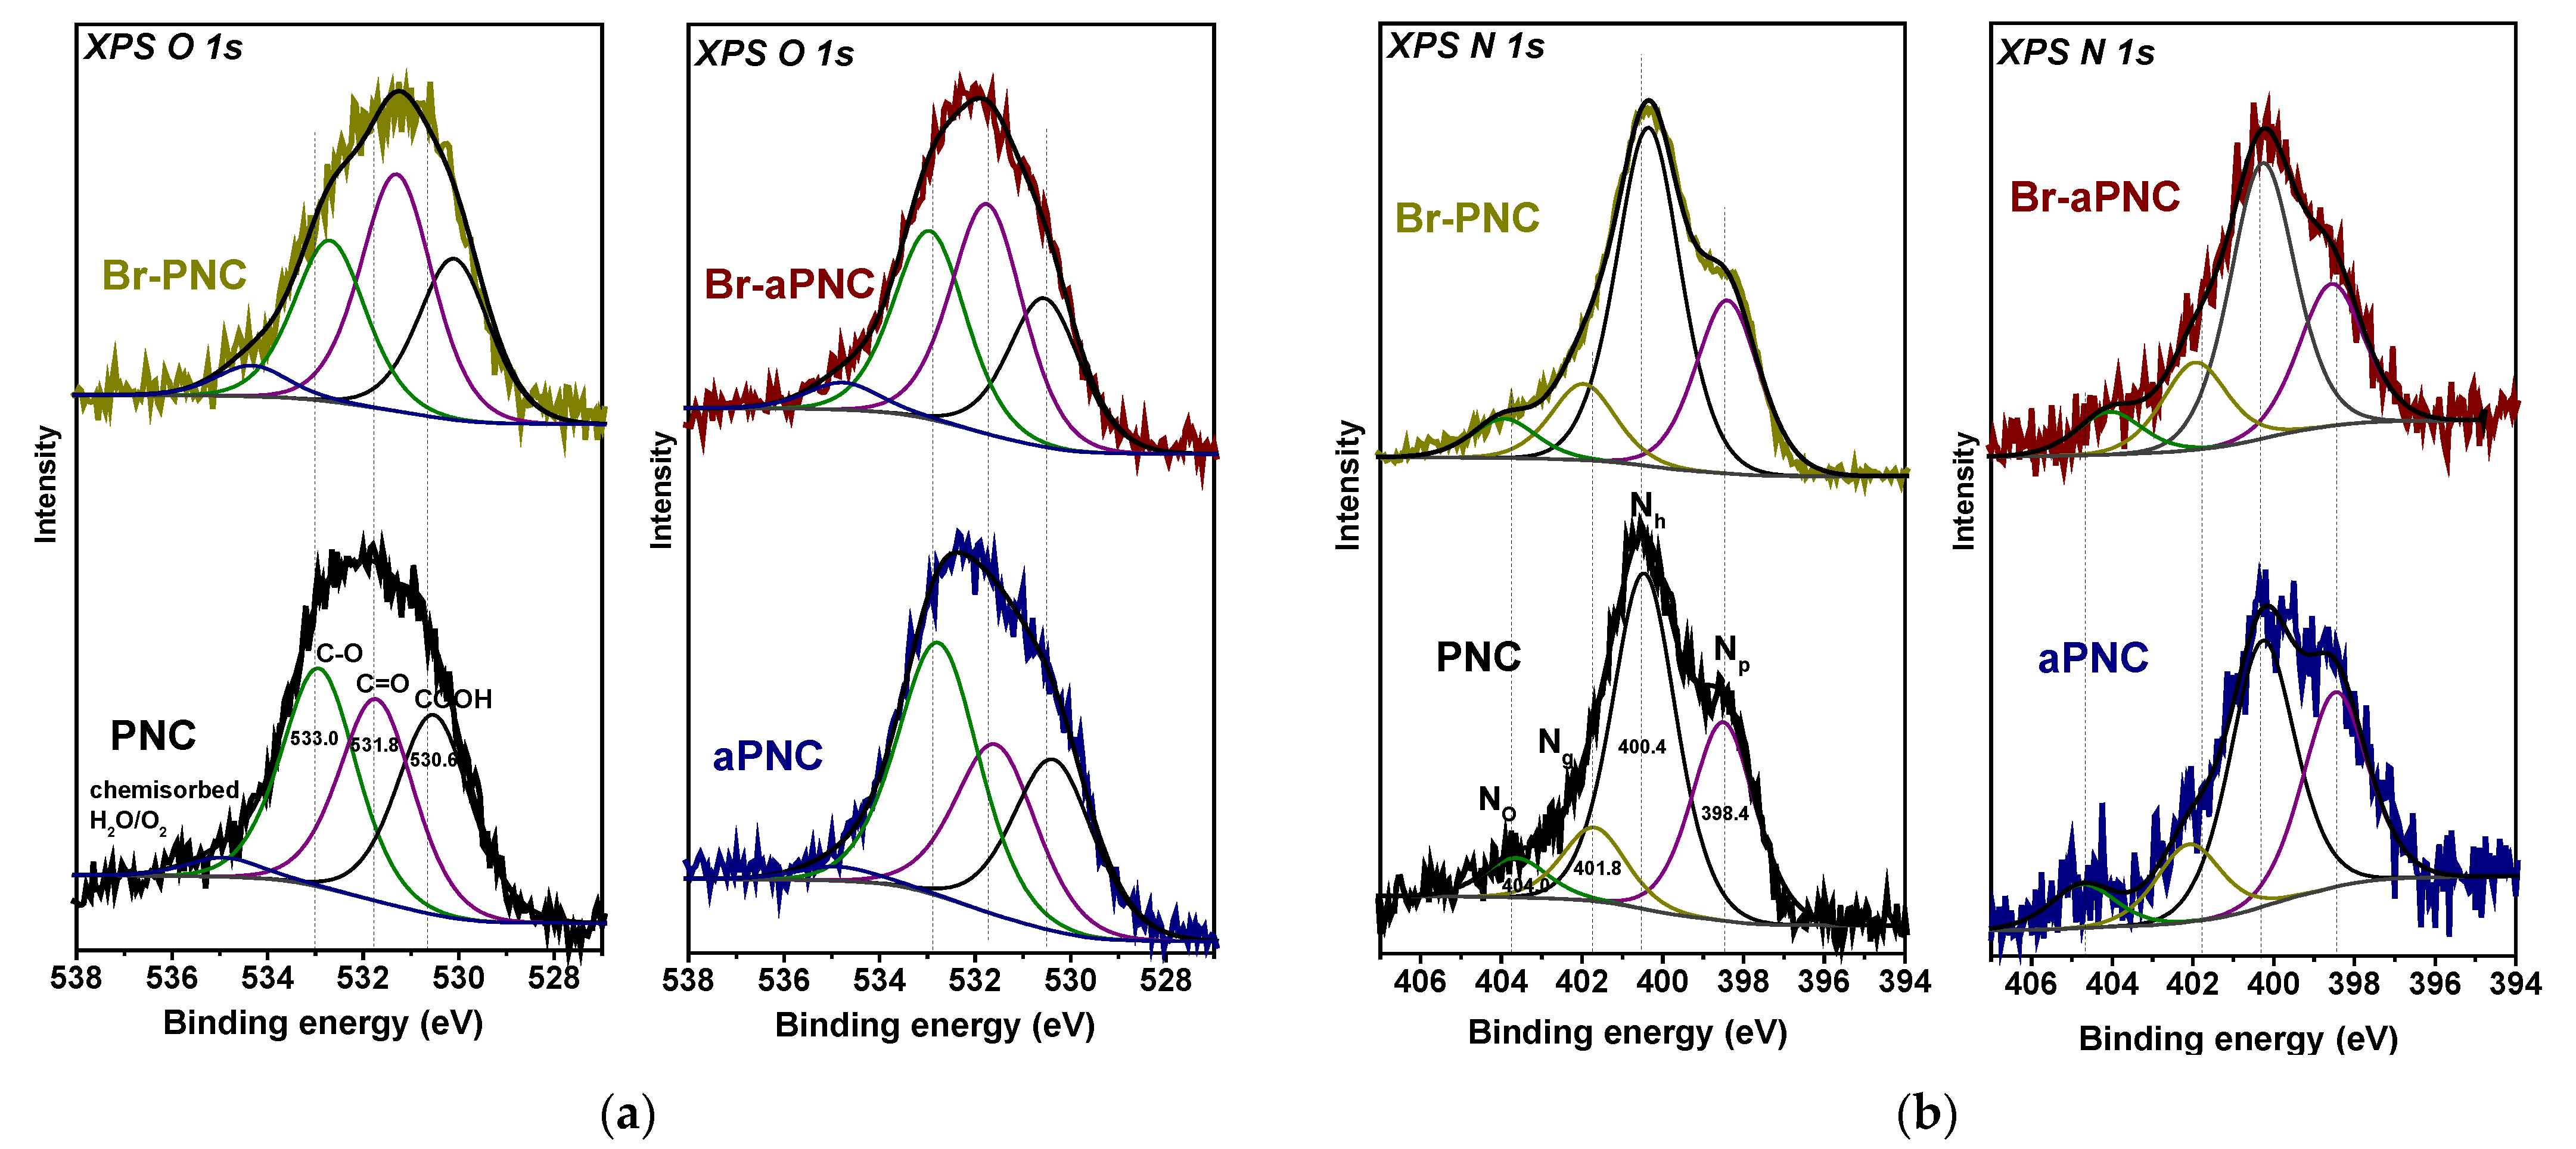
The evolution of the states of oxygen and nitrogen is traced along the O 1s and N 1s lines (Figure 4). The O 1s lines are fitted by four components corresponding to oxygen double-bonded to carbon in the carboxyl groups (COOH at 530.6 eV), in carbonyls and lactones (C=O at 531.8 eV), oxygen single-bonded to carbon in aromatic rings or in phenols and ethers (C–O at 533.0 eV), and chemisorbed H2O/O2 (weak component at 535 eV) (Figure 4a). The first three components have almost the same intensity in the PNC spectrum, while the relative intensity of the C–O component increases in the aPNC spectrum. This indicates the enrichment of the aPNC sample with hydroxyl groups in accordance with the results of the FTIR spectroscopy. A similar conclusion about the presence of the hydroxyl groups after the activation of carbon materials with KOH was made in [30,48]. Bromination leads to a decrease in the fraction of hydroxyl groups in Br-PNC and carbonyl and carboxyl groups in Br-aPNC. This may be due to the reaction of Br2 with –OH groups to form HBrO or HBr.
The N 1s lines of the samples contain four components with binding energies of 398.4, 400.4, 401.8, and 404.0 eV (Figure 4b) from two-coordinated pyridinic nitrogen Np, hydrogenated nitrogen Nh, substitutional graphitic nitrogen Ng and oxygenated nitrogen No in the ratio of 5:9:2:1 [25]. The first three forms of nitrogen can interact with sodium. According to a previous study, alkali metals prefer to be attached to pyridinic or hydrogenated pyridinic nitrogen, which are located at the edges of atomic vacancies and graphene planes [49]. However, graphitic nitrogen has an additional π-electron, which increases the number of electron carriers and the polarization of the carbon surface, positively affecting the adsorption of alkali metals [50]. Thus, the presence of nitrogen in porous carbon should have a positive effect on both bromination and sodium adsorption in an electrochemical cell. After PNC activation, the total surface concentration of nitrogen decreases by a factor of four, mainly due to the removal of pyridinic and hydrogenated nitrogen. The ratio Np:Nh:Ng:No becomes 4:6:2:1 in a-PNC. Bromination leads to a decrease in the Np to Nh ratio from 0.6 to 0.5 for Br-PNC and from 0.7 to 0.5 for Br-aPNC.
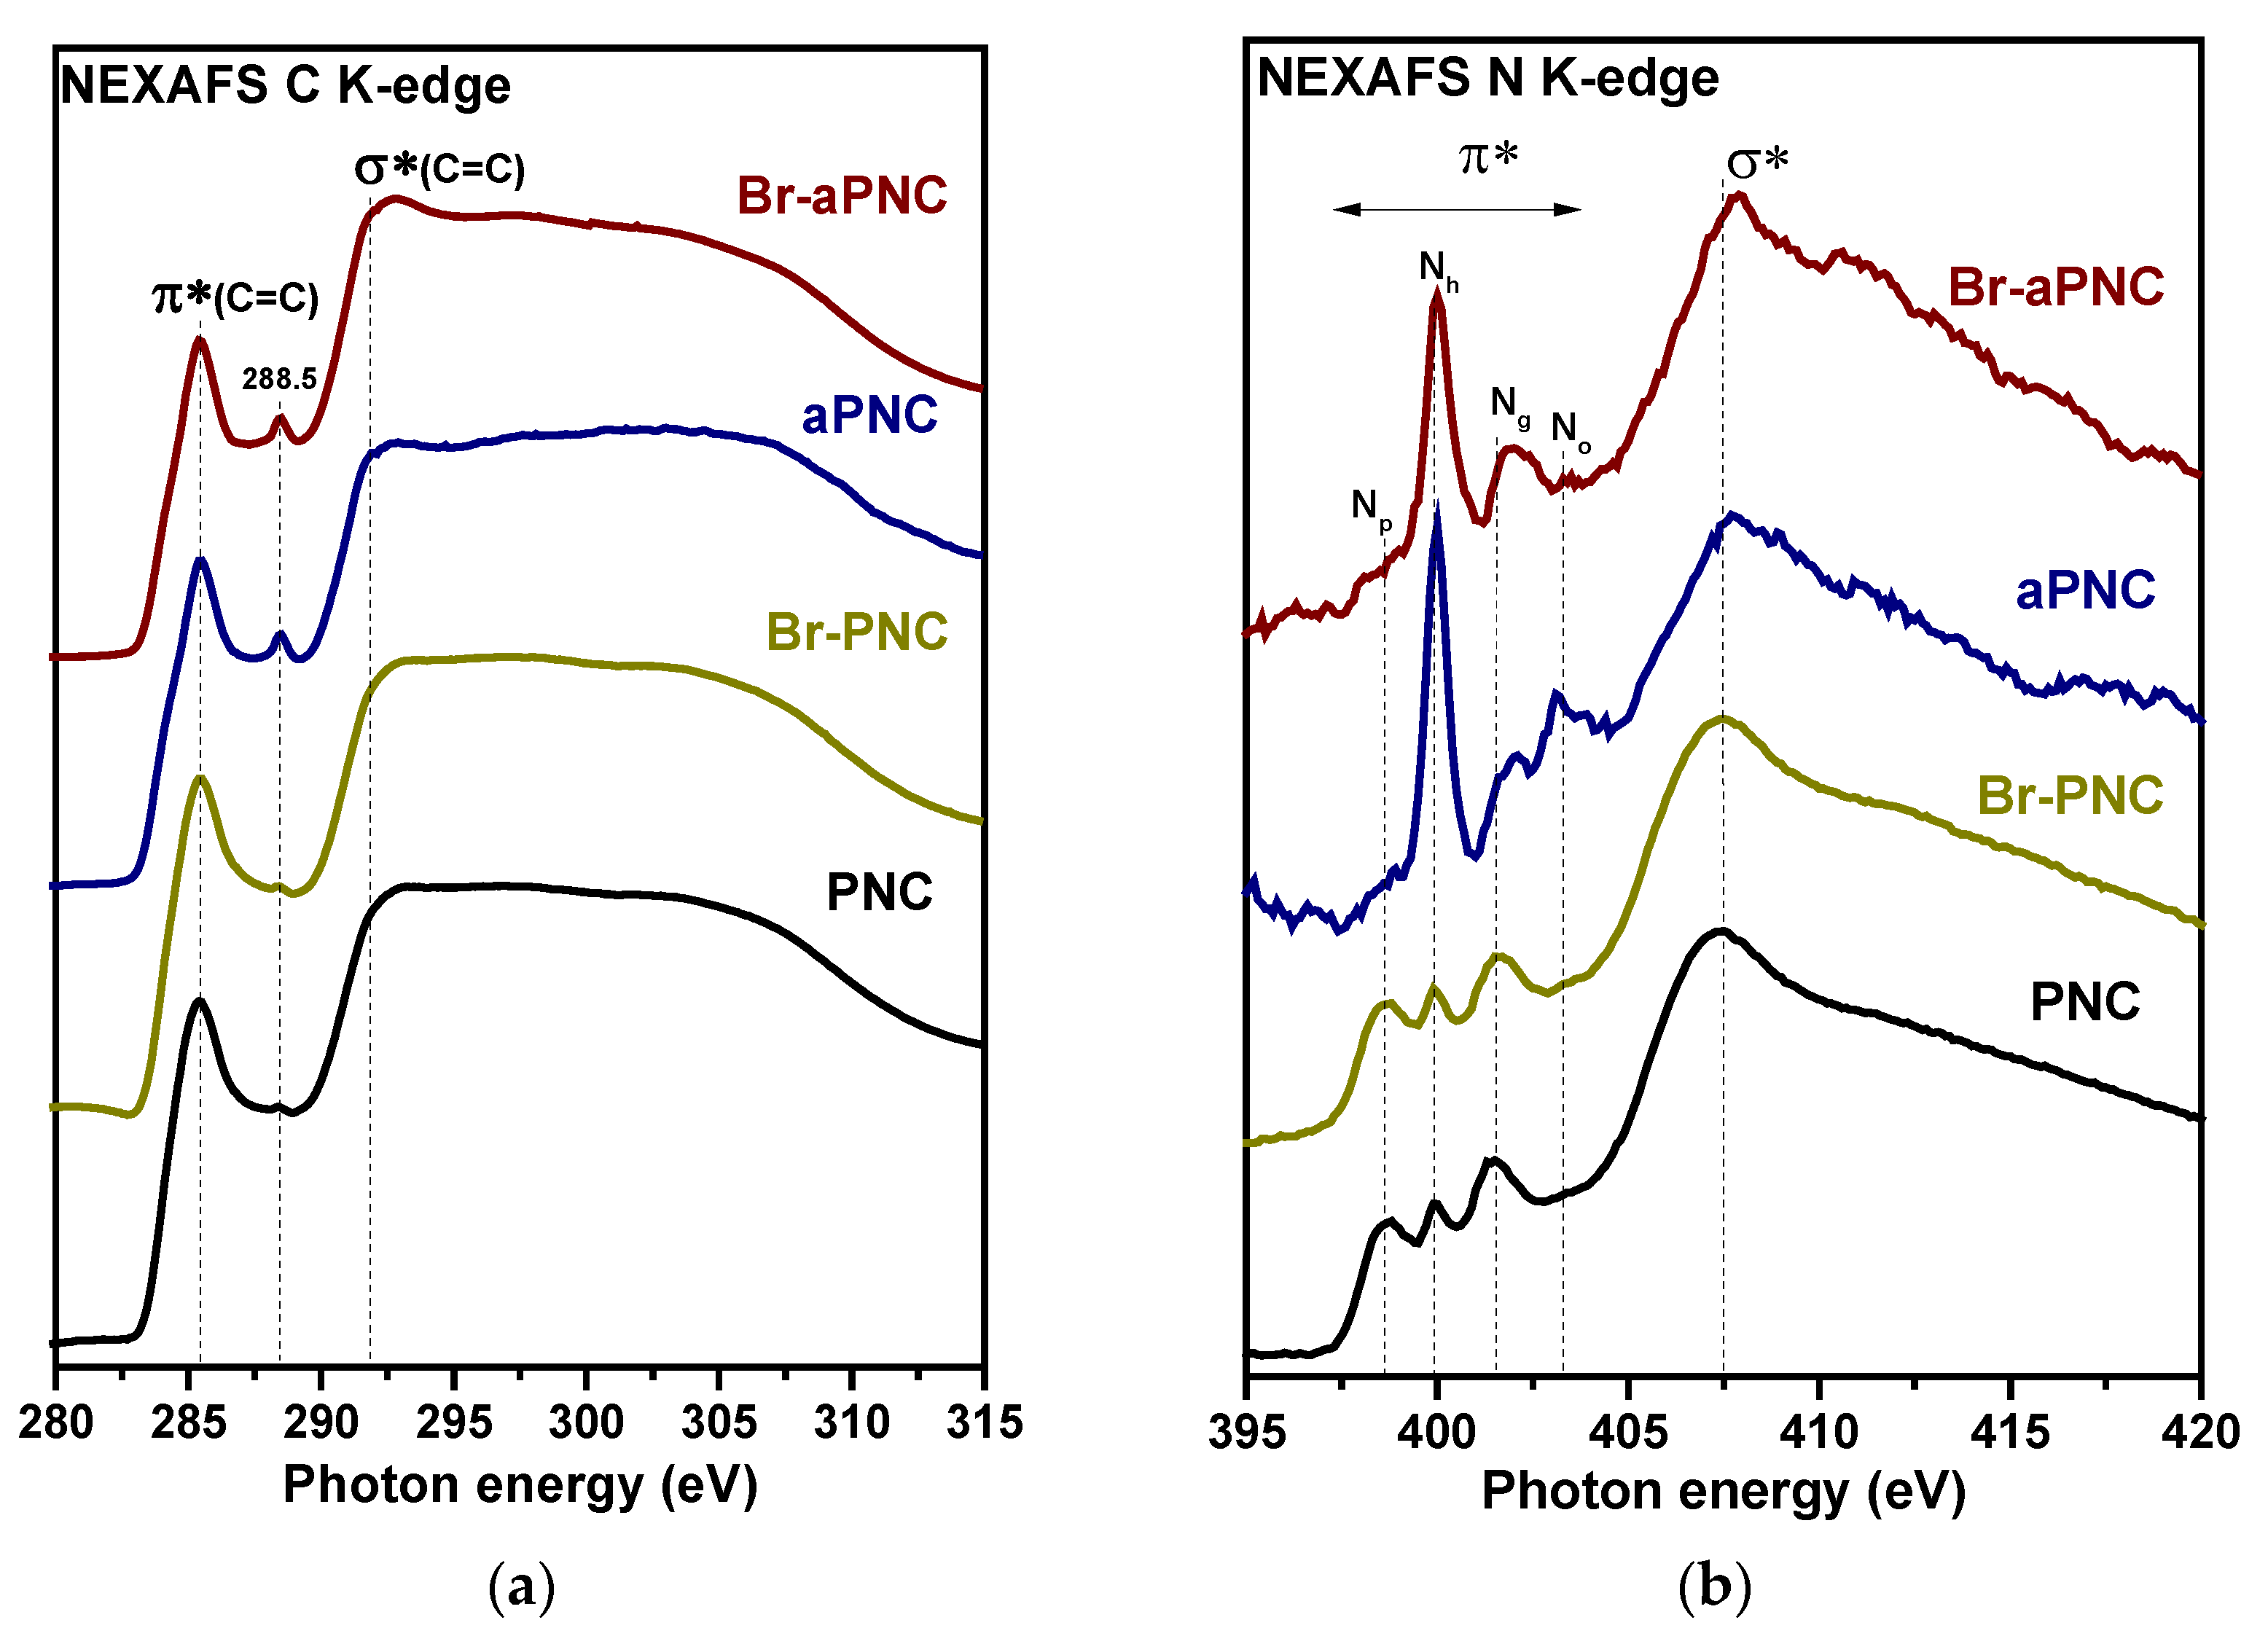
The NEXAFS C K-spectra of the samples demonstrate a sharp π*-resonance at 285.4 eV and a broad σ*-resonance at 292.0 eV due to electron transitions from C 1s levels to π and σ unoccupied C=C states (Figure 5a). The shape of the spectra is characteristic of graphitic-like disordered carbon. The peak at about 288.5 eV in the aPNC spectrum corresponds to the bonding of carbon with oxygen or hydrogen [51]. The spectra of the brominated samples do not show significant changes in shape as compared to the spectra of the starting samples. This indicates that the C–Br groups are located at the edges of graphitic domains without breaking the π (C=C) bonds. The NEXAFS N K-spectra of the samples have a set of π*-resonances (Figure 5b) corresponding to the Np (398.5 eV), Nh (399.9 eV), Ng (401.9 eV), and No (403.3 eV) states and a wide σ* resonance around 407.6 eV [25,40,52]. The Nh and No resonances are sharper in the aPNC spectrum as compared to the PNC spectrum, which is associated with the interaction of nitrogen present in PNC with KOH. Bromination has little effect on the chemical state of nitrogen, except for a slight decrease in portions of hydrogenated and oxidized states. It can be concluded that bromination does not affect the chemical state of nitrogen in the sample volume, which is important if it is necessary to maintain the composition during material modification.
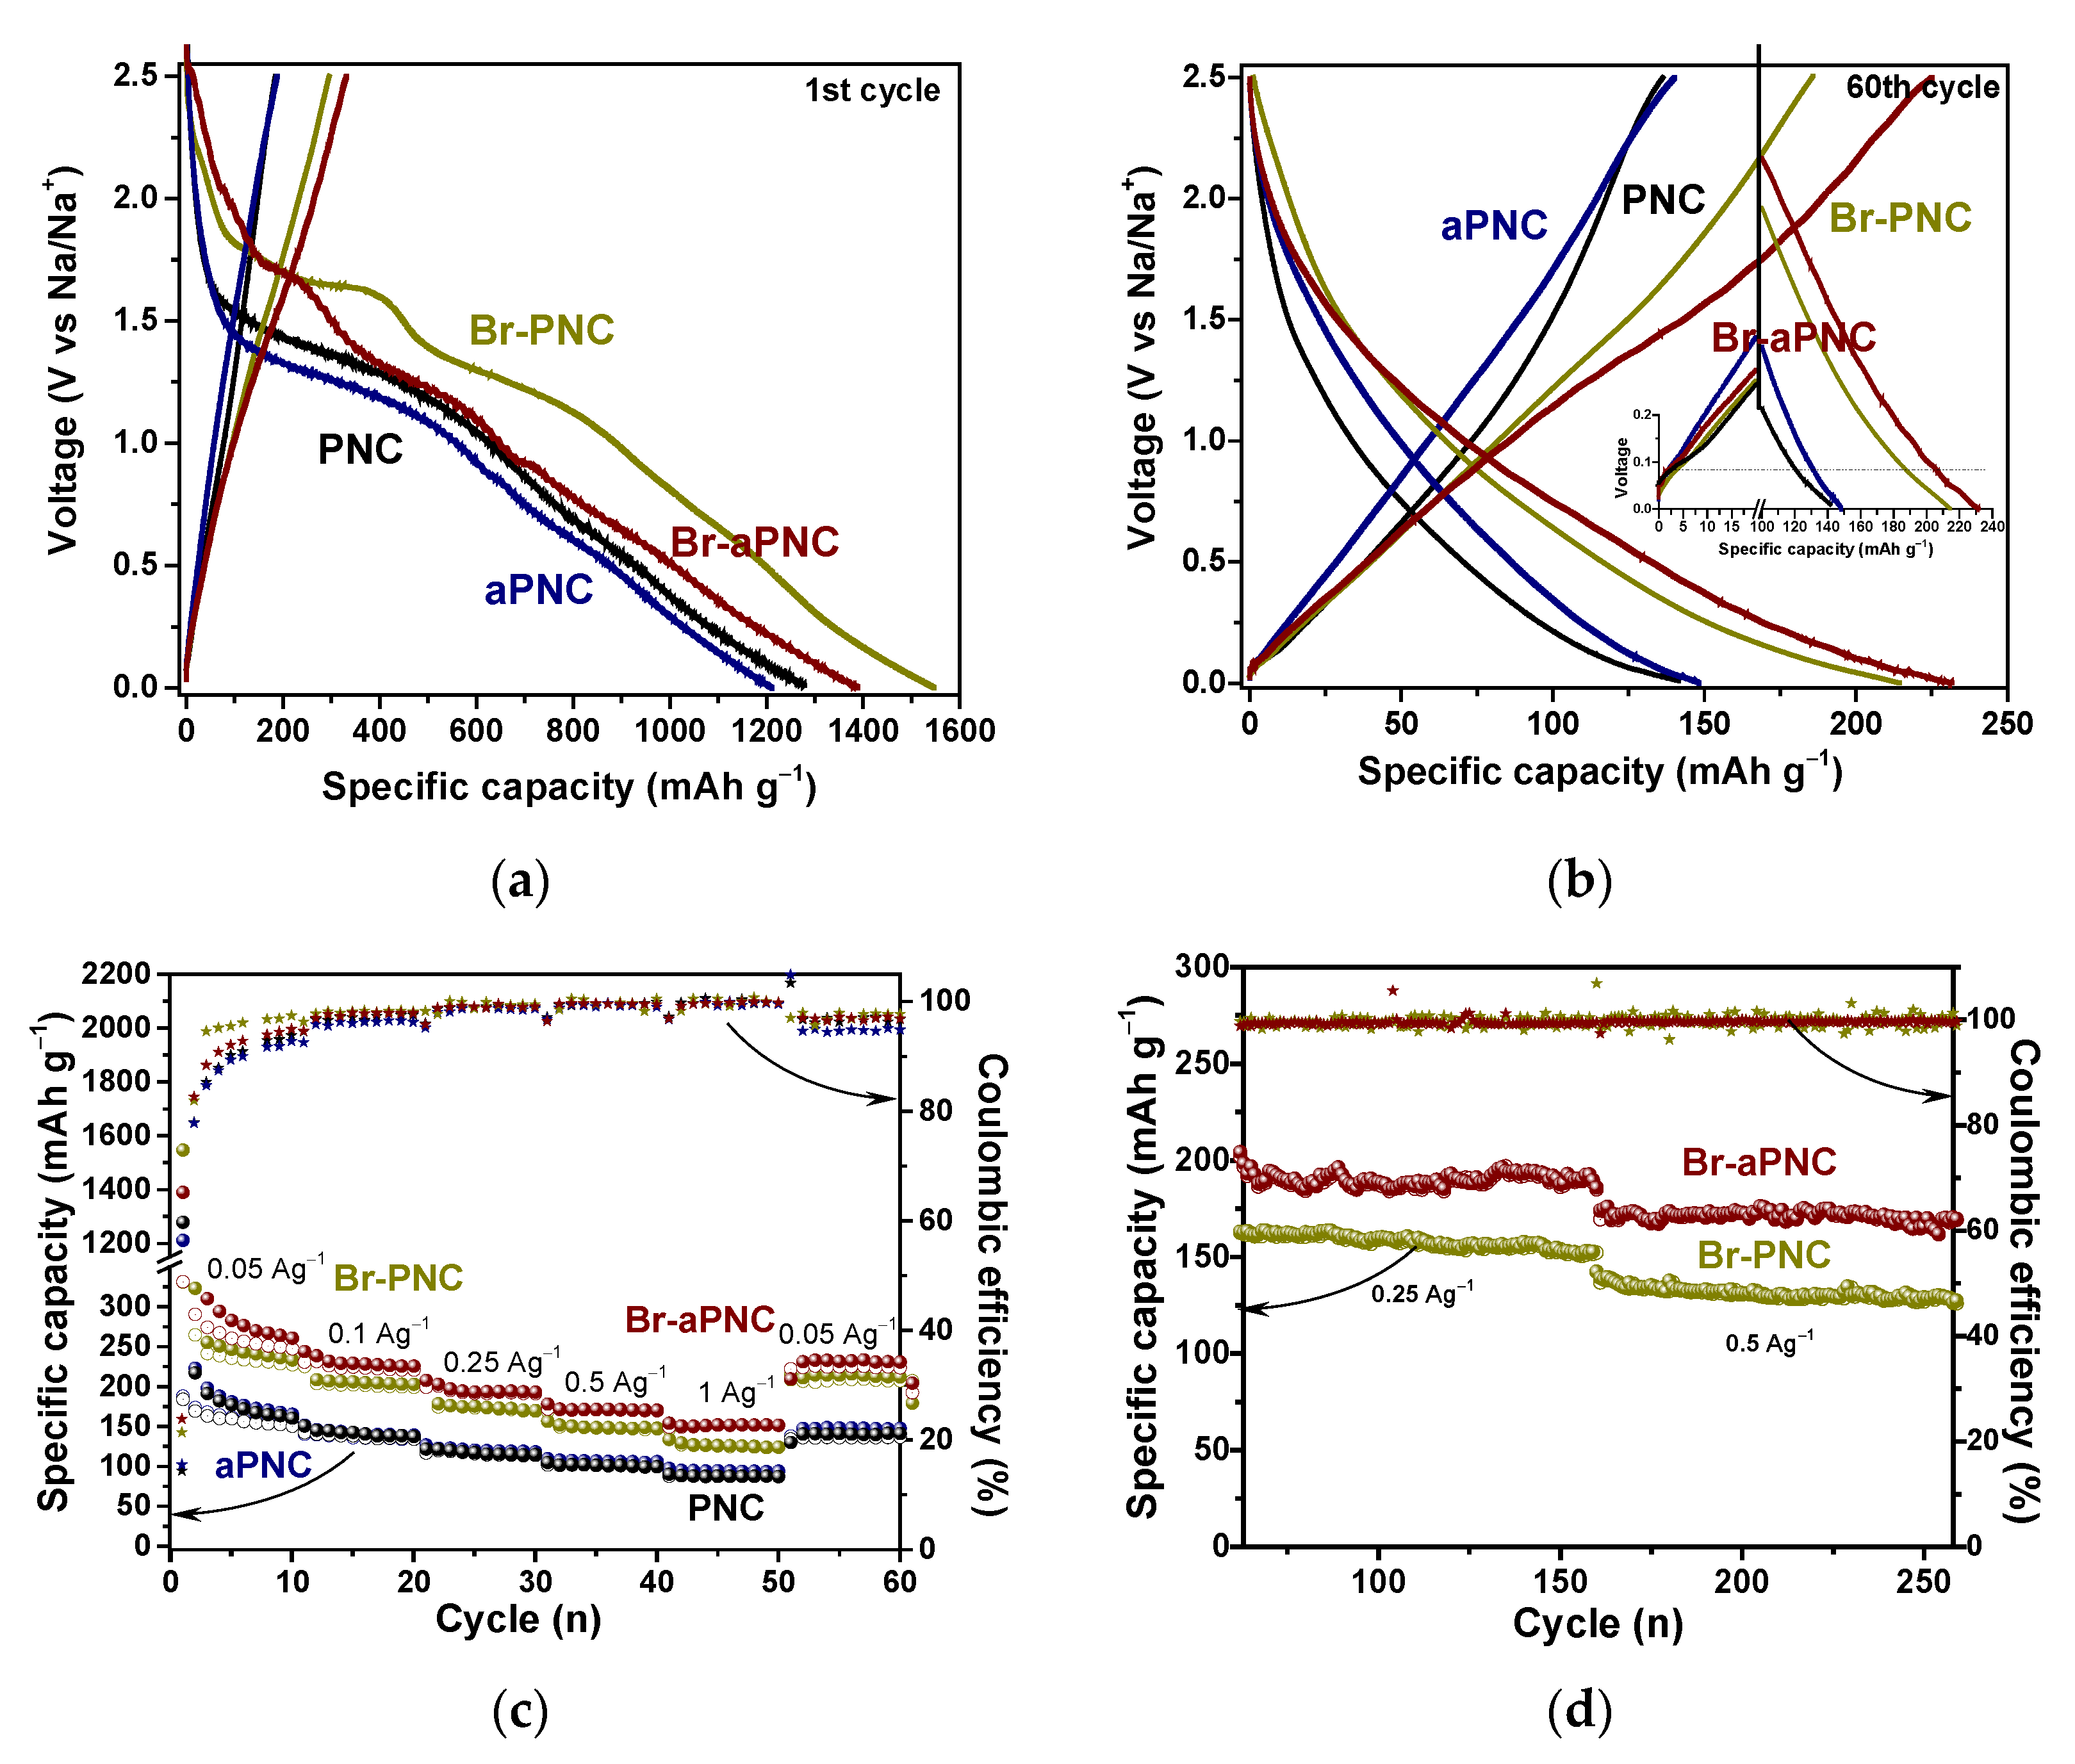
Figure 6 shows the results of the galvanostatic cycling of the carbon electrodes in SIBs. Upon the first insertion of Na+ ions at a current density of 0.05 A g−1, the discharge curves of PNC and aPNC show two plateaus at ~1.4 and ~0.6 V (Figure 6a), which are associated with the formation of a solid electrolyte interphase (SEI) layer on the carbon surface. The plateau at 1.7 V, which is clearly seen only in the first discharge curves of brominated samples, may be due to the irreversible reaction of sodium with bromine-containing functional groups. A similar effect was found for carbon nanomaterials chemically modified with bromine-, sulphur-, and oxygen-containing groups [28,53,54], and it can be assumed that both organic and inorganic reaction products coexist in the SEI layers [55]. The capacity loss in the first discharge-charge cycle is 85% for PNC, 84% for aPNC, 81% for Br-PNC, and 76% for Br-aPNC, and the corresponding initial Coulombic efficiency (ICE) is 14, 15, 21, and 24%, respectively. ICE is highly dependent on many factors, such as the surface composition and texture of the carbon electrode material, the composition of the electrolyte, and the rate in the first discharge cycle. The low ICE values in our case may be due to the large surface area of carbon electrodes and the presence of functional groups leading to the formation of side products and an extended SEI layer in the initial cycle. Assembling a full cell with cathode material can compensate for the low ICE of the anode material.
The discharge–charge curves measured at 0.05 A g−1 in the 60th cycle of testing samples show a sloping region at potentials from 2 to 0.1 V without obvious plateaus (Figure 6b). Sloping-shaped curves are typical for non-graphitic carbon electrodes and indicate the surface adsorption behavior of sodium storage [4]. The slope of the curves for brominated samples appears at higher potentials than for the starting samples. The curves measured for Br-aPNC have a plateau-like inflection of about 1.4 V. A similar behavior was observed for brominated nanohorns and associated with the adsorption of Na+ ions near bromine functionalities [28]. The plateau capacity at potentials below 0.1 V, corresponding to the insertion of Na+ into the carbon interlayer space and the filling of closed pores, is insignificant for all samples and does not exceed 30 mAh g−1 (inset in Figure 6b) [16].
During the first ten cycles at a current density of 0.05 A g−1, the capacity of the brominated samples decreases more strongly compared to the initial samples (Figure 6c), which is related to the irreversible interaction of some bromine species with Na+ ions. With longer cycling, the discharge and charge capacities become reversible with a Coulombic efficiency of about 100%. The initial sample PNC has a capacity of 87 mA h g−1 at 1 A g−1 at the 50th cycle and 140 mA h g−1 at 0.05 A g−1 at the 60th cycle. The main reason for the decrease in capacity at high current density is the sluggish kinetics of Na+ ions in porous carbon electrodes. For aPNC, the corresponding capacity is 97 mA h g−1 at 1 A g−1 and 151 mA h g−1 at 0.05 A g−1. The activation of PNC with KOH does not cause a significant increase in capacity despite an increase in the specific surface area. The brominated samples have the highest capacity values. For Br-PNC, the capacity is 126 mA h g−1 at 1 A g−1 and 216 mA h g−1 at 0.05 A g−1, and for Br-aPNC, it is 151 mA h g−1 at 1 A g−1 and 234 mA h g−1 at 0.05 A g−1. Bromination leads to an increase in the Na+-ion storage capacity by 44–54% for Br-PNC and 77–73% for Br-aPNC. The higher the bromine content, the higher the gain in capacity. The capacity at 1 A g−1 is 58% for Br-PNC and 62–64% for Br-aPNC as compared to the capacity value of the sample at 0.05 A g−1. The most rapid deterioration of capacity with increasing current density for Br-PNC can be explained by the influence of C–Br groups presented in this sample; namely, the movement of Na+ ions through pores decorated with bromine can be sterically hindered. However, the highly developed porous structure of Br-aPNC allows the liquid electrolyte to diffuse easily into the bulk of the carbon electrode material. Both brominated electrodes retain the ability to accumulate Na after 255 cycles (Figure 6d).
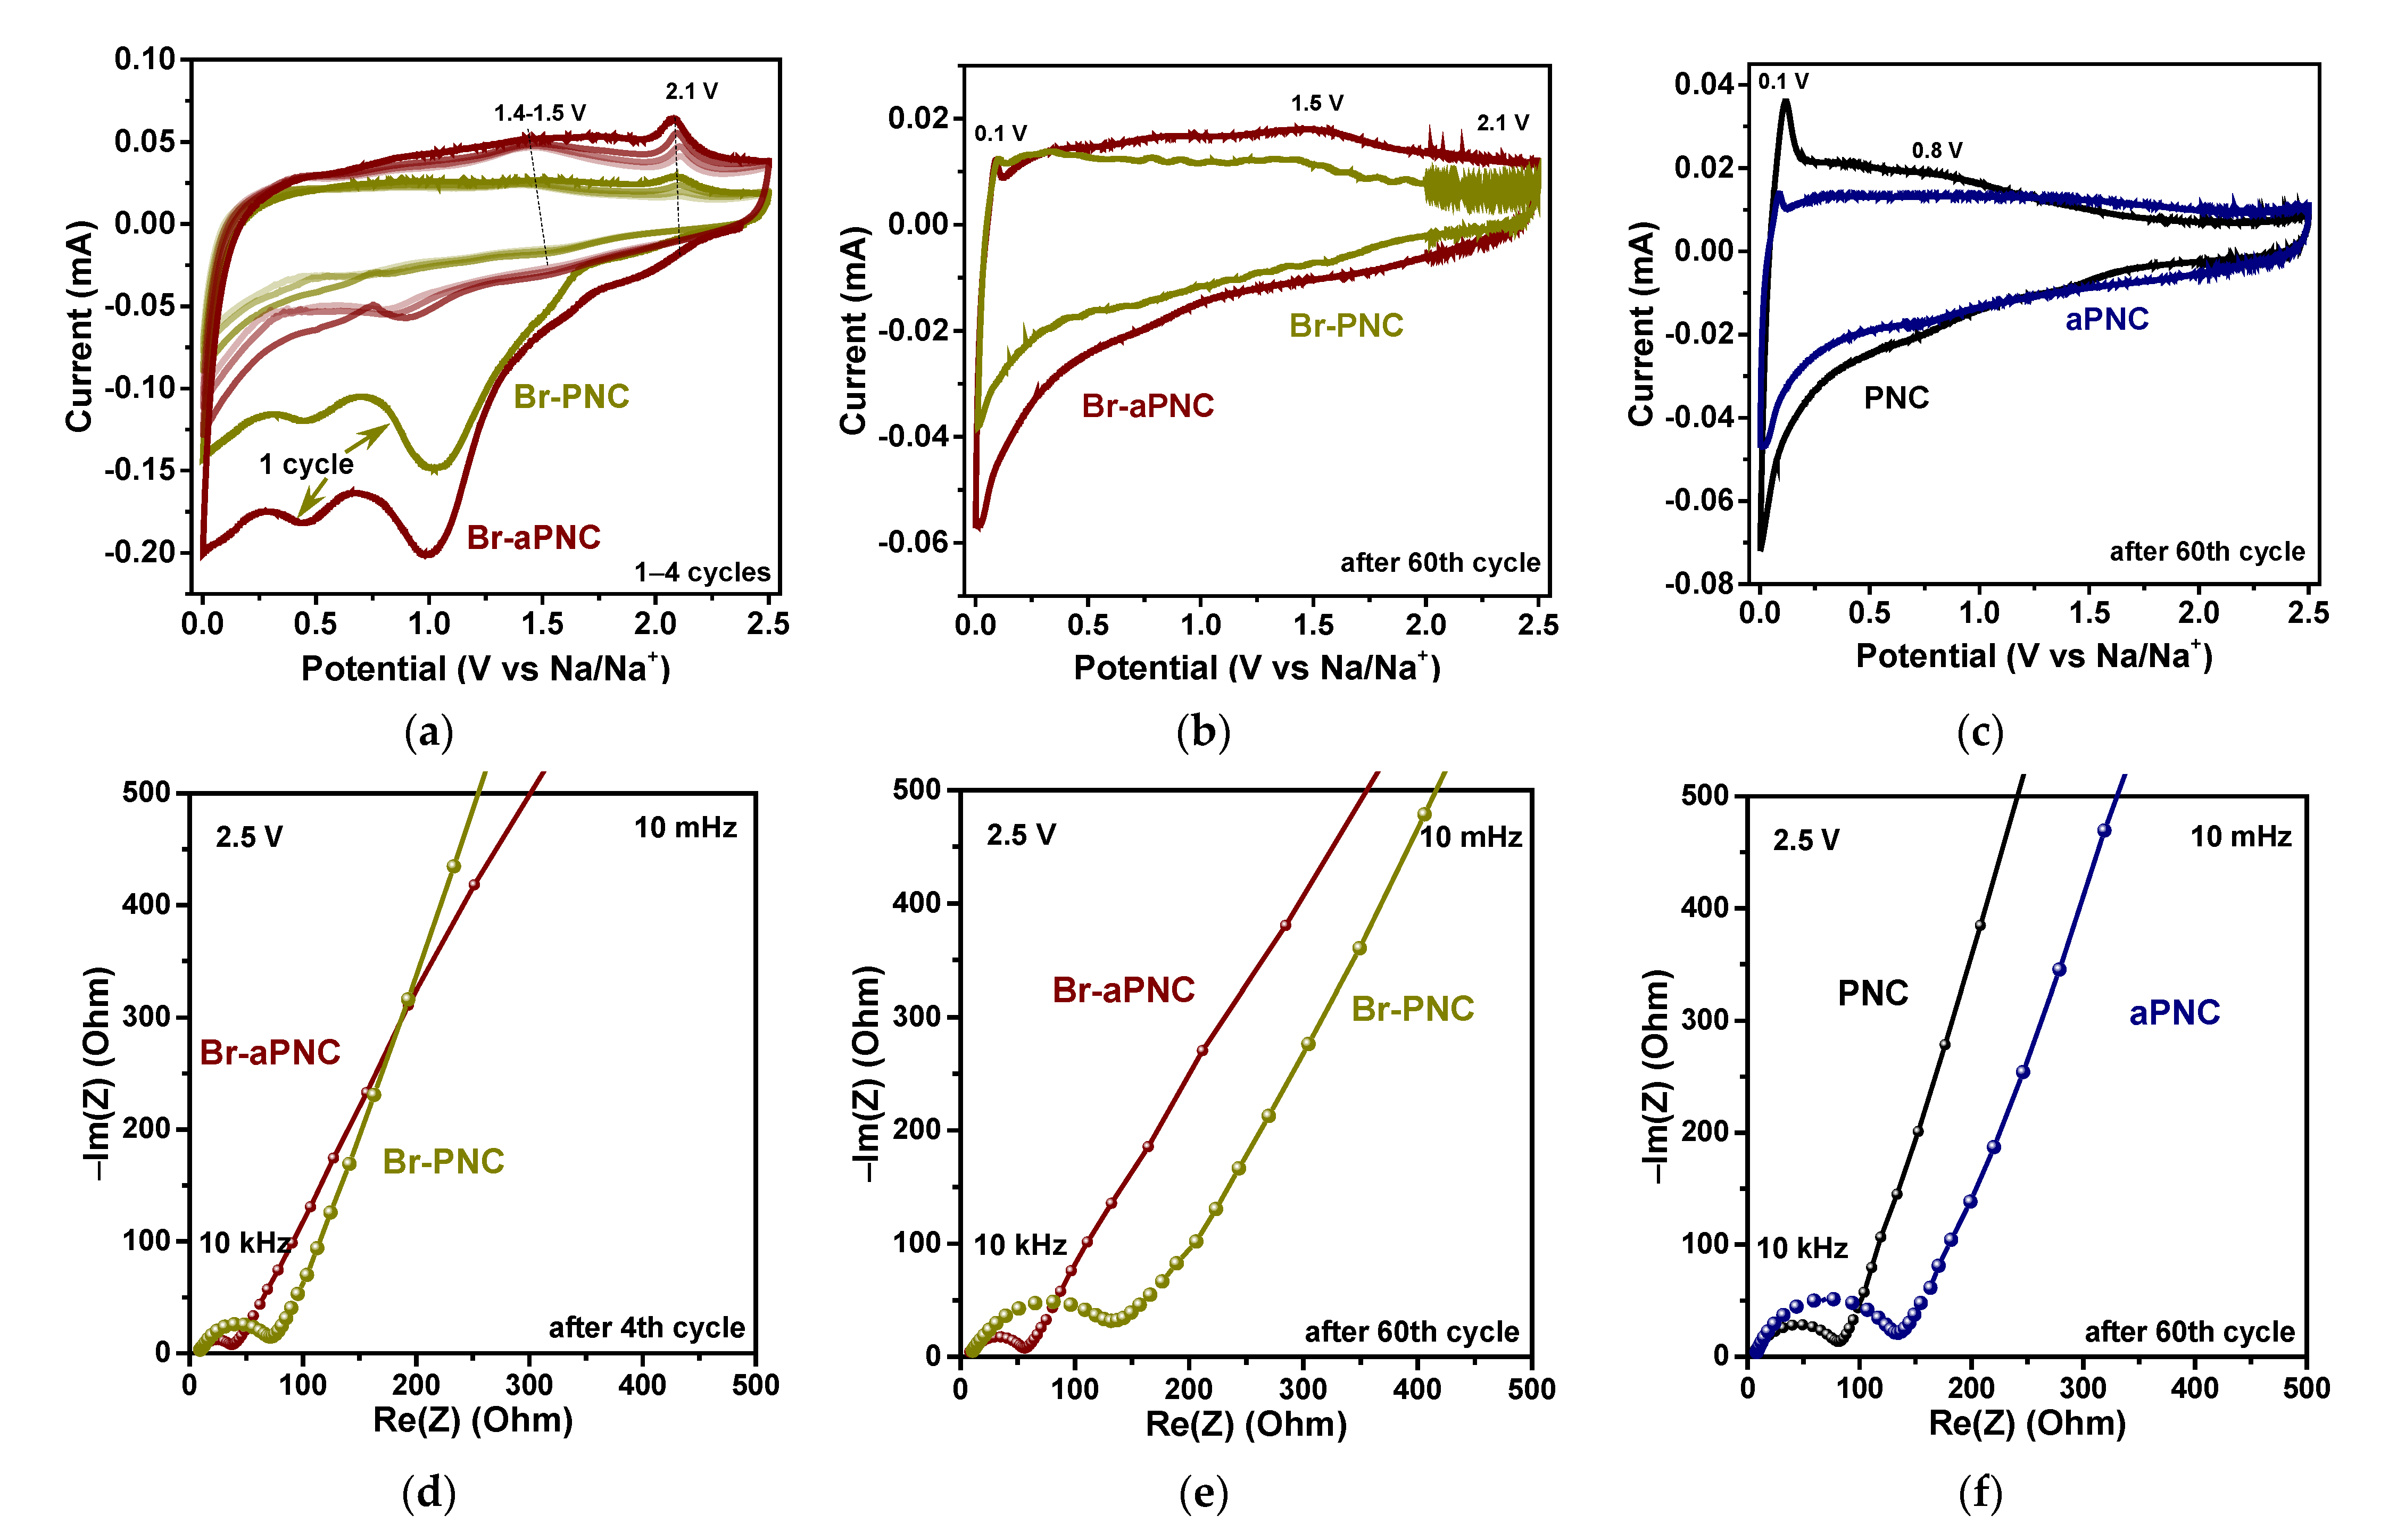
The cyclic voltammetry (CV) curves measured for Br-PNC and Br-aPNC show intense peaks at 0.5 and 1.0 V at the first insertion of Na+ ions (Figure 7a). These peaks almost completely disappear over the next three cycles and therefore correspond to the SEI formation and the irreversible loss of Na+ ions due to the strong interaction with the lattice defects and functional groups. Peaks at 1.4 and 2.1 V refer to the interaction of sodium with carbon sites near C–Br bonds and adsorbed Br2 molecules, respectively [28]. The peak at 2.1 V in the CV curves of Br-aPNC is larger than that of Br-PNC due to the higher Br2 content in the pre-activated sample. The origin of the 1.4 V peak in the CV curves of the Br-aPNC sample is not obvious since the C–Br groups are not observed by XPS (Figure 3a). The formation of C–Br in the bulk of the sample cannot be ruled out, and in this case, the surface-sensitive XPS method cannot detect this bromine state. Another reason is the electrochemical dissociation of Br2 molecules followed by covalent bromine bonding with carbon lattice defects. Indeed, CV curves measured after 60 repeated discharge-charge cycles show a strong decrease in the peak at 2.1 V and retention of the peak at 1.4 V (Figure 7b). These curves also show an increase in the intensity of the peak at 0.1 V, corresponding to the extraction of Na+ ions from graphitic-like layers. Previously, it was shown that bromination promotes the sodiation of carbon material [50].
The CV curve measured after the 60th cycle of the initial PNC has an intense peak at 0.1 V and a peak at 0.8 V, indicating that Na storage is provided by adsorption in pores and on defects (Figure 7c). For a-PNC, the region at high potentials makes a greater contribution due to the enrichment of the activated sample with defects.
Electrochemical impedance spectroscopy (EIS) measurements were carried out to further study the surface reactivity of the brominated and initial carbon electrodes. Prior to these measurements, the cells were cycled 4 or 60 times over a voltage range of 0.01–2.5 V. Nyquist impedance plots are shown over a frequency range of 10 kHz–10 mHz at 2.5 V, corresponding to the non-sodiated carbon electrodes (Figure 7d–f). Each Nyquist plot has a semicircle at high frequencies associated with the charge transfer occurring at the anode surface and an inclined line at low frequencies related to the diffusion process. The semicircle magnitude ends at 73 Ohm for Br-PNC and 38 Ohm for Br-aPNC after the 4th cycle (Figure 7d), and after 60 cycles increases to 134 Ohm for Br-PNC and 56 Ohm for Br-aPNC, respectively (Figure 7e). The surface charge-transfer resistance of Br-aPNC is lower than that of Br-PNC, indicating better Na+ ion transport in Br-aPNC as compared to Br-PNC. In contrast, the Nyquist plot for aPNC shows an increase in charge-transfer resistance up to 135 Ohm due to the presence of various functionalities (Figure 7f). The more vertically inclined line for PNC shows more efficient ion diffusion kinetics.
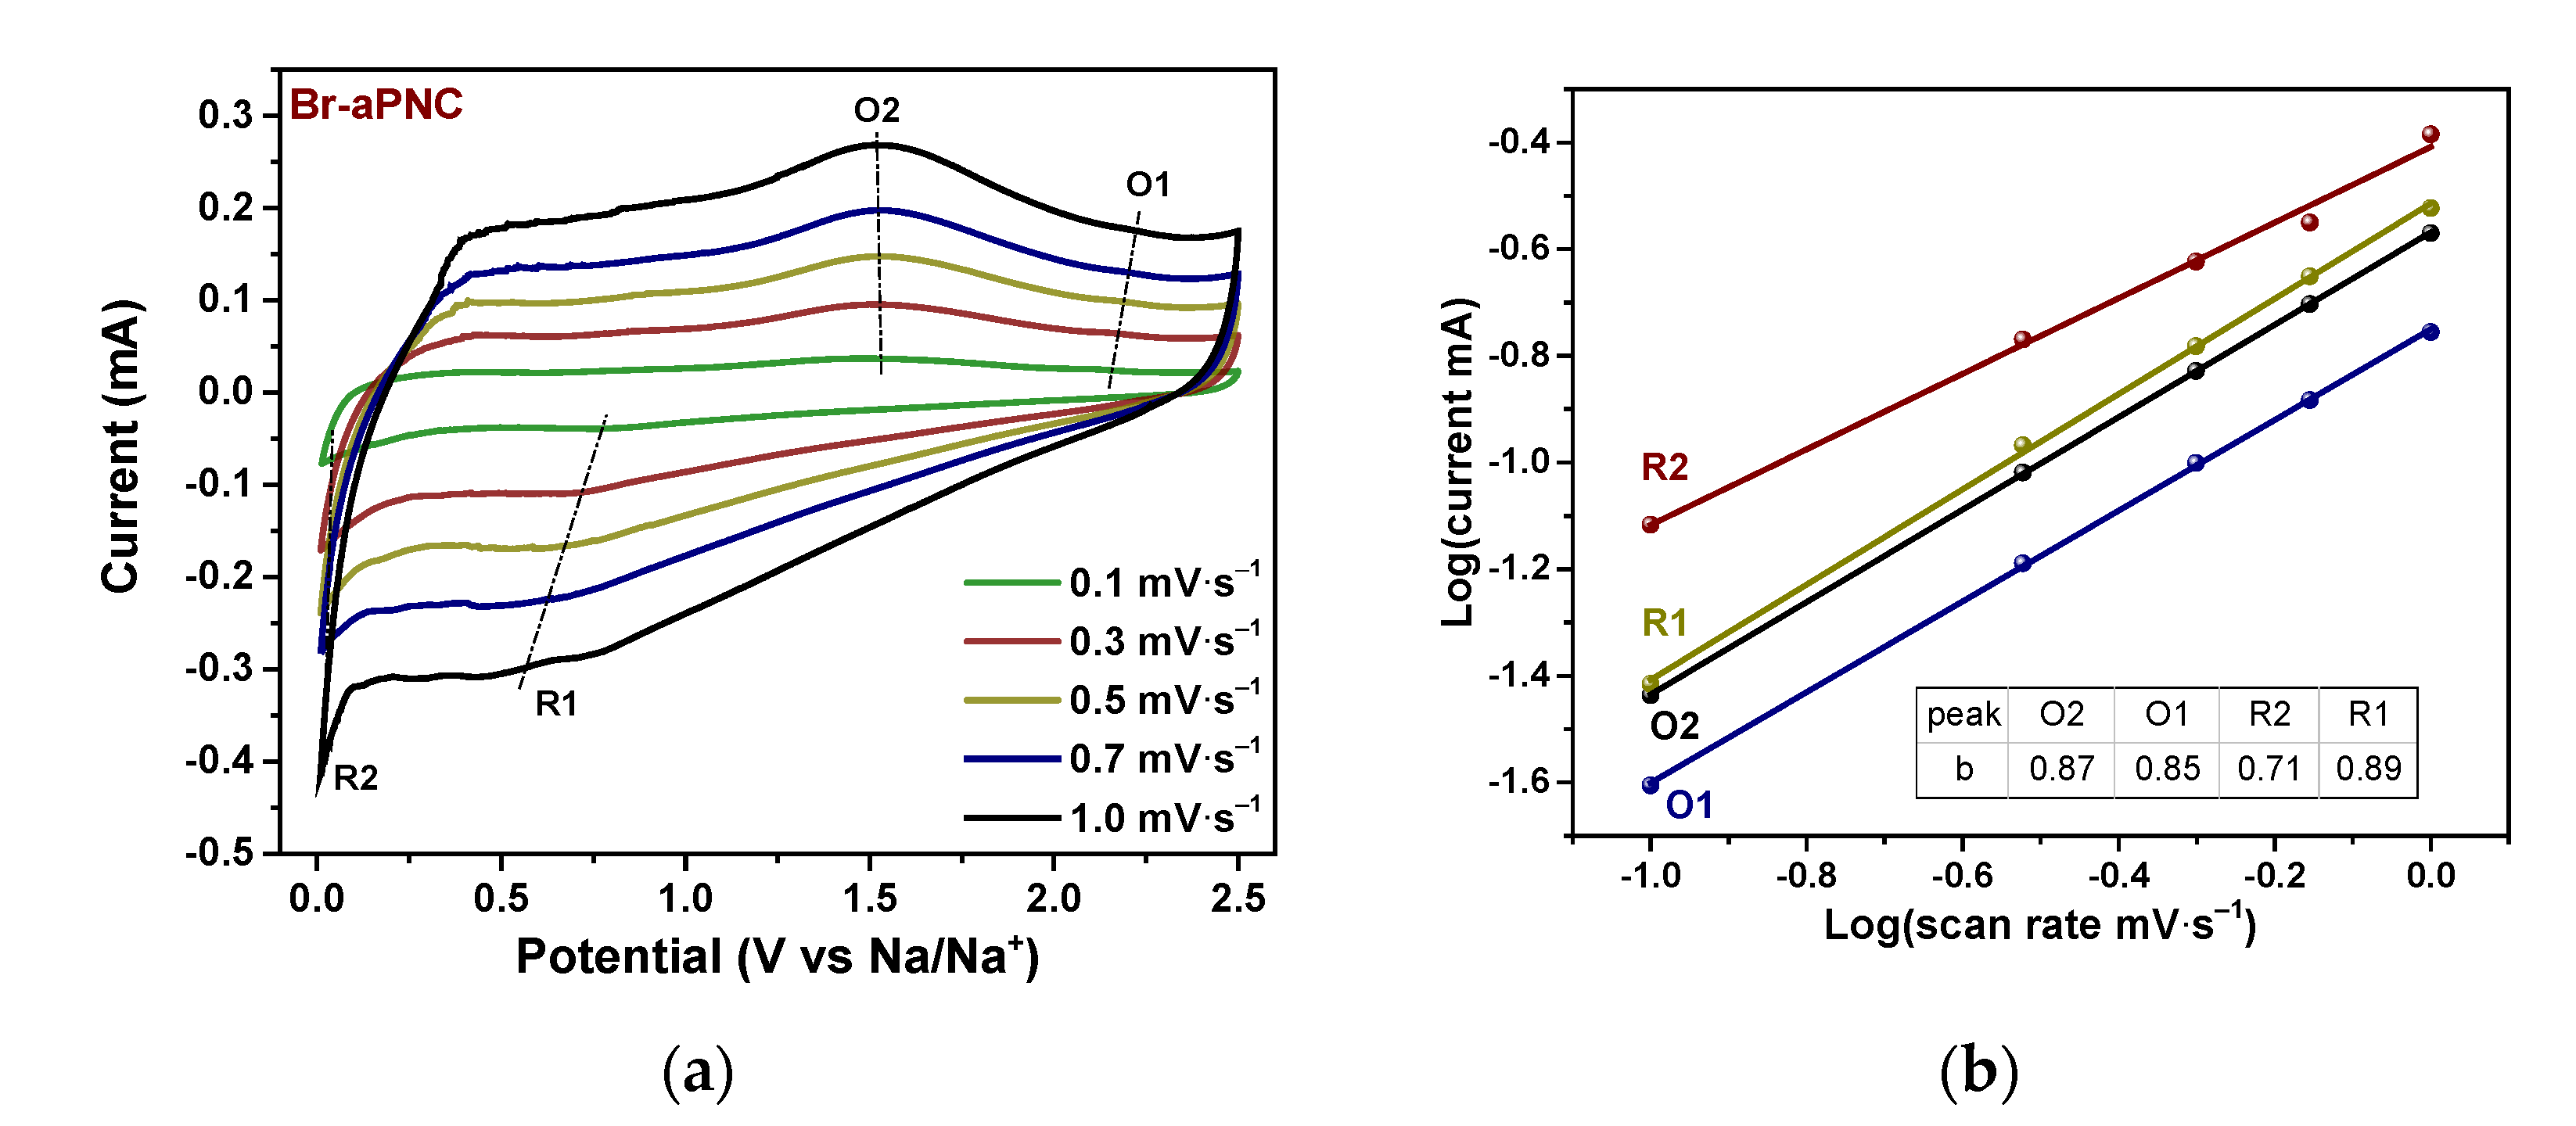
The kinetics of sodium storage processes was studied on the best Br-aPNC sample. CV curves taken at scan rates from 0.1 to 1.0 mV s−1 have a quasi-rectangular shape with weak anodic peaks at 1.5 and 2.1 V and cathodic peaks at 0.1 and 0.5 V (Figure 8a). The current peak intensity (i) depends on the scan rate (v) according to a power law: i = avb [56,57], where a and b are adjustable coefficients. The value of b is determined from the slope of the log(i)—log(v) plot (Figure 8b). When b is 0.5, the current is proportional to the square root of the scan rate, which corresponds to a diffusion-controlled process. The current is proportional to the scan rate at b equal to 1.0, and this case indicates a capacitive process. The b-values determined from the CV curves of the Br-aPNC electrode are in the range of 0.85–0.89 for the O1, O2 oxidation peaks and the R1 reduction peak (table in Figure 8b). Hence, these peaks at high potentials correspond to capacitive-like processes. The R2 peak at 0.1 eV has a b value of 0.71, and, therefore, its current is mainly due to a diffusion-controlled intercalation reaction. The change in the shape of the CV curve with the scan rate (Figure 8a) indicates the presence of both fast capacitive and slow intercalation processes in Br-aPNC, which are determined by the electronic conductivity and surface area of the electrode material as well as the Na+ ion diffusion rate.

3. Materials and Methods

3.1. Synthesis

Nitrogen-doped porous carbon material was synthesized by the template-assisted CVD method using the conditions described in detail elsewhere [24]. Calcium glutarate (CaC5H6O4) was used as a precursor for the template nanoparticles. The thermal decomposition of calcium glutarate at 750 °C for 10 min in an argon atmosphere yielded carbon-coated CaO nanoparticles. The deposition of acetonitrile (CH3CN) vapors on the surface of template nanoparticles was carried out at 750 °C for 1 h, leading to the formation of nitrogen-doped graphitic-like shells in the space between the CaO nanoparticles. Then CaO was removed by treatment with the dilute HCl for 30 min. The product was washed twice with distilled water to neutral pH and air dried at 100 °C overnight. Chemical activation was performed by mixing PNC and KOH in a mass ratio of 1:3 followed by heating at 750 °C for 2 h in an argon atmosphere. The obtained sample was repeatedly washed with distilled water until neutral pH. Bromination was carried out in sealed Teflon reactors using saturated Br2 vapors at 25 °C for 4 days. The brominated samples were purged with N2 to remove excess bromine.

3.2. Characterisation

The SEM images were obtained on a JEOL JSM 6700F microscope equipped with an EX23000BU energy-dispersive X-ray spectrometer at an accelerating voltage of 15 kV using a secondary electron detector. TEM analysis was performed on a JEOL 2010 microscope operated at an accelerating voltage of 200 kV. The surface areas were measured by nitrogen adsorption at 77 K on a «Sorbi-MS» analyzer. The XRD patterns of the samples were obtained using a Shimadzu XRD-7000 diffractometer (Cu Kα radiation, Ni filter on a reflected beam). Raman spectra were recorded with a LabRAM HR Evolution (Horiba) spectrometer using an Ar+ laser (λ = 514 nm). FTIR spectra were obtained on a Fourier spectrometer Scimitar FTS 2000 (Digilab, Holliston, MA, USA) in the range of 400–4000 cm−1. A specimen (~1 mg) was pressed into a KBr tablet. The collected data were processed by subtracting the nonlinear background arising from optical components and KBr.
XPS and NEXAFS spectroscopy experiments were performed at the Russian–German Beamline (RGBL) at the BESSY II synchrotron radiation facility, Helmholtz-Zentrum Berlin für Materialien und Energie (HZB). The powder samples were spread on Cu substrates, which were fixed on a holder. The pressure in the vacuum chambers was about 10−9 Torr. The XPS spectra were measured at a photon energy of 830 eV. The chemical composition of the samples’ surfaces was calculated from the survey XPS spectra, taking into consideration the photoionization cross-sections. The Au 4f7/2 line at 84 eV measured from the surface of a clean gold foil was used to calibrate the binding energy scale. The Shirley background subtraction procedure was applied to correct the XPS spectra, which were then fitted using the Gaussian–Lorentzian product. The C K-edge and N K-edge NEXAFS spectra were measured via the total electron yield.

3.3. Electrochemical Measurements

The electrochemical measurements of the SIBs were carried out using CR2032 coin cells. The carbon samples were mixed with conductive additive (super P) and polyvinylidene fluoride at a weight ratio of 8:1:1. N-methyl-2-pyrrolidone was added to the mixture. Then the slurries were spread on copper foil substrates and dried in a vacuum oven at 80 °C for 12 h. The cells were assembled in an Ar-filled glove box (O2 and H2O <0.1 ppm). A piece of glass fiber separator was inserted between a sodium metal anode and a carbon cathode. As an electrolyte for each coin cell, 1 M NaClO4 in an equal volume ratio of ethylene carbonate and dimethyl carbonate was added. Galvanostatic discharge-charge cycling was performed on NEWARE CT-3008 battery-testing stations at different current densities ranging from 0.05 to 1 A g−1. The potential range was 0.01–2.50 V. A BCS-805 battery cycling system was used for CV and EIS tests. CV curves were measured in a potential range of 0.01–2.50 V at a scan rate of 0.1 mV s−1 after 60 cycles and only for the brominated samples for the first four cycles. To study the sodium storage kinetics, CV tests were performed after five repeated discharge–charge cycles at 0.1 mV s−1. The EIS data were collected for the cells after the 60th cycle and for brominated samples after the fourth cycle at a frequency range of 10 kHz to 10 mHz at an AC amplitude of 5 mV and 2.5 V, respectively.

4. Conclusions

In summary, a porous nitrogen-doped carbon (PNC) material of composition CO0.04N0.04 with a specific surface area of 384 m2 g−1 was synthesized by the thermal decomposition of acetonitrile on the pyrolysis-product of calcium glutarate. The thermal activation of PNC in the presence of potassium hydroxide at 750 °C led to a decrease in the nitrogen content to 1 at% and an increase in the oxygen content up to 8 at%. The etching of carbon shells resulted in the attachment of –OH and –CHx groups to the edges of the a-PNC sample and growth of its specific surface area to 1201 m2 g−1. The bromination of the PNC and a-PNC samples was performed with Br2 vapor at room temperature. Covalently bonded to carbon and molecular bromine was found in Br-PNC with a total bromine content of 3 at%. While in Br-aPNC with a bromine concentration of 5 at%, only the last form of bromine was found since the edge states in the KOH-activated sample were occupied by oxygen-containing groups. The nitrogen doping atoms retained their chemical state after the interaction of the sample with bromine. The electrochemical tests at current densities of 1.00–0.05 A g−1 determined the specific sodium storage capacity of 87–140 mA h g−1 for the initial PNC sample and almost the same capacity for the KOH-activated a-PNC sample. After bromination, the capacity increased to 126–216 mA h g−1 for Br-PNC and to 151–234 mA h g−1 for Br-aPNC. The double modification of PNC by KOH and Br2 led to the maximum capacity gain of 77−73%. The peaks observed in the CV curves of Br-PNC and Br-aPNC at 1.4 and 2.1 V are explained by the adsorption of Na+ ions near the C–Br groups and intercalated bromine molecules. The Br2 molecules increased the separation of graphitic layers in carbon materials and changed the conductivity, while the polarized C–Br bonds created new Na storage sites. As a result, the brominated samples showed significantly improved performance in SIBs.

Supplementary Materials

The following supporting information can be downloaded at: https://www.mdpi.com/article/10.3390/batteries8090114/s1, Figure S1: Scanning electron microscopy images of PNC, aPNC, Br-PNC and Br-aPNC.; Figure S2: SEM image and energy-dispersive X-ray spectroscopy elemental mapping showing distribution of carbon, nitrogen and bromine in Br-aPNC.

Author Contributions

Conceptualization, Y.V.F.; writing—original draft, Y.V.F.; project administration, Y.V.F., methodology, E.V.S. and A.V.O.; investigation, E.V.S., S.G.S., A.A.V., M.A.G., A.A.M. and Y.V.S.; formal analysis, A.A.V. and M.A.G.; resources, A.A.M.; validation, A.V.O.; L.G.B.; supervision, A.V.O.; writing—review & editing, L.G.B. All authors have read and agreed to the published version of the manuscript.

Funding

This research was funded by the Russian Science Foundation (grant 19-73-10068). The XRD and FTIR spectra measurements were supported by the Ministry of Science and Higher Education of the Russian Federation (project 121031700314-5). A.A.M. acknowledges BMBF (grant no. 05K19KER).

Institutional Review Board Statement

Not applicable.

Informed Consent Statement

Not applicable.

Data Availability Statement

Not applicable.

Acknowledgments

The authors thank A.V. Ischenko for TEM data, E.A. Maksimovskiy for SEM images, and the Helmholtz-Zentrum Berlin für Materialien und Energie for the allocation of beamtime for XPS and NEXAFS measurements and support within the Russian German Laboratory at BESSY II.

Conflicts of Interest

The authors declare no conflict of interest.

References

  1. Larcher, D.; Tarascon, J.M. Towards greener and more sustainable batteries for electrical energy storage. Nat. Chem. 2015, 7, 19–29. [Google Scholar] [CrossRef] [PubMed]
  2. Li, M.; Lu, J.; Chen, Z.; Amine, K. 30 years of lithium-ion batteries. Adv. Mater. 2018, 30, 1800561. [Google Scholar] [CrossRef] [PubMed]
  3. Kulova, T.L.; Fateev, V.N.; Seregina, E.A.; Grigoriev, A.S. A brief review of post-lithium-ion batteries. Int. J. Electrochem. Sci. 2020, 15, 7242–7259. [Google Scholar] [CrossRef]
  4. Zhang, T.; Li, C.; Wang, F.; Noori, A.; Mousavi, M.F.; Xia, X.; Zhan, Y. Recent advances in carbon anodes for sodium-ion batteries. Chem. Rec. 2022, e202200083. [Google Scholar] [CrossRef] [PubMed]
  5. Palomares, V.; Serras, P.; Villaluenga, I.; Hueso, K.B.; Carretero-González, J.; Rojo, T. Na-ion batteries, recent advances and present challenges to become low cost energy storage systems. Energy Environ. Sci. 2012, 5, 5884–5901. [Google Scholar] [CrossRef]
  6. Fang, Y.; Yu, X.Y.; Lou, X.W.D. Nanostructured electrode materials for advanced sodium-ion batteries. Matter 2019, 1, 90–114. [Google Scholar] [CrossRef]
  7. Ge, P.; Fouletier, M. Electrochemical intercalation of sodium in graphite. Solid State Ionics 1988, 28–30, 1172–1175. [Google Scholar] [CrossRef]
  8. Li, Z.; Bommier, C.; Chong, Z.S.; Jian, Z.; Surta, T.W.; Wang, X.; Xing, Z.; Neuefeind, J.C.; Stickle, W.F.; Dolgos, M.; et al. Mechanism of Na-ion storage in hard carbon anodes revealed by heteroatom doping. Adv. Energy Mater. 2017, 7, 1602894. [Google Scholar] [CrossRef]
  9. Pramudita, J.C.; Sehrawat, D.; Goonetilleke, D.; Sharma, N. An initial review of the status of electrode materials for potassium-ion. Adv. Energy Mater. 2017, 7, 1602911. [Google Scholar] [CrossRef]
  10. Stevens, D.A.; Dahn, J.R. High capacity anode materials for rechargeable sodium-ion batteries. J. Electrochem. Soc. 2000, 147, 1271–1273. [Google Scholar] [CrossRef]
  11. Cao, B.; Liu, H.; Xu, B.; Lei, Y.; Chen, X.; Song, H. Mesoporous soft carbon as an anode material for sodium ion batteries with superior rate and cycling performance. J. Mater. Chem. A 2016, 4, 6472–6478. [Google Scholar] [CrossRef]
  12. Wen, Y.; He, K.; Zhu, Y.; Han, F.; Xu, Y.; Matsuda, I.; Ishii, Y.; Cumings, J.; Wang, C. Expanded graphite as superior anode for sodium-ion batteries. Nat. Commun. 2014, 5, 4033. [Google Scholar] [CrossRef] [PubMed]
  13. Alvira, D.; Antorán, D.; Manyà, J.J. Plant-derived hard carbon as anode for sodium-ion batteries: A comprehensive review to guide interdisciplinary research. Chem. Eng. J. 2022, 447, 137468. [Google Scholar] [CrossRef]
  14. Tsai, P.; Chung, S.-C.; Lin, S.; Yamada, A. Ab initio study of sodium intercalation into disordered carbon. J. Mater. Chem. A 2015, 3, 9763–9768. [Google Scholar] [CrossRef]
  15. Yang, C.; Sun, X.; Zhang, X.; Li, J.; Ma, J.; Li, Y.; Xu, L.; Liu, S.; Yang, J.; Fang, S.; et al. Is graphite nanomesh a promising anode for the Na/K-ions batteries? Carbon 2021, 176, 242–252. [Google Scholar] [CrossRef]
  16. Yuan, M.; Cao, B.; Liu, H.; Meng, C.; Wu, J.; Zhang, S.; Li, A.; Chen, X.; Song, H. Sodium storage mechanism of nongraphitic carbons: A general model and the function of accessible closed pores. Chem. Mater. 2022, 34, 3489–3500. [Google Scholar] [CrossRef]
  17. Yang, G.; Li, X.; Guan, Z.; Tong, Y.; Xu, B.; Wang, X.; Wang, Z.; Chen, L. Insights into lithium and sodium storage in porous carbon. Nano Lett. 2020, 20, 3836–3843. [Google Scholar] [CrossRef]
  18. Alvin, S.; Yoon, D.; Chandra, C.; Cahyadi, H.S.; Park, J.-H.; Chang, W.; Chung, K.Y.; Kim, J. Revealing sodium ion storage mechanism in hard carbon. Carbon 2019, 145, 67–81. [Google Scholar] [CrossRef]
  19. Shi, G.-S.; Wang, Z.-G.; Zhao, J.-J.; Hu, J.; Fang, H.-P. Adsorption of sodium ions and hydrated sodium ions on a hydrophobic graphite surface via cation-π interactions. Chin. Phys. B 2011, 20, 068101. [Google Scholar] [CrossRef]
  20. Xiao, B.; Rojo, T.; Li, X. Hard carbon as sodium-ion battery anodes progress and challenges. ChemSusChem 2019, 12, 133–144. [Google Scholar] [CrossRef]
  21. Wu, J.; Pan, Z.; Zhang, Y.; Wang, B.; Peng, H. The recent progress of nitrogen-doped carbon nanomaterials for electrochemical batteries. J. Mater. Chem. A 2018, 6, 12932–12944. [Google Scholar] [CrossRef]
  22. Agrawal, A.; Janakiraman, S.; Biswas, K.; Venimadhav, A.; Srivastava, S.K.; Ghosh, S. Understanding the improved electrochemical performance of nitrogen-doped hard carbons as an anode for sodium ion battery. Electrochim. Acta 2019, 317, 164–172. [Google Scholar] [CrossRef]
  23. Vu, N.H.; Le, H.T.T.; Hoang, V.H.; Dao, V.D.; Huu, H.T.; Jun, Y.S.; Im, W. Bin highly N-doped, H-containing mesoporous carbon with modulated physicochemical properties as high-performance anode materials for Li-ion and Na-ion batteries. J. Alloys Compd. 2021, 851, 156881. [Google Scholar] [CrossRef]
  24. Shlyakhova, E.V.; Bulusheva, L.G.; Kanygin, M.A.; Plyusnin, P.E.; Kovalenko, K.A.; Senkovskiy, B.V.; Okotrub, A.V. Synthesis of nitrogen-containing porous carbon using calcium oxide nanoparticles. Phys. Status Solidi 2014, 251, 2607–2612. [Google Scholar] [CrossRef]
  25. Nishchakova, A.D.; Grebenkina, M.A.; Shlyakhova, E.V.; Shubin, Y.V.; Kovalenko, K.A.; Asanov, I.P.; Fedoseeva, Y.V.; Makarova, A.A.; Okotrub, A.V.; Bulusheva, L.G. Porosity and composition of nitrogen-doped carbon materials templated by the thermolysis products of calcium tartrate and their performance in electrochemical capacitors. J. Alloys Compd. 2021, 858, 158259. [Google Scholar] [CrossRef]
  26. Kong, L.; Li, Y.; Feng, W. Fluorine-doped hard carbon as the advanced performance anode material of sodium-ion batteries. Trans. Tianjin Univ. 2022, 28, 123–131. [Google Scholar] [CrossRef]
  27. Hong, S.M.; Etacheri, V.; Hong, C.N.; Choi, S.W.; Lee, K.B.; Pol, V.G. Enhanced lithium- and sodium-ion storage in an interconnected carbon network comprising electronegative fluorine. ACS Appl. Mater. Interfaces 2017, 9, 18790–18798. [Google Scholar] [CrossRef]
  28. Stolyarova, S.G.; Fedoseeva, Y.V.; Baskakova, K.I.; Vorfolomeeva, A.A.; Shubin, Y.V.; Makarova, A.A.; Bulusheva, L.G.; Okotrub, A.V. Bromination of carbon nanohorns to improve sodium-ion storage performance. Appl. Surf. Sci. 2022, 580, 152238. [Google Scholar] [CrossRef]
  29. Hamdan, R.; Kemper, A.F.; Cao, C.; Cheng, H.P. Structure and functionality of bromine doped graphite. J. Chem. Phys. 2013, 138, 164702. [Google Scholar] [CrossRef]
  30. Yu, F.; Wu, Y.; Ma, J. Influence of the pore structure and surface chemistry on adsorption of ethylbenzene and xylene isomers by KOH-activated multi-walled carbon nanotubes. J. Hazard. Mater. 2012, 237–238, 102–109. [Google Scholar] [CrossRef]
  31. Lv, Y.; Zhang, F.; Dou, Y.; Zhai, Y.; Wang, J.; Liu, H.; Xia, Y.; Tu, B.; Zhao, D. A comprehensive study on KOH activation of ordered mesoporous carbons and their supercapacitor application. J. Mater. Chem. 2012, 22, 93–99. [Google Scholar] [CrossRef]
  32. Williams, N.E.; Oba, O.A.; Aydinlik, N.P. Modification, production and methods of KOH-activated carbon. ChemBioEng Rev. 2022, 9, 164–189. [Google Scholar] [CrossRef]
  33. Sevilla, M.; Gu, W.; Falco, C.; Titirici, M.M.; Fuertes, A.B.; Yushin, G. Hydrothermal synthesis of microalgae-derived microporous carbons for electrochemical capacitors. J. Power Sources 2014, 267, 26–32. [Google Scholar] [CrossRef]
  34. Li, Y.; Xiao, Y.; Wang, X.; Cao, M. Enhancement of lithium storage performance of carbon microflowers by achieving a high surface area. Chem. An Asian J. 2014, 9, 1957–1963. [Google Scholar] [CrossRef]
  35. Li, Z.Q.; Lu, C.J.; Xia, Z.P.; Zhou, Y.; Luo, Z. X-ray diffraction patterns of graphite and turbostratic carbon. Carbon 2007, 45, 1686–1695. [Google Scholar] [CrossRef]
  36. Chu, P.K.; Li, L. Characterization of amorphous and nanocrystalline carbon films. Mater. Chem. Phys. 2006, 96, 253–277. [Google Scholar] [CrossRef]
  37. Bulusheva, L.G.; Okotrub, A.V.; Flahaut, E.; Asanov, I.P.; Gevko, P.N.; Koroteev, V.O.; Fedoseeva, Y.V.; Yaya, A.; Ewels, C.P. Bromination of double-walled carbon nanotubes. Chem. Mater. 2012, 24, 2708–2715. [Google Scholar] [CrossRef]
  38. Bulusheva, L.G.; Lobiak, E.V.; Fedoseeva, Y.V.; Mevellec, J.Y.; Makarova, A.A.; Flahaut, E.; Okotrub, A.V. Effect of ultrasound pretreatment on bromination of double-walled carbon nanotubes. Synth. Met. 2020, 259, 116233. [Google Scholar] [CrossRef]
  39. Sedelnikova, O.V.; Ewels, C.P.; Pinakov, D.V.; Chekhova, G.N.; Flahaut, E.; Okotrub, A.V.; Bulusheva, L.G. Bromine polycondensation in pristine and fluorinated graphitic carbons. Nanoscale 2019, 11, 15298–15306. [Google Scholar] [CrossRef]
  40. Fedoseeva, Y.V.; Lobiak, E.V.; Shlyakhova, E.V.; Kovalenko, K.A.; Kuznetsova, V.R.; Vorfolomeeva, A.A.; Grebenkina, M.A.; Nishchakova, A.D.; Makarova, A.A.; Bulusheva, L.G.; et al. Hydrothermal activation of porous nitrogen-doped carbon materials for electrochemical capacitors and sodium-ion batteries. Nanomaterials 2020, 10, 2163. [Google Scholar] [CrossRef]
  41. Geng, D.; Yang, S.; Zhang, Y.; Yang, J.; Liu, J.; Li, R.; Sham, T.K.; Sun, X.; Ye, S.; Knights, S. Nitrogen doping effects on the structure of graphene. Appl. Surf. Sci. 2011, 257, 9193–9198. [Google Scholar] [CrossRef]
  42. Pan, N.; Guan, D.; Yang, Y.; Huang, Z.; Wang, R.; Jin, Y.; Xia, C. A rapid low-temperature synthetic method leading to large-scale carboxyl graphene. Chem. Eng. J. 2014, 236, 471–479. [Google Scholar] [CrossRef]
  43. Ferreira, F.V.; Brito, F.S.; Franceschi, W.; Simonetti, E.A.N.; Cividanes, L.S.; Chipara, M.; Lozano, K. Functionalized graphene oxide as reinforcement in epoxy based nanocomposites. Surfaces Interfaces 2018, 10, 100–109. [Google Scholar] [CrossRef]
  44. Yao, Y.; Velpari, V.; Economy, J. In search of brominated activated carbon fibers for elemental mercury removal from power plant effluents. J. Mater. Chem. A 2013, 1, 12103–12108. [Google Scholar] [CrossRef]
  45. Papirer, E.; Lacroix, R.; Donnet, J.-B.; Nanse, G.; Fioux, P. XPS study of the halogenation of carbon black-Part 1. Bromination. Carbon 1994, 32, 1341–1358. [Google Scholar] [CrossRef]
  46. Lippitz, A.; Friedrich, J.F.; Unger, W.E.S. Plasma bromination of HOPG surfaces: A NEXAFS and synchrotron XPS study. Surf. Sci. 2013, 611, L1–L7. [Google Scholar] [CrossRef]
  47. Colomer, J.-F.; Marega, R.; Traboulsi, H.; Meneghetti, M.; Van Tendeloo, G.; Bonifazi, D. Microwave-assisted bromination of double-walled carbon nanotubes. Chem. Mater. 2009, 21, 4747–4749. [Google Scholar] [CrossRef]
  48. Oginni, O.; Singh, K.; Oporto, G.; Dawson-Andoh, B.; McDonald, L.; Sabolsky, E. Influence of one-step and two-step KOH activation on activated carbon characteristics. Bioresour. Technol. Rep. 2019, 7, 100266. [Google Scholar] [CrossRef]
  49. Lapteva, L.L.; Fedoseeva, Y.V.; Shlyakhova, E.V.; Makarova, A.A.; Bulusheva, L.G.; Okotrub, A.V. NEXAFS spectroscopy study of lithium interaction with nitrogen incorporated in porous graphitic material. J. Mater. Sci. 2019, 54, 11168–11178. [Google Scholar] [CrossRef]
  50. Bulusheva, L.G.; Kanygin, M.A.; Arkhipov, V.E.; Popov, K.M.; Fedoseeva, Y.V.; Smirnov, D.A.; Okotrub, A.V. In situ X-ray photoelectron spectroscopy study of lithium interaction with graphene and nitrogen-doped graphene films produced by chemical vapor deposition. J. Phys. Chem. C 2017, 121, 5108–5114. [Google Scholar] [CrossRef]
  51. Aarva, A.; Deringer, V.L.; Sainio, S.; Laurila, T.; Caro, M.A. Understanding X-ray spectroscopy of carbonaceous materials by combining experiments, density functional theory, and machine learning. Part I: Fingerprint spectra. Chem. Mater. 2019, 31, 9243–9255. [Google Scholar] [CrossRef]
  52. Sánchez-López, J.C.; Donnet, C.; Lefèbvre, F.; Fernéndez-Ramos, C.; Fernández, A. Bonding structure in amorphous carbon nitride: A spectroscopic and nuclear magnetic resonance study. J. Appl. Phys. 2001, 90, 675–681. [Google Scholar] [CrossRef]
  53. Wang, Z.; Feng, X.; Bai, Y.; Yang, H.; Dong, R.; Wang, X.; Xu, H.; Wang, Q.; Li, H.; Gao, H.; et al. Probing the energy storage mechanism of quasi-metallic Na in hard carbon for sodium-ion batteries. Adv. Energy Mater. 2021, 11, 2003854. [Google Scholar] [CrossRef]
  54. Liang, H.J.; Gu, Z.Y.; Zheng, X.Y.; Li, W.H.; Zhu, L.Y.; Sun, Z.H.; Meng, Y.F.; Yu, H.Y.; Hou, X.K.; Wu, X.L. Tempura-like carbon/carbon composite as advanced anode materials for K-Ion batteries. J. Energy Chem. 2021, 59, 589–598. [Google Scholar] [CrossRef]
  55. Wang, Z.; Yang, H.; Liu, Y.; Bai, Y.; Chen, G.; Li, Y.; Wang, X.; Xu, H.; Wu, C.; Lu, J. Analysis of the stable interphase responsible for the excellent electrochemical performance of graphite electrodes in sodium-ion batteries. Small 2020, 16, 2003268. [Google Scholar] [CrossRef]
  56. Mathis, T.S.; Kurra, N.; Wang, X.; Pinto, D.; Simon, P.; Gogotsi, Y. Energy storage data reporting in perspective—guidelines for interpreting the performance of electrochemical energy storage systems. Adv. Energy Mater. 2019, 9, 1902007. [Google Scholar] [CrossRef]
  57. Come, J.; Taberna, P.-L.; Hamelet, S.; Masquelier, C.; Simon, P. Electrochemical kinetic study of LiFePO4 using cavity microelectrode. J. Electrochem. Soc. 2011, 158, A1090. [Google Scholar] [CrossRef] [Green Version]
Figure 1. (a) Schematic illustration of PNC synthesis, activation, and bromination; (b) SEM and (c) TEM images of PNC.
Batteries 08 00114 g001
Figure 2. (a) XRD patterns, (b) Raman scattering, and (c) FTIR spectra of PNC, aPNC, Br-PNC and Br-aPNC. Inset in (b) shows Raman spectrum of Br-PNC in the region of 70–400 cm−1.
Batteries 08 00114 g002
Figure 3. XPS (a) survey and (b) C 1s spectra of PNC, Br-PNC, aPNC, and Br-aPNC; (c) XPS Br 3d spectra of Br-PNC and Br-aPNC.
Batteries 08 00114 g003
Figure 4. XPS (a) O 1s and (b) N 1s spectra of PNC, aPNC, Br-PNC and Br-aPNC.
Batteries 08 00114 g004
Figure 5. NEXAFS (a) C K-edge and (b) N K-edge spectra of PNC, Br-PNC, aPNC, and Br-aPNC.
Batteries 08 00114 g005
Figure 6. Discharge-charge curves of PNC, aPNC, Br-PNC and Br-aPNC measured in (a) first and (b) 60th cycles at 0.05 A g−1; (c) Rate capability of PNC, aPNC, Br-PNC and Br-aPNC at current densities ranging from 0.05 A g−1 to 1 A g−1; (d) Long-term cycling performance of Br-PNC and Br-aPNC at 0.25 A g−1 and 0.5 A g−1. Inset in (b) shows the contribution in the electrode capacity below 0.1 V.
Batteries 08 00114 g006
Figure 7. CV curves of Br-PNC and Br-aPNC electrodes measured at a scan rate of 0.1 mVs−1 for (a) first 4 cycles and (b) after 60th cycle; (c) CV curves of PNC and aPNC after 60th cycle at 0.1 mV s−1; Nyquist plots after (d) 4th cycle and (e) 60th cycle of Br-PNC and Br-aPNC test and (f) 60th cycles of PNC and aPNC test.
Batteries 08 00114 g007
Figure 8. CV curves of Br-aPNC (a) measured at scan rates of 0.1–1.0 mV s−1 and log(i)–log(v) plots (b) obtained for oxidation and reduction peaks. Table in (b) contains determined b values for the peaks.
Batteries 08 00114 g008
Publisher’s Note: MDPI stays neutral with regard to jurisdictional claims in published maps and institutional affiliations.