Article

Advanced Electrochemical Impedance Spectroscopy of Industrial Ni-Cd Batteries

1
Keysight Technologies Austria GmbH, Keysight Laboratories, 4020 Linz, Austria
2
Saft AB, 57228 Oskarshamn, Sweden
*
Authors to whom correspondence should be addressed.
Batteries 2022, 8(6), 50; https://doi.org/10.3390/batteries8060050
Submission received: 22 April 2022 / Revised: 13 May 2022 / Accepted: 25 May 2022 / Published: 29 May 2022

Abstract

:
Advanced electrochemical impedance spectroscopy (EIS) was applied to characterize industrial Ni-Cd batteries and to investigate the electrochemical redox processes. A two-term calibration workflow was used for accurate complex impedance measurements across a broad frequency range of 10 mHz to 2 kHz, resulting in calibrated resistance and reactance values. The EIS calibration significantly improved the measurements, particularly at high frequencies above 200 Hz, with differences of 6–8% to the uncalibrated impedance. With an electromagnetic finite element method (FEM) model, we showed that the impedance is strongly influenced by the cable fixturing and the self-inductance of the wire conductors due to alternating currents, which are efficiently removed by the proposed calibration workflow. For single cells, we measured the resistance and the reactance with respect to the state-of-charge (SoC) at different frequencies and a given rest period. For Ni-Cd blocks that include two cells in series, we found good agreement of EIS curves with single cells. As such, EIS can be used as a fast and reliable method to estimate the cell or block capacity status. For electrochemical interpretation, we used an equivalent electric circuit (EEC) model to fit the impedance spectra and to extract the main electrochemical parameters based on calibrated EIS, including charge-transfer kinetics, mass transport, and ohmic resistances. From the charge-transfer resistance, we computed the exchange current density, resulting in 0.23 A/cm2, reflecting high intrinsic rates of the redox electron transfer processes in Ni-Cd cells.

1. Introduction

Nickel-cadmium (Ni-Cd) batteries have been gaining importance in industry as a reliable, long-life electrochemical energy storage system for various applications where critical environmental conditions are relevant. A Ni-Cd cell is comprised of a nickel-oxyhydroxide cathode, a cadmium anode, a separator, and a potassium-hydroxide electrolyte. In this work, we investigate industrial Ni-Cd cells, specifically cell type SBM112 from SAFT, which are dedicated to industrial standby applications that demand high currents in short time periods. Such applications range from engine starting, emergency lighting, switchgear, to uninterrupted power supply (UPS) applications [1,2,3]. A single Ni-Cd cell has a nominal potential of 1.2 V, and, in heavy-duty industrial applications, a power supply system can contain up to several hundreds of cells depending on the system voltage and power requirements. Ni-Cd cells are known for their high specific energy density of 40–70 Wh/kg, which is similar to lithium titanate oxide LTO batteries. Moreover, Ni-Cd cells have long cycle and calendar lives, with 3000+ cycles and 20+ years in operation without major maintenance. They show reliable performance at low temperatures, and they can sustain high discharge rates, up to 9C-rate [4,5,6]. In comparison to other cell chemistries, for instance lithium-ion batteries, Ni-Cd cells have relatively low internal resistance values and therefore can supply high surge currents which are typically required in critical industrial applications [5].
In order to investigate the Ni-Cd electrochemical redox reactions and the corresponding battery performance in more detail, we revisited Ni-Cd cells with advanced electrochemical impedance spectroscopy (EIS), including accurate calibration and equivalent circuit modelling. Based on robust EIS of cells and Ni-Cd blocks that have two cells in series, we determined the cell internal redox reaction parameters, in particular, the charge transfer kinetics, as well as the mass transport and ohmic resistances. In the past, a number of prognostic and diagnostic studies employing EIS to characterize battery performance at different operational conditions have been reported, mostly related to Li-ion battery technologies. For example, EIS is used for cell quality assessment [7], state-of-charge (SoC) and state-of-health (SoH) estimation [8,9], power fading [10], and performance evaluation [11]. Only a few studies are available in literature on the EIS characterization and SoC estimation of nickel-based chemistries, such as Ni-Cd or nickel-metal hydride (NiMH) [12,13,14,15]. In those studies, either the imaginary part of the impedance (reactance) or the real part of the impedance (resistance) was investigated, without full calibration, and only limited information could be obtained from EIS on the double-layer capacitance and the open-circuit voltage (OCV) with respect to SoC [16,17]. Here, based on calibrated EIS, we investigate both the real and imaginary parts over a broad frequency range of 10 mHz–1 kHz at different SoCs.
Moreover, a few studies showing the applicability of EIS for the performance evaluation of 50 Ah Ni-Cd cells were presented in Refs. [18,19]; the charge-transfer and double-layer capacitance parameters of low-capacity Ni-Cd cells were estimated using EIS. However, the ability of EIS to efficiently characterize a cell under test and to separate the contributions of the different cell processes largely depends on the accurate measurement of the cell impedance over a wide frequency range [20]. Therefore, we apply here a two-term impedance calibration process with a short and known resistor standard, from which we obtain error coefficients that are used to solve the error model and calibrate the system. Based on calibrated EIS measurements at different SoC, we are able to robustly characterize individual Ni-Cd cells as well as cell blocks, which then leads to accurate electrochemical redox parameters extracted from equivalent circuit models fitted to the EIS curves. The extracted parameters can serve as a robust indicator to assess the SoC or SoH of Ni-Cd cells, for example the internal resistance, charge transfer, and double-layer capacitance are typically used to estimate the SoH of the cell [17].

2. Materials and Methods

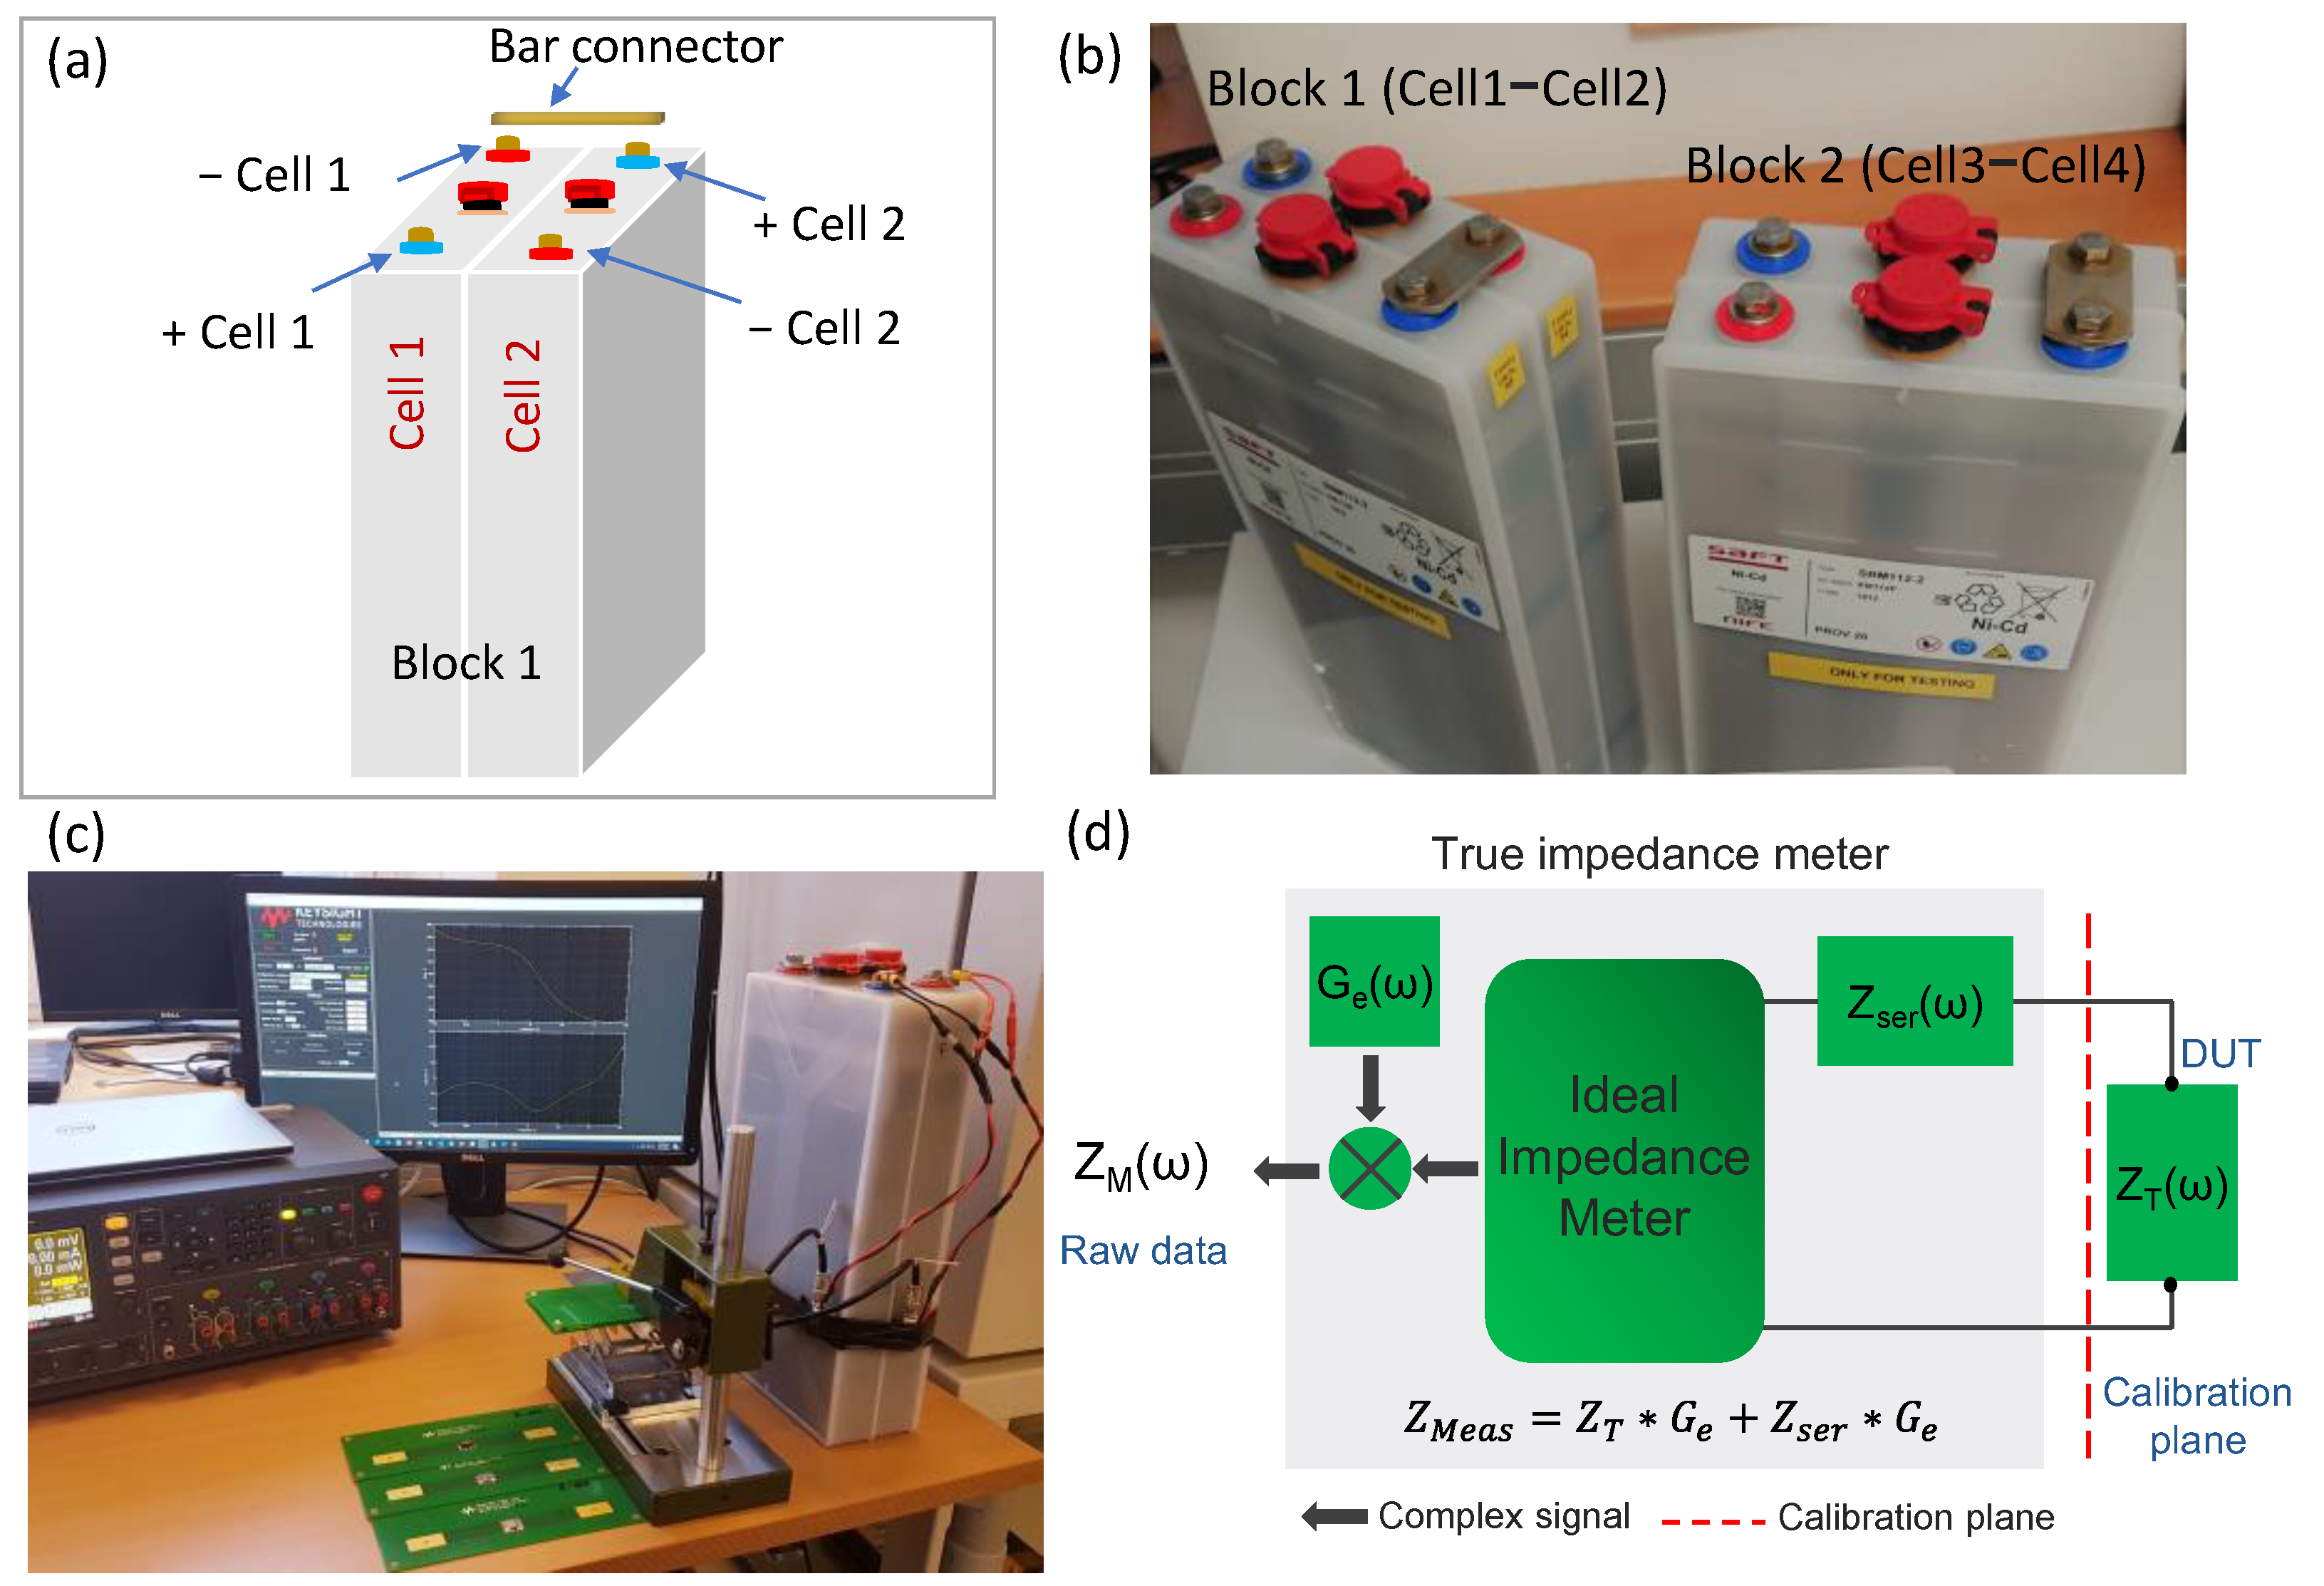
2.1. Ni-Cd Cells and Block Arrangements

Ni-Cd cells (SAFT SBM112) were used, with a cell capacity of 112 Ah per cell. The Ni-Cd cell uses nickel-oxyhydroxide as the active material for the positive plate, and cadmium for the negative plate. The electrolyte is an aqueous solution of potassium hydroxide and lithium hydroxide. A Ni-Cd block configuration consists of two identical cells connected in series with a bar connector (see Figure 1a). In total, two Ni-Cd blocks, each block having two cells, were used in the experiments (Figure 1b). The cells were newly produced and were stored for a few months.

2.2. Electrochemical Impedance Spectroscopy (EIS) and Calibration Method

The EIS setup consists of the measurement hardware and a fixture to connect to the battery under test (BUT). Figure 1c shows the DC power analyzer (Keysight N6705C) installed with two precision source and measure units (SMU; Keysight N6782A) and a PC with the software. One SMU works as the measurement channel and the second as a voltage offset channel to compensate for the cell voltage during the EIS. The 4-quadrant SMU allows one to source and sink current and has a power output rating of 20 W (±20 V, ± 3 A). Therefore, it is used to source the AC excitation signal, and to perform other processes such as charging and discharging (current sink) of the BUT. A four-wire configuration is used to connect the equipment to the BUT, where the “Force” terminal is used to source the EIS excitation current across a frequency range of 10 mHz to 2 kHz, and the “Sense” terminal is used to measure the voltage response across the cell terminals. With the low impedance levels observed for the Ni-Cd cells, current excitation mode was used (i.e., galvanostatic mode). The current amplitude was selected with relation to the cell C-rate, which is the ratio of the current and the cell capacity. Here, we applied a 3 A excitation current which corresponds to a C-rate of C/37 (cell capacity is 112 Ah), and the DC offset current was set to zero. A pair of coaxial cables is used to connect the equipment to the BUT, including safety fuse protection and ring connectors. The measured excitation current i(t) and the measured voltage v(t) signals are digitized coherently by the SMU’s built-in analog-to-digital converter (ADC). The circular excitation frequency ω = 2πfsig is swept within a defined frequency range and the signals are then transformed into the frequency domain by a discrete Fourier transform (DFT) process. The resulting complex signals I(ω) and V(ω) are then used to compute the complex raw impedance Z(ω)raw = V(ω)/I(ω).
Figure 1d shows the systematic error model of the EIS measurement. To model the true impedance, an ideal impedance meter is combined with the series error impedance Zser and the gain error term Ge. The measured impedance ZM is given by the following equation:
Z M = Z T × + Z ser × G e ,
where ZT is the true impedance, and Zser and Ge are the error coefficients. The two error coefficients Zser and Ge are determined in a calibration process where at least two different known calibration standards are measured. Here, we use one short and one 10 mΩ shunt standard. Once the error coefficients are known, the true impedance can be calculated by transforming Equation (1) into the following form:
Z T = Z M G e Z ser .
After applying calibration and correction of the EIS data (see Results section for more details), the end results are visualized either in the complex plane as the real part of the impedance versus the imaginary part, known as a Nyquist plot, or by plotting the real and imaginary parts separately as a function of frequency. For the measurements, a BUT was kept resting at a stable temperature and EIS was conducted at several state-of-charge (SoC) with 30 min rest period intervals. The excitation current was set as 3 A (peak signal) and a logarithmic ascending frequency sweep was applied from 10 mHz to 1 kHz while measuring nine points per decade. The SoC of a cell was estimated based on the cell capacity. For this, a cell was first fully discharged to the lower voltage limit; afterwards, the cell was rested for 3 h to achieve a steady state and EIS was conducted. Incremental steps of 10% SoC were performed using the Advanced Power System (Keysight N7950A), a 2-quadrant module with a power output rating of 1 kW (9 V, 100 A). An upper voltage limit of 1.41 V per cell was set, and the charging DC current was gradually increased up to 11 A (C/10), and the BUT was charged for one hour for each 10% SoC step. Afterwards, EIS was performed at each SoC after a fixed 30 min rest period for reaching equilibrium. For the EIS interpretation and parameter extraction, we use an equivalent electric circuit model representing the main electrochemical mechanisms in the battery (see Results section). In the model identification process, the numerical values of all the parameters of each element in the model are determined. Thereby, the pure ohmic resistances are obtained directly from the fitted circuit elements, such as the solution resistance Rsol and the charge transfer resistance Rct. The double-layer capacitance Cdl is derived from the constant phase reactance CPEdl as follows [21,22]:
C dl = 1 Z CPE ( j × ω ) p
where j is the imaginary unit, ω is the angular frequency, and P is the fractional order. The diffusion resistance Rdiff is obtained from the Warburg impedance Zdiff by the following relation:
R diff = Z diff × ( j × K × ω ) P coth [ ( j × K × ω ) P ]
where K = L2/D, L is the length of the diffusion, D is the diffusion coefficient, and the fractional-order P is set as 0.5.

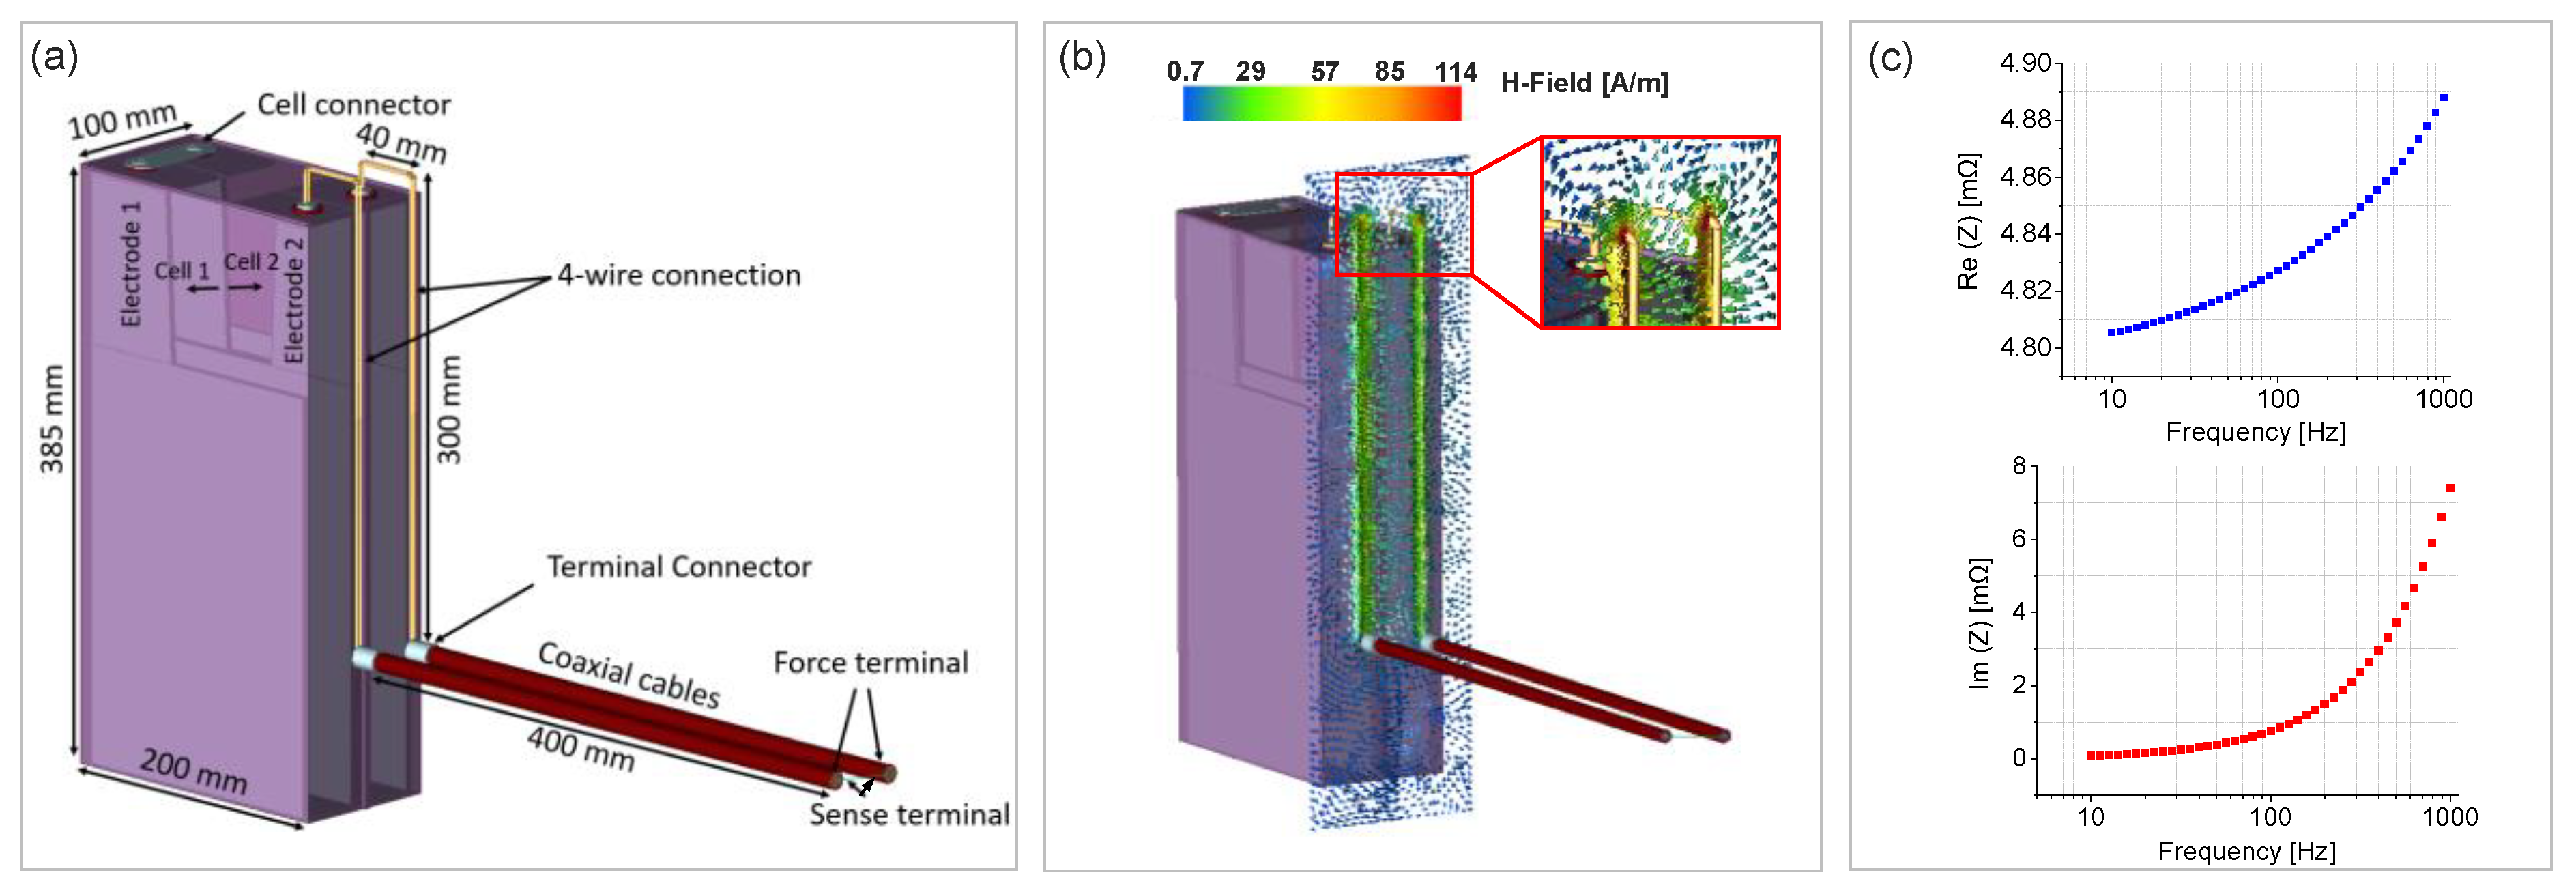
2.3. Electromagnetic Finite Element Method (FEM) Modeling

The battery block, the cable, and the fixture are modelled in order to investigate the broadband frequency characteristics. A 3-D electromagnetic (EM) finite element method (FEM) modelling software was used (EMPro; Keysight Technologies) [23,24]. Figure 2a shows the 3-D computer-aided design (CAD) of the battery block and the cable fixture, including the geometric dimensions. A tetrahedron mesh is generated with dimensions corresponding to the frequency requirements, and an average aspect ratio ≥ 0.7 was considered. The two cells in the block are connected in series through a metallic cell connector.
According to the EIS measurements, a four-wire connection is designed from the excitation source to the cell terminals. The force-terminal is used as source in the excitation current while the sense-terminal is used to measure the voltage. The CAD is simulated on a broad frequency range from 10 Hz to 10 kHz, with a 3 A excitation current, resulting in the real and imaginary impedances. Planar sensors are applied around the wires to measure the magnetic field strength, and a wire length of 100 cm is used. Figure 2b shows the 3-D FEM simulation results of a Ni-Cd block connected to the fixture via four-wire connections, and the magnetic field distribution across the connecting wires. The simulated real impedance (resistance) and the imaginary impedance (reactance) are shown in Figure 2c for the frequency range of 10 Hz to 1 kHz. Both resistance and reactance show an increasing trend along with the frequency, especially at frequencies above 100 Hz. The magnetic field created by the alternating current in the circuit induces a voltage in the same circuit, known as self-inductance, affecting the imaginary impedance [25]. Consequently, the circulating eddy currents, due to the magnetic field, reinforce the current to the wire skin, resulting in an increase of the resistance with higher frequency.

3. Results and Discussion

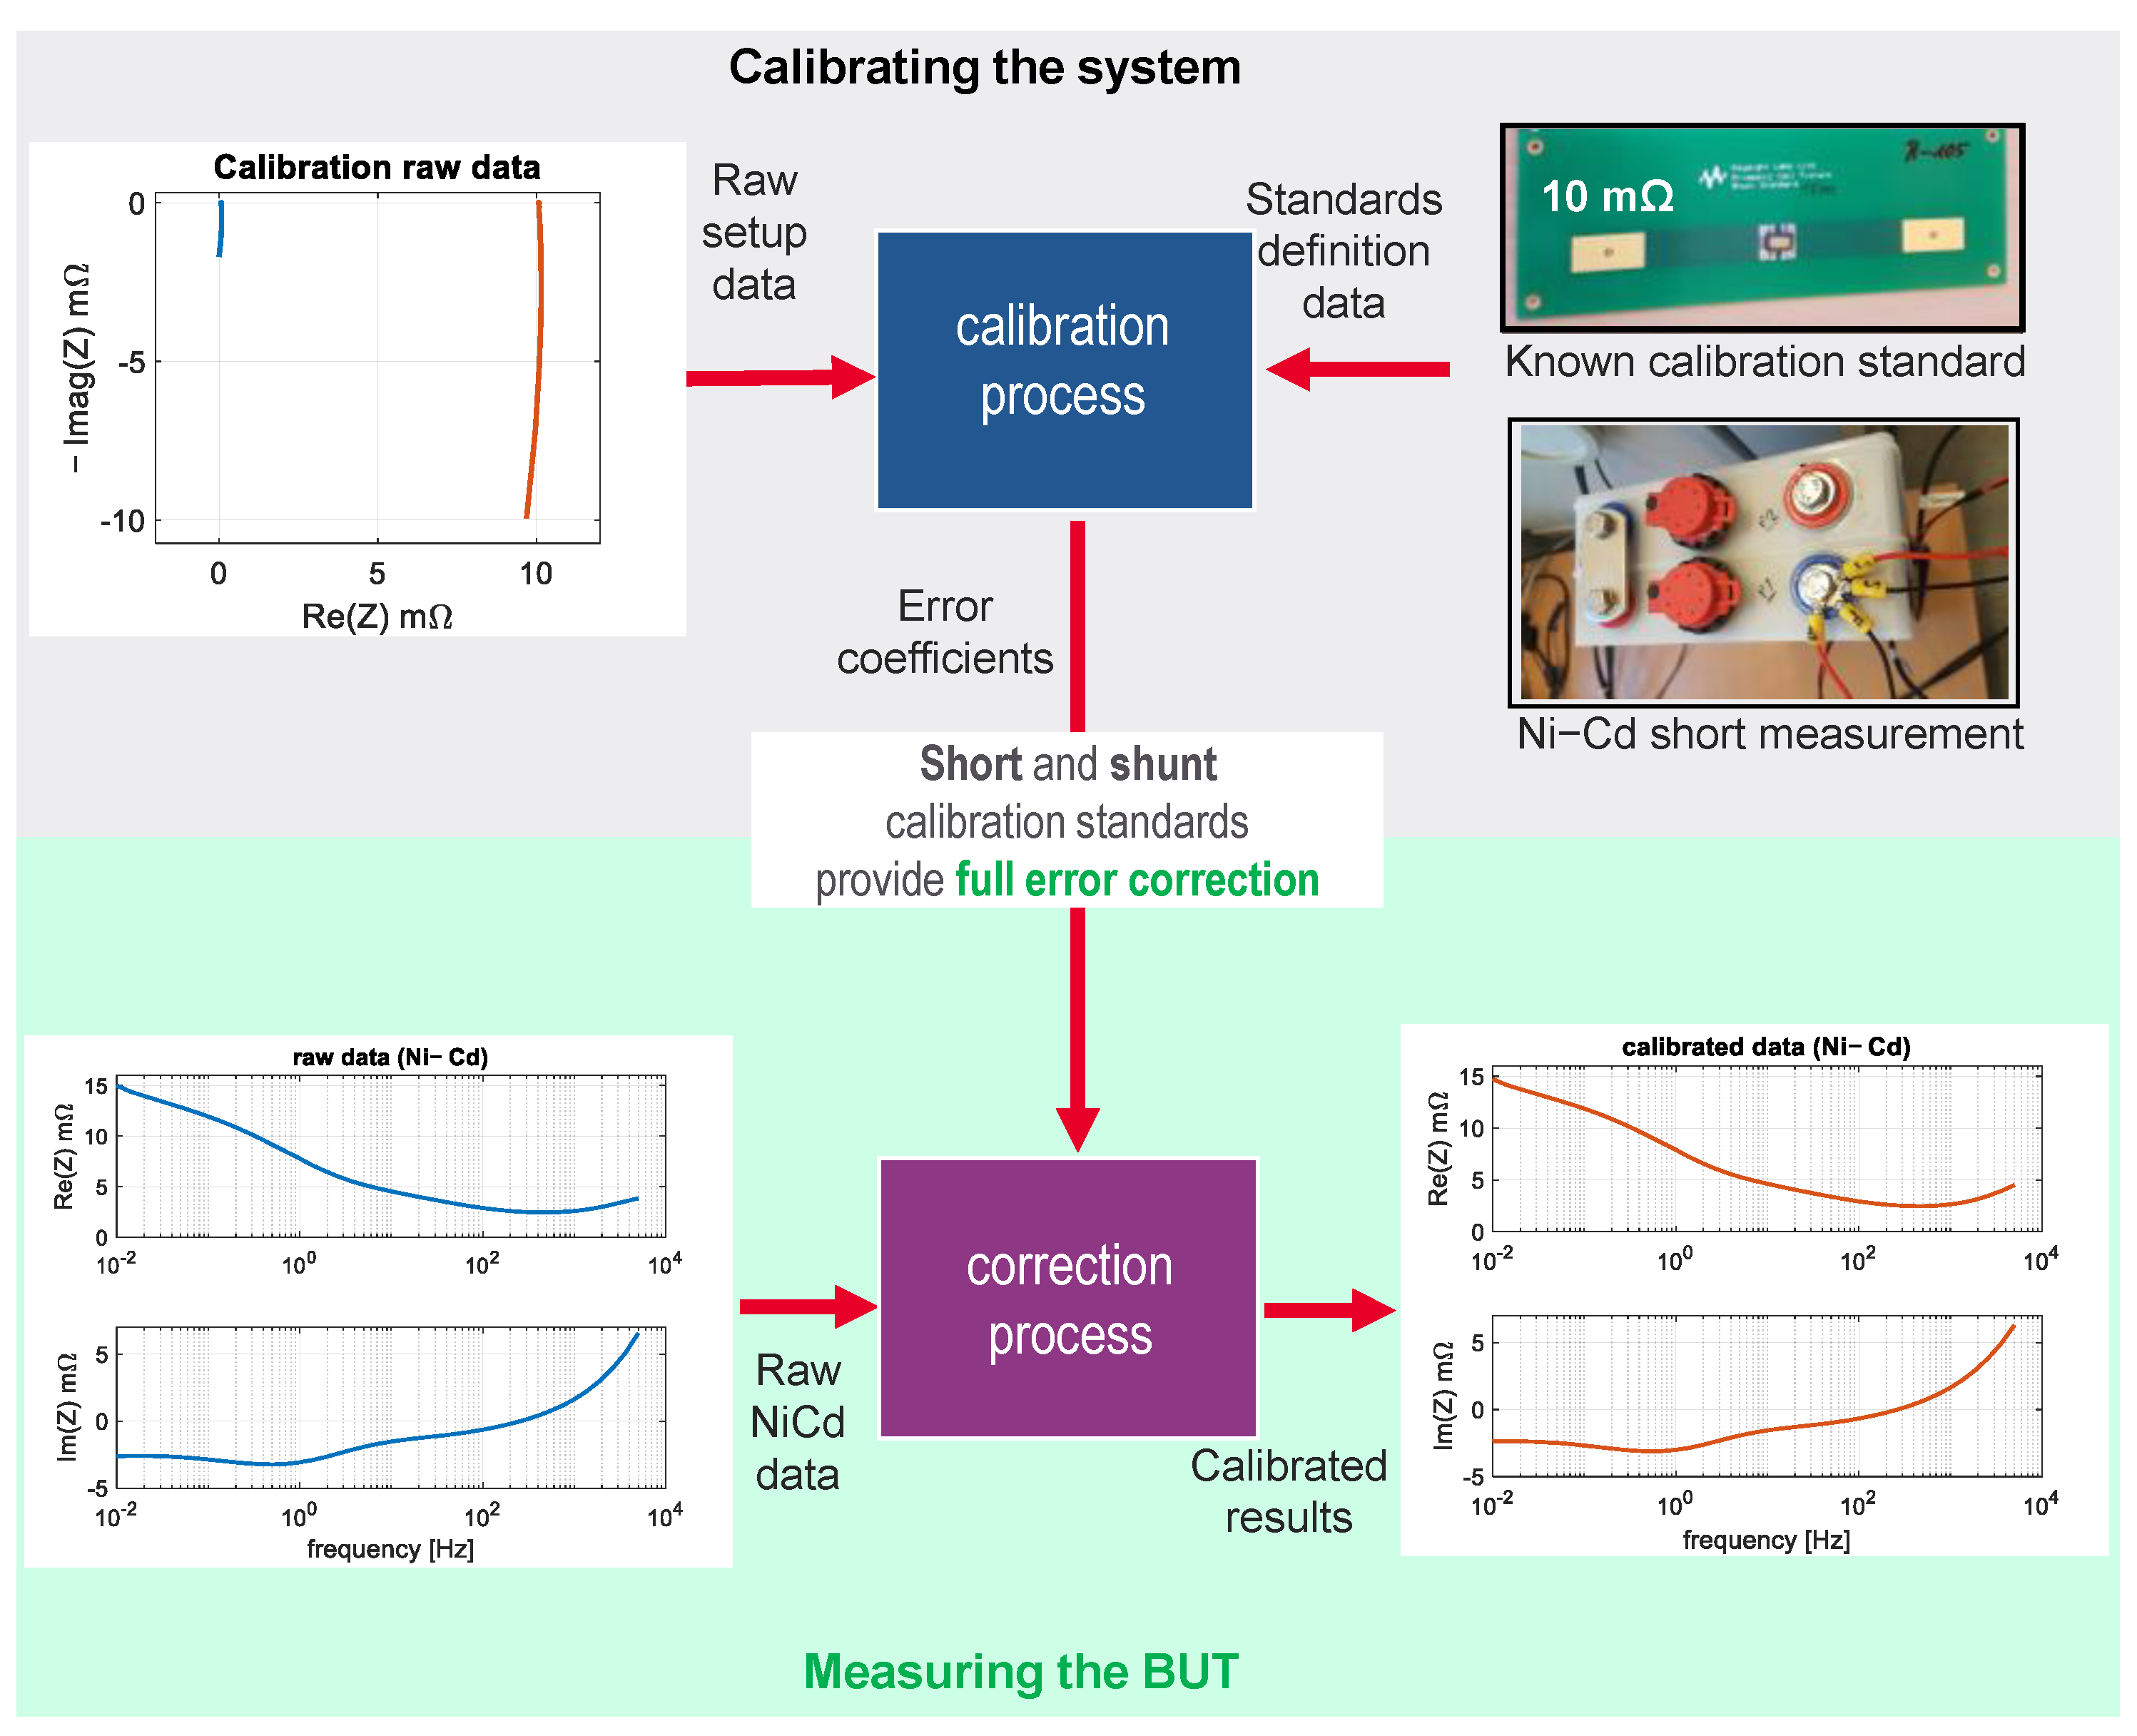
3.1. EIS Calibration Method

The accuracy of EIS measurements is limited by systematic and random errors, the former of which can be corrected by calibration and correction methods [20,23,26]. Here, we apply a two-term calibration process, which includes a short and a resistor of known resistance and inductance values. The short is measured directly at the negative electrode terminal of the battery under test (BUT), and the printed circuit board (PCB) calibration standard is measured at the BUT measurement plane. The calibration measurements are used together with their standard definition data in the calibration process to obtain the error coefficients. Once the BUT is measured, the raw data are used together with the error coefficients in the correction process to obtain the calibrated EIS results. The mathematical description of the calibration is shown in the Methods section and the true impedance of the BUT (ZT) is obtained by Equation (2).
Figure 3 shows the calibration (upper part) and correction (lower part) workflows. A short is measured at the negative electrode and the known impedance standard is measured (10 mΩ shunt) to solve the error model for the frequency-dependent error coefficients. The short and shunt calibration standard provide the error correction, and the error coefficients are used in the correction process to calibrate the raw BUT EIS data or a single Ni-Cd cell measured from 10 mHz to 5 kHz at room temperature (23 °C). Significant differences are observed between the raw and calibrated EIS data, particularly for frequencies above 200 Hz. For the real part (resistance), we obtain a difference of 8%, which is related mostly to ohmic resistances from cable fixtures and cell connectors. For the imaginary part (reactance), the difference between calibrated and uncalibrated results is 6%, which is mostly related to induced voltage in the circuit and the related inductive effects.

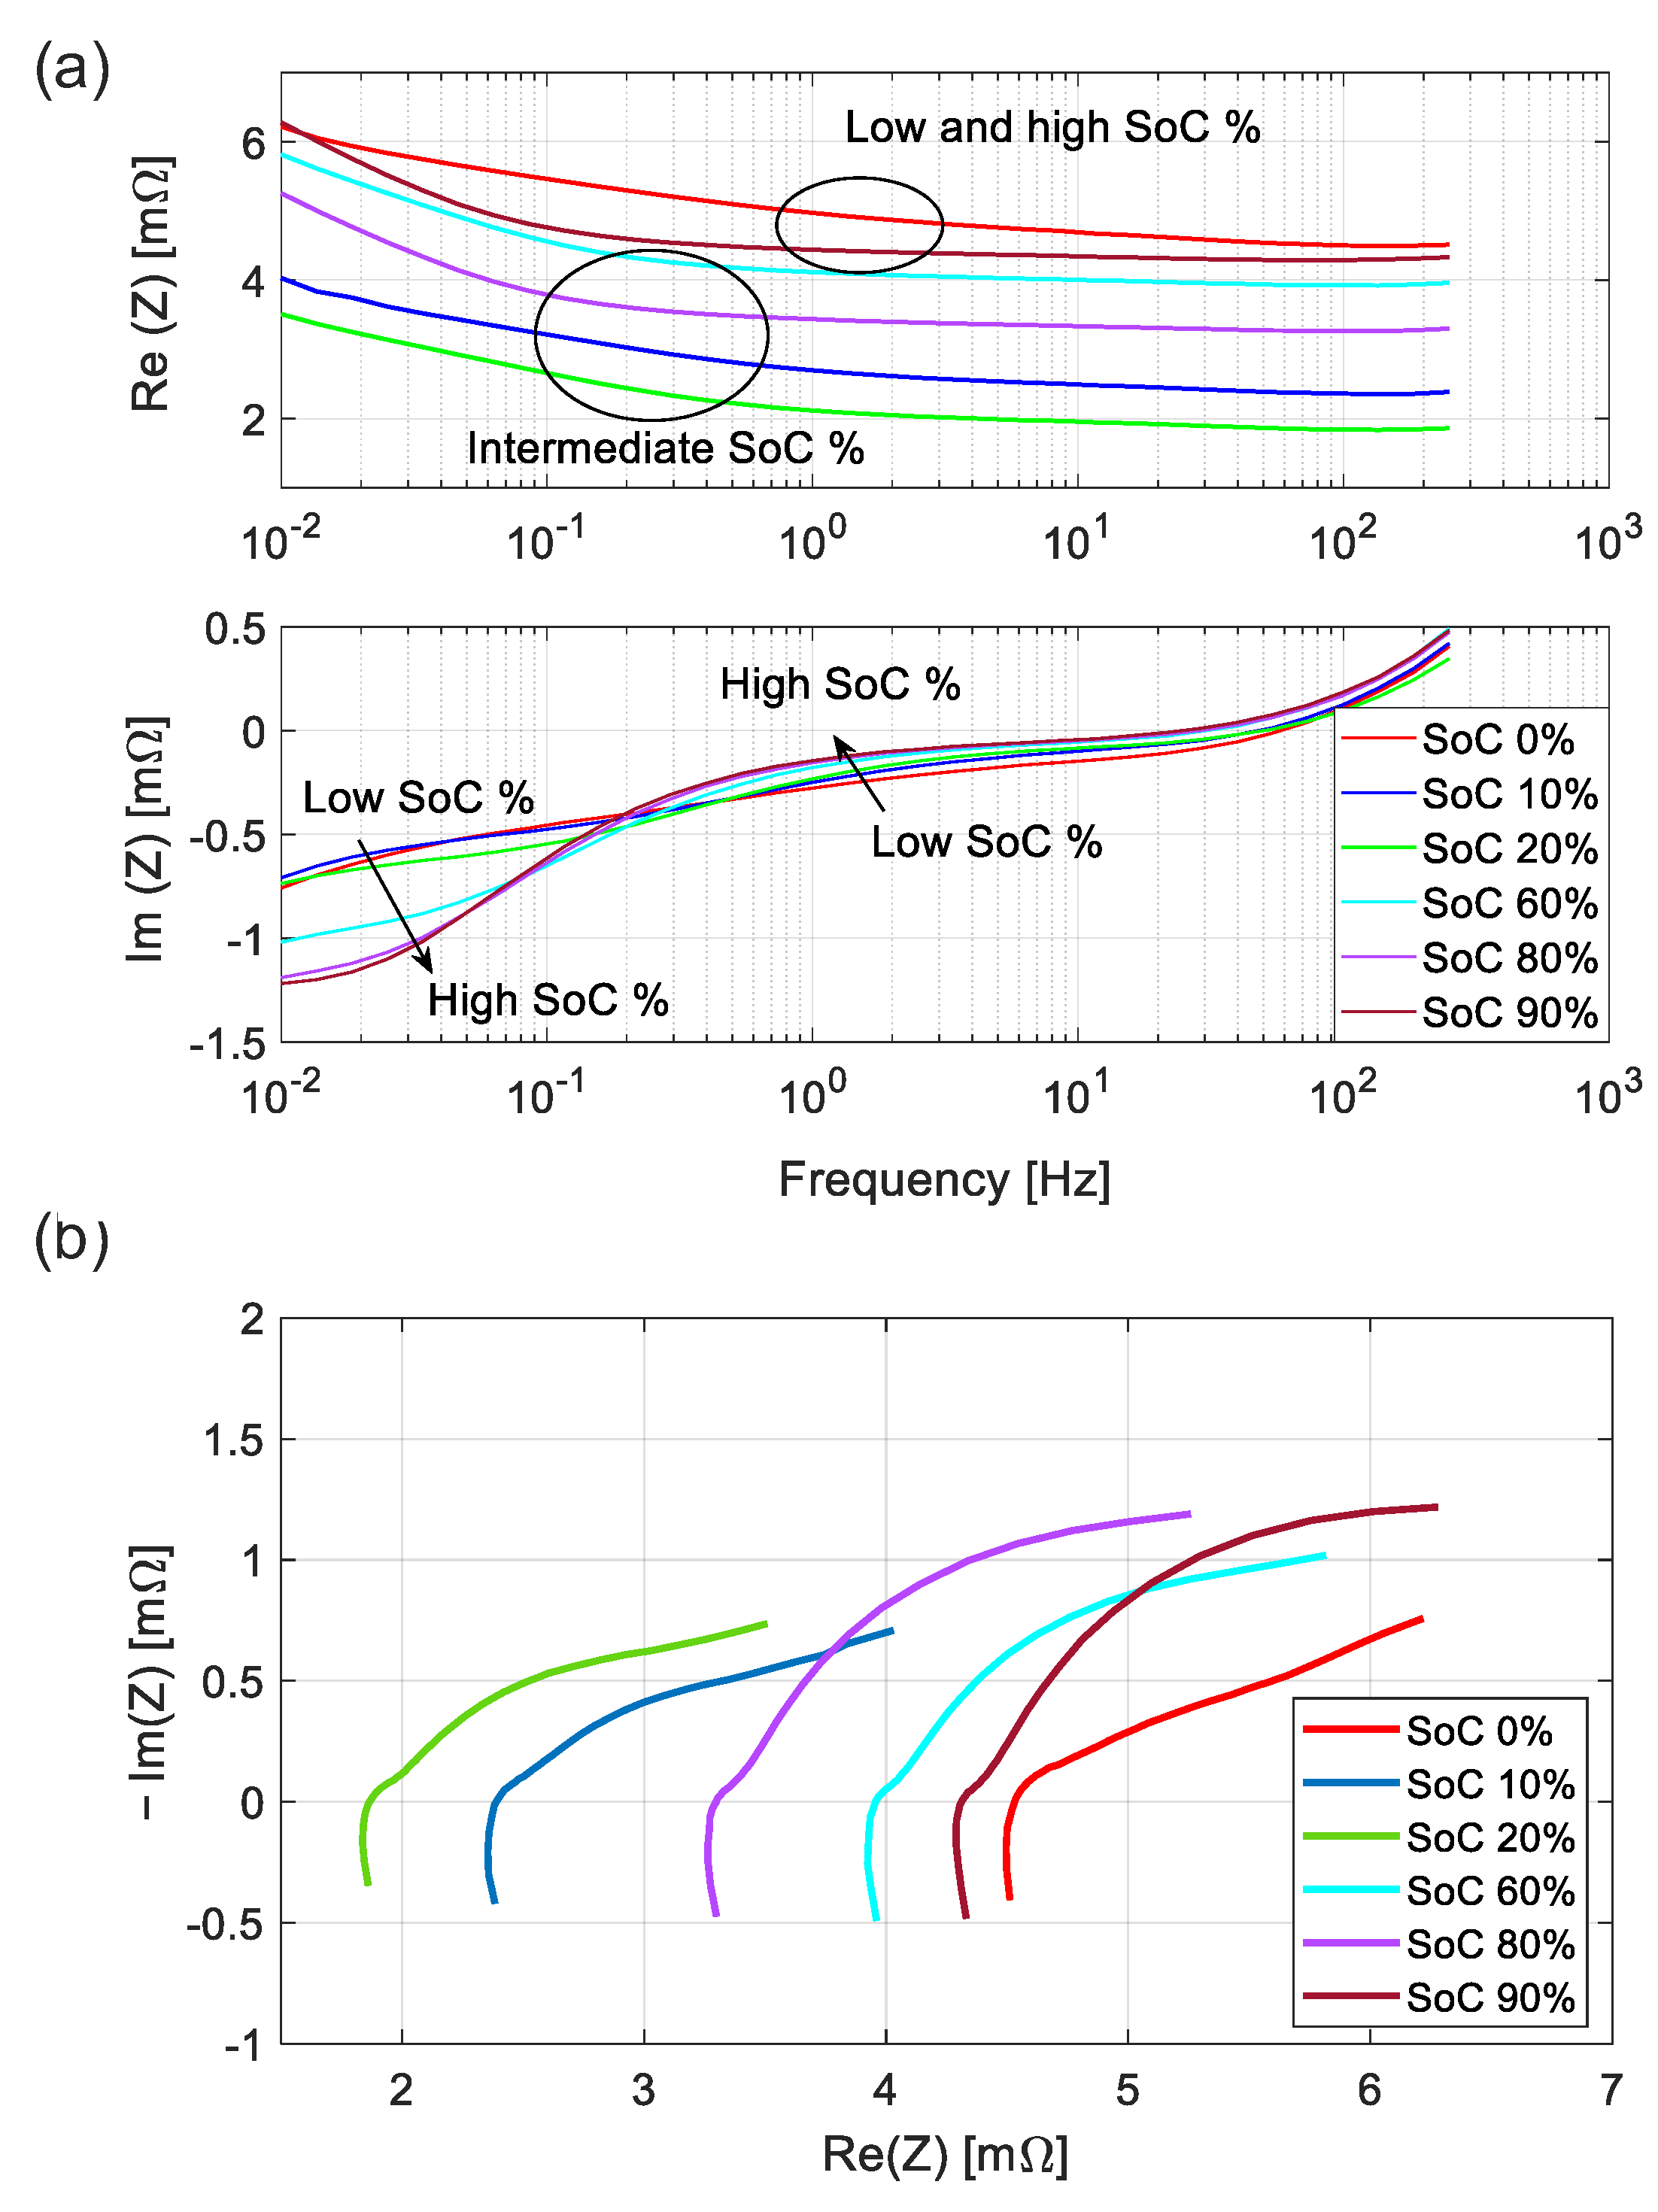
3.2. Calibrated EIS versus SoC

In Figure 4, we show the calibrated EIS results of the Ni-Cd Cell 1 at different state-of-charge (SoC), with the SoC ranging from 0% to 90%. In order to maintain similar equilibrium states of the cell [27], EIS was conducted at each SoC step while maintaining a fixed 30 min rest period. The real part of the impedance (resistance) and the imaginary part of the impedance (reactance) are shown separately in Figure 4a, and in a Nyquist plot in Figure 4b, for the frequency range of 10 mHz to 500 Hz. There are two trends visible in the real part of the impedance. Firstly, the resistance decreases slightly with the frequency. Secondly, and more relevantly, the resistance is correlated with the SoC [19]. For instance, at low and high SoCs, the resistance is higher in comparison to intermediate SoCs, especially at intermediate frequency values ranging from 0.1 Hz to 10 Hz.
Similar trends were observed in previous studies, with exact quantitative values depending on the exact cell chemistry, the cell capacity, and the cell design. For instance, Bundy et al. studied the influence of SoC on the resistance of a 2.4 Ah Ni-Mh cell, where a decrease in the resistance was reported with increasing SoCs, except at 100% SoC, where the resistance increased again [14]. Sathyanarayana et al. also observed U-shape behavior of the resistance versus SoC on a 4 Ah Ni-Cd cell, with relatively higher resistance values at low SoCs [13]. This trend has been interpreted as being due to an increase in the ohmic resistance of the electrolyte and the reduction of hydrogen ions and water in the electrolyte during discharge [28,29]. Additionally, the reactance shows more complex behavior with respect to SoC and frequency. At low frequencies, the reactance decreases with higher SoC, while at higher frequencies, the reactance increases with increased SoC. At the intermediate frequency point around 0.4 Hz, the reactance curves overlap, resulting in the same reactance value for all SoC curves. Olarte et al. reported recently, on a SAFT SBM112 cell, similar behavior of the imaginary part; however, only the equivalent circuit CPE parameters extracted from the EIS data at intermediate frequencies were shown [17]. Olarte et al. argue that the OCV behavior over SoC could be suitable to evaluate the SoC of NiCd cells, as it shows a linear trend and is independent of the SoH. Moreover, it is worth mentioning that the resting time of a cell between the charging steps and the measurements has a significant influence on the results; therefore, we fixed the rest period lengths to a given value, here 30 min [30]. Overall, the relation of the impedance with the SoC can be used to estimate the cell capacity status, with a relatively fast EIS measurement combined with the OCV information of the cell.

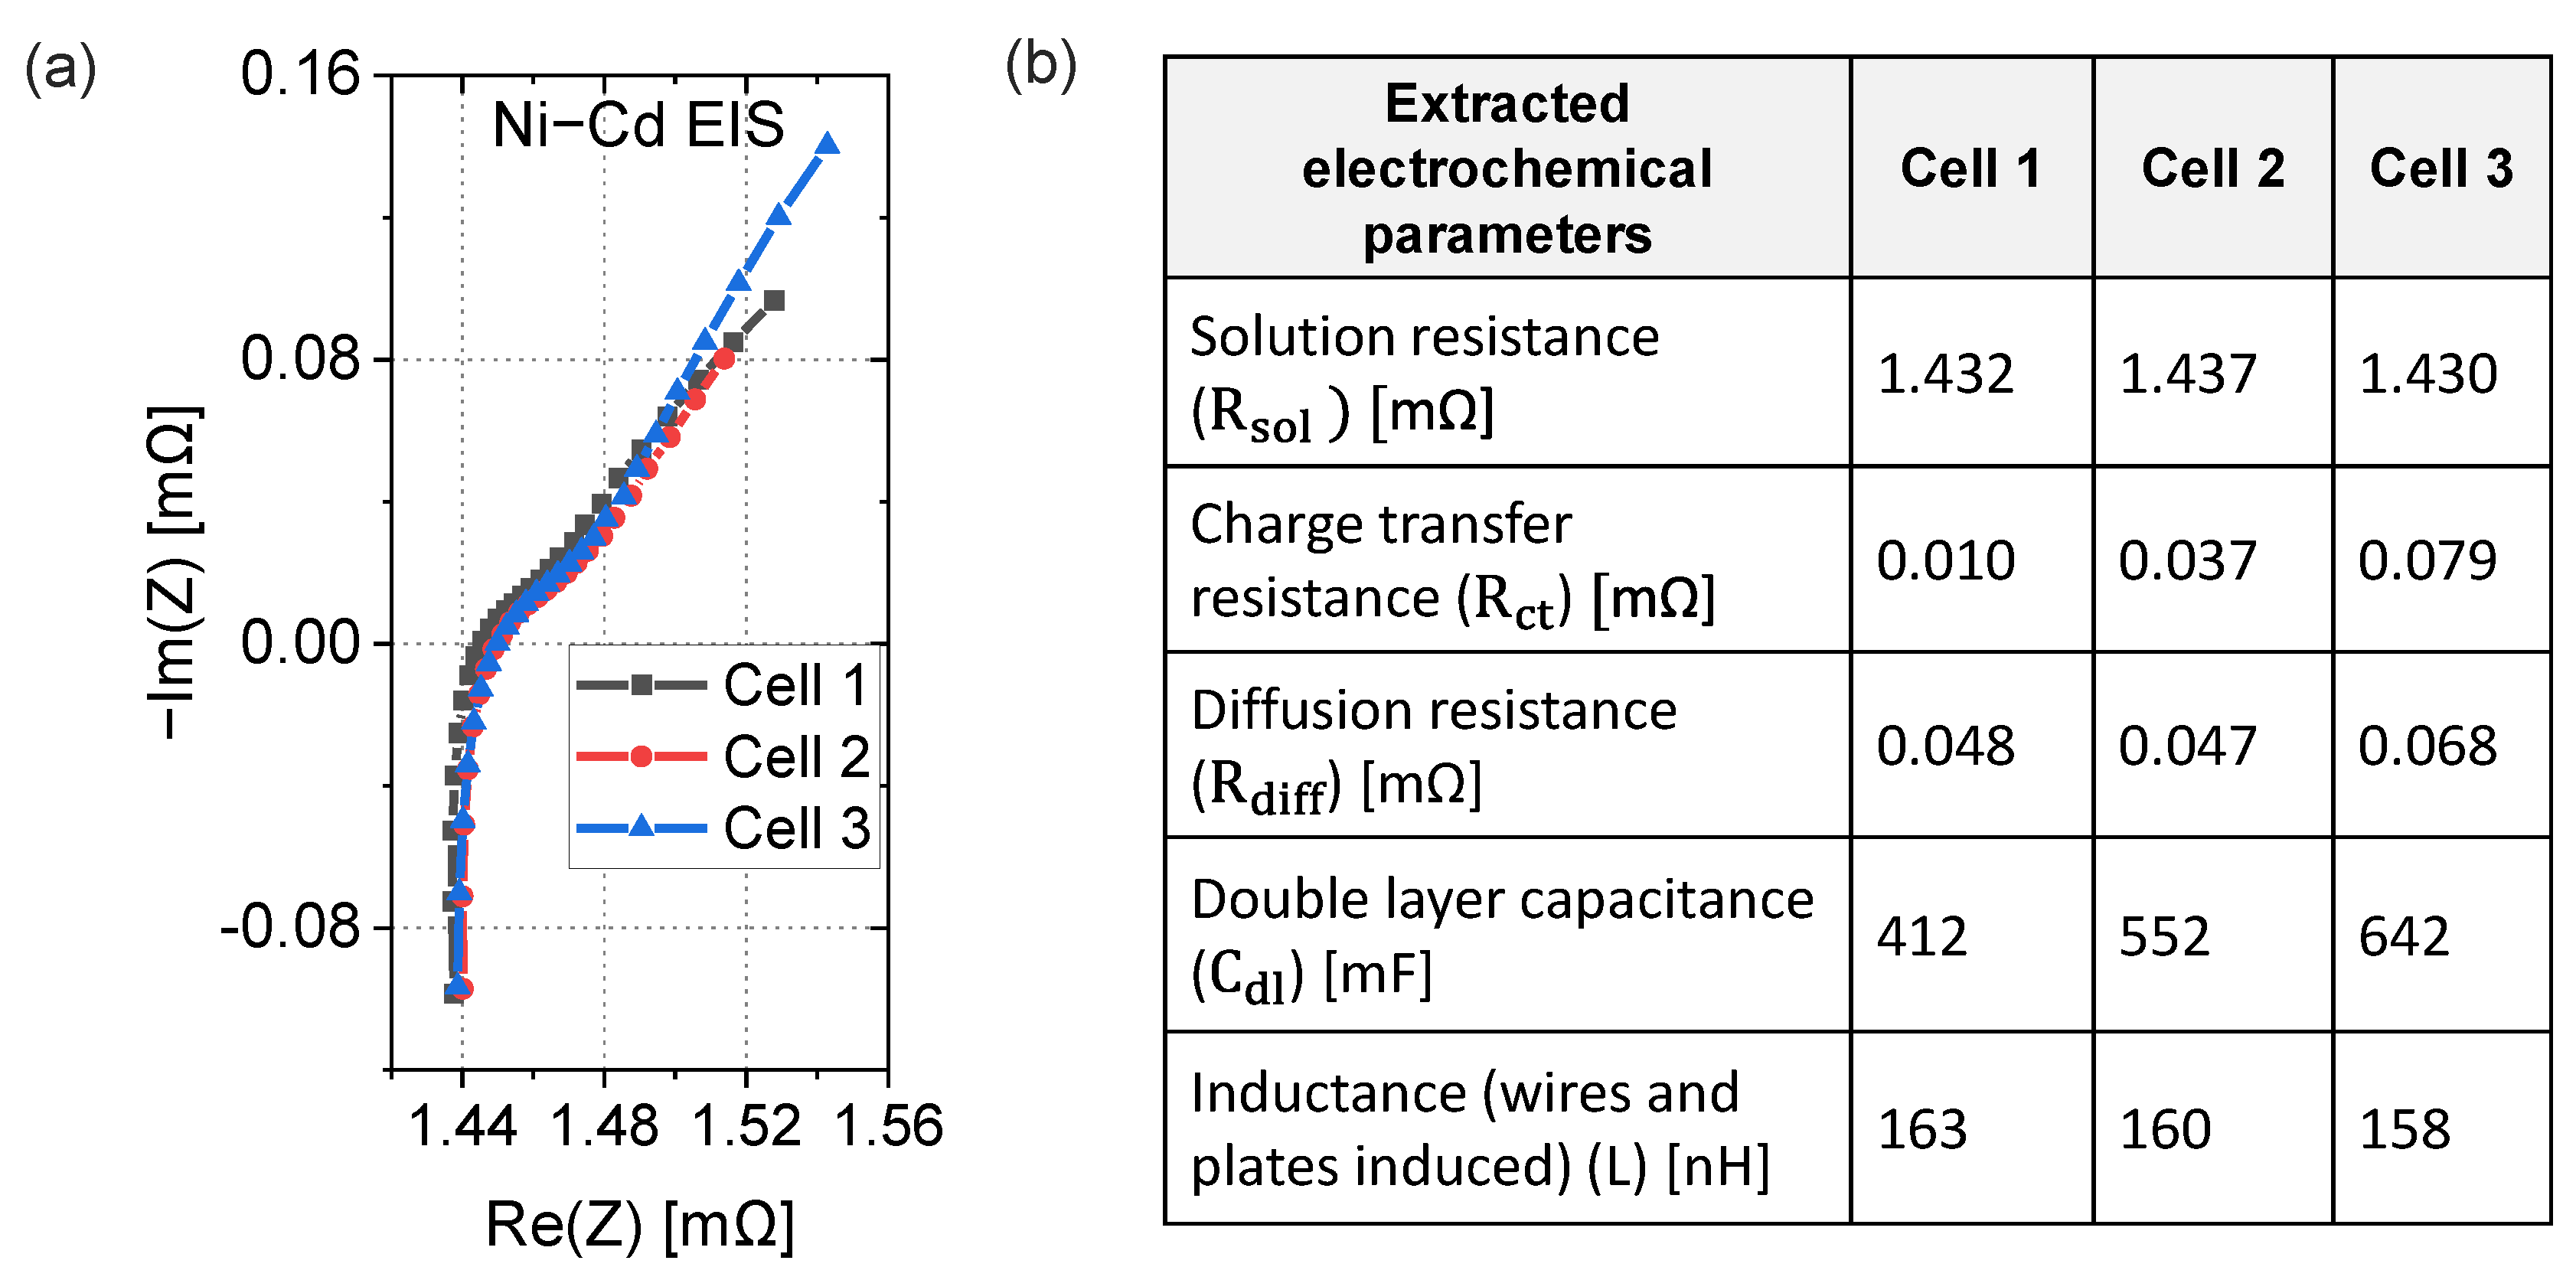
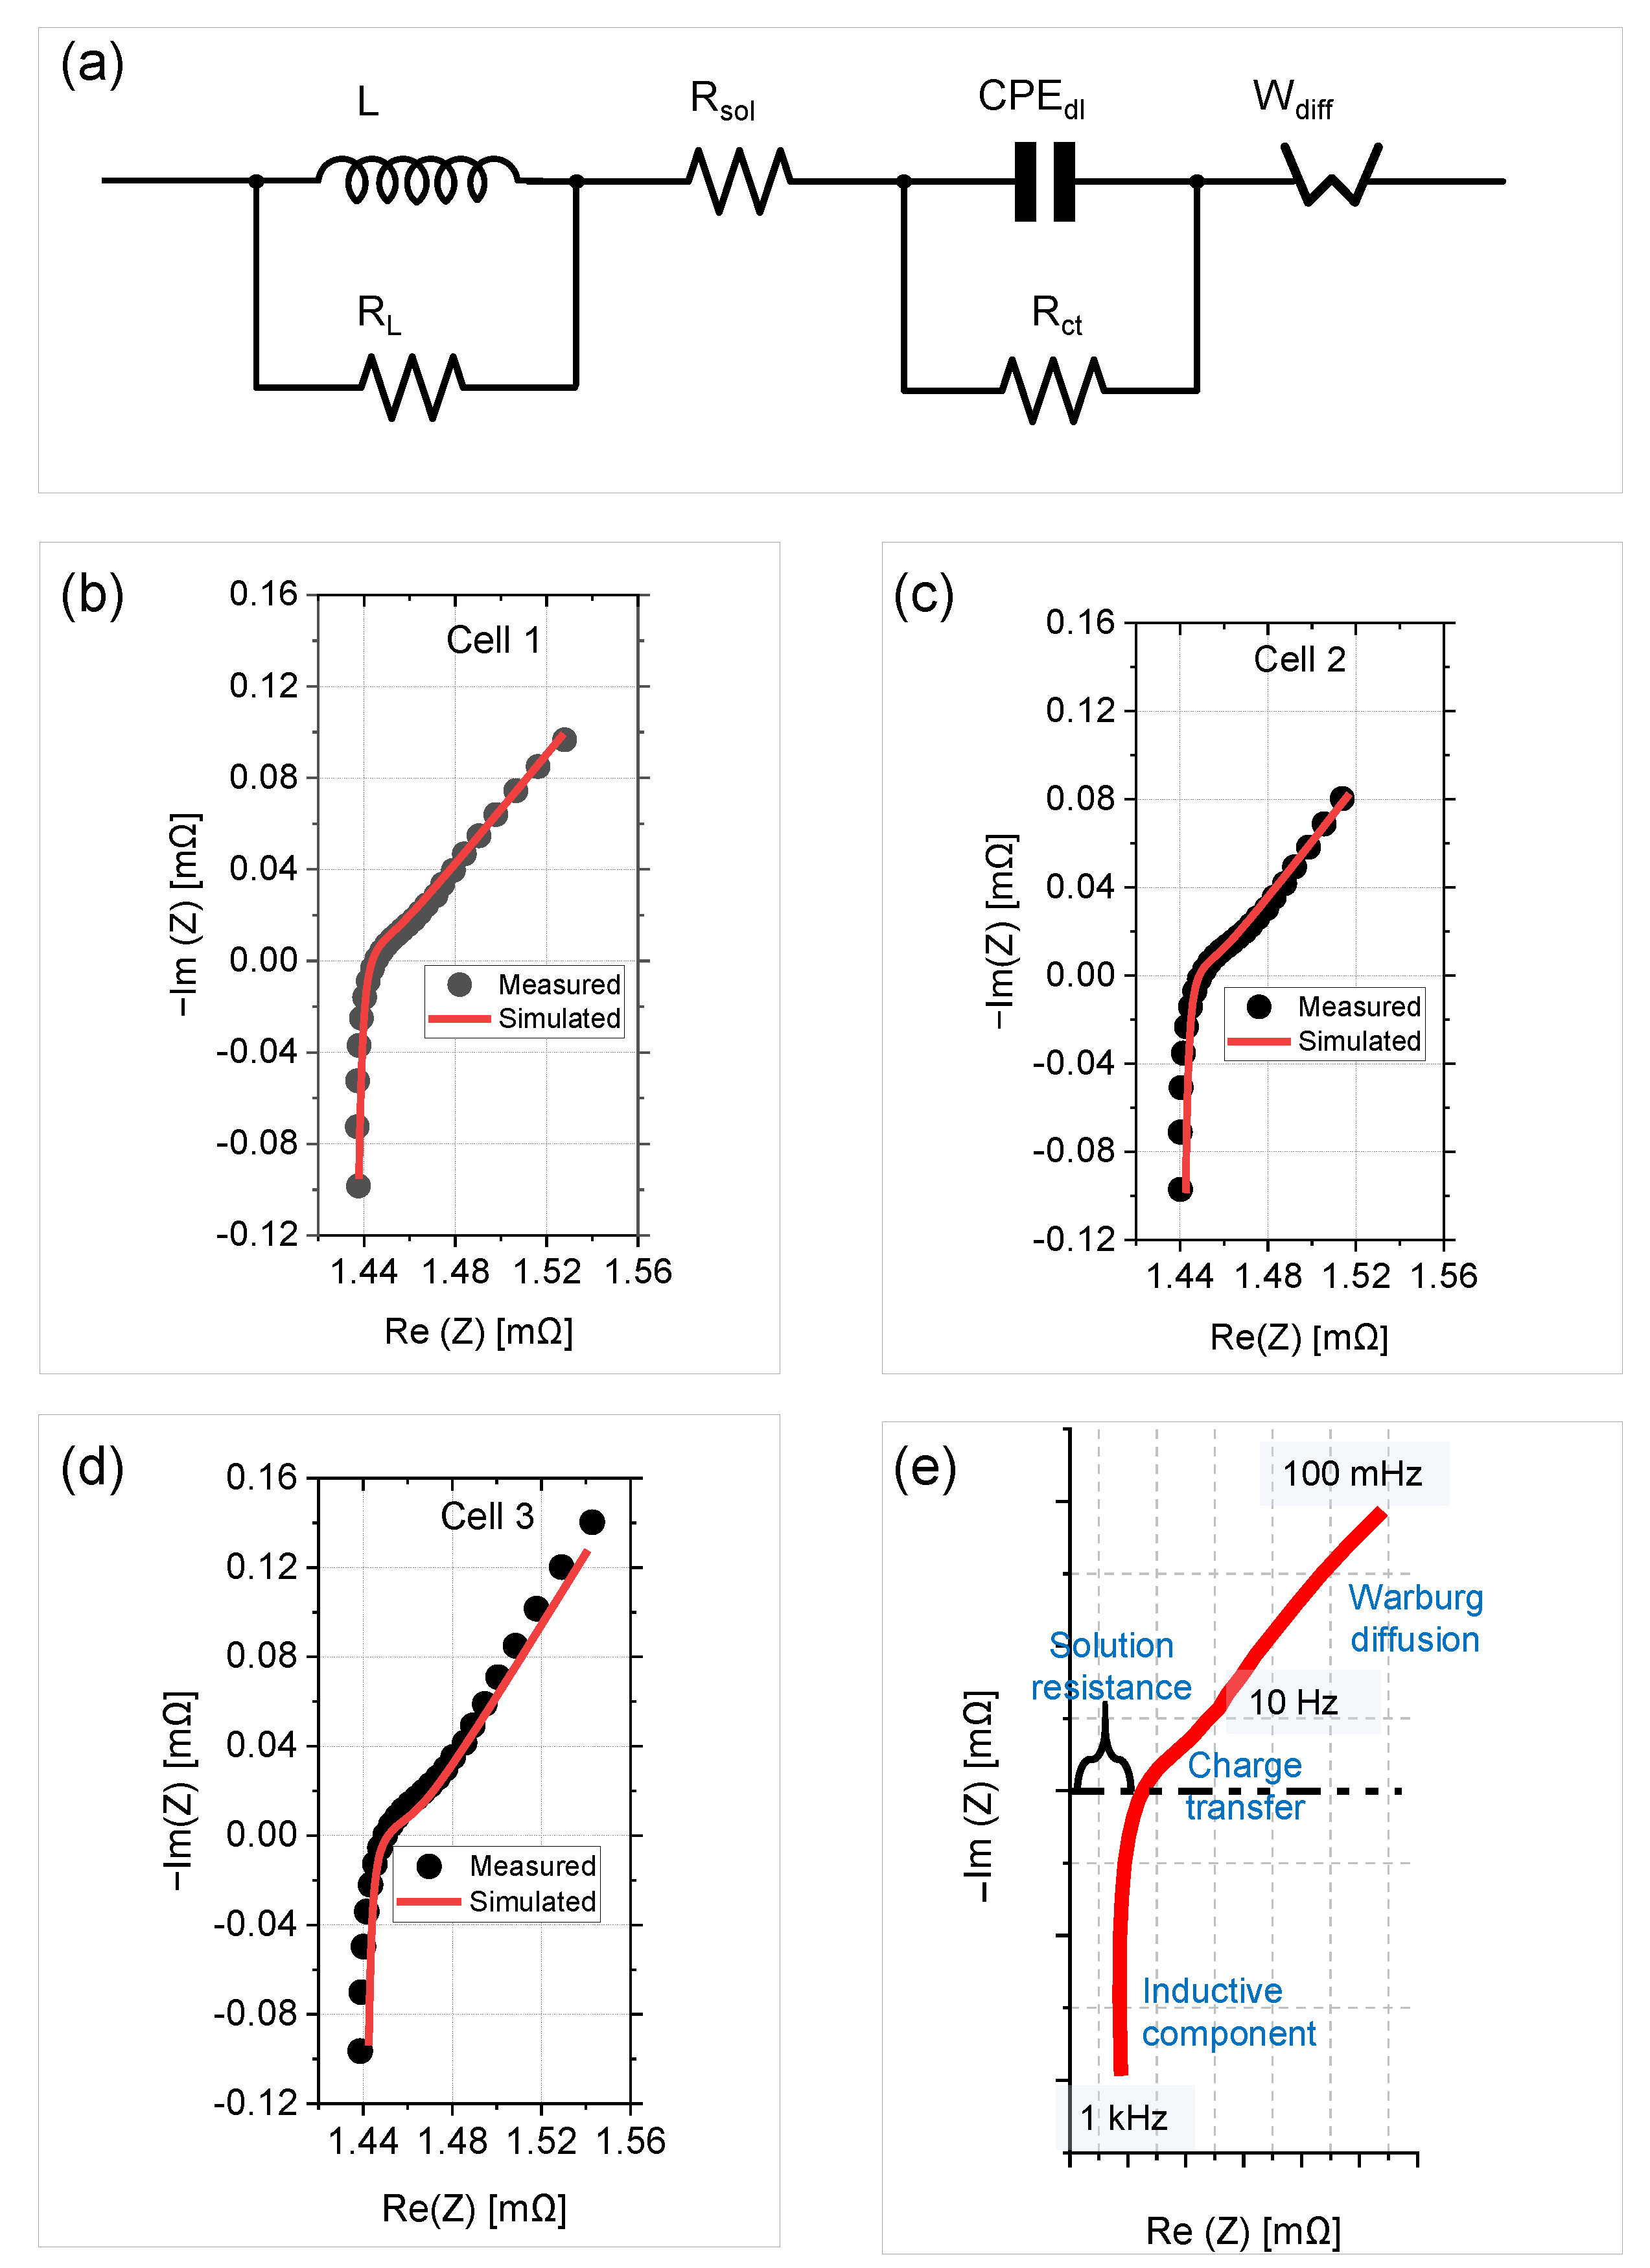
3.3. Equivalent Electric Circuit Model and Fit Parameters

The impedance spectrum of the Ni-Cd cell can be represented with an electrical equivalent circuit (EEC) model; see Figure 5a. We used an extended Randles circuit consisting of four elements, which are from left (high-frequency) to right (low-frequency), an inductive element [L/RL], a solution resistance element Rsol, a ZARC element [Rct/CPEdl], and a Warburg diffusion element (Wdiff). The constant phase element (CPE) is used because of the porous nature of the electrodes and adsorption capacitances [31,32], while the inductive element is included to model the physical arrangement of the cell plates and connectors. From this Randles circuit, the following equation is used to obtain the impedance of the “battery under test” (BUT), ZBUT:
Z BUT = [ R L / ( 1 + R L / j ω L ) ] + R sol + [ R ct / ( 1 + ( j ω / ω c ) α ) ] + Z diff
where j is the imaginary unit, ω is the angular frequency, ωc is the characteristic angular frequency of the CPE, α is the fractional order of the CPE, L is the inductance, and Zdiff is the impedance of the Warburg diffusion.
Several configurations of electric circuit models have been applied in literature for EIS fitting to describe the electrochemical mechanisms in the battery. For Ni-cell chemistries, the impedance of one electrode is typically several orders of magnitude higher than the other; therefore, one RC loop can represent essentially the impedance of the dominant electrode, e.g., for the charge transfer processes [18]. A single RC circuit was similarly considered for the analysis of fresh NiMH cells, while a CPE capacitor was chosen in order to correct for the inhomogeneity in the distribution of charge in the electrodes [28,29]. Figure 5b–d show the Nyquist plots of the EIS experiments and the fitted Randles circuit for Cell 1, Cell 2, and Cell 3, respectively. For accurate EEC fit of electrochemical and double-layer kinetics, the frequency range of 100 mHz–1 kHz was considered in order to maintain a separate fit of the double-layer RC loop (i.e., semi-circle in the Nyquist plot) and the diffusion tail represented by the Warburg element. For the EIS, three NiCd cells were discharged to 0% SoC and charged up to 10% SoC, and afterwards, the cells were stored for 4 weeks at an open circuit state. In comparison to the SoC-EIS results shown in Section 3.2, a lower impedance value was observed at 10% SoC (e.g., for Cell 1, blue curve), which is most probably due to the long storage period of the cells. Overall, the results show good agreement between the measured and the fitted EIS data across the frequency range of 100 mHz to 500 Hz. The EIS spectra exhibit only one depressed semi-circle at intermediate frequencies, related to the double-layer capacitance and charge transfer kinetics. Such characteristics are typically observed for fresh cells, whereas a larger depressed semi-circle is typically observed for aged cells. The interpretation of the EIS is shown in Figure 5e, where the different regions of the Nyquist plot, corresponding to different frequencies, are related to electrochemical processes. Starting with high frequencies and going to lower frequencies, the inductive part is represented by the linear tail on the left side of the Nyquist plot, followed by the solution resistance Rsol as identified by the intersection point of the impedance curve with the x-axis. At intermediate frequencies, the charge transfer resistance and the double-layer capacitance are shown as a depressed semi-circle. At low frequencies, the diffusion tail is obtained on the right part of the Nyquist plot.
Figure 6 shows a superimposition of the measured EIS data of the three cells, as well as the extracted parameters from the curve fits. The solution resistance Rsol shows very similar values for the three cells, with an average of Rsol = 1.433 mΩ. Due to the depressed semi-circle and the corresponding fit errors, the charge transfer resistance Rct values differ significantly. An average value of Rct = 0.042 mΩ is obtained, with a significantly higher value for Cell 3, which is sourced from Block 2, while Cell 1 and Cell 2 are from Block 1. Similarly, the diffusion resistances Rdiff of Cell 1 and Cell 2 are very similar, while Rdiff of Cell 3 is higher, which can be, for instance, due to small differences in the SoC leading to faster electrode kinetics [33]. Lastly, the inductance values L are very similar for all three cells because the inductance is related to the geometry of the cell and electrode plates, which is very similar for Block 1 and Block 2. Thereby, it is noted that the imaginary part of the impedance is dominated by the diffusion resistance, whereas the internal resistance is dominated by the resistance of the solution resistance, which agrees with literature observations [13].

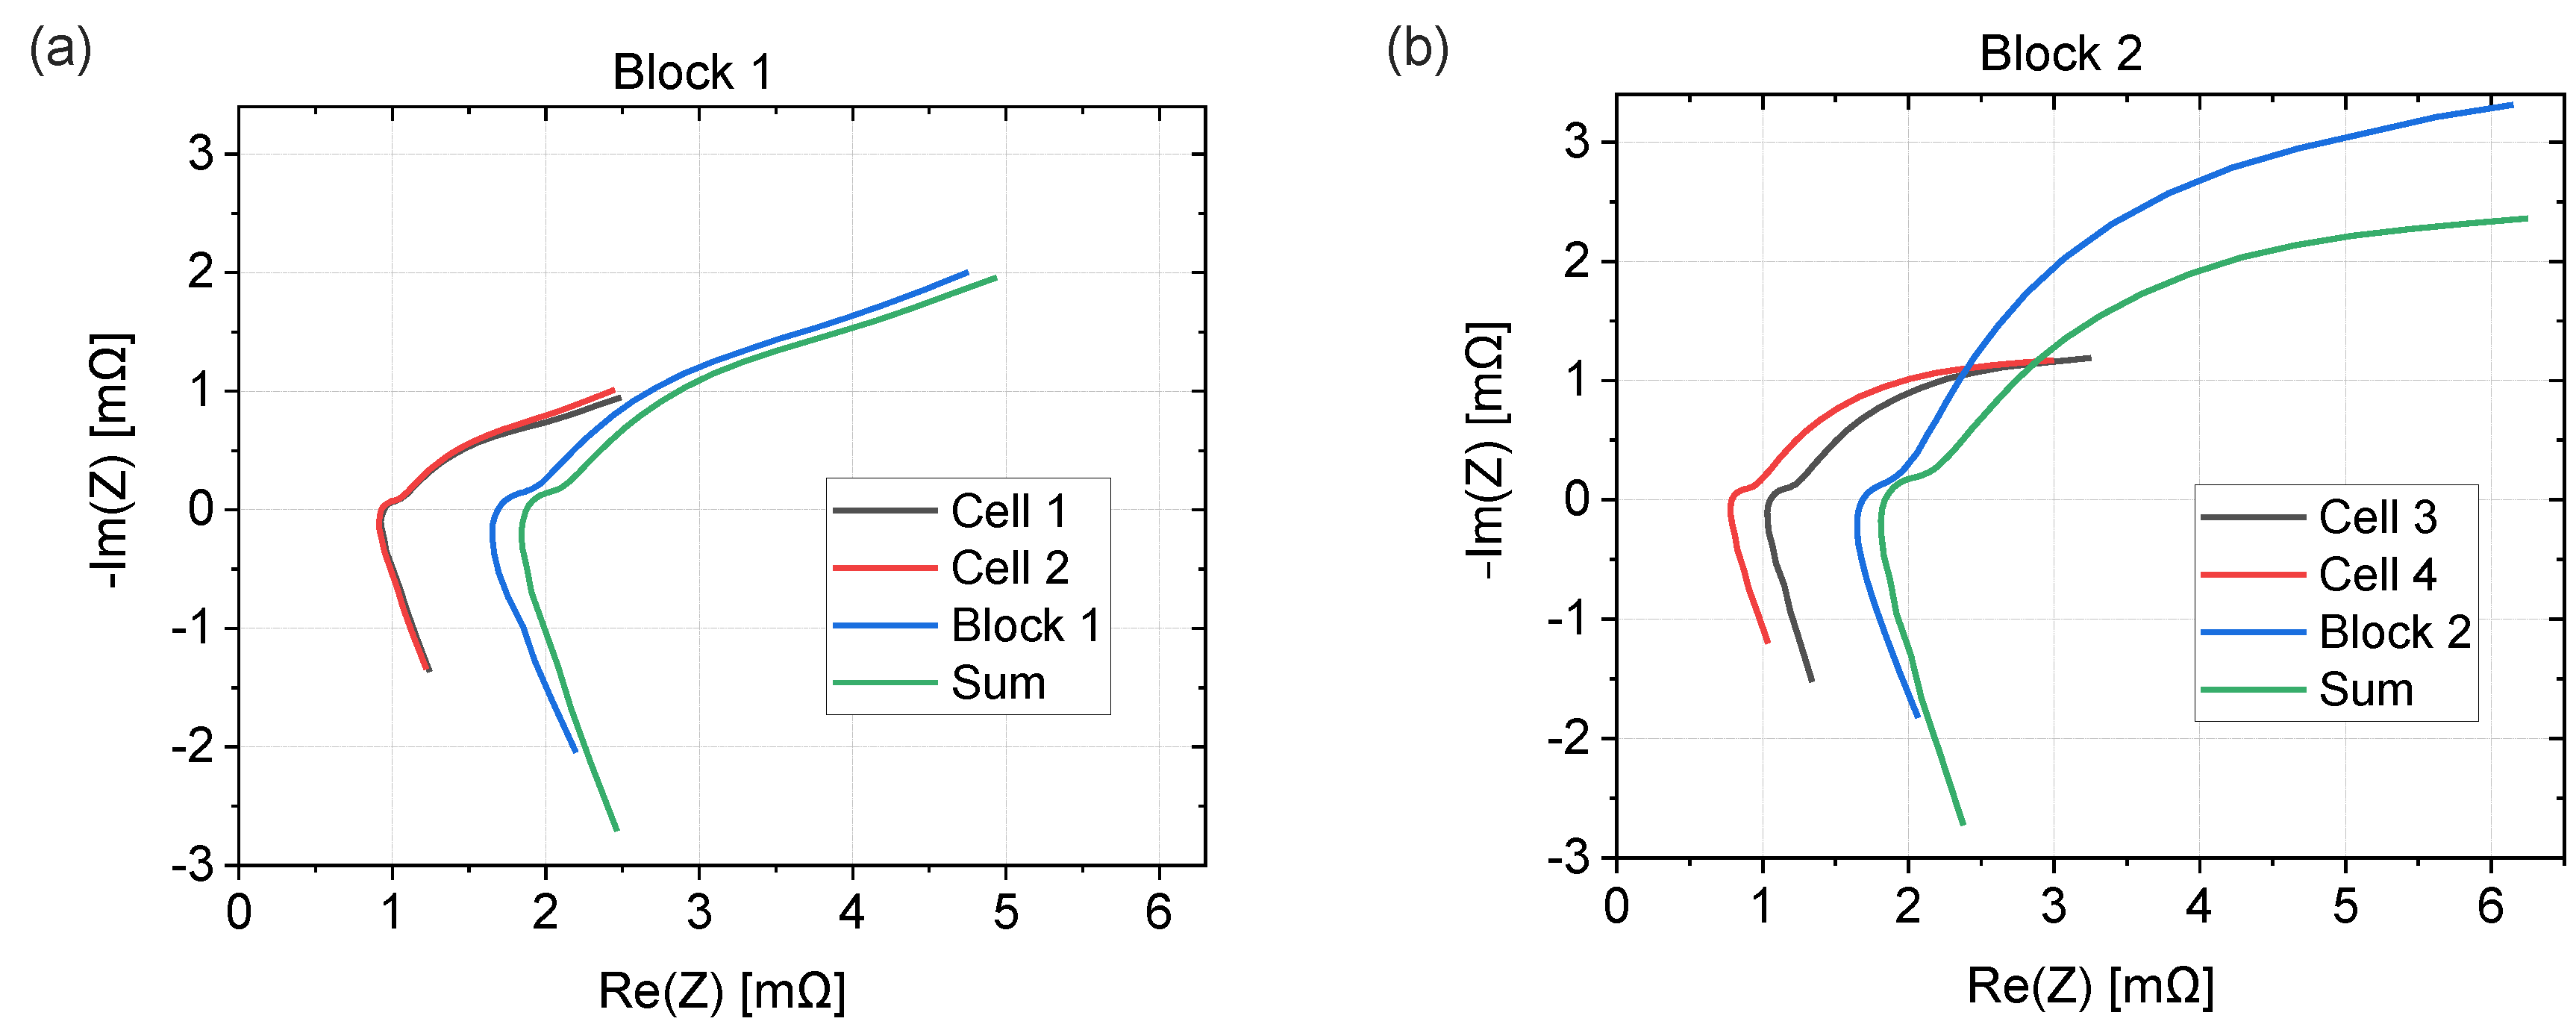
3.4. EIS Comparison of Cells and Blocks

In an extended EIS measurement round, the two Ni-Cd blocks, Block 1 and Block 2 (SAFT SBM112-2, 112 Ah), are measured and compared to the individual single-cell EIS spectra from 10 mHz to 2 kHz. Figure 7 shows the EIS spectra of the single cells compared to the block configurations, both for Block 1 (Figure 7a) and Block 2 (Figure 7b). The sum of the impedance values from the individual cells, Cell 1 and Cell 2, shows good agreement with the block spectra measured at block configuration (blue curves). The offset differences are in the range of 10–400 µΩ and are mostly due to the additional bar connector in the block. The results show that the block impedance can be well-determined from the individual cell impedance values. The increase of the real part in the inductive regime towards the maximum frequency (left side of the Nyquist plot) agrees also with the 3-D FEM simulations obtained in Figure 2c.

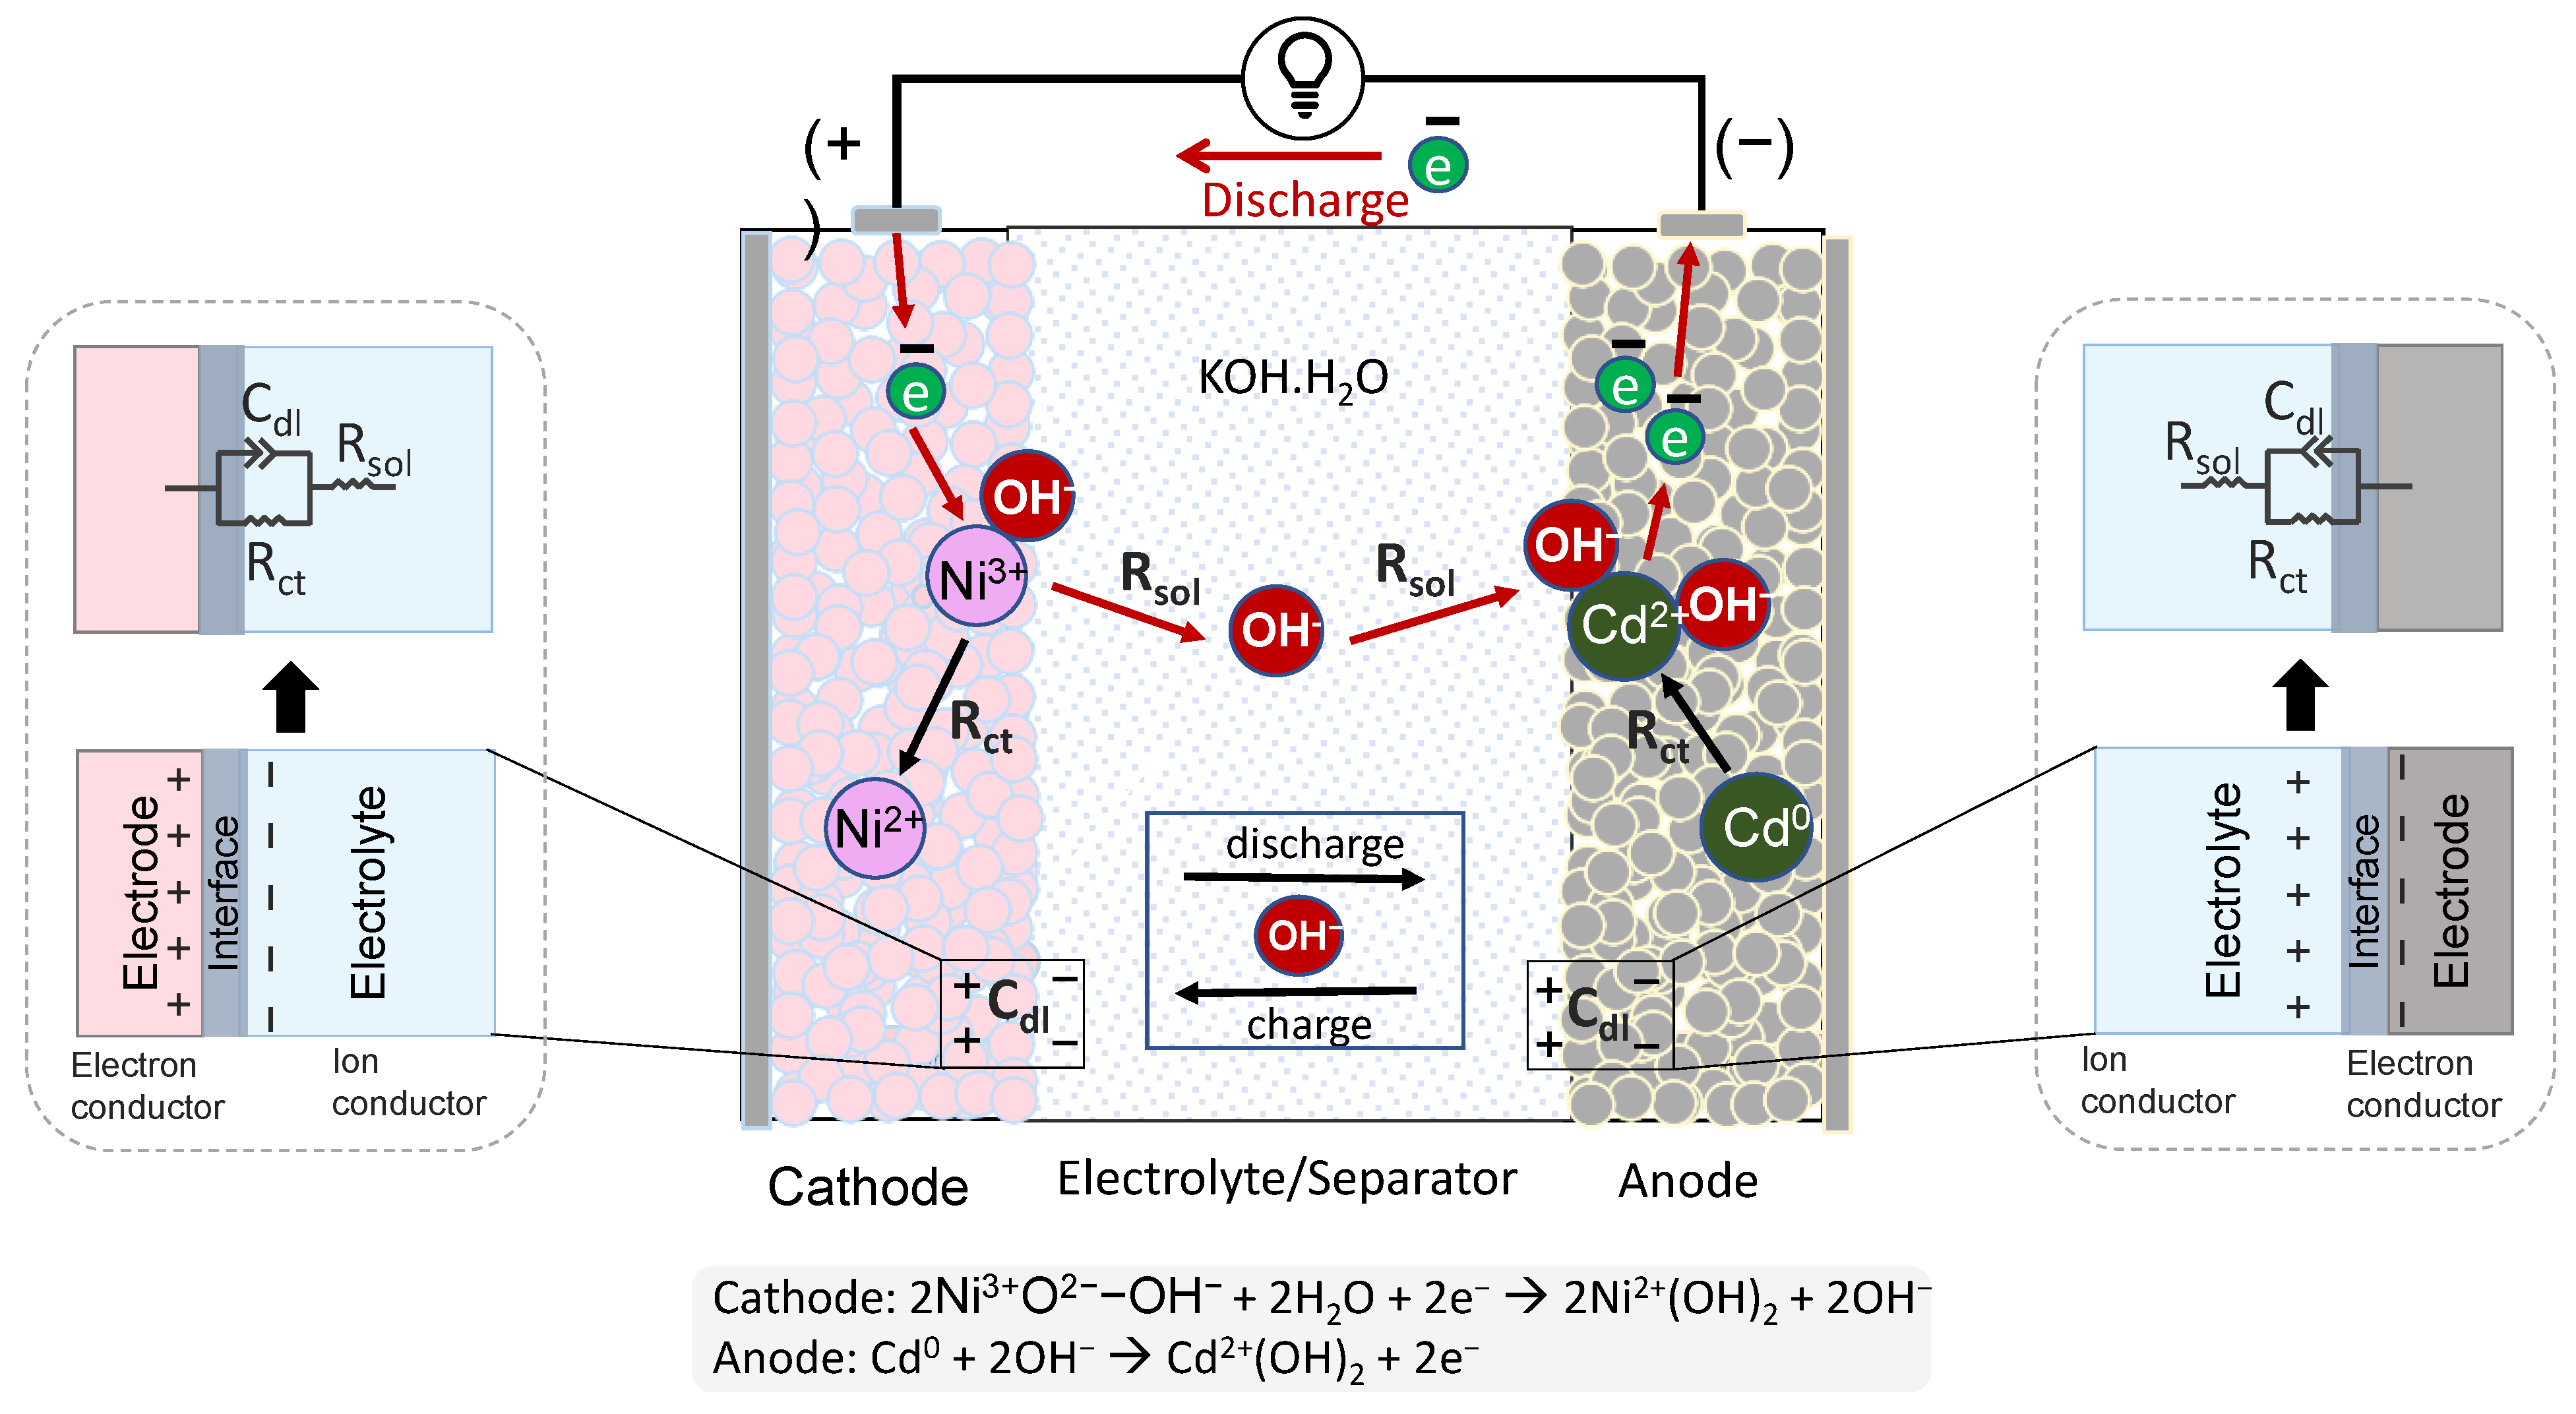
3.5. Electrochemical Interpretation

Figure 8 shows the electrochemical model parameters Rsol, Rct, and Cdl in relation to the principal components of a Ni-Cd cell. The electrochemical redox reactions (reduction and oxidation) include the discharge where Ni3+ is reduced to Ni2+ and the hydroxide ions (OH) are transferred to the cadmium anode, where the oxidation occurs from Cd0 to Cd2+. The main electrochemical model parameter describing the redox reaction is the charge transfer resistance Rct, reflecting the exchange between the ions and the electrons at the electrode interfaces. Rct is related to the reaction kinetics described by the Butler–Vomer equation for a charge-transfer controlled electrochemical reaction with an inverse relation to the exchange current density, Rct = R ×T/(n × F × i0), where i0 is the exchange current density, R is the gas constant, T is the temperature, n is the number of electrons in the redox reaction, and F is the Faraday constant [34]. Considering Cell 3 with an Rct of 0.079 mΩ obtained at 296 K, and a two-electron charge transfer process, then the exchange current density is equal to i0 = 0.23 A·cm−2, which corresponds to 162 A per cell with an electrode surface area of 700 cm2. The exchange current density reflects intrinsic rates of electron transfer between electrodes, and provides insights into the nature of the electrodes, their structure, as well as their physical parameters such as surface roughness [35]. The larger the exchange current density, the faster the redox reactions. Compared to Li-ion batteries which show typical i0 values of around 5 mA·cm−2 [36], the Ni-Cd current density is significantly larger. For instance, this is apparent by the fact that higher C-rates can be obtained from Ni-Cd batteries, which are typically required in uninterruptible power supply (UPS) applications. Such applications require mixed high and low discharge rates for electrical loads between 30 min and 3 h [37]. The highly conductive ionic solution in the Ni-Cd cell is represented in the model by a purely resistive element Rsol. The solution resistance depends on the ionic concentrations, temperature, and geometry of the area in which the current is flowing. The conductivity k of the ionic solution, in units of [S/m], is obtained from the solution resistance Rsol by the following relation, k = Ln/(Rsol × A), where A is the surface area, and Ln is the length of the charge path. Considering Cell 3 with an Rsol = 1.43 mΩ and based on the geometrical dimensions of the Ni-Cd cell, we obtain conductivity values around 1 S·cm−1, which compare very well with the conductivity of bulk KOH solution found in literature [38]. The deposition of ion charges at the electrode interface is countered by electronic charges at the electrode interface, creating a double-layer capacitance CPEdl. Whereas the ion diffusion process inside the electrode particles of the positive Ni active material is represented by a Warburg impedance, which is a solid-state physical diffusion process [39].

4. Conclusions

We investigated the use of calibrated EIS to study the electrochemical processes of industrial Ni-Cd batteries. An EIS calibration process that uses short and shunt standard with known resistance and reactance values was employed. At high frequencies above 200 Hz, significant differences were obtained from the EIS calibration, with an average change of about 8% on the real part and 6% on the imaginary part of the impedance. The real impedance (resistance) and imaginary impedance (reactance) were simulated using an electromagnetic FEM model to analyze the effect of the cable fixturing, including the self-inductance of the wire conductors due to alternating currents. Thereby, the impedance is strongly influenced by the geometry and cables of the system, which is eliminated by the proposed calibration workflow. Experimental EIS data were obtained systematically from Ni-Cd cells and blocks at several SoCs. A correlation of the resistance and the reactance with the SoC was observed, and overall, EIS can be used as a fast method to estimate the cell of the block capacity status. Additionally, we observed that small changes in the impedance can arise due to varying resting periods and shelf storage times. Good agreement was found between single-cell EIS curves and the corresponding block measurements where two cells are in series. Thereby, the overall block response can be determined from individual cell EIS measurements. The electrochemical model parameters Rsol, Rct, and Cdl were described in relation to the principal components of a Ni-Cd cell and the electrochemical redox reactions. Based on the modelled parameters, intrinsic properties were estimated such as the solution conductivity and the exchange current density, reflecting high intrinsic rates of the redox electron transfer processes in Ni-Cd cells compared to LiBs.
An equivalent circuit model was used to fit the calibrated EIS data and to extract the electrochemical cell parameters, including the ohmic resistance, the charge transfer resistance, the double-layer capacitance, and the diffusion resistance. Here, we showed that the EEC parameters can be accurately extracted based on the calibrated complex impedance on a broad frequency range. The presented model and the knowledge gained can be used for state estimation, such as SoC or SoH, and for battery performance evaluations, for example, during charge and discharge operations, and varying temperatures. Future work will involve performing systematic studies based on EIS and OCV measurements at different SoC and investigating the effect of rest period and storage performance on NiCd cells.

Author Contributions

N.A.-Z.R.-S.: conceptualization, investigations, data analysis, and writing of the original draft. M.K.: conceptualization, discussion, supervision. P.K.: formal analysis and writing—review and editing. D.N.: materials used for experiments, discussion, and supervision. B.M.: resources, discussion, writing—review and editing. F.K.: conceptualization, writing of the original draft, discussion, and project administration. All authors have read and agreed to the published version of the manuscript.

Funding

This work was funded in part by the European Union’s Horizon 2020 research and innovation program NMBP “NanoBat” under grant agreement no. 861962.

Institutional Review Board Statement

Not applicable, as studies on humans and animals are not involved.

Informed Consent Statement

Not applicable, as studies on humans are not involved.

Data Availability Statement

The data presented in this study are available on request from the corresponding author. The data are not publicly available as the findings form part of an ongoing study.

Conflicts of Interest

The authors declare no conflict of interest.

References

  1. Kasim, R.; Abdullah, A.R.; Selamat, N.A.; Basir, M.S.S.M.; Ramli, M.Z. Nickel-Cadmium battery analysis using spectrogram. ARPN J. Eng. Appl.Sci. 2016, 11, 3975–3979. [Google Scholar]
  2. Mcdermott, P.; Halpert, G.; Ekpanyaskun, S.; Nche, P. Secondary aerospace batteries and battery materials: A bibliography, 1969–1974. Bibliography 1976, 7044, 1923–1968. [Google Scholar]
  3. Nilsson, A.O. Nickel cadmium batteries in UPS design features. In Proceedings of the 10th International Telecommunications Energy Conference, San Diego, CA, USA, 30 October–2 November 1988; pp. 388–393. [Google Scholar] [CrossRef]
  4. Dirani, H.C.; Semaan, E.; Moubayed, N. Impact of the current and the temperature variation on the Ni-Cd battery functioning. In Proceedings of the 2013 The International Conference on Technological Advances in Electrical, Electronics and Computer Engineering (TAEECE), Konya, Turkey, 9–11 May 2013; pp. 339–343. [Google Scholar] [CrossRef]
  5. Jeyaseelan, C.; Jain, A.; Khurana, P.; Kumar, D.; Thatai, S. Ni-Cd Batteries. In Rechargeable Batteries; Boddula, R., Inamuddin, R.P., Asiri, A.M., Eds.; John Wiley & Sons, Ltd.: Hoboken, NJ, USA, 2020; pp. 177–194. [Google Scholar] [CrossRef]
  6. Mottard, J.-M.; Hannay, C.; Winandy, E.L. Experimental study of the thermal behavior of a water cooled Ni–Cd battery. J. Power Sources 2003, 117, 212–222. [Google Scholar] [CrossRef]
  7. Crescentini, M.; De Angelis, A.; Ramilli, R.; De Angelis, G.; Tartagni, M.; Moschitta, A.; Traverso, P.A.; Carbone, P. Online EIS and Diagnostics on Lithium-Ion Batteries by Means of Low-Power Integrated Sensing and Parametric Modeling. IEEE Trans. Instrum. Meas. 2020, 70, 1–11. [Google Scholar] [CrossRef]
  8. Babaeiyazdi, I.; Rezaei-Zare, A.; Shokrzadeh, S. State of charge prediction of EV Li-ion batteries using EIS: A machine learning approach. Energy 2021, 223, 120116. [Google Scholar] [CrossRef]
  9. Chevalier, S.; Auvity, B.; Olivier, J.C.; Josset, C.; Trichet, D.; Machmoum, M. Detection of Cells State-of-Health in PEM Fuel Cell Stack Using EIS Measurements Coupled with Multiphysics Modeling. Fuel Cells 2014, 14, 416–429. [Google Scholar] [CrossRef]
  10. Jungst, R.G.; Nagasubramanian, G.; Case, H.L.; Liaw, B.Y.; Urbina, A.; Paez, T.L.; Doughty, D.H. Accelerated calendar and pulse life analysis of lithium-ion cells. J. Power Sources 2003, 119, 870–873. [Google Scholar] [CrossRef]
  11. Stanciu, T.; Stroe, D.-I.; Teodorescu, R.; Swierczynski, M. Extensive EIS characterization of commercially available lithium polymer battery cell for performance modelling. In Proceedings of the 2015 17th European Conference on Power Electronics and Applications (EPE’15 ECCE-Europe), Geneva, Switzerland, 8–10 September 2015; pp. 1–10. [Google Scholar] [CrossRef]
  12. Windarko, N.A.; Choi, J.-H. SOC Estimation Based on OCV for NiMH Batteries Using an Improved Takacs Model. J. Power Electron. 2010, 10, 181–186. [Google Scholar] [CrossRef]
  13. Sathyanarayana, S.; Venugopalan, S.; Gopikanth, M.L. Impedance parameters and the state-of charge. I. Nickel-cadmium battery. J. Appl. Electrochem. 1979, 9, 125–139. [Google Scholar] [CrossRef]
  14. Bundy, K.; Karlsson, M.; Lindbergh, G.; Lundqvist, A. An electrochemical impedance spectroscopy method for prediction of the state of charge of a nickel-metal hydride battery at open circuit and during discharge. J. Power Sources 1998, 72, 118–125. [Google Scholar] [CrossRef]
  15. Karkuzhali, V.; Rangarajan, P.; Tamilselvi, V.; Kavitha, P. Analysis of battery management system issues in electric vehicles. IOP Conf. Ser. Mater. Sci. Eng. 2020, 994, 012013. [Google Scholar] [CrossRef]
  16. Hammouche, A.; Karden, E.; De Doncker, R.W. Monitoring state-of-charge of Ni–MH and Ni–Cd batteries using impedance spectroscopy. J. Power Sources 2004, 127, 105–111. [Google Scholar] [CrossRef]
  17. Olarte, J.; de Ilarduya, J.M.; Zulueta, E.; Ferret, R.; Kurt, E.; Lopez-Guede, J.M. Estimating State of Charge and State of Health of Vented NiCd Batteries with Evolution of Electrochemical Parameters. JOM 2021, 73, 4085–4090. [Google Scholar] [CrossRef]
  18. Reid, M.A. Impedance studies of nickel/cadmium and nickel/hydrogen cells using the cell case as a reference electrode. J. Power Sources 1990, 29, 467–476. [Google Scholar] [CrossRef]
  19. Blanchard, P. Electrochemical impedance spectroscopy of small Ni-Cd sealed batteries: Application to state of charge determinations. J. Appl. Electrochem. 1992, 22, 1121–1128. [Google Scholar] [CrossRef]
  20. Meddings, N.; Heinrich, M.; Overney, F.; Lee, J.-S.; Ruiz, V.; Napolitano, E.; Seitz, S.; Hinds, G.; Raccichini, R.; Gaberšček, M.; et al. Application of electrochemical impedance spectroscopy to commercial Li-ion cells: A review. J. Power Sources 2020, 480, 228742. [Google Scholar] [CrossRef]
  21. Mauracher, P.; Karden, E. Dynamic modelling of lead/acid batteries using impedance spectroscopy for parameter identification. J. Power Sources 1997, 67, 69–84. [Google Scholar] [CrossRef]
  22. Dai, H.; Jiang, B.; Wei, X. Impedance Characterization and Modeling of Lithium-Ion Batteries Considering the Internal Temperature Gradient. Energies 2018, 11, 220. [Google Scholar] [CrossRef] [Green Version]
  23. R-Smith, N.A.-Z.; Ragulskis, M.; Kasper, M.; Wagner, S.; Pumsleitner, J.; Zollo, B.; Groebmeyer, A.; Kienberger, F. Multiplexed 16 × 16 Li-Ion Cell Measurements Including Internal Resistance for Quality Inspection and Classification. IEEE Trans. Instrum. Meas. 2021, 70, 1–9. [Google Scholar] [CrossRef]
  24. Tuca, S.-S.; Badino, G.; Gramse, G.; Brinciotti, E.; Kasper, M.; Oh, Y.J.; Zhu, R.; Rankl, C.; Hinterdorfer, P.; Kienberger, F. Calibrated complex impedance of CHO cells andE.colibacteria at GHz frequencies using scanning microwave microscopy. Nanotechnology 2016, 27, 135702. [Google Scholar] [CrossRef]
  25. Piatek, Z.; Baron, B. Exact Closed Form Formula for Self Inductance of Conductor of Rectangular Cross Section. Prog. Electromagn. Res. M 2012, 26, 225–236. [Google Scholar] [CrossRef] [Green Version]
  26. Kasper, M.; Leike, A.; Thielmann, J.; Winkler, C.; R-Smith, N.A.-Z.; Kienberger, F. Electrochemical impedance spectroscopy error analysis and round robin on dummy cells and lithium-ion-batteries. J. Power Sources 2022, 536, 231407. [Google Scholar] [CrossRef]
  27. Qiao, S.; Hu, M.; Fu, C.; Qin, D.; Zhou, A.; Wang, P.; Lin, F. Experimental Study on Storage and Maintenance Method of Ni-MH Battery Modules for Hybrid Electric Vehicles. Appl. Sci. 2014, 9, 1742. [Google Scholar] [CrossRef] [Green Version]
  28. Cruz-Manzo, S.; Greenwood, P.; Chen, R. An Impedance Model for EIS Analysis of Nickel Metal Hydride Batteries. J. Electrochem. Soc. 2017, 164, A1446. [Google Scholar] [CrossRef] [Green Version]
  29. Cheng, S.; Zhang, J.; Zhao, M.; Cao, C. Electrochemical impedance spectroscopy study of Ni/MH batteries. J. Alloys Compd. 1999, 293–295, 814–820. [Google Scholar] [CrossRef]
  30. Wang, H.; Tahan, M.; Hu, T. Effects of rest time on equivalent circuit model for a li-ion battery. In Proceedings of the 2016 American Control Conference (ACC), Boston, MA, USA, 6–8 July 2016; pp. 3101–3106. [Google Scholar] [CrossRef]
  31. Łosiewicz, B.; Budniok, A.; Rówiński, E.; Łągiewka, E.; Lasia, A. The structure, morphology and electrochemical impedance study of the hydrogen evolution reaction on the modified nickel electrodes. Int. J. Hydrogen Energy 2004, 29, 145–157. [Google Scholar] [CrossRef]
  32. Agudelo, B.O.; Zamboni, W.; Monmasson, E. A Comparison of Time-Domain Implementation Methods for Fractional-Order Battery Impedance Models. Energies 2021, 14, 4415. [Google Scholar] [CrossRef]
  33. Chayambuka, K.; Mulder, G.; Danilov, D.L.; Notten, P.H. Determination of state-of-charge dependent diffusion coefficients and kinetic rate constants of phase changing electrode materials using physics-based models. J. Power Sources Adv. 2021, 9, 100056. [Google Scholar] [CrossRef]
  34. Krauskopf, T.; Mogwitz, B.; Hartmann, H.; Singh, D.K.; Zeier, W.G.; Janek, J. The Fast Charge Transfer Kinetics of the Lithium Metal Anode on the Garnet-Type Solid Electrolyte Li6.25Al0.25La3Zr2O12. Adv. Energy Mater. 2020, 10, 2000945. [Google Scholar] [CrossRef]
  35. Bard, A.J.; Faulkner, L.R. Electrochemical Methods; Wiley & Sons: New York, NY, USA, 1980. [Google Scholar]
  36. Amin, R.; Belharouak, I. Part-II: Exchange current density and ionic diffusivity studies on the ordered and disordered spinel LiNi0.5Mn1.5O4 cathode. J. Power Sources 2017, 348, 318–325. [Google Scholar] [CrossRef]
  37. KPL KPM KPH Ni-Cd Batteries. Saft Batteries|We Energize the World. 22 October 2020. Available online: https://www.saftbatteries.com/products-solutions/products/kpl-kpm-kph-ni-cd-batteries (accessed on 22 December 2021).
  38. Allebrod, F.; Chatzichristodoulou, C.; Mollerup, P.L.; Mogensen, M.B. Electrical conductivity measurements of aqueous and immobilized potassium hydroxide. Int. J. Hydrogen Energy 2012, 37, 16505–16514. [Google Scholar] [CrossRef]
  39. De Vidts, P.; White, R.E. Mathematical Modeling of a Nickel-Cadmium Cell: Proton Diffusion in the Nickel Electrode. J. Electrochem. Soc. 1995, 142, 1509. [Google Scholar] [CrossRef] [Green Version]
Figure 1. (a) A sketch of the Ni-Cd block showing the two cells connected in series with a bar connector, and the respective cell electrode terminals. (b) Two Ni-Cd blocks (Block 1, Block 2) consisting of two cells per block connected in series with a bar connector. (c) EIS measurement setup consisting of a power analyzer containing two source measure units (SMUs), a PC with EIS control and visualization software, and the calibration standards and fixture. (d) EIS measurement modelled by combining an ideal impedance meter with the series error impedance Zser and a gain error term Ge. The true impedance ZT is computed from the measured and error-affected impedance ZM.
Batteries 08 00050 g001
Figure 2. (a) The 3-D electromagnetic computer-aided design (CAD) model of the Ni-Cd battery block containing two cells connected in series and the cable fixture. A four-wire connection scheme for force and sense is considered, and a metallic cell connector is used to connect both cells. (b) The 3-D EMPro simulation of the cell fixture and contacts, including a planar view of the magnetic H-filed distribution around the wires. (c) Simulated real impedance (upper panel) and imaginary impedance (lower panel) across the frequency range of 10 Hz to 1 kHz. The geometry and model dimensions are based on the original Ni-Cd block (SAFT SBM112) and the EIS setup.
Batteries 08 00050 g002
Figure 3. EIS calibration (upper row) and correction process (lower row) using printed circuit board (PCB) shunt standard. The shunt standard is measured at the BUT measurement plane and the short is measured at the BUT negative terminal (upper right). The calibration raw data (upper left) are used together with the standard definition data to obtain the error coefficients which are forwarded to the correction process. The raw BUT data (lower left) and the calibrated data (lower right) are shown for a Ni-Cd single cell with 112 Ah measured at 23 °C.
Batteries 08 00050 g003
Figure 4. (a) Calibrated EIS results shown as the real impedance (resistance) and imaginary impedance (reactance), across the measurement frequency of 10 mHz to 500 Hz. The results are shown for Ni-Cd Cell 1 at six SoC charging levels, from 0% to 90%, and measured at 23 °C. The high, intermediate, and low SoC curve transitions are indicated in the graphs. (b) The corresponding EIS results shown in a Nyquist plot.
Batteries 08 00050 g004
Figure 5. Equivalent electric circuit model of a Ni-Cd cell. (a) Randles model with four elements. (b) Comparison of experimental impedance spectra and simulation for Cell 1, (c) Cell 2, and (d) Cell 3 at 10% SoC and 23 °C. (e) Interpretation of the electrochemical processes in the Nyquist plot at different frequencies from 100 mHz to 500 Hz.
Batteries 08 00050 g005
Figure 6. Calibrated EIS spectra of three cells and the extracted electrochemical parameters. (a) Nyquist plot of the impedance spectra of the three cells. (b) Extracted electrochemical parameters from the fitted EIS results for Cell 1, Cell 2, and Cell 3, simulated using Z-view software. The spectra were obtained in the frequency range of 100 mHz to 500 Hz.
Batteries 08 00050 g006
Figure 7. Nyquist plot of the impedance spectra of the single cells, Cell 1, Cell 2, Cell 3, and Cell 4, compared to the block impedance for Block 1 (a) and Block 2 (b). The cells are at 20% SoC and the EIS measurements are performed using 3 A excitation current across the frequency range of 10 mHz to 2 kHz at 23 °C.
Batteries 08 00050 g007
Figure 8. Electrochemical model parameters and principal components of a Ni-Cd cell. During discharge, the cathode (Ni3+O2−-OH) reacts with water to produce Ni2+(OH)2 and hydroxide ions (OH) are transferred to the cadmium anode. The main electrochemical processes during discharge are described, including equivalent circuit model elements, such as Rct, Rsol, and Cdl (left and right panels).
Batteries 08 00050 g008
Publisher’s Note: MDPI stays neutral with regard to jurisdictional claims in published maps and institutional affiliations.

