Article

On the Specific Capacity and Cycle Stability of Si@void@C Anodes: Effects of Particle Size and Charge/Discharge Protocol

Department of Mechanical, Materials and Aerospace Engineering, Illinois Institute of Technology, Chicago, IL 60616, USA
*
Author to whom correspondence should be addressed.
Batteries 2022, 8(10), 154; https://doi.org/10.3390/batteries8100154
Submission received: 7 August 2022 / Revised: 8 September 2022 / Accepted: 29 September 2022 / Published: 2 October 2022
(This article belongs to the Special Issue Feature Papers to Celebrate the First Impact Factor of Batteries)

Abstract

:
Silicon has the potential to be a high-performance anode material, but its practical application is impeded by huge volume expansion during lithiation. Many studies have revealed that the huge volume expansion problem can be mitigated by introducing engineered voids into Si/C core–shell structures. In this study, a Si/C core/shell structure with engineered voids, termed Si@void@C, is investigated for its specific capacity and cycle stability as a function of particle size and charge/discharge protocol. The study shows that finer Si@void@C particles result in higher specific capacities, but with little impact on the cycle stability. Further, lower and upper cutoff voltages in charge/discharge have a profound impact on the specific capacity and cycle stability. Importantly, cutoff voltages in formation cycles have long-lasting effects on the cycle stability, indicating the critical role of forming a robust solid electrolyte interphase (SEI) layer during formation cycles. Using a constant current charge followed by potentiostatic hold charge can further improve the cycle stability and minimize the sharp capacity decay in the first 20–40 cycles. With proper choices of charge/discharge protocols, the specific capacities of Si@void@C anodes at the electrode level are 66.8%, 38.2% and 22.7% higher than those of graphite anodes at the 1st, 300th and 500th cycles, respectively, proving that Si@void@C has promising potential to replace graphite anodes for practical applications in the future.

1. Introduction

High capacity electrode materials are essential to satisfy the ever-increasing energy demand of next-generation Li-ion batteries (LIBs). Among all emerging anode materials for LIBs, silicon has been considered one of the most promising anode materials due to its superior theoretical gravimetric and volumetric capacities [1,2]. In addition, its environmentally friendly properties (non-toxic), natural abundance (the second largest resource) and attractive wide operating voltage make Si a promising candidate for anode materials for next-generation LIBs [2,3]. However, the low intrinsic conductivity (~10−6 S/cm) and the huge volume expansion (>300%) during lithiation have impeded the practical application of Si anodes [2,3,4,5,6,7]. In particular, huge volume expansion produces stress on particles, causing pulverization and electrical isolation of silicon domains during cycling; moreover, the stability of the solid electrolyte interphase (SEI) is disrupted by the dimensional changes, causing additional Li+ ions to be trapped and leading to capacity decay [2,3,4,5,6].
Many strategies have been investigated to improve the electrochemical behavior of silicon anodes. Specially designed morphologies and structures of silicon anodes such as core–shell structures [8,9], yolk-shell nanoparticles [10,11,12,13,14], porous Si structures [15,16,17,18], nanowires [19,20], nanotubes [21,22], nanofibers [23,24], and conductive polymer- and carbon-coated Si [25] are reported to achieve high specific capacity and long cycle stability. The choices of binders [26,27,28,29] or conductive agents [30] are also studied for silicon anodes. Additionally, the effects of electrolyte composition on SEI reactions have been studied as well [31,32,33,34,35]. It is reported that the stability of the SEI layer and cycling performance could be improved with some electrolyte additives such as fluoroethylene carbonate (FEC) [35] or using localized high-concentration electrolytes [33]. Most of the aforementioned works are trying to minimize the detrimental effects of silicon volume change and form a stable SEI layer while improving the electronic conductivity of silicon.
Recently, our group reports a facile, eco-friendly and scalable synthesis method (patent pending) that can produce Si@void@C micro-reactors which contain an outer carbon shell and inner silicon core with internal carbon networks and nano-channel shaped voids inside the silicon core [36]. Each of these Si@void@C particles serves as a micro-reactor to minimize the volume expansion of the micro-reactor during lithiation because of the presence of internal nano-channel voids and confinement of the outer carbon shell, while the outer carbon shell and internal carbon networks also provide electronic conductivity. Si@void@C anodes can deliver 1100, 1000, 900 and 800 mAh/g-Si specific capacity at the current density of 2, 4, 6 and 8 A/g-Si, respectively [36]. Further, Si@void@C half cells could live up to 1000 cycles under 8 A/g-Si current density, but with 50% specific capacity loss [36]. The present study aims to investigate the effects of Si@void@C particle size and charge/discharge protocols on cycle stability while maintaining the high specific capacity advantage of Si@void@C anodes. It is known that smaller Si particles lead to smaller volume change per particle and thus better cycle stability [2]. Controlling the cutoff voltages in charge/discharge protocols can regulate the volume expansion of Si anodes [37,38] and thus offer a potent approach to improving the cycle stability of Si anodes. The findings of this study are described below and discussed on the basis of the aforementioned expectations.

2. Experimental

The detailed procedure for synthesizing submicron-sized Si@void@C particles was described previously elsewhere [36]. Briefly, the synthesis method consisted of three major steps. The first step was high-energy ball milling of micron-sized Si powder (99.5% purity, 325 mesh, Sigma Aldrich, St. Louis, MO, USA) using a Szegvari attritor mill under an Ar atmosphere. The weight ratio of stainless steel balls to Si powder was 15 to 1 in high-energy ball milling. After 12-h ball milling, polyacrylonitrile (PAN, average molecular weight 150,000, Sigma-Aldrich, St. Louis, MO, USA) powder was added to the ball-milled Si powder for additional 1 h ball milling to generate Si/PAN composite particles. The second step was carbonization treatment to form carbon-encapsulated Si particles, denoted as Si@C. This was conducted by heating the Si/PAN powder in a tube furnace at 800 °C for 5 h under a flowing Ar atmosphere. The third step was partial etching of the nanostructured Si core inside Si@C particles using a 0.5 M sodium hydroxide (NaOH, 97.0%, Sigma-Aldrich, St. Louis, MO, USA) solution to create Si@void@C particles which contain an outer carbon shell with nano-channel shaped voids, internal carbon networks and Si nanoclusters inside the carbon shell. The etchant solution was controlled at 47 °C in the whole etching process. After etching for 45 min, the etched powder was collected using a vacuum filtration system with a porous membrane, washed three times with deionized (DI) water, and then vacuum dried at 150 °C for 12 h. The obtained powder was denoted as Si@void@C for subsequent use.
Because of the nature of high-energy ball milling, Si@void@C powder has a wide particle size distribution (ranging from 0.1 to 5.0 μm). To study the size effects of Si@void@C powder, Si@void@C particles were dispersed in DI water and classified into three size groups using a custom-made vibration device containing three sieves with sieve openings of 1.2 μm, 0.65 μm and 0.1 μm. After classification, Si@void@C particles were separated into three size groups: (i) >1.2 μm, (ii) between 0.65 and 1.2 μm, and (iii) between 0.1 and 0.65 μm. All classified powders were vacuum dried at 150 °C for 12 h for the subsequent use.
Si@void@C particles were used as the active material and prepared into electrode slurries to fabricate Si@void@C coin cells. For each electrode the active material, carbon black (CB, MTI® Super P conductive CB, 99+%, MTI®, Richmond, CA, USA) and polyacrylic acid (PAA, average molecular weight 450,000, Sigma Aldrich, St. Louis, MO, USA) binder were mixed together in N-methyl-2-pyrrolidone (NMP, 99.5%, Acros Organics, Geel, Belgium) solvent at the weight ratio of 6:2:2 or 8:1:1. The mixture was sonicated for 8 min and then mixed using a Thinky Mixer (250 rpm for 5 min). This mixing procedure was repeated for three times to achieve a uniform slurry which was then cast onto a copper foil and vacuum dried at 120 °C for 12 h. Half cells in CR2032 coin cell format were fabricated using the dried electrode with a Li chip as the counter electrode and Celgard® 2325 membrane as the separator (Celgard®, Charlotte, NC, USA). The active material loading is controlled at 1 mg/cm2. The membrane was soaked in the electrolyte for 20 min before being assembled into the coin cell. The electrolyte was prepared using 1 M LiPF6 salt in ethylene carbonate (EC)–diethyl carbonate (DEC) (1:1 wt./wt.), containing 10 vol.% FEC and 1 vol.% vinylene carbonate (VC). Neware® battery test system was used to conduct charge/discharge experiments with different protocols (to be detailed later). The specific capacity reported in this study is based on the weight of Si@void@C particles. This will facilitate the direct comparison in the specific capacity at the level of electrodes made of Si@void@C anodes and widely used graphite anodes without knowing the weight ratio of the Si to C within Si@void@C particles. However, for those want to know the specific capacity in terms of the Si weight, our previous study reveals that the weight ratio of the Si to C within Si@void@C particles is close to 1:1 [36].
Scanning electron microscopy (JEOL SEM 5900, Tokyo, Japan) was used to observe the morphologies, sizes and structures of Si particles before and after ball milling and Si@void@C powder. Samples were coated with silver via a sputter coater before being transferred into the SEM chamber. Transmission electron microscopy (TEM) and scanning transmission electron microscopy (STEM), FEI Talos F200X TEM/STEM (Thermo Fisher Scientific, Waltham, MA, USA), with capability for high-resolution STEM imaging in the Center for Nanoscale Materials (CNM) at Argonne National Laboratory (ANL) were utilized to identify the coating thickness, elemental distribution, and nano-channel shaped voids inside Si@void@C particles.

3. Results and Discussion

3.1. Characteristics of Si@void@C Particles

Figure 1a reveals that the starting Si particles have sizes ranging from about 1 μm to 15 μm. After high-energy ball milling with PAN, Si particle sizes have been reduced substantially to ~50 nm–5 μm (Figure 1c). Furthermore, all Si nanoparticles are embedded in a PAN matrix because of the forced injection of Si nanoparticles into ductile PAN particles during high-energy ball milling. This forced injection leads to Si/PAN agglomerates in which solid PAN not only encapsulates Si nanoparticles but also forms a network interpenetrating inside Si/PAN agglomerates (Figure 1c). The PAN is then converted to carbon in the subsequent carbonization treatment. As a result, the product from the carbonization treatment is Si@C particles containing an outer carbon shell encapsulating Si nanoparticles with an inner carbon network penetrating between Si nanoparticles [36]. The final step of partial etching of the Si core inside Si@C particles via a NaOH solution introduces nano-channel shaped voids into Si@C particles (Figure 1e). As a result, the final product of Si@void@C micro-reactor particles has sizes ranging from ~50 nm to 5 μm (Figure 1d) and contain an outer carbon shell encapsulating Si nanoparticles with an inner carbon network penetrating between Si nanoparticles and many nano-channel voids (Figure 1f). As can be seen from the STEM image (Figure 1e), the volume of nano-channel voids is not large and thus some volume expansion of Si@void@C particles during lithiation is still expected. Our previous study [36] has indeed reported a 36.9% increase in the electrode thickness after 620 cycles in the voltage window of 0.1–1.0 V vs. Li+/Li. The presence of the outer carbon shell and inner carbon networks as well as nanocrystalline Si particles has been proven previously using TEM equipped with an energy dispersive spectrometer (EDS) and X-ray diffraction (XRD) [36] and thus will not be repeated here.

3.2. Specific Capacity of Si@void@C Anode as a Function of Particle Size

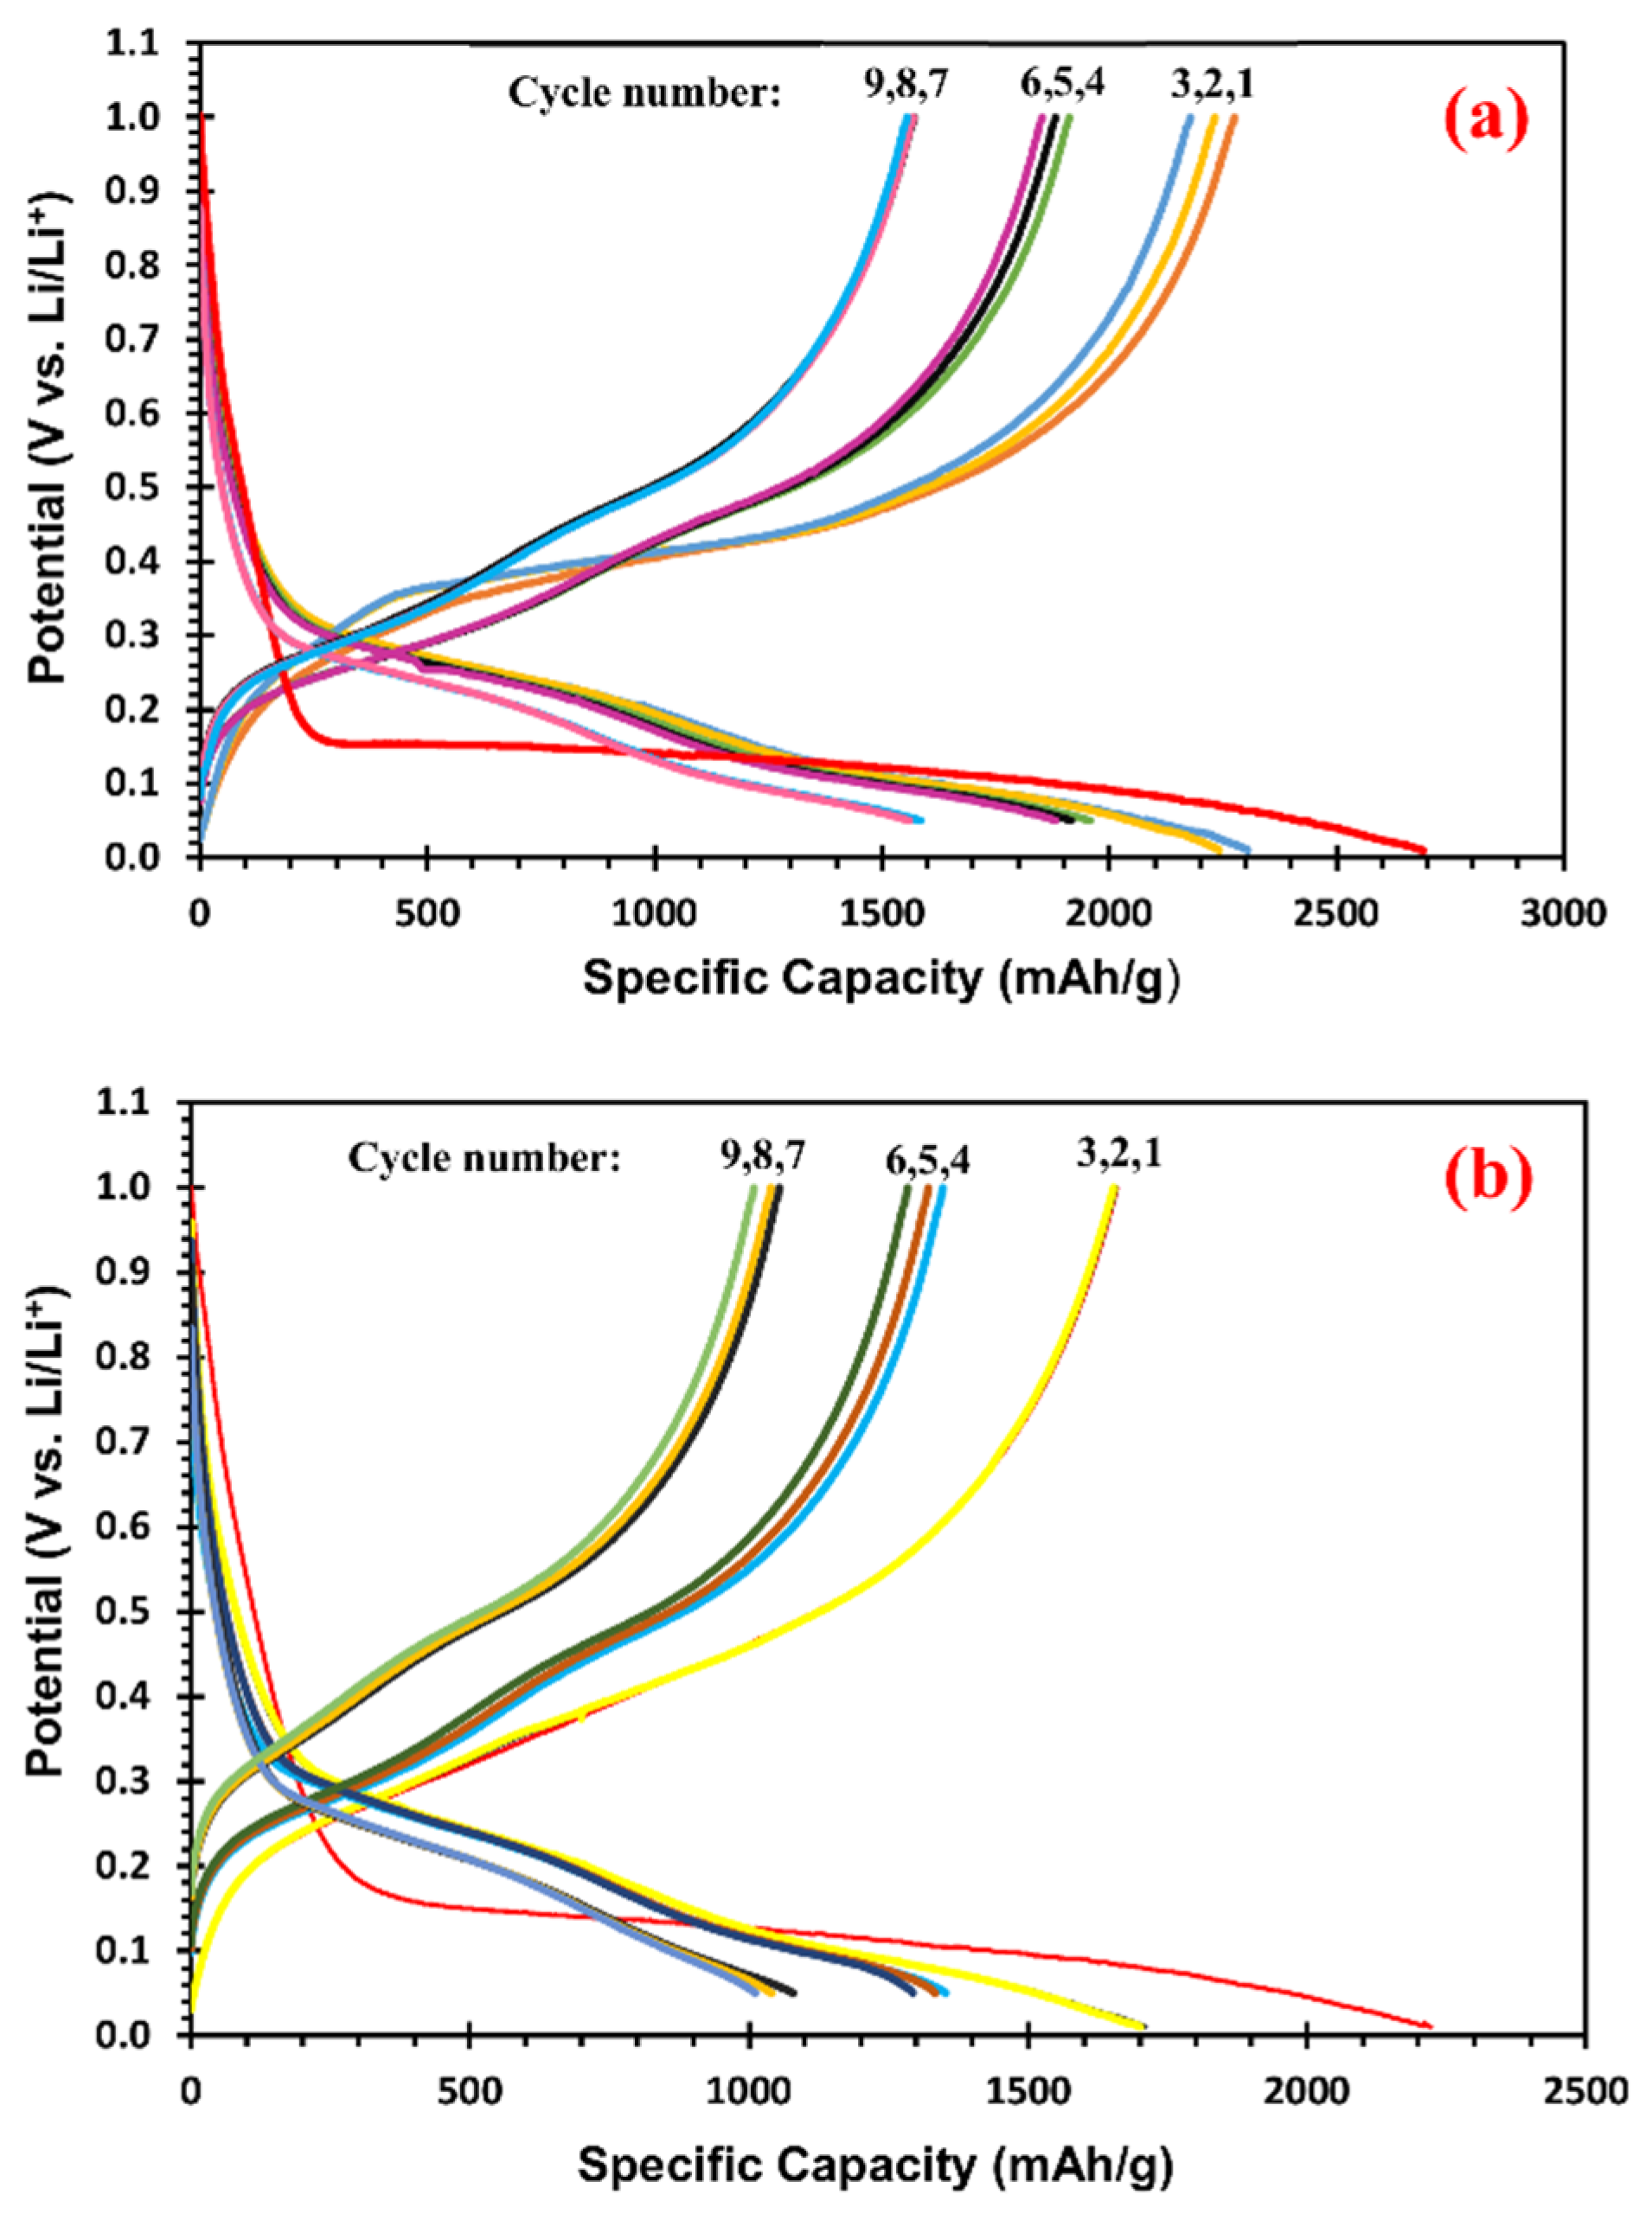
As described in the experimental section, in order to understand the particle size effect, we have classified Si@void@C powder using sieve membranes to separate it into three sizes of groups: (a) 100 nm to 650 nm, (b) 650 nm to 1200 nm, and (c) >1200 nm. Table 1 shows the size distribution of Si@void@C powder after classification. We have carried out electrochemical evaluation of two types of powders: (i) the smallest size group of Si@void@C powder (100 to 650 nm) and (ii) Si@void@C powder without classification (100 nm to >1200 nm). Figure 2 compares the charge/discharge voltage profiles of these two groups of Si@void@C powders. As shown, the smallest size group of Si@void@C powder has much higher specific capacities than Si@void@C powder without classification under otherwise identical testing conditions. For instance, the delithiation capacities at the 3rd, 6th and 9th cycles are 2177 mAh/g, 1851 mAh/g and 1553 mAh/g, respectively, for the smallest size group of Si@void@C powder. In contrast, the corresponding values for Si@void@C powder without classification are 1653 mAh/g, 1248 mAh/g, and 1007 mAh/g. Thus, the specific capacity of Si@void@C powder without classification is about 520 to 600 mAh/g lower than that of the smallest size group of Si@void@C powder under otherwise identical conditions. We have attributed the higher specific capacity of the smallest size group of Si@void@C powder to their larger specific surface area and thus larger electrode/electrolyte interfacial area. The latter allows larger Li flux across the electrode/electrolyte interface during lithiation and delithiaton and thus higher specific capacities.
Note that all the specific capacities and current densities in Figure 2 are computed using the weight of Si@void@C active material, not Si weight. Thus, the specific capacity achieved in the 9th cycle (1553 mAh/g-Si@void@C) for the smallest size group of Si@void@C powder is equivalent to 3106 mAh/g-Si because our Si@void@C particles contain about 50 wt% Si and 50 wt% C [36]. Furthermore, note that the specific capacities from the 1st to 3rd cycles are similar, and the same is true from the 4th to 6th cycles and from the 7th to 9th cycles because the current density increases when changing from the 1st to 3rd cycles to from the 4th to 6th cycles and finally to from the 7th to 9th cycles. This is a well-known phenomenon, i.e., higher current density leads to lower specific capacity because of the polarization effect.

3.3. Effects of Si@void@C Particle Sizes on Cycle Stability

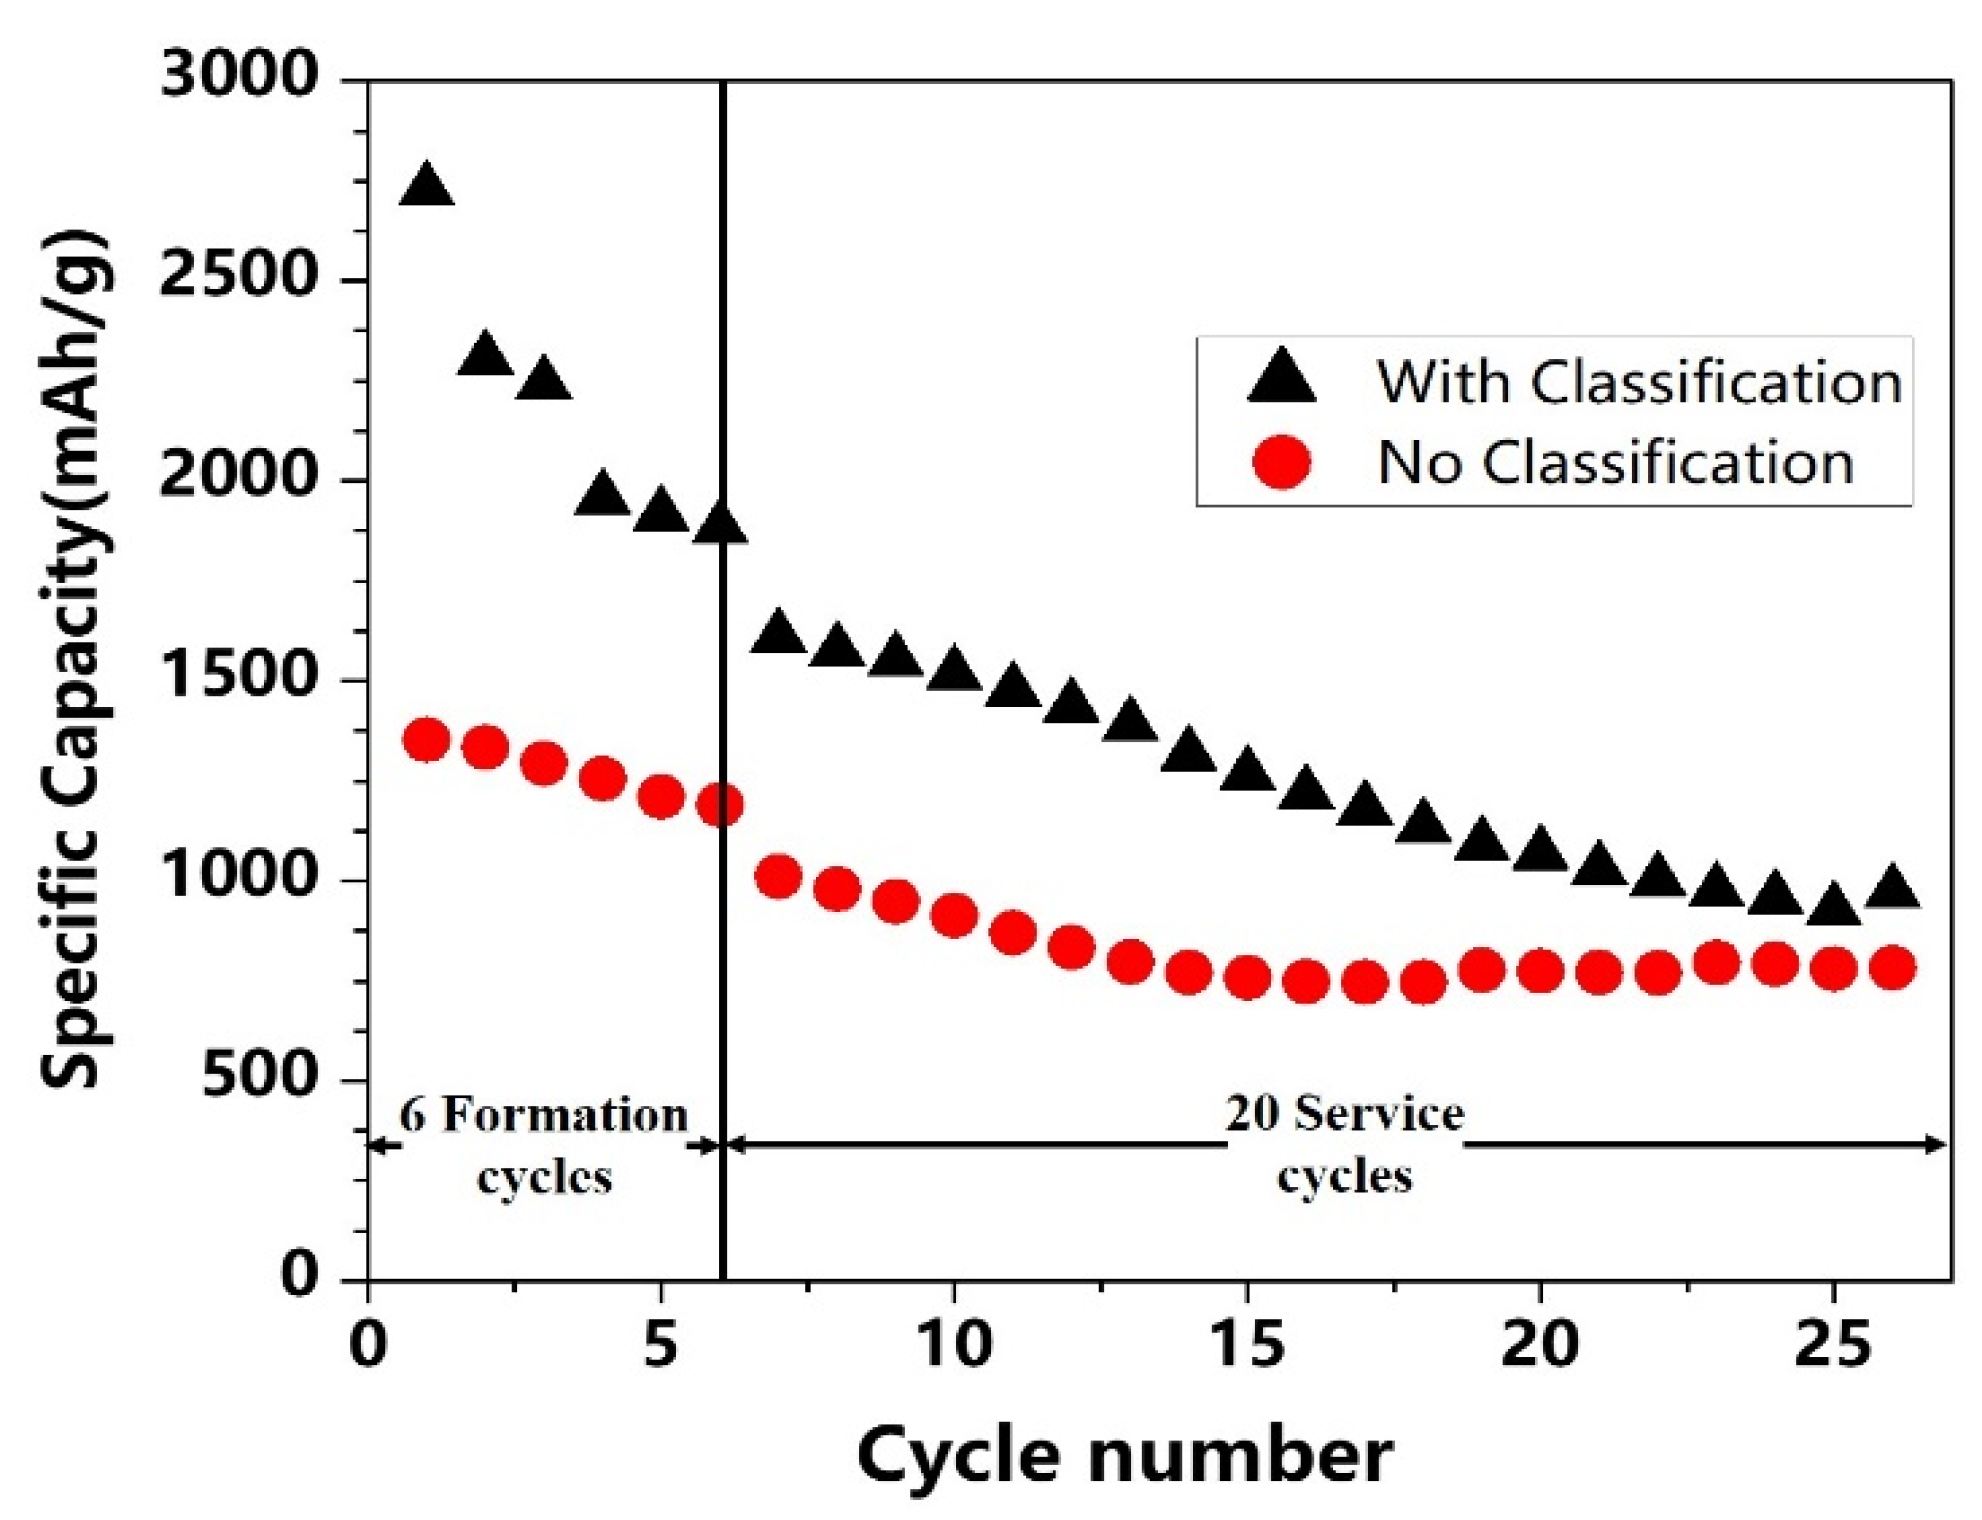
The particle size effect on the cycle stability is shown in Figure 3. In this figure, the half cells made of the smallest size group of Si@void@C powder and made of Si@void@C powder without particle classification are first charged/discharged with 6 formation cycles which contain 3 cycles at the current density of 0.05 A/g between 0.01 V and 1.0 V (vs. Li+/Li) and then 3 cycles at 0.1 A/g between 0.05 V and 1.0 V. After 6 formation cycles both Si@void@C cells are subjected to 20 service cycles at 0.5 A/g between 0.05 V and 1.0 V.
Two interesting phenomena can be observed in this figure. First, the smallest size group of Si@void@C cell exhibits a rapid capacity drop in the 20 service cycles (changing from 1610 mAh/g in the first service cycle to 980 mAh/g in the 20th service cycle). The cell made of Si@void@C powder without classification also exhibits a rapid capacity drop in the first 10 service cycles. Such rapid capacity decay in the initial service cycles is also observed in many cells (to be shown later). We attribute this phenomenon to nonuniform volume expansion of Si@void@C particles during lithiation, which results in the most active Si@void@C particles over-expanding and then losing contact with the carbon black (CB) conductive network during the delithiation process. As a result, these lost-contact particles can no longer participate in redox reactions in subsequent cycles, leading to fast capacity drop in the initial cycles. After sufficient numbers of cycles (to be shown later), however, most Si@void@C particles have been largely activated, i.e., the central region of large Si@void@C particles can participate in redox reactions rather than just the surface region which participates in redox reactions in the initial cycles. Furthermore, some Si@void@C particles that are initially in an unfavorable condition (e.g., have not been wetted by the electrolyte) can also contribute to electrochemical reactions after being wetted by the electrolyte through the activation of many cycles. With these activations, the specific capacity can start to increase or stop decreasing after about 10 to 50 cycles as more and more Si@void@C particles have been eventually fully activated (i.e., the entire particle and more Si@void@C particles participate in redox reactions).
The second interesting phenomenon is that the cell made of the smallest size group of Si@void@C remains to have higher specific capacities than the cell made of Si@void@C without particle classification, such as 980 mAh/g at the end of the first 20 service cycles for the former vs. 770 mAh/g at the end of the first 20 service cycles for the latter. Clearly, this phenomenon is due to the larger specific surface area of the smallest size group of Si@void@C than that of Si@void@C powder without particle classification.
In short, small Si@void@C particles have the advantage of higher specific capacity than large Si@void@C particles because the former has a larger electrode/electrolyte interfacial area for lithiation and delithiation. However, small Si@void@C particles do not have the advantage in the cycle stability over larger Si@void@C particles. Both particles have exhibited substantial capacity decay in the initial service cycles.

3.4. Enhancing the Cycle Stability of Si@void@C Anode via Charge/Discharge Protocol

It is well-known that the charge/discharge protocol for batteries is typically composed of two parts: (i) formation cycles (which are carried out by battery manufacturers before shipping batteries to consumers) and (ii) service cycles (which are conducted by consumers during the use of batteries). Our study reveals that the conditions of both formation cycles and service cycles have a strong influence on the specific capacity and cycle stability of Si@void@C anodes. Ideally, one would like to have high specific capacity and long cycle life (with 1000 cycles for electric vehicle applications) simultaneously. However, for Si@void@C anodes we find that high specific capacity normally results in short cycle life and vice versa. As a result, it is important to have optimized charge/discharge protocol(s) so that both cycle life and specific capacity can be enhanced in service cycles. In what follows, we will discuss the effects of different protocols on the specific capacity and cycle stability of Si@void@C anodes.

3.4.1. Effects of the Lower Cutoff Voltage in Formation Cycles on Specific Capacity and Cycle Stability

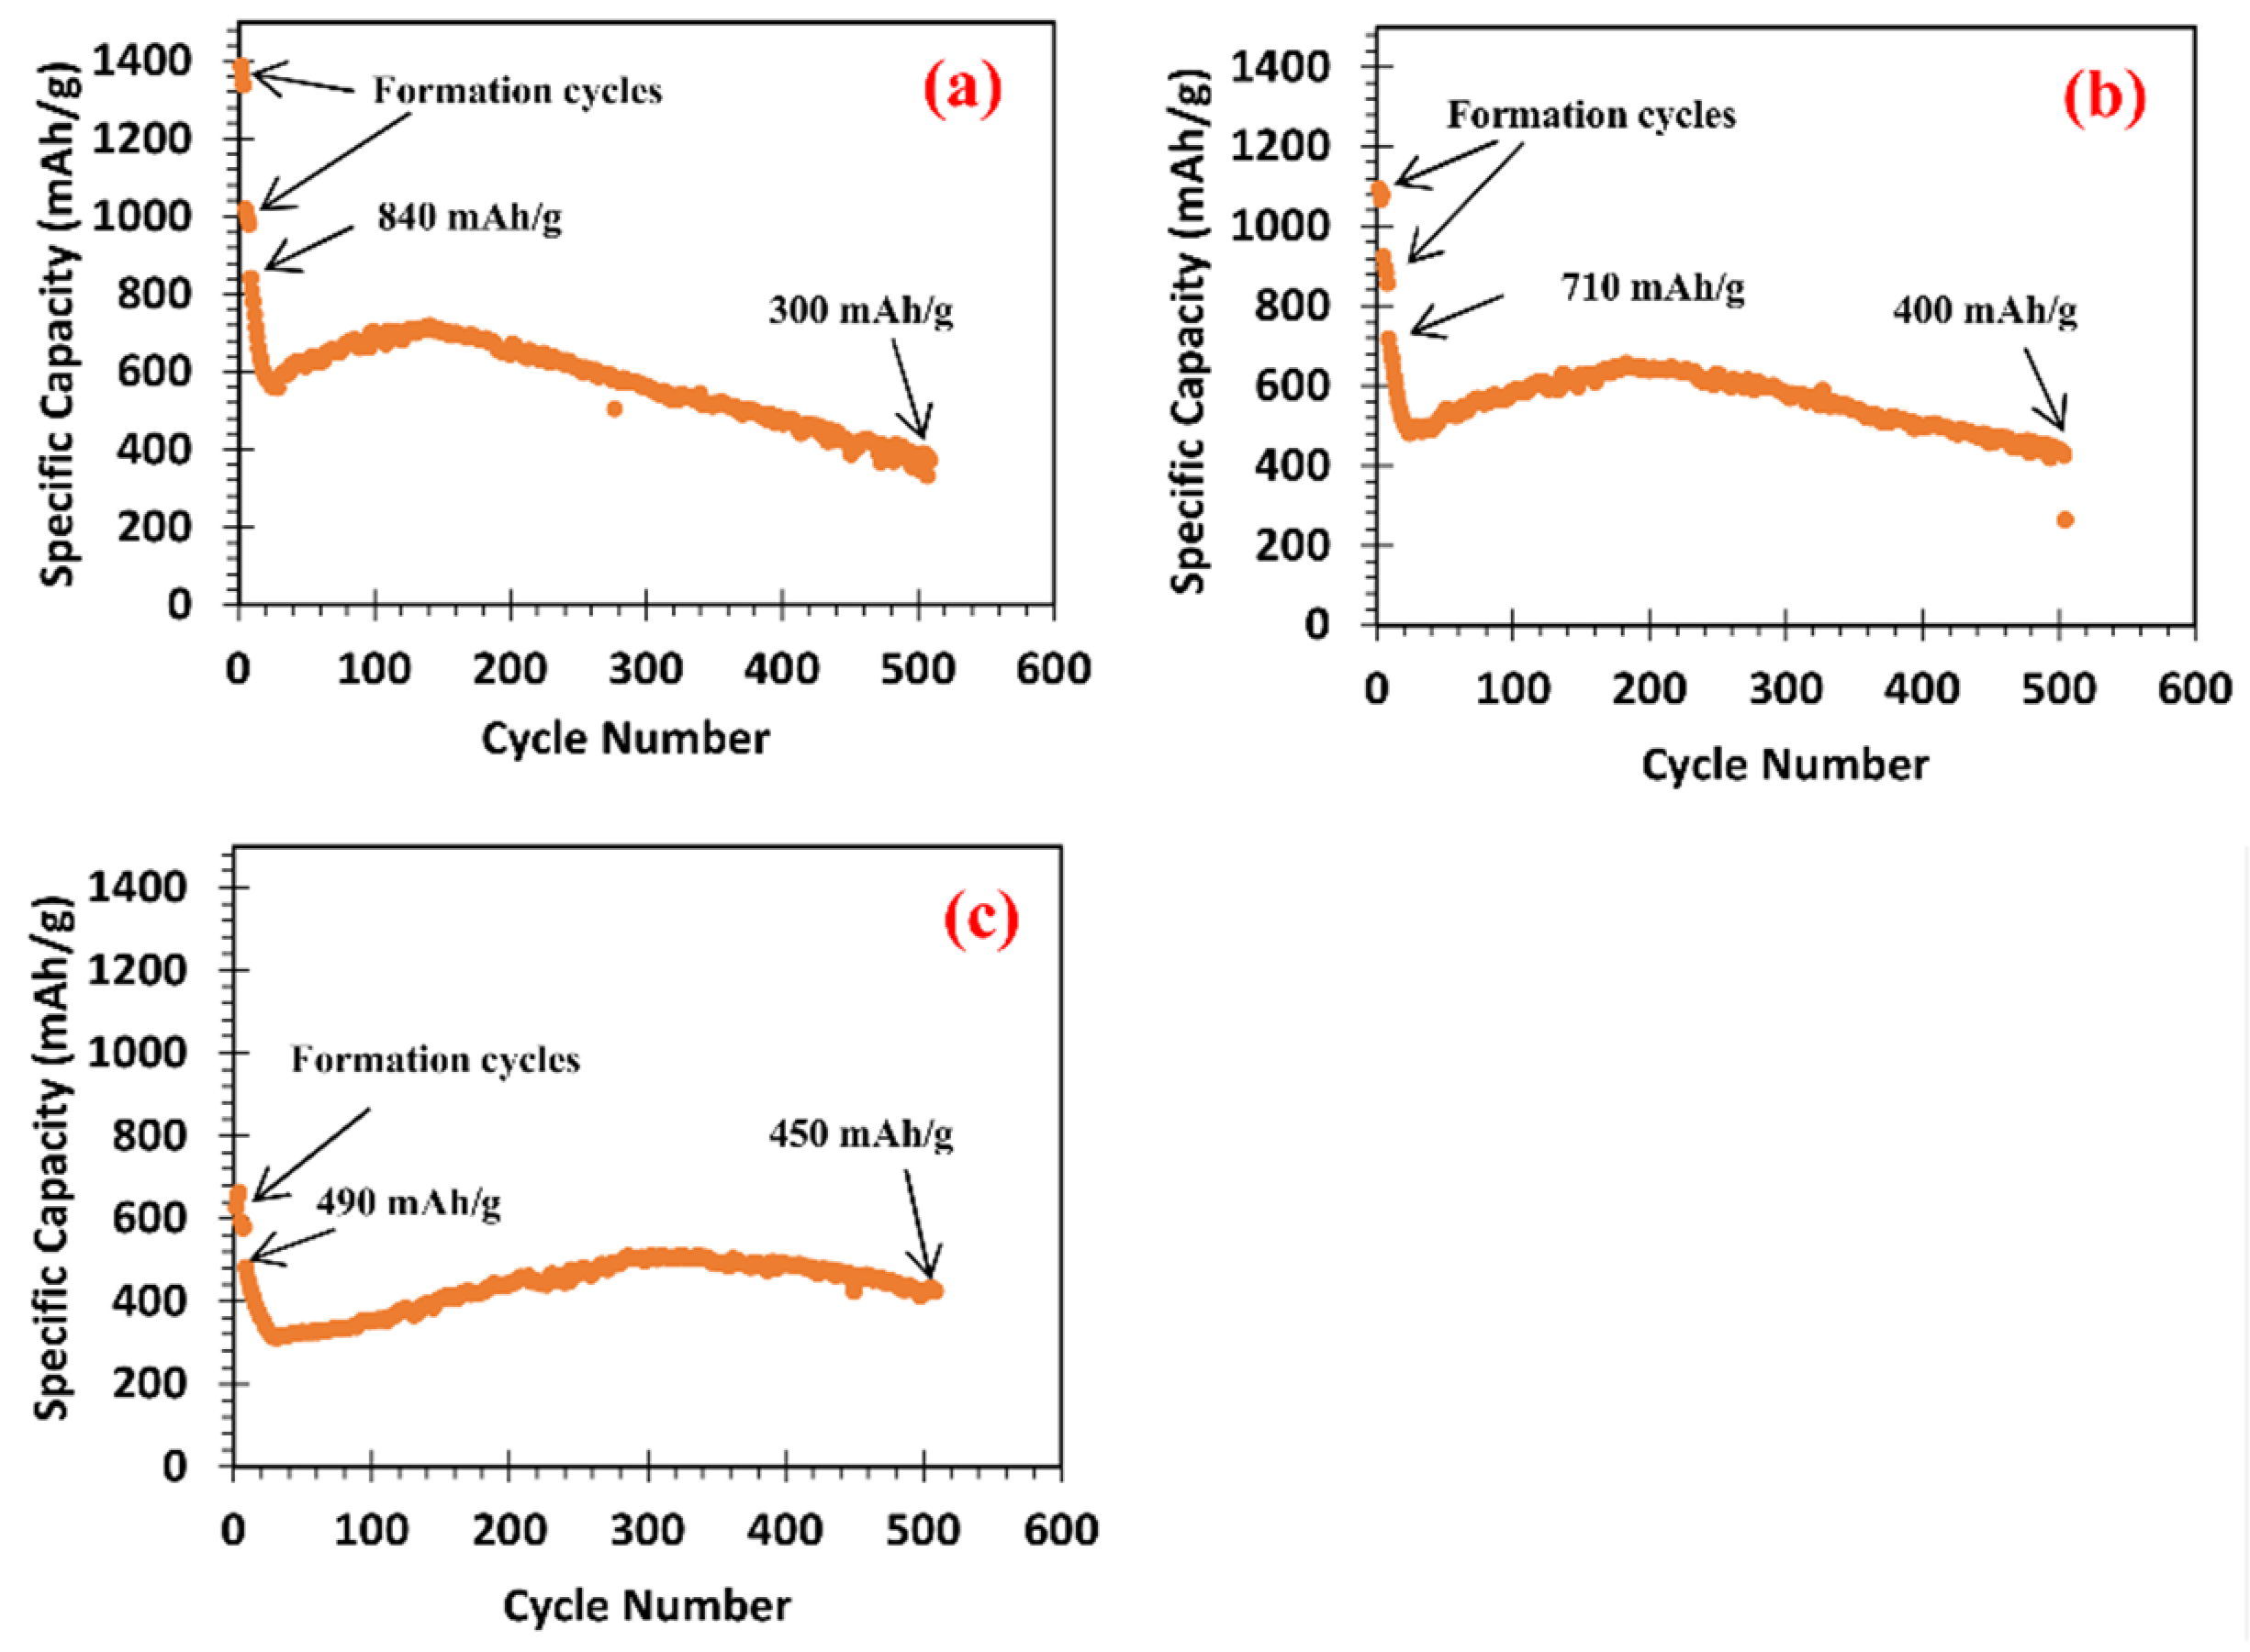
Figure 4 illustrates the effects of the lower cutoff voltage (LCV) in formation cycles on the specific capacity and cycle stability of Si@void@C anodes. For easy comparison, the charge/discharge protocol and specific capacities at selected cycles are summarized in Table 2. Note that all three cells (M1, M2 and M3) have the same protocol for service cycles. Further, the upper cutoff voltages (UCV) are the same for these cells in formation cycles. However, their LCV in formation cycles are different. Specifically, the M1 cell has the lowest LCV (0.05 V) in formation cycles, whereas the M3 cell has the highest LCV (0.1 V) in formation cycles. As shown in Figure 4, with a decrease in the LCV the specific capacity of Si@void@C anode in formation cycles increases, i.e., M1 > M2 > M3. This trend is clearly due to more lithiation when the LCV is decreased (see Figure 2). Interestingly, this trend is maintained in the initial service cycles. For example, the specific capacity at the 1st service cycle is 840, 710 and 490 mAh/g for M1, M2 and M3 cells, respectively. However, the order of cycle stability is reversed, i.e., M1 < M2 < M3. For instance, the specific capacity of Si@void@C at the 500th cycle for the M1 cell is 300 mAh/g with only 36% capacity retention when compared with the specific capacity at the 1st service cycle. In contrast, the specific capacity of Si@void@C at the 500th cycle for M3 cethe ll is 450 mAh/g with 92% capacity retention when compared with the specific capacity at the 1st service cycle. The corresponding values for the M2 cell are between these two cells, as shown in Table 2.
In short, the M3 cell has the smallest charge/discharge window (0.1 V to 1.5 V) in formation cycles and thus has the smallest specific capacity at the 1st service cycle. However, it has the best cycle stability and the highest specific capacity after 500 service cycles because it has the smallest volume change in formation cycles. In contrast, M1 has the largest charge/discharge window (0.05 V to 1.5 V) in formation cycles and thus the largest specific capacity at the 1st service cycle. However, it has the worst cycle stability and the lowest specific capacity after 500 service cycles because it has the largest volume change in formation cycles, leading to the loss of some Si@void@C particles in contact with the CB conductive network and/or more severe fracture and reformation of SEI layer. Clearly, the conditions of formation cycles have a strong influence on the specific capacity and cycle stability of Si@void@C anodes in service cycles and should be chosen carefully to ensure optimized specific capacity and cycle stability.

3.4.2. Effects of the Upper Cutoff Voltage on Specific Capacity and Cycle Stability

Figure 5 shows the specific capacity as a function of cycle number for M4 and M5 half cells made of Si@void@C without particle classification. As shown in Table 1, M4 and M5 have the same charge/discharge protocol except for M4 with the UCV at 1.0 V vs. Li+/Li and M5 with the UCV at 1.5 V. By comparing M4 and M5 cells, two phenomena are observed. First, the specific capacity of M4 at the 1st service cycle (305 mAh/g) is lower than that of M5 (430 mAh/g) because M5 has a higher UCV at 1.5 V vs. Li+/Li. This indicates that M4 has not fully delithiated yet even after delithiation up to 1.0 V. Second, the cycle stability of M4 with a smaller UCV at 1.0 V is better than that of M5 with a larger UCV at 1.5 V. For instance, the specific capacity of M4 drops from 305 mAh/g at the 1st service cycle to 252 mAh/g at the 500th cycle with 82.6% capacity retention. In contrast, the specific capacity of M5 drops from 430 mAh/g at the 1st service cycle to 221 mAh/g at the 500th cycle with only 51.4% capacity retention.
The better cycle stability of M4 than M5 is attributed to less fracture and reformation of the SEI layer on the surface of Si@void@C particles because it has been found previously that the SEI layer of Si particles fractures under compressive stresses during delithiation [21]. The lower UCV of M4 leads to less volume shrinkage of Si@void@C particles and thus smaller compressive stresses which, in turn, result in less fracture and reformation of the SEI layer. Therefore, based on the analysis above we can conclude that a lower UCV leads to smaller specific capacities initially but possesses better cycle stability. As a result, after a large number of cycles the specific capacities of cells with lower UCVs can be higher than those of cells with higher UCVs (e.g., 252 mAh/g for M4 at the 500th cycle vs. 221 mAh/g for M5 at the 500th cycle).

3.4.3. Effects of Constant Current (CC) and Constant Current-Constant Voltage (CCCV) Charge on Specific Capacity and Cycle Stability

To further understand charge/discharge protocol effects, we have designed a set of experiments with CC or CCCV charge protocols the details of which are summarized in Table 3. Figure 6 compares the electrochemical performance of Si@void@C anodes made of the smallest size group of Si@void@C particles with P1, P2 and P3 charge/discharge protocols (Table 3). It can be seen from Figure 6a that the specific capacity of B1 cell with P2 (CC) charge/discharge protocol for both formation and service cycles exhibits a substantial drop in the first 40 service cycles which are followed by a gradual increase up to 300 cycles. Such a substantial drop in the specific capacity in the first 20 to 40 service cycles are similar to that exhibited by Si@void@C powder without particle classification (e.g., Figure 4 and Figure 5 where CC protocol is also used).
When the charge/discharge protocol is changed from P2 (CC) to P3 (CCCV), the substantial drop in the first 20 to 40 service cycles has been mitigated significantly. As shown in Figure 6b, the reduction of the specific capacity for B2 cell with P3 (CCCV) protocol from the 1st service cycle to the 15th service cycle is 12.6% (i.e., from 883 mAh/g at the 1st service cycle to 772 mAh/g at the 15th service cycle) and 16.1% from the 1st service cycle to the 50th service cycle. In sharp contrast, the drop of the specific capacity of B1 cell with P2 (CC) protocol is substantially larger, i.e., 27.7% from the 1st service cycle to the 15th service cycle and 53.7% from the 1st service cycle to the 50th service cycle.
Recall that the sharp drop of the specific capacity in the initial service cycles is present for all cells with CC charge/discharge protocol (see Figure 3, Figure 4, Figure 5 and Figure 6). As proposed before, we attribute this phenomenon to nonuniform volume expansion of Si@void@C particles during lithiation, which results in the most active Si@void@C particles to over-expand and then lose contact with the CB conductive network during the delithiation process. As a result, these lost-contact particles can no longer participate in redox reactions in subsequent cycles, leading to a fast capacity drop in the initial service cycles. However, when the charge/discharge protocol changes to P3 (CCCV), the volume expansion of Si@void@C particles becomes more uniformly distributed from one particle to another because of very small polarization during potentiostatic hold charge. This more uniform volume expansion among Si@void@C particles minimizes over-expansion of the most active Si@void@C particles. As a result, most Si@void@C particles remain in contact with the CB conductive network in the delithiation process and continue to participate in redox reactions, thereby drastically reducing the specific capacity drop in the initial service cycles. This proposed mechanism is consistent with the finding reported by Strobridge et al. [39] who have conducted in situ energy dispersive X-ray diffraction of LiFePO4 half cells and concluded that the electrochemical reaction of the LiFePO4 electrode becomes less uniform in the directions parallel with and perpendicular to the current when the charge/discharge rates increase.
Note that the cell in Figure 6a has CC formation cycles, whereas the cell in Figure 6b has CCCV formation cycles. To find out whether the minimization of the capacity sharp drop at the initial service cycles is due to different formation cycles, we have carried out another set of experiments that have CCCV formation cycles followed by CC service cycles, i.e., P1 (CCCV + CC) protocol in Table 3. As shown in Figure 6c, the cell subjected to P1 protocol still exhibits a sharp capacity drop in the initial service cycles. Specifically, the specific capacity drops from 1285 mAh/g at the 1st service cycle to 712 mAh/g at the 30th service cycle (with a 44.6% capacity drop). Thus, it is clear that the sharp capacity drop at the initial service cycles is directly dictated by the charge/discharge protocol at service cycles and the charge/discharge protocol at formation cycles has little influence on the sharp capacity drop at the initial service cycles.
There are several additional interesting phenomena that can be observed in Figure 6. First, a larger charge/discharge voltage window results in higher specific capacities initially—a conclusion that can be drawn by comparison between the cell in Figure 6a with the voltage window from 0.1 to 1.0 V and the cell in Figure 6c with the voltage window from 0.1 to 1.5 V. This phenomenon is consistent with our previous discussion of Figure 4 and Figure 5. Second, the CCCV protocol provides higher specific capacities than the CC protocol when the charge/discharge voltage window is the same. In fact, the cell in Figure 6b with the voltage window from 0.15 to 1.0 V has a higher specific capacity at the 1st service cycle (884 mAh/g) than the cell in Figure 6a with the voltage window from 0.1 to 1.0 V at the 1st service cycle (680 mAh/g). This phenomenon is due to the participation of more Si@void@C particles in redox reactions and/or higher degrees of lithiation of most Si@void@C particles because of the lower polarization induced by the CCCV protocol. Third, the CCCV protocol leads to a gradual decrease in the specific capacity as the cycle number increases, whereas the CC protocol results in a sharp capacity drop initially, followed by some capacity increase and then decrease again as the cycle number increases.

3.5. Coulombic Efficiency (CE) Analysis

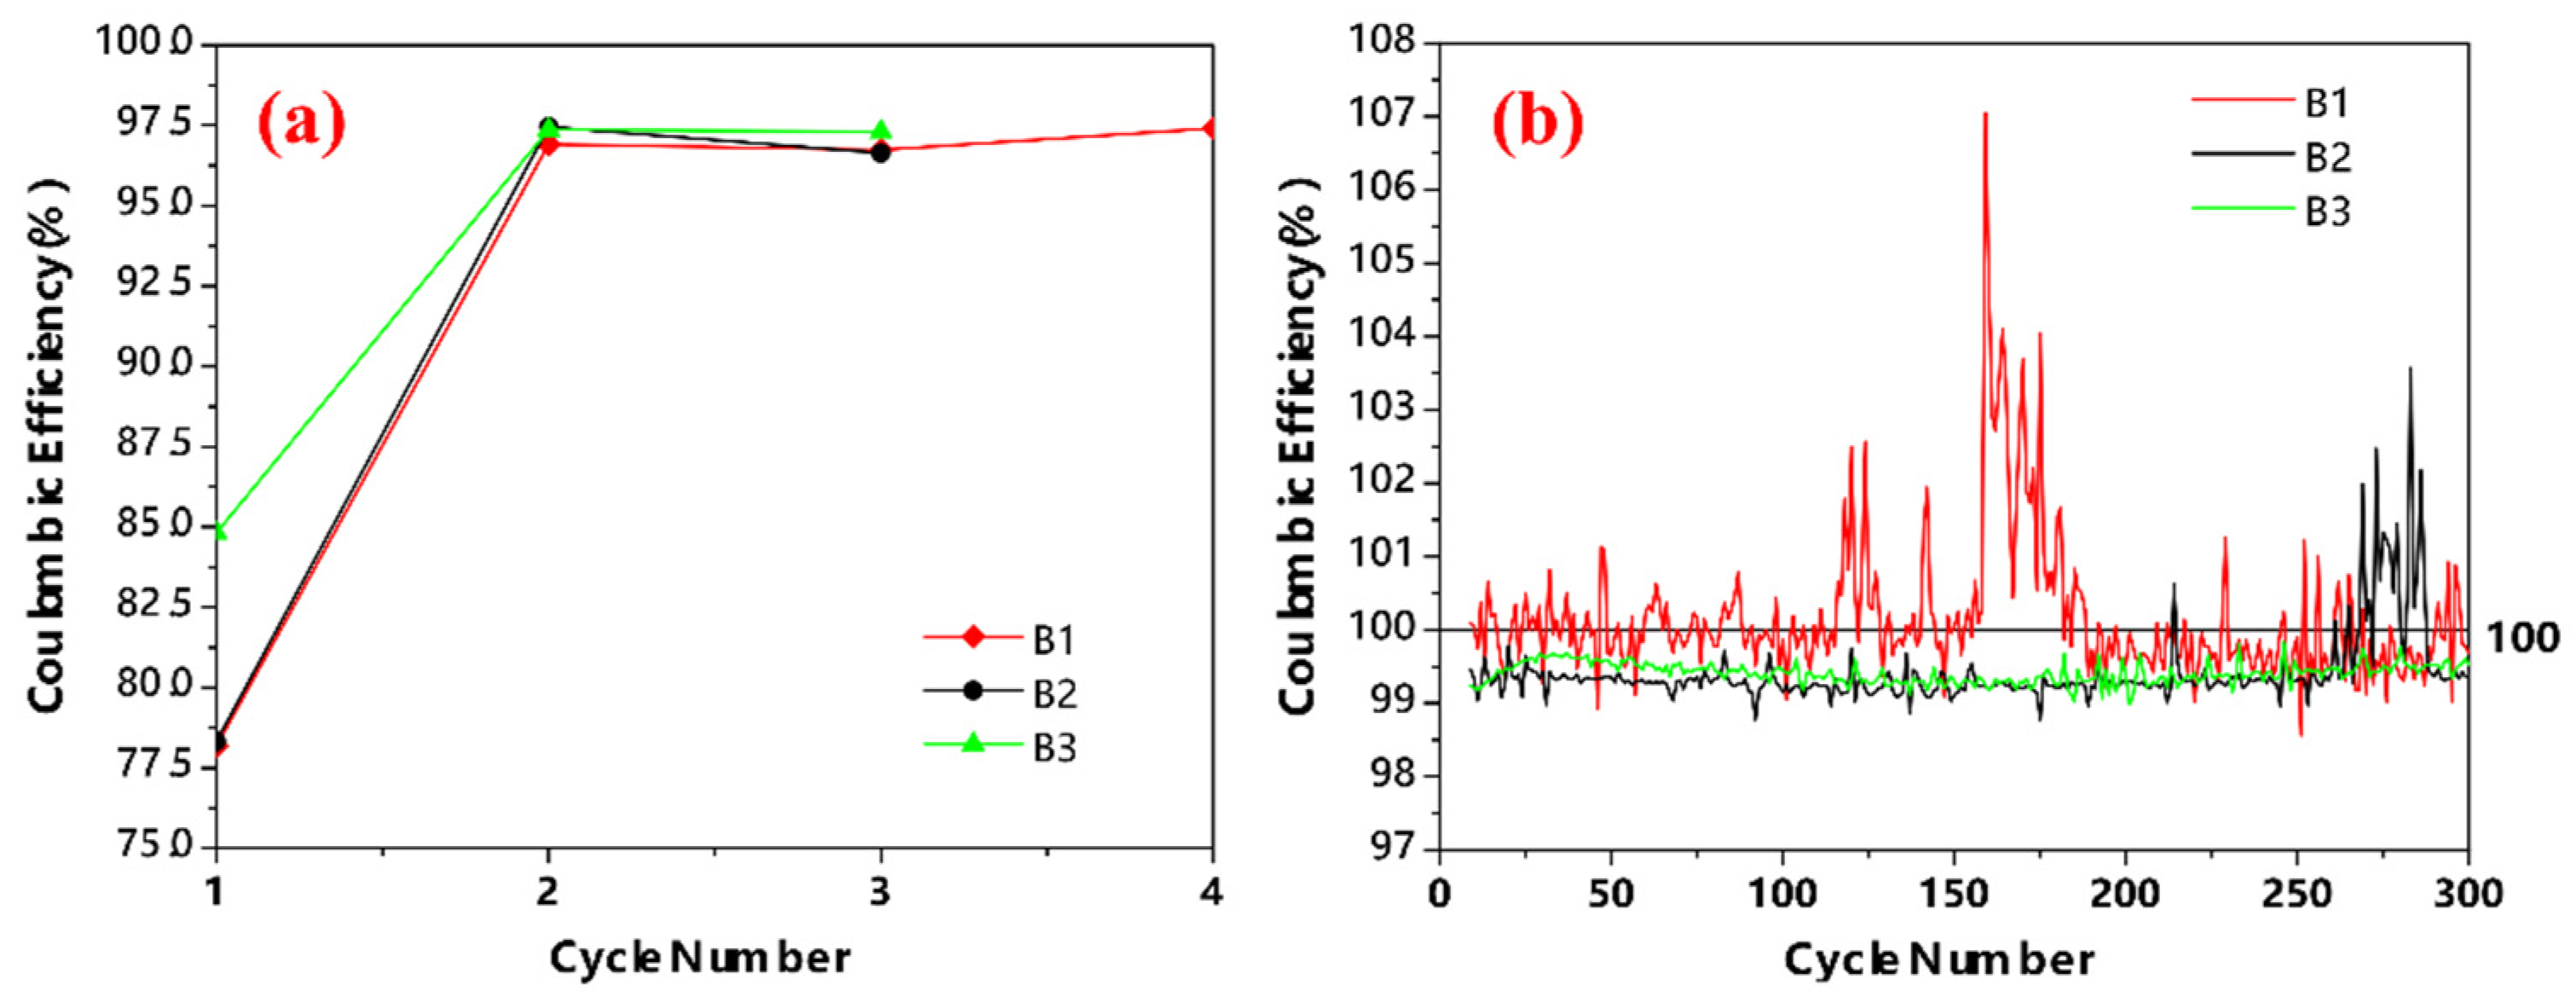
The data of CE can provide invaluable information about the efficiency of electrochemical reactions of Si@void@C anodes. Figure 7 presents the CE of the cells shown in Figure 6 as a function of formation cycles. Note that the first cycle CE (<85%) is low for all three cells because of the well-known SEI formation in the first cycle. However, the B3 cell has a higher CE (84.9%) than B2 (78.2%) because the former has a larger UCV than the latter. The larger UCV allows more Li ions to delithiate from LixSi and thus leads to higher CE. Interestingly, the B1 cell has a similar CE as B2. When compared with B2, the B1 cell has the same UCV as B2 (both at 1.0 V vs. Li+/Li), but has a much smaller LCV at 0.01 V than B2 at 0.1 V vs. Li+/Li. Small LCV has two effects: (i) leading to more lithiation as well as more delithiation from Si@void@C particles and (ii) allowing for the formation of a durable SEI layer [40]. The first effect results in more delithiation (2200 mAh/g) at UCV = 1.0 V for B1 than for B2 (1570 mAh/g). Since the first effect also results in more lithiation for B1 than for B2, the net result is that the two cells have similar CE in the first cycle. The second effect contributes to higher CE in the subsequent cycles because a durable SEI layer can minimize the reformation of SEI layers in the subsequent cycles.
The second and third cycle CE has increased significantly from the first cycle CE for all three cells (Figure 7a). This is consistent with the expectation that most SEI layers are formed in the first cycle. However, the CE values for all three cells are still far below 100% (i.e., <98%), indicating that SEI layer formation is still ongoing in the second and third cycles. Cessation of some active Si@void@C particles in electrochemical reactions due to loss of contact with the conductive CB network after delithiation volume shrinkage and/or particle fracture could also contribute to the CE value less than 100% in the second and third cycles.
The CE of B1, B2, and B3 cells as a function of cycle number in service cycles are shown in Figure 7b. Interestingly, the CE of B1 cell is averaging around 100% in the first 100 cycles, suggesting that the SEI layers formed in formation cycles are durable due to their small LCV at 0.01 V vs. Li+/Li and there is little or no new SEI layer formation in service cycles. In contrast, the CE of B2 and B3 cells are always below 100%, indicating that the SEI layers formed in formation cycles at LCV = 0.1 V vs. Li+/Li are not durable enough and new SEI layers are formed throughout the entire service cycles. Note that B1 and B2 cells exhibit CE higher than 100% at some cycles. This phenomenon is due to the well-known “Li trapping” behavior reported by other researchers [41].
A close comparison between Figure 6 and Figure 7b reveals a surprising result, i.e., the rapid capacity decay in the first 40 service cycles exhibited by B1 and B3 cells cannot be judged from their CE curves because their CEs in this cycle range are similar to those CEs between 40 and 300 cycles. This is unexpected and suggests that the rapid capacity decay in the first 40 service cycles exhibited by B1 and B3 are mainly related to the cessation of some active Si@void@C particles in electrochemical reactions due to loss of contact with the conductive CB network after delithiation volume shrinkage and/or particle fracture. Along with this reasoning, the gradual capacity increase after about 40 service cycles displayed by these two cells (Figure 6) can be attributed to the activation of more Si@void@C particles and/or the inner portion of the Si core in large Si@void@C particles to participate in electrochemical reactions, as discussed in Section 3.3 and Section 3.4. In contrast, the hypothesis of reformation of SEI layers cannot offer a reasonable explanation of the phenomenon of the rapid capacity decay in the first 20–40 cycles and then gradual increase exhibited by B1 and B3 cells in the first 100 to 200 cycles.
Another interesting observation by comparing Figure 6 and Figure 7b is the behavior of the B1 cell which exhibits about 100% CE in the entire service cycles and its capacity does not decrease from 200 to 300 cycles, indicating the importance of forming durable SEI layers in the formation cycles through an LCV = 0.01 V vs. Li+/Li. In contrast, the B2 cell displays a gradual capacity decrease in the entire service cycle, whereas the B3 cell exhibits a gradual capacity decrease from 120 to 300 cycles after it displays gradual capacity increase from 40 to 120 cycles. The gradual capacity decrease beyond 200 cycles for both B2 and B3 mentioned above is likely related to the reformation of SEI layers because of their less durable SEI layers formed in formation cycles with a high LCV = 0.1 V vs. Li+/Li.

3.6. Achieving High Specific Capacity and Good Cycle Stability Simultaneously

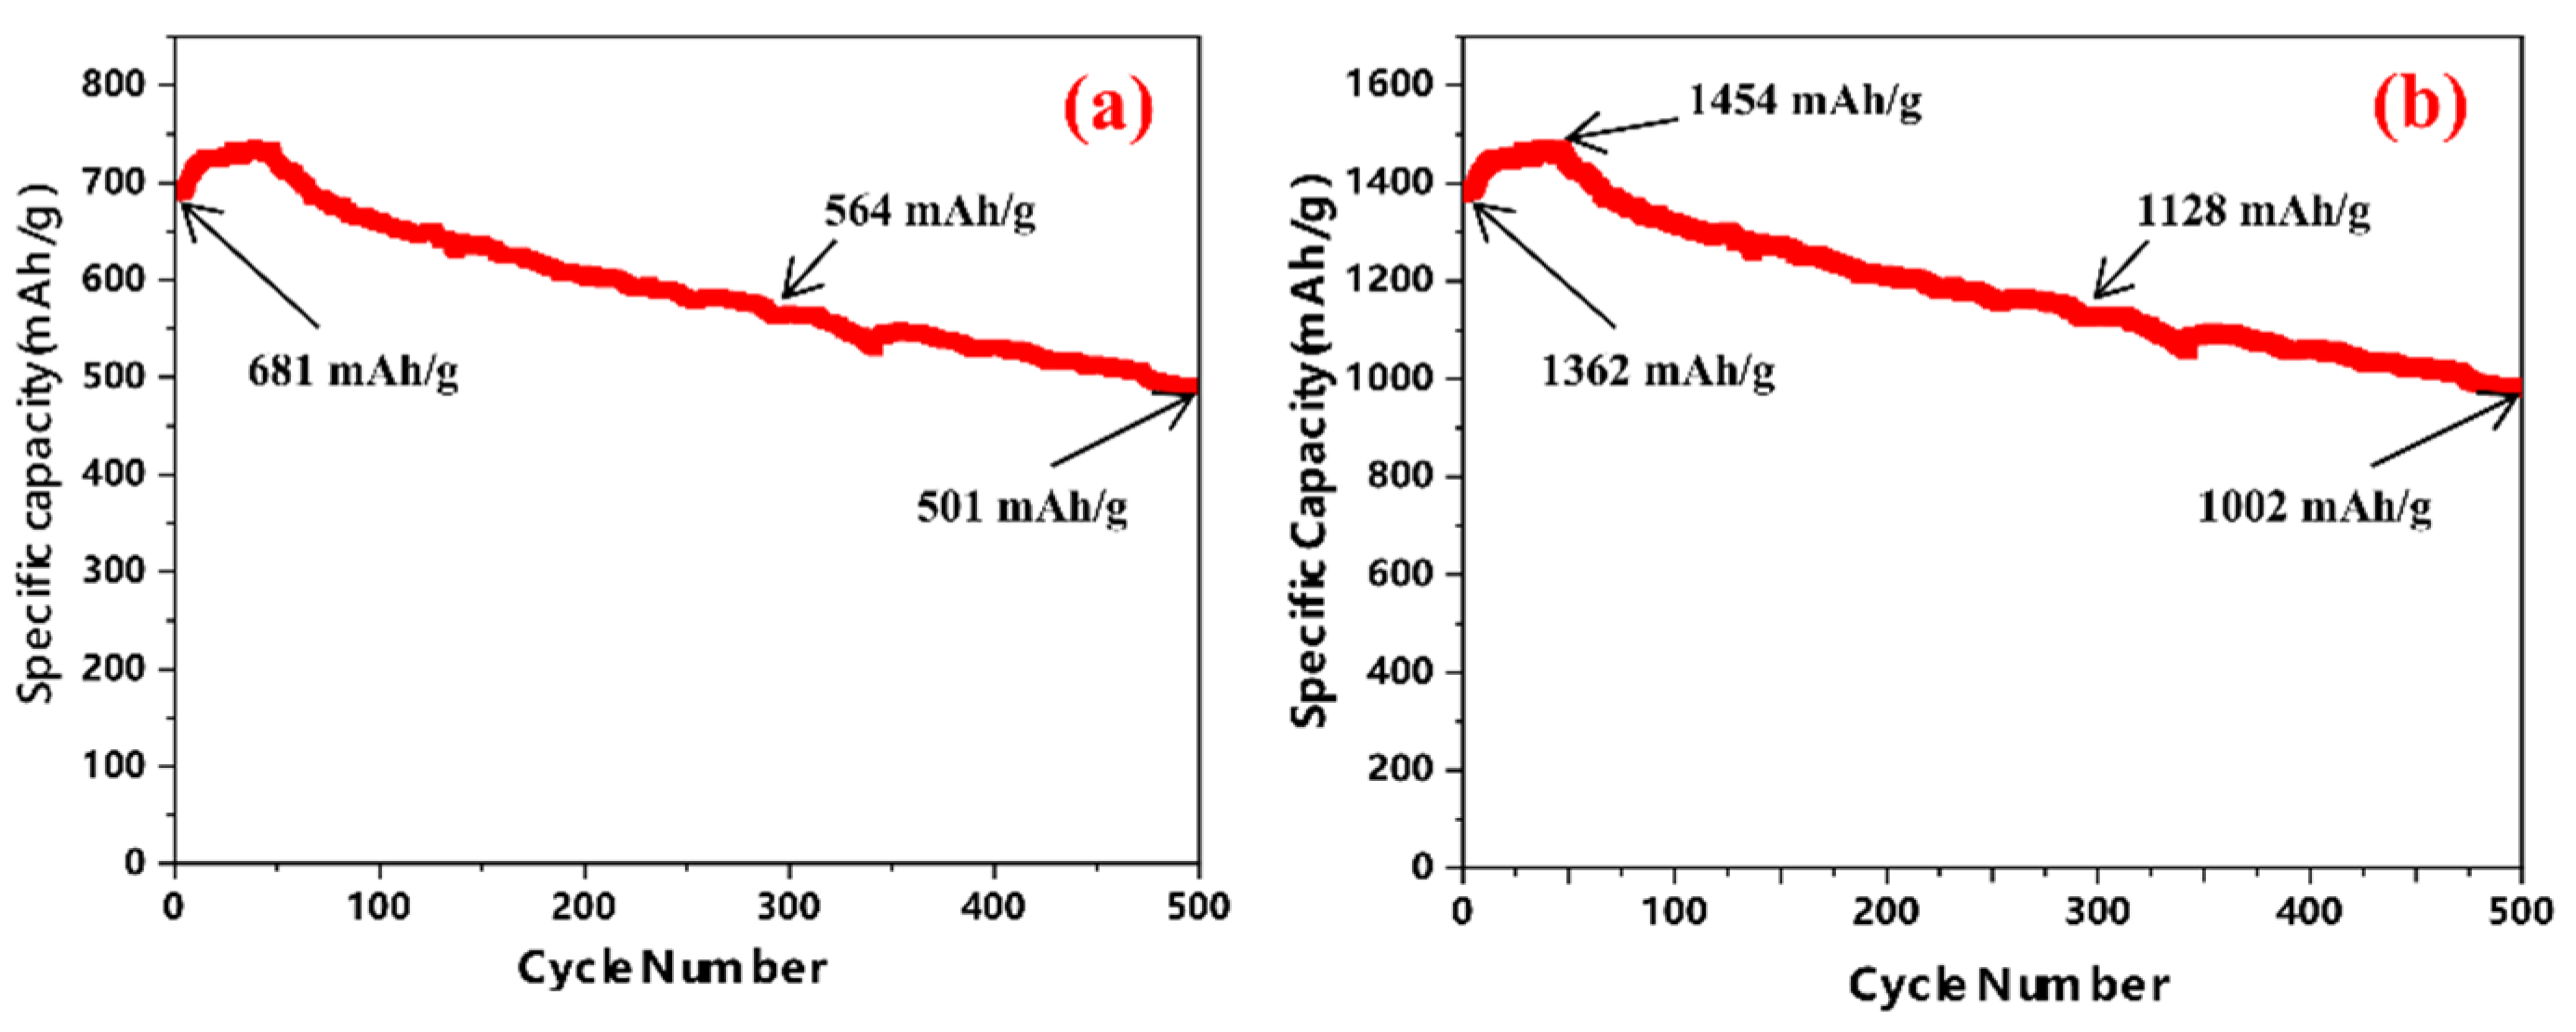
The ultimate goal of investigating Si anodes is to achieve high specific capacity and good cycle stability simultaneously so that Si anodes can replace the state-of-the-art graphite anodes to improve the specific energy of Li-ion batteries. Towards this goal, we have taken what we have learned from the studies of charge/discharge protocol effects and designed a Si@void@C half cell with an electrode composition of 80 wt% Si@void@C without particle classification, 10 wt% CB and 10 wt% PAA. The half cell is subjected to the P4 charge/discharge protocol (Table 3). Note that the formation cycles of P4 are the same as P3, but its LCV and UCV in service cycles are 0.1 V and 1.0 V vs. Li+/Li, respectively. It can be seen from Figure 8a that the delithiation specific capacity of the cell is 681 mAh/g-Si@void@C in the first service cycle. This specific capacity becomes 564 and 501 mAh/g-Si@void@C at the 300th and 500th cycles, respectively. These specific capacities are superior to those of graphite anodes at the electrode level. Specifically, the specific capacities of Si@void@C anodes at the electrode level (including the consideration of CB and PAA weights) are 544.8, 451.2 and 400.8 mAh/g-Si@void@C+CB+PAA at the 1st, 300th and 500th cycles, respectively. In contrast, the typical specific capacity of graphite anodes at the electrode level is 326.6 mAh/g-Graphite+CB+PVDF (assuming the specific capacity of graphite as 355 mAh/g-graphite at the rate of 0.1 A/g-graphite and the electrode composition composed of 92 wt% graphite, 2 wt% CB and 6 wt% PVDF) [42]. As such, the specific capacities of Si@void@C anodes at the electrode level demonstrated in this study are 66.8%, 38.2% and 22.7% higher than that of graphite anodes at the 1st, 300th and 500th cycles, respectively. Thus, Si@void@C anodes investigated in this study have the potential to replace the state-of-the-art graphite anodes for applications with 500 cycle requirements. Recall that Si@void@C anodes in this study have been shown previously to be capable of 1000 cycles but the specific capacity retention is low; further, the specific capacity at the electrode level at the 1000th cycle is lower than that of graphite anodes [36]. Thus, for applications that require 1000 cycles with higher specific capacities at the electrode level than those of graphite anodes, further investigation is still needed in the future.
To compare with other research on Si anodes, Figure 8a is re-plotted in Figure 8b but this time the specific capacity is calculated based on the Si weight in the electrode. In a recent article published in 2022 [25], the authors have ball milled micro-sized Si particles and then coated them with two materials (first carbon and then poly(hexaazatrinaphthalene) (PHATN)). These double-coated Si particles exhibit ~1540 mAh/g-Si specific capacity initially and 1129 mAh/g-Si after 500 cycles at the rate of 1.0 A/g-Si [25]. Our results shown in Figure 8b are close to these specific capacities and capacity retention although the delithiation rate in our case is higher, i.e., 2.0 A/g-Si and Si@void@C has only a carbon coating with one coating operation. Our results are also comparable with the best performances reported in earlier publications [43,44]. Specifically, by treating micro-sized Si particles with a solution of CuSO4 + HF at 80 °C for 12 h followed by treatment with Cu(NO3)2 at 580 °C and then in situ growth of carbon nano-tubes (CNTs) with ethanol as a precursor at 800 °C [43], Zhang et al. have produced micro-sized Si particles linked together by CNTs and coated with a carbon shell and demonstrated 900 mAh/g-Si specific capacity after 500 cycles at 2 A/g-Si. Another investigation [44] starts with SiO powder and subjects it to disproportionation reaction at 950 °C for 5 h, followed by HF treatment at room temperature for 3 h to remove SiO2 and create porous Si particles which are then coated with carbon via chemical vapor deposition. These carbon-coated porous Si particles can offer 1200 mAh/g-Si after 500 cycles at 1.2 A/g-Si [44]. Clearly, our results are comparable with these best performances reported previously. Furthermore, the synthesis method to produce Si@void@C does not involve HF treatment [36], making production of Si@void@C powder eco-friendlier.
To better understand the decay mechanisms of Si@void@C anodes, we have decrimped cycled coin cells with the cycling condition being the same as the cell shown in Figure 8 and examined Si@void@C particles using TEM. As shown in Figure 9a, Si@void@C particles before cycling contain obvious internal voids, as evidenced by clear void contrast. However, the void volume inside Si@void@C particles after 100 cycles (Figure 9b) has reduced significantly, as evidenced by the presence of little void contrast. After 200 and 500 cycles (Figure 9c,d) the void volume becomes little or absent. These results reveal that the void volume inside Si@void@C before cycling is not large enough to accommodate all of the volume expansion of Si cores during lithiation down to 0.1 V vs. Li+/Li (see P4 protocol in Table 3). As a result, most of the internal voids disappear even after delithiation up to 1.0 V vs. Li+/Li. Thus, it is reasonable to deduce that Si@void@C particles are in fact expanding and shrinking during lithiation and delithiation, rather than maintaining a constant size. The volume expansion and shrinkage can result in fracture and re-formation of SEI layers, thereby gradual decay of the specific capacity observed in Figure 8. However, it appears that there is little particle fracture, if any, since many Si@void@C particles remain to have sizes of 100–150 nm even after 500 cycles. In other words, the presence of the internal voids in Si@void@C particles before cycles has minimized or prevented particle fracture during cycling and this is the reason why Si@void@C can offer 500 cycles with reasonable capacity retention (Figure 8). Based on this TEM analysis, it can be concluded that more internal voids are needed through longer etching time to further improve the cycle stability of Si@void@C particles in the future.

4. Conclusions

The present study investigates the effects of Si@void@C particle size and charge/discharge protocols on the specific capacity and cycle stability of Si@void@C anodes. Based on this investigation, several conclusions can be drawn.
  • Small Si@void@C particles have the advantage of higher specific capacity than large Si@void@C particles because the former has a larger electrode/electrolyte interfacial area for lithiation and delithiation. However, small Si@void@C particles do not have the advantage in the cycle stability over larger Si@void@C particles.
  • Charge/discharge protocols in both formation and service cycles have a profound impact on the specific capacity and cycle stability of Si@void@C anodes. Although formation cycles are typically only a few cycles (e.g., 3 to 5 cycles), their influence is far-reaching and can be seen even after 500 service cycles.
  • A high LCV (e.g., 0.1 V vs. Li+/Li) in formation cycles results in a small specific capacity at the 1st service cycle but has good cycle stability and high specific capacity after 500 service cycles because it has a small volume change in formation cycles. In contrast, a small LCV (e.g., 0.05 V vs. Li+/Li) in formation cycles results in a large specific capacity at the 1st service cycle but has poor cycle stability and low specific capacity after 500 service cycles because it has a large volume change in formation cycles.
  • A high UCV (e.g., 1.5 V vs. Li+/Li) in both formation and service cycles results in high specific capacity initially but with poor cycle stability. In comparison, a low UCV (e.g., 1.0 V vs. Li+/Li) leads to low specific capacity initially but with good cycle stability. Such a phenomenon is attributed to the fact that lower UCV leads to less volume shrinkage of Si@void@C particles during delithiation and thus smaller compressive stresses on the SEI layer, thereby less fracture and reformation of the SEI layer.
  • CC charge protocol always leads to rapid capacity decay in the first 20 to 40 cycles, followed by a gradual capacity increase in the next 50 to 150 cycles and then capacity decrease again as the cycle number increases.
  • CCCV charge protocol can mitigate rapid capacity decay in the first 20 to 40 cycles because it can minimize polarization and lead to more uniform lithiation of most Si@void@C particles to avoid overcharge of some Si@void@C particles, thereby preventing loss of some Si@void@C particles in contact with CB conductive network and/or severe fracture and reformation of their SEI layers.
  • The CE analysis reveals that the LCV at 0.01 V vs. Li+/Li in the formation cycles can provide a CE averaging around 100% in the service cycles, suggesting that the SEI layers formed in the formation cycles are durable due to their small LCV and there is little or no new SEI layer formation in the service cycles. In contrast, the CE in the service cycles is always below 100% for the LCV at high values (such as LCV = 0.1 V vs. Li+/Li) in the formation cycles, indicating that the SEI layers formed in the formation cycles is not durable enough and new SEI layers are formed throughout the entire service cycles.
  • With proper charge/discharge protocols Si@void@C anodes can offer specific capacities of 544.8, 451.2 and 400.8 mAh/g-Si@void@C+CB+PAA at the electrode level for the 1st, 300th and 500th cycles. These specific capacities at the electrode level are 66.8%, 38.2% and 22.7% higher than those of graphite anodes at the 1st, 300th and 500th cycles, respectively. Thus, Si@void@C anodes investigated in this study have the potential to replace the state-of-the-art graphite anodes for applications with 500 cycle requirements in the future.

Author Contributions

B.L., M.L. and Z.W. have designed experiments with L.S., B.L., M.L., Z.W. and C.P. have conducted experiments and analyzed the results. L.S. and B.L. have written the article and all the authors have discussed the results and reviewed the manuscript. All authors have read and agreed to the published version of the manuscript.

Funding

This research was funded by the U.S. National Science Foundation with the grant numbers CMMI-1660572 and IIP-1918991.

Data Availability Statement

Data are included within the article.

Acknowledgments

This work was supported by the U.S. National Science Foundation (NSF) with the award numbers CMMI-1660572 and IIP-1918991. L.S. is also grateful to the Rowe Family Endowment Fund. The use of the Center for Nanoscale Materials (CNM) was supported by the US Department of Energy, Office of Science, Office of Basic Energy Sciences, under Contract No. DE-AC02-06CH11357.

Conflicts of Interest

Three patent applications have been filed, including U.S. Patent Application #16/646,252, China Patent Application #201980007509.X and EU Patent Application #19741670.4, for design of nano-channel shaped voids and the internal carbon networks as well as the method to create Si micro-reactors with nano-channel shaped voids and internal carbon networks.

References

  1. Larcher, D.; Beattie, S.; Morcrette, M.; Edström, K.; Jumas, J.C.; Tarascon, J.M. Recent findings and prospects in the field of pure metals as negative electrodes for Li-ion batteries. J. Mater. Chem. 2007, 17, 3759–3772. [Google Scholar] [CrossRef]
  2. Ashuri, M.; He, Q.; Shaw, L.L. Silicon as a potential anode material for Li-ion batteries: Where size, geometry and structure matter. Nanoscale 2016, 8, 74–103. [Google Scholar] [CrossRef] [PubMed]
  3. Li, J.Y.; Xu, Q.; Li, G.; Yin, Y.X.; Wan, L.J.; Guo, Y.G. Research progress regarding Si-based anode materials towards practical application in high energy density Li-ion batteries. Mater. Chem. Front. 2017, 1, 1691–1708. [Google Scholar] [CrossRef]
  4. Chan, C.K.; Peng, H.; Liu, G.; McIlwrath, K.; Zhang, X.F.; Huggins, R.A.; Cui, Y. High-performance lithium battery anodes using silicon nanowires. Nat. Nanotechnol. 2008, 3, 31–35. [Google Scholar] [CrossRef] [PubMed]
  5. Sun, Y.; Liu, N.; Cui, Y. Promises and challenges of nanomaterials for lithium-based rechargeable batteries. Nat. Energy 2016, 1, 16071. [Google Scholar] [CrossRef]
  6. Jin, Y.; Zhu, B.; Lu, Z.; Liu, N.; Zhu, J. Challenges and recent progress in the development of Si anodes for lithium-ion battery. Adv. Energy Mater. 2017, 7, 1700715. [Google Scholar] [CrossRef] [Green Version]
  7. Wetjen, M.; Solchenbach, S.; Pritzl, D.; Hou, J.; Tileli, V.; Gasteiger, H.A. Morphological changes of silicon nanoparticles and the influence of cutoff potentials in silicon-graphite electrodes. J. Electrochem. Soc. 2018, 7, A1503–A1514. [Google Scholar] [CrossRef] [Green Version]
  8. Zhang, T.; Gao, J.; Zhang, H.P.; Yang, L.C.; Wu, Y.P.; Wu, H.Q. Preparation and electrochemical properties of core-shell Si/SiO nanocomposite as anode material for lithium ion batteries. Electrochem. Commun. 2007, 9, 886–890. [Google Scholar] [CrossRef]
  9. Hwa, Y.; Kim, W.-S.; Hong, S.-H.; Sohn, H.-J. High capacity and rate capability of core–shell structured nano-Si/C anode for Li-ion batteries. Electrochim. Acta 2012, 71, 201–205. [Google Scholar] [CrossRef]
  10. Liu, N.; Wu, H.; McDowell, M.T.; Yao, Y.; Wang, C.; Cui, Y. A yolk-shell design for stabilized and scalable Li-ion battery alloy anodes. Nano Lett. 2012, 12, 3315–3321. [Google Scholar] [CrossRef]
  11. Park, Y.; Choi, N.-S.; Park, S.; Woo, S.H.; Sim, S.; Jang, B.Y.; Oh, S.M.; Park, S.; Cho, J.; Lee, K.T. Si-encapsulating hollow carbon electrodes via electroless etching for lithium-ion batteries. Adv. Energy Mater. 2013, 3, 206–212. [Google Scholar] [CrossRef]
  12. Yang, L.Y.; Li, H.Z.; Liu, J.; Sun, Z.Q.; Tang, S.S.; Lei, M. Dual yolk-shell structure of carbon and silica-coated silicon for high-performance lithium-ion batteries. Sci. Rep. 2015, 5, 10908. [Google Scholar] [CrossRef] [PubMed] [Green Version]
  13. Xie, J.; Tong, L.; Su, L.; Xu, Y.; Wang, L.; Wang, Y. Core-shell yolk-shell Si@C@Void@C nanohybrids as advanced lithium ion battery anodes with good electronic conductivity and corrosion resistance. J. Power Sources 2017, 342, 529–536. [Google Scholar] [CrossRef]
  14. Pan, L.; Wang, H.; Gao, D.; Chen, S.; Tan, L.; Li, L. Facile synthesis of yolk–shell structured Si–C nanocomposites as anodes for lithium-ion batteries. Chem. Commun. 2014, 50, 5878–5880. [Google Scholar] [CrossRef] [PubMed] [Green Version]
  15. Liu, N.; Lu, Z.; Zhao, J.; McDowell, M.T.; Lee, H.-W.; Zhao, W.; Cui, Y. A pomegranate-inspired nanoscale design for large-volume-change lithium battery anodes. Nat. Nanotechnol. 2014, 9, 187–192. [Google Scholar] [CrossRef]
  16. An, Y.; Fei, H.; Zeng, G.; Ci, L.; Xiong, S.; Feng, J.; Qian, Y. Green, scalable, and controllable fabrication of nanoporous silicon from commercial alloy precursors for high-energy lithium-ion batteries. ACS Nano 2018, 12, 4993–5002. [Google Scholar] [CrossRef] [PubMed]
  17. Yi, R.; Dai, F.; Gordin, M.L.; Chen, S.; Wang, D. Micro-sized Si-C composite with interconnected nanoscale building blocks as high-performance anodes for practical application in lithium-ion batteries. Adv. Energy Mater. 2013, 3, 295–300. [Google Scholar] [CrossRef]
  18. Tian, H.; Tan, X.; Xin, F.; Wang, C.; Han, W. Micro-sized nano-porous Si/C anodes for lithium ion batteries. Nano Energy 2015, 11, 490–499. [Google Scholar] [CrossRef]
  19. Cui, L.-F.; Ruffo, R.; Chan, C.K.; Peng, H.; Cui, Y. Crystalline-amorphous core−shell silicon nanowires for high capacity and high current battery electrodes. Nano Lett. 2009, 9, 491–495. [Google Scholar] [CrossRef]
  20. Ge, M.; Rong, J.; Fang, X.; Zhou, C. Porous doped silicon nanowires for lithium ion battery anode with long cycle life. Nano Lett. 2012, 12, 2318–2323. [Google Scholar] [CrossRef]
  21. Wu, H.; Chan, G.; Choi, J.W.; Ryu, I.; Yao, Y.; McDowell, M.T.; Lee, S.W.; Jackson, A.; Yang, Y.; Hu, L.; et al. Stable cycling of double-walled silicon nanotube battery anodes through solid-electrolyte interphase control. Nat. Nanotechnol. 2012, 7, 310–315. [Google Scholar] [CrossRef] [PubMed]
  22. Song, T.; Xia, J.; Lee, J.-H.; Lee, D.H.; Kwon, M.-S.; Choi, J.-M.; Wu, J.; Doo, S.K.; Chang, H.; Park, W.I.; et al. Arrays of sealed silicon nanotubes as anodes for lithium ion batteries. Nano Lett. 2010, 10, 1710–1716. [Google Scholar] [CrossRef]
  23. Lee, D.J.; Lee, H.; Ryou, M.-H.; Han, G.-B.; Lee, J.-N.; Song, J.; Choi, J.; Cho, K.Y.; Lee, Y.M.; Park, J.-K. Electrospun three-dimensional mesoporous silicon nanofibers as an anode material for high-performance lithium secondary batteries. ACS Appl. Mater. Interfaces 2013, 5, 12005–12010. [Google Scholar] [CrossRef]
  24. Xue, L.; Fu, K.; Li, Y.; Xu, G.; Lu, Y.; Zhang, S.; Toprakci, O.; Zhang, X. Si/C composite nanofibers with stable electric conductive network for use as durable lithium-ion battery anode. Nano Energy 2013, 2, 361–367. [Google Scholar] [CrossRef]
  25. Wang, Q.; Zhu, M.; Chen, G.; Dudko, N.; Li, Y.; Liu, H.; Shi, L.; Wu, G.; Zhang, D. High-performance microsized Si anodes for lithium-ion batteries: Insights into the polymer configuration conversion mechanism. Adv. Mater. 2022, 34, 2109658. [Google Scholar] [CrossRef] [PubMed]
  26. Parikh, P.; Sina, M.; Banerjee, A.; Wang, X.; Savio D’Souza, M.; Doux, J.-M.; Wu, E.A.; Trieu, O.Y.; Gong, Y.; Zhou, Q.; et al. Role of polyacrylic acid (PAA) binder on the solid electrolyte interphase in silicon anodes. Chem. Mater. 2019, 31, 2535–2544. [Google Scholar] [CrossRef]
  27. Magasinski, A.; Zdyrko, B.; Kovalenko, I.; Hertzberg, B.; Burtovyy, R.; Huebner, C.F.; Fuller, T.F.; Luzinov, I.; Yushin, G. Toward efficient binders for Li-ion battery Si-based anodes: Polyacrylic acid. ACS Appl. Mater. Interfaces 2019, 2, 3004–3010. [Google Scholar] [CrossRef]
  28. Song, J.; Zhou, M.; Yi, R.; Xu, T.; Tang, D.; Yu, Z.; Regula, M.; Wang, D. Interpenetrated gel polymer binder for high-performance silicon anodes in lithium-ion batteries. Adv. Funct. Mater. 2014, 24, 5904–5910. [Google Scholar] [CrossRef]
  29. Jiao, X.; Yin, J.; Xu, X.; Wang, J.; Liu, Y.; Xiong, S.; Zhang, Q.; Song, J. Highly energy-dissipative, fast self-healing binder for stable Si anode in lithium-ion batteries. Adv. Funct. Mater. 2021, 31, 2005699. [Google Scholar] [CrossRef]
  30. Zhang, H.; Liu, S.; Yu, X.; Chen, S. Improving rate capacity and cycling stability of Si-anode lithium ion battery by using copper nanowire as conductive additive. J. Alloys Compd. 2020, 822, 153664. [Google Scholar] [CrossRef]
  31. Martinez De La Hoz, J.M.; Soto, F.A.; Balbuena, P.B. Effect of the electrolyte composition on SEI reactions at Si anodes of Li ion batteries. J. Phys. Chem. C 2015, 119, 7060–7068. [Google Scholar] [CrossRef]
  32. Nie, M.; Song, J.; Zhou, M.; Yi, R.; Xu, T.; Tang, D.; Yu, Z.; Regula, M.; Wang, D.; Abraham, D.P.; et al. Silicon solid electrolyte interphase (SEI) of lithium ion battery characterized by microscopy and spectroscopy. J. Phys. Chem. C 2013, 117, 13403–13412. [Google Scholar] [CrossRef]
  33. Jia, H.; Zou, L.; Gao, P.; Cao, X.; Zhao, W.; He, Y.; Engelhard, M.H.; Burton, S.D.; Wang, H.; Ren, X.; et al. High-performance silicon anodes enabled by nonflammable localized high-concentration electrolytes. Adv. Energy Mater. 2019, 9, 1900784. [Google Scholar] [CrossRef]
  34. Jin, Y.; Kneusels, N.-J.H.; Marbella, L.E.; Castillo-Martínez, E.; Magusin, P.C.M.M.; Weatherup, R.S.; Jónsson, E.; Liu, T.; Paul, S.; Grey, C.P. Understanding fluoroethylene carbonate and vinylene carbonate based electrolytes for Si anodes in lithium ion batteries with NMR spectroscopy. J. Am. Chem. Soc. 2018, 140, 9854–9867. [Google Scholar] [CrossRef] [PubMed] [Green Version]
  35. Li, Q.; Liu, X.; Han, X.; Xiang, Y.; Zhong, G.; Wang, J.; Zheng, B.; Zhou, J.; Yang, Y. Identification of the solid electrolyte interface on the Si/C composite anode with FEC as the additive. ACS Appl. Mater. Interfaces 2019, 11, 14066–14075. [Google Scholar] [CrossRef]
  36. He, Q.; Ashuri, M.; Liu, Y.; Liu, B.; Shaw, L. Silicon micro-reactor as a fast charge, long cycle life anode with high initial coulombic efficiency for Li-ion batteries. ACS Appl. Energy Mater. 2021, 4, 4744–4757. [Google Scholar] [CrossRef]
  37. Klett, M.; Gilbert, J.A.; Pupek, K.Z.; Trask, S.E.; Abraham, D.P. Layered oxide, graphite and silicon-graphite electrodes for lithium-ion cells: Effect of electrolyte composition and cycling windows. J. Electrochem. Soc. 2017, 164, A6095–A6102. [Google Scholar] [CrossRef]
  38. Prado, A.Y.R.; Rodrigues, M.-T.F.; Trask, S.E.; Shaw, L.; Abraham, D.P. Electrochemical dilatometry of Si-bearing electrodes: Dimensional changes and experimental design. J. Electrochem. Soc. 2020, 167, 160551. [Google Scholar] [CrossRef]
  39. Strobridge, F.C.; Orvananos, B.; Croft, M.; Yu, H.-C.; Robert, R.; Liu, H.; Zhong, Z.; Connolley, T.; Drakopoulos, M.; Thornton, K.; et al. Mapping the inhomogeneous electrochemical reaction through porous LiFePO4-electrodes in a standard coin cell battery. Chem. Mater. 2015, 27, 2374–2386. [Google Scholar] [CrossRef] [Green Version]
  40. Markevich, E.; Fridman, K.; Sharabi, R.; Elazari, R.; Salitra, G.; Gottlieb, H.E.; Gershinsky, G.; Garsuch, A.; Semrau, A.; Schmidt, M.A.; et al. Amorphous columnar silicon anodes for advanced high voltage lithium ion full cells: Dominant factors governing cycling performance. J. Electrochem. Soc. 2013, 160, A1824–A1833. [Google Scholar] [CrossRef]
  41. Zhu, B.; Liu, G.; Mu, Y.; Zhao, Y.; Wang, Y.; Li, X.; Yao, P.; Deng, Y.; Cui, Y.; Zhu, J. Minimized lithium trapping by isovalent isomorphism for high initial Coulombic efficiency of silicon anodes. Sci. Adv. 2019, 5, eaax0651. [Google Scholar] [CrossRef] [PubMed] [Green Version]
  42. Kim, D.S.; Kim, Y.E.; Kim, H. Improved fast charging capability of graphite anodes via amorphous Al2O3 coating for high power lithium ion batteries. J. Power Sources 2019, 422, 18–24. [Google Scholar] [CrossRef]
  43. Zhang, Z.; Han, X.; Li, L.; Su, P.; Huang, W.; Wang, J.; Xu, J.; Li, C.; Chen, S.; Yang, Y. Tailoring the interfaces of silicon/carbon nanotube for high rate lithium-ion battery anodes. J. Power Sources 2020, 450, 227593. [Google Scholar] [CrossRef]
  44. Yi, R.; Dai, F.; Gordin, M.L.; Sohn, H.; Wang, D. Influence of silicon nanoscale building blocks size and carbon coating on the performance of micro-sized Si-C composite Li-ion anodes. Adv. Energy Mater. 2013, 3, 1507–1515. [Google Scholar] [CrossRef]
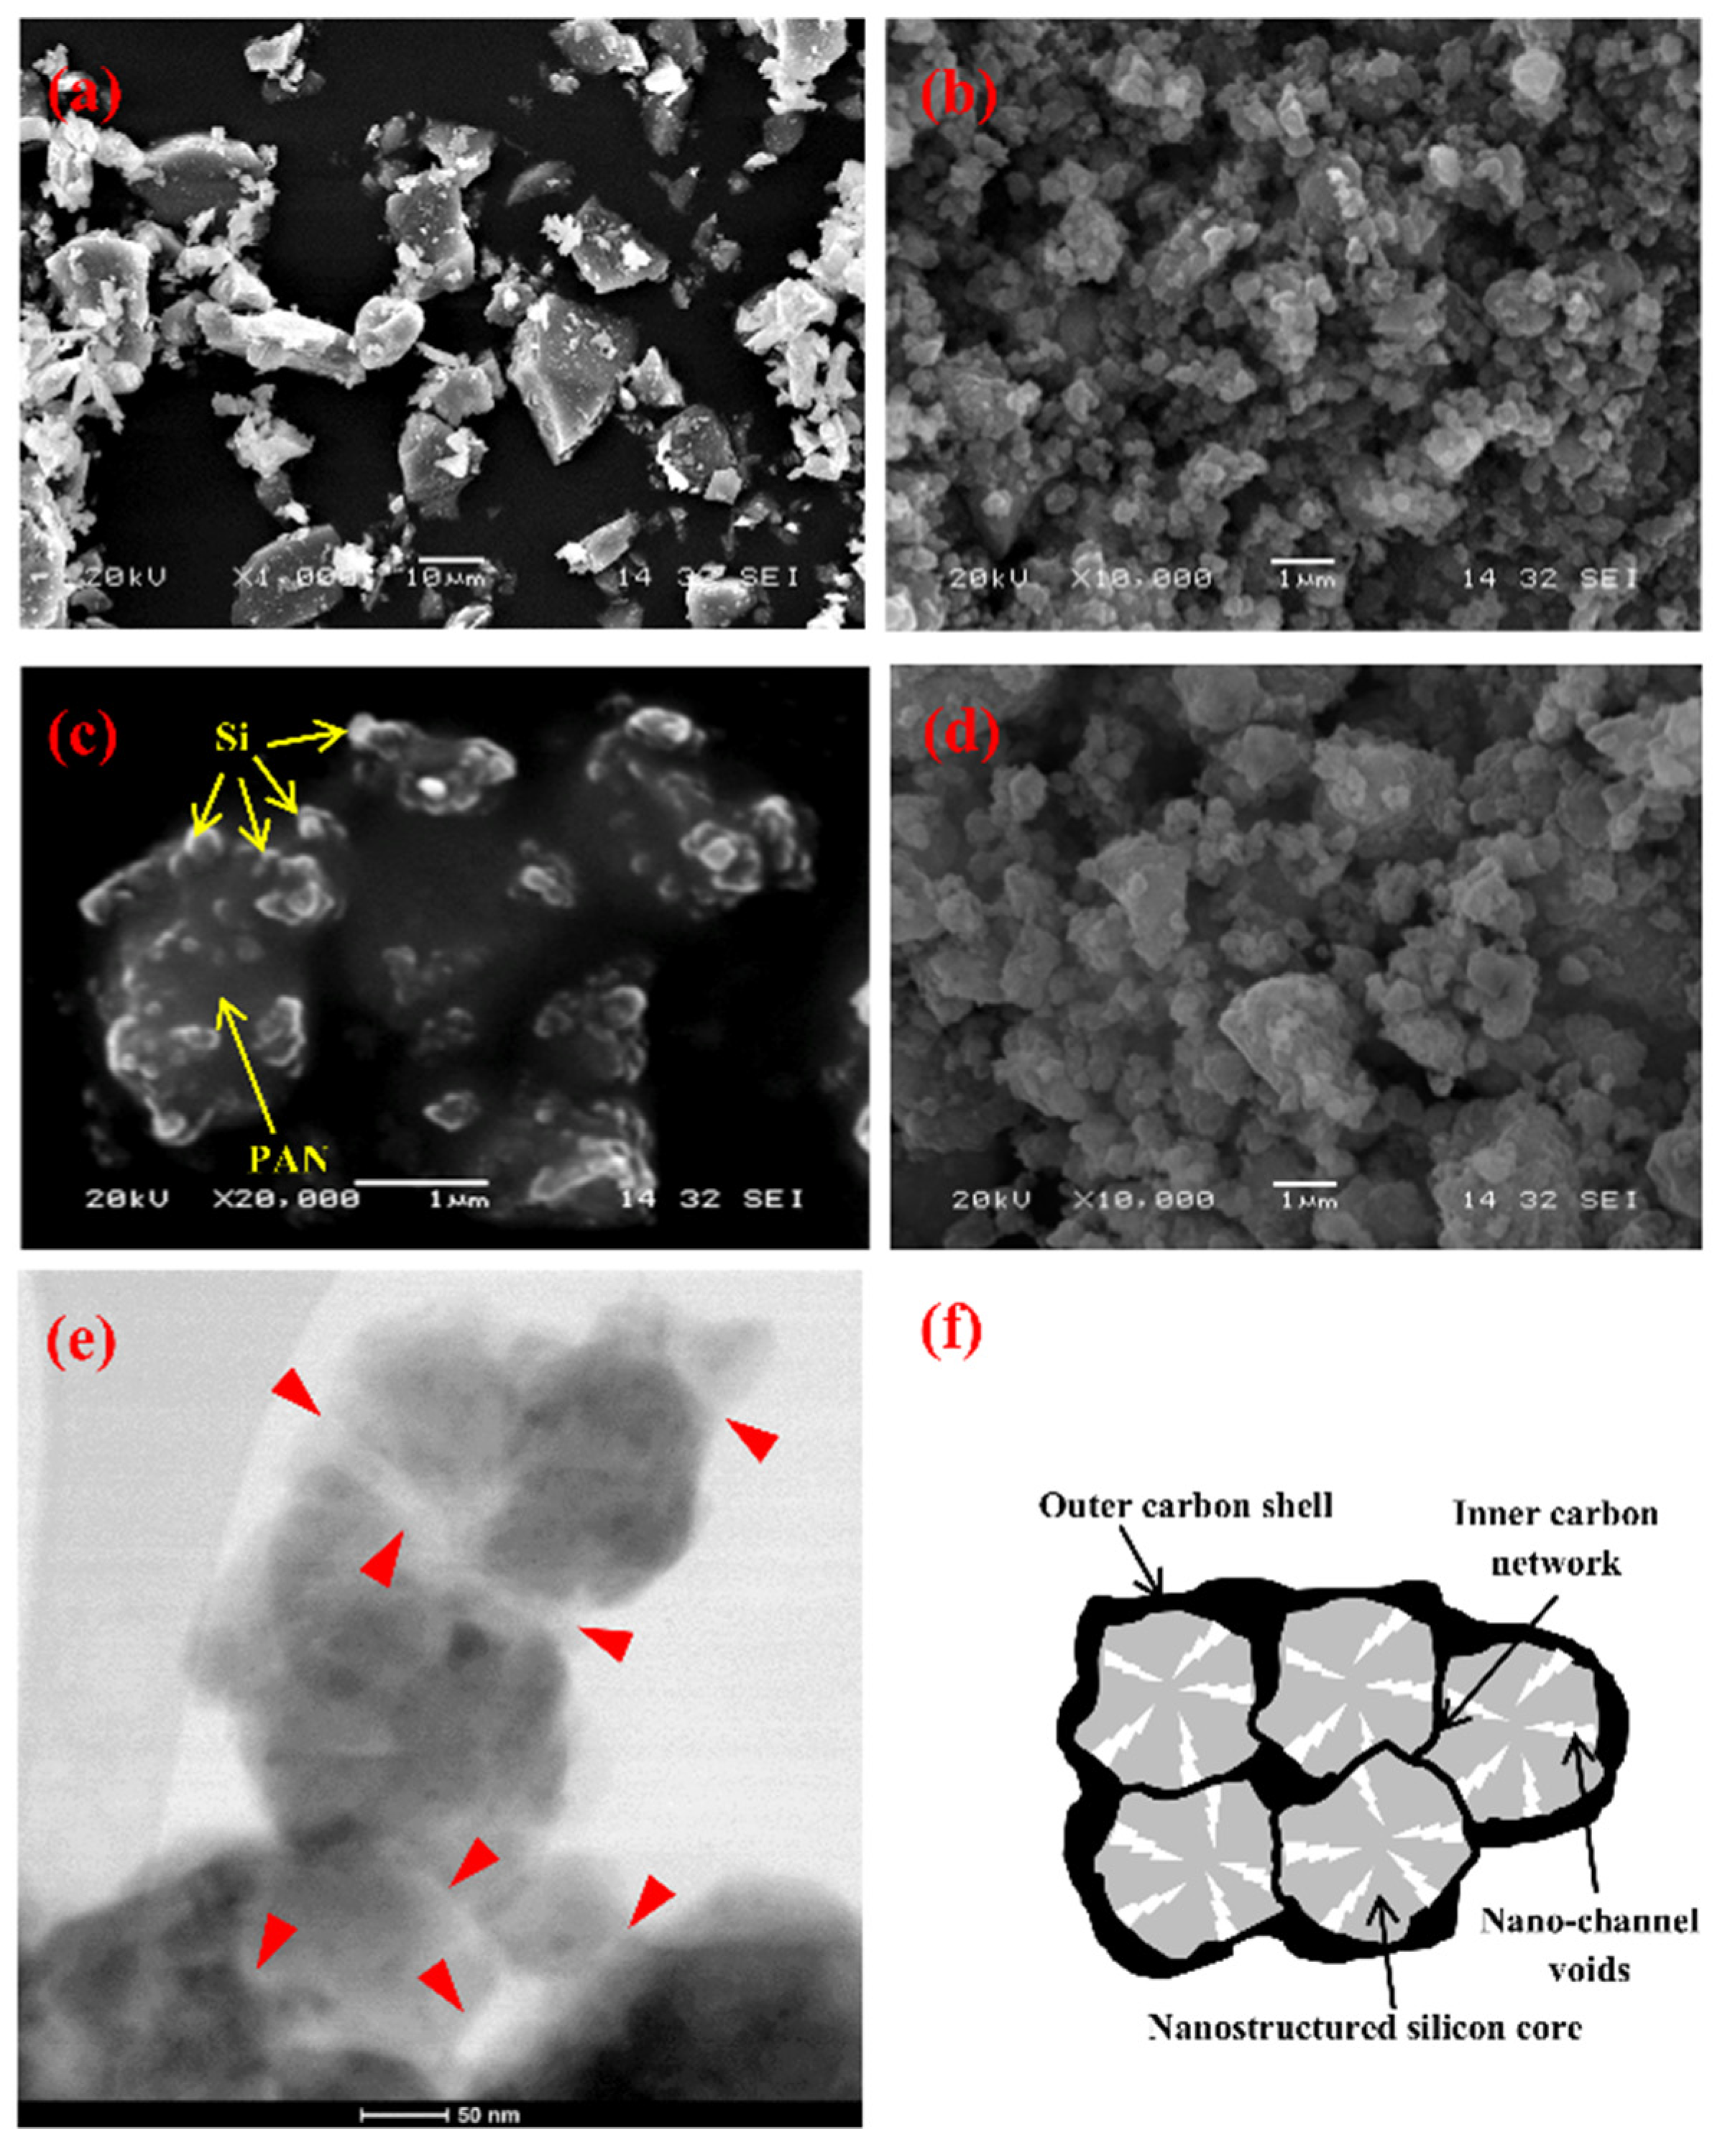
Figure 1. SEM images: (a) silicon powder before ball milling, (b) Si/PAN powder after ball milling, (c) a close view of Si/PAN powder after ball milling (arrows showing Si nanoparticles embedded in a PAN matrix), and (d) the final product of Si@void@C powder. (e) STEM image of several Si@void@C particles (arrows indicating the presence of nano-channel shaped voids), and (f) schematic of a Si@void@C particle with internal carbon networks and nano-channel voids inside the silicon core which is encapsulated by an outer carbon shell.
Batteries 08 00154 g001
Figure 2. The voltage vs. specific capacity curves of Si@void@C half cells: (a) the smallest size group of Si@void@C powder and (b) Si@void@C powder without particle classification. Both electrodes have the same Si@void@C mass loading at 1.0 mg/cm2. The electrode composition is 20 wt% carbon black (CB), 20 wt% PAA, and 60 wt% Si@void@C active material. The charge/discharge conditions are the same for both cells, i.e., (i) 3 cycles at the current density of 0.05 A/g between 0.01 V and 1.0 V; (ii) 3 cycles at 0.1 A/g between 0.05 V and 1.0 V; and (iii) 3 cycles at 0.5 A/g between 0.05 V and 1.0 V (vs. Li+/Li).
Batteries 08 00154 g002
Figure 3. A comparison in the specific capacity as a function of cycle numbers between the cell made of the smallest size group of Si@void@C powder and the cell made of Si@void@C powder without particle classification. Both cells have the same formation and service cycles. See the text for details.
Batteries 08 00154 g003
Figure 4. The specific capacity as a function of cycle numbers: (a) M1 cell, (b) M2 cell, and (c) M3 cell. All of them are made of Si@void@C powder without particle classification. Further, all of them have the same service cycles. The different specific capacities and cycle stabilities are due to different lower cutoff voltages in formation cycles. See Table 2 for detailed charge/discharge protocols. The specific capacities at the 1st and 500th service cycles are indicated for each cell.
Batteries 08 00154 g004
Figure 5. A comparison in the specific capacity as a function of cycle numbers between M4 and M5 cells. Both of them are made of Si@void@C powder without particle classification. The UCV of M4 is 1.0 V vs. Li+/Li, whereas the UCV of M5 is 1.5 V. See Table 1 for more details.
Batteries 08 00154 g005
Figure 6. The specific capacity as a function of cycle numbers: (a) B1 cell with P2 protocol, (b) B2 cell with P3, and (c) B3 cell with P1 (see Table 3 for the details of P1, P2 and P3 protocols). All of the electrodes are made of the smallest size group of Si@void@C powder. Further, B1, B2 and B3 cells have the same Si@void@C electrode but with different charge/discharge protocols as indicated above.
Batteries 08 00154 g006
Figure 7. The Coulombic efficiencies of B1, B2, and B3 cells as a function of (a) cycle number in formation cycles and (b) cycle number in service cycles.
Batteries 08 00154 g007
Figure 8. The specific capacity of a Si@void@C half cell as a function of service cycles: (a) the specific capacity based on the Si@void@C weight in the electrode and (b) the specific capacity based on the Si weight in the electrode. Note that the electrode is composed of 80 wt% Si@void@C, 10 wt% CB and 10 wt% PAA.
Batteries 08 00154 g008
Figure 9. TEM images of Si@void@C particles: (a) before cycles, (b) after 100 cycles, (c) after 200 cycles, and (d) after 500 cycles. All cycled particles were obtained after the cells were delithiated up to 1.0 V (vs. Li+/Li).
Batteries 08 00154 g009
Table 1. Si@void@C particle size distribution.
(a) 100 to 650 nm(b) 650 to 1200 nm(c) >1200 nm(d) 100 to >1200 nm
45 wt%34 wt%21 wt%No classification
Table 2. Charge/discharge protocol and specific capacities at selected cycles for M1–M5 cells.
Sample IDFormation CyclesService CyclesSpecific Capacity at
the 1st Service Cycle
Specific Capacity at
the 500th Service Cycle
M1(a) 3 cycles at 0.05 A/g between 0.05 V and 1.5 V vs. Li+/Li.
(b) 3 cycles at 0.1 A/g between 0.05 V and 1.5 V vs. Li+/Li.
500 cycles at 0.5 A/g
between 0.1 and 1.5 V vs. Li+/Li.
840 mAh/g300 mAh/g
M2(a) 3 cycles at 0.05 A/g between 0.075 V and 1.5 V.
(b) 3 cycles at 0.1 A/g between 0.075 V and 1.5 V.
500 cycles at 0.5 A/g
between 0.1 and 1.5 V.
710 mAh/g400 mAh/g
M3(a) 3 cycles at 0.05 A/g between 0.1 V and 1.5 V.
(b) 3 cycles at 0.1 A/g between 0.1 V and 1.5 V.
500 cycles at 0.5 A/g
between 0.1 and 1.5 V.
490 mAh/g450 mAh/g
M4(a) 3 cycles at 0.1 A/g between 0.05 V and 1.0 V.800 cycles at 0.5 A/g
between 0.1 and 1.0 V.
305 mAh/g252 mAh/g
M5(a) 3 cycles at 0.1 A/g between 0.05 V and 1.5 V.800 cycles at 0.5 A/g
between 0.1 and 1.5 V.
430 mAh/g221 mAh/g
Table 3. Charge/discharge protocols investigated.
Protocol IDFormation CyclesService Cycles
P1 (CCCV in formation cycles
and CC in service cycles)
(a) Lithiate Si@void@C at 0.05 A/g to 0.1 V vs. Li+/Li and hold at this potential until the current density becomes 0.005 A/g. Delithiate the cell at 0.05 A/g to 1.5 V.
(b) Lithiate Si@void@C at 0.1 A/g to 0.1 V vs. Li+/Li and hold at this potential until the current density becomes 0.005 A/g. Delithiate the cell at 0.1 A/g to 1.5 V.
(c) Lithiate Si@void@C at 0.5 A/g to 0.1 V vs. Li+/Li and hold at this potential until the current density becomes 0.005 A/g. Delithiate the cell at 0.5 A/g to 1.5 V.
Lithiate and delithiate at 0.5 A/g
between 0.1 V and 1.5 V vs. Li+/Li for 300 cycles.
P2 (CC in both formation
and service cycles)
(a) Lithiate Si@void@C at 0.05 A/g to 0.01 V vs. Li+/Li and then delithiate the cell at 0.05 A/g to 1.0 V vs. Li+/Li. Repeat this for 4 times.Lithiate and delithiate at 1.0 A/g
between 0.1 V and 1.0 V vs. Li+/Li for 300 cycles.
P3 (CCCV in both formation
and service cycles)
(a) Lithiate Si@void@C at 0.05 A/g to 0.1 V vs. Li+/Li and hold at this potential until the current density becomes 0.005 A/g. Delithiate the cell at 0.05 A/g to 1.0 V.
(b) Lithiate Si@void@C at 0.1 A/g to 0.1 V vs. Li+/Li and hold at this potential until the current density becomes 0.005 A/g. Delithiate the cell at 0.1 A/g to 1.0 V.
(c) Lithiate Si@void@C at 0.5 A/g to 0.1 V vs. Li+/Li and hold at this potential until the current density becomes 0.005 A/g. Delithiate the cell at 0.5 A/g to 1.0 V.
Lithiate at 1.0 A/g to 0.15 V vs. Li+/Li
and hold at this potential until the current density
becomes 0.05 A/g. Delithiate the cell at
0.5 A/g to 1.0 V. Cycle for 300 times.
P4 (CCCV in both formation
and service cycles)
(a) Lithiate Si@void@C at 0.05 A/g to 0.1 V vs. Li+/Li and hold at this potential until the current density becomes 0.005 A/g. Delithiate the cell at 0.05 A/g to 1.0 V.
(b) Lithiate Si@void@C at 0.1 A/g to 0.1 V vs. Li+/Li and hold at this potential until the current density becomes 0.005 A/g. Delithiate the cell at 0.1 A/g to 1.0 V.
(c) Lithiate Si@void@C at 0.5 A/g to 0.1 V vs. Li+/Li and hold at this potential until the current density becomes 0.005 A/g. Delithiate the cell at 0.5 A/g to 1.0 V.
Lithiate at 1.0 A/g to 0.10 V vs. Li+/Li
and hold at this potential until the current density
becomes 0.05 A/g. Delithiate the cell at
0.5 A/g to 1.0 V. Cycle for 500 times.
Publisher’s Note: MDPI stays neutral with regard to jurisdictional claims in published maps and institutional affiliations.