1. Introduction
Over the past three decades, lithium-ion batteries (LIB) have been intensively used as the main power sources in portable electronic devices, stationary energy storage systems, and in electric vehicles. Although the manufacturers of such devices claim that the batteries are safe, the use of active oxidizers and reductants along with organic electrolytes carries the risk of fire and explosion, which can lead to destruction and injury, the severity of which ranges from minor superficial burns to death. The U.S. Consumer Product Safety Commission has already reported 25,000 cases of fires in lithium-ion batteries in various devices [
1].
As a rule, such fires occur due to the so-called battery thermal runaway—a sharp increase in temperature associated with intense heat generation in abnormal battery operation modes, which include overcharging, overdischarging, external and internal short circuits, and external overheating. Overcharging and overdischarging are the most frequent causes of a thermal runaway [
2,
3,
4,
5,
6]. They lead to an internal short circuit by dendrites formed from lithium during overcharging [
7,
8] and from copper during overdischarge [
9,
10]. An internal short circuit, as well as an external short circuit, lead to an instantaneous increase in temperature within a few seconds and a possible ignition of the battery [
11,
12]. Thus, the development of new chemical protection methods aimed at suppressing short circuits is a paramount step toward creating completely safe batteries.
In accordance with the known mechanism of the thermal runaway of the battery [
13,
14,
15], there are several protective strategies that are aimed at creating external protective systems, as well as internal protection by modifying battery components with functional materials. Traditionally, electronic battery management systems (BMS) are used in the design of batteries as an “external” protection. BMS consist of sensors, actuators, and controllers that are connected to the cells in the battery. All incoming signals are processed according to a special developed algorithm, and the desired actions such as current interrupt, are taken [
16]. These systems are combined with mechanical circuit breakers and fuses.
More reliable than electronic systems are chemical protection elements, which duplicate or supplement the functions of the BMS. The most common among them are functional additives in the electrolyte, including those that slow down dendrite formation [
17,
18,
19] and redox shuttle additives which prevent overcharge via electrochemical bypass [
20,
21,
22]. The use of completely noncombustible electrolytes [
23,
24,
25,
26,
27,
28,
29] is also suggested.
A common disadvantage of such additives is the ability to suppress only one specific stage of the development of an abnormal situation. In this case, many protective mechanisms are activated after the beginning of the irreversible process of battery failure and can only minimize the consequences of the accident. Moreover, changing the composition of the electrolyte affects all components of batteries, and, in addition to protective properties, it is necessary to ensure the absence of side effects of each new additive. Therefore, the search for chemical protection systems that do not require changing the composition of the electrolyte and have the possibility of reversible operation is actively carried out. Among such systems, the most widespread are fusible separators, which break the electric circuit due to blocking transport of lithium ions in case the temperature increases to the melting point of the one of separator layers [
30]. Another emerging protective technology is based on the use of variable resistance materials, which breaks the circuit of electronic conductivity when the temperature increases (thermoresistive materials) or the battery voltage exceeds permissible limits (potentioresistive materials).
The internal protection of the LIB by means of thermoresistive materials (i.e., components with variable resistance triggered by the temperature) is one of the most universal solutions of the LIB safety problem at the moment. This protection system allows one to interrupt current at the initial stage along with all undesirable processes connected with temperature growth accompanying overcharge, overdischarge, and external and internal short circuit and overheating. Thermoresistive materials are composites of crystalline polymers with conductive additives. Examples of the use of intrinsically conductive polymers for this purpose are also known. The main feature of all polymeric thermoresistive materials is the non-linearity of the electrical resistance dependence on the temperature with a transition point near the protection temperature required by the consumer. In such cases, thermoresistive materials are used as a layer between the cathode active mass and the aluminum current collector [
31,
32,
33], or as a powdered additive to the cathode active mass itself [
34,
35,
36]. The most typical representatives of thermoresistive protective materials are blends of ethyl vinyl acetate, polyethylene oxide (EVA/PEO) with carbon black [
33], polyethylene with nickel [
37], epoxy resin with carbon black [
32], poly(3-dodecylthiophene) [
38], and poly(3-octylthiophene) [
39].
However, the interruption of current flow when the battery heats up due to the activation of the chemical thermoresistive protection does not guarantee the stopping of thermal runaway, because the temperature growth already indicates the beginning of the destructive processes inside the battery, which can continue to develop even without current flow. In most critical processes, a change in the battery voltage occurs before the temperature starts to rise, i.e., it goes beyond the upper charging value if it is an overcharge, or beyond the lower discharging voltage if it is an overdischarge or a short circuit. Thus, the protection, the triggering factor of which is the change of the battery voltage, allows one to stop the side processes at an earlier stage. The combination of such protection with thermoresistive protection can make the product completely explosion- and fire-safe. Variants of implementation of chemical potentioresistive protection using layers of truly conductive polymers are known. The P3HT-PEO block copolymer [
38,
39] was proposed in [
40] as a polymeric conductive and ion-conductive binder for lithium iron phosphate (LFP)-based cathodes. In the operating voltage range of the LFP cathode, the electrical conductivity of the polymer is close to10
−3 S/cm, whereas at the end of the discharge it drops sharply below 10
−7 S/cm, turning the polymer layer into an insulator. The loss of binder conductivity at the end of the discharge cycle provides a unique way to protect against overdischarge, because at the end of the process the cathode is “disconnected“ from the consumer’s grid chemically. After the discharge ends, the open circuit voltage returns to the standard 3.32 V for LFP, and the polymer conductivity returns to 10
−3 S/cm, corresponding to that potential. The authors do not test such overdischarge protection according to industry standards, but based on their findings they indicate that their binder is promising for overdischarge protection. Interestingly, the analogous polymer, P3HT, and other polythiophene derivatives have thermoresistive properties [
41,
42] and have even been used for internal LIB protection against thermal runaway [
38,
39,
43]. However, no joint testing of potentioresistive and thermoresistive properties has been performed.
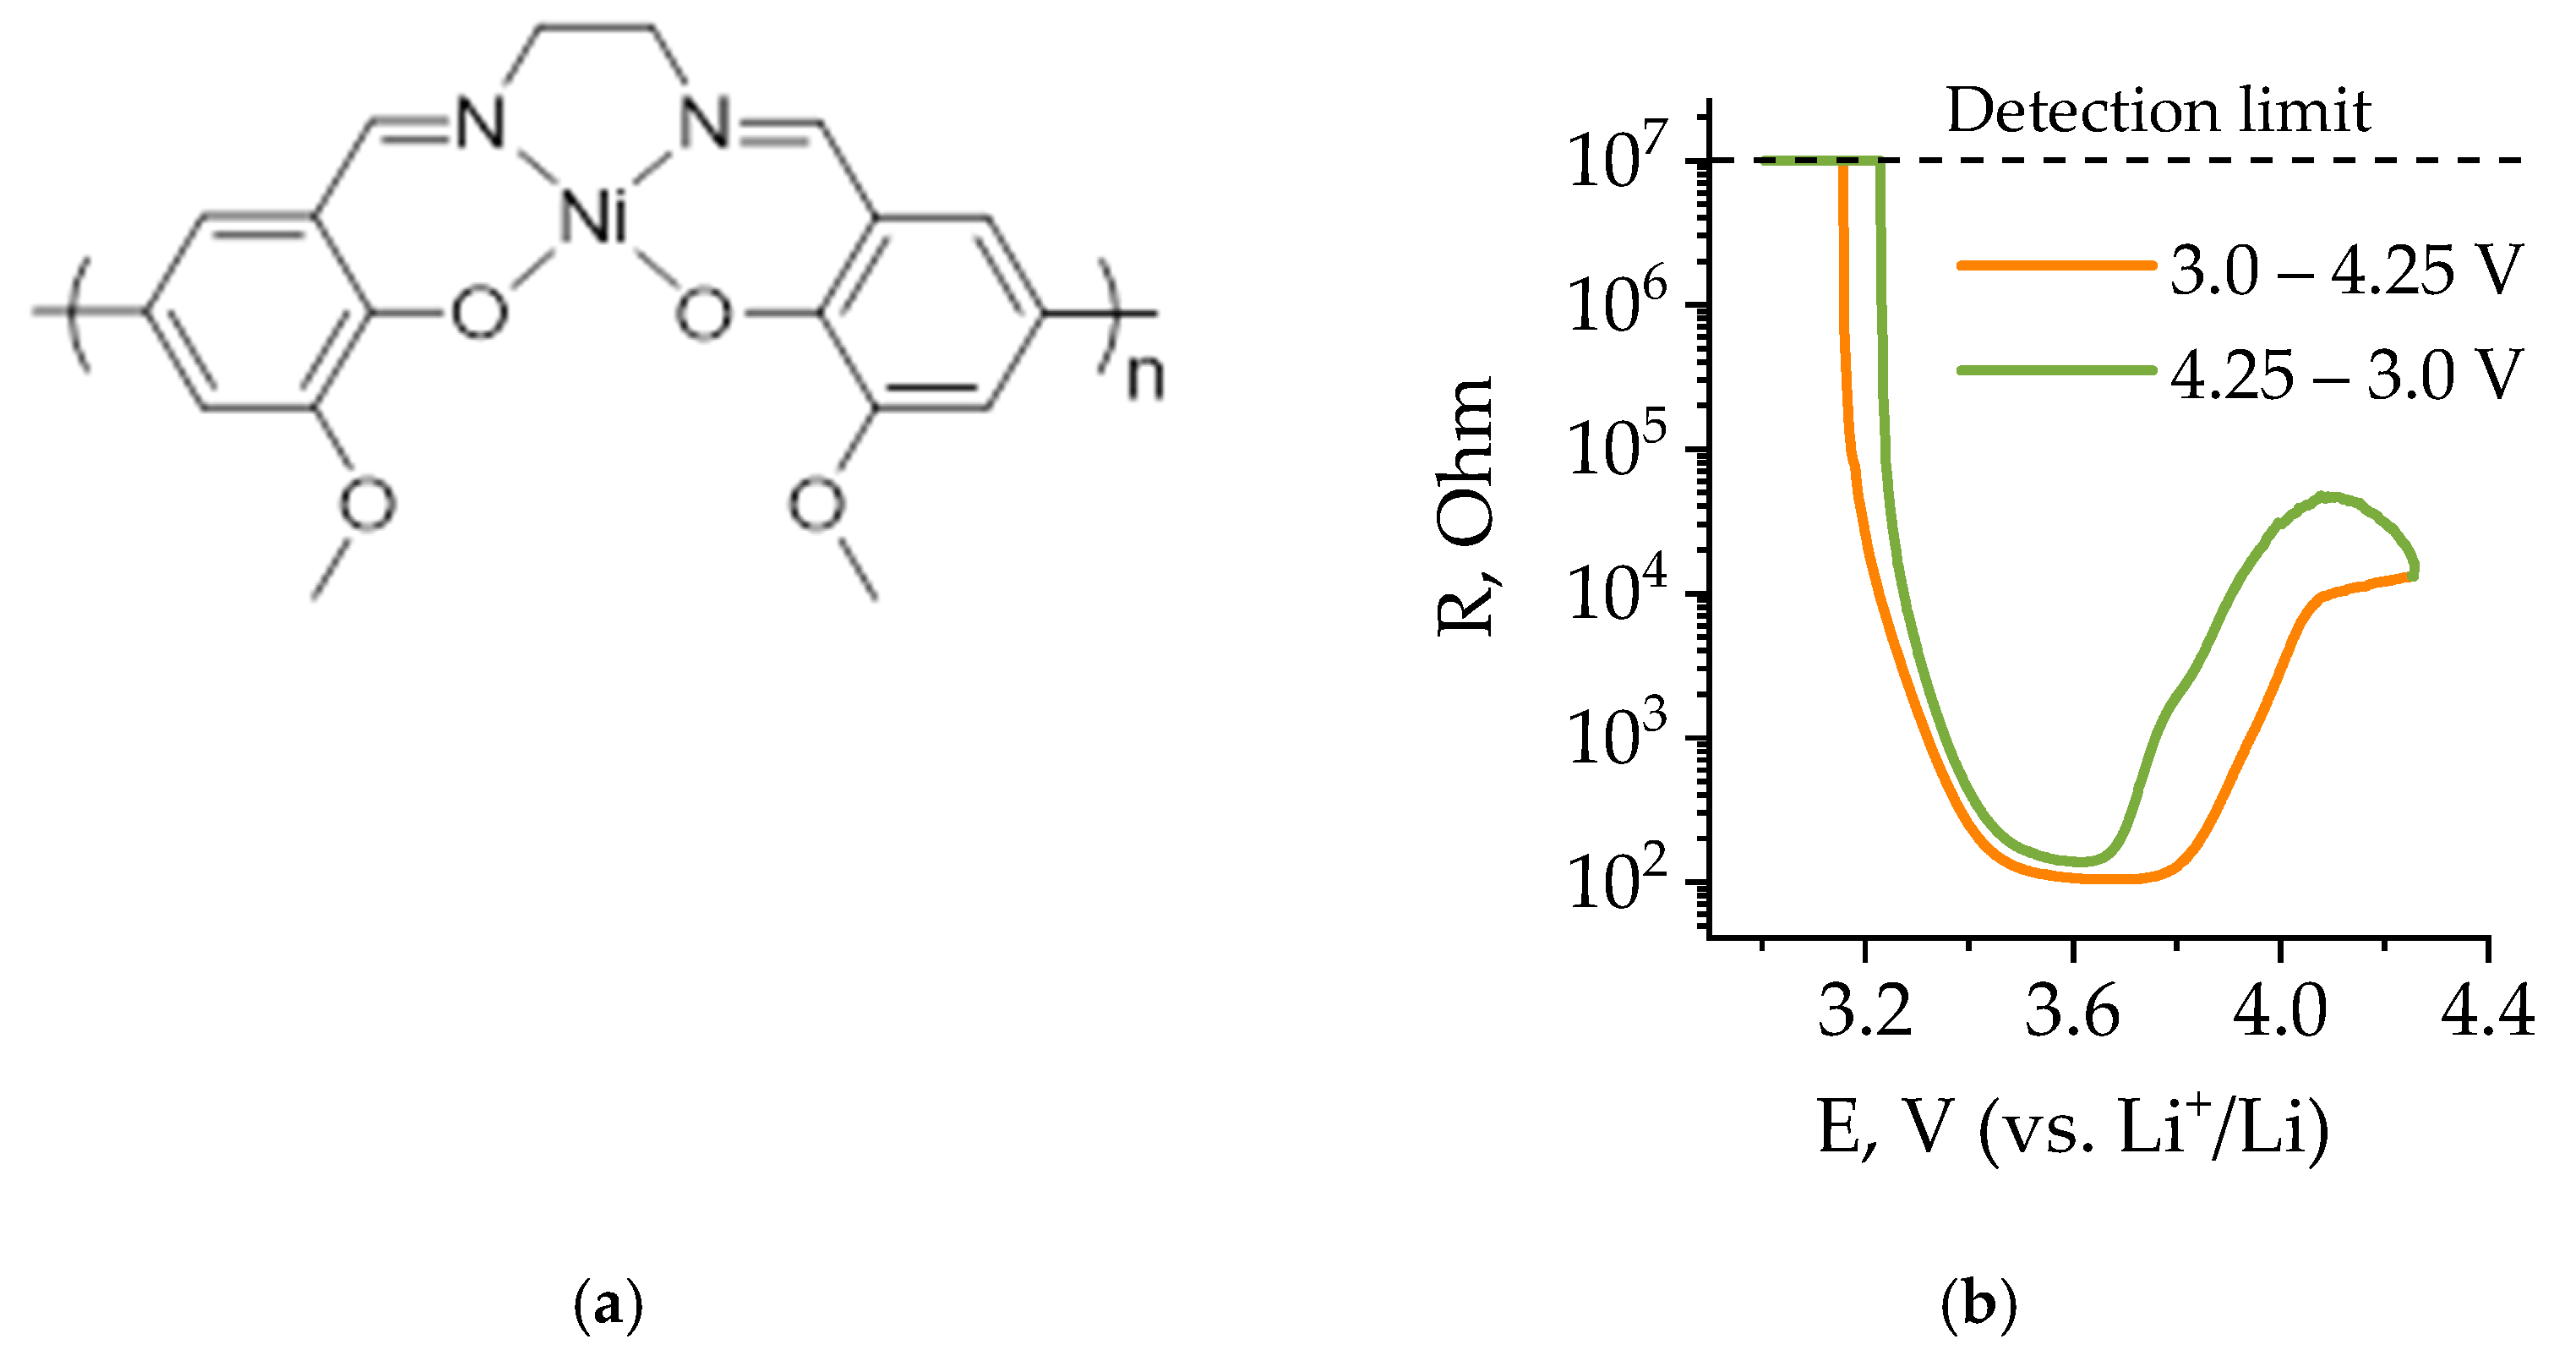
Earlier, in [
44,
45], we demonstrated potentioresistive protection of LIBs against overcharge by using a potentioresistive polymer poly[Ni(CH
3OSalen)], the structure of which is shown in
Figure 1a. The dependence of the electrical resistance of this polymer on the electrode potential has a U-shaped character, in which the resistance minimum refers to the range of potentials of commercial cathode materials [
44,
46], which makes it possible to assume its suitability for protection against internal and external short circuits, because the cathode potential rapidly decreases in short circuit, going beyond the range of electrical conductivity of the polymer. In our other work, we showed that this polymer also has thermoresistive properties, resulting in a rapid increase of resistance at elevated temperatures [
47]. Moreover, unlike composite materials based on carbon and metallic fillers, NiSalen-type polymers retain high conductivity at subzero temperatures up to –40 °C [
48,
49]. This suggests that poly[Ni(CH
3OSalen)] could be a versatile protective layer against short circuits, overcharging and overheating. This paper presents a study of poly[Ni(CH
3OSalen)] as a short-circuit protective layer of a LiFePO
4-based battery, in which the polymer exhibits both potentioresistive and thermoresistive protective properties.
2. Results and Discussion
The resistance of polymer poly[Ni(CH
3OSalen)] versus the potential was measured on interdigitated electrodes in [
46] in case of overcharge. In this work, we present resistance-potential dependence for operation in the normal potential range 2.5–4.0 V (
Figure 1b). The switching between the insulating and conducting states of the polymer occurs when the electrode potential becomes higher than 3.2 V. The minimum resistance of poly[Ni(CH
3OSalen)] is when the electrode potential reaches 3.6 V. In this case, the resistance value decreases by four orders of magnitude. When the electrode potential reaches 4.25 V, it increases again, but by a smaller amount—only 50 times (
Figure 1b). A subsequent change in potential from 4.25 V to 3.2 V leads to a decrease in polymer resistance at 3.6 V and a subsequent increase at 3.2 V. In the case of a battery short-circuit, there may be such a drop of potential in the polymer that it will limit the short-circuit current. Thus, the polymer can be used as a promising short-circuit protection layer material for lithium-ion phosphate batteries, as it satisfies the theoretical requirements.
Short circuiting leads to the decrease in the cell voltage up to 0 V, which in turn leads to the sharp resistance increase of the variable-resistance protective layer of poly[Ni(CH
3OSalen)] (R
layer) by several orders of magnitude (see
Figure 1b).
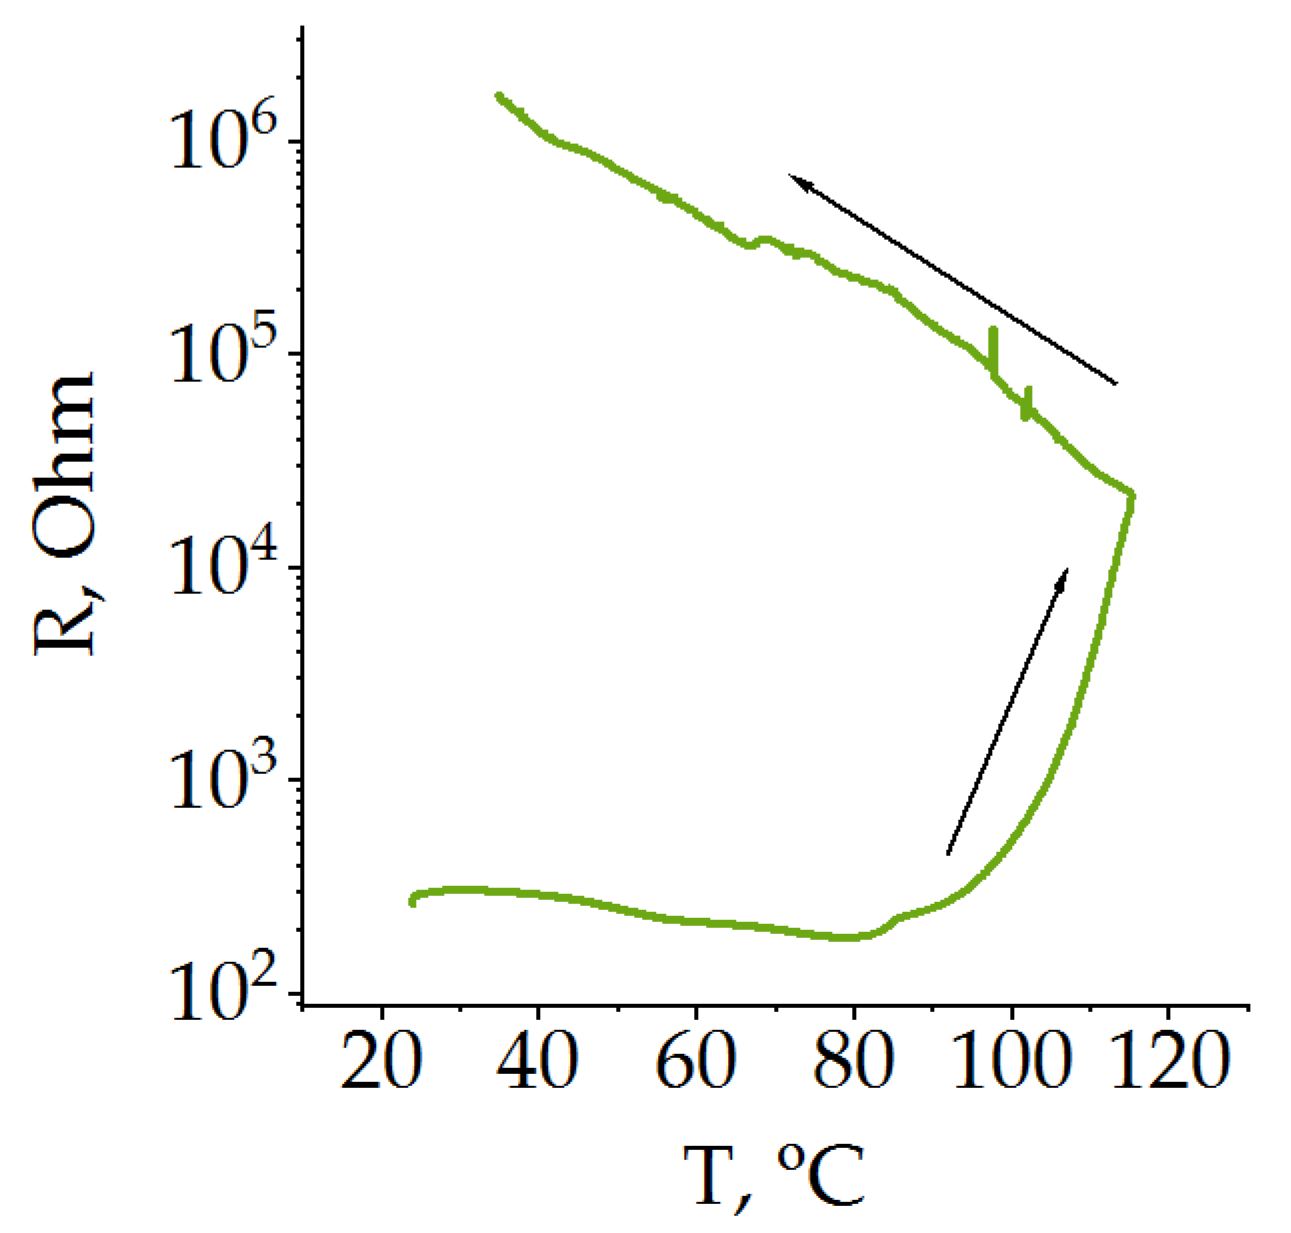
In addition, the poly[Ni(CH
3OSalen)] protective layer has a strong positive temperature coefficient; its resistance sharply increases by two and a half orders of magnitude when the temperature exceeds ~220 °C [
47] (
Figure 2). In this study, the temperature dependence of resistance was measured on a dry film with a BF
4− anion. The obtained value of the transition temperature is higher than that described in the literature for the beginning of the thermal runaway of LiCoO
2 [
50] but lower than for LiFePO
4 [
51] and other mixed oxides [
52]. Because the thermal runaway in the battery begins when there is still electrolyte in the battery, the protective properties are determined by the change in the resistance of the protective layer in the presence of the electrolyte.
As can be seen from
Figure 2, the polymer film resistance immersed in the electrolyte under heating first slightly decreases and at approximately 80 °C there is an inflection, after which an acceleration of resistance occurs. By the end of the heating, the resistance increased by two orders of magnitude. When the system cools down, there is no return of the system to its original state, and the resistance continues to grow, increasing by another two orders of magnitude. Due to the corrosive activity of PF
6− ion-based electrolytes, the measurements described above were performed in 1 M LiTFSI solution in EC/DEC. However, one would expect a similar behavior of poly [Ni(CH
3OSalen)] in conventional electrolytes based on the PF
6−- anion. Therefore, the transition temperature of the protective layer is expected to be below 100 °C, which is suitable for all types of LIB.
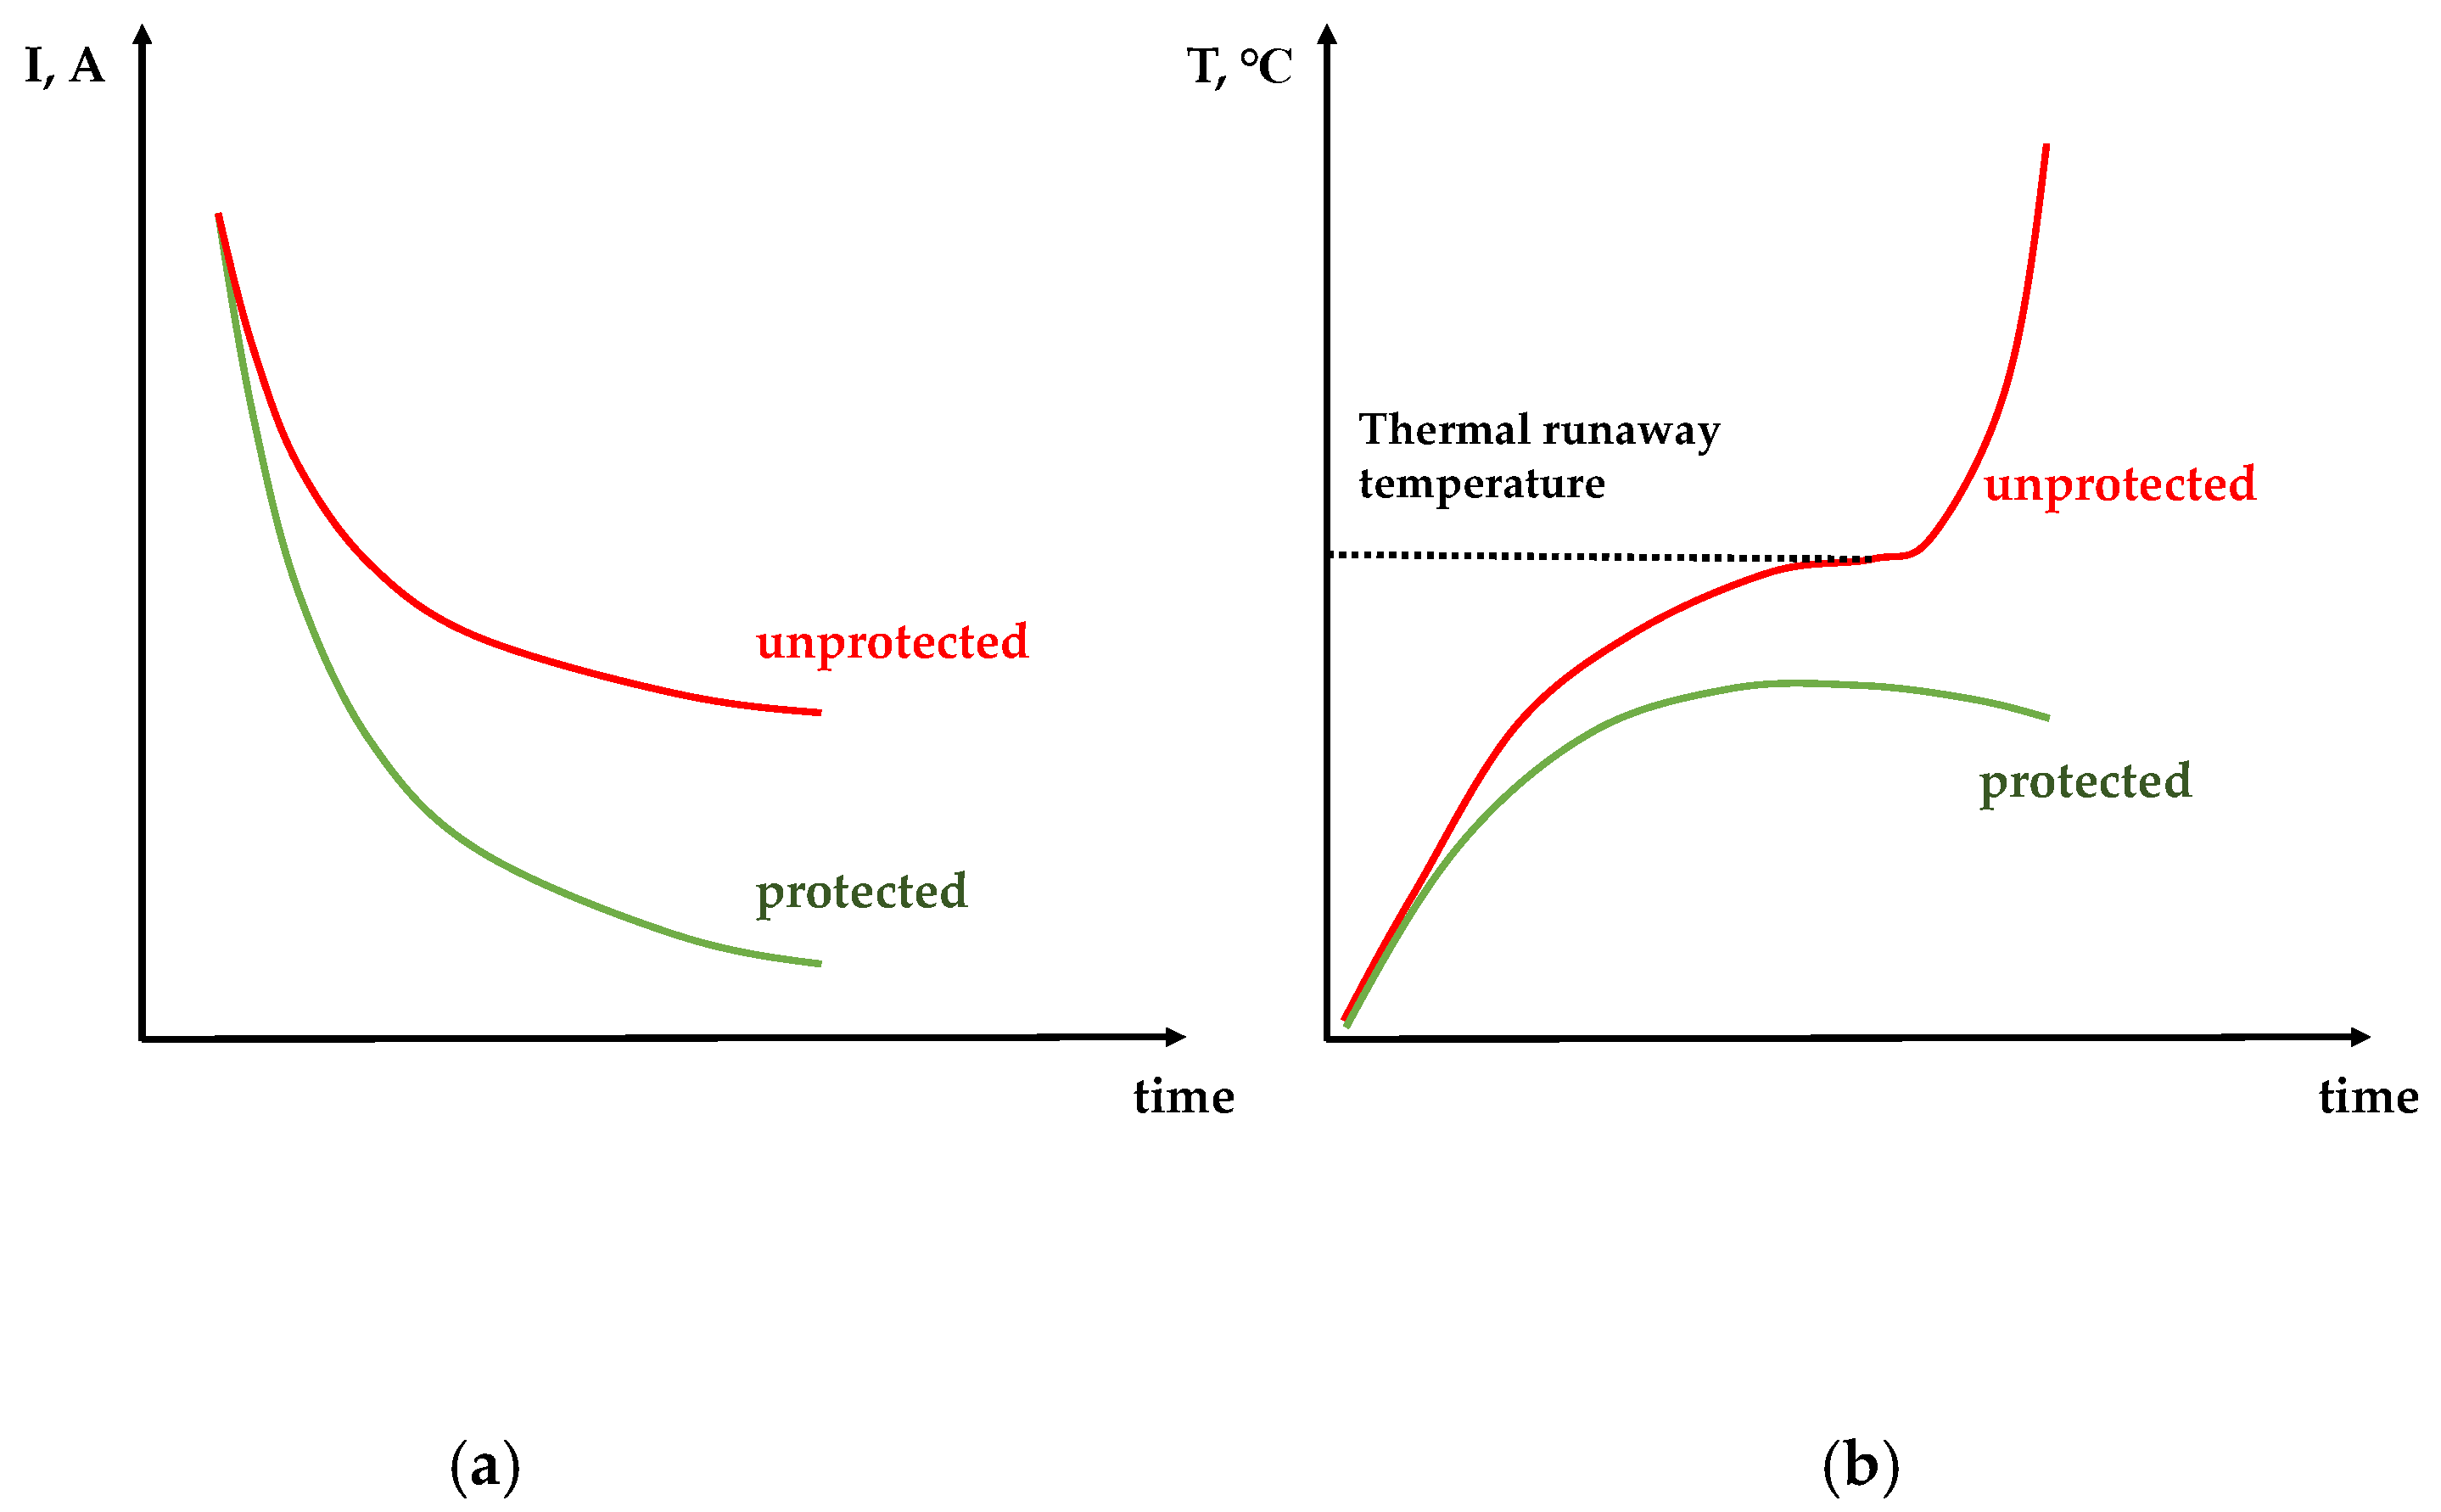
Therefore, one can conclude that the variable-resistance protective layer of poly[Ni(CH
3OSalen)] slows down the heat generation process in two independent ways—by interrupting current at overheating and short-circuit voltage and, thus, protecting the battery from thermal runaway followed by ignition. A schematic representation of the expected currents and temperatures versus time of two short-circuited batteries (with and without protective layer) is given in
Figure 3. The experimental data, confirming this assumption, are presented below.
Electrochemical test. The poly[Ni(CH
3OSalen)] layer was deposited on the graphitized aluminum foil by electropolymerisation. The deposition parameters were the same as in [
44].
In [
44], the charge–discharge characteristics of LiFePO
4 cathodes with a poly[Ni(CH
3OSalen)] protective layer (Al/poly/LFP) in the operating potential range from 2.5 to 4.0 V at currents of 0.1, 0.25, 0.5, 1.0, 2.0, and 3.0 C and cycling stability at 1 C were demonstrated. The discharge capacity of the Al/poly/LFP electrode for a charge–discharge rate of 1 C was 94% with respect to standard Al/LFP electrodes (105 mAh·g
−1), and at currents less than 0.5 C it was over 98% with respect to Al/LFP. Likewise, the Al/poly/LFP electrode showed good stability when cycling at 1 C charge–discharge current, retaining more than 90% capacity by the 50th cycle.
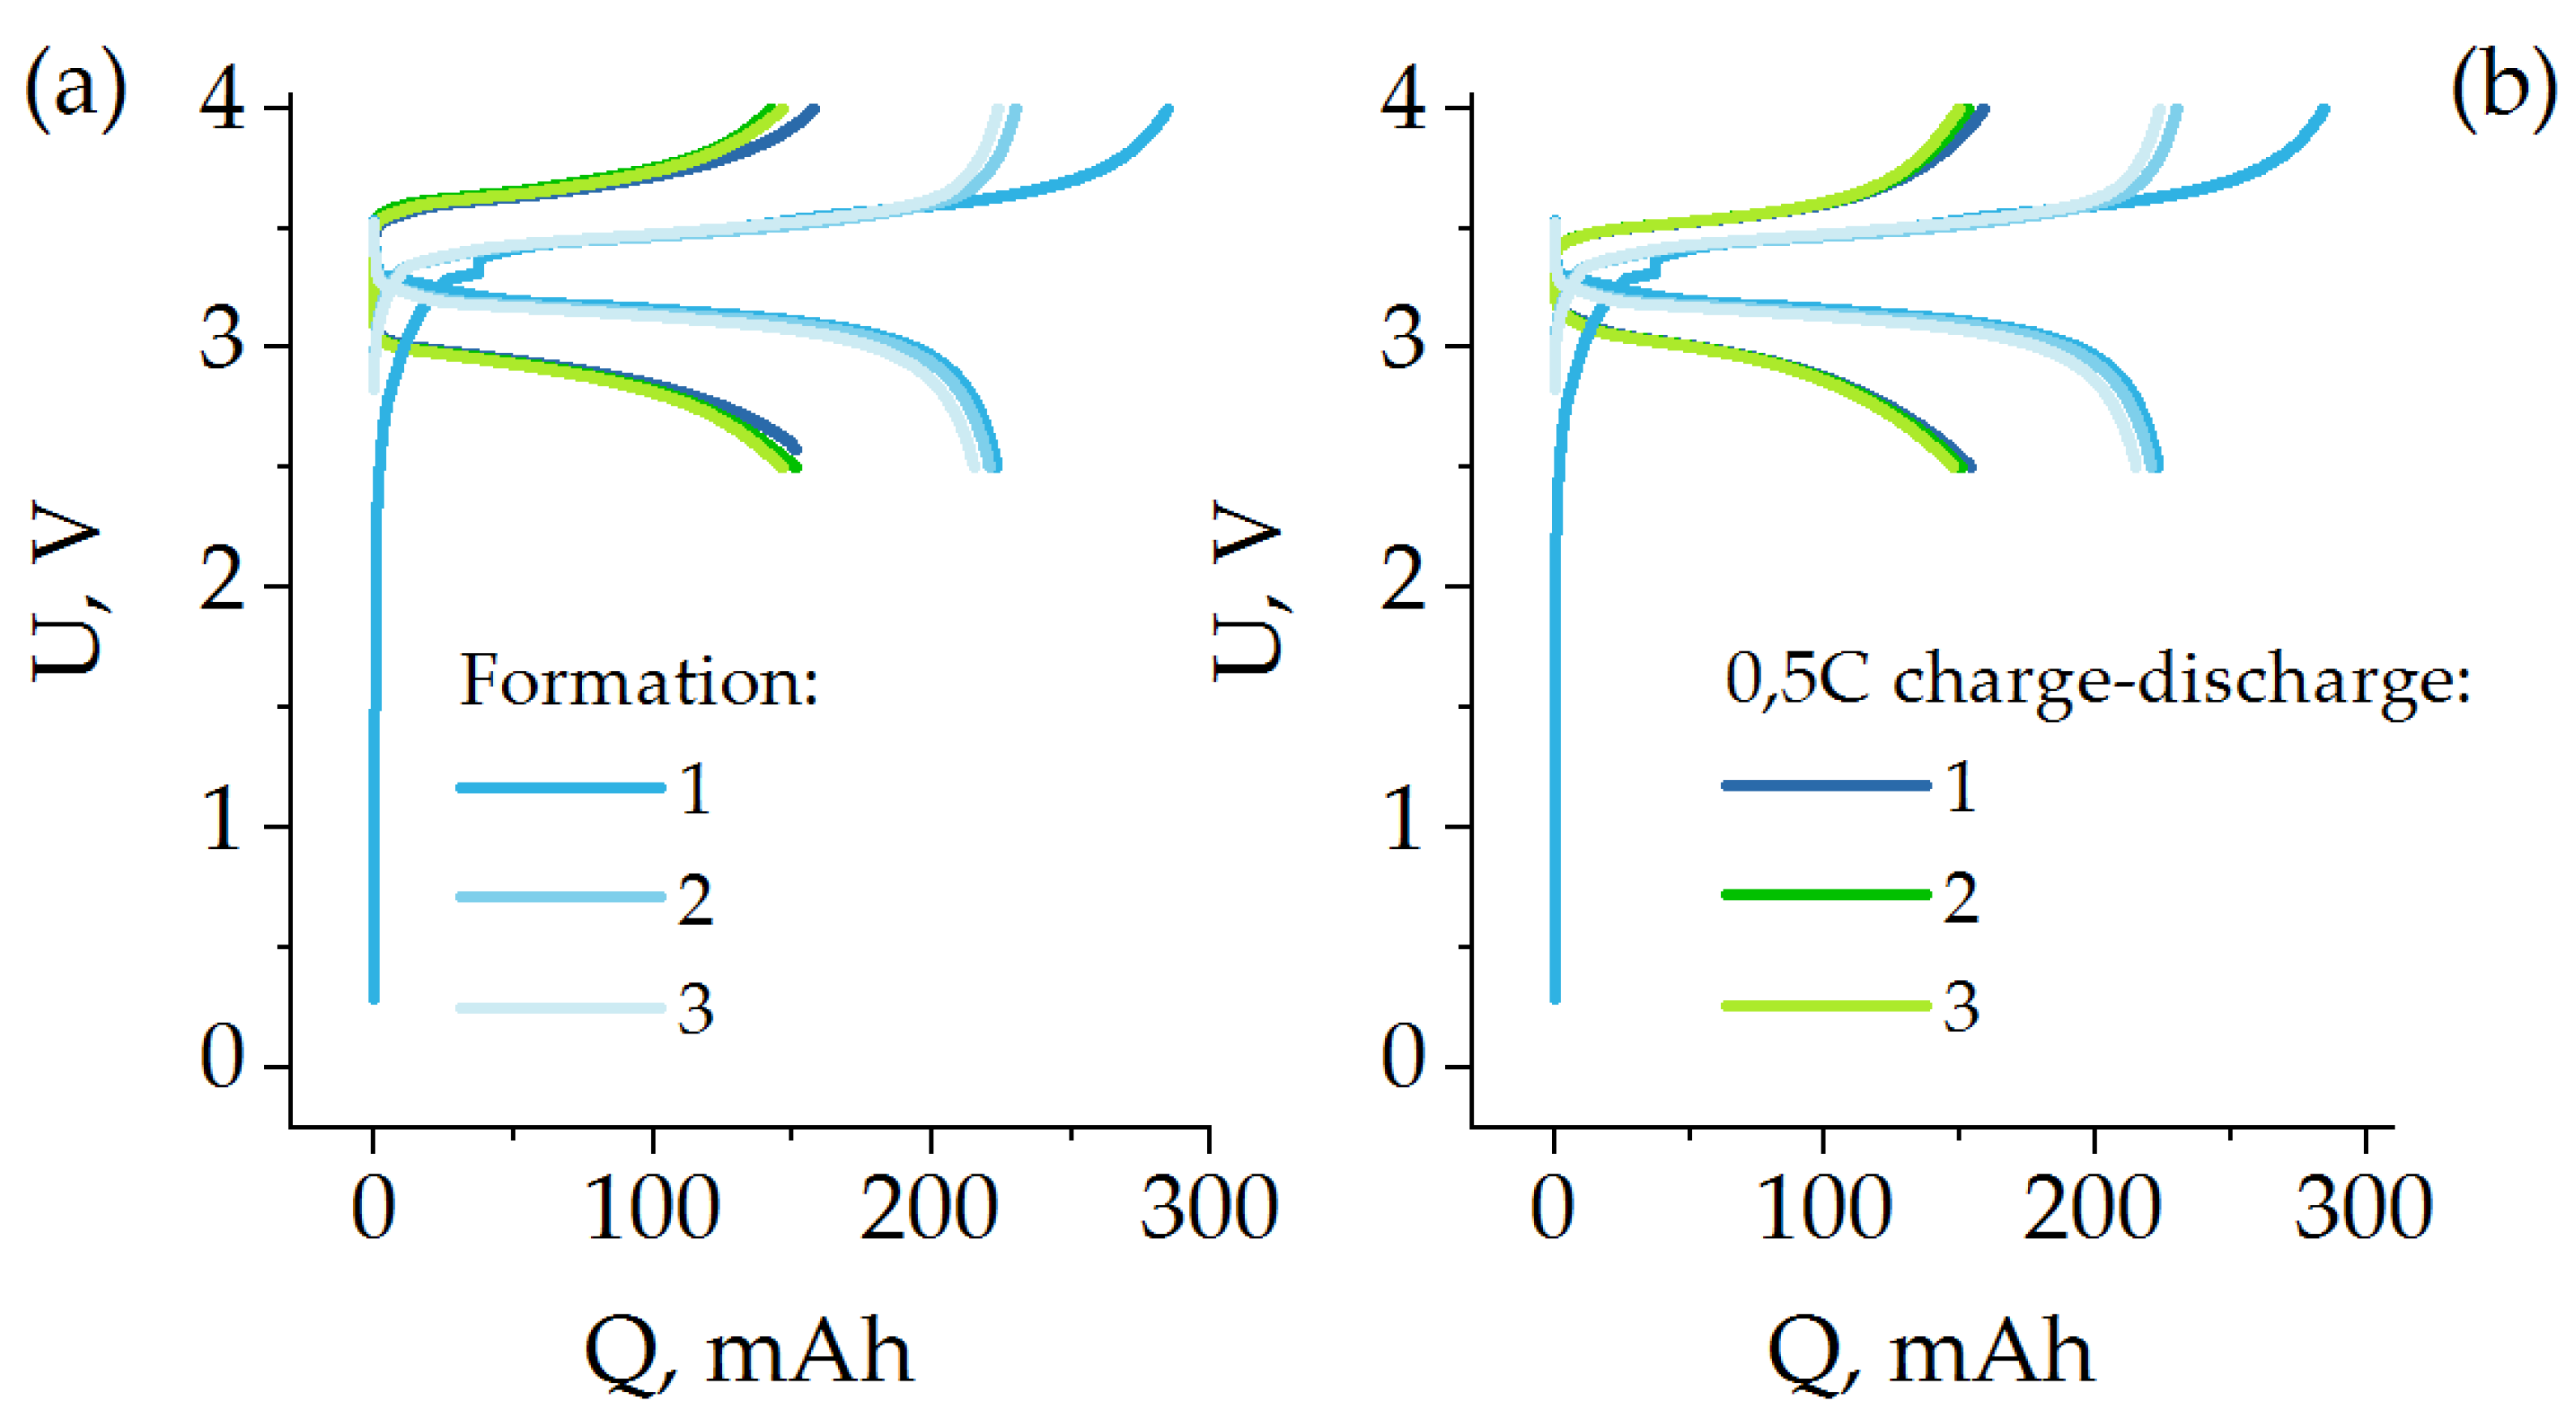
A charge–discharge current of 0.5 C, which is common in commercial batteries, was chosen as the operating current for the electrodes. For this operating mode, the charge–discharge characteristics of Al/LFP and Al/poly/LFP are shown in
Figure 4. As can be seen from the figure, the electrodes behaved stably over three cycles. The capacity of Al/LFP decreased from 117.8 to 116.8 mAh·g
−1, whereas the capacity of Al/poly/LFP decreased from 111.7 to 110.2 mAh·g
−1. The electrodes with a protective sublayer show slightly lower capacity values, which is associated with the influence of the intrinsic resistance of poly[Ni(CH
3OSalen)] on the polarization during charge and discharge, as evidenced by the measured voltage difference between the flat parts of the charge and discharge curves: 0.16 V in the case of Al/LFP and 0.20 V for Al/poly/LFP. Such small changes in overpotential results from the proper selection of a layer thickness at which the influence of the sublayer would be minimal in the operating potential range. Most of the charge–discharge of the LFP occurs at potentials around 3.4–3.6 V, which is where the sublayer has minimal resistance. As the potential is shifted to the left or right, the resistance increases, which is reflected in the change in cell voltage. For example, the voltage at charge on the cell is
where
U is the battery or coin cell voltage,
E(cathode) is the the cathode potential,
E(anode) is the the anode potential,
E(polarization) is the the polarization of the battery or coin cell, and
IR is the ohmic drop.
Accordingly, for Al/poly/LFP R = f(E(cathode)). At some value of E(cathode) IR for the cell will be such that U is 4.0 V. The charge will stop. But the E(cathode) of Al/poly/LFP and Al/LFP will not be equal. We assume that during the charge–discharge process, Al/LFP operates between 2.5–4.0 V, whereas Al/poly/LFP operates in a narrower range that does not reach the extremes at 2.5 and 4.0 V, which we cannot yet determine. To do this, a mathematical model has to be prepared.
The effects of high current and high temperature on the poly[Ni(CH3OSalen)] protected Al/poly/LFP electrode were analyzed and separated by quasi-isothermal short circuit tests. The tests were carried out with a small amount of active material in CR2032 coin cells, which have high heat capacity and thermal conductivity. In these tests, cell rupture, evaporation and other side effects (such as bending of the layers, leakage, or convective cooling) did not occur, and purely the electrochemical response was observed. To create cell short circuiting, we shorted the positive and negative contacts via a potentiostat/galvanostat by applying 0 V and recording 1 point in 100 ms.
According to the [
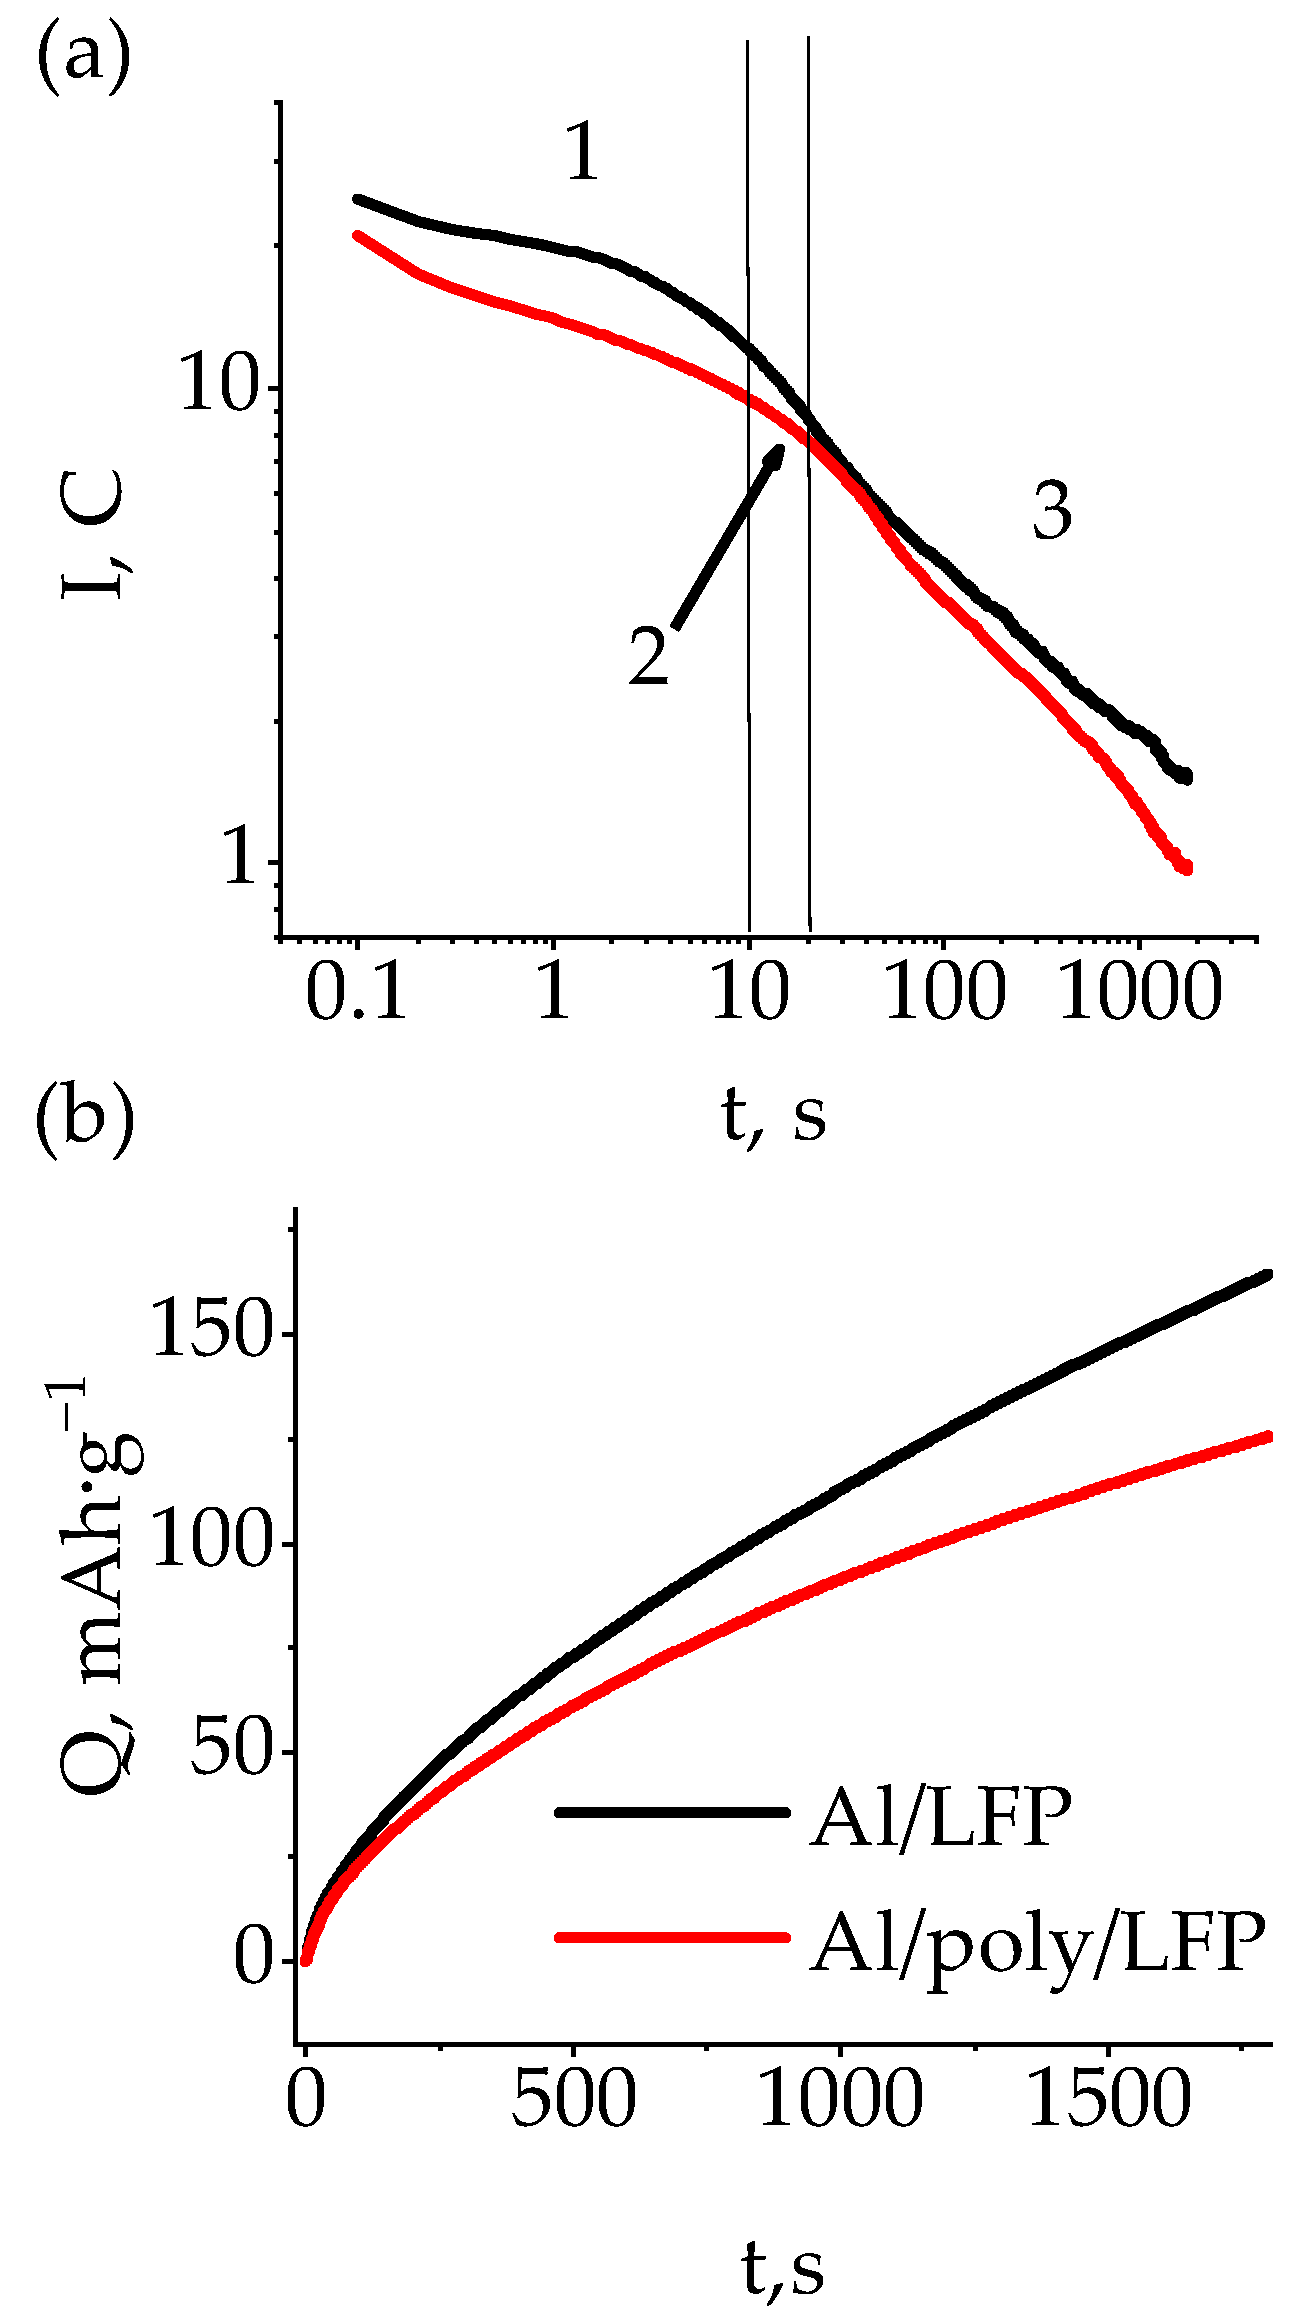
12], three sections can be distinguished on the short-circuit current versus time dependences. In region 1, the current is the highest, and the processes are governed by the discharge of the double and diffusion layers considering internal and external resistance. The duration of this section ranges from fractions of seconds to tens of seconds. Then the current drops significantly in the second region, which is likely limited by mass transport resistance(s). The value of this current does not depend on the internal resistance of the accumulator and is almost always about 10 C under quasi-isothermal conditions. In region 3, the forced discharge of the active material leads to a drop of electromotive force (emf), which in turn causes a continuous decrease of current and potential.
The indicated form of the short-circuit current versus time dependence was observed for both protected and non-protected cells (
Figure 5a). The duration of the first section was about 22.7 s. The magnitude of the current here was governed by the internal resistance of the half-cell, which in the case of Al/poly/LFP was already greater at the beginning and gradually increased throughout the discharge of the double and diffusion layers, as can be seen from the decrease in the current. In the second section lasting 27.3 s, in which the mass transport resistance(s) were limiting, the short currents almost equalized and averaged 6.5 C for Al/LFP and 6.2 C for Al/poly/LFP. At the end of this section, the currents began to diverge. It can be assumed that as the EMF decreased, the potential on poly[Ni(CH
3OSalen)] changed, causing its resistance to increase, which is manifested in the increasing decrease in the short-circuit current of Al/poly/LFP over time. At the end of the test, it was 1.5 C for Al/LFP and 1 C for Al/poly/LFP.
On the basis of the data shown in
Figure 5a the dependence of the change in the discharge capacity on time was plotted (
Figure 5b), from which we can see that as the short circuit develops, the discharge capacities of the samples diverge more and more from one another. At the end of the test, its value was 165 mAh·g
−1 for Al/LFP and 126 mAh·g
−1 for Al/poly/LFP. As the maximum operating capacity obtained at 0.1 C is 155 mAh·g
−1 (see [
44]), the obtained values indicate that the overdischarge of the active material, leading to deterioration of its characteristics, was observed for Al/LFP cell, whereas Al/poly/LFP was discharged to the capacity below maximum operating capacity, i.e., the overdischarge did not happen. The difference in the LFP state of discharge is expressed by the different OCV value after short circuiting; Al/LFP OCV was approximately 1.8 V, and Al/poly/LFP was approximately 3.4 V (see
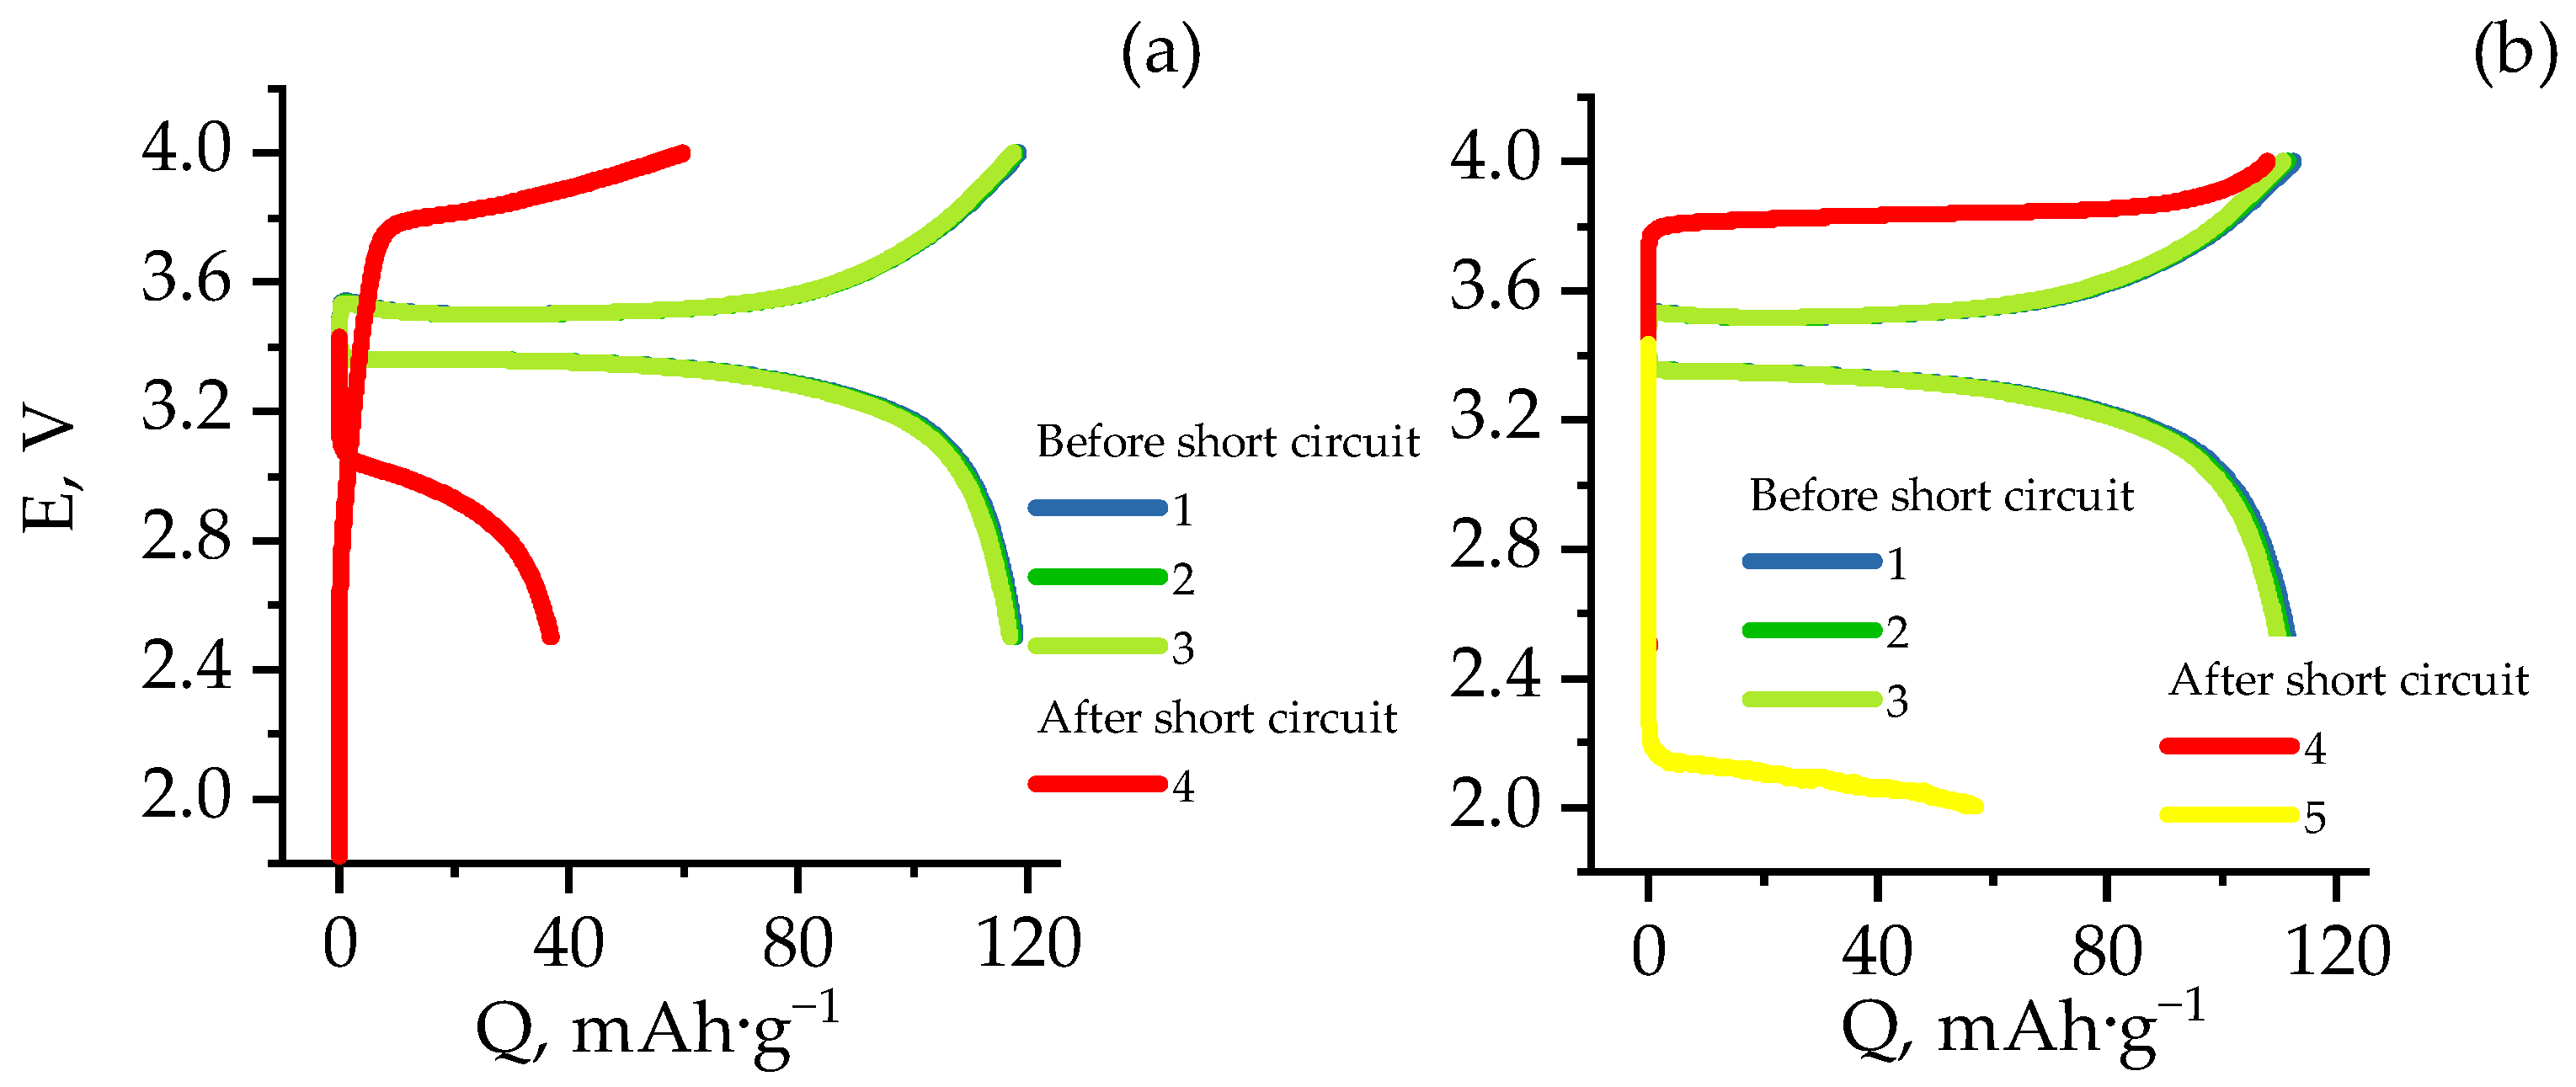
Table 1). A subsequent charge–discharge cycle with the operating mode showed (
Figure 4) that the Al/LFP electrode polarization increased and a sloping charge curve was observed instead of being almost parallel and typical for LiFePO
4 plateau, which is not the case for Al/poly/LFP, in which the shape of the charge curve was almost unchanged with increased polarization, which can be attributed to the increase in resistance of the protective layer with respect to the polymer cycled in the operating mode and the absence of overdischarge of the active material, as evidenced by the OCV after 5 h after the removal of the short circuit (
Table 1). On subsequent discharge, the Al/LFP capacity was approximately 38 mAh·g
−1, and the Al/poly/LFP capacity was about 0.1 mAh·g
−1 in the operating potential range. Reducing the discharge voltage to 2.0 V allowed the Al/poly/LFP electrode to discharge at 57 mAh·g
−1. Moreover, both on charge and on discharge there were no significant changes in the shape of the charge–discharge curves, but there was a parallel shift of the plateau voltage by the value governed by the sublayer resistance, which is significantly different for charge and discharge, as will be confirmed below (see Impedance spectroscopy).
The significant decrease in capacitance for Al/LFP can be explained by an increase in the number of antisite defects after the short circuit. Because a one-dimensional lithium diffusion is realized in LiFePO
4, the appearance of defects in the material leads to a complete stop of lithium ions movement through blocked channels [
53,
54]. For example, in [
55] the material obtained by the hydrothermal method without subsequent annealing showed a capacity two times lower than the one annealed at 500 °C.
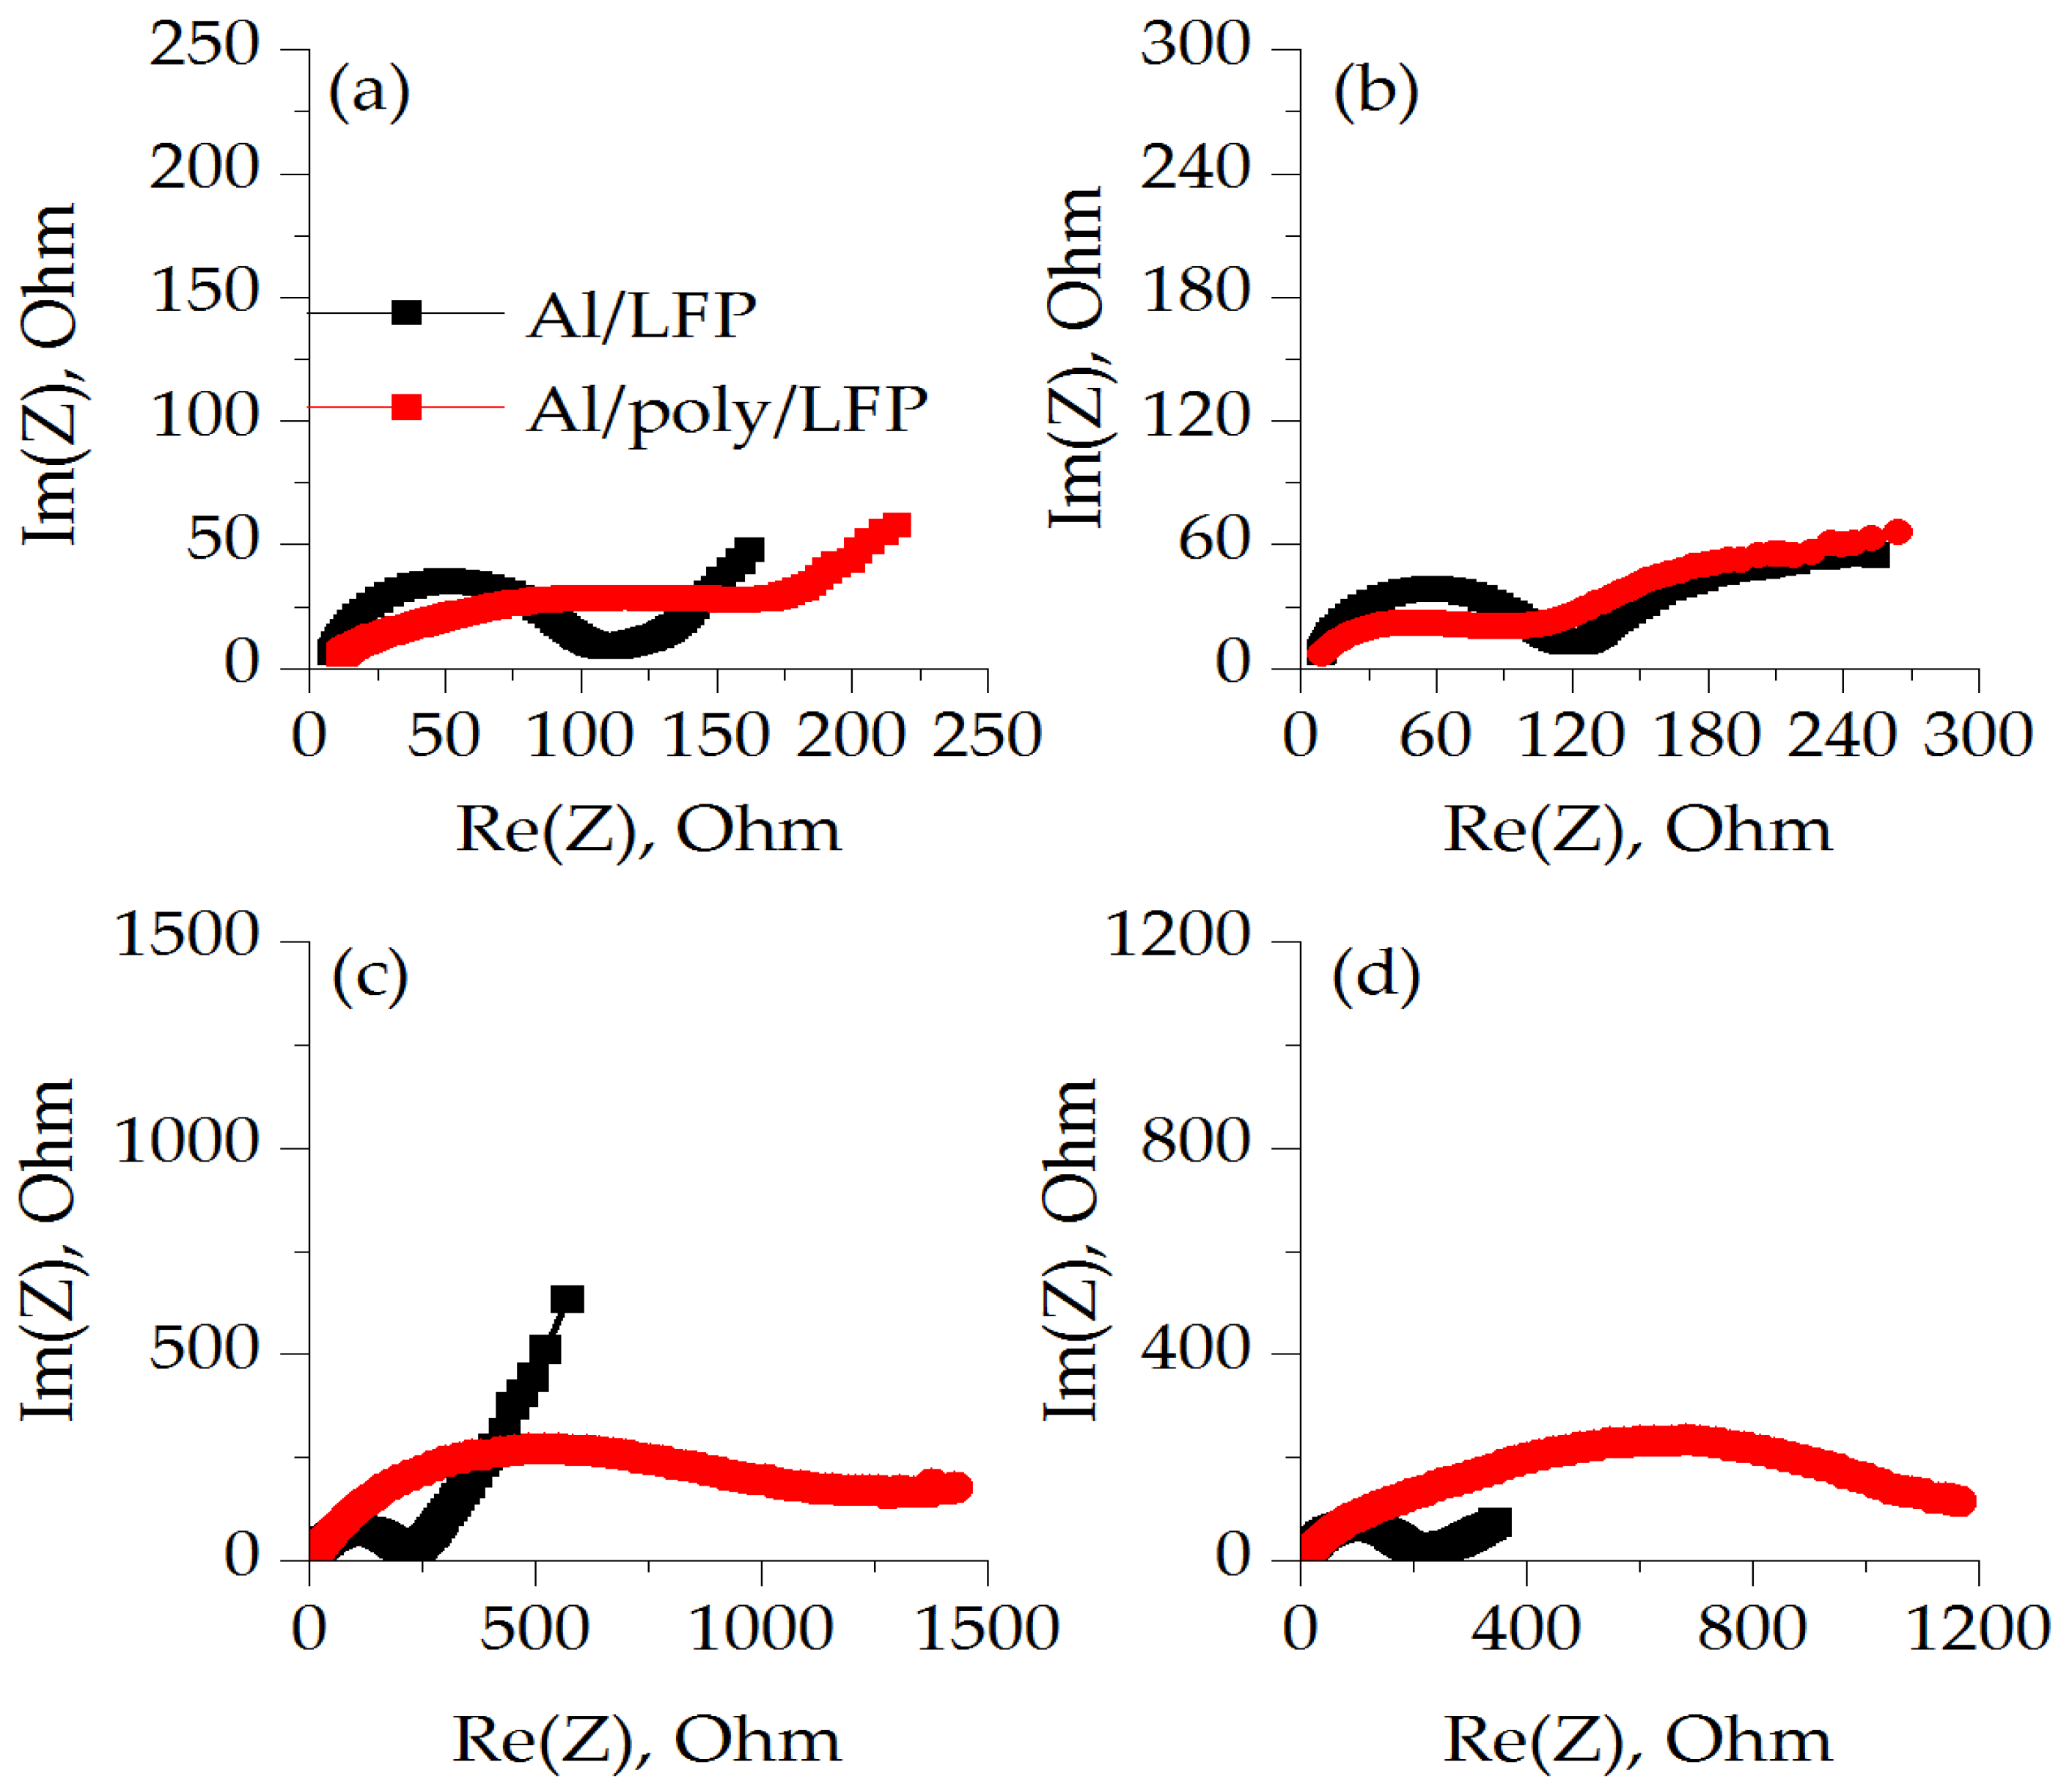
Impedance spectroscopy. After short circuiting, the electrode resistances had to change. To assess this, it was decided to apply impedance spectroscopy at different states of charge on protected (Al/poly/LFP) and non-protected LiFePO
4 (Al/LFP) half-cells (
Figure 6 and
Figure S1).
At different states of charge, the overall electrochemical impedance of both non-protected (Al/LFP) and protected cathodes (Al/poly/LFP) is different. When the EIS spectrum was carried out on charged cells, the charge transfer resistance (Rct) of the Al/LFP cathode was less than Al/poly/LFP (
Table 1). When the Al/poly/LFP sample was discharged to 2.5 V, the Rct values decreased to a minimum and was almost equal to Al/LFP. Comparison of both samples’ behavior in the extreme charge states clearly shows the effect of the polymer layer, as the Al/poly/LFP charge transfer resistance (Rct) changes in the charged and discharged half-cell states, whereas Al/LFP remains almost the same. Such behavior is explained by the fact that the impedance spectroscopy was measured at OCV potentials after charge and discharge; that is, when the polymer is fully doped and dedoped, respectively. Examining
Figure 1, it is possible to see the hysteresis in resistance when moving in the direction of 3.0 to 4.25 V and back between 4.25 and 3.0 V. Accordingly, after charging to 4.0 V at the last point of charge we have a doped polymer. When the charge is turned off, the LFP potential drifts to OCV, causing the polymer to be dedoped. Obviously, this process depends on the potential difference between the active mass and the polymer layer. Most likely, it is slow enough at the time of measurement when the polymer has a sufficiently large resistance, which, as can be seen from the resistance-to-potential relationship for the 4.25–3.0 V direction, decreases more smoothly for the right side than for the left.
Al/poly/LFP resistance increases significantly after a short circuit and subsequent cycle of charge/discharge. Compared to the unprotected cathode, the Rct of which increases only to 219 ohms after short circuit and decreases to 193 and 185 ohms after charge and discharge, the Rct of the protected Al/poly/LFP cathode reaches 1200 ohms, which hardly changes during subsequent cycles. Thus, after a short circuit, the presence of the protective layer does cause an irreversible increase in resistance, thus protecting the cell from further undesirable processes.
It is important to highlight that after short circuiting or after further charging and discharging in the working potential range, the Rct of Al/LFP did not change significantly. This is most likely because the measurements were made at OCV, which in all cases tended to 3.40 V. However, the different behavior of the Al/poly/LFP electrode on charge and discharge suggests a change in the shape of the electrical conductivity dependence of poly[Ni(CH3OSalen)] after exposure to potentials outside the operating range.
With this assumption made, it was decided to determine the character of the dependence of the electrical conductivity of poly[Ni(CH
3OSalen)] on the electrode potential after overdischarge to 1.0 V at the IDE. This final potential value was chosen because active SEI formation in 1 M LiPF6 EC/DEC begins below 1.0 V [
56,
57]. The result is shown in
Figure S2.
Before overdischarge, poly[Ni(CH
3OSalen)] demonstrates stable behavior on both the CVA and the conductivity-potential dependence. The cathodic and anodic peaks are broad with current maxima at 3.84 V and 3.69 V, respectively. During overdischarge to 1.0 V, an irreversible reduction peak is present at a potential of about 2.15 V, which can be attributed to the transition of nickel to the monovalent state in accordance with similar results obtained in literature for acetonitrile [
58,
59] and DMF [
60].
After overdischarge, the CV transformation occurred during the subsequent cycles within the normal range of potentials. On the first cycle after overdischarge, a quasi-reversible peak appeared in the anodic region at 3.85 V coupled with a corresponding cathode peak of lower intensity at 3.63 V. Both peaks were shifted relative to the pre-test voltammetric traces by 10 and 60 mV, respectively. In the second and third cycles, the anodic parts of the voltameterograms underwent more significant transformations, whereas the shape and position of the cathodic ones remained unchanged.
The dependence of electrical conductivity on potential after overdischarge also changed (
Figure S2). The presence of negative conductivity in the IDE measurements indicates that the Faraday currents on each of the IDE components are not equal, and the value of electrical conductivity is significantly less than this difference due to which the conditions of Equations (1)–(3) are not met. From these data, we conclude that the electrical conductivity of the polymer after overdischarge to 1.00 V became significantly lower than what it was at cycles in the working potential range.
The behavior of Al/poly/LFP after the short circuit on the charge–discharge cycle is also clearly explained by the change in R
ct depending on the applied potential.
Figure S3 shows the impedance spectra at potentials of 2.50, 3.00, 3.42, 3.85 (at half charge capacity) and 4.00 V. The figure shows that the minimum charge transfer resistance of about 350 ohms corresponds to the potential of 3.85 V at which the charge is experienced. Already at 4.00 V, it practically compares with the value for OCV (3.42 V), and when moving toward 2.50 V, it quadruples again, shifting the discharge plateau from 3.35 V to 2.10 V. Thus, the Al/poly/LFP electrode in the operating potential range can only be charged but not discharged.
Short circuit in pouch cells. The previous study of short circuit in coin cells allowed us to estimate the influence of only one component of the LFP-based electrode protection (potentioresistivity of the protective sublayer) under quasi-isothermal conditions. However, under real operating conditions of batteries the temperatures rise up to the temperature of the beginning of thermal runaway plays a key role as well. Hence, we made batteries in a flexible case the characteristics of which are presented in
Figure 7. The figure shows forming (0.1 C) and subsequent charge–discharge cycles with 0.5 C current (112.5 mA). Formation was performed according to the protocol from [
61]. The figure shows that the batteries behave similarly during the formation cycles, exhibiting about 225 mAh of nominal capacity. Further testing of the capacity in the 0.5 C operating mode showed that the cells differ slightly in the shape of the charge–discharge curves, although the discharge capacity was identical, being about 150 mAh in both cases. In the case of Al/LFP, a slightly increased polarization on charge and discharge is observed, associated with the peculiarities of manual assembly of the samples. In contrast to the machine assembly of coin cells, whereby a reproducible compression level of electrodes is realized, in the case of manual assembly it is reproduced with certain deviations. Because the adhesion of the LFP active mass to the aluminum foil surface decreases when wetted with electrolyte [
62], and the presence of a polymer coating of salen-type polymers improves it [
63], the possible deviations during manual assembly can lead to an increase in internal resistance. However, even in this case, the protective effect of poly[Ni(CH
3OSalen)] on the battery behavior, expressed in a reduction of the short-circuit current, remains noticeable, as will be discussed below.
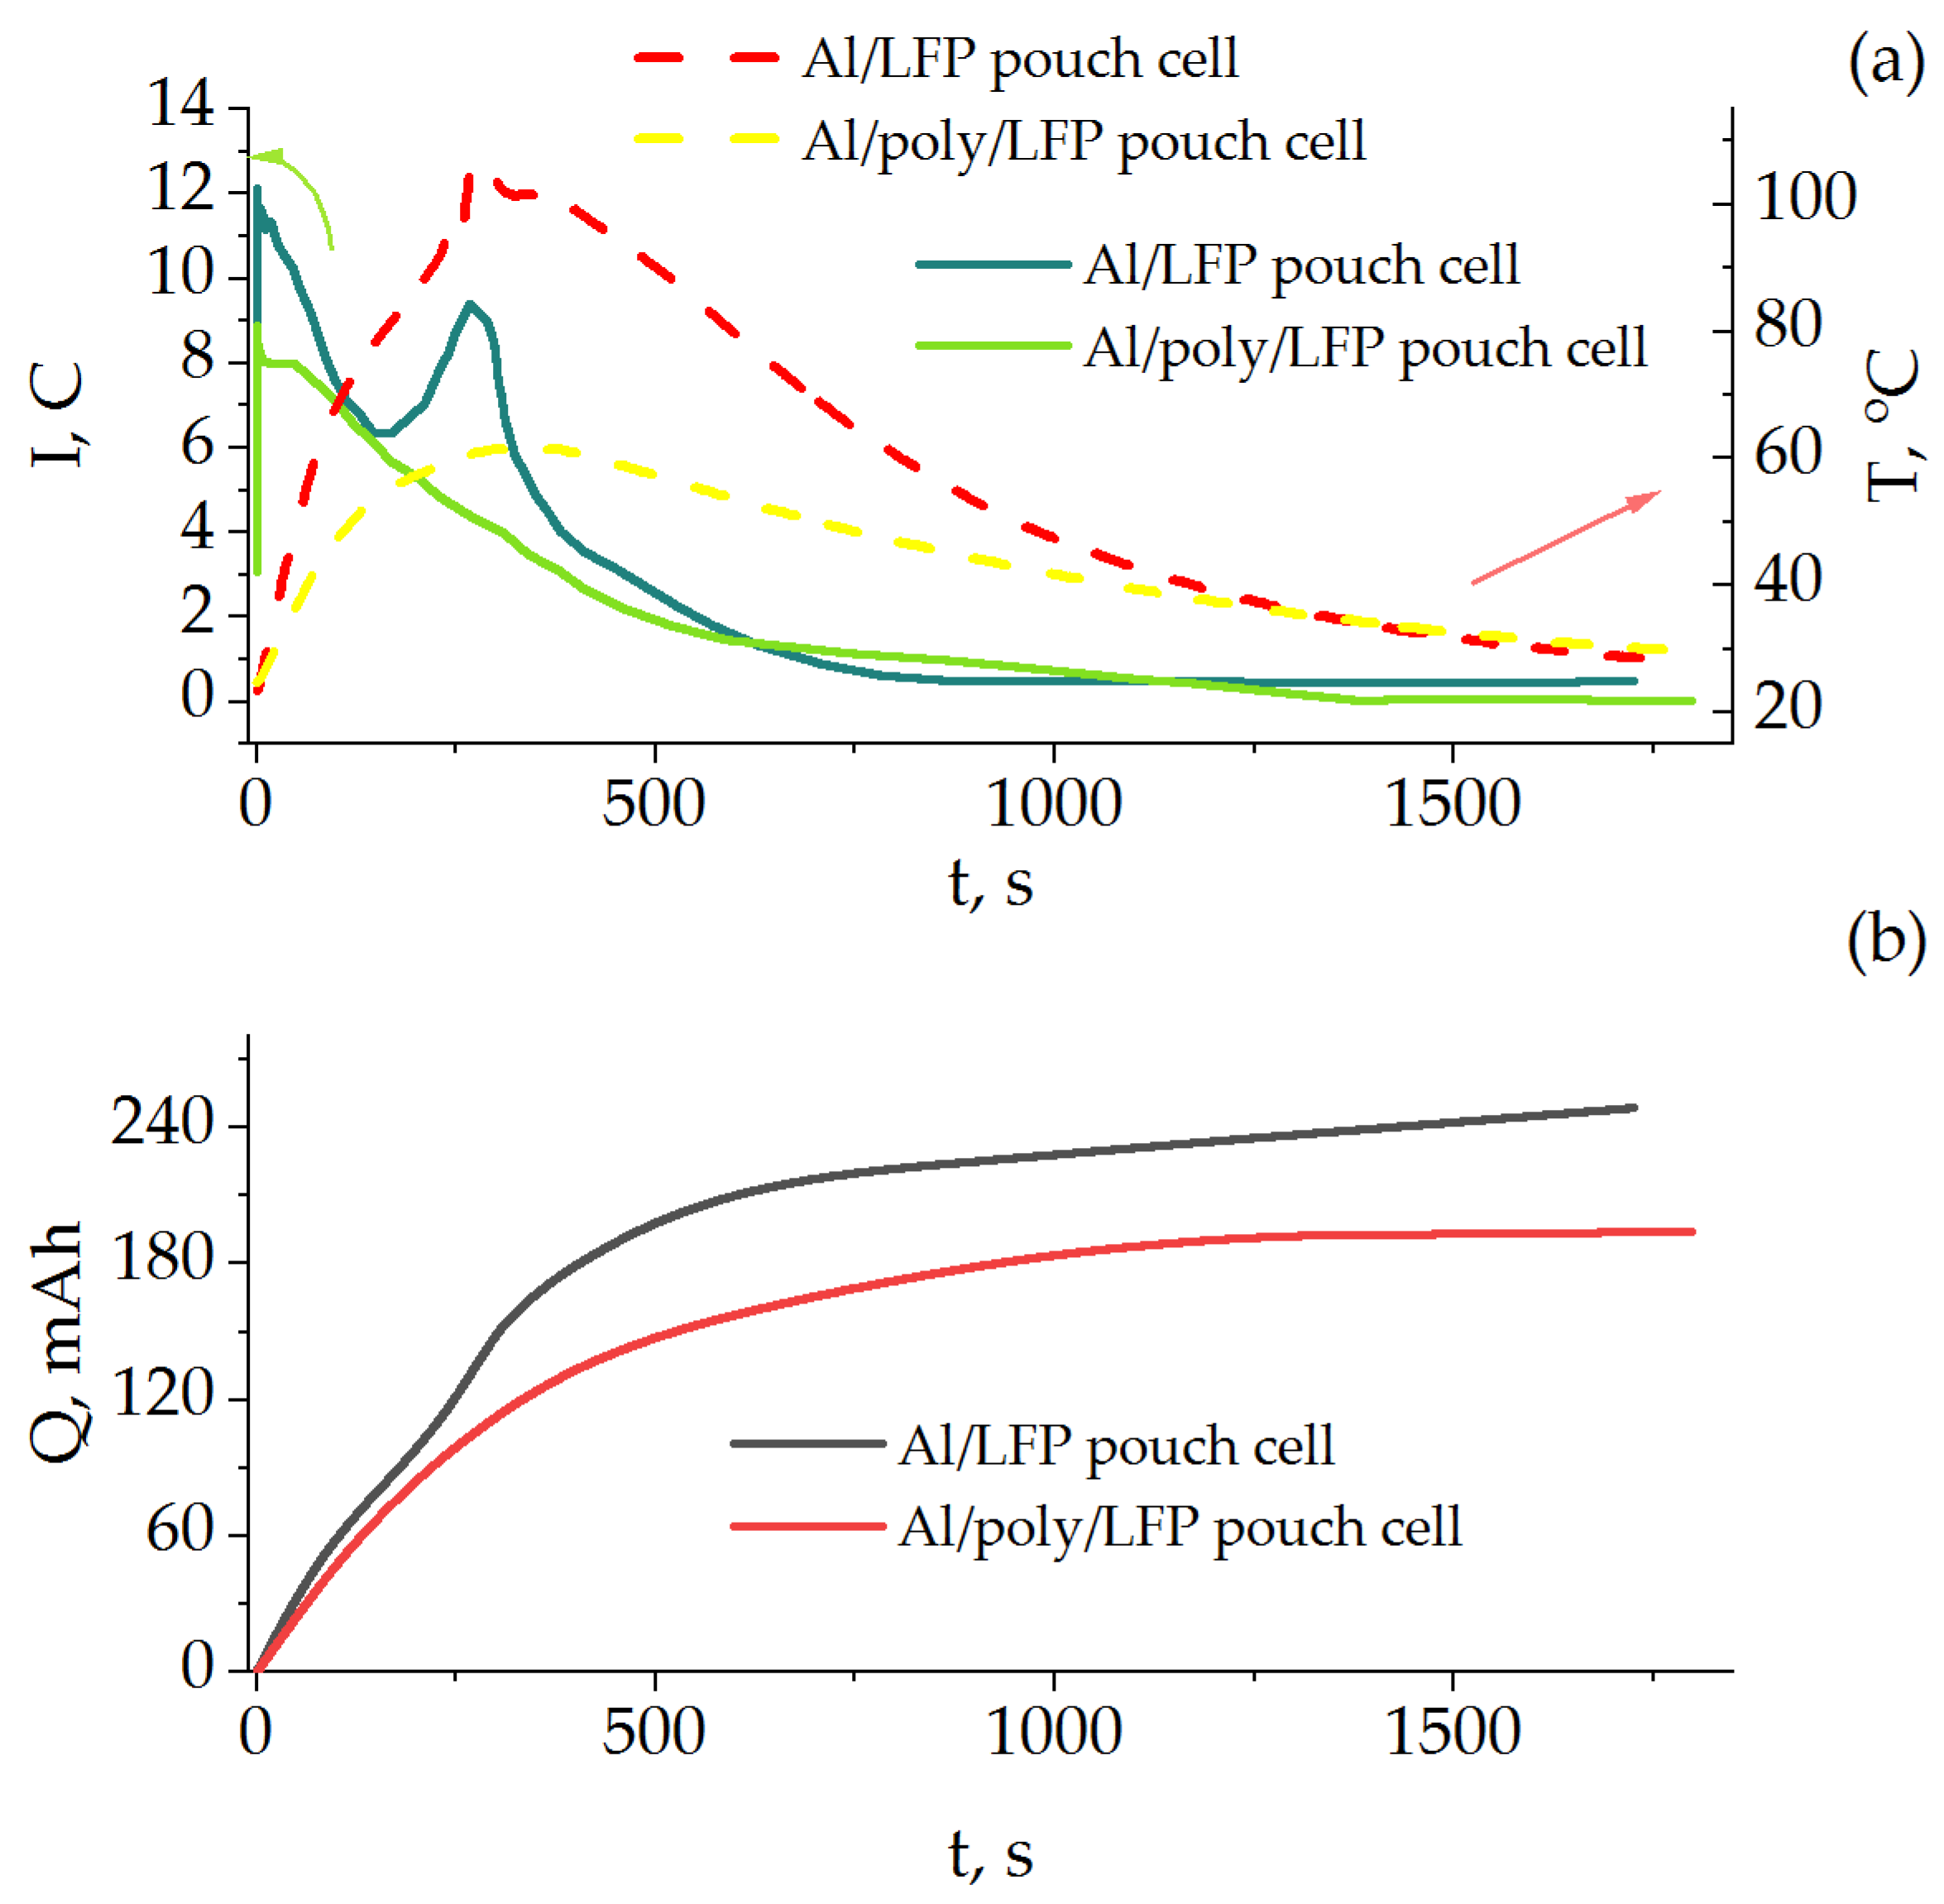
Figure 8 shows the time dependence of the short-circuit current and temperature as well as the discharge capacity during the short circuit. As in the case of the coin cells, the presence of the protective layer influences the short-circuit behavior of the product. The value of current for Al/poly/LFP from the beginning of the process up to 600 s was lower than that of Al/LFP by a factor of 1.5 or more. The temperature rise of Al/LFP cell was sharper, reaching a maximum of 102 °C at 274 s as compared to that of Al/poly/LFP cell which reached a maximum of 61.5 °C at 360 s. The short-circuit current profile of Al/LFP cell differs slightly from the previously described for coin cells by the presence of a peak of 9.5 C at 266 s. When considering the results presented in logarithmic coordinates (
Figure S4), it becomes obvious that it refers to the end of the mass transport region, because it is influenced more by the change in temperature than by the value of the external resistance [
12], which was the same for both pouch cells.
By integrating the time dependences of the short-circuit current, the change in the discharge capacity during the short-circuit tests was estimated (
Figure 8b). The Al/LFP cell was discharged by 250 mAh, which is 25 mAh more than the nominal discharge capacity obtained on the formation cycles (
Figure 7). In other words, the sample was overdischarged. In the case of the protected Al/poly/LFP sample, this value was 194 mAh, which is less than the nominal capacity, and the sample did not go into overdischarge. We can also see from the figure that in Al/poly/LFP cell, after 1200 s the value of discharge capacity practically stopped changing, reaching a plateau, whereas for Al/LFP cell the curve has a sloping character, which indicates the ability to continue overdischarging.
After short-circuiting, the pouch cells were charged–discharged with nominal current, but both batteries showed no electrochemical activity in the operating voltage range. The electrodes of coin cells and pouch cells after the short-circuit test were examined by the XPS method.
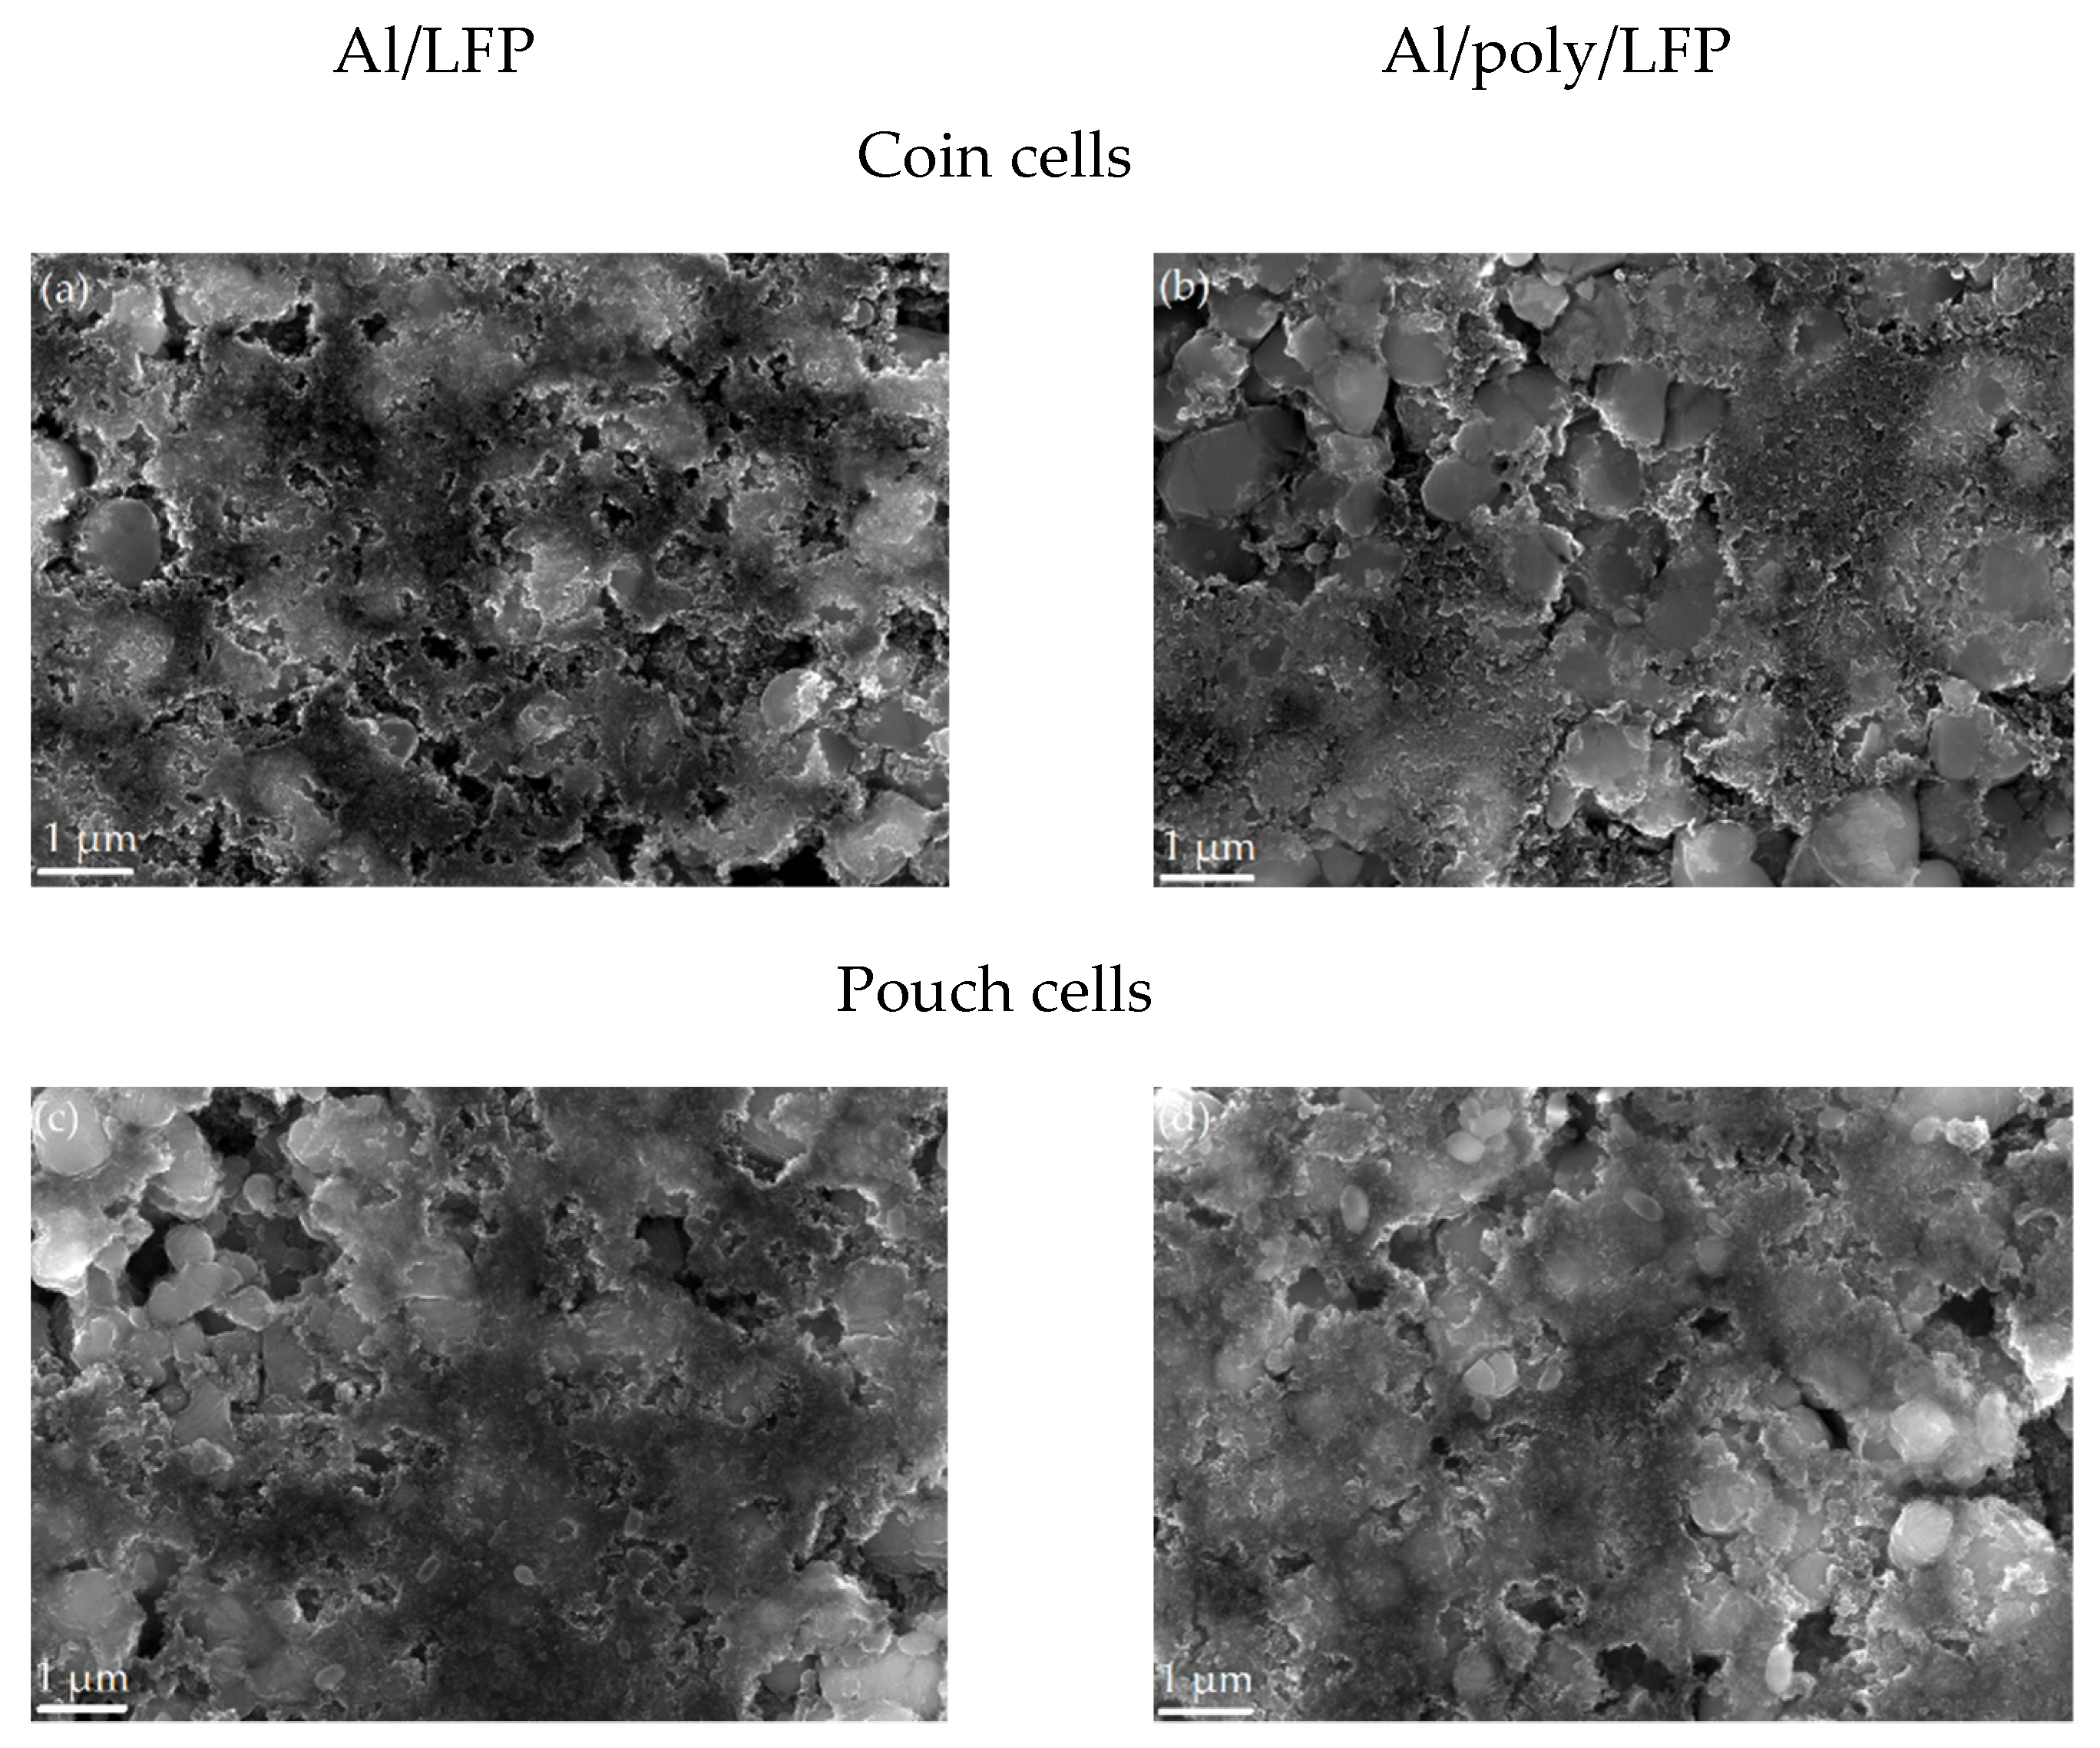
Characterization of the electrodes after the short circuit. On the SEM images in
Figure 9, the coin and pouch cell cathodes’ surface is shown. There are no visible changes after the short circuit in both cases. The surfaces of the samples, the shape and size of the particles, and the uniformity of the distribution of the components of the active mass are not changed in comparison with the non-operated cathode.
A 1-µm X-ray diffraction study of the cathodes is presented in
Figure S5, and it is apparent that the change in the crystal structure of the active material does not occur for the short circuit of both electrodes in coin cells and pouch cells, as confirmed by the presence of LiFePO
4 and FePO
4 phases, indicating that only the electrode discharge process without any side reactions takes place. Thus, we can assume that changes in charge–discharge characteristics after short circuiting of coin and pouch cells can likewise be caused by changes in composition of cathode interface layers on protected and unprotected cathodes formed during short circuiting in quasi-isothermal and non-quasi-isothermal conditions. To reveal these differences, the exposed cathode samples were characterized by using XPS.
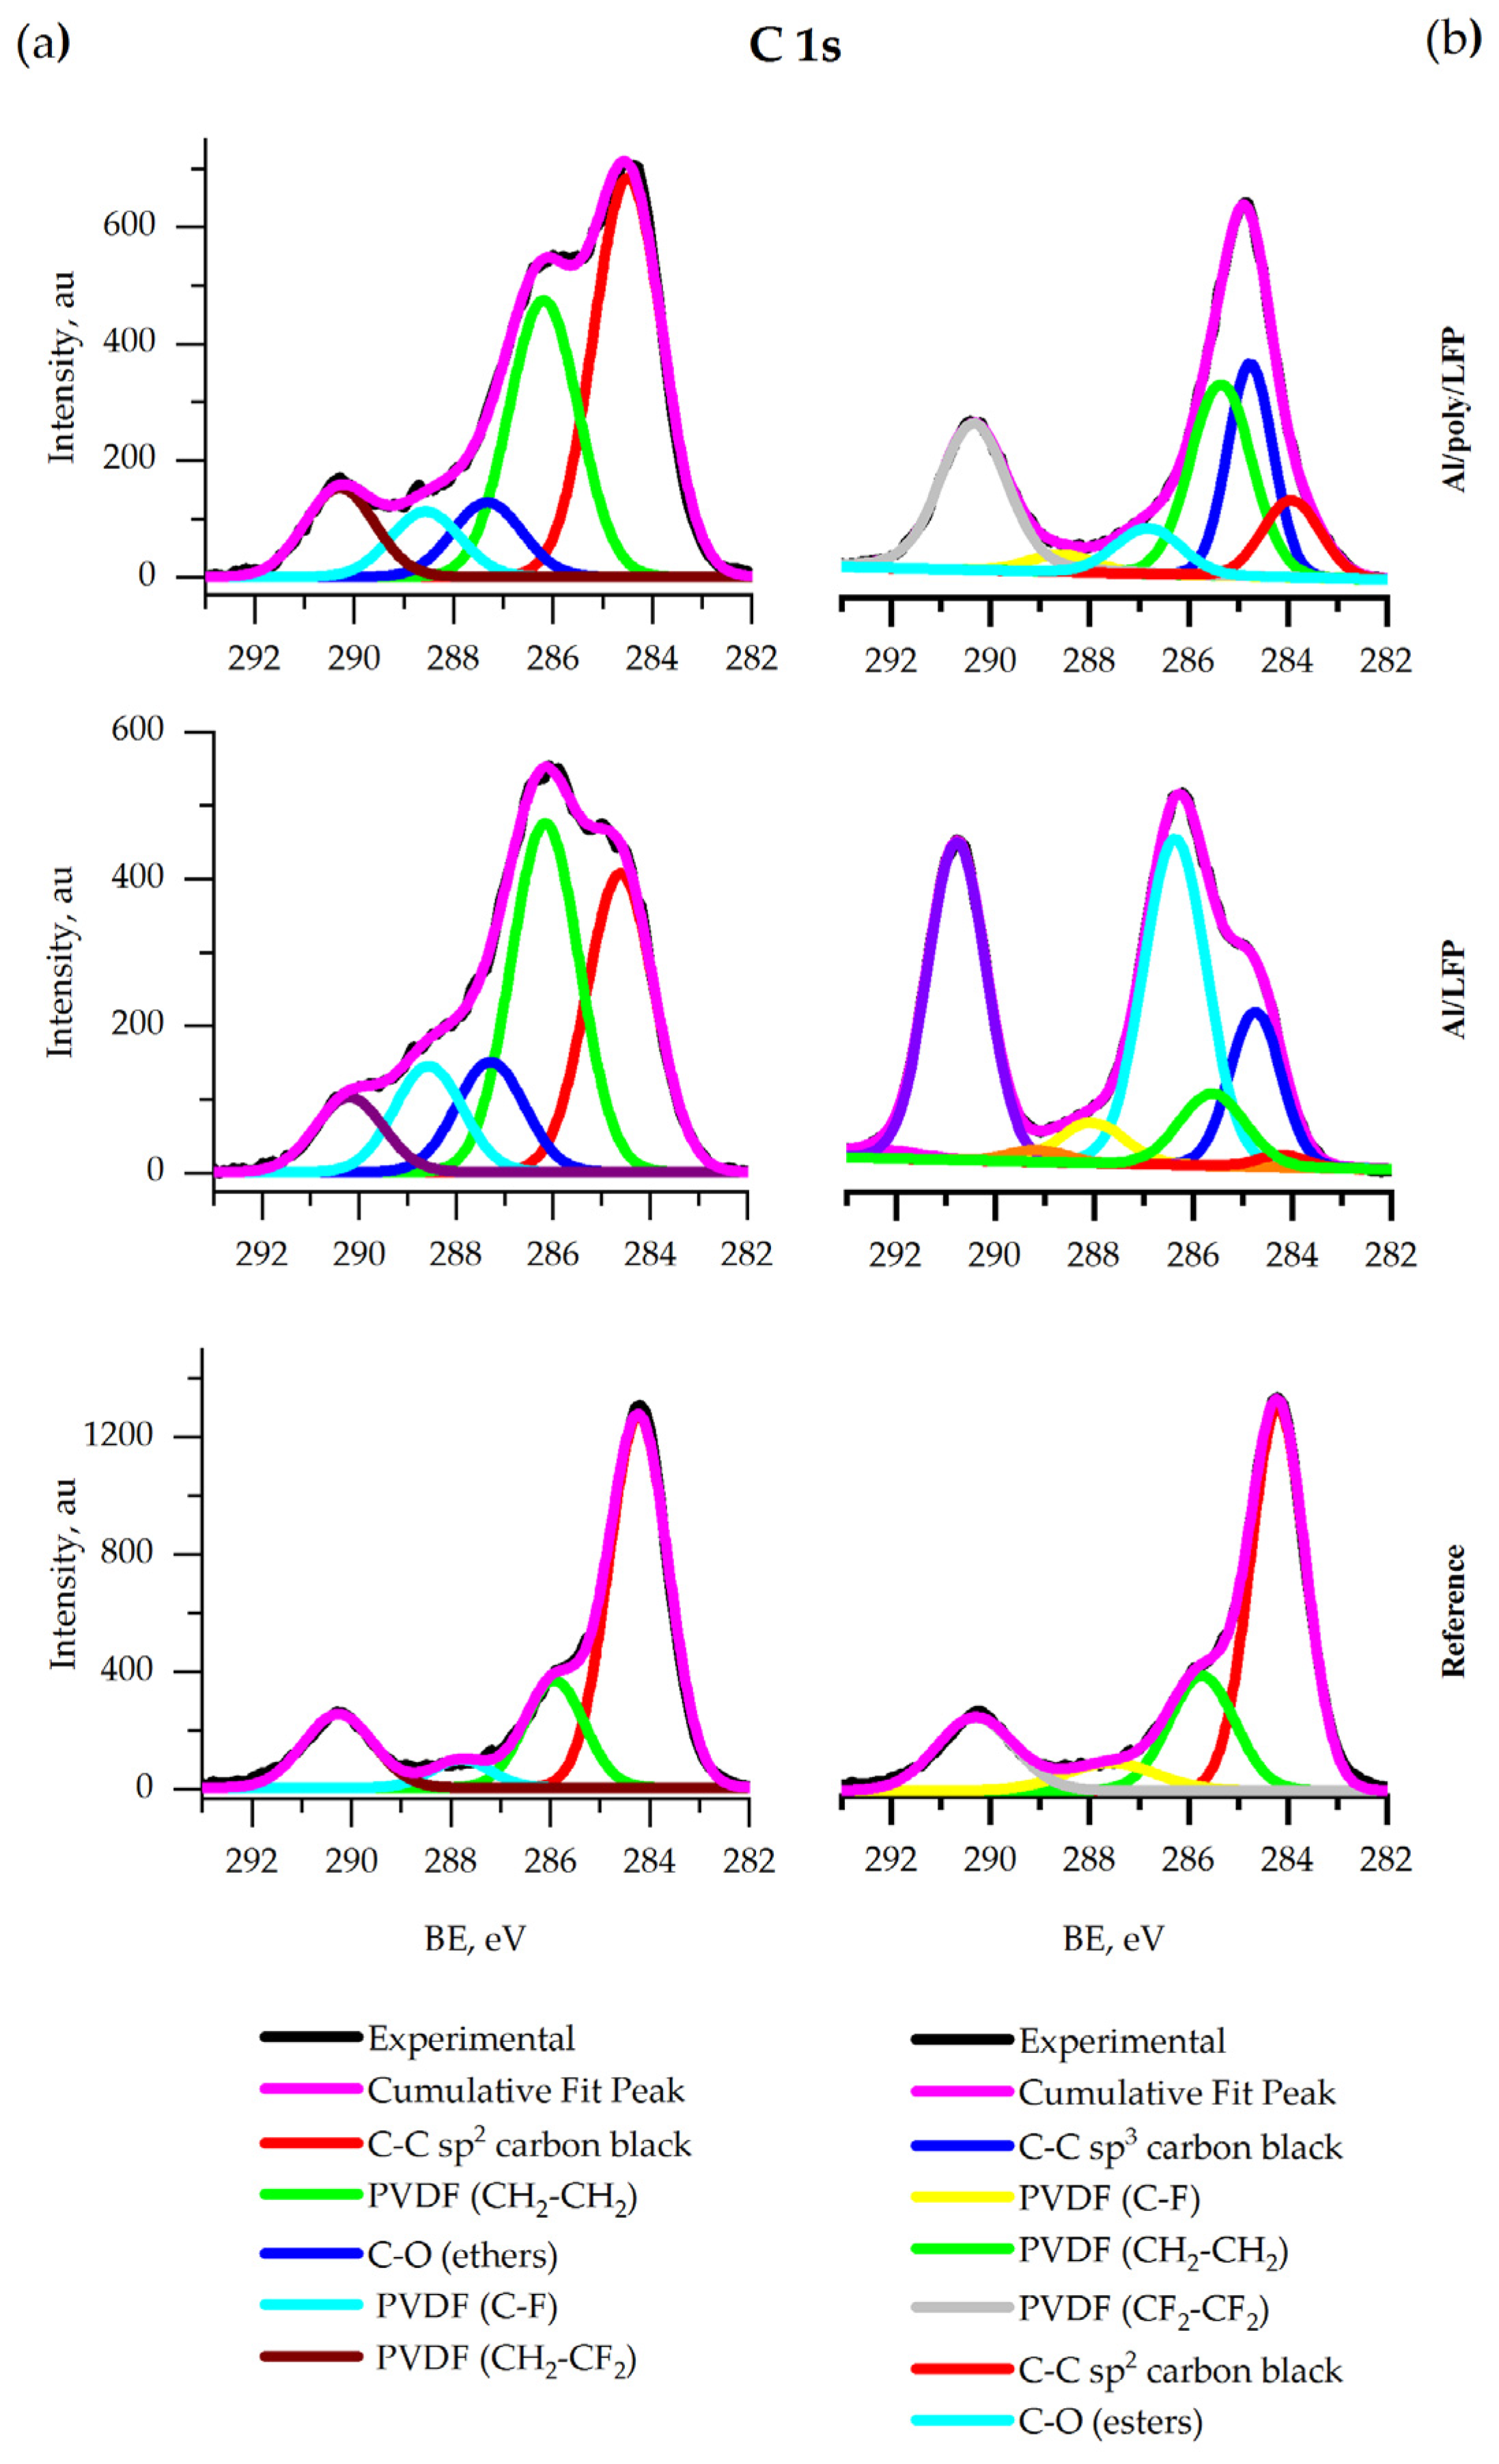
Coin cells electrodes XPS. Figure 10 a shows the C 1s spectra of all samples. The spectra contain the peak of the C–C sp
2-bond of carbon black [
64] and peaks of C–H and C–F bonds in the CF
2–CF
2 group [
64] in PVDF. The intensities of the carbon black and the binder peaks remained intact after short circuit test. The new peak of ethers at 286.9 eV is detected in the spectra of samples after the test. The ethers are produced by the electrolyte decomposition. The intensity of the peak on the spectrum of protected sample was lower.
Figure 11a shows that in the P 2p spectrum of the reference LFP, the main peak is observed at 133.3 eV, which corresponds to phosphorus P
+5 in the PO
43− [
65,
66] and the second peak at 138.7 eV [
64], corresponding to LiPF
6. The component at 136.4 eV is attributed to a fluorine-rich (and oxygen-poor) fluoropolyphosphate Li
xPO
y−1F
z + 1.
Figure 12a shows that in the F 1s spectrum of the reference sample there is one main peak at 687.3 eV which is assigned to CH
2–CF
2 in PVDF [
67]. The signals at around 684.9 eV on the Al/LFP and Al/poly/LFP spectra are assigned to LiF in agreement with the reference BE and FWHM [
68].
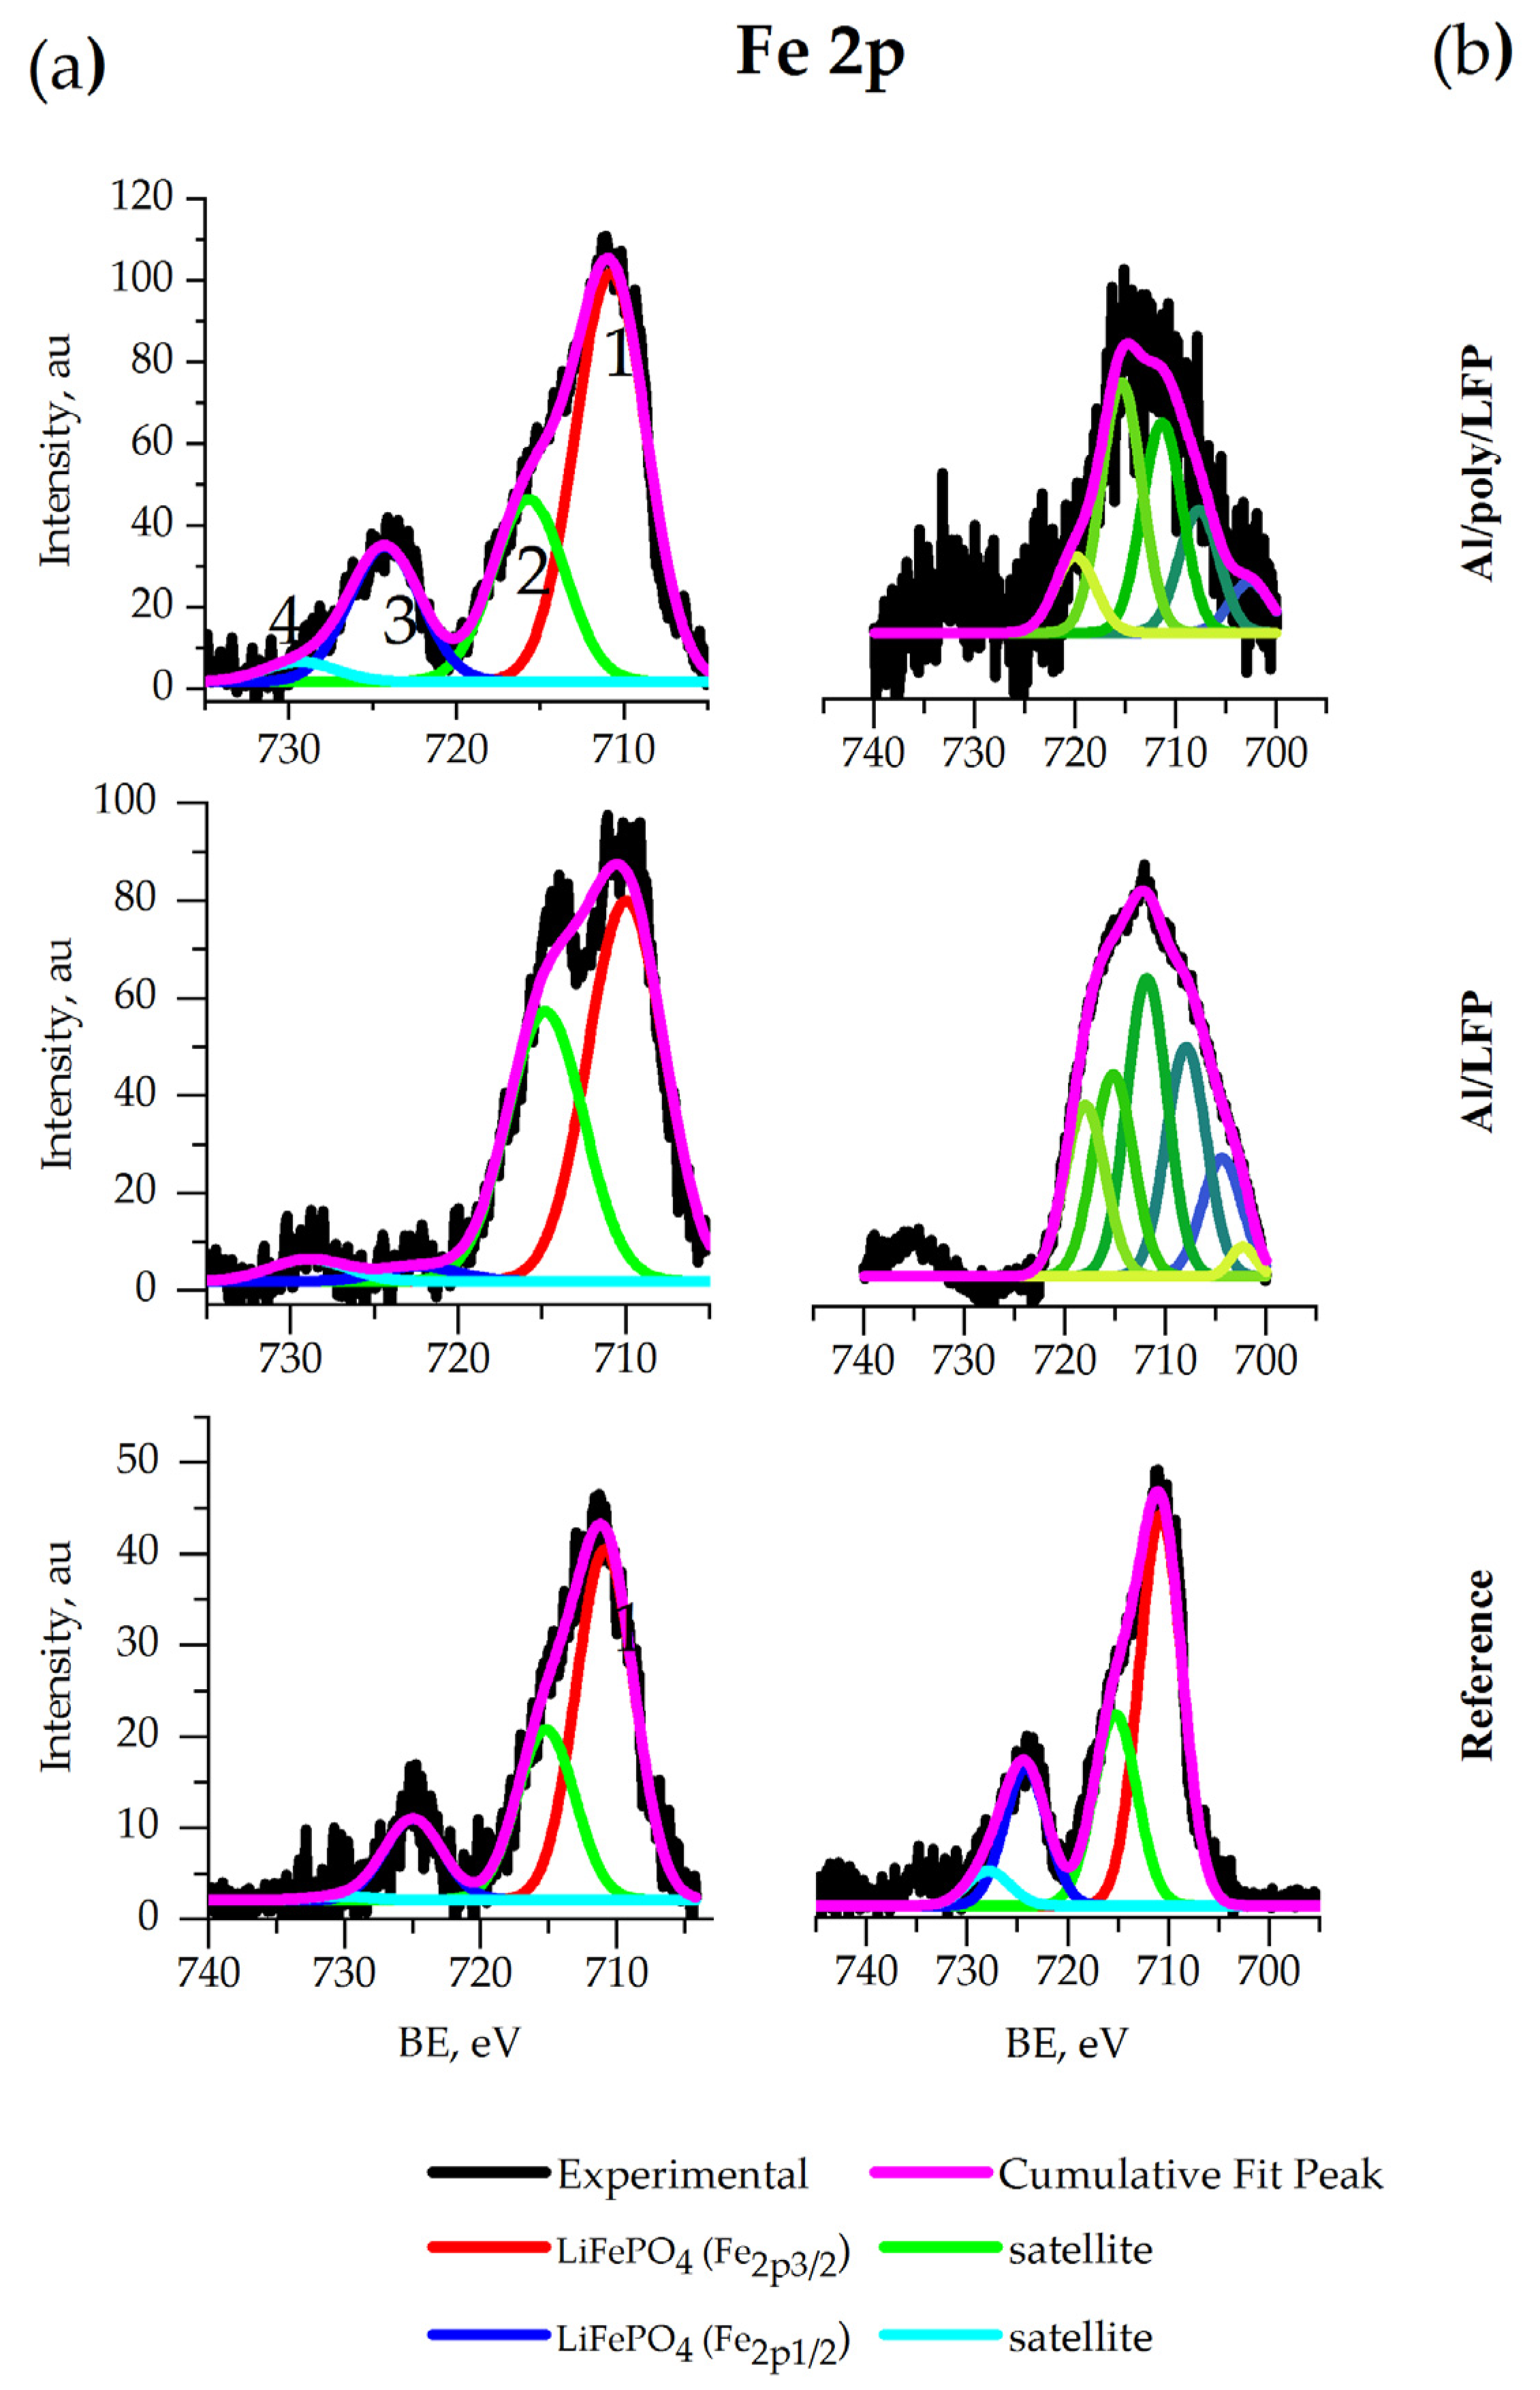
The Fe 2p spectra of all coin cell electrodes (
Figure 13a) contain two peaks 1 and 3 located at 710 eV and 723 eV, respectively, that correspond to the bands of
and
in LiFePO
4 [
69]. In the same spectra, satellite peaks 2 and 4 at 715 eV and 729 eV, respectively, relate to the transition of metal spectra [
64]. The peak at 723 eV disappeared from the spectrum of the unprotected electrode extracted after the short-circuit test.
Pouch cells electrodes XPS. Figure 10 b shows that the C 1s spectra of all samples contain bands characteristic of the C–C sp
2-bond, which indicates carbon black presence in the sample [
64]. Additionally, these spectra contain peaks of C–H and C–F bonds in the CF
2–CF
2 group [
64], corresponding to the presence of PVDF. The carbon black and binder peaks persist after short circuit test; however, the ratio of their intensities changes. In contrast to the spectrum of the reference set, a peak of ethers is detected in all overcharged sets (C–O, about 286.9 eV). The ethers are the products of the electrolyte (1 M LiPF
6 EC:DEC) decomposition reaction. The intensity of the peak was lower for all protected samples. The signal at 284.6 eV corresponds to sp3-hybridized aliphatic carbon [
64].
Figure 11b shows that in the P 2p spectrum of the reference Al/LFP electrode (
Figure 11), the main peak is observed at 133.3 eV, which corresponds to phosphorus P
+ 5 in the PO
43− [
65,
66]. In overcharged samples this peak is retained and remains dominant. For Al/LFP and Al/poly/LFP electrodes extracted from the cells after short-circuit test, a second peak of the F–P–O bond appears at about 134.4 eV, which can be attributed to fluorine-rich fluorophosphates Li
xPO
y [
68]. The component at 136.4 eV is attributed to a fluorine-rich (and oxygen-poor) fluoropolyphosphate Li
xPO
y−1F
z + 1; the attribution is validated by the corresponding signal in the F 1s spectra (see F 1s discussion) [
68]. LiPF
6 peak is found at 137.7 eV [
68,
70].
Figure 12b shows that in the F 1s spectrum of the reference sample has the only peak at 687.3 eV corresponding to the C–F bond in CH
2-CF
2 binder group [
67]. The signals at around 684.9 on the Al/LFP and Al/poly/LFP spectra are assigned to LiF in agreement with the reference BE and FWHM [
64]. A main peak appears on the spectra of Al/LFP at 687.6 eV. Based on the results published in [
68], the shoulder can be attributed to the F–P bond in Li
xPO
y−1F
z + 1. The presence of this component is also confirmed by the P 2p spectrum of these samples discussed above.
The Fe 2p spectra of both pouch cell electrodes after short circuit contain the new peak at around 708 eV corresponding to Fe
3O
4 [
71], which is a product of the cathode overdischarge. Additionally, another product of overdischarge, FeF
3, may be detected by peaks at 711.8 and 715.2 eV [
72].
The signal of Fe 2p on the Fe spectrum of Al/LFP has the intensity close to the noise level. Taking this into account, the spectra of the reference LFP and overdischarged Al/poly/LFP electrodes are similar and indicates electrode safety after overdischarge. The intensity of the Fe 2p peak in the spectrum of Al/LFP is lower due to degradation of the electrode material under short-circuit conditions.
The surface of the sample with a switchable resistance polymer layer contains less product of the electrode material and electrolyte decomposition. Consequently, the polymer layer protects electrode material in short-circuit conditions.
3. Materials and Methods
General considerations. General ideas concerning the experimental part are presented in the
supplementary materials. There the reader will find information about types of solvents and salts, XRD, XPS modes, paste preparation equipment, etc. The monomer [Ni(CH
3OSalen)] was prepared as described previously [
73]. Electrochemical tests were carried out at the temperature of 20 °C.
Polymer deposition. The poly[Ni(CH3OSalen)] was deposited potentiostatically on an aluminum foil sheets (70 mm length and 35 mm width) with a carbon layer at 0.8 V from 10 mM monomer solution in 1 M LiClO4/CH3CN in a three-electrode galvanic bath to 85 mC per 1 cm2 charge passed for 1 µm poly[Ni(CH3OSalen)] thickness. The deposition process was stopped when certain charges were passed. The poly[Ni(CH3OSalen)] thickness was 1 µm. The counter electrode was stainless steel wrapped in a separator. After deposition, the polymer foil was reduced to −0.3 V by LSV and washed with CH3CN (anhydrous) and dried under an argon atmosphere in a glove-box at room temperature for 24 h.
Electrode preparation. To prepare a slurry mixture of 40 g LiFePO4, 5 g carbon black and 5 g PVDF were homogenized in 120 mL N-methylpyrrolidone for 24 hr with an anchor mixer, casted onto pure or polymer-coated aluminum foil (
Figure S5). Electrodes were dried under air atmosphere until the solvent evaporated and then in vacuo at 80 °C for 24 h. Then, the electrodes were pressed by roll press. The cathode active material loading was 8.57 mg·cm
−2 (1.2 mAh·cm−
2) for protected and unprotected electrodes. Anode material was prepared in the same manner and consisted of CMS graphite (90%), carbon black (5%) and PVDF, casted on a Cu foil, and then dried in vacuo for 24 h at 100 °C.
Cell testing. Half-cells were assembled in CR2032 cases. The cathode was a disc with a diameter of 12 mm. The anode was a lithium chip disc with a diameter of 14 mm. The separator was a 16-mm Celgard 2400. The electrolyte of 1 M LiPF6 in 1:1 EC:DEC in the amount of 0.1 mL was added to each half-cell. Five cells in each group were used for each testing pattern for optimal accuracy of the results, i.e., five cells with the protected electrode and five cells with an unprotected one.
To assemble the pouch cells, a graphite anode (141 × 22 mm) prepared earlier was used. Rectangular electrodes (140×20 mm) were cut with a precision cutter. Aluminum and nickel current collectors were spot welded to anode and cathode strips, respectively. The anode was covered with the Celgard 2400 separator. Then, the cathodes and anodes were twisted into a flat configuration and placed in the laminated Al case. In the argon-filled glove-box, pouch cells were filled with electrolyte (1 M LiPF6 in 1:1 EC:DEC). The amount of electrolyte was 4 mL per Ah. Then samples were vacuum-sealed. Then, the cells were left for 8 h for equilibration with further formation cycles according to dual-current protocol [
61]. Nominal cell capacity was obtained at 0.1 C that was a formation current density. Then three normal charge–discharge cycles at 0.5 C rate from 2.5 to 4 V were performed to control the cell assembling quality. All capacities are normalized to the positive electrode active material content. The 1C is taken equal to 140 mA·g
−1 current.
Impedance spectroscopy. The CR 2032 coin cells were assembled and then six charge/discharge cycles from 2.5 to 4 V at 0.5C rate were conducted after the 8 h rest. The cells were then left to rest for 8 h in the discharged state with the subsequent impedance measurements were carried out. The procedure was executed as follows:
- (1)
the impedance measurement at OCV;
- (2)
charge to 4 V at 0.5C rate;
- (3)
2 h rest hold;
- (4)
the impedance measurement;
- (5)
discharge to 2.5 V at 0.5 C rate;
- (6)
2 h rest hold;
- (7)
the impedance measurement;
- (8)
charge to 4 V at 0.5 C rate;
- (9)
short circuit for 1800 s and 5 h of equilibration at OCV; and
- (10)
the impedance measurement.
After the short circuit, the charge/discharge with impedance measurement (steps 2–7) were performed. A Biologic BTS-805 test station was applied in potentiostatic mode (Ecell = Eocv), frequency scan was from 10 kHz to 10 mHz with 10 points per decade in logarithmic spacing, sinus amplitude 10 mV rms, values obtained as averages from two measures per frequency. Charge transfer resistances (Rct) after charge and discharge were calculated for protected (Al/poly/LFP) as well as non-protected (Al/LFP) coin cells from the semicircular region of impedance spectra by using the Biologic BT-Lab software circle fit algorithm.
Conductivity measurements. A polymer film was deposited on the interdigitated electrode to get 80 mC. Then, the electrode was washed with 1 M LiPF6 in EC/DEC, and the polymer conductivity was also determined. Based on [
74], film thickness was calculated from its charge consumed during the deposition considering the number of electrons for monomeric unit. The electrode surface area was 0.34 cm
2 and the polymer density was taken from literature data [
74]. The interdigitated electrodes had a 6.76-mm single-track length, 5-µm single-track width, and a 5-µm array band gap, and the number of tracks was 250 for each working electrode. Cyclic voltammetry (scan rate 5 mV·s
−1) was performed simultaneously on the IDE grids as two working electrodes with a constant voltage difference of 10 mV between them. A voltage range was set between 3.0 and 4.0 V for normal operating rate and between 1.0 and 3.0 V for the estimation of short-circuit polymer behavior. The currents that flow over the working electrodes consist of the Faraday current of the electrochemical process and the ohmic leakage current. Assuming equality of Faraday currents on both working electrodes, it is quite easy to isolate the leakage current from there. According to Ohm’s law, the resistance/conductivity of the polymer can then be determined. For a more detailed description of this procedure, see the article [
46].
Accordingly, for the two working electrodes WE-1 and WE-2 we can write
Given the leakage current and the electrode parameters, calculate the conductance (G) or resistance (R) of the polymer layer can be calculated as
where
is the difference between the currents on working electrodes and
is the potential difference between the working electrodes.
Specific conductivity and resistivity were calculated according to [
28],
where
is the specific resistivity,
is the distance between the WEs,
is the thickness of the film,
is the number of IDE fingers, and
is their length.


