Abstract
Lithium-ion cells with a silicon-graphite (SiC) anode and a nickel-rich cathode are potential candidates for use in electric vehicles (EVs) as this material combination offers high energy densities and low costs. Another desired cell specification that results from an intended short charging time for EVs is the robustness against high charge rates. However, high charge rates can lead to the critical aging mechanism of lithium plating, especially at low temperatures. Investigating this issue, this paper presents a test series on cyclic aging with varying charge rates from 0.2C to 1.5C at ambient temperatures of 0 °C and 10 °C applied to a nickel-rich SiC cell candidate. The resulting effects on cell aging are analyzed with a stripping method, whereby reversible lithium plating can be detected, and a differential voltage analysis (DVA), whereby the overall loss of capacity can be attributed to changes in individual characteristic capacities. The results indicate a degradation sensitivity of SiC anodes at elevated charge rates, evidenced by the loss in the silicon-related characteristic capacity, and question the aging robustness of this material combination.
1. Introduction
1.1. Motivation
One key element for the successful implementation of electromobility is an appropriate design of the traction battery. In this use case, lithium-ion cells as storage technology still face several challenges. According goals of cell and material development are to achieve higher energy densities, while reducing costs and enhancing sustainability. To this end, the cell components and materials are continuously optimized. Amongst others, a trend towards a silicon-graphite (SiC) anode and a nickel-rich cathode has followed [1]. However, the consequences of these trends on the aging characteristic must be investigated: The higher nickel content of the cathode, which partially substitutes the share of cobalt, can promote the formation of byproducts like a rock-salt layer on the cathode surface. This in turn can increase the charge transfer resistance during cycling [2]. The added silicon share in the anode enables a specific electrode capacity that is far in excess of that of pure graphite anodes [1,3,4]. Here, the disadvantage is that the silicon contributes to irreversible capacity losses, as it causes high volume changes while cycling the cell and thus leads to a degradation of the active anode material [5,6,7,8,9,10]. Another goal of battery development is to achieve charging times of a few minutes in order to compete with the refueling of internal combustion engine vehicles. However, fast charging with high charging currents accelerates cell aging. This effect is enhanced by low ambient temperatures, for example, in winter conditions [1,11,12]. As one potential solution, innovative thermal strategies for fast charging are tested, e.g., asymmetric pre-heating [13]. Alternatively, acceptable charging currents must be identified according to a trade-off between short charging times and long service lives of the battery cells.
1.2. Lithium Plating as a Potential Aging Mechanism while Charging
However, the underlying issue with charging high current rates remains because lithium plating as potential aging mechanism can decrease the cell life significantly [14,15]. As a competing reaction to the regular intercalation of lithium-ions, lithium plating takes place at the anode surface, where approaching lithium-ions are reduced resulting in the deposition of metallic lithium. The precondition for the occurrence of lithium plating is a local anode potential below 0 V vs. Li/Li+ that results in limitations of charge transfer or solid state diffusion. During the constant current (CC) phase of charging, the anode potential decreases continuously and reaches a minimum at the transition to the constant voltage (CV) phase. During the CV phase, the anode potential increases again as the current decreases [12,16,17,18]. A distinction must be made between the reversible share of lithium plating QPlating,rev and the irreversible share of lithium plating QPlating,irrrev where Equation (1) applies [19].
QPlating = QPlating,rev + QPlating,irrev.
Reversible lithium plating is less critical, as plated lithium-ions can reoxidize or intercalate into the graphite subsequently. Irreversible lithium plating, in contrast, leads to an irreversible loss of lithium inventory. This occurs when the plated metallic lithium becomes electrically isolated from the anode. Isolated metallic lithium can react with the electrolyte causing an increased SEI growth. Thus, irreversible lithium plating has a negative effect on cell capacity and power. In the worst case, formed dendrites can lead to cell-internal short-circuits [19,20,21]. The reversibility of lithium plating is denoted as R and can be calculated by R = QPlating,rev/QPlating,irrrev [19].
The occurrence of reversible lithium plating can be detected by the so-called stripping discharge, inter alia. Thereby, the lithium-ion cell is discharged with a low current rate (e.g., C/30). In the case of reversible lithium-plating, a characteristic shift in the voltage response at the beginning of the discharge phase occurs [16,19,22,23]. As a related approach, the stripping relaxation method has to be mentioned. A relaxation phase with no current loading is appended to the critical charging phase and, in the case of lithium plating, again a characteristic shift in the voltage response becomes apparent [17,24]. The non-destructive detection of the irreversible lithium plating is even more challenging. The differential voltage analysis (DVA) is a possible detection method, as it allows to fathom the cause of the total loss of capacity [19]. Lithium plating will primarily lead to a loss of lithium inventory. However, a clear conclusion on the loss of lithium inventory can only be drawn under the assumption that the storage capacities of the anodic and cathodic active material do not change [25,26,27,28]. A further potential method for the in-situ investigation is coulometry, whereby the cells are cycled with low currents while the voltage over ampere-hours is recorded [26,29,30]. Using these data, changes in charging and discharging endpoints allow for conclusions on the anodic and cathodic side reactions, as well as their effect on lithium inventory. For coulometry, high-precision battery test systems are required [26,30,31]. With neutron diffraction, the movements and aggregations of lithium-ions during operation can be visualized. Thus, not only can lithium plating be detected, but also quantified. As a disadvantage, this method can only be performed with special equipment [23,24,32]. Using electrochemical impedance spectroscopy, lithium plating becomes noticeable in the before-after comparison by a shrinking of the entire spectrum in the Bode diagram, especially the charge transfer section, and by a decrease in the ohmic resistance. However, the interpretation of the spectrum is difficult at times and the information content regarding lithium plating is low [11,17]. As a post-mortem analysis, destructive cell openings under inert atmosphere are used for the unambiguous identification of metallic lithium, which becomes visible through a metallic-silver deposit on the graphite surface [18,33].
1.3. Content of This Study
Against this background, this study investigates the effects of fast charging on a cell candidate with a SiC anode and nickel-rich cobalt aluminum oxide (NCA) cathode. To investigate the aging mechanisms as well as occurring cell degradation, solely non-destructive detection methods are applied. This ensures the applicability for the industrial context, as less high-cost equipment is needed. The investigation foresees test series with different charging currents and different ambient temperatures. As a resulting benefit, recommendations for charging protocols are deduced.
2. Experimental
2.1. Initial Cell Characterization
For the investigation presented in this paper, 16 fresh cell candidates with the type designation US186050VC7 of the manufacturer Sony (Murata) are used, whereby all specimens belong to the same production batch. This high-energy cell, with a nominal capacity of 3.5 Ah, is specified with a maximum charge current of 3.0 A, i.e., 0.9C. The charging temperature range is indicated as 0 °C to 45 °C. The upper voltage limit Umax is 4.2 V and the lower voltage limit Umin is 2.5 V. During the presented investigation, the cells are exposed to load cycles, characterized by specific charge rates for load charging, at ambient temperatures at the lower boundary of the charging temperature range, designated as load temperatures.
Half cells are produced for analysis purposes using an additional fresh specimen of the same cell type and production batch, using the procedure as explained in [34]. DVA spectra are recorded on the harvested half cells (anode: SiC, cathode: NCA) as well as on a pristine, fresh full cell in 18650 format as shown in Figure 1 [34]. The shown half cell spectra with their characteristic peaks and valleys can be compared to the available literature [6,26]. This confirms the assumption that the cell candidate has a silicon-graphite anode and a nickel-rich cathode. In consequence, the peaks in the full cell spectrum furthermore can be assigned to either the anode (SiC) or the cathode (NCA).
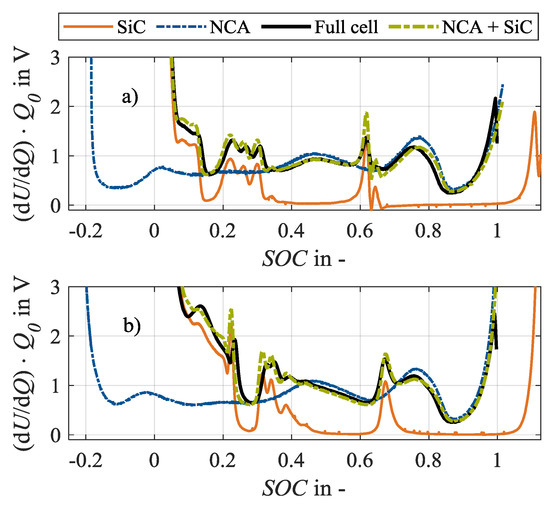
Figure 1.
Spectra of differential voltage analysis (DVA) in (a) charge and (b) discharge direction of half cells (SiC, NCA; at approx. C/100), full cell in 18650 format (at C/30) and analytically reconstructed full cell (NCA + SiC) [34].
Accordingly, the characteristic capacities as shown in Figure 2 can be defined in the full cell spectrum, based on the considerations of Keil and Jossen [26] as well as Zilberman et al. [6], and serve as an unaged reference condition for the investigation. Accordingly, the anodic capacities refer to the charge amount between the start of the charging process at 0% state-of-charge (SOC) and the corresponding SiC peaks. The characteristic capacity CSiC corresponds to the main peak of the anode at 65% SOC. A change in CSiC shows a change in the anodic storage capacity [26]. The anode potential of a silicon-graphite anode rises in a more shallow manner towards delithiation at the discharge end than the potential of a pure graphitic anode [3], showing a plateau at 10% SOC. Therefore, a characteristic capacity CSi is assigned to the silicon component of the SiC anode. Consequently, a change in CSi reflects a change in the storage capacity of the silicon share. The capacities related to the three peaks between 20% and 35% SOC, CC,1, CC,2, and CC,3, are not related to 0% SOC but to the main peak of the anode at 60% SOC, as no overlap with other SiC markers is recommendable [6]. CC,1, CC,2 and CC,3 indicate a change in the storage capacity of the graphite. The cathodic capacity CNCA refers to the distance between the cathode marker at 75% SOC and the end of charging at 100% SOC. In contrast, the capacity CB represents a combination of anode and cathode markers as it is defined as the distance between the main peak of the anode and the end of charge. A change in CB can thus be interpreted as a change in the electrode balancing. If the anodic and cathodic storage capacities do not change, a change in the electrode balancing, thus in CB, indicates a loss of lithium inventory that changes the operating window of the two electrodes [26].
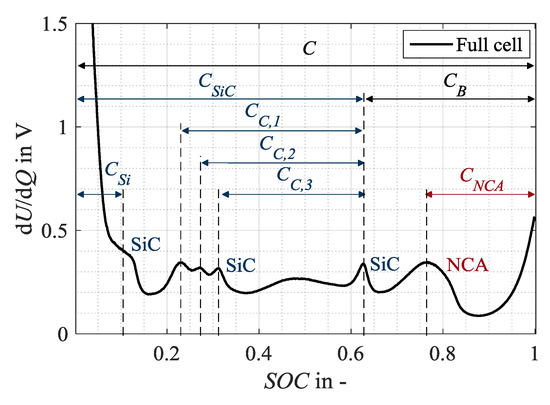
Figure 2.
Assignment of distinct characteristic capacities in the DVA spectra (in charge direction) of the full cell in 18650 format as a basis for the evaluation of present aging mechanisms and modes.
2.2. Regular Check-Up Test
The check-up test with four sequential steps as shown in Table 1, conducted with a Basytec XCTS (step 1) and a Basytec CTS (steps 2–4) system inside the climate chamber Memmert IPP110plus, is used to determine the aging condition regularly. As a first step in the check-up test, a stripping discharge is performed at load temperature 0 °C or 10 °C. In this study, the stripping discharge analysis is chosen as detection method for lithium-plating since this method requires less testing time than stripping relaxation, but provides equivalent results to the relaxation method [35]. An immediate start of the stripping discharge after load charging is necessary, as plated lithium dissolves during rest periods and is not detected consequently [23]. The stripping discharge is implemented as a constant current constant voltage (CCCV) discharge phase with a low CC discharge current Idis of C/25 and a cut-off current Idis,cut-off of C/35.

Table 1.
Check-up test comprises four sequential steps. Different methods are used in the sequential steps to determine different parameters of the cell’s aging condition.
For the subsequent DVA in step 2, the temperature in the climate chamber is raised to 25 °C, which is the reference temperature for check-up testing. For cell homogenization, a rest of six hours is applied after the temperature adjustment. Before the start of the DVA, a CCCV discharge ensures a SOC of 0% at 25 °C. After an additional rest of 60 min, a full CC charge and discharge at C/25, respectively, is applied for DVA. To determine the discharge capacity CDis,CCCV in step 3, two CCCV cycles with C/3 and a cut-off current of C/25 in charge and discharge direction are applied. The averaged discharge capacity is used as check-up capacity in order to minimize the influence of the recovery effect [33,34,36,37]. Finally, the internal resistance RDC,10s is determined by a two-stage pulse test in step 4. For this purpose, the current step profile as explained in [34] is used. The value for RDC,10s is evaluated 10 s after the applied second current step, following other aging studies [37,38].
2.3. Definition and Implementation of the Test Series
For load cyclization, a Basytec XCTS25 system is used. During the experiment, the cells are placed inside the climate chamber Memmert IPP110plus to imprint the specified ambient temperature as load temperature while load cycling.
The full factorial test matrix performed in this investigation is shown in Table 2. Two different temperature levels and four different charge rate levels are investigated. The load temperature 0 °C is selected, as this value is specified as the lower temperature limit for charging in the manufacturer’s data sheet. As a second temperature level, 10 °C represents the annual average daily temperature in Germany in 2017 [39], thus can be assumed as a realistic ambient temperature while charging batteries in electric vehicles. For load cyclization, charge rates of 0.2C, 0.5C, 1.0C or 1.5C are applied to the cells in order to investigate different scenarios of corresponding charging times. To investigate reproducibility, two cells are tested for each test point in Table 2.
Table 2.
Test matrix for load cyclization, whereby “•” stands for tested with two cell specimen.
Table 3 shows the overall test plan conducted for each test point. Between the ten sequential steps, considerable storage times are avoided to minimize interferences of calendar aging. As a first test step, ten consecutive half cycles are executed at 25 °C for cell activation and to establish comparable initial cell conditions. Subsequently, an initial check-up test 0 as presented in Table 1 is conducted to record an initial aging condition. As a next step, the first load cycle (load cycle 1) is performed at the respective load conditions as noted in Table 2. The load charging starts from 0 % SOC in CC mode at load current as specified in Table 2 until reaching the upper voltage limit. Afterwards, the cells are charged in CV mode until reaching a SOC of 80 % corresponding to a total charge throughput of 2.8 Ah. 80 % was chosen as end-of-charge SOC for all test points with different charge rates as a trade-off between a high charging range in CC mode comprising the minimum of anode potential and a short duration of the CV phase during which the anode potential will increase again and may cause the dissolution of plated lithium [17]. Afterwards, the cell is discharged in CCCV mode (Idis = 1C, Idis,cut-off = C/35) to reach initial SOC condition again and complete the load cycle. For temperature homogenization, a remaining 20 min is scheduled between charging and discharging. After one load cycle and according to Table 3, either a check-up test or additional load cycles are applied to the cell. In total, 14 load cycles are applied to the cells in each test point. The test points at a charge rate of 0.2C at either 0 °C or 10 °C are an exception. These two test points are terminated after check-up test 1 (Step 4 in Table 3) due to limited available testing time for this investigation.
Table 3.
Test plan with ten sequential steps applied in this test series for all test points.
3. Results and Discussion
3.1. Evolution of Cell Temperature during Charging
When evaluating cyclic test series with regard to temperature dependence, the evolution of the cell temperature due to resistance-dependent heat generation effects must be taken into account [40,41]. In this investigation cell temperature is evaluated as the temperature at the cell surface measured by a temperature sensor mounted on the cylindrical cell housing longitudinally between the positive and the negative cell pole. Therefore, it must be noted that the temperature in the inner cell core can be higher due to the linear temperature gradient from the center to the surface [40,41]. Figure 3 shows the evolution of the measured cell temperature during the CCCV charge phases with different charging rates at the set ambient load temperatures of (a) 0 °C and at (b) 10 °C, exemplarily during load cycle 1. The temperature curves show initial offsets to the set load temperatures in Table 2 at the beginning of charging, which must be attributed to the control of the used climate chamber. During the CC phase, the cell temperatures rise in dependence on the charge rate: the higher the charge rate, the higher the rise in cell temperature during the CC phase. At the end of the CC phase and with the start of the CV phase (points in time highlighted with asterisks), the cell temperatures decrease again with the appropriate decreasing current rates. At the end of the CV phases (points in time highlighted with vertical lines) the cell temperatures approach the set ambient temperatures again. The cell temperature at a charge rate of 0.2C does not show this evolution trend. It can be assumed that the heat generation is in equilibrium with the heat dissipation for this load condition. Figure 3 also shows that the specified charge rate does not only influence the evolution of cell temperatures but also the duration of the CC and CV phases, respectively. Both effects, the variance in temperature as well as in the duration of the CV phase, can influence the acting aging mechanisms and thus will be addressed in the following.
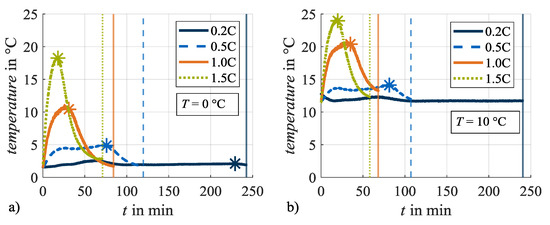
Figure 3.
Evolution of cell temperature during charging at different charging rates at (a) 0 °C and (b) 10 °C. The asterisks mark the end of the constant current phase, the vertical lines the end of the constant voltage phase.
3.2. Investigation of Reversible Lithium Plating
In this section, the results of the stripping discharges are analyzed with regard to the occurrence of reversible lithium plating. Figure 4 shows the relevant beginning of the stripping discharges. Exemplarily, the data at 0 °C and all investigated charge rates is shown. In this early phase, a distinctive plateau in the voltage response is formed and indicates occurred reversible lithium plating [16,19,22,23]. The reference curve, exemplarily representing the unaged condition of one cell specimen used in this test series at check-up test 0, shows no plateau. Similarly, no plateau is apparent for load charging with 0.2C. Therefore, it is deduced that no reversible lithium plating occurred for this load condition. In contrast, after load charging with 0.5C, 1.0C and 1.5C, stripping plateaus indicate the dissolution of lithium-ions from the anode surface. Accordingly, reversible lithium plating has occurred during the previous charging. In addition, the three curves show a trend that the higher the charge rate, the higher the voltage level after the plateau. The turning points of the plateaus shift to the right with an increasing load charge rate. Thus, the length of the plateau increases and indicates a higher quantity of plated lithium-ions [23].
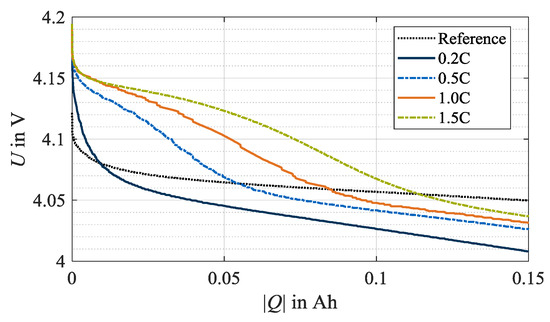
Figure 4.
Beginning of stripping discharges at 0 °C after load cycle 1, whereby lithium plating is not detected at test points with a charge rate of 0.2C but with 0.5C, 1.0C and 1.5C. The reference data exemplifies the unaged condition of once cell specimen used in this test series at check-up test 0.
Table 4 summarizes the occurrence of lithium plating at 0 °C for all test points. Accordingly, no reversible lithium plating can be detected with the stripping discharge following 0.2C load charging. For 0.5C a detection is possible after the load cycles 1, 2, and 5, but not after load cycle 14. For 1.0C and 1.5C, plateaus occur in the voltage response for all stripping discharges. Similarly, Table 5 shows the results for the test series at 10 °C. To obtain these results, the stripping discharges for the test points at 10 °C are analyzed in the same manner as shown in Figure 4 for the test points at 0 °C. For the test points at 10 °C and after load charging with 0.2C and 0.5C, no stripping plateaus occur, indicating the non-occurrence of reversible lithium plating. After load charging with 1.0C and 1.5C, however, plateau formation is recognized. When comparing Table 4 and Table 5, the influence of temperature on the occurrence of reversible lithium plating is apparent. At ambient temperatures of 0 °C, lithium plating is detectable even at a charge rate of 0.5C. At an ambient temperature of 10 °C, reversible lithium plating may be evidenced at charge rates of 1.0C and 1.5C.
Table 4.
Results of stripping discharges at 0 °C, whereby “•” stands for detected, “x” for not detected lithium plating and “-” for not investigated.
Table 5.
Results of stripping discharges at 10 °C, whereby “•” stands for detected, “x” for not detected lithium plating and “-” for not investigated.
It must be noted that in the test point with an ambient temperature of 0 °C and a charge rate of 0.5C, plateaus develop after the first five load cycles, however, no more after the load cycle 14. For this incidence, the duration of the charging phases provides information: as the number of cycles increases, the duration of the CC phase during load charging decreases but the duration of the CV phase increases due to aging. Compared to load cycle 1, the duration of the CV phase has more than doubled after load cycle 14. Accordingly, there is a high probability that lithium plating has occurred, but the reversible lithium has already dissolved in the CV phase and therefore can no longer be detected.
Figure 5 shows the differentiation of the voltage response during the stripping discharge dU/dQ, as shown in Figure 4, for further insights. Here, the values for dU/dQ vare negative, indicating the evaluation in discharge direction. The derivation of the stripping discharges over the number of load cycles is depicted at a charge rate of 1.5C and an ambient temperature of 0 °C, exemplarily. As the number of cycles increases, the local minima shift to the left. This indicates that less plated lithium is dissolved during the stripping discharge with increasing cycle number. On the one hand, this may refer to a lower amount of lithium deposited. On the other hand, it may be due to the longer aging-related CV phase. The reversibly plated lithium already dissolves during the CV phase while load charging and remains undetected. However, a change in the duration of the CV phase may also indicate the occurrence of irreversible lithium plating as the deposited metallic lithium on the surface of the anode will increase the internal resistance. With growth of the internal resistance, the polarization of the cell increases, whereby the upper voltage limit is reached earlier, and a higher share of charge throughput is charged in the CV phase accordingly. Furthermore, after load cycle 14, only a moderately formed minimum can be detected. In this case, a position determination, however, is accordingly inaccurate.
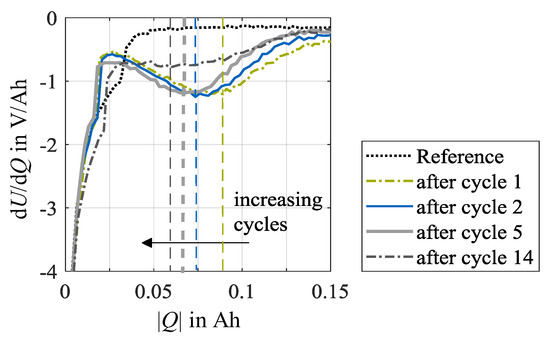
Figure 5.
DVA of stripping discharges at 0 °C after load cycles 1, 2, 5 and 14 at test points with a charge rate of 1.5C. The vertical lines indicate the local minima in the DVA spectra. The reference data exemplifies the unaged condition of once cell specimen used in this test series at check-up test 0.
In summary, three reasons for non-detectable reversible lithium plating are feasible with respect to the results:
- The metallic lithium has already dissolved during the CV phase [22].
- The amount of deposited lithium was too small for detection [17,35].
- No metallic lithium was deposited [16,22].
3.3. Investigation of Irreversible Lithium Plating and Aging Effects
In the following section, irreversible aging effects are investigated by analyzing the relative changes in capacity, resistance and the changes in characteristic capacities. Accordingly, Figure 6 and Figure 7 show the relative changes in internal resistance RDC,10s and discharge capacity CDis,CCCV over the number of cycles at load temperatures of 0 °C and 10 °C. At 0 °C (Figure 6a) and 10 °C (Figure 6b), the internal resistances increase most significantly after load cycle 1 at a charge rate of 0.2C in contrast to the load cycles at higher charging currents, which does not appear as plausible. It is generally assumed that with a higher charge rate, more irreversible lithium plating will occur and thus result in a greater increase in internal resistance [14,15]. Measurement uncertainty, diffusion processes, or the current-dependent evolution of cell temperature evolution can be considered as possible causes. The further development of the resistances with an increasing number of cycles appears plausible, as the greatest relative changes are reached after 14 load cycles.
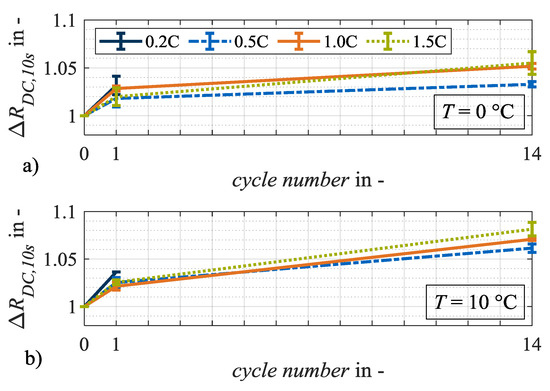
Figure 6.
Relative changes in resistance ΔRDC,10s at test points with charge rates of 0.2C, 0.5C, 1.0C and 1.5C after load cycles 1 and 14 at (a) 0 °C and (b) 10 °C. The error bars show the result deviation from the two equally tested cell specimen.
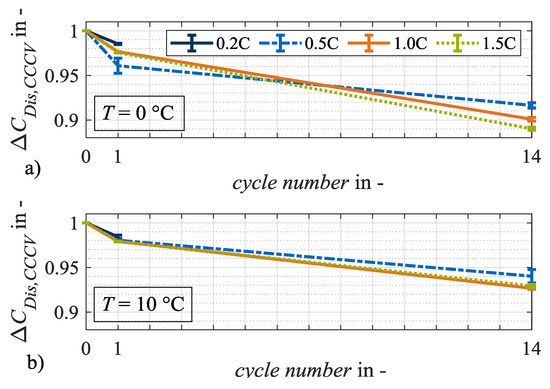
Figure 7.
Relative changes in capacity ΔCDis,CCCV at test points with charge rates of 0.2C, 0.5C, 1.0C and 1.5C after load cycles 1 and 14 at (a) 0 °C and (b) 10 °C. The error bars show the result deviation from the two equally tested cell specimen.
Figure 7a,b shows the relative changes in discharge capacity CDis,CCCV. The higher loss of capacity at 0 °C compared to 10 °C indicates an aging mechanism forced by low temperatures. Irreversible lithium plating is a potential candidate. Due to the low ambient temperature during charging, it is probable that the anode potential drops significantly and remains below 0 V against Li/Li+ for a longer period [12]. Without a reference electrode, however, such a statement is only an assumption. The relative change in internal resistance RDC,10s, however, shows an opposite trend. Here, the relative changes at 10 °C are higher than they are at 0 °C on average. Hence, it can be assumed that at the two load temperatures 0 °C and 10 °C, different aging mechanisms dominate the two different aging effects. Potential aging mechanisms that affect either the cell capacity or resistance are particle cracks, contact losses, corrosion of the current collector or binder decomposition [20]. Irreversible lithium plating primarily results in a loss of capacity. Therefore, it can be assumed that at a load temperature of 10 °C lithium plating is not the dominant aging mechanism. In general, different shares of calendar aging must be considered when comparing aging results at different temperatures [6]. As appropriate data on calendar aging were not available for this cell candidate, the corresponding influence was not analyzed. However, due to the limited test duration of a maximum of 14 load cycles for the individual test points, the difference in calendar shares is assumed to be negligible.
In Figure 8, the development of the DVA spectra over cycle number, as recorded during step 2 in check-up testing as presented in Table 1, is shown for the load charge rates 0.5C, 1.0C and 1.5C at load temperature 0 °C. The data for the charge rate 0.2C is not included, as the corresponding test points are terminated after check-up test 2, wherefore a comparable development trend is not discernible. The data illustrates the general decrease in cell capacity with increasing cycle number as a smaller charge throughput is charged during DVA with increasing cycle number. Hereby, the influence of the charge rate becomes apparent: after 14 load cycles, the highest decrease in capacity is achieved in test points with a charge rate of 1.5C, the least in test points with a charge rate of 0.5C. All characteristic peaks in the DVA spectra shift to the left. Furthermore, the characteristic peak attributed to the silicon share, highlighted by a rectangle in Figure 8, shifts horizontally to higher values in dU/dQ and develops two distinct peaks with an increasing cycle number.
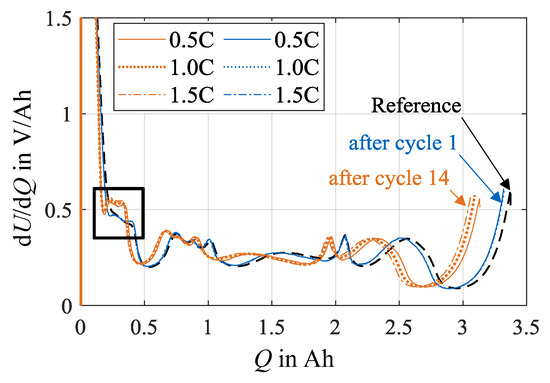
Figure 8.
Overview of the absolute DVA spectra at test points with charge rates of 0.5C, 1.0C and 1.5C after load cycles 1 and 14 at 0 °C.
From these DVA spectra, the characteristic capacities as defined in Figure 2, are evaluated and plotted in Figure 9, after load cycle 1, and in Figure 10, after load cycle 14. In both figures, the values for the characteristic capacities before load charging are given as a reference, whereby the mean values of all used specimen are used. In addition, the data of both figures are presented in tables in the Appendix A. Figure 9a) shows the absolute changes in C, CSiC, CB and CNCA evaluated after load cycle 1 at 0 °C. Here, the capacities C, CSiC and CB show a decreasing trend with an increasing load charge rate. In contrast, the cathode capacity CNCA remains approximately constant. Figure 9b shows a similar trend at load temperature 10 °C. One difference can be observed for CB that rises after load cycle 1 at a charge rate of 0.2C above the reference value and therefore must be considered an outlier. Figure 10a illustrates the absolute values of the characteristic capacities after 14 load cycles and at 0 °C. For C, CSiC and CB a further decrease in general as well as an intensification of the dependence on the charge rate can be observed. The characteristic capacity CNCA still remains constant. In Figure 10b the values for the corresponding load temperature 10 °C are shown. In contrast, no significant dependency on the load charge rate can be stated for the general decrease in C, CSiC and CB. The values for CNCA, again, do not change. In summary to Figure 10, it can be concluded that the capacity C decreases for both load temperatures after repeated load cycles. The major share of this capacity loss can be attributed to a loss in CSiC, thus to a decrease in the storage capability of the SiC anode. An additional share of the loss in C can be attributed to a decrease in CB. As mentioned in Section 2, a change in CB means a change in cell balancing. This change indicates a loss of lithium inventory as long as CSiC and CNCA do not change [26]. As in the present case CSiC decreases, no further differentiation is possible between a loss of active material and a loss of lithium inventory.
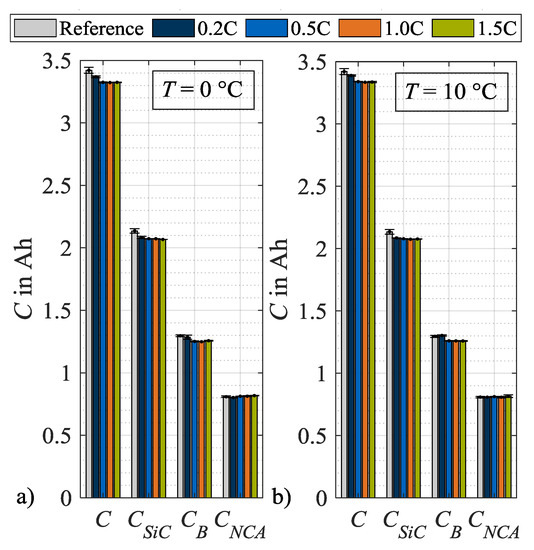
Figure 9.
Absolute changes in characteristic capacities after load cycle 1 at (a) 0 °C and (b) 10 °C.
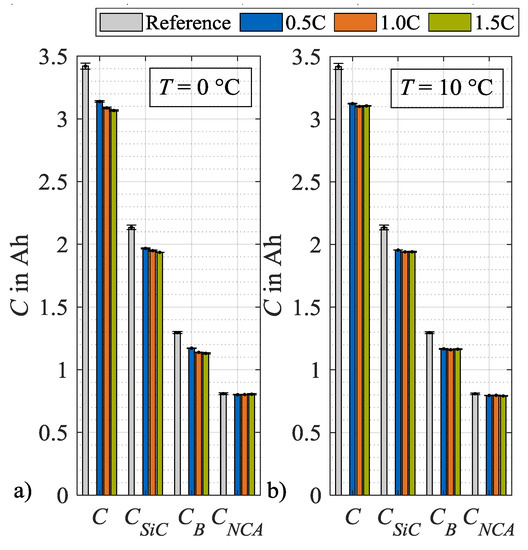
Figure 10.
Absolute changes in characteristic capacities after load cycle 14 at (a) 0 °C and (b) 10 °C.
In the following, the respective contribution of silicon and graphite on the anode degradation is discussed. For simplification, the three individual characteristic capacities CC,1, CC,2 and CC,3 are summarized to CC,1–3, which is the mean value of the three individual values. In Figure 11, the characteristic capacities CSiC and CC,1–3 are displayed. In contrast to CSiC, a dependency on the load rate cannot be identified for CC,1–3. The capacity CSiC, which is influenced by the silicon share, decreases significantly in comparison to CC,1–3, which is influenced by graphite solely. As an example, at a load temperature of 0 °C and a charge rate of 1.5C, CC,1–3 accounts for 35 % of the loss in CSiC. In theory, the remaining share of CSiC can therefore be attributed to a decrease in the storage capacity of the silicon in the anode CSi. Therefore, it is postulated that the bulk of the anodic capacity loss is due to the silicon content and not to the graphite content.
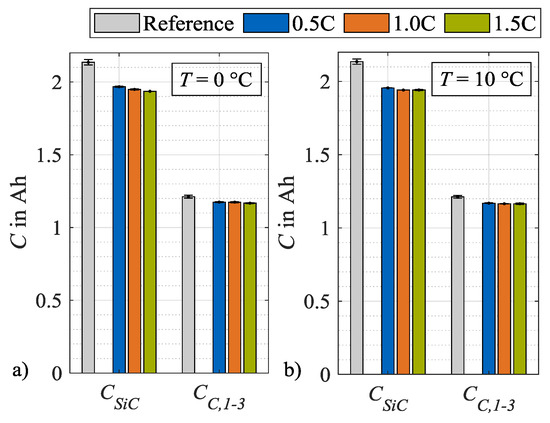
Figure 11.
Absolute changes in characteristic capacities after load cycle 14 at (a) 0 °C and (b) 10 °C.
Additional insights on the contribution of silicon and graphite on the anode degradation can be drawn from the DVA spectra, which are displayed in Figure 12. Excerpts from the full spectrum ranges are shown for both load temperatures that focus on the capacities CSiC and CC,1. The increased silicon degradation leads to an increased compression of the spectra between the start of charging and the graphite peaks related to the capacity CC,1. In combination, the silicon peaks related to CSiC rise in a vertical direction with increasing charge rate and cycle number. Basically, higher values in dU/dQ indicate that the incremental voltage change increases with charge increment. Lewerenz et al. [28] interpret this circumstance as a decrease in the homogeneity of the lithium distribution, thus an increased polarization of the cell electrodes. A possible cause for an increase in polarization is the increase in local resistances that may originate from aging mechanisms like lithium plating or SEI formation. Another possible explanation is a change in the anode composition, e.g., due to a local inactivity or loss of active material.
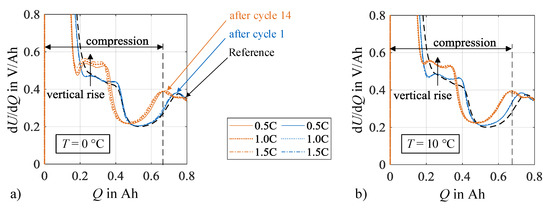
Figure 12.
Compression between charging start and graphite peak as well as formation and increase of silicon characteristics due to increasing number of cycles at (a) 0 °C and (b) 10 °C.
4. Summary and Conclusions
This work investigates the robustness of a commercial 18650 lithium-ion cell (Sony (Murata) US18650VC7) with a silicon-doped graphite anode and a nickel-rich cathode against challenging fast charging scenarios at low temperatures. Reversible and irreversible aging effects are thus analyzed, whereas a focus is set on lithium plating as an aging mechanism due to its criticality for cell life [14,15] and cell safety [19,20,21]. As an analysis technique, this work focuses on non-destructive detection methods that are applicable to the full cell and thus allows for implementation in industrial applications with inherent time and cost constraints.
4.1. Findings on Reversible and Irreversible Lithium Plating
Stripping discharging is used as non-destructive detection method to investigate the reversible share of lithium plating. As a result, the dependency of the occurrence of reversible lithium plating on the temperature as well as on the charge rate for charging is evaluated. In addition, this investigation confirms limitations of stripping discharging as a detection method: the method is sensitive to the duration of the constant voltage phase at the end of charging. In the case of an enduring constant voltage phase, occurred lithium plating already dissolves in this phase of charging and can no longer be detected by evaluating the stripping potential.
For the investigation of the irreversible share of lithium plating, changes in the cell discharge capacity, internal resistance and the differential voltage analysis spectra are evaluated. By defining characteristic capacities in the differential voltage analysis spectra of the full cell, degradations in the individual electrode capacities can be quantified. The characteristic capacities show, that the cathode-related capacity CNCA does not degrade upon charging with high current rates at low temperatures. Therefore, a degradation of the active material at the nickel-rich cathode can be neglected. In contrast, the anodic capacity CSiC decreases upon load cycling. Accordingly, a loss anodic active material can be assumed. This may be caused by aging mechanisms such as crack formation, loss of electrical contact or pore clogging [5,20,27]. In addition, the occurrence of irreversible lithium plating is supported by the fact that at the lower temperature of 0 °C, the total capacity loss is higher, but the anodic capacity loss and the internal resistance increase is lower.
According to the results of stripping discharge analysis and the evaluation of the changes in capacity and resistance it can be assumed that reversible as well as irreversible lithium plating occurred. Nevertheless, the individual quantitative shares of reversible lithium plating and irreversible lithium plating, thus the reversibility, cannot be determined with the used non-destructive methods.
A charge rate of 0.2C at both temperature levels 0 °C and 10 °C as well as a charge rate of 0.5C at 10 °C does not lead to detectable reversible lithium plating with stripping discharge analysis. Consequently, it is assumed that these load conditions combinations do not lead to a loss of capacity due to lithium plating. Nevertheless, one load cycle at 10 °C with a charge rate of 0.5C results in a capacity loss that is comparable to cycling conditions with detectable lithium plating. Therefore, it must be concluded that lithium plating is not the dominant aging mechanism resulting in capacity loss in these tested load conditions.
4.2. Degradation Sensitivity of Silicon Share
The use of differential voltage analysis allows for the differentiation between the shares of silicon and graphite to the overall decrease in anode storage capacity. Accordingly, it can be deduced that the anodic graphite share that is summarized in the characteristic capacity CC,1–3 contributes up to 35% and 36% to the anodic capacity loss upon load cycling at 0 °C and 10 °C, respectively. In consequence, it can be deduced that the majority of the anodic capacity loss due to load cycling can be attributed to the silicon share in the anode. This finding is in accordance with investigations that state enhanced aging of lithium-ion cells with silicon-doped anodes due to the volume changes of the silicon share while cycling result [5,6,7]. In consequence, using silicon-doped graphite as anode material, in order to increase the cell’s energy density, conflicts with a desired robustness against high charge rates and durable high cell capacities.
4.3. Recommendations for the Implementation of Charging Protocols
As a recommendation for the implementation of charging protocol in electric vehicles, the allowed charge rates must be set according to the used cell chemistry. In addition, the charge rate must be adjusted to the actual cell temperature. For this, results from an early and candidate-specific aging characterization can be used: The occurrence of cell-damaging mechanisms can be tested experimentally in advance, and resulting look-up tables for acceptable current rates, as shown in Table 4 and Table 5, can be implemented in the automotive charge strategy algorithms.
Author Contributions
R.B. was mainly responsible for the writing of the original draft of this paper. He conducted the investigation, data curation, data interpretation and formal analysis of the test series during a student research project. T.G. was mainly responsible for the conceptualization and administration of the work as well as the conceptualization of the original draft. She revised the original draft critically for important intellectual content. All authors have read and agree to the published version of the manuscript.
Funding
This research was funded by DEE Dräxlmaier Electric and Electronic Systems GmbH.
Acknowledgments
The authors gratefully acknowledge the additional support trough battery testing infrastructure with the help of independent funding by the Institute of Automotive Technology at the Technical University of Munich.
Conflicts of Interest
The authors declare no conflict of interest.
Appendix A
Table A1.
Change of characteristic capacities after load cycle 1 at 0 °C.
Table A1.
Change of characteristic capacities after load cycle 1 at 0 °C.
| Charge Rate | Characteristic Capacity | ||||
|---|---|---|---|---|---|
| ΔC (mAh) | ΔC (mAh) | ΔCB (mAh) | ΔCNCA (mAh) | ΔCC,1–3 (mAh) | |
| 0.2C | −52 | −53 | −10 | −7 | −17 |
| 0.5C | −96 | −63 | −44 | +3 | −17 |
| 1.0C | −99 | −63 | −47 | +4 | −13 |
| 1.5C | −97 | −64 | −39 | +8 | −15 |
Table A2.
Change of characteristic capacities after load cycle 1 at 10 °C.
Table A2.
Change of characteristic capacities after load cycle 1 at 10 °C.
| Charge Rate | Characteristic Capacity | ||||
|---|---|---|---|---|---|
| ΔC (mAh) | ΔC (mAh) | ΔCB (mAh) | ΔCNCA (mAh) | ΔCC,1–3 (mAh) | |
| 0.2C | −32 | −50 | + 7 | 0 | −16 |
| 0.5C | −81 | −57 | −36 | + 4 | −15 |
| 1.0C | −86 | −61 | −36 | −1 | −14 |
| 1.5C | −84 | −59 | −37 | + 8 | −15 |
Table A3.
Change of characteristic capacities after load cycle 14 at 0 °C.
Table A3.
Change of characteristic capacities after load cycle 14 at 0 °C.
| Charge Rate | Characteristic Capacity | ||||
|---|---|---|---|---|---|
| ΔC (mAh) | ΔC (mAh) | ΔCB (mAh) | ΔCNCA (mAh) | ΔCC,1–3 (mAh) | |
| 0.2C | - | - | - | - | - |
| 0.5C | −282 | −169 | −124 | −8 | −37 |
| 1.0C | −334 | −187 | −158 | −7 | −38 |
| 1.5C | −354 | −200 | −165 | −4 | −44 |
Table A4.
Change of characteristic capacities after load cycle 14 at 10 °C.
Table A4.
Change of characteristic capacities after load cycle 14 at 10 °C.
| Charge Rate | Characteristic Capacity | ||||
|---|---|---|---|---|---|
| ΔC (mAh) | ΔC (mAh) | ΔCB (mAh) | ΔCNCA (mAh) | ΔCC,1–3 (mAh) | |
| 0.2C | - | - | - | - | - |
| 0.5C | −297 | −180 | −128 | −14 | −43 |
| 1.0C | −319 | −195 | −136 | −12 | −47 |
| 1.5C | −315 | −194 | −132 | −17 | −47 |
References
- National Platform for Electric Mobility. Roadmap for an Integrated Cell and Battery Production in Germany. WG 2 Battery Technology. 2016. Available online: http://nationale-plattform-elektromobilitaet.de/fileadmin/user_upload/Redaktion/Publikationen/AG2_Roadmap_Zellfertigung_eng_bf.pdf (accessed on 31 May 2019).
- Myung, S.-T.; Maglia, F.; Park, K.-J.; Yoon, C.S.; Lamp, P.; Kim, S.-J.; Sun, Y.-K. Nickel-Rich Layered Cathode Materials for Automotive Lithium-Ion Batteries: Achievements and Perspectives. ACS Energy Lett. 2017, 2, 196–223. [Google Scholar] [CrossRef]
- Khomenko, V.G.; Barsukov, V.Z.; Doninger, J.E.; Barsukov, I. V600. Lithium-ion batteries based on carbon–silicon–graphite composite anodes. J. Power Sources 2007, 165, 598–608. [Google Scholar] [CrossRef]
- Wu, J.J.; Bennett, W.R. Fundamental investigation of Si anode in Li-Ion cells. In 2012 IEEE Energytech; IEEE: Cleveland, OH, USA, 2012; pp. 1–5. [Google Scholar]
- Li, X.; Colclasure, A.M.; Finegan, D.P.; Ren, D.; Shi, Y.; Feng, X.; Cao, L.; Yang, Y.; Smith, K. Degradation mechanisms of high capacity 18650 cells containing Si-graphite anode and nickel-rich NMC cathode. Electrochim. Acta 2019, 297, 1109–1120. [Google Scholar] [CrossRef]
- Zilberman, I.; Sturm, J.; Jossen, A. Reversible self-discharge and calendar aging of 18650 nickel-rich, silicon-graphite lithium-ion cells. J. Power Sources 2019, 425, 217–226. [Google Scholar] [CrossRef]
- Sturm, J.; Rheinfeld, A.; Zilberman, I.; Spingler, F.B.; Kosch, S.; Frie, F.; Jossen, A. Modeling and simulation of inhomogeneities in a 18650 nickel-rich, silicon-graphite lithium-ion cell during fast charging. J. Power Sources 2019, 412, 204–223. [Google Scholar] [CrossRef]
- Dose, W.M.; Piernas-Muñoz, M.J.; Maroni, V.A.; Trask, S.E.; Bloom, I.; Johnson, C.S. Capacity fade in high energy silicon-graphite electrodes for lithium-ion batteries. Chem. Commun. 2018, 54, 3586–3589. [Google Scholar] [CrossRef] [PubMed]
- Kalaga, K.; Rodrigues, M.-T.F.; Trask, S.E.; Shkrob, I.A.; Abraham, D.P. Calendar-life versus cycle-life aging of lithium-ion cells with silicon-graphite composite electrodes. Electrochim. Acta 2018, 280, 221–228. [Google Scholar] [CrossRef]
- Michan, A.L.; Divitini, G.; Pell, A.J.; Leskes, M.; Ducati, C.; Grey, C.P. Solid Electrolyte Interphase Growth and Capacity Loss in Silicon Electrodes. J. Am. Chem. Soc. 2016, 138, 7918–7931. [Google Scholar] [CrossRef]
- Petzl, M.; Kasper, M.; Danzer, M.A. Lithium plating in a commercial lithium-ion battery—A low-temperature aging study. J. Power Sources 2015, 275, 799–807. [Google Scholar] [CrossRef]
- Waldmann, T.; Kasper, M.; Wohlfahrt-Mehrens, M. Optimization of Charging Strategy by Prevention of Lithium Deposition on Anodes in high-energy Lithium-ion Batteries—Electrochemical Experiments. Electrochim. Acta 2015, 178, 525–532. [Google Scholar] [CrossRef]
- Yang, X.-G.; Liu, T.; Gao, Y.; Ge, S.; Leng, Y.; Wang, D.; Wang, C.-Y. Asymmetric Temperature Modulation for Extreme Fast Charging of Lithium-Ion Batteries. Joule 2019. [Google Scholar] [CrossRef]
- Waldmann, T.; Hogg, B.-I.; Wohlfahrt-Mehrens, M. Li plating as unwanted side reaction in commercial Li-ion cells–A review. J. Power Sources 2018, 384, 107–124. [Google Scholar] [CrossRef]
- Li, Z.; Huang, J.; Yann Liaw, B.; Metzler, V.; Zhang, J. A review of lithium deposition in lithium-ion and lithium metal secondary batteries. J. Power Sources 2014, 254, 168–182. [Google Scholar] [CrossRef]
- Smart, M.C.; Ratnakumar, B.V. Effects of Electrolyte Composition on Lithium Plating in Lithium-Ion Cells. J. Electrochem. Soc. 2011, 158, A379. [Google Scholar] [CrossRef]
- Schindler, S.; Bauer, M.; Petzl, M.; Danzer, M.A. Voltage relaxation and impedance spectroscopy as in-operando methods for the detection of lithium plating on graphitic anodes in commercial lithium-ion cells. J. Power Sources 2016, 304, 170–180. [Google Scholar] [CrossRef]
- Gallagher, K.G.; Trask, S.E.; Bauer, C.; Woehrle, T.; Lux, S.F.; Tschech, M.; Lamp, P.; Polzin, B.J.; Ha, S.; Long, B.; et al. Optimizing Areal Capacities through Understanding the Limitations of Lithium-Ion Electrodes. J. Electrochem. Soc. 2016, 163, A138–A149. [Google Scholar] [CrossRef]
- Petzl, M.; Danzer, M.A. Nondestructive detection, characterization, and quantification of lithium plating in commercial lithium-ion batteries. J. Power Sources 2014, 254, 80–87. [Google Scholar] [CrossRef]
- Vetter, J.; Novák, P.; Wagner, M.R.; Veit, C.; Möller, K.-C.; Besenhard, J.O.; Winter, M.; Wohlfahrt-Mehrens, M.; Vogler, C.; Hammouche, A. Ageing mechanisms in lithium-ion batteries. J. Power Sources 2005, 147, 269–281. [Google Scholar] [CrossRef]
- Legrand, N.; Knosp, B.; Desprez, P.; Lapicque, F.; Raël, S. Physical characterization of the charging process of a Li-ion battery and prediction of Li plating by electrochemical modelling. J. Power Sources 2014, 245, 208–216. [Google Scholar] [CrossRef]
- von Lüders, C.; Keil, J.; Webersberger, M.; Jossen, A. Modeling of lithium plating and lithium stripping in lithium-ion batteries. J. Power Sources 2019, 414, 41–47. [Google Scholar] [CrossRef]
- Zinth, V.; von Lüders, C.; Hofmann, M.; Hattendorff, J.; Buchberger, I.; Erhard, S.; Rebelo-Kornmeier, J.; Jossen, A.; Gilles, R. Lithium plating in lithium-ion batteries at sub-ambient temperatures investigated by in situ neutron diffraction. J. Power Sources 2014, 271, 152–159. [Google Scholar] [CrossRef]
- von Lüders, C.; Zinth, V.; Erhard, S.V.; Osswald, P.J.; Hofmann, M.; Gilles, R.; Jossen, A. Lithium plating in lithium-ion batteries investigated by voltage relaxation and in situ neutron diffraction. J. Power Sources 2017, 342, 17–23. [Google Scholar] [CrossRef]
- Bloom, I.; Jansen, A.N.; Abraham, D.P.; Knuth, J.; Jones, S.A.; Battaglia, V.S.; Henriksen, G.L. Differential voltage analyses of high-power, lithium-ion cells: 1. Technique and application. J. Power Sources 2005, 139, 295–303. [Google Scholar] [CrossRef]
- Keil, P.; Jossen, A. Calendar Aging of NCA Lithium-Ion Batteries Investigated by Differential Voltage Analysis and Coulomb Tracking. J. Electrochem. Soc. 2017, 164, A6066–A6074. [Google Scholar] [CrossRef]
- Birkl, C.R.; Roberts, M.R.; McTurk, E.; Bruce, P.G.; Howey, D.A. Degradation diagnostics for lithium ion cells. J. Power Sources 2017, 341, 373–386. [Google Scholar] [CrossRef]
- Lewerenz, M.; Marongiu, A.; Warnecke, A.; Sauer, D.U. Differential voltage analysis as a tool for analyzing inhomogeneous aging: A case study for LiFePO4|Graphite cylindrical cells. J. Power Sources 2017, 368, 57–67. [Google Scholar] [CrossRef]
- Burns, J.C.; Stevens, D.A.; Dahn, J.R. In-Situ Detection of Lithium Plating Using High Precision Coulometry. J. Electrochem. Soc. 2015, 162, A959–A964. [Google Scholar] [CrossRef]
- Smith, A.J.; Burns, J.C.; Trussler, S.; Dahn, J.R. Precision Measurements of the Coulombic Efficiency of Lithium-Ion Batteries and of Electrode Materials for Lithium-Ion Batteries. J. Electrochem. Soc. 2010, 157, A196. [Google Scholar] [CrossRef]
- Xu, J.; Deshpande, R.D.; Pan, J.; Cheng, Y.-T.; Battaglia, V.S. Electrode Side Reactions, Capacity Loss and Mechanical Degradation in Lithium-Ion Batteries. J. Electrochem. Soc. 2015, 162, A2026–A2035. [Google Scholar] [CrossRef]
- Same, A.; Battaglia, V.; Tang, H.-Y.; Park, J.W. In situ neutron radiography analysis of graphite/NCA lithium-ion battery during overcharge. J. Appl. Electrochem. 2012, 42, 1–9. [Google Scholar] [CrossRef]
- Wilhelm, J.; Seidlmayer, S.; Keil, P.; Schuster, J.; Kriele, A.; Gilles, R.; Jossen, A. Cycling capacity recovery effect: A coulombic efficiency and post-mortem study. J. Power Sources 2017, 365, 327–338. [Google Scholar] [CrossRef]
- Gewald, T.; Lienkamp, M.; Lehmkuhl, D.; Hahn, A. Accelerated Aging Characterization of Lithium-Ion Cells: Limitation of Arrhenius Dependency. In Proceedings of the 2019 Fourteenth International Conference on Ecological Vehicles and Renewable Energies (EVER), Monte-Carlo, Monaco, 8–10 May 2019; pp. 1–10. [Google Scholar]
- Yang, X.-G.; Ge, S.; Liu, T.; Leng, Y.; Wang, C.-Y. A look into the voltage plateau signal for detection and quantification of lithium plating in lithium-ion cells. J. Power Sources 2018, 395, 251–261. [Google Scholar] [CrossRef]
- Naumann, M.; Schimpe, M.; Keil, P.; Hesse, H.C.; Jossen, A. Analysis and modeling of calendar aging of a commercial LiFePO4/graphite cell. J. Energy Storage 2018, 17, 153–169. [Google Scholar] [CrossRef]
- Rumpf, K.; Naumann, M.; Jossen, A. Experimental investigation of parametric cell-to-cell variation and correlation based on 1100 commercial lithium-ion cells. J. Energy Storage 2017, 14, 224–243. [Google Scholar] [CrossRef]
- Schmalstieg, J.; Käbitz, S.; Ecker, M.; Sauer, D.U. A holistic aging model for Li(NiMnCo)O2 based 18650 lithium-ion batteries. J. Power Sources 2014, 257, 325–334. [Google Scholar] [CrossRef]
- German Environment Agency. Trends der Lufttemperatur [Trends in Air Temperature]. Available online: https://www.umweltbundesamt.de/daten/klima/trends-der-lufttemperatur#textpart-1 (accessed on 29 May 2019).
- Drake, S.J.; Wetz, D.A.; Ostanek, J.K.; Miller, S.P.; Heinzel, J.M.; Jain, A. Measurement of anisotropic thermophysical properties of cylindrical Li-ion cells. J. Power Sources 2014, 252, 298–304. [Google Scholar] [CrossRef]
- Waldmann, T.; Wohlfahrt-Mehrens, M. In-Operando Measurement of Temperature Gradients in Cylindrical Lithium-Ion Cells during High-Current Discharge. ECS Electrochem. Lett. 2015, 4, A1–A3. [Google Scholar] [CrossRef]


© 2020 by the authors. Licensee MDPI, Basel, Switzerland. This article is an open access article distributed under the terms and conditions of the Creative Commons Attribution (CC BY) license (http://creativecommons.org/licenses/by/4.0/).